2010_jll_corporate real estate and the decision to lease or buy
DESCRIPTION
Corporate Real Estate and the Decision to Lease or Buy Advance - Corporate Real Estate and the Decision to Lease or BuyTRANSCRIPT

Corporate Real Estate and the Decision to Lease or Buy

� Advance - Corporate Real Estate and the Decision to Lease or Buy

Advance - Corporate Real Estate and the Decision to Lease or Buy �
Strategy Process Synergised Benefits
Relocation Relocating to a location with reduced real estate costs
Relocation provides the essential benefit of reduced real estate costs by leasing or buying space of adequate size and specifications at a possibly reduced property rate.
Consolidated Centralisation
Consolidating multiple offices to a single location
Consolidated centralisation is motivated by the synergy of economies of scale achieved by operating out of a single office. It helps in reducing real estate costs by merging functions and reducing shadow capacities lying idle at multiple existing locations.
Functional Decentralisation
Consolidating multiple offices or splitting a single office to multiple locations
Functional decentralisation helps in reducing real estate costs by distributing the non-essential functions of a business to less expensive real estate locations while retaining or moving essential functions to a prime location.
Expansion Expanding to new locations Expansion provides the opportunity of augmenting operations by leasing or buying additional real estate space.
EX – Existing Locations | N – New Locations Source: Real Estate Intelligence Service (JLL)
operations / maintenance to eventual disposal. Various functions of the CRE executives include Lease Administration, Transaction Management, Change Management, Location Strategies, Portfolio Management and Facilities Management.
Rapidly changing business environments during the expansion phase of Indian economy during �005-�008 led CRE executives to position flexibility at the core of future real estate decisions. As a result, shadow capacities were generated across industries. The recent slowdown has laid emphasis on the efficient minimization of these shadow spaces. As a result, several relocation, consolidation and decentralisation initiatives of office space were witnessed across cities in India during 2H08-1H10 (Figure 1). The search for cost efficient real estate portfolio was helped by the confluence of correction in rental and capital values along with the huge expected supply in the secondary and suburban business districts.
Restructuring of Corporate Real Estate (CRE)Real Estate forms a significant portion of operational costs for corporations today, probably second only to human resources. The complex and extensive data ecosystem of the real estate portfolio makes it imperative to track and analyse. As a result, Corporate Real Estate (CRE) executives have increasingly assumed a greater role in the management of real assets (land and facilities) in the past decade. Corporations are actively increasing financial flexibility utilizing the new-age workplace management systems to manage real assets and reduce fixed costs. With increasing transparency in the market, CRE executives are equipped with better knowledge of the physical and financial indicators. CRE Management is being integrated at multiple points of a project lifecycle, right from its lease / buy and
1 Indian Tier I and II cities climbed to composite ranks 41 and 49 respectively, positioning themselves in the Semi-Transparent segment in Jones Lang LaSalle’s Real Estate Transparency Index 2010. Read our research publication – Mapping the World of Transparency – Uncertainty and Risk in Real Estate released in 2010.
Figure 1: Portfolio Restructuring Strategies Adopted During the Slowdown (2H08-1H10)
EX N
EX
EX
EX
EXN
N
EXEX
EX
EXEXEX
N
EX N

4 Advance - Corporate Real Estate and the Decision to Lease or Buy
Figure 1: Portfolio Restructuring Strategies Adopted During the Slowdown (2H08-1H10)
City Buyer / Lessee Year Leasable / Saleable Area (sq ft) Lease / Buy Strategy
Hyderabad Tata Consultancy Services �010 180,��� Lease Expansion
Chennai Cybernet Slash Support �010 1�8,000 Lease Consolidated Centralisation
Chennai Marg Constructions �010 116,800 Lease Consolidated Centralisation
Bangalore Citrix �010 1�7,000 Lease Expansion
Bangalore Sony �010 1�0,000 Lease Consolidated Centralisation
Hyderabad Accenture �010 10�,000 Lease Expansion
Noida ACS �010 10�,000 Lease Relocation
Hyderabad Synopsis �010 61,990 Lease Consolidated Centralisation
Hyderabad DST �010 55,000 Lease Consolidated Centralisation
Chennai Tata Teleservices �010 75,000 Buy Relocation
Mumbai Ernst & Young 2009 160,000 Lease Functional Decentralisation
Kolkata McNally Bharat 2009 1��,000 Lease Consolidated Centralisation
Hyderabad Colruyt 2009 100,000 Buy Consolidated Centralisation
Noida Samsung 2009 66,000 Lease Functional Decentralisation
Kolkata M Junction 2009 6�,000 Buy Consolidated Centralisation
Mumbai Deutsche Bank 2009 187,000 Lease Consolidated Centralisation
Gurgaon Capital IQ 2009 50,000 Lease Relocation
Mumbai ICICI Prudential 2009 41,000 Lease Functional Decentralisation
Mumbai Standard Chartered Bank �008 ��0,000 Buy Consolidated Centralisation
Bangalore Delphi �008 90,000 Lease Consolidated Centralisation
Bangalore LSI Logic �008 �77,000 Lease Consolidated Centralisation
Hyderabad Brigade �008 60,000 Buy Consolidated Centralisation
Source: Real Estate Intelligence Service (JLL)

Advance - Corporate Real Estate and the Decision to Lease or Buy 5
The Decision to Lease or BuyFaced with the prospect of new transactions, corporate real estate (CRE) managers have been analyzing the options of leasing versus buying a real estate space. In the recent slowdown, distinct trends have emerged among industry verticals while strategically choosing either to lease or buy real estate space (Figure 3). While the IT/ITES sector has been the frontrunner in terms of lease transactions recorded during �H08-1H10, accounting for 41% of the total lease transactions, BFSI and Manufacturing / Industrial sectors have been dominant purchasers of office space during the same period. The Pharmaceutical companies have a larger share of 8% in sale transactions, compared to only 2% in the recorded lease transactions. The Telecommunication companies have equitable share in both sale and lease transactions, accounting for 7-8% of the total transactions recorded during the period.
The variation in the decision pertaining to lease or buy is not without reasoning. The underlying principle in the analysis is that the firms are generally focussed on their core businesses and not in the properties they own or lease. However, the degree of control of occupied space has far-reaching strategic implications for its occupiers. Hence, certain industries and corporate prefer either leasing or buying a real estate space.
Figure �: Transactions Done by Various Industry Verticals During �H08 – 1H10
Source: Real Estate Intelligence Service (JLL), �Q10Note: The analysis represents 91 sale transactions and 911 lease transactions by occupiers of investment grade office space recorded during 2H08 to 1H10. The transactions were recorded in the top seven cities of India by population size – NCR-Delhi, Mumbai, Kolkata, Bangalore, Chennai, Hyderabad and Pune.
IT/ITES1�%
BFSI41%
Manufacturing / Industrial
18%
Services4%
Telecommunications7%
Pharmaceuticals8%
Others10%
IT & ITES41%
BFSI�0%
Manufacturing / Industrial
1�%
Telecommunications8%
Pharmaceuticals2%
Services9%
Others8%
Sale Transactions
Lease Transactions

6 Advance - Corporate Real Estate and the Decision to Lease or Buy
Figure 4: The Decision to Lease or Buy
In this paper, we discuss the implications of a decision of leasing versus buying a corporate real estate (CRE) space. As such, the decision pertaining to lease or buy involves the financial analysis of comparing the cash flows of these two options and beyond. An important aspect in financial analysis is to gauge the trends of capital values and rental values of the subject property and estimate its impact on cash flows for the holding period during which the tenant intends to occupy the property. The strategist needs to have a keen grasp on the status of the markets being undervalued or overvalued and the yields offered in the market. Also, it requires diligent real estate market analysis not only at the macro level but also at the project level.
Tactical Analysis of CRE Transactions (TACT)
Financial Analysis of CRE Transactions (FACT)
Real Estate Analysis of CRE Transactions (REACT)
TACT begins with the decision to restructure the real estate portfolio by expansion, consolidation or downsizing. Parameters such as nature of operations of the company, requirements of size, operational flexibility, degree of control and duration of use are evaluated for leasing versus buying. Key tactical considerations are -
Operational FlexibilityManagement ControlInitial Capital OutlayBenefits of Positive LeverageEquity Build-upTax ShieldRequired Specialisation of Managing Real Estate
●
●
●
●
●
●
●
FACT entails a financial analysis of the alternatives of leasing and buying available in the current real estate scenario. Two primary methods are used to evaluate the projected cash flows over the intended holding period.
Net Present Value MethodInternal Rate of Return Method
Further, scenario and sensitivity analysis is done with several parameters such as expected residual value, cost of capital, forecasted rental movement and initial rental yield to arrive at inflexion points of a lease versus buy analysis.
●
●
REACT encompasses the various real estate considerations, which feed both analytical tools - TACT and FACT with the state of the real estate market along with available transaction opportunities.
Evaluation of phase of the market as bring undervalued or overvaluedExploring alternatives available at a desired yieldTiming the market on the property clock
●
●
●
The procedural components of lease-versus-buy decision making discussed in the paper are
TACT – Tactical Analysis of CRE Transactions; and FACT – Financial Analysis of CRE Transactions; supported by REACT – Real Estate Analysis of CRE Transactions.
The final decision is influenced by the result of the three components and can’t be taken solely on the basis of any single model. While TACT is sufficient for an initial screening, FACT is essential to ensure that the best options have been studied in detail.
●
●
●
Source: Real Estate Intelligence Service (JLL)
Decision To Lease Or Buy
Advance - Corporate Real Estate and the Decision to Lease or Buy 7
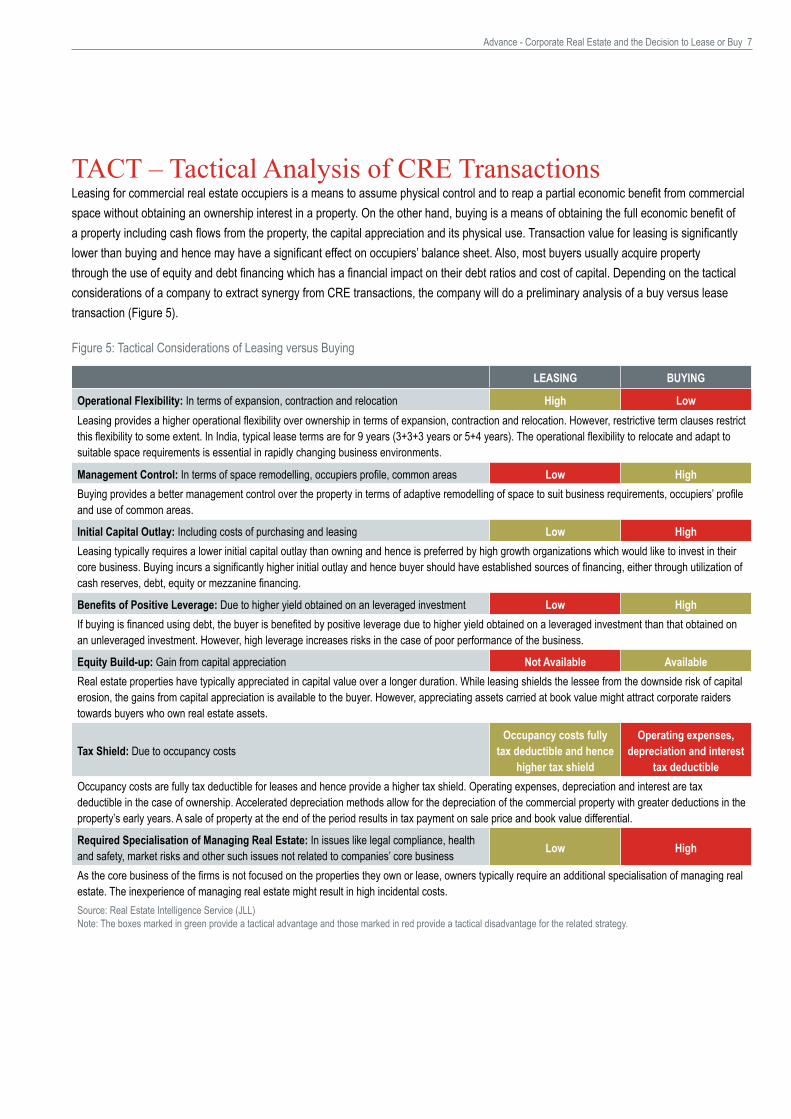
TACT – Tactical Analysis of CRE TransactionsLeasing for commercial real estate occupiers is a means to assume physical control and to reap a partial economic benefit from commercial space without obtaining an ownership interest in a property. On the other hand, buying is a means of obtaining the full economic benefit of a property including cash flows from the property, the capital appreciation and its physical use. Transaction value for leasing is significantly lower than buying and hence may have a significant effect on occupiers’ balance sheet. Also, most buyers usually acquire property through the use of equity and debt financing which has a financial impact on their debt ratios and cost of capital. Depending on the tactical considerations of a company to extract synergy from CRE transactions, the company will do a preliminary analysis of a buy versus lease transaction (Figure 5).
LEASING BUYING
Operational Flexibility: In terms of expansion, contraction and relocation High LowLeasing provides a higher operational flexibility over ownership in terms of expansion, contraction and relocation. However, restrictive term clauses restrict this flexibility to some extent. In India, typical lease terms are for 9 years (3+3+3 years or 5+4 years). The operational flexibility to relocate and adapt to suitable space requirements is essential in rapidly changing business environments.
Management Control: In terms of space remodelling, occupiers profile, common areas Low HighBuying provides a better management control over the property in terms of adaptive remodelling of space to suit business requirements, occupiers’ profile and use of common areas.
Initial Capital Outlay: Including costs of purchasing and leasing Low HighLeasing typically requires a lower initial capital outlay than owning and hence is preferred by high growth organizations which would like to invest in their core business. Buying incurs a significantly higher initial outlay and hence buyer should have established sources of financing, either through utilization of cash reserves, debt, equity or mezzanine financing.
Benefits of Positive Leverage: Due to higher yield obtained on an leveraged investment Low HighIf buying is financed using debt, the buyer is benefited by positive leverage due to higher yield obtained on a leveraged investment than that obtained on an unleveraged investment. However, high leverage increases risks in the case of poor performance of the business.
Equity Build-up: Gain from capital appreciation Not Available AvailableReal estate properties have typically appreciated in capital value over a longer duration. While leasing shields the lessee from the downside risk of capital erosion, the gains from capital appreciation is available to the buyer. However, appreciating assets carried at book value might attract corporate raiders towards buyers who own real estate assets.
Tax Shield: Due to occupancy costsOccupancy costs fully
tax deductible and hence higher tax shield
Operating expenses, depreciation and interest
tax deductibleOccupancy costs are fully tax deductible for leases and hence provide a higher tax shield. Operating expenses, depreciation and interest are tax deductible in the case of ownership. Accelerated depreciation methods allow for the depreciation of the commercial property with greater deductions in the property’s early years. A sale of property at the end of the period results in tax payment on sale price and book value differential.
Required Specialisation of Managing Real Estate: In issues like legal compliance, health and safety, market risks and other such issues not related to companies’ core business Low High
As the core business of the firms is not focused on the properties they own or lease, owners typically require an additional specialisation of managing real estate. The inexperience of managing real estate might result in high incidental costs.Source: Real Estate Intelligence Service (JLL)Note: The boxes marked in green provide a tactical advantage and those marked in red provide a tactical disadvantage for the related strategy.
Figure 5: Tactical Considerations of Leasing versus Buying

8 Advance - Corporate Real Estate and the Decision to Lease or Buy
FACT - Financial Analysis of CRE TransactionsFigure 6: Steps in Financial Analysis of CRE Transactions
STEP 1 – Determine the Initial Capital Outlay and Periodic Costs
BUY Apart from the purchase value and fit-out costs, the initial capital outlay includes the purchase costs in the case of buying. Periodic costs will
include costs of managing and maintaining the property.
LEAS
E Initial outlay in the case of leasing includes the deposit, the prevalent monthly rent and leasing costs. A rental index based on prevalent rental escalation clause or expected rental growth is used to assess periodic rental expense and maintenance.
STEP 2 – Determine the Residual Value
BUY Residual value is dependent on expected change in capital value over the holding period. Selling costs are factored to arrive at a net residual
value.
STEP 3 – Examine the Depreciation and Tax Implications
BUY
Based on the factors involved in the NPV and IRR analysis, the two most important factors are treatment of depreciation and tax benefits. Under the Income Tax Act and the Indian Companies Act, commercial space occupiers are eligible for depreciation allowances. Overall depreciation depends on the purchase value of the property, which has three components – real estate cost, cost of plant and machinery and the fit-out costs. All these components are treated differently for depreciation purposes. Interest on the debt taken for buying commercial space is deductible for tax calculation purposes (corporate tax in India is 33.9%). At the end of the holding period, if the owner wants to exit the property, his realization would be subject to long term capital gains tax which stands at 22.6% in India for Long Term Capital Assets i.e. property held for a period of 36 months or more. The asset disposal also considers depreciation recapture, which is the procedure for collecting income tax on a gain realized by a taxpayer when the taxpayer disposes of an asset that had previously provided an offset to ordinary income for the taxpayer through depreciation.
LEAS
E
Occupancy costs are eligible for tax deductions in the case of leasing.
STEP 4 – Perform a Comprehensive Cash Flow Analysis
BOTH
Based on the cash flow generated by STEP 1 through 4, a comprehensive cash flow analysis is done using the two methods – Net Present Value (NPV) & Internal Rate of Return (IRR).1. Net Present Value (NPV) Method – entails comparison of NPV of both the alternatives at the specified rate of discounting which reflects the occupier’s cost of fund and selecting the alternative with a higher net present value.2. Internal Rate of Return (IRR) Method – estimates IRR for the differential of the cash flows of the two alternatives, namely buying and leasing. If this IRR is greater than the opportunity cost of capital for the occupier, buying is preferred over leasing.
STEP 5 – Perform Sensitivity and Scenario Analysis
BOTH Scenario and sensitivity analysis is done with several parameters such as expected residual value, cost of capital, forecasted rental movement and
initial rental yield to arrive at inflexion points of a lease versus buy analysis.
Read our research publication – Lifting Your Game: Scenario Planning for Real Estate released in �010 Emphasizing on the need for CRE executives to use scenario analysis in their assessment of real estate strategies, the paper elaborates on the various steps in Real Estate Scenario Planning (RESP) process – Seek, Synthesize, Storyboard and Strategize.
Perspectives
2010
Lifting Your Game: Scenario Planning for Real Estate
“We can’t solve problems by using the same kind of thinking
we used when we created them.”
- Albert Einstein
The concept of scenario planning has been a key element in
the deployment of military strategies such as those described
in Sun Tzu’s Art of War. In the past decade or so, this has
also been used widely in the conceptualization of organization
strategies. Scenario planning can be adapted to be a tool that
CRE executives can use to take strategic portfolio planning one
step further.
Numerous corporate real estate (CRE) executives were caught by surprise with the speed of economic deterioration in
2009. It is not improbable to think that many will again be surprised, this time by the speed of recovery – at least in the Asia
Pacific region. The volatility faced by many large corporations has also raised questions about the level of preparedness of
CRE executives to respond to sudden shifts in markets.
Scenario planning should not be confused with the more
common best-case-worst-case approach, where only a
limited number of variables are changed in each case. Once
the analysis involves multi-variant and multi-dimensional
considerations, the definition of each of the worst and best
cases becomes blurred, and the approach is technically no
longer robust (Fig 1).
While the best-case-worst-case approach typically works well
for short-term planning, scenario planning is a far more flexible
approach that supports a longer strategic planning horizon and
can accommodate a greater number of uncertainties and/or
unforeseen events (Fig 2).
Source: Jones Lang LaSalle
Fig 1: Challenging the Best-Case-Worst-Case Approach
Base assumptions Additional factors
• New sales office rollout• Improve workspace
technology provision forsales staff
• Implement alternative workplace solutions to-10% of space
• Leverage market to reduce learning costs
• Implement alternative workplace solutions to-20% of space
• Good opportunity to own 10% of portfolio
• Sales +50%• Headcount +30%• Space utilization ratio
(no change)• Real estate spend +30%
Bes
t
• Sales -5%• Headcount (no change)• Space utilization ratio
-10%• Real estate spend -30%
Wor
st
• Sales +10%• Headcount (no change) • Space utilization ratio
(no change)• Real estate spend
(no change)
Bas
e
Does the best-case-worst-caserelationshipstill hold?
Fig 2: Scenario Planning: A Powerful Approach to Navigate the Future
ScenarioPlanningApproach
Best-Case-Worst-CaseApproach
Limited Addressof Risk
Risk is Key Inputto Strategy
High Degree of Certainty
Rife with Uncertainty
LimitedDimension
MultipleDimension
LimitedVariables
MultipleVariables
Planning Horizon 10 years1 year
Complexity HighLow
Source: Jones Lang LaSalle

Advance - Corporate Real Estate and the Decision to Lease or Buy 9
Figure 7: Leasing versus Buying of Properties versus Investing in Core Business
Assuming No Capital Appreciation, No Depreciation Allowances and Discarding the Growth Phase of CompanyAssuming no capital appreciation, no depreciation allowances on the subject property and discarding the growth phase of the company, the above analysis can be simplified into scenarios which involves comparison of rental yield (RY) with the weighted average cost of capital (WACC) and return on capital employed (ROCE) in the core business. Rental yield is the average annual rental income achievable over the holding period divided by the capital value of the subject property.
If rental yield is greater than weighted average cost of capital, then leasing is costlier than buying and hence buying the commercial space should be preferred. Conversely, if rental yield is lower than weighted average cost of capital, then buying is costlier than leasing and hence buying the commercial space should be avoided.
Scenario 1: WACC<RY<ROCE
In this case, since weighted average cost of capital is lower than property yields, buying the commercial space should be preferred. However, the return on capital employed in core business is higher than property yields reflecting that core business provides more returns than property and hence investment in the core business should be preferred. In such cases, if availability of funds is limited or cash reserves are not sufficient, investment in the core business and leasing the property is the most efficient option. However, if ample sources of funds are available; the company should invest in the core business as well as buy the commercial space.
Scenario 2: WACC<ROCE<RY
Since property yield is higher than return on capital employed in the core business and hence buying the commercial space should be preferred over investment in the core business.
Scenario 3: ROCE<WACC<RY
In this scenario, the company should buy the property and should not invest in the core business. It is because return on capital employed in core business is lower than weighted average cost of capital for the company and rental yield in property investment is higher than WACC.
Scenario 4: ROCE<RY<WACC
Since weighted average cost of capital is higher than return on capital employed in the core business and rental yield on property investment, the company should lease the commercial space, not invest in their core business and attempt to reduce the WACC by retiring debt or purchasing equity in this scenario.
Scenario 5: RY<WACC<ROCE
In this scenario, as return on capital employed in the core business is higher than weighted average cost of capital and rental yield in property investment is lower than that, the company should invest in their core business and should prefer leasing the property over buying it.

10 Advance - Corporate Real Estate and the Decision to Lease or Buy
Analysis 1: Sensitivity Analysis of Desired Yield by Varying Cost of Capital and Increase in Capital Value / Rental Value (assuming equal change in both indicators)
The decision to lease or buy has an inflexion point where Net Present Value of Cash Flows for buying is equal to leasing. If we change parameters from this inflexion point, the financial decision changes towards either buying or leasing depending on the higher NPV.In this analysis, a firm, with a cost of capital of 15.5% should buy (sell) a property providing an initial gross yield above (below) 9.5% in a market which is expected to witness an annual increase of 3% in capital and rental values.
Analysis 2: NPV Analysis of Cost of Capital and Increase in Capital Value / Rental Value (Keeping Initial Gross Yield constant at 11%)
The decision to buy gets stronger with higher expected increase in rental and capital values and weaker with increase in cost of capital. While higher increase in capital values will result in a higher residual value, higher increase in rental values will result in a larger rental expense.Similarly, other models can be built to assess the variation of a lease versus buy decision.
Sensitivity Analysis of Desired Initial Gross Yield
Cost of Capital (Discount Rate)
Expected Percentage Annual Increase in Capital Value / Rental Value
0% 3% 5% 7%
14.0% 13.9% 8.5% 6.5% 4.3%
14.5% 14.1% 8.9% 6.8% 4.7%
15.0% 14.4% 9.2% 7.2% 5.1%
15.5% 14.7% 9.5% 7.5% 5.4%
16.0% 15.0% 9.9% 7.9% 5.8%
Buy (Lease) decision above (below) the mentioned Initial Gross Yield
After Tax Net Advantage to Buy = (After Tax NPV of Buy – After Tax NPV of Lease)
Cost of Capital (Discount Rate)
Expected Percentage Annual Increase in Capital Value / Rental Value
0% 1% 3% 5% 7%
14.0% (286,410,902) 49,801,739 267,309,095 516,06�,�18 800,�15,668
14.5% (312,057,064) 15,410,811 227,615,741 470,264,475 747,399,102
15.0% (336,917,115) (17,938,444) 189,113,814 425,830,085 696,146,490
15.5% (361,015,465) (50,�78,675) 151,765,941 �8�,717,�05 646,408,665
16.0% (384,375,694) (81,641,407) 115,5�6,0�� 340,884,761 598,138,154
Figure 8: Lease vs Buy Scenario Analysis
Model Assumptions
Area RatesLeasable Area 150,000 sq ft Cost of Capital (Discount Rate) Variable %Land Area 100,000 sq ft Residual Discount Rate Cost of Capital + 0.5% %
Price Cost of Debt (Govt Bond + Spread) 8.0% %
Purchase Price (includes land) 2,400,000,000 INR Assumed Tax Rate 33.9% %Land Value 4,000 psq ft Long Term Capital Gains Tax 22.6% %
Term LeverageHolding Period 9 years UnleveragedBuilding Depreciation Life 40 years

Advance - Corporate Real Estate and the Decision to Lease or Buy 11
REACT – Real Estate Analysis of CRE TransactionsUndervalued and Overvalued Phase of Office MarketsUndervalued phase supports buying and overvalued phase supports leasing
As both capital values and rental values are the financial indicators of the same market (basket of properties), their relative movement gives an indicator of the status of the prevalent rates. Capital value behaves as a leading indicator and the lag of growth between the two indicators defines the market conditions to be undervalued or overvalued at certain periods of time.Commercial office markets in India were overvalued in �Q08 relative to rental appreciation in the rapid growth phase of Indian real estate. The appreciation of average capital values had overshot the growth in rental values in
most of the micro-markets during 4Q04-2Q08 resulting in a rapid compression of rental yields (Figure 9). The improved confidence in real estate as an investment class was boosted by continually decreasing vacancy levels, increasing transparency, better execution capabilities of developers and favourable policy changes. While office vacancy decreased from 10.4% at end-2004 to 6.0% in 2Q08, ensuing policy changes with impetus to foreign direct investment along with IT Parks and Special Economic Zones (SEZs) helped by an active participation of International Property Consultants (IPCs) improved market transparency.
The tide turned in �H08, when the perceived risk started to increase in the sector on accounts of falling absorption levels which projected an imminent oversupply of office space. As of 2Q10, a majority of the commercial markets in India are undervalued relative to rental decline implied by a greater decline in capital values than rental values during 2Q08-2Q10 (Figure 9). With this
fundamental attribute favouring purchase of office properties, a rise in the share of outright purchases has been witnessed in the Indian market. While sale transactions were 4.2% of the total transactions recorded in 1H08, their share in total transactions have increased to 11-15% during 1H09-1H10 (Figure 10).
Figure 9: Average Change in Rental and Capital Values
Source: Real Estate Intelligence Service, �Q10Note: Each point represents the rental value and corresponding capital value change in a particular micro-market over the relevant period
2Q08 – Overvalued
Percentage growth of capital values more than rental values
2Q10 – Undervalued
Percentage decline in capital values more than rental values
0
50%
100%
150%
200%
250%
300%
0 50% 100% 150% 200% 250% 300%%CV Change (4Q04-2Q08)
%RV
Cha
nge (
4Q04
-2Q0
8)
% Increase in CV smaller than
% Increase in RV
% Increase in CV greater than
% Increase in RV
0
-60% -50% -40% -30% -20% -10% 0%CV Change (2Q08-2Q10)
%RV
Cha
nge (
2Q08
-2Q1
0)
% Decline in CV greater than
% Decline in RV
% Decline in CV smaller than
% Decline in RV-60%
50%
-40%
-30%
-20%
-10%

1� Advance - Corporate Real Estate and the Decision to Lease or Buy
Source: Real Estate Intelligence Service (JLL), �Q10Note: The recorded transactions are owner occupied lease and sale transactions recorded during 1H08-1H10.
Towards the Desired YieldHigh yield supports buying, Low yield supports leasing
Due to the perceived risk of oversupply and wilting demand, average initial effective rental yields in Indian markets expanded sharply from 10.3% in 2Q08 to peak yields of 11.4% in 1Q09 (Figure 11). Although rental values were declining in 1H09, capital values had hit a floor and stabilised. The ‘floor effect’ was due to the reluctance of landlords to sell below break-even price despite taking a short-term view on rental values. This was accompanied by enhanced channels of financing for real estate developments , including Qualified Institutional Placement (QIP), restructuring of bank loans, External Commercial Borrowing (ECB) and Foreign Direct Investment (FDI), which reduced the financial distress of real estate developers. During 2Q09 – 4Q09, average capital values were either falling at a slower rate than the decline in average rental values or were stable, which led to compression of yields. In 1H10, while rental values hit bottom and stabilised, capital values started strengthening in selected markets, resulting in further yield compression. As of 2Q10, the recorded average initial effective yield in office markets is 10.6%.
� Initial Effective Rental Yield is the initial effective rental income (after deducting outgoings such as property tax and considering incentives such as rent free period) at the time of sale or transaction, expressed as a percentage of the sale price or valuation.� Read our research publication – Emerging Trends in Real Estate Finance released in 2009
Lease Transactions Sale Transactions% Sale Transactions in Total Transactions
4.2%
9.0%
11.4%13.0%
14.9%
0%10%�0%�0%40%50%60%70%80%90%
100%
1H08 �H08 1H09 2H09 1H10
Sale
/ Lea
se T
rans
actio
ns
0%
2%
4%
6%
8%
10%
1�%
14%
16%
%Sa
le Tr
ansa
ction
s in T
otal
Figure 10: Share of Sale Transactions in Total Recorded Transactions (1H08-1H10)
Figure 11: Average Initial Effective Rental Yields in Office Markets
Source: Real Estate Intelligence Service (JLL), �Q10Note: Initial Effective Rental Yield is the initial effective rental income (after deducting outgoings such as property tax and considering incentives such as rent free period) at the time of sale or transaction, expressed as a percentage of the sale price or valuation. The average yield is the imputed yield of average effective rental income and average capital values of NCR-Delhi, Mumbai, Bangalore, Chennai, Pune, Hyderabad and Kolkata.
CBDs SBDs IndiaSuburbs
9.0%
9.5%
10.0%
10.5%
11.0%
11.5%
12.0%
�Q07
4Q07
�Q08
4Q08
2Q09
4Q09
�Q10
4Q10
F
�Q11
F
4Q11
F
�Q1�
F
4Q12
F
Aver
age I
nitial
Ren
tal Y
ield =
Ren
tal In
come
/ Cap
ital V
alue
YIELDPEAK
YIEL
D
YIELD
Suburbs
SBD
CBD
FORECASTCOMPRESSION
Spread 70-80 bps
Advance - Corporate Real Estate and the Decision to Lease or Buy 1�
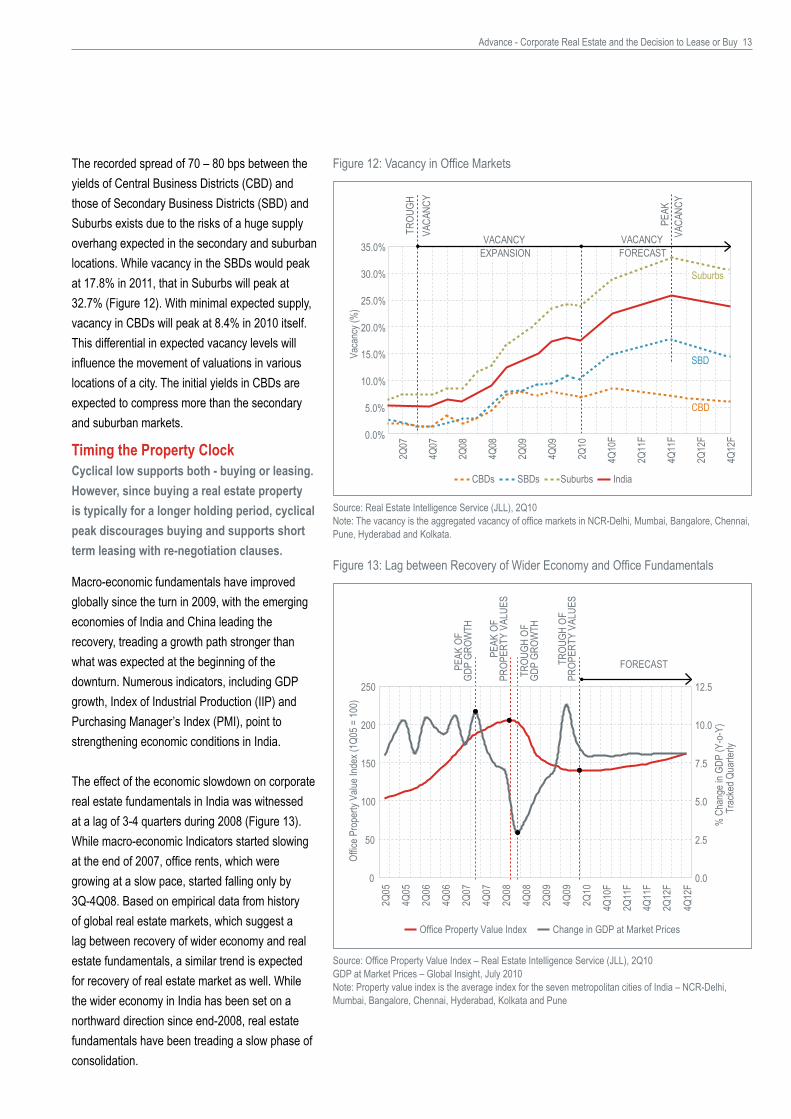
The recorded spread of 70 – 80 bps between the yields of Central Business Districts (CBD) and those of Secondary Business Districts (SBD) and Suburbs exists due to the risks of a huge supply overhang expected in the secondary and suburban locations. While vacancy in the SBDs would peak at 17.8% in 2011, that in Suburbs will peak at 32.7% (Figure 12). With minimal expected supply, vacancy in CBDs will peak at 8.4% in 2010 itself. This differential in expected vacancy levels will influence the movement of valuations in various locations of a city. The initial yields in CBDs are expected to compress more than the secondary and suburban markets.
Figure 12: Vacancy in Office Markets
Timing the Property ClockCyclical low supports both - buying or leasing. However, since buying a real estate property is typically for a longer holding period, cyclical peak discourages buying and supports short term leasing with re-negotiation clauses.
Macro-economic fundamentals have improved globally since the turn in 2009, with the emerging economies of India and China leading the recovery, treading a growth path stronger than what was expected at the beginning of the downturn. Numerous indicators, including GDP growth, Index of Industrial Production (IIP) and Purchasing Manager’s Index (PMI), point to strengthening economic conditions in India.
The effect of the economic slowdown on corporate real estate fundamentals in India was witnessed at a lag of 3-4 quarters during 2008 (Figure 13). While macro-economic Indicators started slowing at the end of 2007, office rents, which were growing at a slow pace, started falling only by 3Q-4Q08. Based on empirical data from history of global real estate markets, which suggest a lag between recovery of wider economy and real estate fundamentals, a similar trend is expected for recovery of real estate market as well. While the wider economy in India has been set on a northward direction since end-�008, real estate fundamentals have been treading a slow phase of consolidation.
Figure 13: Lag between Recovery of Wider Economy and Office Fundamentals
Source: Real Estate Intelligence Service (JLL), �Q10Note: The vacancy is the aggregated vacancy of office markets in NCR-Delhi, Mumbai, Bangalore, Chennai, Pune, Hyderabad and Kolkata.
Source: Office Property Value Index – Real Estate Intelligence Service (JLL), 2Q10GDP at Market Prices – Global Insight, July 2010Note: Property value index is the average index for the seven metropolitan cities of India – NCR-Delhi, Mumbai, Bangalore, Chennai, Hyderabad, Kolkata and Pune
CBDs SBDs IndiaSuburbs
0.0%
5.0%
10.0%
15.0%
20.0%
25.0%
30.0%
35.0%
�Q07
4Q07
�Q08
4Q08
2Q09
4Q09
�Q10
4Q10
F
�Q11
F
4Q11
F
�Q1�
F
4Q12
F
Vaca
ncy (
%)
VACANCY
TROU
GHVA
CANC
Y
VACANCY
PEAK
VACA
NCY
Suburbs
SBD
CBD
EXPANSION FORECAST
Office Property Value Index Change in GDP at Market Prices
0
50
100
150
�00
�50
�Q05
4Q05
�Q06
4Q06
�Q07
4Q07
�Q08
4Q08
�Q09
4Q09
�Q10
Offic
e Pro
perty
Valu
e Ind
ex (1
Q05 =
100)
0.0
2.5
5.0
7.5
10.0
12.5
% C
hang
e in G
DP (Y
-o-Y
)Tr
acke
d Qua
rterly
PEAK
OF
GDP
GROW
TH
PEAK
OF
PROP
ERTY
VAL
UES
TROU
GH O
FGD
P GR
OWTH
TROU
GH O
FPR
OPER
TY V
ALUE
S
FORECAST
4Q10
F
�Q11
F
4Q11
F
�Q1�
F
4Q12
F

14 Advance - Corporate Real Estate and the Decision to Lease or Buy
Nearing the peak in 1H08, the Indian markets were in the ‘growth slowing’ quadrant of the property clock, when rental values were increasing at a slower rate than previous quarters. As demand wilted and the pressure of oversupply loomed, the markets rapidly moved to the ‘value declining’ quadrant by end-2008. By 2Q09, the rental values had corrected by 30-40% of their peaks and had already moved to ‘decline slowing’ quadrant (Figure 14).
The effect of strengthening absorption of office space in the past 3-4 quarters has already resulted in a stabilisation of rental and capital values in most of the markets. The period from 2Q10 to 3Q11 provides a strategic window of opportunity for both buying and leasing CRE, when both rental and capital values are at their cyclical low. Capital values typically are a leading indicator and signs of strengthening of capital values in selected micro-markets have already been witnessed. Post 2011, moderate growth of capital values is forecasted for office markets in India. Mumbai and NCR-Delhi office markets are expected to lead the property clock followed by Bangalore and Chennai.
Figure 14: Office Property Clock and the Strategic Window of Opportunity
Source: Real Estate Intelligence Service (JLL), �Q10
VALUE DECLINING
VALUE RISING
GROWTH SLOWING
DECLINE SLOWING
BangalorePune & Chennai
HyderabadKolkata
Hyderabad
ChennaiBangalore
KolkataMumbai
NCR Delhi
NCR Delhi
Mumbai & NCR Delhi
2Q08
2Q10
2Q09
Mumbai
BangalorePune
Chennai
Hyderabad & Kolkata
3Q11F
STRATEGIC WINDOW OFOPPORTUNITY
Read our research publication – The Slope of Descent released in March 2009 In the whitepaper, we had forecasted that the fast moving office markets (mainly prime markets), which are relatively less affected by conditions of oversupply, would start recovering in 3Q10. Six quarters hence, when we analysed the conditions during 2Q10, the forecast for these markets remains in place. Property values in these prime office markets such as CBD and BKC of Mumbai, CBD of Delhi and MG Road of Gurgaon have already started recovering. The aggressors and followers (mostly SBDs and suburban markets), which have considerable amount of supply in pipeline, would remain stable for a longer time and should recover only in 2H11.
The slope of descent
A closer look into India’s rental dynamics

Advance - Corporate Real Estate and the Decision to Lease or Buy 15
AuthorsHimadri Mayank, Manager, Research & [email protected]+91 22 6141 6513 Himadri Mayank joined Jones Lang LaSalle India in July 2008 and is responsible for managing the quarterly research offering – Real Estate Intelligence Service (REIS), which tracks, analyses and forecasts trends in office, retail and residential property sectors for Indian cities. Based out of Mumbai, he also contributes towards regional and local research publications covering economy, sector analyses, market forecasts and investment strategies.He holds a degree of B.Arch. from Indian Institute of Technology Kharagpur and has three years of experience in the field of real estate. He is pursuing the Chartered Financial Analyst (CFA) program offered by CFA Institute, Charlottesville and is a 2011 Level III CFA candidate.
AcknowledgementsAnkit Bansal from Jones Lang LaSalle’s Research has also contributed to this project.
Abhishek Kiran Gupta, Head of Research & [email protected]+91 22 6141 6500 Abhishek Kiran Gupta leads the Jones Lang LaSalle India Research team and is based in Mumbai. He manages research operations on a Pan-India level and is responsible for the team’s outputs, including research reports such as topical white papers, property market digests and bespoke research projects based on specific client requirements. Prior to joining Jones Lang LaSalle, he had seven years of experience in market research, business analysis and market strategy consulting, servicing diversified industries including pharmaceutical, software publishing and insurance.
Avinash Mirchandani, Associate Director, Research and REIS [email protected] +91 22 6141 6500
Avinash Mirchandani supports the Jones Lang LaSalle India Research & REIS team. Based in Mumbai, he provides guidance and oversight on all of the team’s research outputs and bespoke client projects. Avinash originally joined Jones Lang LaSalle in 2007 as the programme manager for the World Winning Cities Research Programme, a multi-year research initiative conducted by our Global Research team. Prior to that, he worked in a variety of consulting and research roles across the biotech, aerospace and IT industries in the United States. Avinash holds a bachelor’s degree in Economics from UCLA and an MBA from the Indian School of Business.

Jones Lang LaSalle offices
COPYRIGHT © JONES LANG LASALLE All rights reserved. No part of this publication may be published without prior written permission from Jones Lang LaSalle. The information in this publication should be regarded solely as a general guide. Whilst care has been taken in its preparation no representation is made or responsibility accepted for the accuracy of the whole or any part. We stress that forecasting is a problematical exercise which at best should be regarded as an indicative assessment of possibilities rather than absolute certainties. The process of making forward projections involves assumptions regarding numerous variables which are acutely sensitive to changing conditions, variations in any one of which may significantly affect the outcome, and we draw your attention to this factor.
About Jones Lang LaSalleJones Lang LaSalle (NYSE:JLL) is a financial and professional services firm specializing in real estate. The firm offers integrated services delivered by expert teams worldwide to clients seeking increased value by owning, occupying or investing in real estate. With 2009 global revenue of USD 2.5 billion, Jones Lang LaSalle serves clients in 60 countries from 750 locations worldwide, including 180 corporate offices. The firm is an industry leader in property and corporate facility management services, with a portfolio of approximately 1.6 billion square feet worldwide. LaSalle Investment Management, the company’s investment management business, is one of the world’s largest and most diverse in real estate with approximately USD 40 billion of assets under management. For further information, please visit our website, www.joneslanglasalle.com.Jones Lang LaSalle has over 50 years of experience in Asia Pacific, with over 17,800 employees operating in 76 offices in 13 countries across the region.
About Jones Lang LaSalle IndiaJones Lang LaSalle is India’s premiere and largest professional services firm specializing in real estate. With an extensive geographic footprint across ten cities (Delhi, Mumbai, Bangalore, Pune, Chennai, Hyderabad, Kolkata, Kochi, Chandigarh and Coimbatore) and a staff strength of over 3500, the firm provides investors, developers, local corporates and multinational companies with a comprehensive range of services including research, consultancy, transactions, project and development services, integrated facility management, property and asset management, capital markets, residential, hotels and retail advisory. For further information, please visit www.joneslanglasalle.co.in
Real Estate Intelligence Service (REIS) India is a subscription based research service designed to provide you with cutting edge insights into India’s diverse and challenging real estate markets through collation, analysis and forecasts of property market indicators and trends across all major Indian markets across various real estate asset classes - office, retail, residential. REIS empowers you with consistent and complete market data and analyses for all real estate indicators by specific micro markets. It is supplemented by value added services including client briefings, presentations and rapid market updates. For more details, contact, Abhishek Kiran Gupta - [email protected] or Avinash Mirchandani - [email protected]
BANGALORE tel +91 80 41182900 fax +91 80 41182901
CHANDIGARH tel +91 172 3047650 fax +91 172 3044212
CHENNAI tel +91 44 42993000 fax +91 44 42993001
COIMBATORE tel +91 422 2544433 fax +91 422 2544422
DELHI tel +91 11 43317070 fax +91 11 43317071
GURGAON tel +91 124 4605000 fax +91 124 4605001
HYDERABAD tel +91 40 40409100 fax +91 40 40409101
KOCHI tel +91 484 3018652-56 fax +91 484 4029394
KOLKATA tel +91 33 22273293 fax +91 33 22276934
MUMBAI tel +91 22 24828400 fax: +91 22 24941321
tel +91 22 66581000 fax+91 22 66581003
PUNE tel +91 20 40196100 fax +91 20 40196101