2010/11 uefa financial report · this is why uefa sees its annual financial report as much more...
TRANSCRIPT

WE CARE ABOUT FOOTBALL
Financial Report 2010/11
XXXVI Ordinary UEFA Congress
Istanbul, 22 March 2012

I. FACTs And FIgUREs 1 Foreword by the UEFA President 2 A financial strategy to reflect UEFA’s
core values 3 Highlights of the 2010/11 financial year 4 Income statement 6 source of income 8 Use of income 10 governing expenses 11 solidarity 12 The flow of UEFA solidarity payments 14 Balance sheet
16 Equity evolution 17 The four-year cycle 18 UEFA Champions League 22 UEFA Europa League 26 Result by activities
II. AnnEX • notes and explanations to the annual
financial statements
• Auditor’s reports
TABLE OF COnTEnTs
© UEFA — Cover Photo: © LOC Poland – M. Bakiewicz
1
Financial Report 2010/11
The reader is, of course, invited to draw his or her own conclusions. But, in my opinion, UEFA’s financial report for the 2010/11 season is remarkably satisfactory. In a period of exceptional turbulence in the European and global economies, UEFA managed to negotiate the stormy waters on an even keel.
This report not only contains figures which reflect and confirm this fact. It also contains words and paragraphs which might have a familiar ring to readers of last year’s report. I am proud of that. In literature or journalism, repeating oneself might be frowned upon. But in UEFA’s financial report, to reiterate core concepts is to be like a team that, through thick and thin, remains faithful to a well-defined playing philosophy.
To maintain stability during a period of crisis in financial markets represented a challenge. Risk assessment was a continuous process and assets were spread in many directions. The strategy was effective, but as the 2010/11 campaign closed and when this report went to print, the objective was still to remain alert and to achieve similarly good results in the next.
UEFA’s mission is always to put football first, to run our competitions as efficiently as possible and to provide the best possible stage on which the top performers can generate the emotions, intensity and entertainment which, in times of crisis and anxiety, have an even greater value within society. This financial report tells us whether we have achieved this in a responsible way, with sufficient expertise to create income which UEFA can re-invest in the game of football and its future.
It was therefore an important feature of the 2010/11 campaign that UEFA was able to provide advance confirmation that the conditions for the HatTrick III programme would be higher than in the past. The announcement paved the way for forward planning and, as a knock-on benefit, gave national associations greater scope in establishing joint ventures with other stakeholders.
At the same time, it was a striking feature of the year that, thanks to higher income from the broadcasters and commercial partners which supported UEFA’s competitions during the season under review, distribution of income to participating teams reached a landmark by surpassing the € 1 billion mark for the first time – and this was in a year when there was no distribution of revenue generated by a EURO final round.
At a time when financial fairplay has become a crucial issue and when we are working hard to eliminate fraud and betting irregularities from ‘the beautiful game’, it is even more important for UEFA to assume role-model status. This report aims to provide a clear impression of what the people responsible for UEFA’s finances, under the guidance of the Finance Committee, are striving for: to make sure that financial assets are effectively converted into support for member associations and into the promotion of social benefits, and to offer confirmation that, irrespective of changes in the financial climate, UEFA continues to care about football.
Michel Platini UEFA President
FOREWORd By THE UEFA PREsIdEnT

22
A FInAnCIAL sTRATEgy TO REFLECT UEFA’s CORE VALUEs
Associating the Beatles with UEFA’s financial report might seem little short of outrageous. But the heart of football is the love for the game – the love of playing it and the love of watching it. This is where the Beatles might enter the equation. The view that “money can’t buy me love” could be part of UEFA’s mission statement and a fundamental point to make when presenting the financial summary of the 2010/11 season.
The first of UEFA’s 11 core values is to put football first. The philosophy is to make sure that football is
about sport, about games, about entertainment and about enjoyment rather than something that boils down to business, markets and products. As a not-for-profit organisation, UEFA is not about accumulating money but rather about using income in ways which will protect and enhance people’s love for the game. Income needs to be treated as a means rather than an end. It is a vehicle which can be driven towards a goal of giving pleasure and entertainment to millions, offering opportunities at grassroots level for people of all ages to enjoy the game, or seeing the immense social benefits of a sport which unites people while promoting values based on integrity and respect.
This is why UEFA sees its annual financial report as much more than a series of figures presented in debit and credit columns. It is a publication which has to reflect UEFA’s attention to core values.
UEFA is committed to strengthening solidarity, to protect the future of the game and to maximise the benefits that football can offer to society as a whole. UEFA’s finances therefore need to reflect and highlight the concept of solidarity.
UEFA is committed to good governance and to the promotion of good governance throughout its member associations. Leadership in this sphere implies responsibilities and duties. UEFA’s finances must therefore aim to demonstrate that good governance begins at home.
UEFA is committed to maintaining and enhancing the balance between national team and club football as complementary elements within the game. The distribution of financial resources therefore needs to achieve an equitable balance between the two.
UEFA is committed to safeguarding sporting integrity and preserving the true spirit of the game while running its competitions in an efficient way and to optimise revenues from commercial contracts to benefit and develop European football. The financial results offer an indication as to whether sporting and business criteria have been successfully married and whether these objectives have been achieved.
UEFA is committed to promoting fair play both on and off the pitch. Financial fair play is high on the agenda and, if UEFA is to lead European football in the right direction and provide top-class administrative support, UEFA’s economic status must be an illustration of financial fair play in terms of responsibility, fairness and transparency.
This adds up to an obligation for UEFA, in the pages of this financial report for the 2010/11 exercise, to set out the financial results with transparency, to provide clear indications of where income comes from and where it goes to, and to illustrate that, even if “money can’t buy me love”, it can be used in ways which nurture love for the world’s most popular game.
“ UEFA’s economic status must be an illustration of financial fair play in terms of responsibility, fairness and transparency.”
© U
EFA
© U
EFA

3
Financial Report 2010/11
HIgHLIgHTs OF THE 2010/11 FInAnCIAL yEAR
It could be argued that, in tune with the action on the field of play, the financial years between World Cups and European Football Championship (EURO) final rounds tend to be less spectacular. But the 2010/11 season at UEFA was marked by the following significant events:
• The EURO 2012 qualifiers kicked off with 51 national teams eager to join Poland and Ukraine on the match schedule for the final round, to be played from 8 June to 1 July 2012.
• The two major club competitions successfully completed their second season of the current three-year cycle, culminating in an unforgettable UEFA Champions League final between FC Barcelona and Manchester United FC at the new Wembley Stadium in London.
• The final round of the UEFA European Under-21 Championship was staged in Denmark and was notable for the fact that some of the big associations had not qualified. But Spain underlined their quality in depth by taking the title against an impressive Swiss team which had reached the final for the first time.
• All of UEFA’s youth competitions were played in the same format as in the previous season. However, an increased financial contribution was paid by UEFA towards the travel costs of the teams competing in the intermediate and final rounds.
Off-the-pitch developments which were closely related to finances included the following highlights:
• UEFA’s second office building, La Clairière, was officially inaugurated in October 2010, adding 240 working places to the existing capacity at the House of European Football on the opposite side of the road.
• Construction of a third, adjacent office building, Bois-Bougy, with 190 additional working places made rapid progress towards the scheduled inauguration date of March 2012.
• The additional buildings have been designed to complete the UEFA campus in Nyon and to allow all of UEFA’s staff members to operate from a central location. The campus also features the football pitches and modern infrastructure associated with the Colovray stadium, which UEFA uses to run refereeing and coach education courses, among others.
With regard to aspects of UEFA’s internal administration, the management of financial assets in 2010/11 was not an easy task in a climate of constant uncertainty in the markets, with European countries and banks making headlines for negative reasons. UEFA’s strategy of opting for wide diversification among the best-rated banks was considered the most appropriate response to the situation. Currency effects, mainly derived from the relationships between the euro and the Swiss franc, had significant repercussions on the 2010/11 accounts – a one-off negative effect on the net result due to high non-realised currency exchange losses and a lasting positive effect in terms of UEFA’s equity expressed in euros.
2010/11 was the last financial year in which the Swiss franc served as the day-to-day accounting currency. With effect from 2011/12, the euro will not only be used as the reporting currency but also as the new official accounting currency. UEFA’s equity, originally held in Swiss francs has, in consequence, now been converted into euros, and during a period of strength for the Swiss franc against the EU single currency, brought UEFA’s equity close to the € 500 million mark.
The 2011/12 campaign will also be marked by the implementation of a new integrated finance and administration IT application. This was considered the ideal timing to bring UEFA’s accounting system even closer into line with international standards. Given that advance payments for coming seasons are now entered in the balance sheet directly and no longer indirectly via the former period adjustment position, a few 2009/10 figures – but obviously not the bottom line – have changed in the restated form when compared with figures published in last year’s financial report.
“ With effect from 2011/12, the Euro will not only be used as the reporting currency but also as the new official accounting currency.”

4
InCOmE sTATEmEnT
UEFA’s total 2010/11 revenue of € 1,384.5 million was slightly higher compared with the previous year. With effect from this financial year and in anticipation of the application of international standards, payments related to coming seasons are no longer incorporated in the figures disclosed in this section but entered directly in the balance sheet – hence the restatement of the 2009/10 figures.
Thanks to higher income from broadcasters and sponsors for the competitions played during the year
under review, the distribution made to the participating teams passed the € 1 billion mark for the first time. This level had not been reached even in the 2007/08 financial year, when the EURO 2008 distribution had been included under this heading.
UEFA’s net result of minus € 85.9 million against the budget of minus € 75 million approved by the 2010
UEFA Congress was heavily marked by currency exchange losses, mainly unrealised losses, however, on which UEFA had no influence but at least valid
“ The distribution made to the participating teams passed the¤1billionmark.”
© 2
011
Get
ty Im
ages

5
Financial Report 2010/11
compensation, with the weakness of the euro against the Swiss franc having a positive effect on UEFA’s equity expressed in euros, as disclosed on page 16. Despite this year’s loss of € 85.9 million, UEFA’s equity expressed in euros decreased by only € 40.2 million over this same period and now stands at € 493.7 million.
UEFA’s actual performance over the 2010/11 financial year should therefore be measured on the basis of the operating result. The impressive € 76.7 million achieved in 2010/11 is clearly higher than both the 2009/10 result (€ 45 million) and the 2010/11 budget (€ 45.5 million) as approved by the UEFA Congress.
€ m 2010/11 2009/10
Total revenue 1 384.5 1 308.8
Total event expenses - 1 193.3 - 1 156.8
thereof distribution to participating teams - 1 000.6 - 960.2
Gross result 191.2 152.0
Total personnel expenses - 44.6 - 35.3
Total other expenses - 69.9 - 71.7
Operating result 76.7 45.0
Total non-operating items 75.4 126.5
Total solidarity payments - 238.0 - 237.9
Net result - 85.9 - 66.4
Expenses net ResultRevenue
1,384.5¤m 1,470.4
- 85.9

6
sOURCE OF InCOmE
The composition of UEFA’s total income is further analysed from two perspectives, by nature and by activity (competitions).
In addition to the first four items on the consolidated income statement, UEFA’s total income comprises its asset management result, as well as the financing
from the EURO pool, resulting for 2010/11, in a total income of € 1,453.1 million.
In terms of income by nature, broadcasting rights continued to represent the lion’s share in 2010/11, representing 75 %, with commercial rights representing a further 19 %. For the first time, due to the weakness of the euro against the Swiss franc causing very high – though unrealised – currency losses, the asset management result did not add to but, unfortunately, reduced the amount of total income.
“ Broadcasting rights continued to represent the lion’s share.”
Revenue and income by nature
€ m 2010/11 2009/10
Broadcasting rights 1 086.3 1 023.0
Commercial rights 275.1 273.3
Ticket and hospitality 9.1 3.3
Other revenue 14.0 9.2
Total revenue 1 384.5 1 308.8
Financial items - 30.9 18.8
EURO pool reversal 99.5 101.7
Source of income 1 453.1 1 429.3
© S
po
rtsf
ile

7
Financial Report 2010/11
7
The table below illustrates the source of UEFA’s 2010/11 income by activity, i.e. by competition. The total UEFA Champions League revenue, including tickets, of € 1,147.8 million represented 79 % of this total, while the UEFA Europa League accounted for € 210.4 million in effective and 14.5 % in relative
figures. Both these figures are higher than last year. When comparing total UEFA Europa League revenue with the UEFA Champions League, it should always be borne in mind that the UEFA Champions League took some years to acquire its current status and standards.
Revenue and income by competition and by activity
€ m 2010/11 2009/10
UEFA European Football Championship 0 0
UEFA Champions League 1 147.8 1 099.4
UEFA Europa League 210.4 195.0
Other competitions and income 94.9 134.9
Source of income 1 453.1 1 429.3
UEFA Champions League
UEFA Europa League
Other competitions and income
6.5 %79.0%
14.5 %
© S
po
rtsf
ile

8
UsE OF InCOmE
It is UEFA’s responsibility and obligation to use income as efficiently and fairly as possible. By far the most important share (€ 1,000.6 million) was distributed to the teams competing in UEFA competitions. Details can be found on the following pages, which disclose the competition results of both the UEFA Champions League and the UEFA Europa League.
UEFA is very satisfied that solidarity payments, including the funds made available to its member associations through the HatTrick programme, occupy second position in terms of use of income, amounting to € 238 million.
The positive effect of the new accounting principles, whereby EURO 2012-related revenue and expenses are deferred to the balance sheet, is that the yearly results can be compared directly over the years, as no period adjustments are included and presented under organisational costs. Therefore, the 2009/10 figures have been restated.
The total organisational costs of UEFA’s main competitions did not change and include the UEFA Champions League, the UEFA Europa League and the UEFA Super Cup, as well as the EURO 2012 qualifiers. The organisational costs of all other competitions, including youth and women’s competitions, as well as the UEFA European Under-21 Championship, are shown under other competitions, the total of which
increased in 2010/11 because of an Under-21 final round having taken place during this period.
UEFA’s governing expenses of € 62.3 million remained under control. These figures refer to all expenses which are not attributed directly to a competition or defined projects. It is UEFA’s intention to maintain tight control over these governing expenses, which, in the long term, should not be allowed to exceed the 4 % mark.
“ UEFA's responsibility and obligation is to use income as efficiently and fairly as possible.”
© U
EFA

9
Financial Report 2010/11
€ m 2009/10 2010/11 in %
Distributions to main competitions teams - 960.2 - 1 000.6 68.9 %
Solidarity (incl. HatTrick) - 237.9 - 238.0 16.4 %
Organisation: main competitions - 162.5 - 162.9 11.2 %
Organisation: other competitions - 25.2 - 26.6 1.8 %
Football development (incl. education and events) - 7.9 - 10.3 0.6 %
ICT and media technologies - 45.9 - 38.3 2.7 %
Governing expenses - 56.1 - 62.3 4.3 %
Net financing from UEFA equity 66.4 85.9 - 5.9 %
Total use of income 1 429.3 1 453.1 100.0 %
Football development
Equity financed
Total
1,453.1
distribution
1,000.6
solidarity
238.0
main competitions
162.9
governing expenses
62.3
ICT and media
38.3
Other competitions
26.6 10.3
85.9
¤m
© U
EFA

10
gOVERnIng EXPEnsEs
The expenses related to the running of UEFA as a governing body can be listed under the following headings:
• UEFA administration expenses: these include personnel and other general administrative costs, such as travel and office running costs, which at present are not directly allocated to a specific competition or project. Compared with 2009/10, the increase in costs expressed in euros is clearly related to the stronger Swiss franc, as most of these expenses are invoiced in the local currency. This category also covers the maintenance and running costs of the three buildings in Nyon. With the implementation of a new cost accounting system in 2011/12, these allocation principles will
be adapted, given that the major part of UEFA’s buildings are occupied by operational units. To reflect this fact also in financial terms, the relevant costs, for example of UEFA’s competitions or refereeing, should be charged to the relevant competitions. This change will mean lower administration expenses published under this heading and the disclosure of the total effective costs of UEFA competitions.
• Institutional and disciplinary proceedings: this heading embraces the organisation of the UEFA Congress, meetings of the UEFA Executive Committee and, as the title suggests, disciplinary proceedings, including UEFA’s commitment to activities aimed at fighting betting fraud.
• Committees and panels: this area covers the total costs of all of UEFA’s committees and panels. The decrease in expenses compared with 2009/10 is related to the fact that the uniforms were replaced in the previous year and the investment was shown under this subheading.
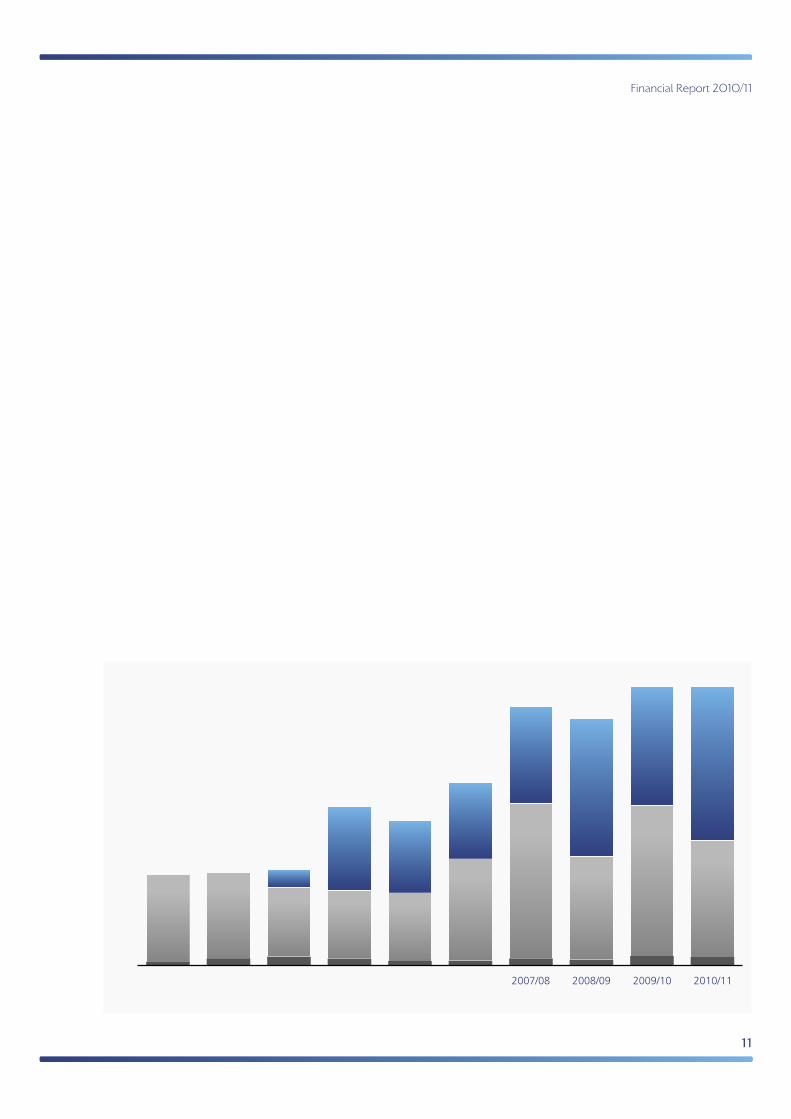
UEFA is clearly committed to keeping governing expenses as low as possible in order to allow maximum resources to be allocated to solidarity payments, football development and to the teams participating in UEFA competitions. The percentage of governing expenses in relation to total revenue is closely monitored and, as highlighted elsewhere in this report, UEFA’s objective is to remain below the 4 % benchmark. The following chart illustrates the evolution over the years, with annual governing expenses and average total revenue over four years set against each other. This offers the best basis for comparison, bearing in mind that such comparisons would otherwise be distorted by UEFA European Football Championship final rounds every fourth year.
“ UEFA is clearly committed to keepinggoverningexpenses as low as possible.”
€ m 2007/08 2008/09 2009/10 2010/11
UEFA administration expenses 31.3 32.6 36.8 48.7
Institutional and disciplinary proceedings 12.0 12.4 16.9 11.8
Committees and panels 1.3 1.3 2.4 1.8
Total governing expenses 44.6 46.3 56.1 62.3
1 %
2 %
3 %
4 %
5 %
6 %
ACT 04/05 ACT 05/06 ACT 06/07 ACT 07/08 ACT 08/09 ACT 09/10 ACT 10/11
governing expenses in % of revenue
Trend
11
Financial Report 2010/11
2010/112009/102008/092007/082006/072005/062004/052003/042002/032001/02
7856446863
131
101
117
83
65
6171
15
10012988132875858597374
Total 77 79 82 135 123 156 221 210 238 238
sOLIdARITy
In pure figures, the total made available for solidarity payments is the second largest after the amount distributed to participating teams, as shown in the use of income chart on page 9. But, more importantly, solidarity payments represent a cornerstone in UEFA’s philosophy.
Thanks to the concept of central marketing and, of course, the ever-increasing popularity of UEFA’s flagship competitions, it is possible for UEFA, as a governing body, to generate substantial revenue. It is UEFA’s objective to plough back as much as possible of these resources into European football, not only via payments to participating teams and member associations, but also to those which may not have qualified to take part in the revenue-generating segments of UEFA’s competitions.
This has two-fold objectives, given that reducing financial gaps has the additional benefit of reducing sporting gaps and opening up the elite competitions
to a maximum number of associations and teams. The sharing of resources is a boost to the development of the European game at grassroots and youth levels, again in associations and clubs. Above all, the solidarity concept is an unwritten mutual contract aimed at developing the European football family as a whole and promoting the social values of the game.
Solidarity payments are made available to:
• national associations to develop infrastructure
• national associations to co-finance some of their statutory tasks
• national associations as incentives (participation in non-top competitions, and for good governance, including club licensing project)
• clubs eliminated in the preliminary stages of the UEFA Champions League and UEFA Europa League
• other top division clubs that do not qualify for UEFA competitions, with payments distributed by the leagues or associations for youth development.
“ solidarity payments represent a cornerstone in UEFA’s philosophy.”
HatTrickprogramme
solidarity
Contribution and donations
¤m

12
THE FLOW OF UEFA sOLIdARITy PAymEnTs
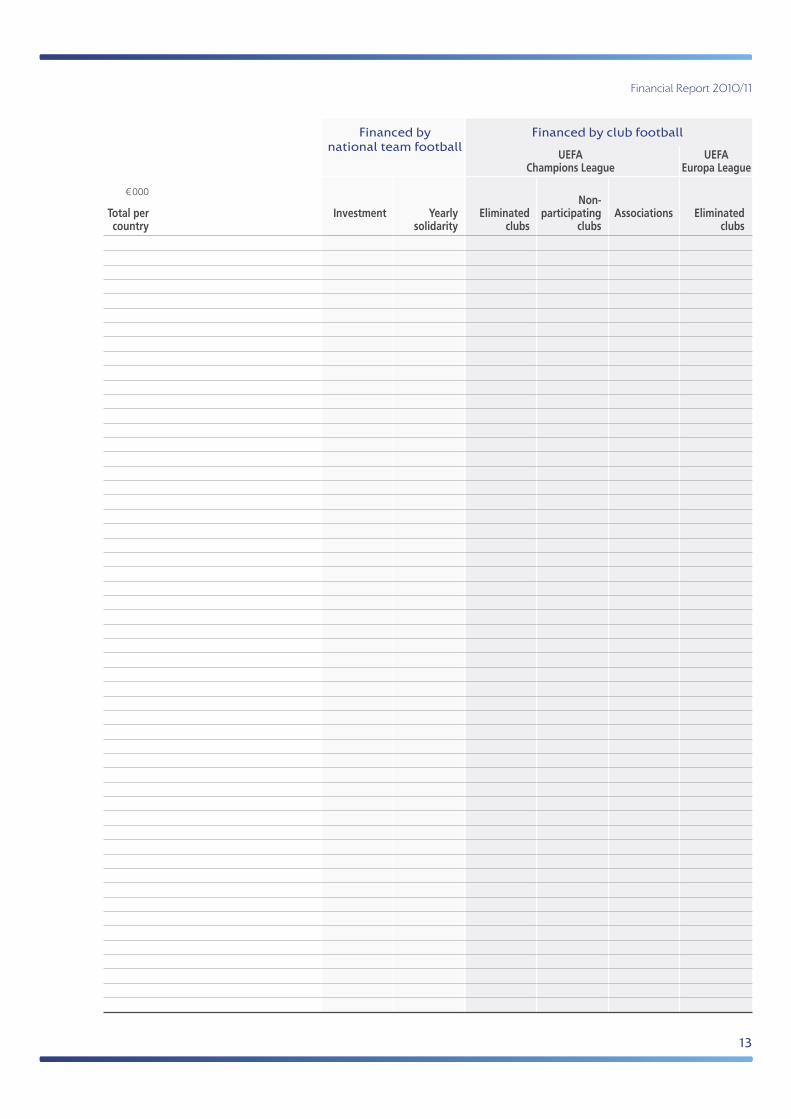
The previous pages of this report have focused on the source of the revenue used for UEFA’s solidarity payments. But it is also important to provide an overview of all the beneficiaries of these payments.
The various beneficiaries are disclosed in six columns on the table on the opposite page. However, the interpretation of this information needs to take into account that a portion of solidarity payments stem from revenue generated by club competitions and that they therefore mainly benefit club football. The other part, financed by national team football and derived from EURO final rounds, is made available to national associations within the framework of the HatTrick programme.
However, the football family is not divided into two sections but is an integrated, inter-related whole. As in any real family, solidarity within European football is based on mutual values – which means that
benefits are directed into club and national team football. Inter-relationships can be illustrated by the fact that, when a EURO final round takes place every four years, a significant portion of the financial distribution is channelled to the clubs participating in the success of the tournament. On the other hand, as can be seen in the chart on the opposite page, a proportion of the annual income generated by club football is injected into the EURO pool and channelled towards national associations.
“ As in any real family, solidarity within European football is based on mutual values.”
solidarity payments financed by national team football
1 The HatTrick programme for the 2008–12 four-year cycle provides for a one-off € 2.5 million solidarity payment per association to be used for investments in football infrastructure. The amounts distributed during the 2010/11 financial year are disclosed in this section. In some cases, these still include payments from the first HatTrick cycle.
2 The HatTrick programme also provides for yearly solidarity payments in favour of national associations, consisting of the following elements :
• € 500,000 as a yearly solidarity payment to cover current running costs
• € 800,000 as a maximum yearly incentive payment, including:
– € 250,000 max. for participating in non-top UEFA competitions
– € 250,000 max. for implementing and applying the UEFA club licensing system
– € 100,000 max. for implementing and applying the UEFA Coaching Convention
– € 100,000 max. for implementing and applying the UEFA Grassroots Charter
– € 100,000 max. for improving good governance
• UEFA’s contribution to the running of the Referee Convention also forms part of the HatTrick solidarity payments.
Although not included in the association by association totals, the UEFA Study Group Scheme and HatTrick education are also financed via the EURO pool and included in the annual solidarity total.
solidarity payments financed by club football
3 A lump sum, depending on the number of matches played, was paid to clubs which were on the starting grid but which failed to qualify for the group stage of the UEFA Champions League, with an additional amount of € 200,000 for a domestic champion. No payments were made to clubs involved in UEFA Champions League qualifying rounds which succeeded in reaching the group stage.
4 A substantial amount was made available to clubs not involved in European competitions for youth development. According to decisions taken by the relevant leagues and/or national associations, clubs in the domestic first division and, in some cases, in the second division were included in this scheme.
5 € 26.5 million was transferred into the EURO pool for the benefit of UEFA’s member associations.
6 The formula described in paragraph 3 above was also applied to the UEFA Europa League.
13
Financial Report 2010/11
Financed by Financed by club football national team football UEFA UEFA Champions League Europa League
€ 000 Non-
Total per Investment Yearly Eliminated participating Associations Eliminated country solidarity clubs clubs clubs 2 716 Albania – 1 221 330 305 500 360 2 656 Andorra – 1 296 330 260 500 270 2 719 Armenia – 1 356 330 263 500 270 3 864 Austria 575 1 361 330 468 500 630 3 077 Azerbaijan 237 1 205 330 265 500 540 3 743 Belarus 72 1 632 460 269 500 810 3 324 Belgium 250 1 381 330 503 500 360 3 257 Bosnia and Herzegovina 353 1 265 330 269 500 540 2 994 Bulgaria – 1 253 460 331 500 450 2 910 Croatia – 1 300 460 290 500 360 3 807 Cyprus 400 1 321 460 316 500 810 3 027 Czech Republic – 1 381 330 456 500 360 4 063 Denmark – 1 360 – 1 483 500 720 15 781 England – 1 414 – 13 687 500 180 2 742 Estonia – 1 381 330 261 500 270 5 601 Faroe Islands 2 925 1 316 330 260 500 270 4 101 Finland 768 1 380 460 273 500 720 7 797 France 1 350 1 341 – 4 516 500 90 4 136 FYROM 1 156 1 341 330 269 500 540 3 208 Georgia 47 1 436 330 265 500 630 9 435 Germany – 1 361 – 7 484 500 90 5 805 Greece 1 208 1 380 130 2 317 500 270 3 205 Hungary – 1 381 460 324 500 540 2 845 Iceland – 1 381 330 274 500 360 4 474 Israel 1 300 1 381 – 753 500 540 10 500 Italy – 1 380 – 8 530 500 90 2 809 Kazakhstan – 1 224 460 265 500 360 4 054 Latvia 1 287 1 406 330 261 500 270 2 085 Liechtenstein – 1 235 – 260 500 90 3 392 Lithuania 585 1 356 330 261 500 360 3 387 Luxembourg 805 1 221 330 261 500 270 2 714 Malta – 1 285 460 289 500 180 3 048 Moldova – 1 355 330 413 500 450 3 083 Montenegro 250 1 156 460 267 500 450 4 080 Netherlands 500 1 381 – 1 339 500 360 3 105 Northern Ireland 225 1 340 330 260 500 450 3 200 Norway 100 1 381 330 529 500 360 3 720 Poland 250 1 381 460 589 500 540 3 411 Portugal 243 1 305 – 1 003 500 360 3 040 Republic of Ireland – 1 381 330 379 500 450 4 240 Romania – 1 456 130 1 614 500 540 3 719 Russia 100 1 300 – 1 549 500 270 2 385 San Marino – 1 115 330 260 500 180 4 333 Scotland 298 1 361 130 1 504 500 540 3 083 Serbia – 1 380 – 753 500 450 3 639 Slovakia 680 1 346 – 753 500 360 3 426 Slovenia 492 1 381 330 273 500 450 10 001 Spain 125 1 456 – 7 920 500 – 6 035 Sweden 2 400 1 360 460 415 500 900 3 445 Switzerland 452 1 380 – 753 500 360 5 268 Turkey 750 1 341 130 2 007 500 540 3 167 Ukraine – 1 454 – 763 500 450 2 971 Wales – 1 301 460 260 500 450 222 627 TOTAL 20 183 71 243 13 300 69 891 26 500 21 510
1 2 3 4 5 6

14
BALAnCE sHEET
UEFA’s balance sheet total as at 30 June 2011 increased substantially, by over 30 %, and now stands above € 1.8 billion. Further accumulated payments related to EURO 2012 and substantial advance payments for the 2012–15 club competition cycle explain this development.
The structure of the balance sheet did not change significantly. The cash and cash equivalents within UEFA’s assets and the deferred income and advances from third-party positions within UEFA’s liabilities on their own absorb the lion’s share of the variance between these two financial years.
A closer look at UEFA’s assets reveals that long-term securities decreased while investments in land and buildings increased to achieve an even wider diversification. The increases in projects in progress and inventories, as well as receivables from football partners, are mainly related to EURO 2012.
The cash and cash equivalents represent € 1,069 million or roughly 60 % of the balance sheet total. By adding the € 419.5 million in long-term securities, UEFA’s financial assets invested with 22 top-rated counterparts, i.e. well-known international banks, amounted to € 1,488 million and represented 82.5 % of UEFA’s assets as at 30 June
2011. Risk monitoring of these assets is performed on a monthly basis. Given the importance of these financial assets, external expertise and a sophisticated scoring list are provided by UEFA’s advisory bank to best safeguard these assets, the assets of UEFA’s member associations.
UEFA’s balance sheet can be considered as very solid. Even after having absorbed the negative 2010/11 net result, equity still stands at € 493.7 million, which is only € 40.2 million lower than a year ago. This is due to the relation of the Swiss franc against the euro, which had a one-off negative impact on the 2010/11 net result and, in contrast, a positive effect on UEFA’s equity expressed in euros. Given that the euro becomes UEFA’s accounting currency from the 2011/12 financial year, UEFA equity of € 493.7 million will be carried forward as at 1 July 2011, with the positive currency effects on UEFA’s equity expressed in euros as at 30 June 2011 therefore having a permanent effect.
“Riskmonitoringoftheseassets is performed on a monthly basis.”
© 2
011
Get
ty Im
ages

15
Financial Report 2010/11
€ m 30/06/2011 30/06/2010
Cash and cash equivalents 1 068.8 705.0
Other current assets 175.7 86.2
Total current assets 1 244.5 791.2
Financial assets 460.9 497.5
Other fixed assets 96.9 83.1
Total fixed assets 557.8 580.6
Total assets 1 802.3 1 371.8
Current liabilities 1 292.2 815.5
Other liabilities and provisions 16.4 22.4
Total liabilities 1 308.6 837.9
Total UEFA equity 493.7 533.9
Total liabilities and UEFA equity 1 802.3 1 371.8
¤m
1,244.5 1,308.6Current assets
557.8 493.7Fixed assets
Assets Liabilities UEFA equity
© U
EFA
16
EqUITy EVOLUTIOn
The fact that UEFA recorded a negative result of € 85.9 million in 2010/11 but that its equity decreased only by € 40.2 million, from € 533.9 million to € 493.7 million, during the same period is currency-related.
UEFA’s equity is denominated in Swiss francs, whereas the decrease in equity, as recorded at the end of the 2010/11 financial year, is expressed in euros. The strength of the Swiss franc against the euro on the balance sheet closure date meant that the amount in Swiss francs translated to a higher equivalent when expressed in euros. The exchange rate at the end of the financial year was 1.22 Swiss francs to the euro, compared with 1.32 in the previous year – which explains the substantial difference.
Currency effects are expected to continue to influence UEFA’s equity as expressed in euros, however, to a lesser extent, given that the euro, representing roughly 90 % of UEFA’s financial assets, will also serve as its accounting currency from the 2011/12 financial year. This favourable effect will have a lasting positive impact on UEFA’s equity expressed in euros - now standing close to the € 500 million mark.
As is the case every four years, after a EURO final round, UEFA’s equity, i.e. the retained earnings position, will increase substantially in the course of 2011/12. The losses over the following three financial years will then be offset against this same position.
30 June 2005 30 June 2006 30 June 2007 30 June 2008 30 June 2009 30 June 2010 30 June 2011
212
¤m
242 256
508 518534
494
© U
EFA

17
Financial Report 2010/11
€ m 2007/08 2008/09 2009/10 2010/11 Cumulative in %
UEFA European Football Championship 1 039 0 0 0 1 039 18.8 %
UEFA Champions League 822 820 1 099 1 148 3 889 70.4 %
UEFA Europa League 53 54 195 210 512 9.3 %
Other competitions and income 24 54 33 - 1 110 2.0 %
Formation and use of EURO pool provision - 342 117 102 96 - 27 - 0.5 %
Source of income 1 596 1 045 1 429 1 453 5 523 100.0 %
Distributions to teams - 822 - 644 - 960 - 1 001 - 3 427 61.9 %
Solidarity (including HatTrick) - 221 - 210 - 238 - 238 - 907 16.4 %
Organisation : main competitions - 220 - 116 - 162 - 163 - 661 12.0 %
Organisation : other competitions - 19 - 21 - 25 - 27 - 92 1.7 %
Football development, education and events - 6 - 7 - 8 - 10 - 31 0.6 %
ICT and media technologies - 28 - 29 - 46 - 38 - 141 2.6 %
Governing expenses - 44 - 46 - 56 - 62 - 208 3.8 %
Net financing from UEFA equity - 236 28 66 86 - 56 1.0 %
Use of income - 1 596 - 1 045 - 1 429 - 1 453 - 5 523 100.0 %
THE FOUR-yEAR CyCLE
UEFA is a not-for-profit organisation. But this fundamental aspect is not visible if results for a single financial year are considered in isolation. As previously mentioned, an exercise which embraces a EURO final round produces a positive net result, whereas years without yield a negative result. The
overall revenue and expense streams therefore have to be seen over a four-year financial period in order for a clear picture to become visible. The current report is based on a cycle which starts from a year with a EURO final round and is followed by three successive years without. The following figures are therefore based on the current cycle, which started with UEFA EURO 2008. The table shows that over the four-year period, UEFA generated approximately € 5.5 billion in revenue. In order to be transparent, it is necessary to add the reversal of the EURO pool provision, which finances UEFA’s HatTrick programme.
From this overall € 5.5 billion, UEFA is distributing nearly 62 % to participating clubs and national associations, as well as € 907 million as solidarity payments to national associations and clubs. It goes without saying that a considerable amount is required to organise and run UEFA’s main competitions. If the organisational costs of other competitions are combined with totals for football development, education and events, another € 123 million can be seen to be reinvested in football. From another perspective, costs for media technologies (including investment in the UEFA website), the Legacy video archive system and information technologies also go towards the development and promotion of European football. Governing expenses are explained in greater detail on page 10, where it is emphasised that less than 4 % of the total is used for running the UEFA administration, committees and panels and other institutional aspects.
UEFA’s status as a not-for-profit organisation means that the balance at the end of a four-year cycle (in this case, the 2010/11 exercise) should be zero. The situation of the current cycle is a surplus of € 56 million.
“ Overall revenue and expense streams have to be seen over a four-year financial period in order for a clear picture to become visible.”

18
UEFA CHAmPIOns LEAgUE
In this second season of the 2009–12 three-year contractual cycle, total revenue increased to € 1.145 billion. Besides the reasons mentioned below, currency effects also had a significant impact, given that some of the contracts with UEFA Champions League partners are designated in British pounds and US dollars.
This 2010/11 season again included 20 play-off matches to finalise the list of 32 group stage participants. These play-offs were included in the UEFA Champions League contracts, bringing the total number of UEFA Champions League matches played to 145. In addition, the UEFA Super Cup match is also part of the UEFA Champions League package. The dual UEFA Champions League access – the champions’ route and the league route – again enabled clubs from a greater number of national associations to participate in the group stage of the competition.
The injection of two additional matchweeks (four matchdays) into the UEFA Champions League calendar was also a significant factor. These organisational changes helped to make the UEFA Champions League even more attractive to broadcasters and sponsors, not only in Europe but also, to an even faster growing extent, in other sectors of the global audience.
Distribution to clubs
The lion’s share of income continues to be made available to the clubs which participate in the competition, including the 20 involved in the play-off round, ten of which were diverted into the group stage of the UEFA Europa League. The two clubs involved in the UEFA Super Cup were also rewarded financially. The principles governing the distribution of revenue among the participating 32 UEFA Champions League group stage clubs remained essentially the same as in the past, with a fixed amount, a performance bonus and an important part of the financial benefits distributed through the market pool concept. Market pool shares in favour of UEFA Champions League clubs are in proportion to the value of the broadcasting revenue within the territory of their respective national associations.
Each of the 20 clubs involved in the UEFA Champions League play-offs received € 2.1 million, while the 32 group stage clubs received a participation bonus of € 3.9 million each. Further payments related to group matches included a match bonus of € 550,000 per game played and, in addition, a performance bonus of € 800,000 for every win and € 400,000 for every draw.
Additional payments were made to the clubs that progressed further in the competition, with € 3 million the reward for reaching the round of 16, € 3.3 million for reaching the quarter-finals and € 4.2 million for a semi-final place. The winners of the final at Wembley Stadium, FC Barcelona, collected a further € 9 million, with € 5.6 million going to the runners-up, Manchester United FC.
As already mentioned, participating clubs were also entitled to a share of the market pool based on the commercial value of their domestic television market, the number of UEFA Champions League matches played during the season in question and their final position in the previous season’s domestic league table.
“Organisationalchangeshelpedtomake the UEFA Champions League even more attractive.”
© S
po
rtsf
ile

19
Financial Report 2010/11
Given that total UEFA Champions League revenue was higher than anticipated when the amounts for distribution in 2010/11 were fixed, a surplus of € 32.2 million was available at the end of the 2010/11 season. This surplus was split among the 32 clubs in proportion to the total of the fixed amount and market pool shares already received by each club during this season. These surplus amounts are included in the market pool column on page 21.
It should also be noted that, with regard to all but one of the matches played, the home club kept all gate receipts – the exception being the final in London, where the two finalists received equal shares.
Solidarity payments
Ever since its introduction, the UEFA Champions League concept has been based on one winner on the pitch and a large number of winners in terms of solidarity payments derived from UEFA’s flagship club competition. During the current 2009–12 cycle, these
solidarity payments have increased considerably. This has been possible thanks to higher overall revenue for distribution and to the satisfying fact that the clubs (through the European Club Association) agreed to increase the solidarity share percentage from 5 % to 6.5 % of total revenue.
Contribution to the development of European football
€ 78.1 million (or 6.8 %) of UEFA Champions League total revenue was able to be allocated to European football as a whole. This is not the net profit, however, as all the administrative costs related to this competition, such as personnel and marketing expenses, are not debited against the project accounts of this competition. The lion’s share of this contribution is directly re-invested in football, first and foremost in non-top competitions, to further develop the game at the base of the footballing pyramid and for the benefit of European football as a whole.
© 2
011
Get
ty Im
ages

20
€ m 2010/11 in % 2009/10 in %
Broadcasting rights 885.1
Commercial rights 259.9
Currency exchange differences 0.2
TOTAL REVENUE 1 145.2 100.0 % 1 108.5 100.0 %
Distribution: participation and match bonus - 272.4
Distribution: performance bonus - 182.6
Distribution: market pool - 373.3
Distribution: other - 2.4
Total distribution to clubs - 830.7
Solidarity financed by clubs - 68.3
CLUB SHARE - 899.0 78.5 % - 869.1 78.4 %
Event expenses - 92.8
Internal allocation: UEFA.com - 17.3
Internal allocation: UEFA Super Cup - 6.0
Referees and match officers - 10.6
Solidarity financed by UEFA - 14.9
Solidarity to member associations - 26.5
Contribution to European football - 78.1
UEFA SHARE - 246.2 21.5 % - 239.4 21.6 %
UEFA Champions League : project accounts
¤m
Club share 899.0
UEFA share 246.2
Revenue 1,145.2
21
Financial Report 2010/11
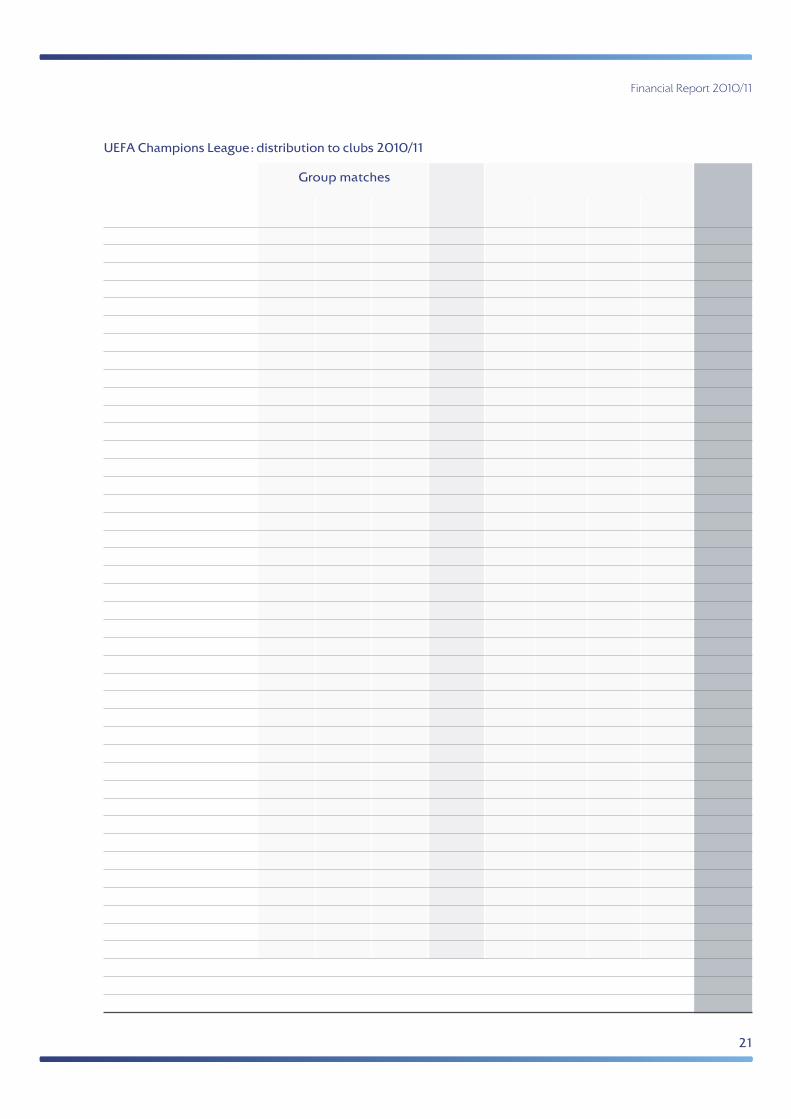
UEFA Champions League : distribution to clubs 2010/11
group matches Market Knockoutmatches
€ 000 Participation Match Performance pool
Round Quarter- Semi- Final Total bonus bonus bonus of 16 finals finals
group A Tottenham Hotspur FC 3 900 3 300 3 200 15 762 3 000 3 300 – – 32 462
FC Twente 3 900 3 300 2 000 4 806 – – – – 14 006
FC Internazionale Milano 3 900 3 300 2 800 23 303 3 000 3 300 – – 39 603
SV Werder Bremen 3 990 3 300 1 600 9 401 – – – – 18 201
group B Hapoel Tel-Aviv FC 3 900 3 300 1 600 1 737 – – – – 10 537
Olympique Lyonnais 3 900 3 300 2 800 10 623 3 000 – – – 23 623
FC Schalke 04 3 900 3 300 3 600 20 147 3 000 3 300 4 200 – 41 447
SL Benfica 3 900 3 300 1 600 3 540 – – – – 12 340
group C Valencia CF 3 900 3 300 3 200 11 683 3 000 – – – 25 083
Manchester United FC 3 900 3 300 4 000 28 168 3 000 3 300 4 200 5 600 55 468
Rangers FC 3 900 3 300 2 000 10 116 – – – – 19 316
Bursaspor 3 900 3 300 400 13 304 – – – – 20 904
group d FC Rubin Kazan 3 900 3 300 2 000 5 133 – – – – 14 333
FC Barcelona 3 900 3 300 4 000 22 505 3 000 3 300 4 200 9 000 53 205
Panathinaikos FC 3 900 3 300 800 15 323 – – – – 23 323
FC Kobenhavn 3 900 3 300 2 800 9 155 3 000 – – – 22 155
group E FC Basel 1893 3 900 3 300 1 600 2 665 – – – – 11 465
FC Bayern München 3 900 3 300 4 000 19 751 3 000 – – – 33 951
AS Roma 3 900 3 300 2 800 18 371 3 000 – – – 31 371
CFR 1907 Cluj 3 900 3 300 1 200 10 798 – – – – 19 198
group F Chelsea FC 3 900 3 300 4 000 28 922 3 000 3 300 – – 46 422
Olympique de Marseille 3 900 3 300 3 200 12 756 3 000 – – – 26 156
FC Spartak Moskva 3 900 3 300 2 400 4 699 – – – – 14 299
MSK Zilina 3 900 3 300 – 529 – – – – 7 729
group g AJ Auxerre 3 900 3 300 800 6 306 – – – – 14 306
Real Madrid CF 3 900 3 300 4 400 18 865 3 000 3 300 4 200 – 40 965
AFC Ajax 3 900 3 300 2 000 3 655 – – – – 12 855
AC Milan 3 900 3 300 2 400 14 291 3 000 – – – 26 891
group H FK Partizan 3 900 3 300 – 1 675 – – – – 8 875
Arsenal FC 3 900 3 300 3 200 17 862 3 000 – – – 31 262
SC Braga 3 900 3 300 2 400 2 749 – – – – 12 349
FC Shakhtar Donetsk 3 900 3 300 4 000 4 700 3 000 3 300 – – 22 200
Total 32 clubs 124 800 105 600 76 800 373 300 48 000 26 400 16 800 14 600 786 300
Contribution in favour of the 20 clubs involved in the UEFA Champions League play-offs (€ 2.1 million per club) 42 000
Allocated to the European Club Association in accordance with the Memorandum of Understanding with UEFA 2 445
TOTAL DISTRIBUTION 830 745
22
UEFA EUROPA LEAgUE
The introduction of this competition, which replaced the UEFA Cup, represented an important change which had positive repercussions for European club football. The 48 teams which qualified for the group stage in the second season of the UEFA Europa League were drawn into 12 groups, with the result that every team played a minimum of three home matches. The winner and runner-up in each of the 12 groups were joined by the 8 teams which had
earned the right to continue their European campaign by finishing third in their UEFA Champions League group. These 32 clubs were the starters in the first of the four knockout rounds which determined the two teams in the UEFA Europa League final in Dublin. In all, 205 UEFA Europa League matches were staged all over Europe.
As opposed to the old UEFA Cup format where the groups comprised five teams, the UEFA Europa League format allows opponents to meet on a traditional home and away basis, with UEFA selling broadcasting and commercial rights on a centralised basis. The financial result achieved in this second season was very encouraging and confirmed that
the new competition had found the right profile and sporting calibre to further develop alongside the UEFA Champions League.
Distribution to clubs
In the UEFA Europa League, 75 % of the total revenue generated was distributed to the participating clubs. The distribution scheme is similar to that of the UEFA Champions League, with a mix of fixed and
performance-based payments, complemented by payments from the market pool, where payments in favour of the clubs are in direct relation to the revenue generated in the relevant markets. Ticketing arrangements are the same as for the UEFA Champions League, with the home club retaining all gate receipts, except for the final, when the two finalists receive equal shares of the ticketing revenue.
Solidarity
Until 2008/09, solidarity payments to clubs in all UEFA competitions were debited in full against the UEFA Champions League project accounts and were partly financed by clubs and by European football.
“ An important change which had positive repercussions for European club football.”
© 2
011
Get
ty Im
ages

23
Financial Report 2010/11
However, since 2009/10, solidarity payments in favour of clubs eliminated in the UEFA Europa League qualifying matches have been debited against the UEFA Europa League project accounts, entirely taken from the UEFA share.
Contribution from European football
In the second season of the UEFA Europa League, a contribution of approximately € 1.6 million was
financed from European football to achieve break-even. Such a contribution was necessary for the sole reason that the € 21.5 million in solidarity payments to the clubs eliminated in the UEFA Europa League qualifying matches had been debited against the project accounts for this competition. UEFA is optimistic that the UEFA Europa League will eventually be able to break even without a contribution from European football.
€ m 2010/11 in % 2009/10 in %
Broadcasting rights 197.1
Commercial rights 13.0
Currency exchange differences 0
TOTAL REVENUE 210.1 100.0 % 196.2 100.0 %
Distribution: participation and match bonus - 52.3
Distribution: performance bonus - 42.4
Distribution: market pool - 62.9
Total distribution to clubs - 157.6
Solidarity financed by clubs 0
CLUB SHARE - 157.6 75.0 % - 147.1 75.0 %
Event expenses - 21.6
Internal allocation: UEFA.com - 0.9
Referees and match officers - 10.1
Solidarity financed by UEFA - 21.5
Contribution from European football 1.6
UEFA SHARE - 52.5 25.0 % - 49.1 25.0 %
UEFA Europa League : project accounts
Club share 157.6
UEFA share 52.5
Revenue 210.1
¤m
24
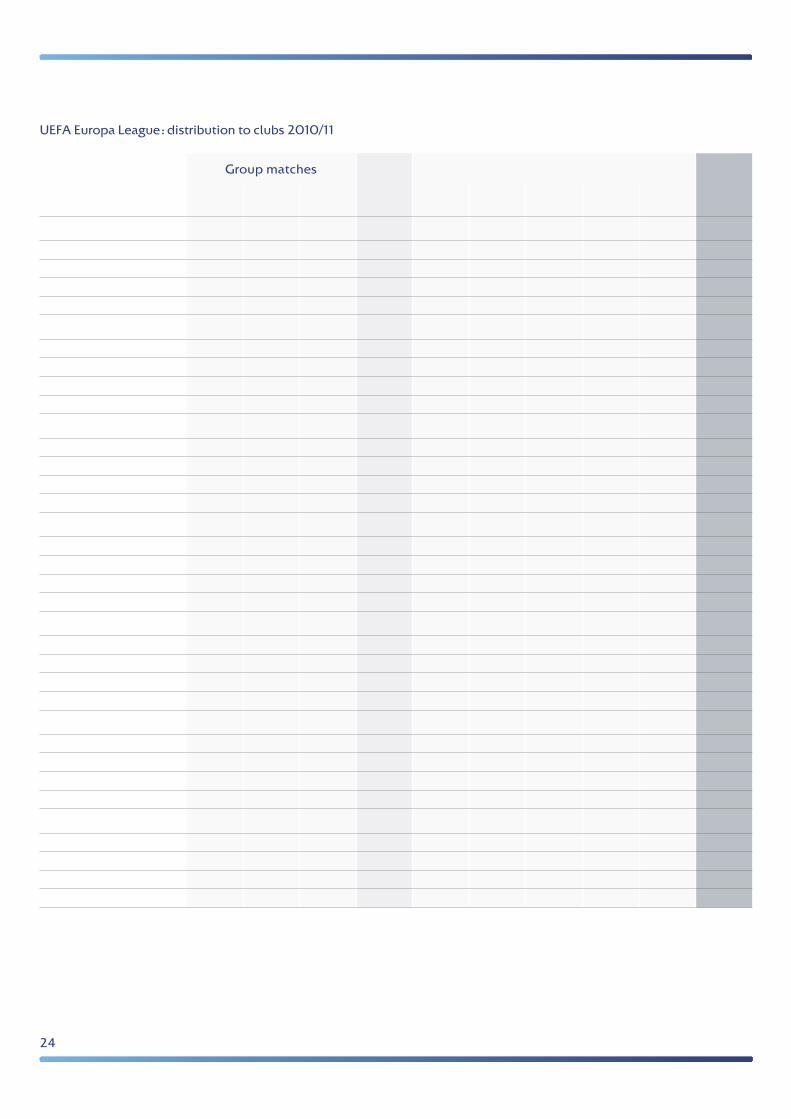
UEFA Europa League : distribution to clubs 2010/11
group matches Market Knockoutmatches
€ 000 Participation Match Performance pool
Round Round Quarter- Semi- Final Total bonus bonus bonus of 32 of 16 finals finals
group A
KKS Lech Poznan 640 360 560 1 326 200 – – – – 3 086
FC Salzburg 640 360 140 144 – – – – – 1 284
Manchester City FC 640 360 560 4 358 200 300 – – – 6 418
Juventus 640 360 420 520 – – – – – 1 940
group B
Rosenborg BK 640 360 140 385 – – – – – 1 525
Aris Thessaloniki FC 640 360 490 1 354 200 – – – – 3 044
Club Atlético de Madrid 640 360 420 1 679 – – – – – 3 099
Bayer 04 Leverkusen 640 360 630 5 638 200 300 – – – 7 768
group C
Sporting Clube de Portugal 640 360 560 492 200 – – – – 2 252
KAA Gent 640 360 350 279 – – – – – 1 629
LOSC Lille Métropole 640 360 420 1 065 200 2 685
PFC Levski Sofia 640 360 350 217 – – – – – 1 567
group d
PAOK FC 640 360 560 1 354 200 – – – – 3 114
NK Dinamo Zagreb 640 360 350 148 – – – – – 1 498
Villarreal FC 640 360 560 6 262 200 300 400 700 – 9 422
Club Brugge KV 640 360 210 204 – – – – – 1 414
group E
FC BATE Borisov 640 360 490 115 200 – – – – 1 805
AZ Alkmaar 640 360 350 375 – – – – – 1 725
FC Sheriff 640 360 280 109 – – – – – 1 389
FC Dynamo Kyiv 640 360 560 404 200 300 400 – – 2 864
group F
PFC CSKA Moskva 640 360 770 1 404 200 300 – – – 3 674
AC Sparta Praha 640 360 490 241 200 – – – – 1 931
US Città di Palermo 640 360 350 520 – – – – – 1 870
FC Lausanne-Sport 640 360 70 137 – – – – – 1 207
group g
HNK Hajduk Split 640 360 140 179 – – – – – 1 319
RSC Anderlecht 640 360 350 268 200 – – – – 1 818
FC Zenit St Petersburg 640 360 840 1 978 200 300 – – – 4 318
AEK Athens FC 640 360 350 1 117 – – – – – 2 467

25
Financial Report 2010/11
group matches Market Knockoutmatches
€ 000 Participation Match Performance pool
Round Round Quarter- Semi- Final Total bonus bonus bonus of 32 of 16 finals finals
group H
Odense BK 640 360 210 545 – – – – – 1 755
VfB Stuttgart 640 360 700 3 963 200 – – – – 5 863
BSC Young Boys 640 360 420 144 200 – – – – 1 764
Getafe CF 640 360 350 972 – – – – – 2 322
group I
UC Sampdoria 640 360 280 520 – – – – – 1 800
Debreceni VSC 640 360 140 271 – – – – – 1 411
FC Metalist Kharkiv 640 360 560 222 200 – – – – 1 982
PSV Eindhoven 640 360 700 636 200 300 400 – – 3 236
group J
Paris Saint-Germain FC 640 360 630 1 878 200 300 – – – 4 008
FC Karpaty Lviv 640 360 70 198 – – – – – 1 268
Borussia Dortmund 640 360 490 3 238 – – – – – 4 728
Sevilla FC 640 360 490 2 059 200 – – – – 3 749
group K
FC Steaua Bucuresti 640 360 350 2 434 – – – – – 3 784
SSC Napoli 640 360 420 784 200 – – – – 2 404
FC Utrecht 640 360 350 375 – – – – – 1 725
Liverpool FC 640 360 560 4 358 200 300 – – – 6 418
group L
SK Rapid Wien 640 360 140 144 – – – – – 1 284
Besiktas JK 640 360 630 7 044 200 – – – – 8 874
PFC CSKA Sofia 640 360 140 217 – – – – – 1 357
FC Porto 640 360 770 1 628 200 300 400 700 3 000 7 998
Clubs from UEFA Champions League
Rangers FC 236 200 300 – – – 736
SL Benfica 344 200 300 400 700 – 1 944
AFC Ajax 94 200 300 – – – 594
SC Braga 973 200 300 400 700 2 000 4 573
FC Basel 1893 7 200 – – – – 207
FC Spartak Moskva 1 300 200 300 400 – – 2 200
FC Rubin Kazan 103 200 – – – – 303
FC Twente 261 200 300 400 – – 1 161
TOTAL DISTRIBUTION 30 720 17 280 20 160 67 220 6 400 4 800 3 200 2 800 5 000 157 580
26
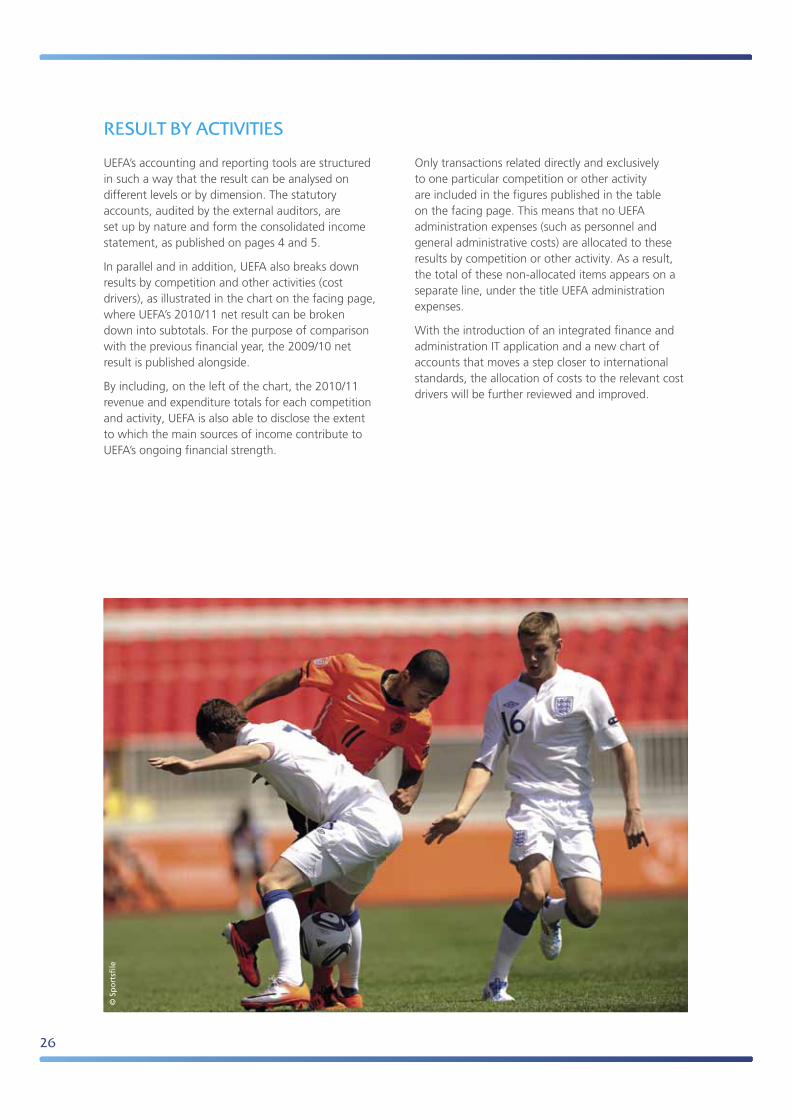
REsULT By ACTIVITIEs
UEFA’s accounting and reporting tools are structured in such a way that the result can be analysed on different levels or by dimension. The statutory accounts, audited by the external auditors, are set up by nature and form the consolidated income statement, as published on pages 4 and 5.
In parallel and in addition, UEFA also breaks down results by competition and other activities (cost drivers), as illustrated in the chart on the facing page, where UEFA’s 2010/11 net result can be broken down into subtotals. For the purpose of comparison with the previous financial year, the 2009/10 net result is published alongside.
By including, on the left of the chart, the 2010/11 revenue and expenditure totals for each competition and activity, UEFA is also able to disclose the extent to which the main sources of income contribute to UEFA’s ongoing financial strength.
Only transactions related directly and exclusively to one particular competition or other activity are included in the figures published in the table on the facing page. This means that no UEFA administration expenses (such as personnel and general administrative costs) are allocated to these results by competition or other activity. As a result, the total of these non-allocated items appears on a separate line, under the title UEFA administration expenses.
With the introduction of an integrated finance and administration IT application and a new chart of accounts that moves a step closer to international standards, the allocation of costs to the relevant cost drivers will be further reviewed and improved.
© S
po
rtsf
ile

27
Financial Report 2010/11
net result by activities
2010/11 2010/11 € m 2010/11 2009/10
Revenue Expenses Net result Net result
0 - 3.0 UEFA EURO and European Championship qualifiers - 3.0 0
1 153.1 - 1 075.0 UEFA Champions League 78.1 67.9
210.5 - 212.1 UEFA Europa League - 1.6 - 8.3
0 0.7 UEFA Super Cup 0.7 0.7
Total main competitions 74.2 60.3
22.4 - 50.0 Asset management - 27.6 7.3
105.8 0 Provisions 105.8 103.7
TOTAL SOURCE OF NET INCOME 152.4 171.3
0.1 - 8.8 Women's competitions - 8.7 - 13.5
5.4 - 13.7 Under-21 competitions - 8.3 - 5.9
0.1 - 6.6 Youth competitions - 6.5 - 4.8
0 - 1.2 Futsal competitions - 1.2 - 1.6
0.5 - 2.4 Various other competitions - 1.9 0.6
Total other competitions - 26.6 - 25.2
0 - 100.8 HatTrick programme and Study Group Scheme - 100.8 - 102.6
2.0 - 9.8 Football development and education - 7.8 - 5.1
0 - 2.5 Events - 2.5 - 2.8
1.4 - 39.7 ICT and media technologies - 38.3 - 45.9
Total other activities - 149.4 - 156.4
1.6 - 50.3 UEFA administration expenses - 48.7 - 36.8
6.8 - 18.6 Institutional and disciplinary proceedings - 11.8 - 16.9
0 - 1.7 Committees and panels - 1.8 - 2.4
Total governing expenses - 62.3 - 56.1
TOTAL USE OF NET INCOME - 238.3 - 237.7
NET RESULT - 85.9 - 66.4
© 2
011
Get
ty Im
ages
© 2
011
Get
ty Im
ages
This financial report is published in English, French and German. The English version is authoritative in respect of financial reporting, in accordance with Article 4.3 of the UEFA statutes.

Setting and printing : Artgraphic Cavin SA, Grandson, Switzerland

UEFAROUTE dE gEnÈVE 46
CH-1260 nyOn 2sWITZERLAnd
TELEPHOnE : +41 848 00 27 27TELEFAX : +41 22 707 27 34
UEFA.com
WE CARE ABOUT FOOTBALL