2010 report on hospitals - mississippimsdh.ms.gov/msdhsite/_static/resources/4371.pdf · 2010...
TRANSCRIPT

2010
Report on Hospitals
2010
Report on Hospitals
Licensed by Mississippi State Department of Health Division of Health Facilities Licensure and
Certification
Licensed by
Mississippi State Department of Health P.O. Box 1700
Jackson, Mississippi 39216
Published June 2011
Health Facilities Licensure and Certification
Marilynn Winborne, Director

Table of Contents Page Preface.............................................................I Map I Distribution of Mississippi Hospitals by Type of Facility and County.................................1 Table I-A Number of Acute Care Hospitals and Beds in Mississippi by Type of Ownership and Control in 2010.....................................2 Table I-B Number of Psychiatric Hospitals and Beds in Mississippi by Type of Ownership and Control in 2010.............................................3 Table I-C Number of Chemical Dependency Hospitals and Beds in Mississippi by Type of Ownership and Control in 2010.............................................4 Table I-D Number of Rehabilitation Hospitals and Beds in Mississippi by Type of Ownership and Control in 2010.............................................5 Table II Accreditations and Certifications of Mississippi Hospitals, 2000, 2005 and 2010......................6 Table III 2010 Staffing of All Mississippi Hospitals by Type....7 Map II Hospital Service Area Map.............................8 Table IV-A Computed Tomographic Body Procedures by Hospital Service Area in 2010................................9 Table IV-B Computed Tomographic Head Procedures by Hospital Service Area in 2010................................9 Table IV-C Diagnostic Radioisotope and X-Ray Procedures by Hospital Service Area in 2010......................10 Table IV-D Digital Subtraction Angiography and Magnetic Resonance Imaging Procedures by Hospital Service Area in 2010...............................10 Table IV-E Positron Emission Tomography and Single Photon Emission Computerized Tomography Procedures by Hospital Service Area in 2010......................11 Table IV-F Ultrasound Procedures by Hospital Services by Hospital Service Area in 2010......................11 Table V-A Linear Accelerator Procedures by Hospital Service Area in 2010...............................12
Table of Contents Continued Table V-B Radioactive Implants by Hospital Service Area in 2010............................................12 Table V-C Therapeutic Radioisotope Procedures by Hospital Service Area in 2010...............................13 Table VI-A Cardiac Catheterizations and Angioplasty (PCTA) Procedure by Hospital Service Area in 2010.........13 Table VI-B Cardiac Surgeries by Hospital Service Area in 2010...14 Table VII Renal Extracorporeal Shock Wave Lithotripter Procedures by Hospital Service Area in 2010........14 Table VIII Physical Therapy and Occupational Therapy Procedures by Hospital Service Area in 2010........15 Table IX Geriatric, Respite and Adult Day Care Patients Served by Hospital Service Area in 2010............15 Table X Surgical Operations and Rooms by Hospital Service Area in 2010......................................16 Table XI Emergency, Clinic/other visits by Hospital Service Area in 2010..............................16 Table XII Rural Health Clinics and Visits by Hospital Service Area in 2010...............................17 Table XIII Selected Statistics for 2010 Licensed Hospital Beds..18 Table XIV-A Average Length of Stay, Average Daily Census and Occupancy Rate by Acute Care Category for Mississippi Hospitals in 2010......................19 Table XIV-B 1 Average Length of Stay, Average Daily Census and Occupancy Rate by Psychiatric Category for Mississippi Hospitals in 2010.....................24 Table XIV-B 2 Average Length of Stay, Average Daily Census and Occupancy Rate by Adult Psychiatric Category for Mississippi Hospitals in 2010.................25 Table XIV-B 3 Average Length of Stay, Average Daily Census and Occupancy Rate by Adolescent Psychiatric Category for Mississippi Hospitals in 2010........26 Table XIV-C 1 Average Length of Stay, Average Daily Census and Occupancy Rate by Chemical Dependency Category for Mississippi Hospitals in 2010.................27
Table of Contents Continued Table XIV-C 2 Average Length of Stay, Average Daily Census and Occupancy Rate by Adult Chemical Dependency Category for Mississippi Hospitals in 2010........28 Table XIV-C 3 Average Length of Stay, Average Daily Census and Occupancy Rate by Adolescent Chemical Dependency Category for Mississippi Hospitals in 2010........29 Table XIV-D Average Length of Stay, Average Daily Census and Occupancy Rate by Rehabilitation Category for Mississippi Hospitals in 2010.....................30 Table XV-A Acute Care Licensed Bed Capacity and Beds Set up and Staffed for Mississippi Hospitals in 2010.....31 Table XV-B Psychiatric Licensed Bed Capacity and Beds Set up and Staffed for Mississippi Hospitals in 2010.....36 Table XV-C Chemical Dependency Licensed Bed Capacity and Beds Set up and Staffed for Mississippi Hospitals in 2010.................................37 Table XV-D Rehabilitation Licensed Bed Capacity and Beds Set up and Staffed for Mississippi Hospitals in 2010...........................................38 Table XVI Swing Bed Average Length of Stay and Average Daily Census for Mississippi Hospitals in 2010..........39 Table XVII Destination of Discharged Swing Bed Patients in 2010, Number Referred to Home Health, and Number of Acute Care Beds Designated as Swing Beds by Hospital Service Area.....................42 Table XVIII Swing Bed Utilization in 2010 by Hospital Service Area......................................43 Table XIX Percentage Distribution of Population and Hospital Beds by Hospital Service Area, 2010......44 Table XX-A Selected Utilization Statistics for Mississippi Hospitalsin 2010 by Hospital Service Area and County........................................45 Table XX-B Psychiatric, Chemical Dependency and Rehabilitation Utilization Statistics for Mississippi Hospitals in 2010 by Hospital Service Area and County...........................48 Table XXI Selected Utilization Statistics for 2000, 2005 and 2010..........................................50
Table of Contents Continued Table XXII 2010 Newborn Statistics by Hospital Service Area and County........................................51 Table XXIII Newborn Statistics for 2000 2005 and 2010...........53 Table XXIV 2010 Selected Acute Hospital Utilization Data by Hospital Service Area.............................54 Table XXV Beds Set Up, Discharges, Discharge Days and Inpatient Days Reported in 2010...................56 Table XXVI Average Length of Stay, Average Daily Census and Occupancy Rates by Acute Care Category Excluding Long Term Care Acute Hospitals, Geriatric Psychiatric and DP/SNF Beds in 2010...............57 Table XXVII Acute Care Licensed Bed Capacity and Beds Set Up and Staffed Excluding Long Term Care Hospitals, Geriatric Psychiatric and DP/SNF Beds in 2010.....62 Appendix A 2010 Obstetrical Utilization........................67 Appendix B Licensed Hospital Beds for 1980, 1990, 2000 and 2010..........................................71 Appendix C Licensed Hospitals Beds.............................78 Appendix D Selected State Owned Hospital Data..................83 Appendix E Hospital Directory..................................87
-i-
Preface Overview This publication reflects data collected in the hospital licensure process. A historical accounting of the responsibility for this function began in 1946 when the Mississippi Commission on Hospital Care was legislatively authorized to license non-federal hospitals and prepare an annual report. In 1979 the legislature passed a bill to merge the responsibilities of the Commission on Hospital Care into the Mississippi Health Care Commission and in 1986 another bill was passed to merge the responsibilities into the Mississippi State Department of Health. In October 2010, the Bureau of Health Facilities Licensure and Certification mailed copies of it's combined "Annual Hospital Report and Application for Renewal of Hospital Licensure" and the American Hospital Association's "Annual Survey of Hospitals" to all non-federal hospitals in Mississippi. This survey is the source of statistics for this publication. A copy of the survey form is included in Appendix E. The hospital survey forms were reviewed and automated by the Division of Public Health Statistics. Questions regarding reported data were answered by hospital personnel through letters or telephone calls.
In 1984, for planning purposes, the Statewide Health Coordinating Council (SHCC) established seven hospital service areas based on where patients sought hospital care. For ease in using the data presented in this report some tables are presented by the planning service areas. Map II displays the hospital service Areas. This Annual Report is based on 109 hospitals; 94 acute care, 4 psychiatric, 1 rehabilitation, 1 OB/GYN, and 9 long-term acute care. The five federal hospitals in Mississippi have been excluded. Additionally, East Mississippi State Hospital, North Mississippi State Hospital, Oak Circle Center, South Mississippi State Hospital, and Whitfield Medical/Surgical Hospital have been excluded from all data except Table II and Table III. Map I shows location of hospitals by type of facility, Table II shows accreditations and Table III displays employees. Five crisis intervention hospitals closed during 2010; Mississippi State Hospital Crisis Intervention Center Brookhaven, Mississippi State Hospital Crisis Intervention Center Cleveland, North Mississippi State Hospital Batesville Crisis Intervention Center, North Mississippi State Hospital Corinth Crisis Intervention Center, and South Mississippi State Hospital Crisis Intervention Center Laurel.

-ii-
Hospital Ownership and Certification Ninety-four hospitals in Mississippi are classified as medical/surgical. These figures were based on the type of service that the hospitals provided to the majority of admissions. Data from the ten long-term care hospitals are included with the 94 acute care hospitals plus the one OB/Gyn facility. The other acute care facility, Whitfield Med/Surg is not included in the acute care statistics. The seven counties in Mississippi that do not have a hospital are Amite, Benton, Carroll, Issaquena, Itawamba, Kemper, and Tunica.
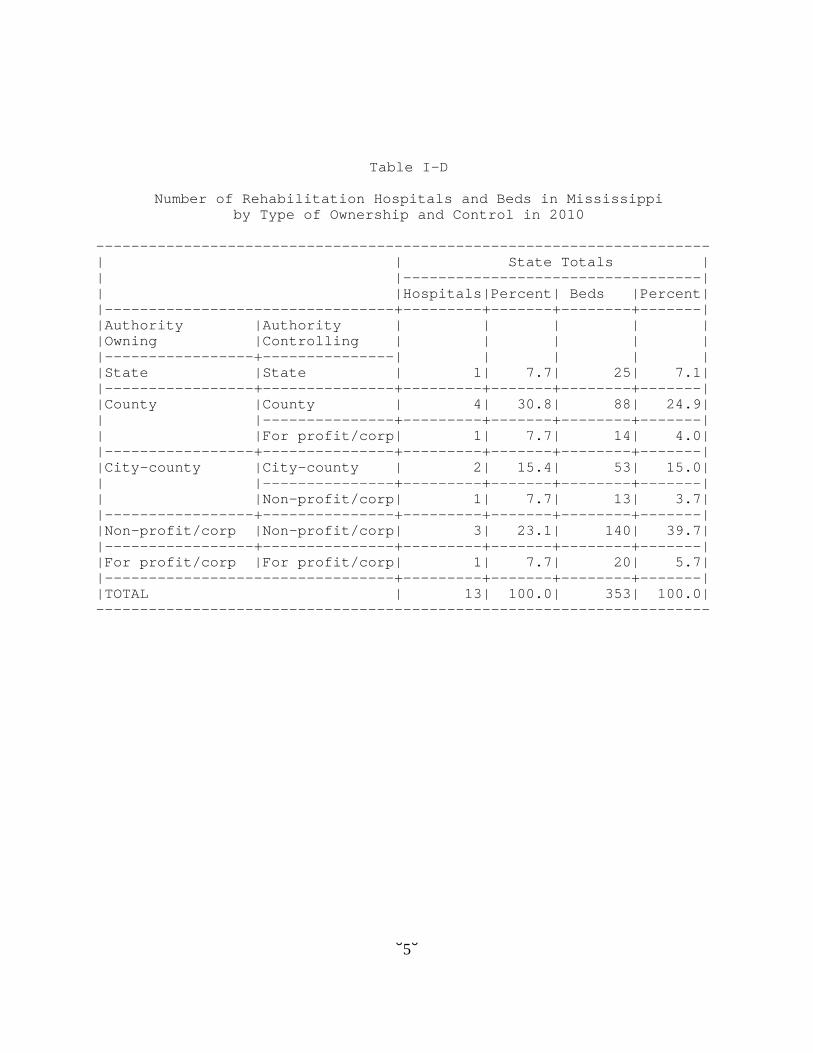
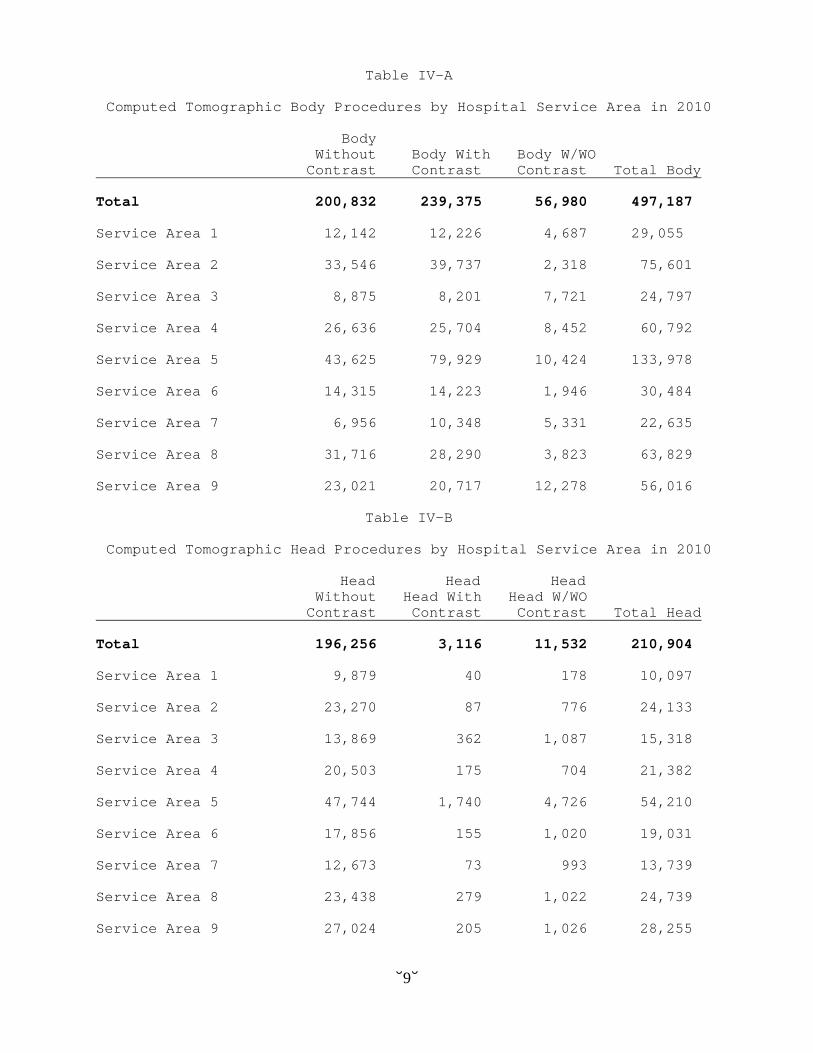
Ownership and control of hospitals and beds are shown in Tables I-A through I-D. In 2010 there were 11,484 licensed acute care beds. (This count excludes Whitfield Medical Surgical Hospital and includes Mississippi Hospital for Restorative Care, Promise Specialty Hospital of Vicksburg, Regency Hospital of Hattiesburg, Regency Hospital of Jackson, Regency Hospital of Meridian, Select Specialty Hospital of Gulfport, Select Specialty Hospital Jackson, Specialty Hospital of Meridian and Long Term Acute Hospital of Greenwood. Seventeen hospitals reported 777 licensed psychiatric beds. Seventy percent of the beds, 571, were located at acute care hospitals. Twelve hospitals reported 327 licensed chemical dependency beds. Thirteen hospitals reported 353 rehabilitation beds. Seventy-seven percent, 273, were located at 12 acute care facilities. Table II indicates that 58% of the hospitals are accredited by the Joint Commission on Accreditation of Healthcare Organization (JCAHO). Ninety-three percent of the hospitals participate in Blue Cross and 97.4% participate in Medicare, and 95.6% participate in Medicaid. This represents all 115 hospitals. Hospital Employees Table III displays hospital personnel. Mississippi's hospitals employed 61,632 people during 2010, of which 81.2% were full-time employees and 18.8% were part-time employees. Services Utilization Tables IV - XII show number of procedures by hospital service area for the following categories: Head and Body CT Scans Cardiac Catheterization Diagnostic Radioisotope Angioplasty X-Ray Cardiac Surgeries Magnetic Resonance Imaging Renal Extracorporeal Shock Ultrasound Wave Lithotripter Digital Subtraction Angiography Physical Therapy Single Photon Emission Occupational Therapy Computerized Tomography (SPECT) Geriatric Patients Served

-iii-
Linear Accelerator Respite Patients Served Radioactive Implants Inpatient and Outpatient Therapeutic Radioisotope Surgeries Cardiac Catheterization Outpatient Utilization Rural Health Clinics Sixty-four hospitals reported 107,512 inpatient surgeries and sixty-nine hospitals reported 175,121 outpatient surgeries. This count includes only surgeries performed at acute care hospitals. As Table X shows, the majority of surgeries were performed in Service Area 5.
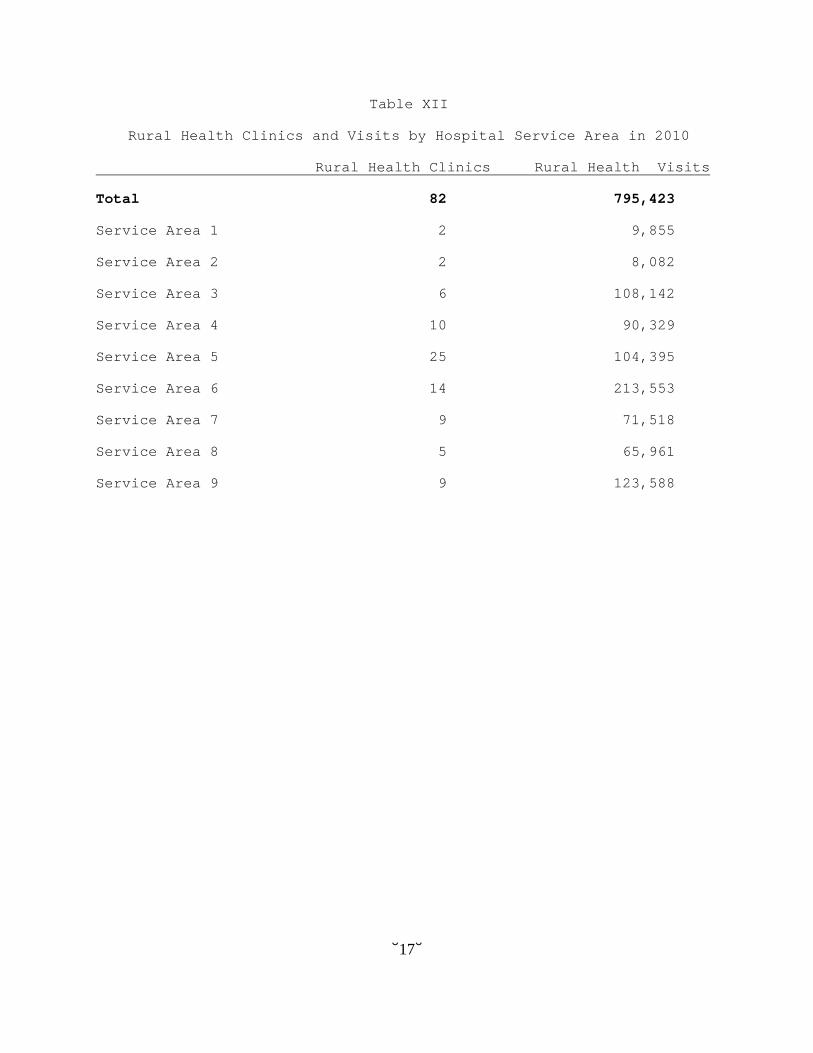
Table XI presents outpatient emergency visits and clinic/other visits by Hospital Service Area. Service Area 5 reported both the most outpatient emergency visits and clinic/other visits. Thirty-six hospitals reported 82 rural health clinics and 795,423 rural health clinic visits. Table XII shows rural health clinics and visits by hospital service area. One hospital was unable to provide rural health visits. Bed Changes Crossgates River Oaks Hospital increased their geriatric psychiatric beds from 15 to 20. And the following three hospitals changed their licensed bed capacity. Delta Regional Medical Center West Campus decreased licensed beds from 137 to 98. River Oaks Hospital increased their beds from 110 to 160, and Tri-Lakes Medical Center increased their psychiatric beds from 15 to 25 and decreased their chemical dependency beds from 20 to 10 Name Changes Greenwood Specialty Hospital is now LTAC Hospital of Greenwood, Newton Regional Hospital changed its name to Pioneer Community Hospital of Newton, and Oktibbeha County Hospital is now known as OCH Regional Medical Center. Hospital Closings Five crisis intervention centers closed during the reporting period, Alcorn, Bolivar, Jones, Lincoln, and Panola Counties. Licensed Beds, Average Length of Stay, Average Daily Census and Occupancy Rate Table XIII shows hospitals and beds by bed size groupings. Occupancy rates are also shown by bed size. Under acute care the greatest number of hospital beds was reported at hospitals with 25 - 49 beds, 50-99 beds, and 100-199 beds. Of the 17 hospitals reporting psychiatric beds, three were licensed as psychiatric hospitals. Three

-iv-
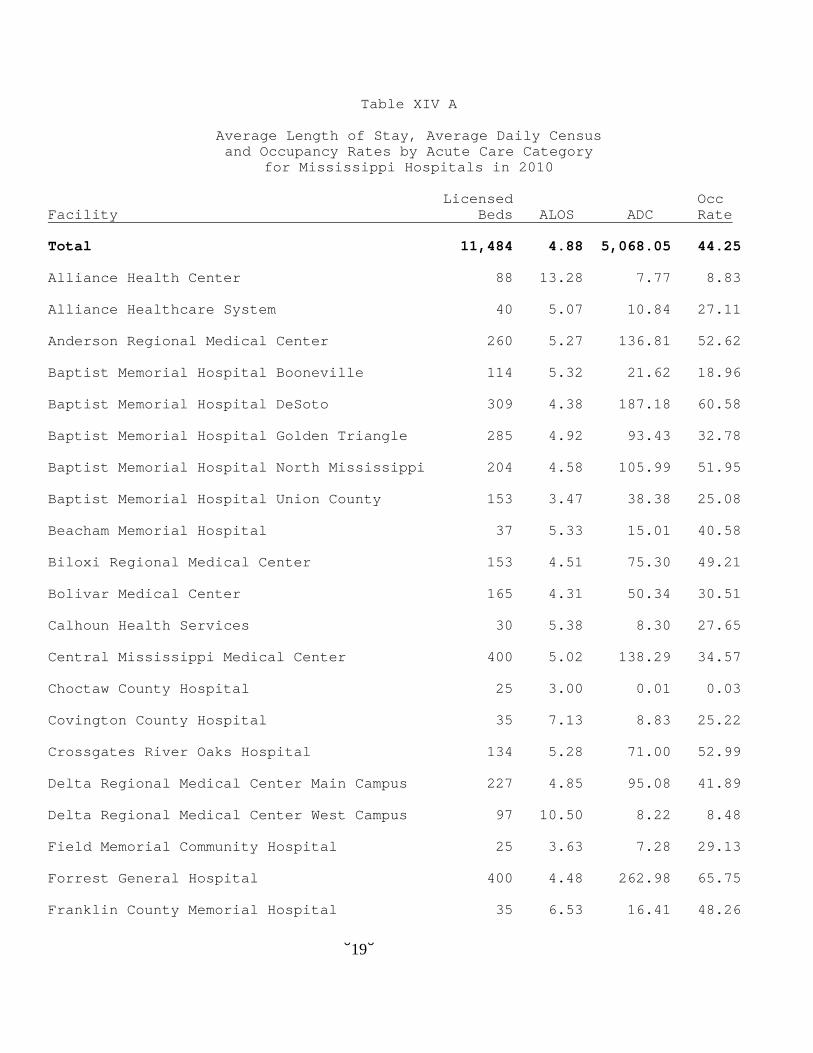
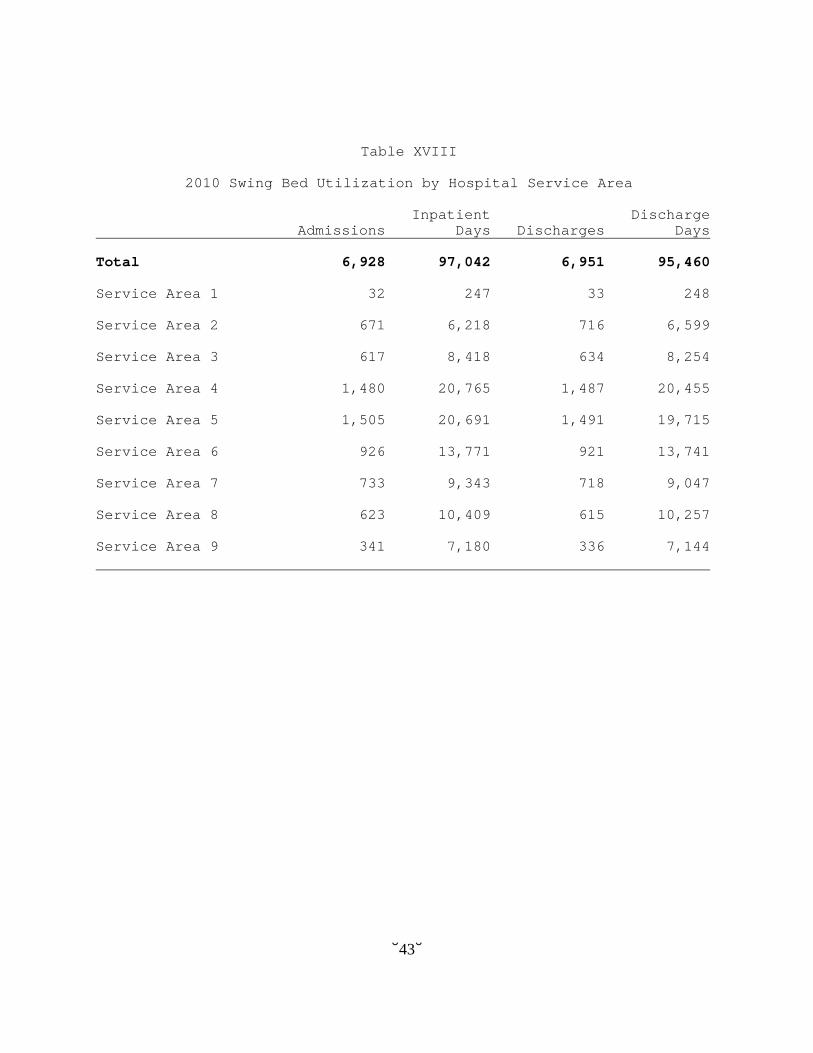
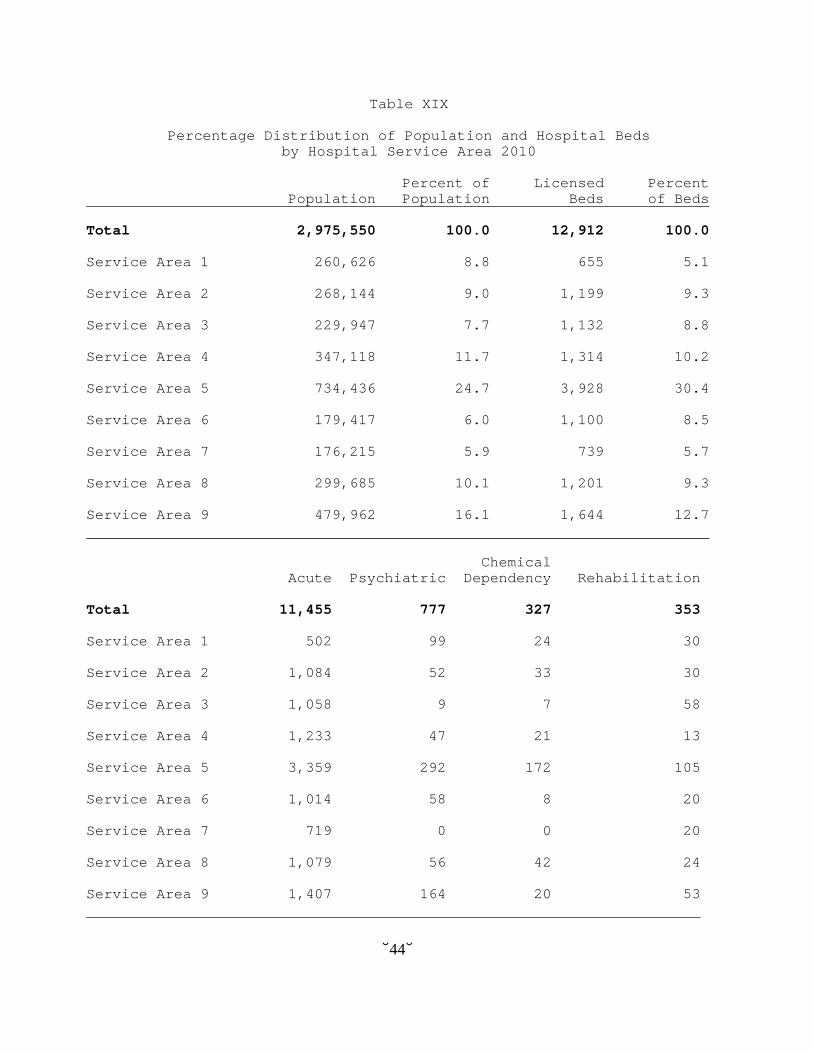
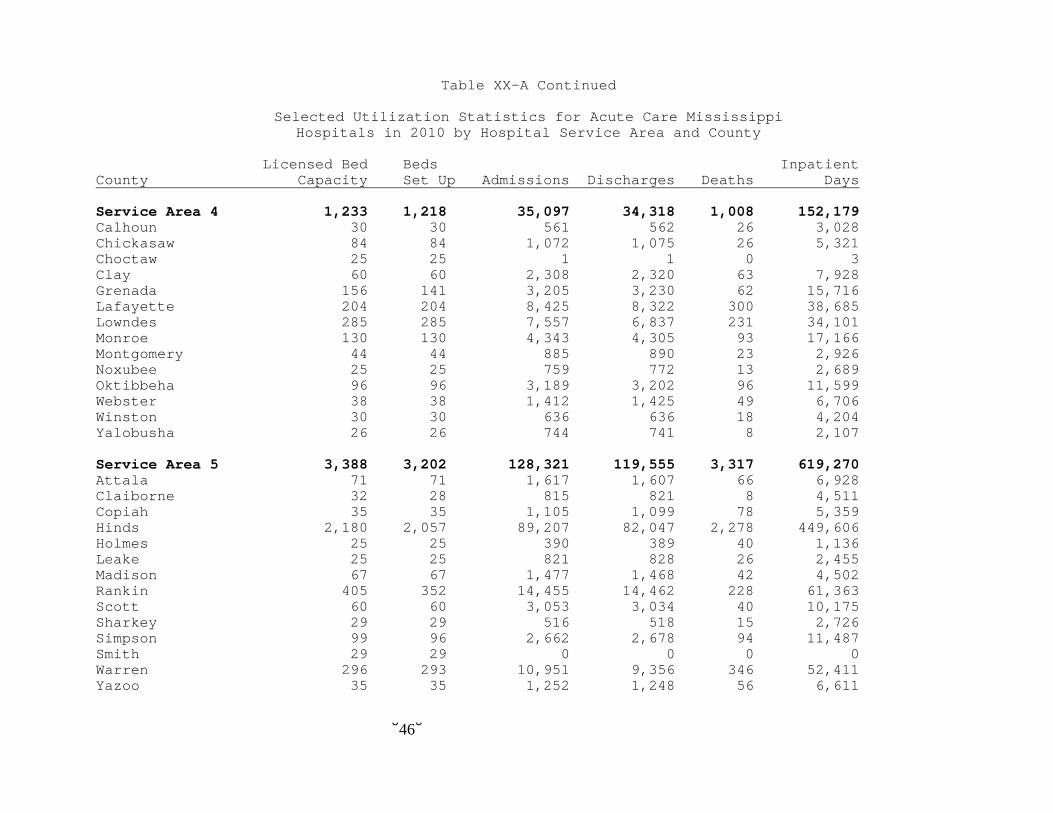
hundred twenty-seven chemical dependency beds were reported at 12 hospitals. Thirteen hospitals reported 353 rehabilitation beds. Table XIV-A gives average lengths of stay (ALOS), average daily census (ADC), percentages of occupancy for each hospital by licensed acute care bed capacity and state totals. Psychiatric data can be found in Table XIV-B, chemical dependency data in Table XIV-C, and rehabilitation data in Table XIV-D. A comparison of licensed beds and beds set up and staffed is shown in Tables XV-A -XV-D. Of the 11,484 licensed acute beds, 10,492 beds were set up and staffed. Seven hundred thirty-eight of the 777 licensed psychiatric beds were set up and staffed. Three hundred twenty-one of the 327 licensed chemical dependency beds were set up and staffed. Swing Beds Table XVI shows the number of swing beds, average length of stay and average daily census by facility. Table XVII shows the destination of discharged swing bed patients, number referred to home health, and number of acute care beds designated as swing beds by service area. Over two-thirds (69.3%) were discharged to their home, 11.8% were discharged to nursing homes, 1.3% were admitted to hospitals, 9.4% were admitted to personal care homes, and the remaining 8.2% were discharged to other destinations. Swing bed utilization in 2010 by hospital service area is shown in Table XVIII. Hospital Use Statistics Table XIX shows the population of each service area in comparison with its licensed bed capacity. Service areas are maintaining a relatively close correlation between the percentage of population and percentage of licensed hospital beds. Service Area 5, including the city of Jackson and Hinds County, has the largest population at 24.7% and the most beds at 30.4%. Licensed beds by type are also shown by hospital service area. Table XX-A provides information on acute hospital beds, admissions, discharges, deaths and inpatient days by service area and county. Psychiatric, chemical dependency and rehabilitation beds located in acute care facilities are included in Table XX-B along with those facilities that are licensed as psychiatric, or rehabilitation facilities. There are 11,484 licensed acute care hospital beds in Mississippi, 777 psychiatric beds, 327 chemical dependency beds, and 353 rehabilitation beds. A comparison of utilization statistics for 2000, 2005 and 2010 is shown in Table XXI. While there wasn't much change in acute care data
-v-
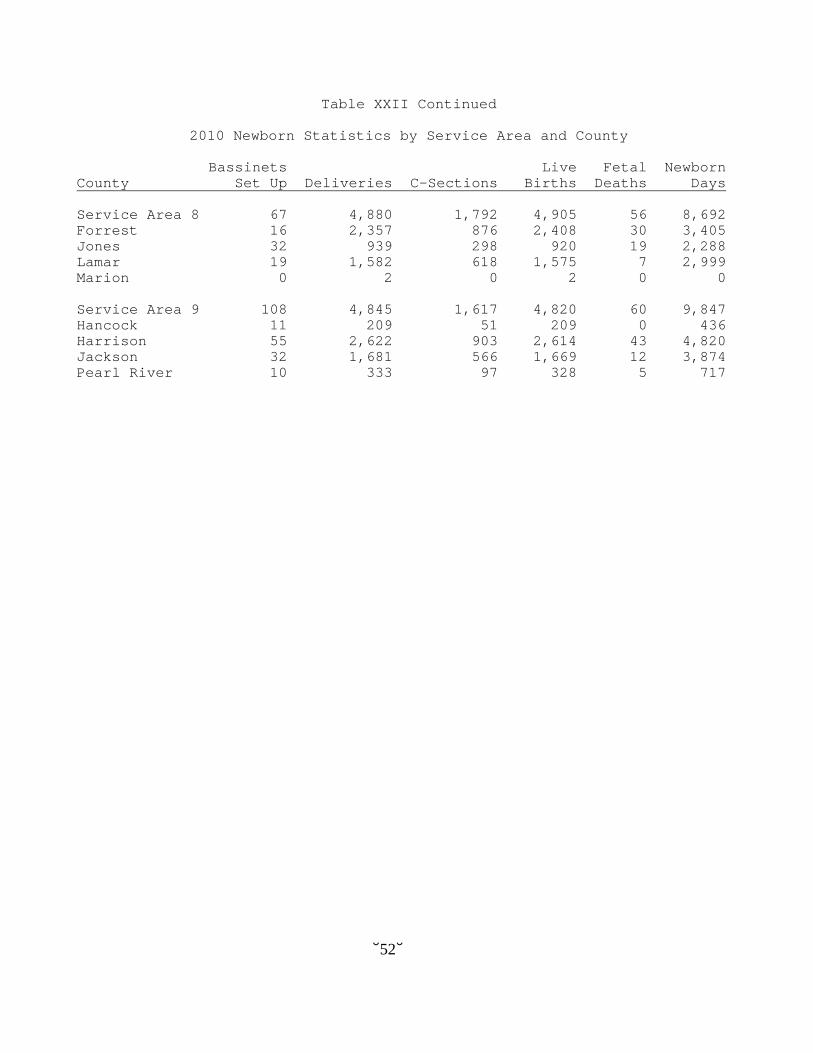
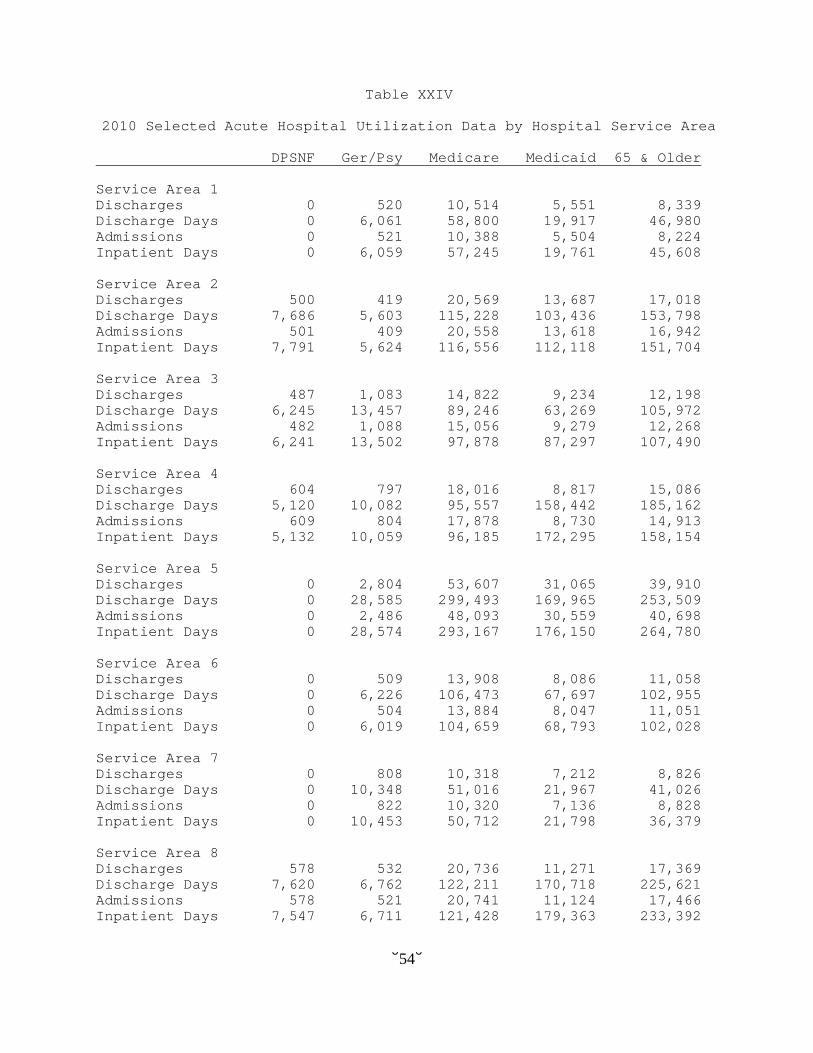
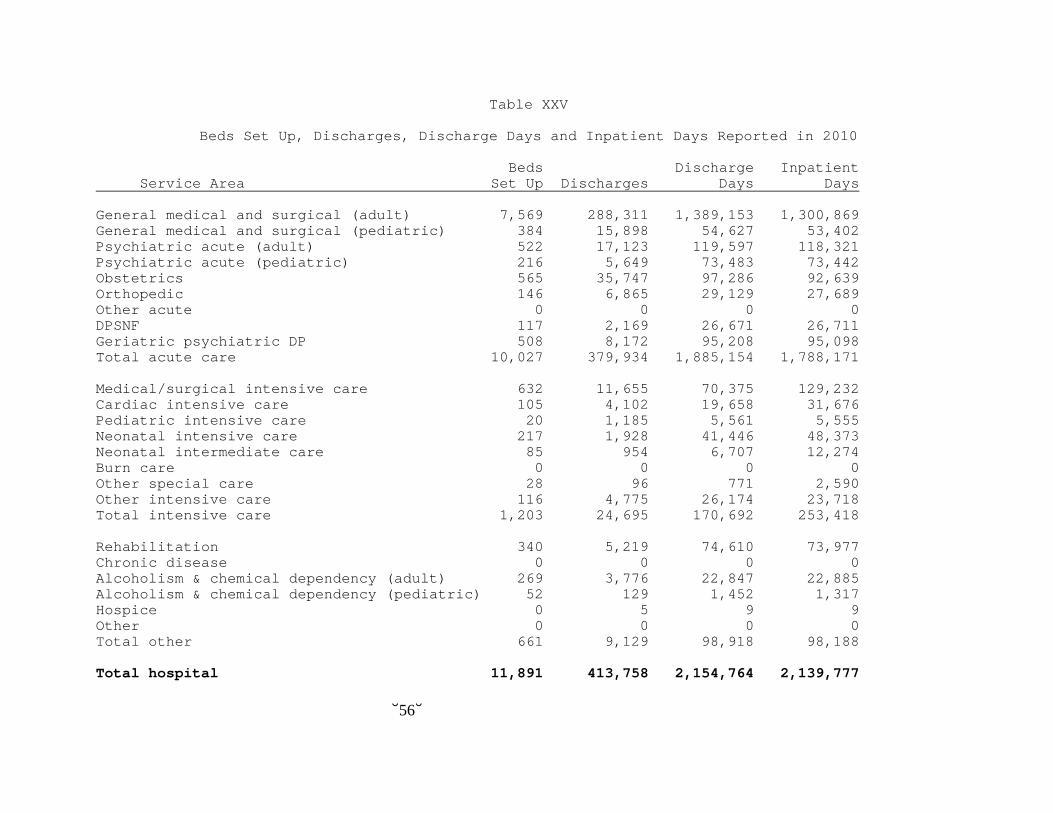
from 2000 to 2010, most psychiatric and rehabilitation data increased while chemical dependancy data decreased. Table XXII deals with newborn statistics. Once again, Service Area 5 leads in every category, as does Hinds County. Table XXIII compares with the newborn statistics of 2010 with those of 2005 and 2000. There was a -4.5% percent of change in bassinets and a -16.1 percent of change in obstetrical beds set up and staffed. Deliveries saw an -6.8 percent of change from 2000. The percent of change in fetal deaths was -12.2%. Table XXIV displays discharges, discharge days, admissions and inpatient days by service area for DP SNF, geriatric psychiatric, patients 65 and older, Medicare and Medicaid. Table XXV shows beds set up, discharges, discharge days and inpatient days for the state's hospitals. Data reported by specialty hospitals is also included. Data is broken down into acute care, intensive care, other care, and long-term care. No data was reported for psychiatric intensive care, hospice, psychiatric long term care or mental retardation. Obstetrical Utilization 2010 obstetrical utilization is shown in Appendix A. Hospital Listing Hospitals are listed alphabetically by county in Appendix C. The hospital directory is located in Appendix E. The licensed bed capacity is reported as of January 1, 2010 whereas the rest of the report is as of the end of the reporting period, usually September 30, 2010.
State Owned Facilities Data relating to state owned facilities may be found in Appendix D. These include East Mississippi State Hospital and Mississippi State Hospital.

Note: Type of facility indicated represents the one category selected by the facility as being the best description of the type of service provided to the majority of admissions.
Includes East Mississippi State Hospital, Mississippi State Hospital, Oak Circle Center and Whitfield Medical Surgical Hospital, North Mississippi State Hospital and South Mississippi State Hospital.
Map IDistribution of Mississippi Hospitals by Type of Facility and County
❑ Medical/Surgical . . . . . . . . 95❍ Psychiatric/Mental . . . . . . . 9◆ Alcoholism & Chem. Dep. . 0 Rehabilitation . . . . . . . . . . . 1★ Long Term Acute . . . . . . . . 9▲ OB/GYN . . . . . . . . . . . . . . . 1
DeSoto Marshall Benton Alcorn
Tippah
Tisho-mingo
Prentiss
UnionLee
ItawambaPontotoc
TunicaTate
Panola Lafayette
QuitmanCoahoma
Bolivar
Tallahatchie
Yalobusha CalhounChickasaw Monroe
ClayWebster
Grenada
Sunflower
WashingtonLeflore
Carroll Mont-gomery
Choctaw
Oktibbeha
Lowndes
KemperNeshoba
NoxubeeWinstonAttala
HolmesYazoo
Humphreys
Sharkey
Issa-quena
Warren
Leake
Scott Newton Lauderdale
ClarkeJasperSmith
SimpsonClaiborne Copiah
Jefferson
Adams
Wilkinson
Amite Pike
Walthall
FranklinLincoln Lawrence
JeffersonDavis
Covington Jones Wayne
GreenePerryForrest LamarMarion
Pearl RiverStone
George
Hancock
HarrisonJackson
Madison
Rankin
Hinds
★
▲

-2-
Table I-A
Number of Acute Care Hospitals and Beds in Mississippi by Type of Ownership and Control in 2010
---------------------------------------------------------------------- | | State Totals | | |----------------------------------| | |Hospitals|Percent| Beds |Percent| |---------------------------------+---------+-------+--------+-------| |Authority |Authority | | | | | |Owning |Controlling | | | | | |-----------------+---------------| | | | | |State |State | 2| 1.9| 689| 6.0| |-----------------+---------------+---------+-------+--------+-------| |County |County | 37| 34.9| 2,968| 25.8| | |---------------+---------+-------+--------+-------| | |Non-profit/corp| 6| 5.7| 400| 3.5| | |---------------+---------+-------+--------+-------| | |For profit/corp| 7| 6.6| 652| 5.7| |-----------------+---------------+---------+-------+--------+-------| |City |For profit/corp| 1| 1.0| 76| 0.7| |-----------------+---------------+---------+-------+--------+-------| |City-county |City-county | 4| 3.8| 666| 5.8| | |---------------+---------+-------+--------+-------| | |Non-profit/corp| 3| 2.8| 355| 3.1| | |---------------+---------+-------+--------+-------| | |For profit/ | | | | | | |partnership | 1| 1.0| 40| 0.3| | |---------------+---------+-------+--------+-------| | |For profit/corp| 1| 1.0| 35| 0.3| |-----------------+---------------+---------+-------+--------+-------| |Hospital dist |Hospital dist | 1| 1.0| 160| 1.4| |-----------------+---------------+---------+-------+--------+-------| |Non-profit/church|Non-profit/corp| 1| 0.9| 417| 3.6| |-----------------+---------------+---------+-------+--------+-------| |Non-profit/corp |Non-profit/corp| 18| 17.0| 2,637| 23.0| | |---------------+---------+-------+--------+-------| | |For profit/corp| 1| 0.9| 36| 0.3| |-----------------+---------------+---------+-------+--------+-------| |For profit/ |For profit/ | | | | | |partnership |partnership | 2| 1.9| 123| 1.1| | |---------------+---------+-------+--------+-------| | |For profit/corp| 2| 1.9| 301| 2.6| |-----------------+---------------+---------+-------+--------+-------| |For profit/corp |For profit/corp| 19| 17.9| 1,929| 16.8| |---------------------------------+---------+-------+--------+-------| |TOTAL | 106| 100.0| 11,484| 100.0| ----------------------------------------------------------------------

-3-
Table I-B
Number of Psychiatric Hospitals and Beds in Mississippi by Type of Ownership and Control in 2010
---------------------------------------------------------------------- | | State Totals | | |----------------------------------| | |Hospitals|Percent| Beds |Percent| |---------------------------------+---------+-------+--------+-------| |Authority |Authority | | | | | |Owning |Controlling | | | | | |-----------------+---------------| | | | | |State |State | 1| 5.9| 33| 4.2| |-----------------+---------------+---------+-------+--------+-------| |County |County | 3| 17.6| 95| 12.2| |-----------------+---------------+---------+-------+--------+-------| |City-county |City-county | 2| 11.8| 108| 13.9| |-----------------+---------------+---------+-------+--------+-------| |Non-profit/church|Non-profit/corp| 1| 5.9| 83| 10.9| |-----------------+---------------+---------+-------+--------+-------| |Non-profit/corp |Non-profit/corp| 2| 11.8| 55| 7.1| |-----------------+---------------+---------+-------+--------+-------| |For profit/ | | | | | | |partnership |For profit/corp| 1| 5.9| 40| 5.1| |-----------------+---------------+---------+-------+--------+-------| |For profit/corp |For profit/corp| 7| 41.2| 363| 46.7| |---------------------------------+---------+-------+--------+-------| |TOTAL | 17| 100.0| 777| 100.0| ----------------------------------------------------------------------

-4-
Table I-C
Number of Chemical Dependency Hospitals and Beds in Mississippi by Type of Ownership and Control in 2010
---------------------------------------------------------------------- | | State Totals | | |----------------------------------| | |Hospitals|Percent| Beds |Percent| |---------------------------------+---------+-------+--------+-------| |Authority |Authority | | | | | |Owning |Controlling | | | | | |-----------------+---------------| | | | | |County |County | 3| 25.0| 49| 15.0| |-----------------+---------------+---------+-------+--------+-------| |City-county |City-county | 1| 8.3| 20| 6.1| |-----------------+---------------+---------+-------+--------+-------| |Non-profit/church|Non-profit/corp| 1| 8.3| 35| 10.7| |-----------------+---------------+---------+-------+--------+-------| |Non-profit/corp |Non-profit/corp| 3| 25.0| 151| 46.2| |-----------------+---------------+---------+-------+--------+-------| |For profit/ | | | | | | |partnership |For profit/corp| 1| 8.3| 40| 12.2| |-----------------+---------------+---------+-------+--------+-------| |For profit/corp |For profit/corp| 3| 25.0| 32| 9.8| |---------------------------------+---------+-------+--------+-------| |TOTAL | 12| 100.0| 327| 100.0| ----------------------------------------------------------------------
-5-
Table I-D
Number of Rehabilitation Hospitals and Beds in Mississippi by Type of Ownership and Control in 2010
---------------------------------------------------------------------- | | State Totals | | |----------------------------------| | |Hospitals|Percent| Beds |Percent| |---------------------------------+---------+-------+--------+-------| |Authority |Authority | | | | | |Owning |Controlling | | | | | |-----------------+---------------| | | | | |State |State | 1| 7.7| 25| 7.1| |-----------------+---------------+---------+-------+--------+-------| |County |County | 4| 30.8| 88| 24.9| | |---------------+---------+-------+--------+-------| | |For profit/corp| 1| 7.7| 14| 4.0| |-----------------+---------------+---------+-------+--------+-------| |City-county |City-county | 2| 15.4| 53| 15.0| | |---------------+---------+-------+--------+-------| | |Non-profit/corp| 1| 7.7| 13| 3.7| |-----------------+---------------+---------+-------+--------+-------| |Non-profit/corp |Non-profit/corp| 3| 23.1| 140| 39.7| |-----------------+---------------+---------+-------+--------+-------| |For profit/corp |For profit/corp| 1| 7.7| 20| 5.7| |---------------------------------+---------+-------+--------+-------| |TOTAL | 13| 100.0| 353| 100.0| ----------------------------------------------------------------------

-6-
Table II
Accreditations and Certifications of All Mississippi Hospitals, 2000, 2005 and 2010
Number Percent 2000 JCHAQ 62 56.9 Blue Cross 104 95.4 Medicare 103 94.5 Medicaid 103 94.5 -------------------------------------------------------- 2005 JCHAQ 72 60.5 Blue Cross 111 93.3 Medicare 115 96.6 Medicaid 109 91.6 -------------------------------------------------------- 2010 JCHAQ 67 58.3 Blue Cross 108 93.9 Medicare 112 97.4 Medicaid 110 95.6

-7-
Table III
2010 Staffing of Mississippi Hospitals by Type Type of Personnel Total Full-time Part-time Total 61,632 50,028 11,604 Administrators and Administrative assistants 964 951 13 Physicians 1,107 928 179 Medical residents 530 530 0 Dentists 12 8 4 Dental residents 16 16 0 Registered nurses (RN) 16,641 12,947 3,694 Licensed practical nurses (LPN) 2,187 1,811 376 Ancillary personnel 6,237 4,998 1,239 Other nursing staff 2,616 2,185 431 Nurse practitioner 456 351 105 Anesthesiologists 63 54 9 CRNA 305 252 53 Medical records administrators 131 130 1 Medical records technicians 904 807 97 Pharmacists, licensed 629 497 132 Pharmacy technicians 620 485 135 Medical technologists 1,158 917 241 Other laboratory personnel 1,501 1,237 264 Pathologists 34 33 1 Dietitians 168 128 40 Dietetic technicians 705 560 145 Radiographers 1,293 978 315 Radiation therapy technicians 116 93 23 Nuclear medicine technologists 149 121 28 Radiologists 57 49 8 Other radiological personnel 939 772 167 Occupational therapists 263 172 91 OT aides and assistants 59 36 23 Physical therapists 441 308 133 PT aides and assistants 354 246 108 Recreational therapists 116 89 27 Speech pathologists 164 95 69 Audiologists 10 9 1 Respiratory therapists 1,249 886 363 Respiratory therapy technicians 252 180 72 Medical social worker 276 229 47 Psychiatric social worker 270 182 88 Licensed clinical psychologists 55 48 7 All other health professional & techologist personnel 3,174 2,639 535 All other personnel 15,411 13,071 2,340

-9-
Table IV-A
Computed Tomographic Body Procedures by Hospital Service Area in 2010 Body Without Body With Body W/WO Contrast Contrast Contrast Total Body Total 200,832 239,375 56,980 497,187 Service Area 1 12,142 12,226 4,687 29,055 Service Area 2 33,546 39,737 2,318 75,601 Service Area 3 8,875 8,201 7,721 24,797 Service Area 4 26,636 25,704 8,452 60,792 Service Area 5 43,625 79,929 10,424 133,978 Service Area 6 14,315 14,223 1,946 30,484 Service Area 7 6,956 10,348 5,331 22,635 Service Area 8 31,716 28,290 3,823 63,829 Service Area 9 23,021 20,717 12,278 56,016
Table IV-B
Computed Tomographic Head Procedures by Hospital Service Area in 2010
Head Head Head Without Head With Head W/WO Contrast Contrast Contrast Total Head Total 196,256 3,116 11,532 210,904 Service Area 1 9,879 40 178 10,097 Service Area 2 23,270 87 776 24,133 Service Area 3 13,869 362 1,087 15,318 Service Area 4 20,503 175 704 21,382 Service Area 5 47,744 1,740 4,726 54,210 Service Area 6 17,856 155 1,020 19,031 Service Area 7 12,673 73 993 13,739 Service Area 8 23,438 279 1,022 24,739 Service Area 9 27,024 205 1,026 28,255

-10-
Table IV-C
Diagnostic Radioisotope and X-Ray Procedures by Hospital Service Area in 2010
Inpatient Outpatient Inpatient Outpatient Diag Radio Diag Radio Diag Xray Diag Xray Total 46,582 88,259 572,045 1,418,508 Service Area 1 3,599 5,878 26,861 45,927 Service Area 2 3,165 15,688 62,873 123,164 Service Area 3 1,806 1,733 37,798 98,917 Service Area 4 1,462 4,526 48,745 136,679 Service Area 5 8,071 17,166 159,701 395,009 Service Area 6 18,092 17,381 55,614 153,217 Service Area 7 1,313 4,951 31,554 116,537 Service Area 8 4,614 7,683 82,499 116,172 Service Area 9 4,460 13,253 66,400 232,886
Table IV-D
DSA and Magnetic Resonance Imaging by Hospital Service Area in 2010 Digital Subtraction Inpatient Outpatient Units Angiography MRI MRI Fixed Mobile Total 37,900 37,335 122,243 58 32 Service Area 1 1,592 2,712 5,686 3 1 Service Area 2 8,542 3,879 19,857 8 1 Service Area 3 2,515 1,878 8,706 2 4 Service Area 4 756 2,316 12,458 6 7 Service Area 5 18,538 14,537 37,190 17 7 Service Area 6 2,916 2,668 4,103 5 5 Service Area 7 0 790 6,845 4 3 Service Area 8 1,954 3,753 7,588 4 2 Service Area 9 1,087 4,802 19,810 9 2
-11-
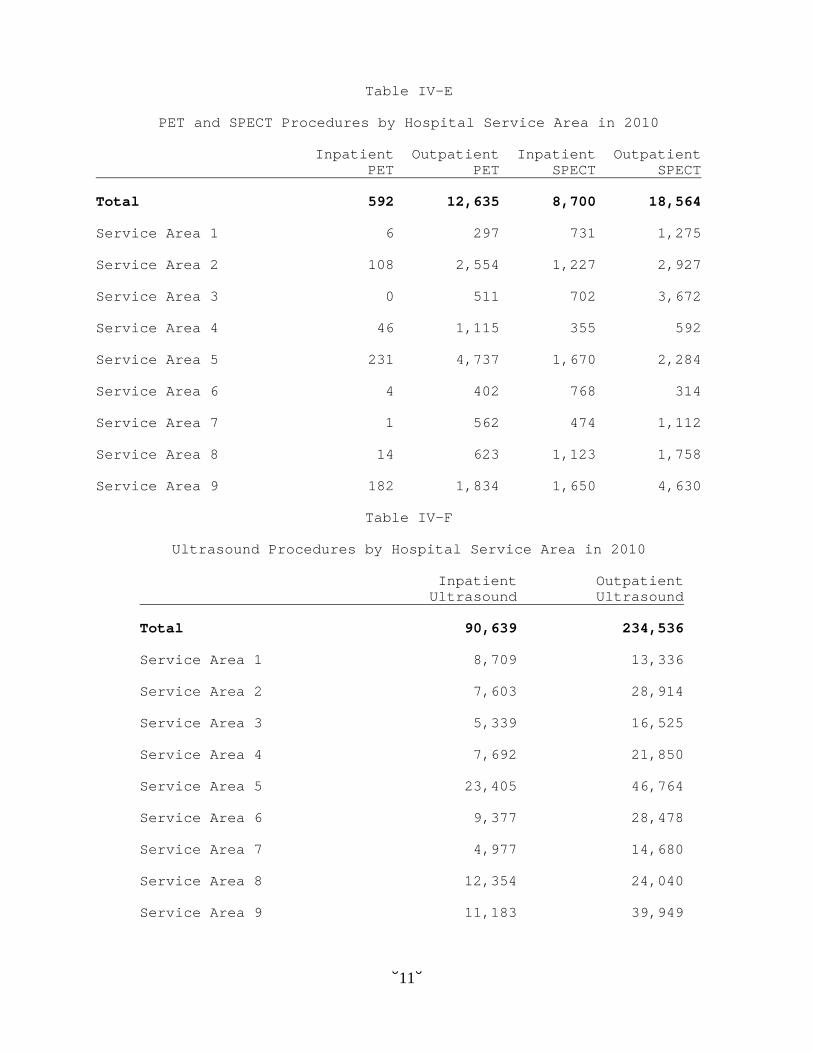
Table IV-E
PET and SPECT Procedures by Hospital Service Area in 2010
Inpatient Outpatient Inpatient Outpatient PET PET SPECT SPECT Total 592 12,635 8,700 18,564 Service Area 1 6 297 731 1,275 Service Area 2 108 2,554 1,227 2,927 Service Area 3 0 511 702 3,672 Service Area 4 46 1,115 355 592 Service Area 5 231 4,737 1,670 2,284 Service Area 6 4 402 768 314 Service Area 7 1 562 474 1,112 Service Area 8 14 623 1,123 1,758 Service Area 9 182 1,834 1,650 4,630
Table IV-F
Ultrasound Procedures by Hospital Service Area in 2010 Inpatient Outpatient Ultrasound Ultrasound Total 90,639 234,536 Service Area 1 8,709 13,336 Service Area 2 7,603 28,914 Service Area 3 5,339 16,525 Service Area 4 7,692 21,850 Service Area 5 23,405 46,764 Service Area 6 9,377 28,478 Service Area 7 4,977 14,680 Service Area 8 12,354 24,040 Service Area 9 11,183 39,949

-12-
Table V-A
Linear Accelerator Procedures by Hospital Service Area in 2010 Inpatient Outpatient Linear Accel Linear Accel Units Total 5,202 137,212 24 Service Area 1 308 6,844 1 Service Area 2 539 14,772 3 Service Area 3 0 0 1 Service Area 4 751 27,988 2 Service Area 5 1,995 45,044 8 Service Area 6 347 10,409 2 Service Area 7 59 5,365 1 Service Area 8 543 15,077 2 Service Area 9 660 11,713 4
Table V-B
Radioactive Implants by Hospital Service Area in 2010 Inpatient Outpatient Radio Implants Radio Implants Total 117 1,315 Service Area 1 0 0 Service Area 2 0 240 Service Area 3 0 33 Service Area 4 6 166 Service Area 5 75 172 Service Area 6 0 14 Service Area 7 0 31 Service Area 8 28 515 Service Area 9 8 144

-13-
Table V-C
Therapeutic Radioisotope Procedures by Hospital Service Area in 2010
Inpatient Therapeutic Outpatient Therapeutic Radioactive Procedures Radioactive Procedures Total 21 793 Service Area 1 0 0 Service Area 2 0 1 Service Area 3 0 23 Service Area 4 0 184 Service Area 5 4 468 Service Area 6 0 17 Service Area 7 0 3 Service Area 8 4 18 Service Area 9 13 79
Table VI-A
Cardiac Catheterizations and Angioplasty (PCTA) Procedures by Hospital Service in 2010
Adult Pediatric Total Total Cath Icc Icc Lycis PTCA Lab Total 47,698 1,053 428 9,851 64 Service Area 1 2,702 0 0 940 3 Service Area 2 9,158 17 0 773 6 Service Area 3 1,189 0 0 143 4 Service Area 4 4,278 0 0 678 4 Service area 5 15,918 1,036 0 2,575 21 Service Area 6 2,375 0 417 875 5 Service Area 7 1,190 0 0 279 5 Service Area 8 4,504 0 11 1,433 7 Service Area 9 6,384 0 0 2,155 9

-14-
Table VI-B
Cardiac Surgeries by Hospital Service Area in 2010 Adult Pediatric Other Open Heart Open Heart Pediatric Total 3,304 46 14 Service Area 1 238 0 0 Service Area 2 770 0 0 Service Area 3 60 0 0 Service Area 4 140 0 0 Service Area 5 831 46 14 Service Area 6 202 0 0 Service Area 7 85 0 0 Service Area 8 656 0 0 Service Area 9 322 0 0
Table VII
Renal Extracorporeal Shock Wave Lithotripter Procedures by Hospital Service Area in 2010
Number of Units ESWL Procedures Fixed Mobile Total 3,933 4 28 Service Area 1 0 1 0 Service Area 2 744 1 3 Service Area 3 106 0 3 Service Area 4 527 0 3 Service Area 5 1,167 0 6 Service Area 6 206 0 3 Service Area 7 524 1 2 Service Area 8 282 1 2 Service Area 9 377 0 6
-15-
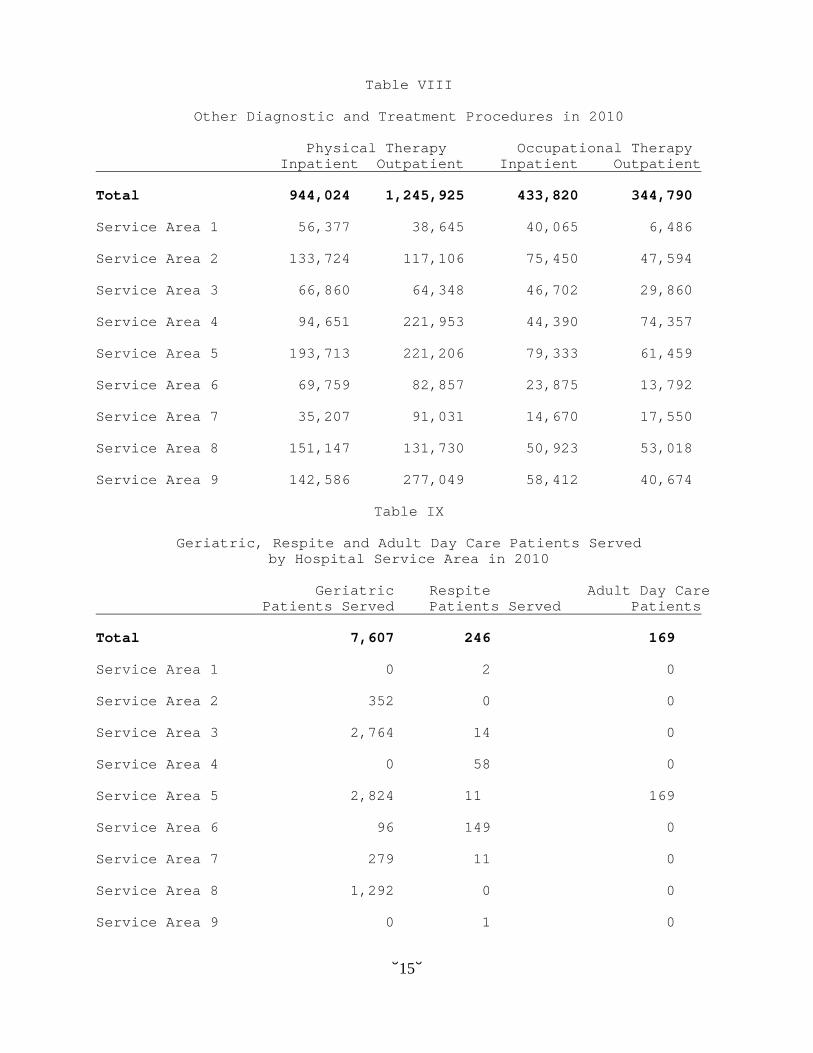
Table VIII
Other Diagnostic and Treatment Procedures in 2010 Physical Therapy Occupational Therapy Inpatient Outpatient Inpatient Outpatient Total 944,024 1,245,925 433,820 344,790 Service Area 1 56,377 38,645 40,065 6,486 Service Area 2 133,724 117,106 75,450 47,594 Service Area 3 66,860 64,348 46,702 29,860 Service Area 4 94,651 221,953 44,390 74,357 Service Area 5 193,713 221,206 79,333 61,459 Service Area 6 69,759 82,857 23,875 13,792 Service Area 7 35,207 91,031 14,670 17,550 Service Area 8 151,147 131,730 50,923 53,018 Service Area 9 142,586 277,049 58,412 40,674
Table IX
Geriatric, Respite and Adult Day Care Patients Served by Hospital Service Area in 2010
Geriatric Respite Adult Day Care Patients Served Patients Served Patients Total 7,607 246 169 Service Area 1 0 2 0 Service Area 2 352 0 0 Service Area 3 2,764 14 0 Service Area 4 0 58 0 Service Area 5 2,824 11 169 Service Area 6 96 149 0 Service Area 7 279 11 0 Service Area 8 1,292 0 0 Service Area 9 0 1 0

-16-
Table X
Surgical Operations and Rooms by Hospital Service Area in 2010 Inpatient Outpatient Total Operating Procedure Surgeries Surgeries Surgeries Rooms Rooms Total 107,512 175,121 282,633 441 166 Service Area 1 3,206 4,293 7,499 17 16 Service Area 2 11,791 20,106 31,897 44 15 Service Area 3 5,669 15,131 20,800 32 21 Service Area 4 7,985 18,674 26,659 40 18 Service Area 5 37,837 47,758 85,595 139 27 Service Area 6 6,793 17,309 24,102 42 14 Service Area 7 5,145 18,083 23,228 34 11 Service Area 8 11,349 12,827 24,176 39 14 Service Area 9 17,737 20,940 38,677 54 30
Table XI
Emergency, Clinic/Other Visits by Hospital Service Area in 2010 Clinic Emergency Other Total Visits Visits Visits Total 1,715,620 2,854,453 4,570,073 Service Area 1 86,837 55,303 142,140 Service Area 2 160,676 282,841 443,517 Service Area 3 147,179 241,655 388,834 Service Area 4 203,742 377,213 580,955 Service Area 5 403,772 616,472 1,020,244 Service Area 6 114,842 220,406 335,248 Service Area 7 119,115 132,047 251,162 Service Area 8 181,574 165,493 347,067 Service Area 9 295,487 762,574 1,058,061
-17-
Table XII
Rural Health Clinics and Visits by Hospital Service Area in 2010 Rural Health Clinics Rural Health Visits Total 82 795,423 Service Area 1 2 9,855 Service Area 2 2 8,082 Service Area 3 6 108,142 Service Area 4 10 90,329 Service Area 5 25 104,395 Service Area 6 14 213,553 Service Area 7 9 71,518 Service Area 8 5 65,961 Service Area 9 9 123,588

-18-
Table XIII
Selected Statistics for 2010 Licensed Hospital Beds* _____________________________________________________________________ Bed Number of Percent of Number Percent Occupancy Capacity Hospitals Hospitals of Beds of Beds Rate Acute Care 106 100.0 11,484 100.0 44.2 003-024 Beds 6 5.7 93 0.8 10.6 025-049 Beds 48 45.3 1,602 13.9 37.2 050-099 Beds 13 12.3 984 8.6 31.8 100-199 Beds 21 19.8 2,706 23.6 33.2 200-299 Beds 7 6.6 1,580 13.8 47.9 300-399 Beds 3 2.8 855 7.4 46.2 400-499 Beds 3 2.8 1,088 9.5 39.8 500+ Beds 5 4.7 2,556 22.4 62.9 Psychiatric 17 100.0 777 100.0 67.6 005-024 Beds 0 0.0 0 0.0 0.0 025-049 Beds 1 5.9 25 3.2 84.3 050-099 Beds 1 5.9 74 9.5 73.3 100-199 Beds 6 35.3 263 33.8 76.5 200-299 Beds 0 0.0 0 0.0 0.0 300-399 Beds 2 11.8 62 8.8 46.4 400-499 Beds 3 17.6 148 19.0 55.2 500+ Beds 4 23.5 205 26.4 67.9 Chemical Dependency 12 100.0 327 100.0 20.3 005-024 Beds 0 0.0 0 0.0 0.0 025-049 Beds 0 0.0 0 0.0 0.0 050-099 Beds 1 8.3 14 4.3 39.8 100-199 Beds 3 25.0 25 7.6 59.3 200-299 Beds 1 8.3 10 3.1 52.3 300-399 Beds 2 16.7 61 18.7 32.3 400-499 Beds 1 8.3 20 6.1 18.0 500+ Beds 4 33.3 197 60.2 9.7 Rehabilitation 13 100.0 353 100.0 57.4 005-024 Beds 0 0.0 0 0.0 0.0 025-049 Beds 0 0.0 0 0.0 0.0 050-099 Beds 0 0.0 0 0.0 0.0 100-199 Beds 5 38.5 158 44.8 41.8 200-299 Beds 2 15.4 33 9.3 48.7 300-399 Beds 1 7.7 30 8.5 51.7 400-499 Beds 2 15.4 53 15.0 71.6 500+ Beds 3 23.1 79 22.4 73.3
-19-
Table XIV A
Average Length of Stay, Average Daily Census and Occupancy Rates by Acute Care Category
for Mississippi Hospitals in 2010 Licensed Occ Facility Beds ALOS ADC Rate Total 11,484 4.88 5,068.05 44.25 Alliance Health Center 88 13.28 7.77 8.83 Alliance Healthcare System 40 5.07 10.84 27.11 Anderson Regional Medical Center 260 5.27 136.81 52.62 Baptist Memorial Hospital Booneville 114 5.32 21.62 18.96 Baptist Memorial Hospital DeSoto 309 4.38 187.18 60.58 Baptist Memorial Hospital Golden Triangle 285 4.92 93.43 32.78 Baptist Memorial Hospital North Mississippi 204 4.58 105.99 51.95 Baptist Memorial Hospital Union County 153 3.47 38.38 25.08 Beacham Memorial Hospital 37 5.33 15.01 40.58 Biloxi Regional Medical Center 153 4.51 75.30 49.21 Bolivar Medical Center 165 4.31 50.34 30.51 Calhoun Health Services 30 5.38 8.30 27.65 Central Mississippi Medical Center 400 5.02 138.29 34.57 Choctaw County Hospital 25 3.00 0.01 0.03 Covington County Hospital 35 7.13 8.83 25.22 Crossgates River Oaks Hospital 134 5.28 71.00 52.99 Delta Regional Medical Center Main Campus 227 4.85 95.08 41.89 Delta Regional Medical Center West Campus 97 10.50 8.22 8.48 Field Memorial Community Hospital 25 3.63 7.28 29.13 Forrest General Hospital 400 4.48 262.98 65.75 Franklin County Memorial Hospital 35 6.53 16.41 48.26

-20-
Table XIV A Continued
Average Length of Stay, Average Daily Census and Occupancy Rates by Acute Care Category
for Mississippi Hospitals in 2010 Licensed Occ Facility Beds ALOS ADC Rate Garden Park Medical Center 130 4.39 47.87 36.83 George County Hospital 48 4.63 21.10 43.97 Gilmore Memorial Regional Medical Center 95 3.71 38.75 40.79 Greene County Hospital 3 2.87 0.24 8.13 Greenwood Leflore Hospital 188 4.68 96.27 51.21 Grenada Lake Medical Center 156 4.90 43.06 27.60 H.C. Watkins Memorial Hospital 25 4.11 5.90 23.61 Hancock Medical Center 47 3.23 21.85 46.48 Hardy Wilson Memorial Hospital 35 4.89 14.68 41.95 Highland Community Hospital 95 2.80 19.33 20.35 Holmes County Hospital & Clinics 25 2.93 3.11 12.45 Iuka Hospital 48 3.71 8.87 18.48 Jasper General Hospital 16 4.42 0.32 2.00 Jefferson County Hospital 30 8.86 21.93 73.10 Jeff Davis Community Hospital 35 6.68 9.62 27.49 Kilmichael Hospital 19 3.28 3.07 16.15 King's Daughters Hospital Yazoo County 35 5.28 18.11 51.75 King's Daughters Medical Center 122 3.41 34.09 27.94 Laird Hospital 25 3.00 7.41 29.65 Lawrence County Hospital 25 3.30 3.70 14.78 Leake Memorial Hospital 25 3.03 6.73 26.90 Long Term Actue Hospital of Greenwood 40 26.51 22.53 56.34
-21-
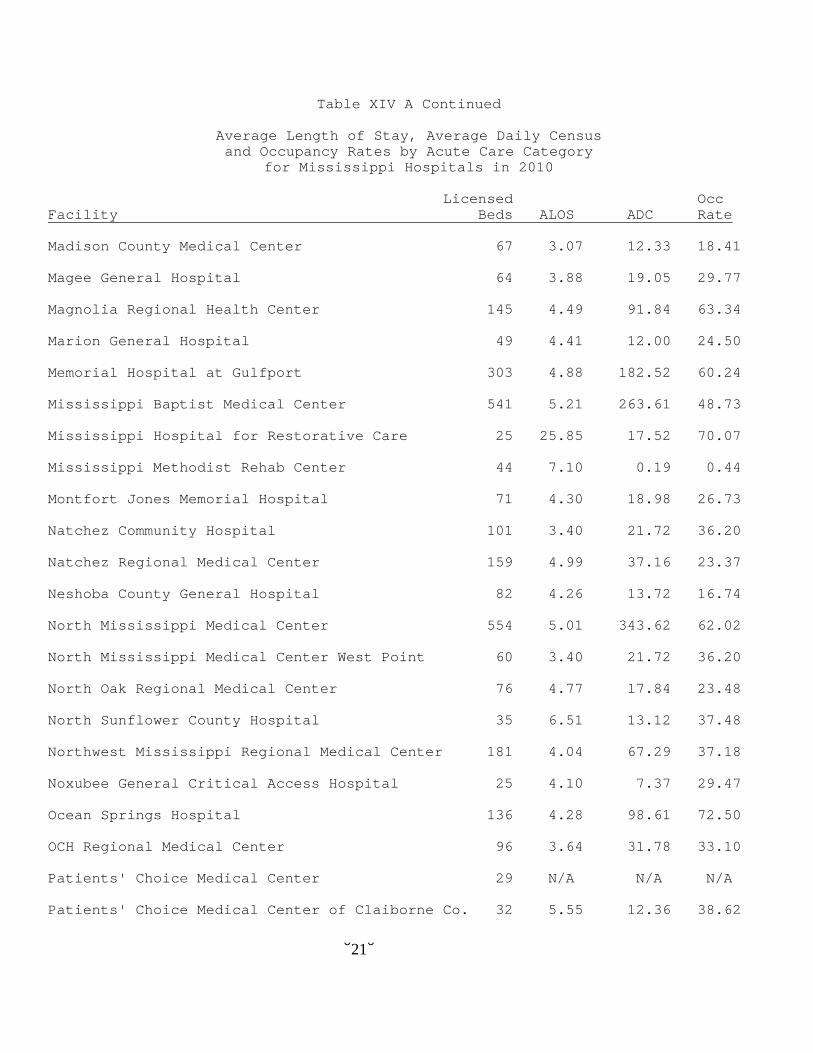
Table XIV A Continued
Average Length of Stay, Average Daily Census and Occupancy Rates by Acute Care Category
for Mississippi Hospitals in 2010 Licensed Occ Facility Beds ALOS ADC Rate Madison County Medical Center 67 3.07 12.33 18.41 Magee General Hospital 64 3.88 19.05 29.77 Magnolia Regional Health Center 145 4.49 91.84 63.34 Marion General Hospital 49 4.41 12.00 24.50 Memorial Hospital at Gulfport 303 4.88 182.52 60.24 Mississippi Baptist Medical Center 541 5.21 263.61 48.73 Mississippi Hospital for Restorative Care 25 25.85 17.52 70.07 Mississippi Methodist Rehab Center 44 7.10 0.19 0.44 Montfort Jones Memorial Hospital 71 4.30 18.98 26.73 Natchez Community Hospital 101 3.40 21.72 36.20 Natchez Regional Medical Center 159 4.99 37.16 23.37 Neshoba County General Hospital 82 4.26 13.72 16.74 North Mississippi Medical Center 554 5.01 343.62 62.02 North Mississippi Medical Center West Point 60 3.40 21.72 36.20 North Oak Regional Medical Center 76 4.77 17.84 23.48 North Sunflower County Hospital 35 6.51 13.12 37.48 Northwest Mississippi Regional Medical Center 181 4.04 67.29 37.18 Noxubee General Critical Access Hospital 25 4.10 7.37 29.47 Ocean Springs Hospital 136 4.28 98.61 72.50 OCH Regional Medical Center 96 3.64 31.78 33.10 Patients' Choice Medical Center 29 N/A N/A N/A Patients' Choice Medical Center of Claiborne Co. 32 5.55 12.36 38.62

-22-
Table XIV A Continued
Average Length of Stay, Average Daily Census and Occupancy Rates by Acute Care Category
for Mississippi Hospitals in 2010 Licensed Occ Facility Beds ALOS ADC Rate Patients' Choice Medical Center of Humphreys Co. 34 5.71 10.76 31.64 Pearl River County Hospital 24 6.17 1.21 5.05 Perry County General Hospital 22 3.32 1.85 8.39 Pioneer Community Hospital of Aberdeen 35 6.18 8.28 23.65 Pioneer Community Hospital of Newton 30 4.54 11.60 38.66 Pontotoc Health Services 25 3.64 4.34 17.36 Promise Hospital of Vicksburg 35 25.39 25.46 72.74 Quitman County Hospital 33 5.07 11.54 34.98 Regency Hospital of Jackson 36 23.80 27.07 75.18 Regency Hospital of Meridian 40 26.39 29.61 74.03 Regency Hospital of Southern Mississippi 33 27.98 26.65 80.76 Riley Hospital 120 4.56 33.35 27.79 River Oaks Hospital 160 3.76 73.25 45.78 River Region Health System 261 4.76 118.13 45.26 Rush Foundation Hospital 215 4.47 81.18 37.76 S.E. Lackey CAHospital 35 3.49 15.19 43.41 Scott Regional Hospital 25 3.22 12.68 50.74 Select Specialty Hospital Gulf Coast 61 24.72 18.44 30.22 Select Specialty Hospital Jackson 53 47.28 45.21 85.30 Sharkey-Issaquena Community Hospital 29 5.37 7.47 25.75 Simpson General Hospital 35 5.23 12.42 35.48 Singing River Hospital 385 3.82 94.83 24.63

-23-
Table XIV A Continued
Average Length of Stay, Average Daily Census and Occupancy Rates by Acute Care Category
for Mississippi Hospitals in 2010 Licensed Occ Facility Beds ALOS ADC Rate South Central Regional Medical Center 275 4.74 99.25 36.09 South Sunflower County Hospital 49 2.92 13.95 28.47 Southwest Mississippi Regional Medical Center 160 4.00 74.32 46.45 Specialty Hospital of Meridian 49 35.07 48.18 98.32 St. Dominic Jackson Memorial Hospital 417 4.50 297.88 71.43 Stone County Hospital 25 2.80 2.46 9.84 Tallahatchie General Hospital 9 3.98 2.13 23.62 Tippah County Hospital 45 5.47 13.10 29.10 Trace Regional Hospital 84 4.92 14.58 17.35 Tri Lakes Medical Center 77 4.14 21.68 28.16 Tyler Holmes Memorial Hospital 25 3.39 4.95 19.79 University Hospital & Health System 664 5.62 442.02 68.64 Walthall General Hospital 25 3.84 6.30 25.18 Wayne General Hospital 80 4.26 27.50 34.38 Webster Health Services 38 4.84 18.37 48.35 Wesley Medical Center 211 4.78 134.11 63.56 Winston Medical Center 30 6.66 11.52 38.39 Woman's Hospital at River Oaks 111 3.61 23.87 21.51 Yalobusha General Hospital 26 2.84 5.77 22.20

-24-
Table XIV B 1
Average Length of Stay, Average Daily Census and Occupancy Rates by Psychiatric Care Category
for Mississippi Hospitals in 2010 Licensed Occ Facility Beds ALOS ADC Rate Total 777 8.48 525.39 67.62 Alliance Health Center 58 15.06 58.00 100.00 Baptist Memorial Hospital Golden Triangle 22 7.16 9.87 44.87 Biloxi Regional Medical Center 45 7.83 23.25 51.67 Brentwood Behavioral Healthcare of Mississippi 107 11.72 82.63 77.22 Central Mississippi Medical Center 29 5.02 23.13 79.77 Delta Regional Medical Center West Campus 9 5.18 5.39 59.94 Diamond Grove Center 25 20.26 21.07 84.27 Forrest General Hospital 56 6.38 52.32 93.42 Magnolia Regional Health Center 19 8.96 13.01 68.45 Memorial Hospital at Gulfport 89 8.87 31.87 35.81 North Mississippi Medical Center 33 6.77 32.42 98.24 Parkwood Behavioral Health System 74 10.14 54.21 73.25 River Region Health System 40 8.52 19.19 47.97 Singing River Hospital 30 6.28 15.03 50.11 St. Dominic Jackson Memorial Hospital 83 5.18 34.98 42.15 Tri Lakes Medical Center 25 8.47 17.06 68.23 University Hospital & Health System 33 6.54 12.48 37.82

-25-
Table XIV B 2
Average Length of Stay, Average Daily Census and Occupancy Rates by Adult Psychiatric Care Category
for Mississippi Hospitals in 2010 Licensed Occ Facility Beds ALOS ADC Rate Total 561 7.98 324.15 57.78 Alliance Health Center 36 10.66 36.00 100.00 Baptist Memorial Hospital Golden Triangle 22 7.16 9.87 44.87 Biloxi Regional Medical Center 45 7.83 23.25 51.67 Brentwood Behavioral Healthcare of Mississippi 48 9.05 18.97 39.51 Central Mississippi Medical Center 29 5.02 23.13 79.77 Delta Regional Medical Center West Campus 9 5.18 5.39 59.94 Forrest General Hospital 40 5.66 32.77 81.92 Magnolia Regional Health Center 19 8.96 13.01 68.45 Memorial Hospital at Gulfport 59 8.10 13.00 22.04 North Mississippi Medical Center 33 6.77 32.42 98.24 Parkwood Behavioral Health System 22 8.81 20.05 91.12 River Region Health System 40 8.52 19.19 47.97 Singing River Hospital 30 6.28 15.03 50.11 St. Dominic Jackson Memorial Hospital 83 5.18 34.98 42.15 Tri Lakes Medical Center 25 8.47 17.06 68.23 University Hospital & Health System 21 5.44 7.62 36.39

-26-
Table XIV B 3
Average Length of Stay, Average Daily Census and Occupancy Rates by Adolescent Psychiatric Care Category
for Mississippi Hospitals in 2010 Licensed Occ Facility Beds ALOS ADC Rate Total 216 13.01 206.22 20.28 Alliance Health Center 22 25.62 22.00 100.00 Brentwood Behavioral Healthcare of Mississippi 59 12.85 59.00 100.00 Diamond Grove Center 25 20.26 21.07 84.27 Forrest General Hospital 16 8.13 16.00 100.00 Memorial Hospital at Gulfport 30 9.52 18.87 62.89 Parkwood Behavioral Health System 52 45.34 36.16 60.27 University Hospital & Health System 12 9.65 4.84 40.32
-27-
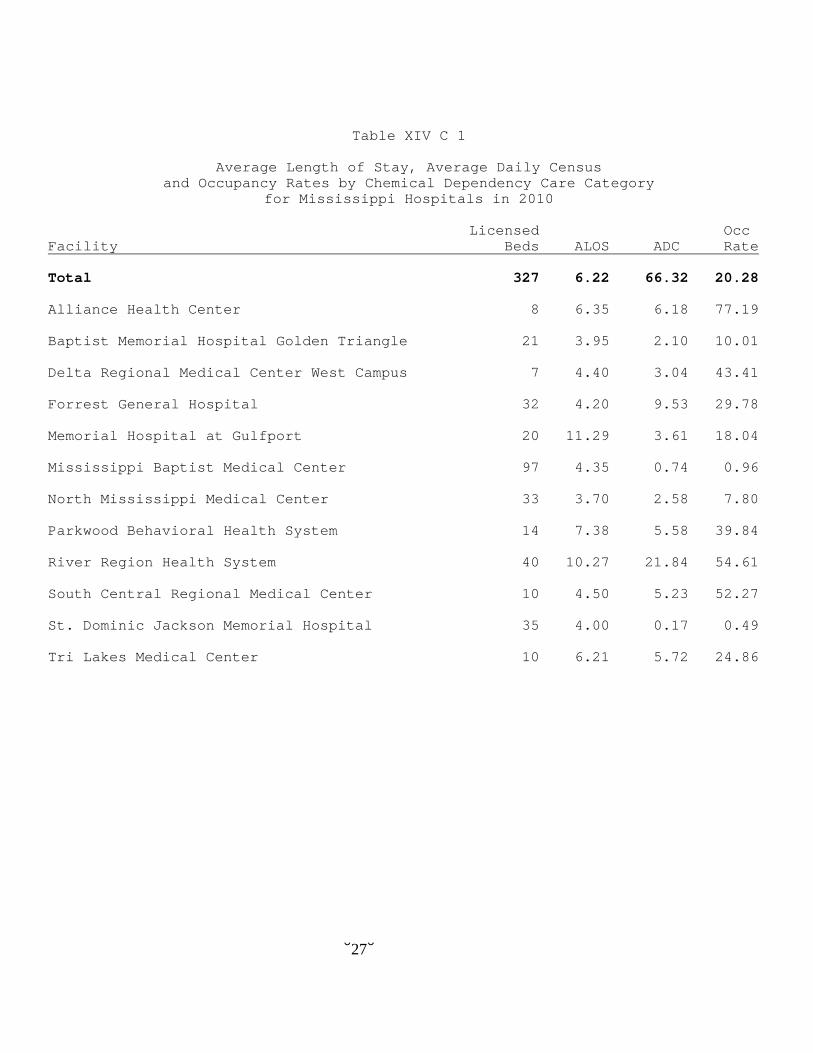
Table XIV C 1
Average Length of Stay, Average Daily Census and Occupancy Rates by Chemical Dependency Care Category
for Mississippi Hospitals in 2010 Licensed Occ Facility Beds ALOS ADC Rate Total 327 6.22 66.32 20.28 Alliance Health Center 8 6.35 6.18 77.19 Baptist Memorial Hospital Golden Triangle 21 3.95 2.10 10.01 Delta Regional Medical Center West Campus 7 4.40 3.04 43.41 Forrest General Hospital 32 4.20 9.53 29.78 Memorial Hospital at Gulfport 20 11.29 3.61 18.04 Mississippi Baptist Medical Center 97 4.35 0.74 0.96 North Mississippi Medical Center 33 3.70 2.58 7.80 Parkwood Behavioral Health System 14 7.38 5.58 39.84 River Region Health System 40 10.27 21.84 54.61 South Central Regional Medical Center 10 4.50 5.23 52.27 St. Dominic Jackson Memorial Hospital 35 4.00 0.17 0.49 Tri Lakes Medical Center 10 6.21 5.72 24.86
-28-
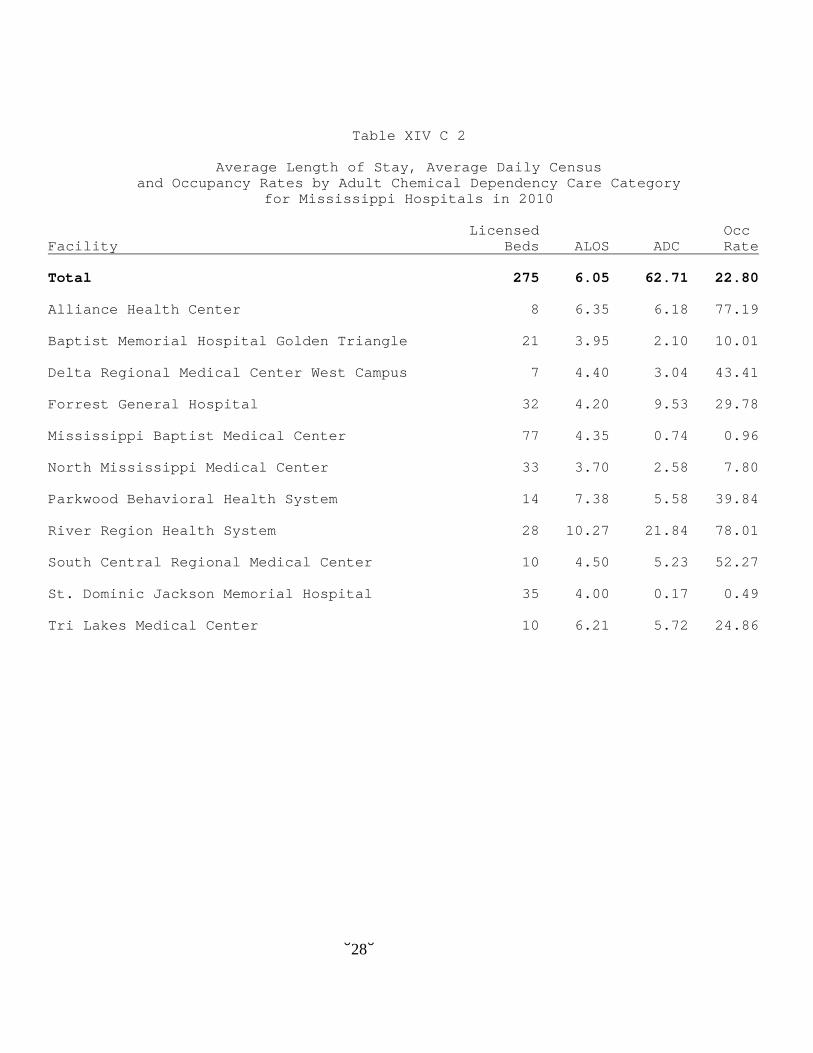
Table XIV C 2
Average Length of Stay, Average Daily Census and Occupancy Rates by Adult Chemical Dependency Care Category
for Mississippi Hospitals in 2010 Licensed Occ Facility Beds ALOS ADC Rate Total 275 6.05 62.71 22.80 Alliance Health Center 8 6.35 6.18 77.19 Baptist Memorial Hospital Golden Triangle 21 3.95 2.10 10.01 Delta Regional Medical Center West Campus 7 4.40 3.04 43.41 Forrest General Hospital 32 4.20 9.53 29.78 Mississippi Baptist Medical Center 77 4.35 0.74 0.96 North Mississippi Medical Center 33 3.70 2.58 7.80 Parkwood Behavioral Health System 14 7.38 5.58 39.84 River Region Health System 28 10.27 21.84 78.01 South Central Regional Medical Center 10 4.50 5.23 52.27 St. Dominic Jackson Memorial Hospital 35 4.00 0.17 0.49 Tri Lakes Medical Center 10 6.21 5.72 24.86

-29-
Table XIV C 3
Average Length of Stay, Average Daily Census and Occupancy Rates by Adolescent Chemical Dependency Care Category
for Mississippi Hospitals in 2010 Licensed Occ Facility Beds ALOS ADC Rate Total 52 11.29 3.61 18.04 Memorial Hospital at Gulfport 20 11.29 3.61 18.04 Mississippi Baptist Medical Center 20 N/A N/A N/A River Region Health System 12 N/A N/A N/A

-30-
Table XIV D
Average Length of Stay, Average Daily Census and Occupancy Rates by Rehabilitation Category
for Mississippi Hospitals in 2010 Licensed Occ Facility Beds ALOS ADC Rate Total 353 14.29 202.68 57.42 Baptist Memorial Hospital North Mississippi 13 12.56 7.16 55.05 Baptist Memorial Hospital DeSoto 30 13.08 15.50 51.67 Delta Regional Medical Center West Campus 24 12.84 7.07 29.46 Forrest General Hospital 24 13.11 17.79 74.12 Greenwood Leflore Hospital 20 N/A N/A N/A Memorial Hospital at Gulfport 33 15.13 18.94 57.40 Mississippi Methodist Rehab Center 80 15.32 48.06 60.08 Natchez Regional Medical Center 20 13.94 5.85 29.25 North Mississippi Medical Center 30 16.77 18.79 62.63 Northwest Mississippi Regional Medical Center 14 9.81 2.31 16.52 Riley Hospital 20 13.53 14.75 73.75 Singing River Hospital 20 12.90 17.15 85.77 University Hospital & Health System 25 16.84 20.81 83.24

-31-
Table XV-A
Acute Care Licensed Bed Capacity and Beds Set Up and Staffed for Mississippi Hospitals in 2010
Licensed Beds Set Up Facility Beds and Staffed Total 11,484 10,492 Alliance Health Center 88 80 Alliance Healthcare System 40 40 Anderson Regional Medical Center 260 260 Baptist Memorial Hospital Booneville 114 114 Baptist Memorial Hospital Golden Triangle 285 285 Baptist Memorial Hospital North Mississippi 204 204 Baptist Memorial Hospital Union County 153 153 Baptist Memorial Hospital DeSoto 309 240 Beacham Memorial Hospital 37 37 Biloxi Regional Medical Center 153 153 Bolivar Medical Center 165 94 Calhoun Health Services 30 30 Central Mississippi Medical Center 400 400 Choctaw County Hospital 25 25 Covington County Hospital 35 28 Crossgates River Oaks Hospital 134 134 Delta Regional Medical Center Main Campus 227 171 Delta Regional Medical Center West Campus 97 14 Field Memorial Community Hospital 25 25 Forrest General Hospital 400 400 Franklin County Memorial Hospital 35 34

-32-
Table XV-A Continued
Acute Care Licensed Bed Capacity and Beds Set Up and Staffed for Mississippi Hospitals in 2010
Licensed Beds Set Up Facility Beds and Staffed Garden Park Medical Center 130 130 George County Hospital 48 48 Gilmore Memorial Regional Medical Center 95 95 Greene County Hospital 3 3 Greenwood Leflore Hospital 188 176 Grenada Lake Medical Center 156 141 H.C. Watkins Memorial Hospital 25 25 Hancock Medical Center 47 47 Hardy Wilson Memorial Hospital 35 35 Highland Community Hospital 95 55 Holmes County Hospital & Clinics 25 25 Iuka Hospital 48 48 Jasper General Hospital 16 16 Jefferson County Hospital 30 30 Jeff Davis Community Hospital 35 35 Kilmichael Hospital 19 19 King's Daughters Hospital Yazoo County 35 35 King's Daughters Medical Center 122 91 Laird Hospital 25 25 Lawrence County Hospital 25 25 Leake Memorial Hospital 25 25 Long Term Actue Hospital of Greenwood 40 40

-33-
Table XV-A Continued
Acute Care Licensed Bed Capacity and Beds Set Up and Staffed for Mississippi Hospitals in 2010
Licensed Beds Set Up Facility Beds and Staffed Madison County Medical Center 67 67 Magee General Hospital 64 61 Magnolia Regional Health Center 145 145 Marion General Hospital 49 49 Memorial Hospital at Gulfport 303 303 Mississippi Baptist Medical Center 541 541 Mississippi Hospital for Restorative Care 25 25 Mississippi Methodist Rehab Center 44 31 Montfort Jones Memorial Hospital 71 71 Natchez Community Hospital 101 101 Natchez Regional Medical Center 159 135 Neshoba County General Hospital 82 58 North Mississippi Medical Center 554 554 North Mississippi Medical Center West Point 60 60 North Oak Regional Medical Center 76 41 North Sunflower County Hospital 35 35 Northwest Mississippi Regional Medical Center 181 181 Noxubee General Critical Access Hospital 25 25 Ocean Springs Hospital 136 136 OCH Regional Medical Center 96 96 Patients' Choice Medical Center 29 29 Patients' Choice Medical Center of Claiborne County 32 28

-34-
Table XV-A Continued
Acute Care Licensed Bed Capacity and Beds Set Up and Staffed for Mississippi Hospitals in 2010
Licensed Beds Set Up Facility Beds and Staffed Patients' Choice Medical Center of Humphreys County 34 34 Pearl River County Hospital 24 24 Perry County General Hospital 22 22 Pioneer Community Hospital of Aberdeen 35 35 Pioneer Community Hospital of Newton 30 30 Pontotoc Health Services 25 25 Promise Hospital of Vicksburg 35 33 Quitman County Hospital 33 33 Regency Hospital of Jackson 36 36 Regency Hospital of Meridian 40 40 Regency Hospital of Southern Mississippi 33 33 Riley Hospital 120 120 River Oaks Hospital 160 158 River Region Health System 261 260 Rush Foundation Hospital 215 179 S.E. Lackey CAHospital 35 35 Scott Regional Hospital 25 25 Select Specialty Hospital Gulf Coast 61 61 Select Specialty Hospital Jackson 53 53 Sharkey-Issaquena Community Hospital 29 29 Simpson General Hospital 35 35 Singing River Hospital 385 199

-35-
Table XV-A Continued
Acute Care Licensed Bed Capacity and Beds Set Up and Staffed for Mississippi Hospitals in 2010
Licensed Beds Set Up Facility Beds and Staffed South Central Regional Medical Center 275 184 South Sunflower County Hospital 49 49 Southwest Mississippi Regional Medical Center 160 143 Specialty Hospital of Meridian 49 49 St. Dominic Jackson Memorial Hospital 417 405 Stone County Hospital 25 25 Tallahatchie General Hospital 9 9 Tippah County Hospital 45 45 Trace Regional Hospital 84 84 Tri Lakes Medical Center 77 77 Tyler Holmes Memorial Hospital 25 25 University Hospital & Health System 664 566 Walthall General Hospital 25 25 Wayne General Hospital 80 80 Webster Health Services 38 38 Wesley Medical Center 211 211 Winston Medical Center 30 30 Woman's Hospital at River Oaks 111 60 Yalobusha General Hospital 26 26
-36-
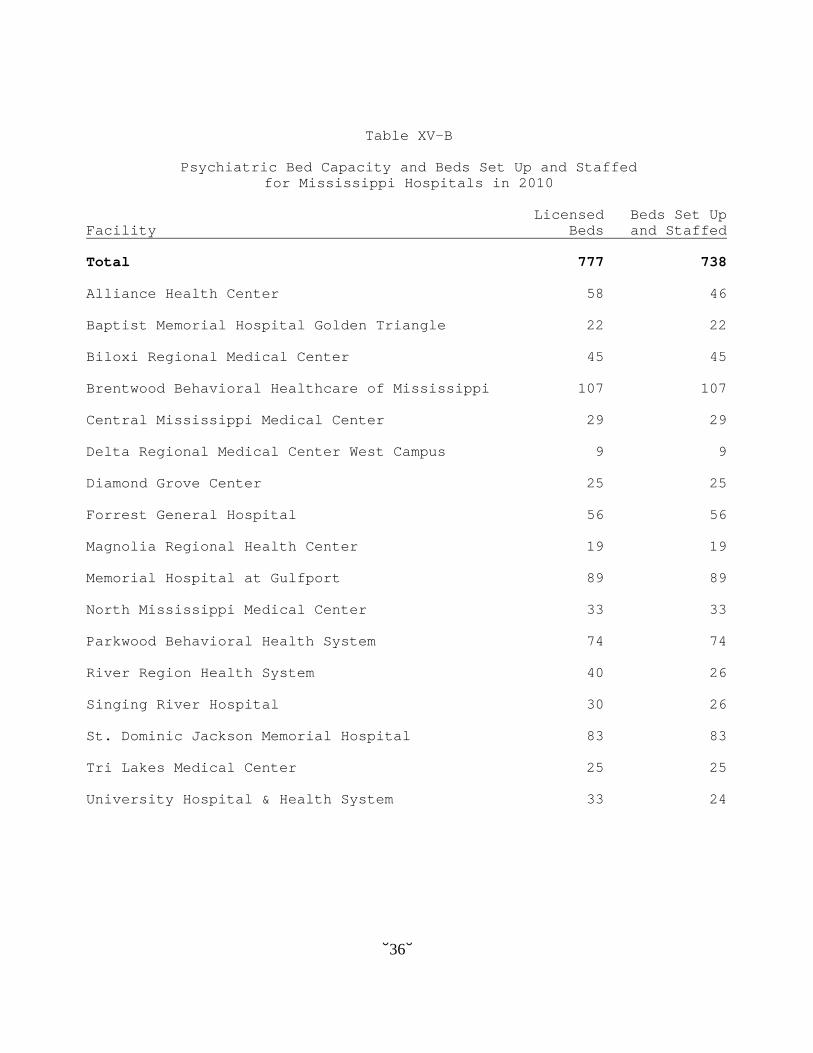
Table XV-B
Psychiatric Bed Capacity and Beds Set Up and Staffed for Mississippi Hospitals in 2010
Licensed Beds Set Up Facility Beds and Staffed Total 777 738 Alliance Health Center 58 46 Baptist Memorial Hospital Golden Triangle 22 22 Biloxi Regional Medical Center 45 45 Brentwood Behavioral Healthcare of Mississippi 107 107 Central Mississippi Medical Center 29 29 Delta Regional Medical Center West Campus 9 9 Diamond Grove Center 25 25 Forrest General Hospital 56 56 Magnolia Regional Health Center 19 19 Memorial Hospital at Gulfport 89 89 North Mississippi Medical Center 33 33 Parkwood Behavioral Health System 74 74 River Region Health System 40 26 Singing River Hospital 30 26 St. Dominic Jackson Memorial Hospital 83 83 Tri Lakes Medical Center 25 25 University Hospital & Health System 33 24

-37-
Table XV-C
Chemical Dependency Licensed Bed Capacity and Beds Set Up and Staffed for Mississippi Hospitals in 2010
Licensed Beds Set Up Facility Beds and Staffed Total 327 321 Alliance Health Center 8 8 Baptist Memorial Hospital Golden Triangle 21 21 Delta Regional Medical Center West Campus 7 7 Forrest General Hospital 32 32 Memorial Hospital at Gulfport 20 20 Mississippi Baptist Medical Center 97 97 North Mississippi Medical Center 33 33 Parkwood Behavioral Health System 14 14 River Region Health System 40 34 South Central Regional Medical Center 10 10 St. Dominic Jackson Memorial Hospital 35 35 Tri Lakes Medical Center 10 10

-38-
Table XV-D
Rehabilitation Bed Capacity and Beds Set Up and Staffed for Mississippi Hospitals in 2010
Licensed Beds Set Up Facility Beds and Staffed Total 353 340 Baptist Memorial Hospital North Mississippi 13 13 Baptist Memorial Hospital DeSoto 30 17 Delta Regional Medical Center West Campus 24 16 Forrest General Hospital 24 24 Greenwood Leflore Hospital 20 20 Memorial Hospital at Gulfport 33 33 Mississippi Methodist Rehab Center 80 93 Natchez Regional Medical Center 20 20 North Mississippi Medical Center 30 30 Northwest Mississippi Regional Medical Center 14 14 Riley Hospital 20 20 Singing River Hospital 20 20 University Hospital & Health System 25 20

-39-
Table XVI
2010 Swing Beds, Average Length of Stay, and Average Daily Census Average Average Swing Daily Length Hospital Beds Census of Stay Total 776 265.87 13.73 Alliance Healthcare System 4 0.67 7.52 Baptist Memorial Hospital Booneville 10 5.60 9.01 Baptist Memorial Hospital Union County 12 1.96 7.84 Beacham Memorial Hospital 15 6.27 12.16 Calhoun Health Services 10 2.39 13.75 Covington County Hospital 10 6.95 15.90 Field Memorial Community Hospital 10 4.30 10.17 Franklin County Memorial Hospital 24 4.61 12.35 George County Hospital 10 0.94 10.44 Gilmore Memorial Regional Medical Center 16 3.94 7.72 Greene County Hospital 3 2.24 23.31 H.C. Watkins Memorial Hospital 25 11.41 17.35 Hardy Wilson Memorial Hospital 10 8.16 18.36 Holmes County Hospital & Clinics 25 3.24 15.32 Iuka Hospital 10 3.03 9.53 Jasper General Hospital 12 5.39 16.95 Jeff Davis Community Hospital 10 4.33 16.03 Kilmichael Hospital 10 0.52 12.53 King's Daughters Hospital Yazoo County 25 4.90 13.05 Laird Hospital 25 5.35 11.74 Lawrence County Hospital 10 4.65 15.21

-40-
Table XVI Continued
2010 Swing Beds, Average Length of Stay, and Average Daily Census Average Average Swing Daily Length Hospital Beds Census of Stay Leake Memorial Hospital 10 4.45 13.98 Magee General Hospital 12 10.09 12.29 Marion General Hospital 20 4.78 18.35 Montfort Jones Memorial Hospital 12 4.19 11.55 Neshoba County General Hospital 10 5.47 12.46 North Mississippi Medical Center West Point 10 5.69 8.67 North Sunflower County Hospital 15 11.47 12.14 Noxubee General Critical Access Hospital 25 6.53 17.59 OCH Regional Medical Center 10 0.01 5.00 Patients' Choice Medical Center of Claiborne County 7 4.33 9.82 Patients' Choice Medical Center of Humphreys County 25 6.35 13.45 Pearl River County Hospital 10 5.45 21.16 Perry County General Hospital 22 4.84 15.14 Pioneer Community Hospital of Aberdeen 25 11.31 22.40 Pioneer Community Hospital of Newton 21 3.52 12.57 Pontotoc Health Services 25 5.39 10.59 Quitman County Hospital 25 3.49 12.71 S.E. Lackey Critical Access Hospital 15 5.50 15.44 Scott Regional Hospital 10 3.34 9.82 Sharkey-Issaquena Community Hospital 10 2.42 11.23 Simpson General Hospital 25 6.06 13.94 Specialty Hospital of Meridian 20 2.70 16.33

-41-
Table XVI Continued
2010 Swing Beds, Average Length of Stay, and Average Daily Census Average Average Swing Daily Length Hospital Beds Census of Stay Stone County Hospital 25 13.28 22.96 Tallahatchie General Hospital 3 1.76 20.29 Tippah County Hospital 10 1.05 7.04 Trace Regional Hospital 10 1.48 6.42 Tyler Holmes Memorial Hospital 10 5.45 13.97 Walthall General Hospital 25 5.76 13.81 Wayne General Hospital 10 9.28 17.62 Webster Health Services 10 7.25 13.66 Winston Medical Center 10 3.55 13.48 Yalobusha General Hospital 13 8.77 19.77

-42-
Table XVII
Destination of Discharged Swing Bed Patients in 2010, Number Referred to Home Health and Number of
Acute Care Beds Designated as Swing Beds by Hospital Service Area Hospital Service Area 1 2 3 4 5 6 7 8 9 Total Nursing Home 1 89 51 189 174 84 86 107 42 823 Patient's Home 17 530 454 970 1,077 680 488 397 204 4,817 Personal Care Home 9 55 56 178 128 83 33 55 58 655 Hospital 0 12 31 10 8 18 1 10 0 90 Other 6 30 42 140 104 56 111 46 32 567 Total Discharges 33 716 634 1,487 1,491 921 719 615 336 6,952 Referred to Home Health 8 284 200 485 636 340 261 288 137 2,639 Swing Beds 4 67 68 159 161 111 84 77 45 776
-43-
Table XVIII
2010 Swing Bed Utilization by Hospital Service Area Inpatient Discharge Admissions Days Discharges Days Total 6,928 97,042 6,951 95,460 Service Area 1 32 247 33 248 Service Area 2 671 6,218 716 6,599 Service Area 3 617 8,418 634 8,254 Service Area 4 1,480 20,765 1,487 20,455 Service Area 5 1,505 20,691 1,491 19,715 Service Area 6 926 13,771 921 13,741 Service Area 7 733 9,343 718 9,047 Service Area 8 623 10,409 615 10,257 Service Area 9 341 7,180 336 7,144
-44-
Table XIX
Percentage Distribution of Population and Hospital Beds by Hospital Service Area 2010
Percent of Licensed Percent Population Population Beds of Beds Total 2,975,550 100.0 12,912 100.0 Service Area 1 260,626 8.8 655 5.1 Service Area 2 268,144 9.0 1,199 9.3 Service Area 3 229,947 7.7 1,132 8.8 Service Area 4 347,118 11.7 1,314 10.2 Service Area 5 734,436 24.7 3,928 30.4 Service Area 6 179,417 6.0 1,100 8.5 Service Area 7 176,215 5.9 739 5.7 Service Area 8 299,685 10.1 1,201 9.3 Service Area 9 479,962 16.1 1,644 12.7 Chemical Acute Psychiatric Dependency Rehabilitation Total 11,455 777 327 353 Service Area 1 502 99 24 30 Service Area 2 1,084 52 33 30 Service Area 3 1,058 9 7 58 Service Area 4 1,233 47 21 13 Service Area 5 3,359 292 172 105 Service Area 6 1,014 58 8 20 Service Area 7 719 0 0 20 Service Area 8 1,079 56 42 24 Service Area 9 1,407 164 20 53

-45-
Table XX-A
Selected Utilization Statistics for Acute Care Mississippi Hospitals in 2010 by Hospital Service Area and County
Licensed Bed Beds Inpatient County Capacity Set Up Admissions Discharges Deaths Days Total 11,484 10,492 407,460 381,862 11,051 1,849,835 Service Area 1 502 398 21,443 20,157 519 86,706 DeSoto 309 240 16,327 16,095 399 68,321 Marshall 40 40 766 769 18 3,958 Panola 77 77 2,980 1,913 73 7,915 Tate 76 41 1,370 1,380 29 6,512 Service Area 2 1,084 1,084 41,481 39,417 1,259 190,440 Alcorn 145 145 7,920 7,399 188 33,521 Lee 554 554 26,028 24,297 889 125,420 Pontotoc 25 25 430 432 12 1,584 Prentiss 114 114 1,482 1,486 65 7,891 Tippah 45 45 680 868 35 4,780 Tishomingo 48 48 871 873 24 3,237 Union 153 153 4,070 4,062 46 14,007 Service Area 3 1,058 836 31,075 30,008 842 142,803 Bolivar 165 94 4,270 4,302 137 18,374 Coahoma 181 181 6,044 6,083 144 24,562 Humphreys 34 34 687 685 8 3,926 Leflore 228 216 8,112 7,869 240 43,363 Quitman 33 33 822 813 10 4,213 Sunflower 84 84 2,482 2,475 36 9,880 Tallahatchie 9 9 195 196 10 776 Washington 324 185 8,463 7,585 257 37,709
-46-
Table XX-A Continued
Selected Utilization Statistics for Acute Care Mississippi Hospitals in 2010 by Hospital Service Area and County
Licensed Bed Beds Inpatient County Capacity Set Up Admissions Discharges Deaths Days Service Area 4 1,233 1,218 35,097 34,318 1,008 152,179 Calhoun 30 30 561 562 26 3,028 Chickasaw 84 84 1,072 1,075 26 5,321 Choctaw 25 25 1 1 0 3 Clay 60 60 2,308 2,320 63 7,928 Grenada 156 141 3,205 3,230 62 15,716 Lafayette 204 204 8,425 8,322 300 38,685 Lowndes 285 285 7,557 6,837 231 34,101 Monroe 130 130 4,343 4,305 93 17,166 Montgomery 44 44 885 890 23 2,926 Noxubee 25 25 759 772 13 2,689 Oktibbeha 96 96 3,189 3,202 96 11,599 Webster 38 38 1,412 1,425 49 6,706 Winston 30 30 636 636 18 4,204 Yalobusha 26 26 744 741 8 2,107 Service Area 5 3,388 3,202 128,321 119,555 3,317 619,270 Attala 71 71 1,617 1,607 66 6,928 Claiborne 32 28 815 821 8 4,511 Copiah 35 35 1,105 1,099 78 5,359 Hinds 2,180 2,057 89,207 82,047 2,278 449,606 Holmes 25 25 390 389 40 1,136 Leake 25 25 821 828 26 2,455 Madison 67 67 1,477 1,468 42 4,502 Rankin 405 352 14,455 14,462 228 61,363 Scott 60 60 3,053 3,034 40 10,175 Sharkey 29 29 516 518 15 2,726 Simpson 99 96 2,662 2,678 94 11,487 Smith 29 29 0 0 0 0 Warren 296 293 10,951 9,356 346 52,411 Yazoo 35 35 1,252 1,248 56 6,611

-47-
Table XX-A Continued
Selected Utilization Statistics for Acute Care Mississippi Hospitals in 2010 by Hospital Service Area and County
Licensed Bed Beds Inpatient County Capacity Set Up Admissions Discharges Deaths Days Service Area 6 1,014 946 28,418 25,926 1,005 147,107 Clarke 25 25 521 531 21 2,154 Lauderdale 772 728 22,519 19,984 794 122,967 Neshoba 82 58 1,196 1,198 51 5,009 Newton 55 55 1,831 1,844 54 6,939 Wayne 80 80 2,351 2,369 85 10,038 Service Area 7 719 646 22,250 22,031 618 95,465 Adams 260 236 7,330 7,122 260 30,117 Franklin 35 34 878 857 25 5,989 Jefferson 30 30 887 880 2 8,004 Lawrence 25 25 411 409 11 1,349 Lincoln 122 91 3,657 3,668 76 12,442 Pike 197 180 7,766 7,772 203 32,608 Walthall 25 25 595 595 17 2,298 Wilkinson 25 25 726 728 24 2,658 Service Area 8 1,079 981 46,965 42,307 1,165 202,883 Covington 35 28 443 456 14 3,222 Forrest 433 433 26,388 22,049 671 105,716 Greene 3 3 31 31 0 89 Jasper 16 16 55 26 31 115 Jeff Davis 35 35 529 534 12 3,512 Jones 275 184 8,033 7,604 181 36,225 Lamar 211 211 10,258 10,379 213 48,949 Marion 49 49 1,025 1,027 39 4,381 Perry 22 22 203 201 4 674 Service Area 9 1,407 1,181 52,410 48,143 1,318 212,982 George 48 48 1,667 1,678 72 7,703 Hancock 47 47 2,473 2,473 59 7,974 Harrison 647 647 26,854 23,950 650 118,306 Jackson 521 335 18,426 17,014 453 70,604 Pearl River 119 79 2,688 2,701 56 7,497 Stone 25 25 302 327 28 898

-48-
Table XX-B
Psychiatric, Chemical Dependency and Rehabilitation Utilization During 2010 by Hospital Service Area and County
Licensed Bed Beds Inpatient County Capacity Set Up Discharges Days Psychiatric 777 738 22,772 191,763 Service Area 1 99 99 2,692 26,012 DeSoto 74 74 1,952 19,786 Panola 25 25 740 6,226 Service Area 2 52 52 2,317 16,580 Alcorn 19 19 526 4,747 Lee 33 33 1,791 11,833 Service Area 3 0 0 0 0 Service Area 4 47 47 869 11,293 Lowndes 22 22 491 3,603 Winston 25 25 378 7,690 Service Area 5 292 269 8,292 62,929 Hinds 145 136 4,882 25,767 Rankin 107 107 2,588 30,159 Warren 40 26 822 7,003 Service Area 6 Lauderdale 58 46 1,896 28,279 Service Area 7 0 0 0 0 Service Area 8 Forrest 56 56 3,008 19,095 Service Area 9 164 160 3,324 25,606 Harrison 134 134 2,413 20,119 Jackson 30 26 911 5,487 Chemical Dependency 327 321 3,905 24,202 Service Area 1 24 24 609 4,123 DeSoto 14 14 276 2,036 Panola 10 10 333 2,087 Service Area 2 Lee 33 33 231 940 Service Area 3 Washington 7 7 259 1,109 Service Area 4 Lowndes 21 21 202 767

-49-
Table XX-B Continued
Psychiatric, Chemical Dependency and Rehabilitation Utilization During 2010 by Hospital Service Area and County
Licensed Bed Beds Inpatient County Capacity Set Up Discharges Days Service Area 5 172 166 841 8,306 Hinds 132 132 74 333 Warren 40 34 767 7,973 Service Area 6 Lauderdale 8 8 356 2,254 Service Area 7 0 0 0 0 Service Area 8 42 42 1,278 5,386 Forrest 32 32 853 3,478 Jones 10 10 425 1,908 Service Area 9 Harrison 20 20 129 1,317 Rehabilitation 353 340 5,219 73,977 Service Area 1 DeSoto 30 17 449 5,658 Service Area 2 Lee 30 30 404 6,858 Service Area 3 58 50 530 6,523 Coahoma 14 14 86 844 Leflore 20 20 248 3,098 Washington 24 16 196 2,581 Service Area 4 Lafayette 13 13 209 2,612 Service Area 5 Hinds 105 113 1,607 25,139 Service Area 6 Lauderdale 20 20 404 5,384 Service Area 7 Adams 20 20 177 2,135 Service Area 8 Forrest 24 24 497 6,493 Service Area 9 53 53 942 13,175 Harrison 33 33 460 6,914 Jackson 20 20 482 6,261

-50-
Table XXI
Selected Statistics 1995, 2000 and 2005 2000-2010 Percent 2000 2005 2010 Difference of Change Licensed Beds 13,151 13,056 12,941 -210 -1.6 Acute 11,817 11,584 11,484 -333 -2.8 Psychiatric 572 719 777 205 35.8 Chemical Dependency 419 353 327 -92 -22.0 Rehabilitation 343 388 353 10 2.9 Beds Set up and Staffed 12,119 11,994 11,920 -199 -1.6 Acute 10,854 10,613 10,463 -391 -3.6 Psychiatric 558 665 777 219 39.2 Chemical Dependency 367 329 327 -40 -10.9 Rehabilitation 340 387 353 13 3.8 Discharges 420,402 428,593 413,758 -6,644 -1.6 Acute 396,941 397,026 381,862 -15,079 -3.8 Psychiatric 13,594 18,885 22,772 9,178 67.5 Chemical Dependency 5,415 5,723 3,905 -1,510 -27.9 Rehabilitation 4,452 6,959 5,219 767 17.2 Inpatient Days 2,303,095 2,288,754 2,139,777 -163,318 -7.1 Acute 2,049,585 1,983,060 1,849,835 -199,750 -9.7 Psychiatric 134,741 175,502 191,763 57,022 42.3 Chemical Dependency 47,534 36,419 24,202 23,332 -49.1 Rehabilitation 71,235 93,773 73,977 2,742 3.8

-51-
Table XXII
2010 Newborn Statistics by Service Area and County Bassinets Live Fetal Newborn County Set Up Deliveries C-Sections Births Deaths Days Total 781 39,174 14,423 39,044 426 94,009 Service Area 1 30 2,187 745 2,183 6 5,591 DeSoto 24 2,018 686 2,020 0 5,088 Panola 6 169 59 163 6 503 Service Area 2 48 3,867 1,250 3,888 13 8,249 Alcorn 12 500 169 492 8 1,043 Lee 24 2,254 721 2,278 2 4,582 Union 12 1,113 360 1,118 3 2,624 Service Area 3 110 3,299 1,050 3,246 22 9,130 Bolivar 16 412 154 411 0 1,229 Coahoma 21 976 367 976 2 3,084 Leflore 25 757 205 743 14 1,886 Sunflower 14 261 116 259 2 913 Washington 34 893 208 857 4 2,018 Service Area 4 108 3,975 1,267 4,114 53 10,513 Clay 10 241 175 416 0 1,153 Grenada 20 451 205 455 1 1,161 Lafayette 16 911 288 901 10 2,043 Lowndes 20 907 225 907 24 2,961 Monroe 26 536 172 533 6 1,170 Oktibbeha 16 929 202 902 12 2,025 Service Area 5 195 10,864 4,696 10,726 161 27,711 Hinds 87 6,222 2,594 6,111 101 18,003 Leake 0 6 0 5 1 0 Madison 10 243 105 243 5 627 Rankin 64 3,504 1,740 3,493 39 7,373 Scott 0 1 0 1 0 0 Simpson 7 104 39 104 0 198 Warren 27 780 218 765 15 1,510 Yazoo 0 4 0 4 0 0 Service Area 6 56 2,672 1,020 2,596 21 7,252 Lauderdale 48 2,450 960 2,434 18 6,566 Newton 0 2 0 2 0 0 Wayne 8 220 60 160 3 686 Service Area 7 59 2,585 986 2,566 34 7,024 Adams 28 1,007 335 999 15 2,904 Lincoln 20 640 305 636 12 1,818 Pike 11 938 346 931 7 2,302
-52-
Table XXII Continued
2010 Newborn Statistics by Service Area and County Bassinets Live Fetal Newborn County Set Up Deliveries C-Sections Births Deaths Days Service Area 8 67 4,880 1,792 4,905 56 8,692 Forrest 16 2,357 876 2,408 30 3,405 Jones 32 939 298 920 19 2,288 Lamar 19 1,582 618 1,575 7 2,999 Marion 0 2 0 2 0 0 Service Area 9 108 4,845 1,617 4,820 60 9,847 Hancock 11 209 51 209 0 436 Harrison 55 2,622 903 2,614 43 4,820 Jackson 32 1,681 566 1,669 12 3,874 Pearl River 10 333 97 328 5 717

-53-
Table XXIII
Newborn Statistics for 2000, 2005 and 2010 2000-2010 Percent 2000 2005 2010 Difference of Change Obstetric Beds Set Up 622 603 565 -100 -16,1 Bassinets 818 773 781 -37 -4.5 C-Sections 11,461 13,658 14,423 2,962 25.8 Deliveries 41,991 39,832 39,174 -2,844 -6.8 Live Births 41,981 42,830 39,044 -2,937 -7.0 Fetal Deaths 485 424 426 -59 -12.2 Newborn Days 107,580 98,236 94,009 -13,571 -12.6
-54-
Table XXIV
2010 Selected Acute Hospital Utilization Data by Hospital Service Area DPSNF Ger/Psy Medicare Medicaid 65 & Older Service Area 1 Discharges 0 520 10,514 5,551 8,339 Discharge Days 0 6,061 58,800 19,917 46,980 Admissions 0 521 10,388 5,504 8,224 Inpatient Days 0 6,059 57,245 19,761 45,608 Service Area 2 Discharges 500 419 20,569 13,687 17,018 Discharge Days 7,686 5,603 115,228 103,436 153,798 Admissions 501 409 20,558 13,618 16,942 Inpatient Days 7,791 5,624 116,556 112,118 151,704 Service Area 3 Discharges 487 1,083 14,822 9,234 12,198 Discharge Days 6,245 13,457 89,246 63,269 105,972 Admissions 482 1,088 15,056 9,279 12,268 Inpatient Days 6,241 13,502 97,878 87,297 107,490 Service Area 4 Discharges 604 797 18,016 8,817 15,086 Discharge Days 5,120 10,082 95,557 158,442 185,162 Admissions 609 804 17,878 8,730 14,913 Inpatient Days 5,132 10,059 96,185 172,295 158,154 Service Area 5 Discharges 0 2,804 53,607 31,065 39,910 Discharge Days 0 28,585 299,493 169,965 253,509 Admissions 0 2,486 48,093 30,559 40,698 Inpatient Days 0 28,574 293,167 176,150 264,780 Service Area 6 Discharges 0 509 13,908 8,086 11,058 Discharge Days 0 6,226 106,473 67,697 102,955 Admissions 0 504 13,884 8,047 11,051 Inpatient Days 0 6,019 104,659 68,793 102,028 Service Area 7 Discharges 0 808 10,318 7,212 8,826 Discharge Days 0 10,348 51,016 21,967 41,026 Admissions 0 822 10,320 7,136 8,828 Inpatient Days 0 10,453 50,712 21,798 36,379 Service Area 8 Discharges 578 532 20,736 11,271 17,369 Discharge Days 7,620 6,762 122,211 170,718 225,621 Admissions 578 521 20,741 11,124 17,466 Inpatient Days 7,547 6,711 121,428 179,363 233,392

-55-
Table XXIV Continued
2010 Selected Acute Hospital Utilization Data by Hospital Service Area DPSNF Ger/Psy Medicare Medicaid 65 & Older Service Area 9 Discharges 0 700 21,791 12,757 17,736 Discharge Days 0 8,084 112,814 49,928 106,758 Admissions 0 700 21,971 12,789 17,825 Inpatient Days 0 8,097 118,228 82,216 108,080 Total Discharges 2,169 8,172 184,281 107,680 147,540 Discharge Days 26,671 95,208 1,050,838 825,339 1,221,781 Admissions 2,170 7,855 178,889 106,786 148,215 Inpatient Days 26,711 95,098 1,056,058 919,791 1,207,615
-56-
Table XXV
Beds Set Up, Discharges, Discharge Days and Inpatient Days Reported in 2010 Beds Discharge Inpatient Service Area Set Up Discharges Days Days General medical and surgical (adult) 7,569 288,311 1,389,153 1,300,869 General medical and surgical (pediatric) 384 15,898 54,627 53,402 Psychiatric acute (adult) 522 17,123 119,597 118,321 Psychiatric acute (pediatric) 216 5,649 73,483 73,442 Obstetrics 565 35,747 97,286 92,639 Orthopedic 146 6,865 29,129 27,689 Other acute 0 0 0 0 DPSNF 117 2,169 26,671 26,711 Geriatric psychiatric DP 508 8,172 95,208 95,098 Total acute care 10,027 379,934 1,885,154 1,788,171 Medical/surgical intensive care 632 11,655 70,375 129,232 Cardiac intensive care 105 4,102 19,658 31,676 Pediatric intensive care 20 1,185 5,561 5,555 Neonatal intensive care 217 1,928 41,446 48,373 Neonatal intermediate care 85 954 6,707 12,274 Burn care 0 0 0 0 Other special care 28 96 771 2,590 Other intensive care 116 4,775 26,174 23,718 Total intensive care 1,203 24,695 170,692 253,418 Rehabilitation 340 5,219 74,610 73,977 Chronic disease 0 0 0 0 Alcoholism & chemical dependency (adult) 269 3,776 22,847 22,885 Alcoholism & chemical dependency (pediatric) 52 129 1,452 1,317 Hospice 0 5 9 9 Other 0 0 0 0 Total other 661 9,129 98,918 98,188 Total hospital 11,891 413,758 2,154,764 2,139,777

-57-
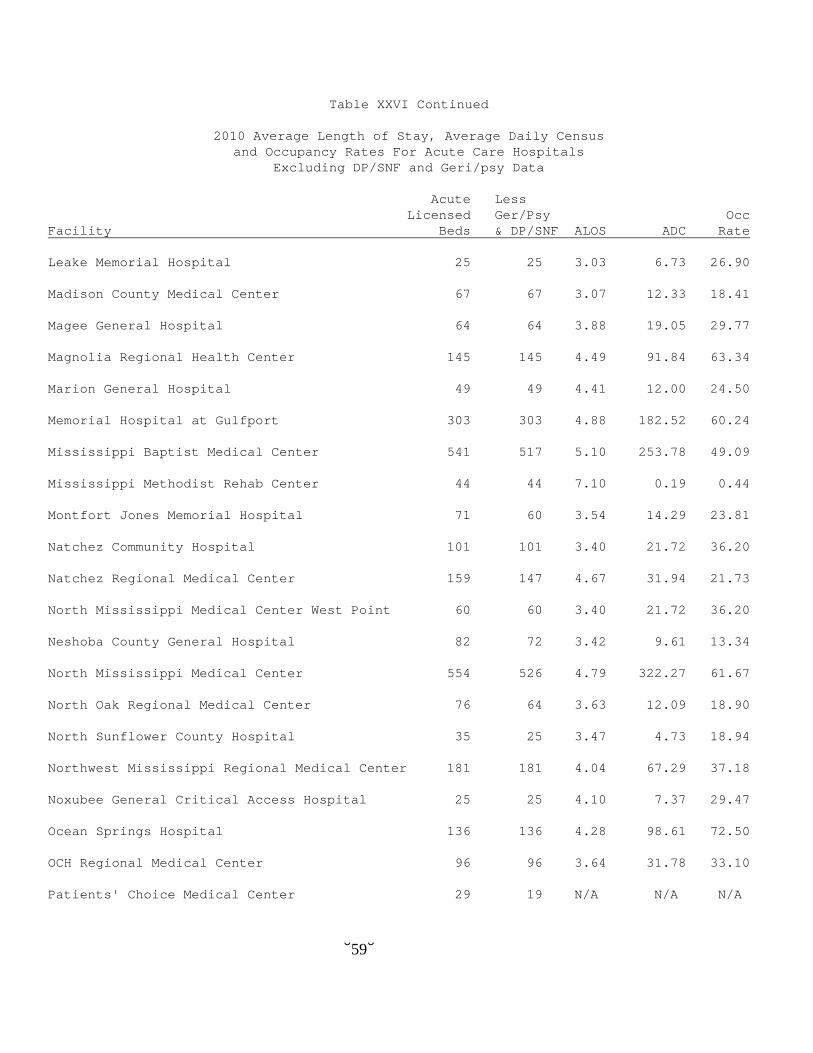
Table XXVI
2010 Average Length of Stay, Average Daily Census and Occupancy Rates For Acute Care Hospitals
Excluding DP/SNF and Geri/psy Data Acute Less Licensed Ger/Psy Occ Facility Beds DP/SNF ALOS ADC Rate Total 11,112 10,487 4.47 4,474.56 42.82 Alliance Health Center 88 76 13.28 7.77 8.83 Alliance Healthcare System 40 20 4.05 6.95 34.75 Anderson Regional Medical Center 260 260 5.27 136.81 52.62 Baptist Memorial Hospital Booneville 114 99 3.78 13.01 13.15 Baptist Memorial Hospital DeSoto 309 309 4.38 187.18 60.58 Baptist Memorial Hospital Golden Triangle 285 262 4.92 93.43 32.78 Baptist Memorial Hospital North Mississippi 204 204 4.58 105.99 51.95 Baptist Memorial Hospital Union County 153 153 3.47 38.38 25.08 Beacham Memorial Hospital 37 37 5.33 15.01 40.58 Biloxi Regional Medical Center 153 141 4.13 65.50 29.02 Bolivar Medical Center 165 153 3.97 44.41 29.02 Calhoun Health Services 30 21 3.81 4.72 22.47 Central Mississippi Medical Center 400 382 5.02 131.40 34.40 Choctaw County Hospital 25 25 3.00 0.01 0.03 Covington County Hospital 35 25 3.97 3.27 13.07 Crossgates River Oaks Hospital 134 119 4.66 57.63 51.46 Delta Regional Medical Center Main Campus 227 227 4.85 95.08 41.89 Delta Regional Medical Center West Campus 97 83 10.50 8.22 8.48 Field Memorial Community Hospital 25 25 3.63 7.28 29.13 Forrest General Hospital 400 400 4.48 262.98 65.75

-58-
Table XXVI Continued
2010 Average Length of Stay, Average Daily Census and Occupancy Rates For Acute Care Hospitals
Excluding DP/SNF and Geri/psy Data Acute Less Licensed Ger/Psy Occ Facility Beds & DP/SNF ALOS ADC Rate Franklin County Memorial Hospital 35 25 4.68 9.25 26.42 Garden Park Medical Center 130 118 3.96 40.54 34.36 George County Hospital 48 38 3.92 16.05 42.25 Gilmore Memorial Regional Medical Center 95 95 3.71 38.75 40.79 Greene County Hospital 3 3 2.87 0.24 8.13 Greenwood Leflore Hospital 188 157 4.04 76.81 48.92 Grenada Lake Medical Center 156 128 4.14 32.18 25.14 H.C. Watkins Memorial Hospital 25 25 4.11 5.90 23.61 Hancock Medical Center 47 47 3.23 21.85 46.48 Hardy Wilson Memorial Hospital 35 25 5.65 14.04 56.15 Highland Community Hospital 95 95 2.80 19.33 20.35 Holmes County Hospital & Clinics 25 25 2.93 3.11 12.45 Iuka Hospital 48 48 3.71 8.87 18.48 Jasper General Hospital 16 16 4.42 0.32 2.00 Jefferson County Hospital 30 12 3.94 5.67 47.26 Jeff Davis Community Hospital 35 25 3.57 3.53 14.10 Kilmichael Hospital 19 19 3.28 3.07 16.15 King's Daughters Hospital Yazoo County 35 25 3.87 11.02 44.08 King's Daughters Medical Center 122 122 3.41 34.09 27.94 Laird Hospital 25 25 3.00 7.41 29.65 Lawrence County Hospital 25 25 3.30 3.70 14.78
-59-
Table XXVI Continued
2010 Average Length of Stay, Average Daily Census and Occupancy Rates For Acute Care Hospitals
Excluding DP/SNF and Geri/psy Data Acute Less Licensed Ger/Psy Occ Facility Beds & DP/SNF ALOS ADC Rate Leake Memorial Hospital 25 25 3.03 6.73 26.90 Madison County Medical Center 67 67 3.07 12.33 18.41 Magee General Hospital 64 64 3.88 19.05 29.77 Magnolia Regional Health Center 145 145 4.49 91.84 63.34 Marion General Hospital 49 49 4.41 12.00 24.50 Memorial Hospital at Gulfport 303 303 4.88 182.52 60.24 Mississippi Baptist Medical Center 541 517 5.10 253.78 49.09 Mississippi Methodist Rehab Center 44 44 7.10 0.19 0.44 Montfort Jones Memorial Hospital 71 60 3.54 14.29 23.81 Natchez Community Hospital 101 101 3.40 21.72 36.20 Natchez Regional Medical Center 159 147 4.67 31.94 21.73 North Mississippi Medical Center West Point 60 60 3.40 21.72 36.20 Neshoba County General Hospital 82 72 3.42 9.61 13.34 North Mississippi Medical Center 554 526 4.79 322.27 61.67 North Oak Regional Medical Center 76 64 3.63 12.09 18.90 North Sunflower County Hospital 35 25 3.47 4.73 18.94 Northwest Mississippi Regional Medical Center 181 181 4.04 67.29 37.18 Noxubee General Critical Access Hospital 25 25 4.10 7.37 29.47 Ocean Springs Hospital 136 136 4.28 98.61 72.50 OCH Regional Medical Center 96 96 3.64 31.78 33.10 Patients' Choice Medical Center 29 19 N/A N/A N/A

-60-
Table XXVI Continued
2010 Average Length of Stay, Average Daily Census and Occupancy Rates For Acute Care Hospitals
Excluding DP/SNF and Geri/psy Data Acute Less Licensed Ger/Psy Occ Facility Beds & DP/SNF ALOS ADC Rate Patients' Choice Medical Center of Claiborne Co. 32 22 3.04 5.06 23.01 Patients' Choice Medical Center of Humphreys Co. 34 25 2.72 3.54 14.18 Pearl River County Hospital 24 24 6.17 1.21 5.05 Perry County General Hospital 22 22 3.32 1.85 8.39 Pioneer Community Hospital of Aberdeen 35 25 3.30 3.21 12.85 Pioneer Community Hospital of Newton 30 21 3.21 6.99 33.29 Pontotoc Health Services 25 25 3.64 4.34 17.36 Quitman County Hospital 33 25 3.38 6.67 26.67 Riley Hospital 120 120 4.56 33.35 27.79 River Oaks Hospital 160 160 3.76 73.25 45.78 River Region Health System 261 234 4.48 106.59 45.55 Rush Foundation Hospital 215 215 4.47 81.18 37.76 St. Dominic Jackson Memorial Hospital 417 417 4.50 297.88 71.43 S.E. Lackey Critical Access Hospital 35 25 2.44 9.49 37.95 Scott Regional Hospital 25 25 3.22 12.68 50.74 Sharkey-Issaquena Community Hospital 29 19 2.77 2.68 14.10 Simpson General Hospital 35 25 3.23 5.99 23.96 Singing River Hospital 385 385 3.82 94.83 24.63 South Central Regional Medical Center 275 257 4.54 92.52 36.00 South Sunflower County Hospital 49 49 2.92 13.95 28.47 Southwest Mississippi Regional Medical Center 160 160 4.00 74.32 46.45

-61-
Table XXVI Continued
2010 Average Length of Stay, Average Daily Census and Occupancy Rates For Acute Care Hospitals
Excluding DP/SNF and Geri/psy Data Acute Less Licensed Ger/Psy Occ Facility Beds & DP/SNF ALOS ADC Rate Stone County Hospital 25 25 2.80 2.46 9.84 Tallahatchie General Hospital 9 9 3.98 2.13 23.62 Tippah County Hospital 45 35 3.40 6.29 17.98 Trace Regional Hospital 84 66 31.88 7.65 11.60 Tri Lakes Medical Center 77 55 31.68 14.72 26.77 Tyler Holmes Memorial Hospital 25 25 3.39 4.95 19.79 University Hospital & Health System 644 644 6.32 442.02 68.64 Walthall General Hospital 25 25 3.84 6.30 25.18 Wayne General Hospital 80 80 4.26 27.50 34.38 Webster Health Services 38 38 4.84 18.37 48.35 Wesley Medical Center 211 187 4.28 113.43 60.66 Winston Medical Center 30 16 4.07 4.90 30.65 Woman's Hospital at River Oaks 111 111 3.61 23.87 21.51 Yalobusha General Hospital 26 26 2.84 5.77 22.20

-62-
Table XXVII
2010 Acute Care Licensed Bed Capacity and Beds Set Up and Staffed Excluding Long Term Care Hospitals, Geriatric Psychiatric and DP/SNF Beds
Acute Less DP/SNF Beds Set Up Facility LBC & Ger/Psy and Staffed Total 11,092 10,467 9,497 Alliance Health Center 88 76 68 Alliance Healthcare System 40 20 20 Anderson Regional Medical Center 260 260 260 Baptist Memorial Hospital Booneville 114 99 99 Baptist Memorial Hospital DeSoto 309 309 240 Baptist Memorial Hospital Golden Triangle 285 262 262 Baptist Memorial Hospital North Mississippi 204 204 204 Baptist Memorial Hospital Union County 153 153 153 Beacham Memorial Hospital 37 37 37 Biloxi Regional Medical Center 153 141 141 Bolivar Medical Center 165 153 82 Calhoun Health Services 30 21 21 Central Mississippi Medical Center 400 382 382 Choctaw County Hospital 25 25 25 Covington County Hospital 35 25 18 Crossgates River Oaks Hospital 134 119 119 Delta Regional Medical Center Main Campus 227 227 171 Delta Regional Medical Center West Campus 97 83 0 Field Memorial Community Hospital 25 25 25 Forrest General Hospital 400 400 400 Franklin County Memorial Hospital 35 25 24

-63-
Table XXVII Continued
2010 Acute Care Licensed Bed Capacity and Beds Set Up and Staffed Excluding Long Term Care Hospitals, Geriatric Psychiatric and DP/SNF Beds
Acute Less DP/SNF Beds Set Up Facility LBC & Ger/Psy and Staffed Garden Park Medical Center 130 118 118 George County Hospital 48 38 38 Gilmore Memorial Regional Medical Center 95 95 95 Greene County Hospital 3 3 3 Greenwood Leflore Hospital 188 157 145 Grenada Lake Medical Center 156 128 113 H.C. Watkins Memorial Hospital 25 25 25 Hancock Medical Center 47 47 47 Hardy Wilson Memorial Hospital 35 25 25 Highland Community Hospital 95 95 55 Holmes County Hospital & Clinics 25 25 25 Iuka Hospital 48 48 48 Jasper General Hospital 16 16 16 Jefferson County Hospital 30 12 12 Jeff Davis Community Hospital 35 25 25 Kilmichael Hospital 19 19 19 King's Daughters Hospital Yazoo County 35 25 25 King's Daughters Medical Center 122 122 91 Laird Hospital 25 25 25 Lawrence County Hospital 25 25 25 Leake Memorial Hospital 25 25 25 Madison County Medical Center 67 67 67

-64-
Table XXVII Continued
2010 Acute Care Licensed Bed Capacity and Beds Set Up and Staffed Excluding Long Term Care Hospitals, Geriatric Psychiatric and DP/SNF Beds
Acute Less DP/SNF Beds Set Up Facility LBC & Ger/Psy and Staffed Magee General Hospital 64 64 61 Magnolia Regional Health Center 145 145 145 Marion General Hospital 49 49 49 Memorial Hospital at Gulfport 303 303 303 Mississippi Baptist Medical Center 541 517 517 Mississippi Methodist Rehab Center 44 44 31 Montfort Jones Memorial Hospital 71 60 60 North Mississippi Medical Center West Point 60 60 60 Natchez Community Hospital 101 101 101 Natchez Regional Medical Center 159 147 123 Neshoba County General Hospital 82 72 48 North Mississippi Medical Center 554 526 526 North Oak Regional Medical Center 76 64 29 North Sunflower County Hospital 35 25 25 Northwest Mississippi Regional Medical Center 181 181 181 Noxubee General Critical Access Hospital 25 25 25 Ocean Springs Hospital 136 136 136 OCH Regional Medical Center 96 96 96 Patients' Choice Medical Center 29 19 19 Patients' Choice Medical Center of Claiborne Co. 32 22 18 Patients' Choice Medical Center of Humphreys Co. 34 25 25 Pearl River County Hospital 24 24 24

-65-
Table XXVII Continued
2010 Acute Care Licensed Bed Capacity and Beds Set Up and Staffed Excluding Long Term Care Hospitals, Geriatric Psychiatric and DP/SNF Beds
Acute Less DP/SNF Beds Set Up Facility LBC & Ger/Psy and Staffed Perry County General Hospital 22 22 22 Pioneer Community Hospital of Aberdeen 35 25 25 Pioneer Community Hospital of Newton 30 21 21 Pontotoc Health Services 25 25 25 Quitman County Hospital 33 25 25 Riley Hospital 120 120 120 River Oaks Hospital 160 160 158 River Region Health System 261 234 233 Rush Foundation Hospital 215 215 179 St. Dominic Jackson Memorial Hospital 417 417 405 S.E. Lackey Critical Access Hospital 35 25 25 Scott Regional Hospital 25 25 25 Sharkey-Issaquena Community Hospital 29 19 19 Simpson General Hospital 35 25 25 Singing River Hospital 385 385 199 South Central Regional Medical Center 275 257 166 South Sunflower County Hospital 49 49 49 Southwest Mississippi Regional Medical Center 160 160 143 Stone County Hospital 25 25 25 Tallahatchie General Hospital 9 9 9 Tippah County Hospital 45 35 35 Trace Regional Hospital 84 66 66

-66-
Table XXVII Continued
2010 Acute Care Licensed Bed Capacity and Beds Set Up and Staffed Excluding Long Term Care Hospitals, Geriatric Psychiatric and DP/SNF Beds
Acute Less DP/SNF Beds Set Up Facility LBC & Ger/Psy and Staffed Tri Lakes Medical Center 77 55 55 Tyler Holmes Memorial Hospital 25 25 25 University Hospital & Health System 644 644 566 Walthall General Hospital 25 25 25 Wayne General Hospital 80 80 80 Webster Health Services 38 38 38 Wesley Medical Center 211 187 187 Winston Medical Center 30 16 16 Woman's Hospital at River Oaks 111 111 60 Yalobusha General Hospital 26 26 26

-67-
2010 Obstetrical Utilization Number of Number of Occ Hospital County Deliveries OB Beds Rate Total 39,174 565 42.5 University Hospital & Health System Hinds 2,880 41 70.0 Forrest General Hospital Forrest 2,357 35 59.7 North Mississippi Medical Center Lee 2,254 64 32.0 Baptist Memorial Hospital DeSoto DeSoto 2,018 0 0.0 River Oaks Hospital Rankin 1,967 23 66.3 Wesley Medical Center Lamar 1,582 0 0.0 Woman's Hospital at River Oaks Rankin 1,537 18 10.6 Memorial Hospital at Gulfport Harrison 1,357 20 46.6 St. Dominic Jackson Memorial Hospital Hinds 1,272 0 0.0 Anderson Regional Medical Center Lauderdale 1,237 30 30.7 Baptist Memorial Hospital Union County Union 1,113 0 0.0 Mississippi Baptist Medical Center Hinds 1,045 40 23.5 Central Mississippi Medical Center Hinds 1,025 0 0.0 Northwest Mississippi Regional Medical Center Coahoma 976 11 90.2 Ocean Springs Hospital Jackson 960 9 53.6 South Central Regional Medical Center Jones 939 19 42.2 Southwest Mississippi Regional Medical Center Pike 938 9 116.5 OCH Regional Medical Center Oktibbeha 929 0 0.0 Baptist Memorial Hospital North Mississippi Lafayette 911 0 0.0 Baptist Memorial Hospital Golden Triangle Lowndes 907 17 60.6 Delta Regional Medical Center Main Campus Washington 893 15 58.6 Rush Foundation Hospital Lauderdale 881 18 41.3 River Region Health System Warren 780 28 30.7

-68-
2010 Obstetrical Utilization Continued
Number of Number of Occ Hospital County Deliveries OB Beds Rate Greenwood Leflore Hospital Leflore 757 16 40.6 Biloxi Regional Medical Center Harrison 746 17 51.7 Singing River Hospital Jackson 721 22 22.6 King's Daughters Medical Center Lincoln 640 0 0.0 Natchez Community Hospital Adams 548 0 0.0 Gilmore Memorial Regional Medical Center Monroe 536 15 25.8 Garden Park Medical Center Harrison 519 9 35.2 Magnolia Regional Health Center Alcorn 500 8 38.3 Natchez Regional Medical Center Adams 459 19 16.5 Grenada Lake Medical Center Grenada 451 0 0.0 Bolivar Medical Center Bolivar 412 17 50.3 Highland Community Hospital Pearl River 333 13 14.7 Riley Hospital Lauderdale 332 5 54.9 South Sunflower County Hospital Sunflower 261 0 0.0 Madison County Medical Center Madison 243 0 0.0 North Mississippi Medical Center West Point Clay 241 6 0.0 Wayne General Hospital Wayne 220 7 33.3 Hancock Medical Center Hancock 209 10 17.4 Tri Lakes Medical Center Panola 169 0 0.0 Magee General Hospital Simpson 104 4 14.5 Leake Memorial Hospital Leake 6 0 0.0 King's Daughters Hospital Yazoo County Yazoo 4 0 0.0 Laird Hospital Newton 2 0 0.0 Marion General Hospital Marion 2 0 0.0 Scott Regional Hospital Scott 1 0 0.0

-69-
2010 C-Sections Number of Percent of Hospital C-Sections Deliveries C-Sections Total 14,423 39,174 36.8 North Mississippi Medical Center West Point 175 241 72.6 Woman's Hospital at River Oaks 907 1,537 59.0 Mississippi Baptist Medical Center 499 1,045 47.8 King's Daughters Medical Center 305 640 47.7 Central Mississippi Medical Center 483 1,025 47.1 Grenada Lake Medical Center 205 451 45.5 South Sunflower County Hospital 116 261 44.4 Rush Foundation Hospital 384 881 43.6 Madison County Medical Center 105 243 43.2 River Oaks Hospital 833 1,967 42.3 St. Dominic Jackson Memorial Hospital 529 1,272 41.6 Wesley Medical Center 618 1,582 39.1 Anderson Regional Medical Center 468 1,237 37.8 University Hospital & Health System 1,083 2,880 37.6 Northwest Mississippi Regional Medical Center 367 976 37.6 Magee General Hospital 39 104 37.5 Bolivar Medical Center 154 412 37.4 Forrest General Hospital 876 2,357 37.2 Southwest Mississippi Regional Medical Center 346 938 36.9 Biloxi Regional Medical Center 272 746 36.5 Ocean Springs Hospital 349 960 36.4 Memorial Hospital at Gulfport 478 1,357 35.2 Tri Lakes Medical Center 59 169 34.9 Natchez Regional Medical Center 157 459 34.2

-70-
2010 C-Sections Continued Number of Percent of Hospital C-Sections Deliveries C-Sections Baptist Memorial Hospital DeSoto 686 2,018 34.0 Magnolia Regional Health Center 169 500 33.8 Natchez Community Hospital 178 548 32.5 Riley Hospital 108 332 32.5 Baptist Memorial Hospital Union County 360 1,113 32.3 Gilmore Memorial Regional Medical Center 172 536 32.1 North Mississippi Medical Center 721 2,254 32.0 South Central Regional Medical Center 298 939 31.7 Baptist Memorial Hospital North Mississippi 288 911 31.6 Singing River Hospital 217 721 30.1 Garden Park Medical Center 153 519 29.5 Highland Community Hospital 97 333 29.1 River Region Health System 218 780 27.9 Wayne General Hospital 60 220 27.3 Greenwood Leflore Hospital 205 757 27.1 Baptist Memorial Hospital Golden Triangle 225 907 24.8 Hancock Medical Center 51 209 24.4 Delta Regional Medical Center Main Campus 208 893 23.3 Oktibbeha County Hospital 202 929 21.7 Leake Memorial Hospital 0 6 0.0 King's Daughters Hospital Yazoo County 0 4 0.0 Laird Hospital 0 2 0.0 Marion General Hospital 0 2 0.0 Scott Regional Hospital 0 1 0.0

-71-
Licensed Hospital Beds for 1980, 1990, 2000 and 2010 by County 1980 1990 2000 2010 Hospital LBC LBC LBC LBC Total 15,373 15,308 15,240 15,032 Adams County 374 306 306 280 Natchez Community Hospital 101 101 101 101 Natchez Regional Medical Center 205 205 205 179 Natchez Charity Hospital 68 Alcorn County Magnolia Regional Health Center 121 178 164 164 Attala County Montfort Jones Memorial Hospital 78 78 72 71 Bolivar County 222 188 Bolivar Medical Center 165 165 165 165 Shelby Community Hospital 23 23 Mound Bayou Hospital 34 Calhoun County 80 79 Calhoun Health Services 30 30 30 30 Community Hospital of Calhoun 50 49 Chickasaw County 118 94 94 Okolona Community Hospital 34 10 10 Trace Regional Hospital 84 84 84 84 Choctaw County Choctaw County Hospital 28 28 17 25 Claiborne County Patients' Choice Medical Center of Claiborne County 32 32 32 32 Clarke County H.C. Watkins Memorial Hospital 50 32 32 25 Clay County North Mississippi Medical Center West Point 67 60 60 60 Coahoma County Northwest Mississippi Regional Medical Center 194 194 175 195 Copiah County Hardy Wilson Memorial Hospital 59 49 49 35 Covington County Covington County Hospital 83 82 82 35 DeSoto County 190 206 427 Baptist Memorial Hospital DeSoto 130 140 339 Parkwood Behavioral Health System 60 66 88

-72-
Licensed Hospital Beds for 1980, 1990, 2000 and 2010 by County 1980 1990 2000 2010 Hospital LBC LBC LBC LBC Forrest County 545 Forrest General Hospital 429 503 537 512 Regency Hospital of Southern Mississippi 33 Franklin County Franklin County Memorial Hospital 60 53 49 35 George County George County Hospital 64 57 53 48 Greene County Greene County Hospital 40 10 3 Grenada County Grenada Lake Medical Center 100 156 156 156 Hancock County Hancock Medical Center 56 60 104 47 Harrison County 737 854 977 834 Bienville Recovery Center 30 Biloxi Regional Medical Center 200 153 153 198 Cpc Sand Hill Hospital 60 Garden Park Medical Center 114 120 130 130 Gulf Coast Medical Center 144 144 189 Gulf Oaks Hospital 45 Memorial Hospital at Gulfport 271 302 425 445 Select Specialty Hosp Biloxi 42 Select Specialty Hospital Gulf Coast 38 61 Eye, Ear, Nose & Throat Hospital 8 Hinds County 2,109 2,432 2,497 2,562 Central Mississippi Medical Center 334 474 473 429 Doctors Hospital 162 Jackson Recovery Center 40 Mississippi Baptist Medical Center 606 646 639 638 Mississippi Hospital for Restorative Care 25 25 Mississippi Methodist Rehab Center 60 124 124 124 Regency Hospital of Jackson 36 St. Dominic Jackson Memorial Hospital 409 409 571 535 Select Specialty Hospital Jackson 53 University Hospital & Health System 538 577 665 722 Doctor's Hospital 162 Holmes County 79 113 113 Holmes County Hospital & Clinics 29 29 29 25 University Hospital & Clinics Holmes County 50 84 84 Humphreys County 53 Patients' Choice Medical Center of Humphreys County 35 28 28 34 Belzoni Hospital 18

-73-
Licensed Hospital Beds for 1980, 1990, 2000 and 2010 by County 1980 1990 2000 2010 Hospital LBC LBC LBC LBC Itawamba County Itawamba Health Services 68 62 Jackson County 539 551 571 Ocean Springs Hospital 124 124 136 Singing River Hospital 521 415 427 435 Jasper County Jasper General Hospital 66 33 16 16 Jefferson County Jefferson County Hospital 30 30 30 30 Jeff Davis County Jeff Davis Community Hospital 41 41 41 35 Jones County 389 South Central Regional Medical Center 226 275 285 285 Ellisville Municipal Hospital 17 Laurel General Hospital 51 South Mississippi State Hospital 95 Kemper County Kemper County Hospital/Nursing Facility 35 26 Lafayette County Baptist Memorial Hospital North Mississippi 150 150 204 217 Lamar County 166 224 261 261 Lumberton Citizens Hospital 26 23 South Mississippi State Hospital 50 50 Wesley Medical Center 140 201 211 211 Lauderdale County 1,359 1,151 1,220 1,267 Alliance Health Center 66 109 154 Anderson Regional Medical Center 244 260 260 260 East Mississippi State Hospital 483 450 407 409 Regency Hospital of Meridian 40 Riley Hospital 168 170 180 140 Rush Foundation Hospital 192 205 215 215 Specialty Hospital of Meridian 49 49 Matty Hersee Hospital 88 Meridian Regional Hospital 154 Pine Forrest Sanitorium 30 Lawrence County Lawrence County Hospital 64 53 53 25

-74-
Licensed Hospital Beds for 1980, 1990, 2000 and 2010 by County 1980 1990 2000 2010 Hospital LBC LBC LBC LBC Leake County 57 54 Leake Memorial Hospital 35 32 32 25 Thaggard Hospital 22 22 Lee County 688 700 700 North Mississippi Medical Center 600 647 650 650 North Mississippi Medical Center Baldwyn 41 North Mississippi State Hospital 50 50 Leflore County 248 Greenwood Leflore Hospital 230 260 260 208 Long Term Actue Hospital of Greenwood 40 Lincoln County King's Daughters Medical Center 135 122 122 122 Lowndes County 235 Baptist Memorial Hospital Golden Triangle 177 326 328 328 Columbus Hospital 58 Madison County Madison County Medical Center 67 67 67 67 Marion County Marion General Hospital 78 90 79 49 Marshall County Alliance Healthcare System 60 40 40 40 Monroe County 189 144 144 130 Gilmore Memorial Regional Medical Center 105 95 95 95 Pioneer Community Hospital of Aberdeen 84 49 49 35 Montgomery County 89 68 68 44 Kilmichael Hospital 19 19 19 19 Tyler Holmes Memorial Hospital 70 49 49 25 Neshoba County Neshoba County General Hospital 82 82 82 82 Newton County 92 89 99 55 Laird Hospital 41 50 50 25 Pioneer Community Hospital of Newton 51 39 49 30 Noxubee County Noxubee General Critical Access Hospital 51 49 49 25 Oktibbeha County 109 OCH Regional Medical Center 96 96 96 96 Tom Bailey Memorial Hospital 13

-75-
Licensed Hospital Beds for 1980, 1990, 2000 and 2010 by County 1980 1990 2000 2010 Hospital LBC LBC LBC LBC Panola County 120 Tri Lakes Medical Center 70 70 70 112 South Panola Community Hospital 50 Pearl River County 128 125 119 119 Highland Community Hospital 98 95 95 95 Pearl River County Hospital 30 30 24 24 Perry County Perry County General Hospital 44 22 22 22 Pike County 197 197 197 197 Beacham Memorial Hospital 37 37 37 37 Southwest Mississippi Regional Medical Center 160 160 160 160 Pontotoc County Pontotoc Health Services 88 59 58 25 Prentiss County Baptist Memorial Hospital Booneville 136 121 114 114 Quitman County Quitman County Hospital 36 36 36 33 Rankin County 2,176 2,101 1,937 2,094 Brentwood Behavioral Healthcare of Mississippi 107 Charter Hospital of Jackson 111 Crossgates River Oaks Hospital 94 90 134 134 Mississippi State Hospital 1,915 1,646 1,479 1,479 Oak Circle Center 60 60 River Oaks Hospital 100 110 160 Whitfield Med/Surg Hospital 43 43 43 Woman's Hospital at River Oaks 111 111 111 111 Riverside Hospital 56 Scott County 79 55 60 S.E. Lackey Critical Access Hospital 48 44 25 35 Scott Regional Hospital 31 30 25 Sharkey County Sharkey-Issaquena Community Hospital 29 29 29 29 Simpson County 114 113 113 99 Magee General Hospital 64 64 64 64 Simpson General Hospital 50 49 49 35 Smith County Patients' Choice Medical Center 30 29
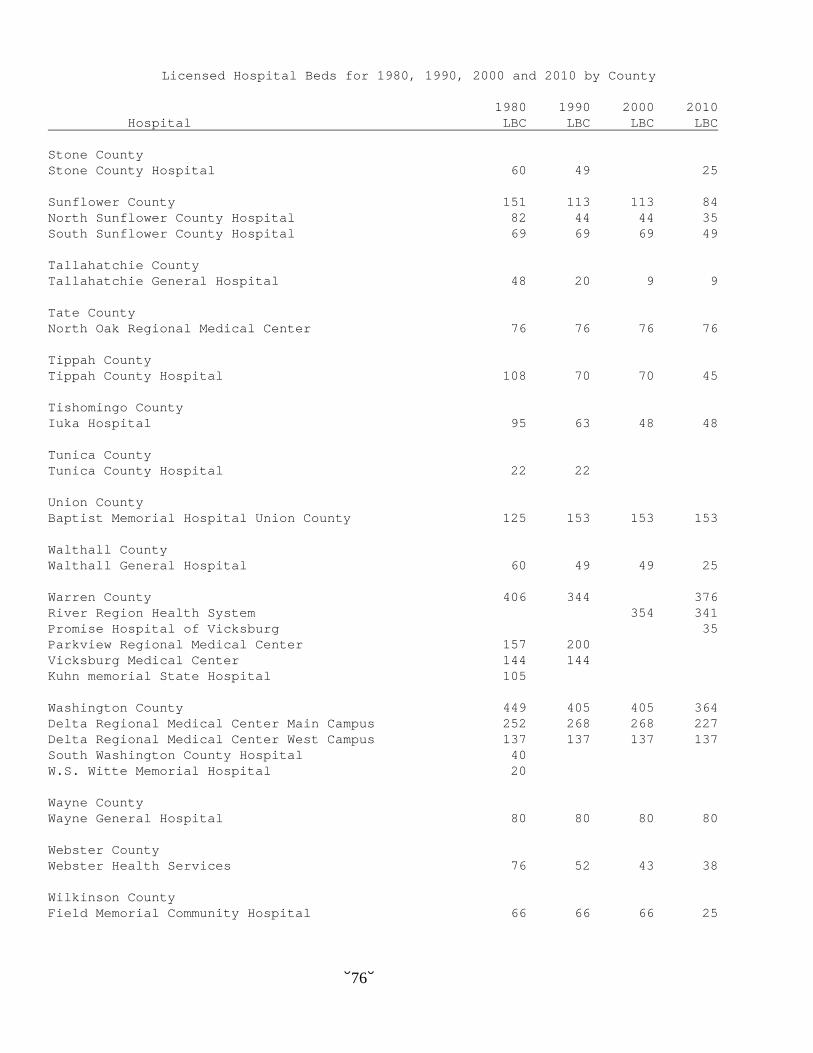
-76-
Licensed Hospital Beds for 1980, 1990, 2000 and 2010 by County 1980 1990 2000 2010 Hospital LBC LBC LBC LBC Stone County Stone County Hospital 60 49 25 Sunflower County 151 113 113 84 North Sunflower County Hospital 82 44 44 35 South Sunflower County Hospital 69 69 69 49 Tallahatchie County Tallahatchie General Hospital 48 20 9 9 Tate County North Oak Regional Medical Center 76 76 76 76 Tippah County Tippah County Hospital 108 70 70 45 Tishomingo County Iuka Hospital 95 63 48 48 Tunica County Tunica County Hospital 22 22 Union County Baptist Memorial Hospital Union County 125 153 153 153 Walthall County Walthall General Hospital 60 49 49 25 Warren County 406 344 376 River Region Health System 354 341 Promise Hospital of Vicksburg 35 Parkview Regional Medical Center 157 200 Vicksburg Medical Center 144 144 Kuhn memorial State Hospital 105 Washington County 449 405 405 364 Delta Regional Medical Center Main Campus 252 268 268 227 Delta Regional Medical Center West Campus 137 137 137 137 South Washington County Hospital 40 W.S. Witte Memorial Hospital 20 Wayne County Wayne General Hospital 80 80 80 80 Webster County Webster Health Services 76 52 43 38 Wilkinson County Field Memorial Community Hospital 66 66 66 25
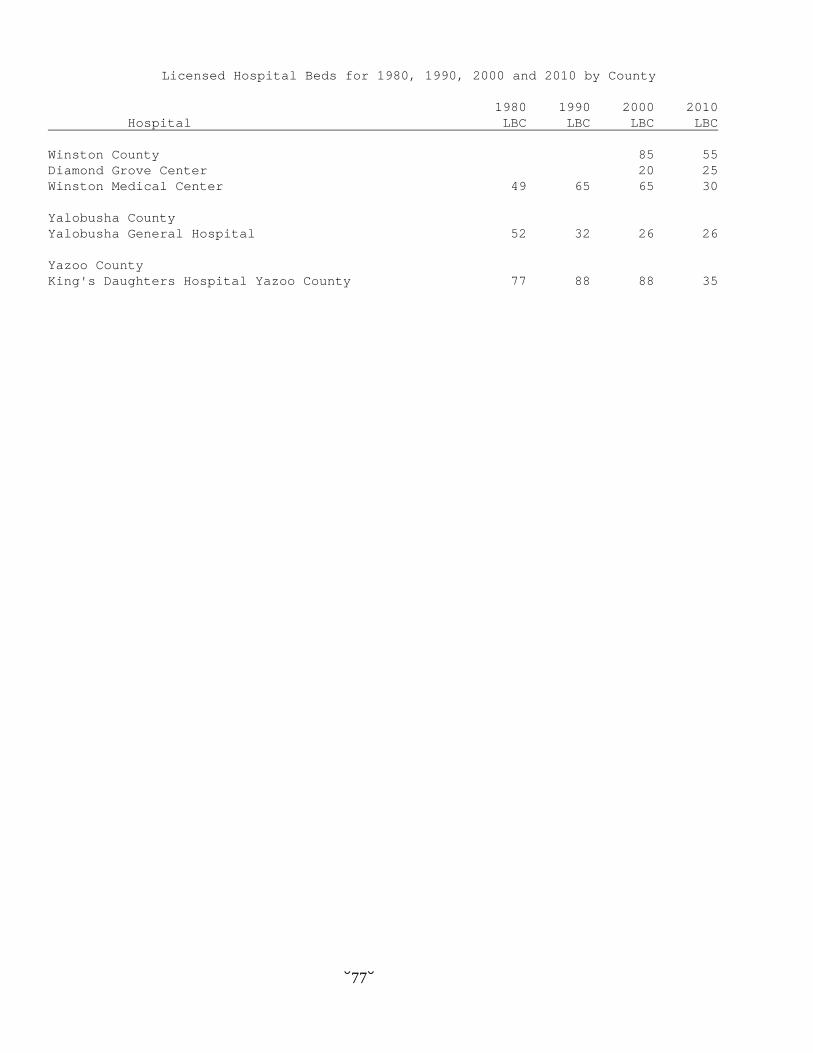
-77-
Licensed Hospital Beds for 1980, 1990, 2000 and 2010 by County 1980 1990 2000 2010 Hospital LBC LBC LBC LBC Winston County 85 55 Diamond Grove Center 20 25 Winston Medical Center 49 65 65 30 Yalobusha County Yalobusha General Hospital 52 32 26 26 Yazoo County King's Daughters Hospital Yazoo County 77 88 88 35

-78-
2010 Licensed Beds by Hospital Licensed Acute Psy Rehab CDU Hospital Beds Beds Beds Beds Beds Total 15,032 11,516 2,667 353 494 Alliance Health Center 154 88 58 0 8 Alliance Healthcare System 40 40 0 0 0 Anderson Regional Medical Center 260 260 0 0 0 Baptist Memorial Hospital Booneville 114 114 0 0 0 Baptist Memorial Hospital Golden Triangle 328 285 22 0 21 Baptist Memorial Hospital North Mississippi 217 204 0 13 0 Baptist Memorial Hospital Union County 153 153 0 0 0 Baptist Memorial Hospital DeSoto 339 309 0 30 0 Beacham Memorial Hospital 37 37 0 0 0 Biloxi Regional Medical Center 198 153 45 0 0 Bolivar Medical Center 165 165 0 0 0 Brentwood Behavioral Healthcare of Mississippi 107 0 107 0 0 Calhoun Health Services 30 30 0 0 0 Central Mississippi Medical Center 429 400 29 0 0 Choctaw County Hospital 25 25 0 0 0 Covington County Hospital 35 35 0 0 0 Crossgates River Oaks Hospital 134 134 0 0 0 Delta Regional Medical Center Main Campus 227 227 0 0 0 Delta Regional Medical Center West Campus 137 97 9 24 7 Diamond Grove Center 25 0 25 0 0 East Mississippi State Hospital 409 0 372 0 35 Field Memorial Community Hospital 25 25 0 0 0 Forrest General Hospital 512 400 56 24 32

-79-
2010 Licensed Beds by Hospital Continued Licensed Acute Psy Rehab CDU Hospital Beds Beds Beds Beds Beds Franklin County Memorial Hospital 35 35 0 0 0 Garden Park Medical Center 130 130 0 0 0 George County Hospital 48 48 0 0 0 Gilmore Memorial Regional Medical Center 95 95 0 0 0 Greene County Hospital 3 3 0 0 0 Greenwood Leflore Hospital 208 188 0 20 0 Grenada Lake Medical Center 156 156 0 0 0 H.C. Watkins Memorial Hospital 25 25 0 0 0 Hancock Medical Center 47 47 0 0 0 Hardy Wilson Memorial Hospital 35 35 0 0 0 Highland Community Hospital 95 95 0 0 0 Holmes County Hospital & Clinics 25 25 0 0 0 Iuka Hospital 48 48 0 0 0 Jasper General Hospital 16 16 0 0 0 Jefferson County Hospital 30 30 0 0 0 Jeff Davis Community Hospital 35 35 0 0 0 Kilmichael Hospital 19 19 0 0 0 King=s Daughters Hospital Yazoo County 35 35 0 0 0 King=s Daughters Medical Center 122 122 0 0 0 Laird Hospital 25 25 0 0 0 Lawrence County Hospital 25 25 0 0 0 Leake Memorial Hospital 25 25 0 0 0 Long Term Actue Hospital of Greenwood 40 40 0 0 0 Madison County Medical Center 67 67 0 0 0
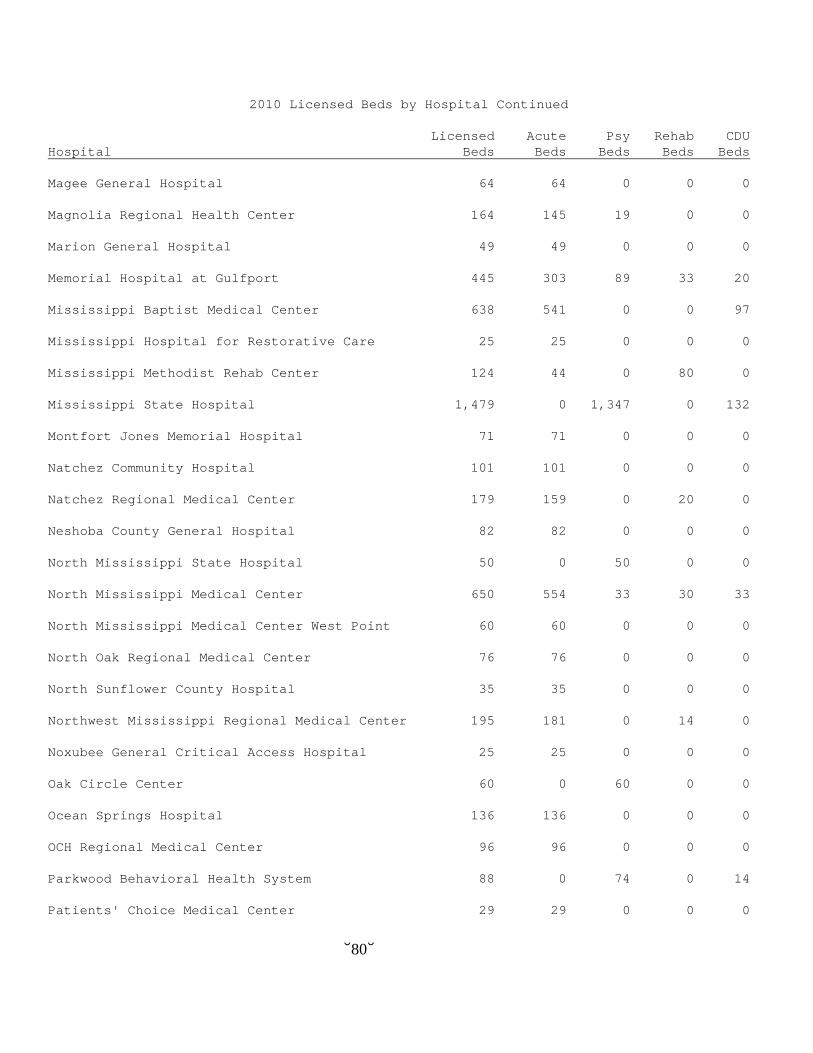
-80-
2010 Licensed Beds by Hospital Continued Licensed Acute Psy Rehab CDU Hospital Beds Beds Beds Beds Beds Magee General Hospital 64 64 0 0 0 Magnolia Regional Health Center 164 145 19 0 0 Marion General Hospital 49 49 0 0 0 Memorial Hospital at Gulfport 445 303 89 33 20 Mississippi Baptist Medical Center 638 541 0 0 97 Mississippi Hospital for Restorative Care 25 25 0 0 0 Mississippi Methodist Rehab Center 124 44 0 80 0 Mississippi State Hospital 1,479 0 1,347 0 132 Montfort Jones Memorial Hospital 71 71 0 0 0 Natchez Community Hospital 101 101 0 0 0 Natchez Regional Medical Center 179 159 0 20 0 Neshoba County General Hospital 82 82 0 0 0 North Mississippi State Hospital 50 0 50 0 0 North Mississippi Medical Center 650 554 33 30 33 North Mississippi Medical Center West Point 60 60 0 0 0 North Oak Regional Medical Center 76 76 0 0 0 North Sunflower County Hospital 35 35 0 0 0 Northwest Mississippi Regional Medical Center 195 181 0 14 0 Noxubee General Critical Access Hospital 25 25 0 0 0 Oak Circle Center 60 0 60 0 0 Ocean Springs Hospital 136 136 0 0 0 OCH Regional Medical Center 96 96 0 0 0 Parkwood Behavioral Health System 88 0 74 0 14 Patients' Choice Medical Center 29 29 0 0 0

-81-
2010 Licensed Beds by Hospital Continued Licensed Acute Psy Rehab CDU Hospital Beds Beds Beds Beds Beds Patients' Choice Medical Center of Claiborne County 32 32 0 0 0 Patients' Choice Medical Center of Humphreys County 34 34 0 0 0 Pearl River County Hospital 24 24 0 0 0 Perry County General Hospital 22 22 0 0 0 Pioneer Community Hospital of Aberdeen 35 35 0 0 0 Pioneer Community Hospital of Newton 30 30 0 0 0 Pontotoc Health Services 25 25 0 0 0 Promise Hospital of Vicksburg 35 35 0 0 0 Quitman County Hospital 33 33 0 0 0 Regency Hospital of Jackson 36 36 0 0 0 Regency Hospital of Meridian 40 40 0 0 0 Regency Hospital of Southern Mississippi 33 33 0 0 0 Riley Hospital 140 120 0 20 0 River Oaks Hospital 160 160 0 0 0 River Region Health System 341 261 40 0 40 Rush Foundation Hospital 215 215 0 0 0 S.E. Lackey Critical Access Hospital 35 35 0 0 0 Scott Regional Hospital 25 25 0 0 0 Select Specialty Hospital Gulf Coast 61 61 0 0 0 Select Specialty Hospital Jackson 53 53 0 0 0 Sharkey-Issaquena Community Hospital 29 29 0 0 0 Simpson General Hospital 35 35 0 0 0 Singing River Hospital 435 385 30 20 0 South Central Regional Medical Center 285 275 0 0 10

-82-
2010 Licensed Beds by Hospital Continued Licensed Acute Psy Rehab CDU Hospital Beds Beds Beds Beds Beds South Mississippi State Hospital 50 0 50 0 0 South Sunflower County Hospital 49 49 0 0 0 Southwest Mississippi Regional Medical Center 160 160 0 0 0 Specialty Hospital of Meridian 49 49 0 0 0 St. Dominic Jackson Memorial Hospital 535 417 83 0 35 Stone County Hospital 25 25 0 0 0 Tallahatchie General Hospital 9 9 0 0 0 Tippah County Hospital 45 45 0 0 0 Trace Regional Hospital 84 84 0 0 0 Tri Lakes Medical Center 112 77 25 0 10 Tyler Holmes Memorial Hospital 25 25 0 0 0 Univ Hospital & Health System 722 664 33 25 0 Walthall General Hospital 25 25 0 0 0 Wayne General Hospital 80 80 0 0 0 Webster Health Services 38 38 0 0 0 Wesley Medical Center 211 211 0 0 0 Whitfield Med/Surg Hospital 43 32 11 0 0 Winston Medical Center 30 30 0 0 0 Woman's Hospital at River Oaks 111 111 0 0 0 Yalobusha General Hospital 26 26 0 0 0

-83-
2010 State Owned Licensed Beds by Hospital Licensed Acute Psy CDU Hospital Beds Beds Beds Beds Total 2,091 32 1,890 167 East Mississippi State Hospital 409 0 372 35 Mississippi State Hospital 1,479 0 1,347 132 North Mississippi State Hospital 50 0 50 0 Oak Circle Center 60 0 60 0 South Mississippi State Hospital 50 0 50 0 Whitfield Med/Surg Hospital 43 32 11 0
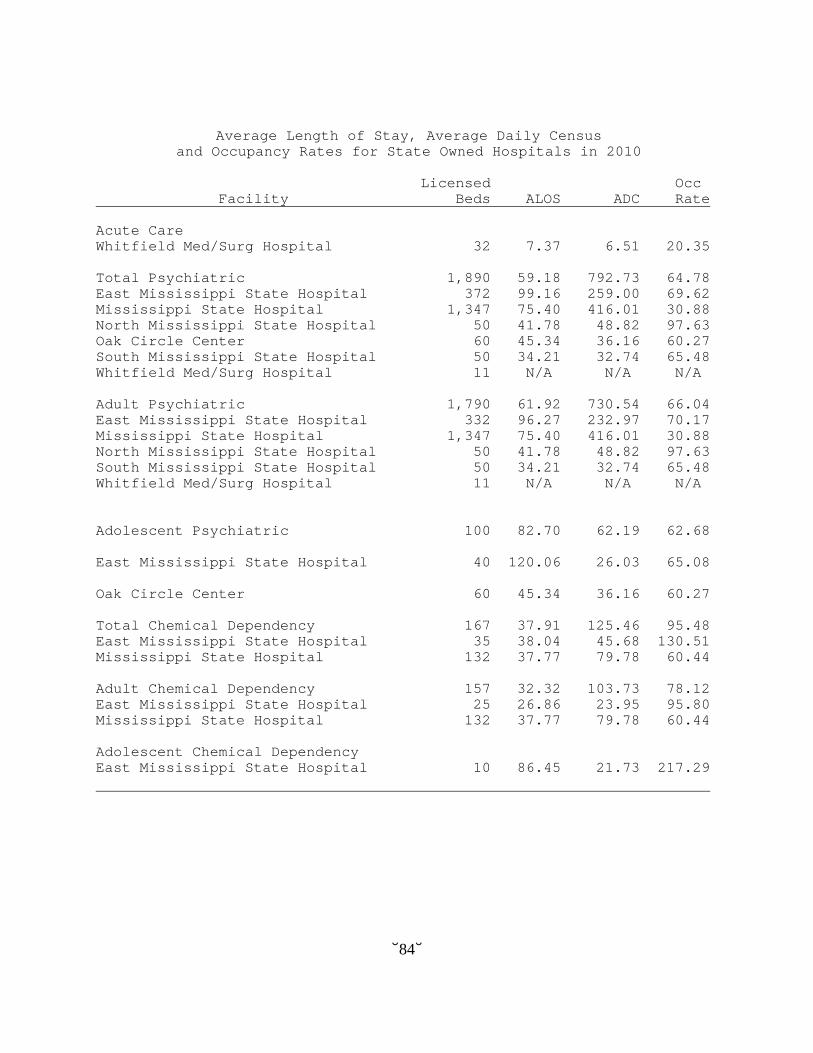
-84-
Average Length of Stay, Average Daily Census and Occupancy Rates for State Owned Hospitals in 2010
Licensed Occ Facility Beds ALOS ADC Rate Acute Care Whitfield Med/Surg Hospital 32 7.37 6.51 20.35 Total Psychiatric 1,890 59.18 792.73 64.78 East Mississippi State Hospital 372 99.16 259.00 69.62 Mississippi State Hospital 1,347 75.40 416.01 30.88 North Mississippi State Hospital 50 41.78 48.82 97.63 Oak Circle Center 60 45.34 36.16 60.27 South Mississippi State Hospital 50 34.21 32.74 65.48 Whitfield Med/Surg Hospital 11 N/A N/A N/A Adult Psychiatric 1,790 61.92 730.54 66.04 East Mississippi State Hospital 332 96.27 232.97 70.17 Mississippi State Hospital 1,347 75.40 416.01 30.88 North Mississippi State Hospital 50 41.78 48.82 97.63 South Mississippi State Hospital 50 34.21 32.74 65.48 Whitfield Med/Surg Hospital 11 N/A N/A N/A
Adolescent Psychiatric 100 82.70 62.19 62.68 East Mississippi State Hospital 40 120.06 26.03 65.08 Oak Circle Center 60 45.34 36.16 60.27 Total Chemical Dependency 167 37.91 125.46 95.48 East Mississippi State Hospital 35 38.04 45.68 130.51 Mississippi State Hospital 132 37.77 79.78 60.44 Adult Chemical Dependency 157 32.32 103.73 78.12 East Mississippi State Hospital 25 26.86 23.95 95.80 Mississippi State Hospital 132 37.77 79.78 60.44 Adolescent Chemical Dependency East Mississippi State Hospital 10 86.45 21.73 217.29
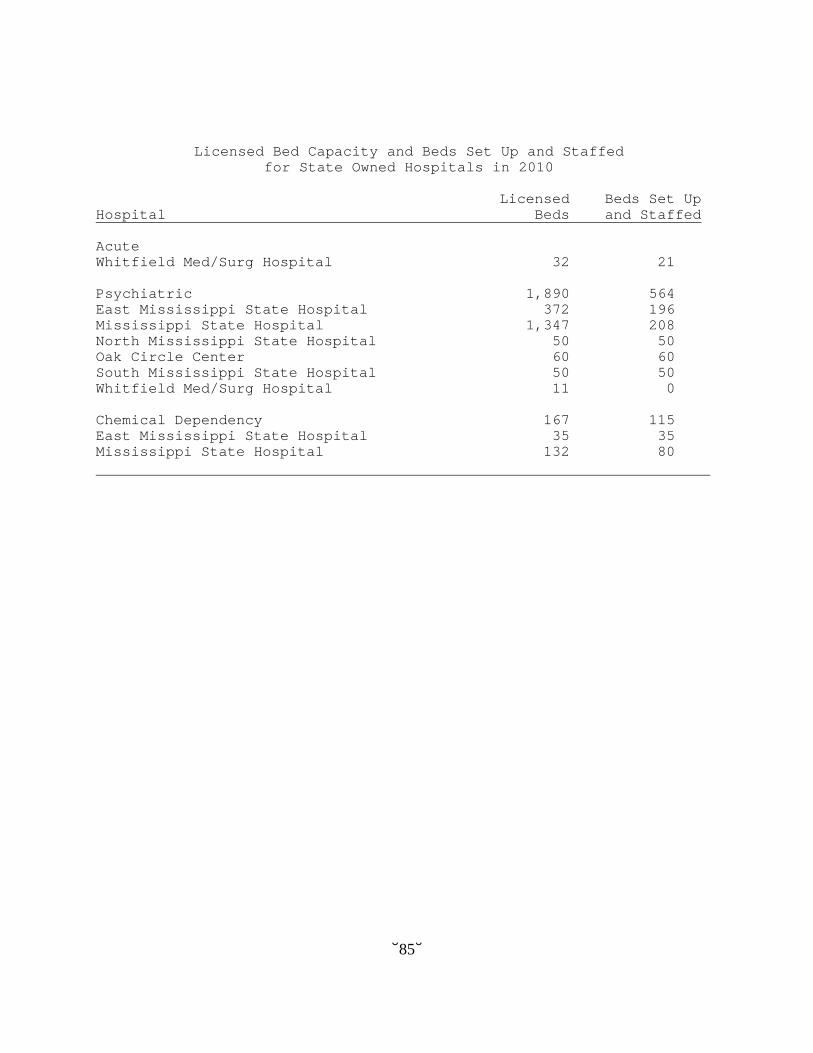
-85-
Licensed Bed Capacity and Beds Set Up and Staffed for State Owned Hospitals in 2010
Licensed Beds Set Up Hospital Beds and Staffed Acute Whitfield Med/Surg Hospital 32 21 Psychiatric 1,890 564 East Mississippi State Hospital 372 196 Mississippi State Hospital 1,347 208 North Mississippi State Hospital 50 50 Oak Circle Center 60 60 South Mississippi State Hospital 50 50 Whitfield Med/Surg Hospital 11 0 Chemical Dependency 167 115 East Mississippi State Hospital 35 35 Mississippi State Hospital 132 80

-86-
Beds Set Up, Discharges, Discharge Days and Inpatient Days Reported in 2010 by State Facilities
Beds Discharge Inpatient Service Area Set Up Discharges Days Days General medical and surgical (adult) 21 340 2,505 2,377 General medical and surgical (pediatric) 0 0 0 0 Psychiatric acute (adult) 464 2,515 110,031 136,282 Psychiatric acute (pediatric) 100 382 23,747 22,700 Obstetrics 0 0 0 0 Orthopedic 0 0 0 0 Other acute 133 90 22,970 45,360 DPSNF 0 0 0 0 Geriatric psychiatric DP 0 0 0 0 Total acute care 718 3,327 159,253 206,719 Medical/surgical intensive care 0 0 0 0 Cardiac intensive care 0 0 0 0 Pediatric intensive care 0 0 0 0 Neonatal intensive care 0 0 0 0 Neonatal intermediate care 0 0 0 0 Burn care 0 0 0 0 Other special care 0 0 0 0 Other intensive care 0 0 0 0 Total intensive care 0 0 0 0 Rehabilitation 0 0 0 0 Chronic disease 201 89 105,559 85,006 Alcoholism & chemical dependency (adult) 105 1,134 39,386 37,862 Alcoholism & chemical dependency (pediatric) 10 73 6,311 7,931 Hospice 0 0 0 0 Other 0 0 0 0 Total other 316 1,296 151,256 130,799 Total hospital 1,034 4,623 310,509 337,518 Psychiatric long term care (adult) 0 0 0 0 Psychiatric long term care (pediatric) 0 0 0 0 Mental retardation 0 0 0 0 Sheltered care 0 0 0 0 Self care 0 0 0 0 Skilled nursing long term care 418 81 105,031 148,552 Other long term care (include ICF) 0 0 0 0 Other subacute care 0 0 0 0 Total subacute 418 81 105,031 148,552 Total facility 1,452 4,704 415,540 486,070
-87-
Hospitals as of January 1, 2011
These are Medical-Surgical Hospitals unless otherwise specified.
Hospital, Address, Telephone Number, Fax Number, Licensed Beds, License Number, Accreditations & Certifications Adams County
Natchez Community Hospital 129 Jefferson Davis Boulevard P. O. Box 1203 Natchez, Mississippi 39120 Donald R Rentfro, Administrator Telephone: 601-445-6205 Fax: 601-445-6233 Licensed Beds: 101 License #12-271 Accred/Cert: 1-2-3-4 www.natchezcommunityhospital.com Natchez Regional Medical Center 54 Seargent S. Prentiss Drive P. O. Box 1488 Natchez, Mississippi 39120 William Heburn, Administrator Telephone: 601-443-2100 Fax: 601-445-0362 Licensed Beds: 179 159 Acute 20 Rehabilitation 12 Geriatric Psychiatric License #11-220 Accred/Cert: 1-2-3-4 www.natchezregional.com Alcorn County Magnolia Regional Health Center 611 Alcorn Drive Corinth, Mississippi 38834 Rick Napper, Administrator Telephone: 662-293-1000 Fax: 662-293-4255 Licensed Beds: 164 145 Acute 19 Adult Psychiatric Beds License #11-248 Accred/Cert: 1-2-3-4 www. mrhc.org
Attala County
Montfort Jones Memorial Hospital 220 Highway 12 West P. O. Box 887 Kosciusko, Mississippi 39090 John Dawson, Administrator Telephone: 662-289-4311 Fax: 662-289-6080 Licensed Beds: 71 11 Geriatric Psychiatric License #11-008 Accred/Cert: 2-3-4 www.mjmh.com Bolivar County Bolivar Medical Center 901 East Sunflower Road P. O. Box 1380 Cleveland, Mississippi 38732 Wes Sigler, Administrator Telephone: 662-846-0061 Fax: 662-846-2380 Licensed Beds: 165 12 DPSNF License #16-224 Accred/Cert: 1-2-3-4 www.bolivarmedical.com Calhoun County Calhoun Health Services 140 Burke/Calhoun City Road Calhoun City, Mississippi 38916 James P. Franklin, Administrator Telephone: 662-628-6611 Fax: 662-628-6300 Licensed Beds: 30 9 Geriatric Psychiatric License #11-259 Accred/Cert: 2-3-4

-88-
Chickasaw County Trace Regional Hospital Highway 8 East (1002 E Madison) P. O. Box 626 Houston, Mississippi 38851 Gary L. Staten, Administrator Telephone: 662-456-3700 Fax: 662-456-5417 Licensed Beds: 84 18 Geriatric Psychiatric License #12-296 Accred/Cert: 1-2-3-4 www.traceregional.com Choctaw County Choctaw County Hospital 311 West Cherry Street P. O. Box 1039 Ackerman, Mississippi 39735 Steve Fontaine, Administrator Telephone: 662-285-6235 Fax: 662-285-9933 Licensed Beds: 25 License #11-191 Accred/Cert: 2-3-4 Critical Access Hospital Claiborne County Patients= Choice Medical Center of Claiborne County 123 McComb Avenue P. O. Drawer 1004 Port Gibson, Mississippi 39150 Tim Cockrell, Administrator Telephone: 601-437-5141 Fax: 601-437-5145 Licensed Beds: 32 10 Geriatric Psychiatric License #26-276 Accred/Cert: 2-3-4 Critical Access Hospital
Clarke County H. C. Watkins Memorial Hospital 605 South Archusa Avenue Quitman, Mississippi 39355 Clinton Eaves, Administrator Telephone: 601-776-6925 Fax: 601-776-7147 Licensed Beds: 25 License #13-282 Accred/Cert: 2-3-4 www.watkinshospital.org Critical Access Hospital Clay County North Miss. Medical Center West Point 835 Medical Center Drive West Point Mississippi 39773 Bob Jones, Administrator Telephone: 662-495-2300 Fax: 662-495-2361 Licensed Beds: 60 License #13-312 Accred/Cert: 1-2-3-4 www.nmhs.net/westpoint Coahoma County Northwest Miss. Regional Medical Ctr 1970 Hospital Drive P. O. Box 1218 Clarksdale, Mississippi 38614 Joan Strayham, Administrator Telephone: 662-627-3211 Fax: 662-627-5440 Licensed Beds: 195 181 Acute 14 Rehab License #16-035 Accred/Cert: 1-2-3-4 www.northwestregional.com

-89-
Copiah County Hardy Wilson Memorial Hospital 233 Magnolia Street P. O. Box 889 Hazlehurst, Mississippi 39083 Larry Walker, Administrator Telephone: 601-894-4541 Fax: 601-894-6279 Licensed Beds: 35 10 Geriatric Psychiatric License #11-164 Accred/Cert: 2-3-4 Critical Access Hospital www.hardywilsonhospital.com Covington County Covington County Hospital 701 South Holly Avenue P. O. Box 1149 Collins, Mississippi 39428 Jamie P. Rodgers, Administrator Telephone: 601-765-6711 Fax: 601-698-0180 Licensed Beds: 35 10 Geriatric Psychiatric License #11-181 Accred/Cert: 1-2-3-4 www.covingtonhospital.com DeSoto County
Baptist Memorial Hospital -DeSoto 7601 Southcrest Parkway Southaven, Mississippi 38671 Randy King, Administrator Telephone: 662-772-4000 Licensed Beds: 339 309 Acute 30 Rehabilitation License #13-318 Accred/Cert: 1-2-3-4 www.bmhcc.org
Parkwood Behavioral Health System 8135 Goodman Road Olive Branch Mississippi 38654 Kurt Isaacson, Administrator Telephone: 662-895-4900 Fax: 662-895-4403 Licensed Beds: 88 14 Adult Chemical/Dep. 22 Adult Psychiatric 52 Adolescent Psy. License #32-316 Accred/Cert: 1-2-3-4 www.parkwoodbhs.com Forrest County Forrest General Hospital 6051 Highway 49 South P. O. Box 16389 Hattiesburg, Mississippi 39401 Evan S. Dillard, Administrator Telephone: 601-288-7000 Fax: 601-288-4441 Licensed Beds: 512 400 Acute 40 Adult Psychiatric 16 Adolescent Psy. 24 Adult Chem/Dep. 8 Adolescent Chem/Dep. 24 Rehabilitation License #11-141 Accred/Cert: 1-2-3-4 www.forrestgeneral.com Regency Hospital of Southern Miss. 6051 US Highway 49, 5th Floor Hattiesburg, Mississippi 39401 Douglas Johnson, Administrator Telephone: 601-288-8510 Fax: 601-288-8525 Licensed Beds: 33 License # 22-333 Accred/Cert: 2-3-4 www.regencyhospital.com Long term acute care

-90-
Franklin County Franklin County Memorial Hospital 40 Union Church Road P. O. Box 636 Meadville, Mississippi 39653 W. P. Dickey, Jr., Administrator Telephone: 601-384-5801 Fax: 601-384-4100 Licensed Beds: 35 10 Geriatric Psychiatric License #11-175 Accred/Cert: 2-3-4 George County George County Hospital 859 Winter Street P. O. Box 607 Lucedale, Mississippi 39452 Paul A. Gardner Administrator Telephone: 601-947-3161 Fax: 601-947-9206 Licensed Beds: 48 10 Geriatric Psychiatric License #11-166 Accred/Cert: 2-3-4 www.georgeregional.com Greene County Greene County Hospital 1017 Jackson Avenue P.O. Box 819 Leakesville, Mississippi 39451 Paul Gardner, Administrator Telephone: 601-394-4135 Fax: 601-394-4455 Licensed Beds: 3 License # 11-343 Critical Access Hospital
Grenada County Grenada Lake Medical Center 960 Avent Drive Grenada, Mississippi 38901 Charles L. AChip@ Denton, Administrator Telephone: 662-227-7000 Fax: 662-227-6555 Licensed Beds: 156 14 Geri/psy 10/01/09 14 DPSNF License #11-245 Accred/Cert: 1-2-3-4 www.glmc.net Hancock County Hancock Medical Center 149 Drinkwater Blvd. P.O. Box 2790 Bay St. Louis, Mississippi 39520 Hal W. Leftwich, Administrator Telephone: 228-467-8744 Fax: 228-467-8799 Licensed Beds: 47 License #11-214 Accred/Cert: 1-2-3-4 www.hmc.org Harrison County Biloxi Regional Medical Center 150 Reynoir Street P. O. Box 128 Biloxi, Mississippi 39530 Monte J Bostwick, Administrator Telephone: 228-432-1571 Fax: 228-436-1205 Licensed Beds: 198 153 Acute 45 Psychiatric 12 Geri/psy License #12-299 Accred/Cert: 1-2-3-4 www.biloxiregional.com
-91-
Garden Park Medical Center 15200 Community Road P.O. Box 1240 Gulfport, Mississippi 39502 Brenda M Waltz, Administrator Telephone: 228-575-7000 Fax: 228-575-7114 Licensed Beds: 130 12 Geriatric Psychiatric License #12-272 Accred/Cert: 1-2-3-4 www.gpmedical.com Memorial Hospital at Gulfport 4500 13th Street P.O. Box 1810 Gulfport, Mississippi 39501 Gary G. Marchand, Administrator Telephone: 228-867-4000 Fax: 228-865-3694 Licensed Beds: 445 303 Acute 89 Adult Psychiatric 20 Chem/dep. 33 Rehabilitation License #11-028 Accred/Cert: 1-2-3-4 www.gulfportmemorial.com Select Specialty Hospital of the Gulf Coast 1520 Broad Avenue Gulfport, Mississippi 39501 John O=Keefe, Administrator Telephone: 228-575-7502 Fax: 228-575-7509 Licensed Beds 61 License # 22-326 Accred/Cert 1-2-3-4 Long Term Acute Care Hospital
Hinds County Central Mississippi Medical Center 1850 Chadwick Drive P. O. Box 59001 Jackson, Mississippi 39284-9001 Scott Smith, Administrator Telephone: 601-376-1000 Fax: 601-376-2821 Licensed Beds: 429 400 Acute 29 Adult Psychiatric 18 Geri/psy License #16-240 Accred/Cert: 1-2-3-4 www.centralmississippimedicalcenter.com Mississippi Baptist Medical Center 1225 North State Street P.O. Box 23668 Jackson, Mississippi 39202 Mark F. Slyter, Administrator Telephone: 601-968-1000 Fax: 601-968-1383 Licensed Beds: 638 541 Acute 77 Adult Chemical/Dep. 20 Adolescent Chem/Dep. 24 Geriatric Psychiatric License #14-281 Accred/Cert: 1-2-3-4 www.mbhs.org Miss. Hospital for Restorative Care 1225 North State Street, Suite 5 D P.O. Box 23695 Jackson, Mississippi 39202 Brenda Howie, Administrator Telephone: 601-973-1660 Fax: 601-968-1371 Licensed Beds: 25 Long-term acute care License #23-319 Accred/Cert: 1-2-3-4 www.mbmc.org

-92-
Miss. Methodist Rehabilitation Center 1350 East Woodrow Wilson Drive Jackson, Mississippi 39216 Mark A. Adams, Administrator Telephone: 601-364-3360 Fax: 601-364-3465 Licensed Beds: 124 80 Rehabilitation 44 Acute License #43-278 Accred/Cert: 1-2-3-4 www.methodistonline.org Regency Hospital of Jackson 969 Lakeland Drive, 6th Floor Jackson, Mississippi 39216 Tommy Jackson, Administrator Telephone: 601-364-6200 Fax: 601-601-364-6270 Licensed Beds: 36 Long-term acute care License #22-344 St Dominic Jackson Memorial Hospital 969 Lakeland Drive Jackson, Mississippi 39216 Claude W. Harbarger, Administrator Telephone: 601-200-2000 Fax: 601-200-6800 Licensed Beds: 535 417 Acute 83 Adult Psychiatric 35 Adult Chemical/Dep. License #14-031 Accred/Cert: 1-2-3-4 www.stdom.com Select Specialty Hospital Jackson 5903 Ridgewood Road Jackson, Mississippi 39211 Shannon Conard, Administrator Telephone: 601-899-3800 Fax: 601-899-3863 Licensed Beds: 53 License #22-331 Accred/Cert: 2-3 Long Term Acute Care Hospital
University Hospitals & Health System 2500 North State Street Jackson, Mississippi 39216 David G. Putt, Administrator Telephone: 601-984-4100 Fax: 601-984-4125 Licensed Beds: 722 664 Acute 21 Adult Psychiatric 12 Adolescent Psy 25 Rehabilitation License #11-199 Accred/Cert: 1-2-3-4 www.umc.edu Holmes County
Holmes County Hospital & Clinics 239 Bowling Green Road Lexington, Mississippi 39095 Phillip Grady, Administrator Telephone: 662-834-1321 Fax: 662-834-5240 Licensed Beds: 25 License #11-199 Accred/Cert: 1-2-3-4 Critical Access Hospital www.umhc.com Humphreys County Patients= Choice Medical Center of Humphreys County 500 CCC Road P. O. Box 510 Belzoni, Mississippi 39038 Paula Lang, RN, Administrator Telephone: 662-247-3831 Fax: 662-247-4114 Limited to minor surgery and medicine Licensed Beds: 34 9 Geriatric Psychiatric License #21-169 Accred/Cert: 2-3-4 Critical Access Hospital
-93-
Jackson County Ocean Springs Hospital 3109 Bienville Blvd. Ocean Springs, Mississippi 39564 Kevin Holland, Administrator Telephone: 228-818-1111 Fax: 228-818-2154 Satellite unit of Singing River Hospital Licensed Beds: 136 License #11-039 Accred/Cert: 1-2-3-4 www.srhshealth.com Singing River Hospital 2809 Denny Avenue Pascagoula, Mississippi 39581 Kevin Holland, Administrator Telephone: 228-809-5000 Fax: 228-809-5064 Licensed Beds: 435 385 Acute 30 Adult Psychiatric 20 Rehab License #11-039 Accred/Cert: 1-2-3-4 www.mysrhs.com Jasper County Jasper General Hospital 15 South 6th. Street P.O. Box 527 Bay Springs, Mississippi 39422 Kenneth Posey, Administrator Telephone: 601-764-2101 Fax: 601-764-2930 Licensed Beds: 16 License #11-226 Accred/Cert: 2-3-4
Jefferson County Jefferson County Hospital 870 South Main Street P.O. Box 577 Fayette, Mississippi 39069 Jerry L. Kennedy, Administrator Telephone: 601-786-3401 Fax: 601-786-3400 Licensed Beds: 30 18 Geriatric Psychiatric License #21-238 Accred/Cert: 2-3-4 Jefferson Davis County Jefferson Davis Community Hospital 1102 Rose Street P. O. Drawer 1288 Prentiss, Mississippi 39474 Lee McCall, Administrator Telephone: 601-792-4276 Fax: 601-792-2947 Licensed Beds: 35 10 Geriatric Psychiatric License #16-179 Accred/Cert: 2-3-4 Critical Access Hospital www.jdchospital.com Jones County South Central Regional Medical Center 1220 Jefferson Street P. O. Box 607 Laurel, Mississippi 39440 G. Douglas Higginbotham, Administrator Telephone: 601-426-4000 Fax: 601-426-4228 Licensed Beds: 285 275 Acute 10 Adult Chemical/Dep. 18 Geriatric Psychiatric License #11-153 Accred/Cert: 1-2-3-4 www.scrmc.com

-94-
Lafayette County Baptist Memorial Hospital North Miss. 2301 South Lamar Blvd. P. O. Box 946 Oxford Mississippi 38655 Don Hutson, Administrator Telephone: 662-232-8100 Fax: 662-232-8391 Licensed Beds: 217 204 Acute 13 Rehabilitation License #16-228 Accred/Cert: 1-2-3-4 www.bmhcc.org Lamar County South Mississippi State Hospital 823 Highway 589 Purvis, Mississippi 39475 Wynona C. Winfield, Administrator Telephone: 601-794-0100 Fax: 601-794-0130 Licensed Beds: 50 Psychiatric Licensed #31-329 Accred/Cert: 1-2-3-4 www.smsh.state.ms.us Wesley Medical Center 5001 Hardy Street P. O. Box 16509 Hattiesburg, Mississippi 39402 Michael S. Neuendorf, Administrator Telephone: 601-268-8000 Fax: 601-268-5008 Licensed Beds: 211 24 DPSNF License #12-023 Accred/Cert: 1-2-3-4 www.wesley.com
Lauderdale County Alliance Health Center 5000 Highway 39 North Meridian, Mississippi 39301 William Patterson, Administrator Telephone: 601-483-6211 Fax: 601-696-4898 Licensed Beds: 154 88 Acute 36 Adult Psychiatric 22 Adolescent Psychiatric 8 Adult Chemical/Dep. 12 Geri/psy License #12-308 Accred/Cert: 1-2-3-4 Anderson Regional Medical Center 2124 14th Street Meridian, Mississippi 39301 L. Ray Humphreys, Administrator Telephone: 601-553-6000 Fax: 601-553-6115 Licensed Beds: 260 License #13-237 Accred/Cert: 1-2-3-4 www.jarmc.org East Mississippi State Hospital 4555 Highland Park Drive P. O. Box 4128 Meridian, Mississippi 39304 Charles Carlisle, Administrator Telephone: 601-581-7600 Fax: 601-581-7676 Licensed Beds: 407 332 Adult Psy. 40 Adolescent Psy. 25 Adult Chemical/Dep. 10 Adolescent Chem/Dep. License #31-136 Accred/Cert: 2-3-4 www.emsh.state.ms.us

-95-
Regency Hospital of Meridian 1102 Constitution Avenue, 2nd Floor Meridian, Mississippi 39301 Clifton Quinn, Administrator Telephone: 601-484-7900 Fax: 601-603-6115 Licensed Beds: 40 Long Term Care Acute License #22-332 Accred/Cert: 2-3-4 www.regencyhospital.com Riley Hospital 1102 Constitutian Avenue P. O. Box 1810 Meridian, Mississippi 39302 Pam Tvarkunas, Administrator Telephone: 601-484-3591 Fax: 601-484-3130 Licensed Beds: 140 120 Acute 20 Rehab License #12-249 Accred/Cert: 1-2-3-4 www.rileyhosp.com Rush Foundation Hospital 1314 19th Avenue Meridian, Mississippi 39301 Timothy H. Moore, Administrator Telephone: 601-483-0011 Fax: 601-703-1442 Licensed Beds: 215 License #13-059 Accred/Cert: 1-2-3-4 www.rushhealthsystems.org The Specialty Hospital of Meridian 1314 19th Avenue Meridian, Mississippi 39301 Elizabeth Mitchell, Administrator Telephone: 601-703-4211 Fax: 601-703-4294 Licensed Beds: 49 License #23-324 Accred/Cert: 2-3-4 Www.rushhealthsystems.org Long term acute care hospital
Lawrence County Lawrence County Hospital 1065 East Broad Street P. O. Box 788 Monticello, Mississippi 39654 Semmes Ross, Jr., Administrator Telephone: 601-587-4057 Fax: 601-587-1174 Licensed Beds: 25 License #11-222 Accred/Cert: 2-3-4 Critical Access Hospital Leake County Leake Memorial Hospital 310 Ellis Street P. O. Box 909 Carthage, Mississippi 39051 Robert Faulkner, Administrator Telephone: 601-267-1100 Fax: 601-267-1191 Licensed Beds: 25 License #11-187 Accred/Cert: 2-3-4 Critical Access Hospital Lee County North Mississippi Medical Center 830 South Gloster Street Tupelo, Mississippi 38801 Steve Altmiller, Administrator Telephone: 662-377-3000 Fax: 662-377-3100 Licensed Beds: 650 554 Acute 33 Adult Psychiatric 20 Adult Chemical/Dep. 13 Adolescent Chem/Dep. 30 Rehabilitation 28 DP/SNF License #13-063 Accred/Cert: 1-2-3-4 www.nmhs.net

-96-
North Mississippi State Hospital 1937 Briar Ridge Road Tupelo, Mississippi 38804 Paul A. Callens, Ph.D., Administrator Telephone: 662-690-4200 Fax: 662-690-4227 Licensed Beds: 50 License #31-328 Accred/Cert: 1-2-3-4 www.nmsh.state.ms.us Leflore County LTAC Hospital of Greenwood (Greenwood Leflore Hospital) 1401 River Road P. O. Box 1410 Greenwood Mississippi 38930 James H. Jackson, Jr., Administrator Telephone: 662-459-7000 Fax: 662-459-2719 Licensed Beds: 208 188 Acute 20 Rehabilitation 16 DPSNF 15 Geri/psy License #11-065 Accred/Cert: 1-2-3-4 www.glh.org Greenwood Speciality Hospital 1401 River Road, 2nd Floor P.O. Box 9579 Greenwood, Mississippi 38930 Thomas Strone, Administrator Telephone: 662-451-5172 Fax: 662-459-2680 Licensed Beds: 40 Acute License # 22-335 Long Term Acute Care Lincoln County King's Daughters Medical Center 427 Highway 51 North P. O. Box 948 Brookhaven, Mississippi 39601 Alvin Hoover, Administrator Telephone: 601-833-6011 Fax: 601-833-2791 Licensed Beds: 122 License #16-235 Accred/Cert: 1-2-3-4 www.kdmc.org
Lowndes County Baptist Mem Hospital Golden Triangle 2520 5th Street North P.O. Box 1307 Columbus, Mississippi 39701 E. Paul Cade, Administrator Telephone: 662-244-1500 Fax: 662-244-1651 Licensed Beds: 328 285 Acute 22 Adult Psychiatric 21 Adult Chem/Dep. 23 DPSNF License #13-253 Accred/Cert: 1-2-3-4 www.bmhcc.org Madison County Madison County Medical Center 1421 East Peace Street P. O. Box 1607 Canton, Mississippi 39046 Glen Silverman, Administrator Telephone: 601-855-1331 Fax: 601-855-5100 Licensed Beds: 67 License #16-243 Accred/Cert: 2-3-4 www.madisonregionalmedicalcenter.com Marion County
Marion General Hospital 1560 Sumrall Road P.O.Box 630 Columbia, Mississippi 39429 Jerry Howell, Administrator Telephone: 601-736-6303 Fax: 601-740-2244 Licensed Beds: 49 License #11-167 Accred/Cert: 2-3-4

-97-
Marshall County Alliance Healthcare System 1430 Highway 4 East P.O. Box 6000 Holly Springs, Mississippi 38635 Perry E. Williams, Sr, Administrator Telephone: 662-252-1212 Fax: 662-551-3421 Licensed Beds: 40 20 Geriatric Psychiatric License #16-252 Accred/Cert: 2-3-4 www.alliancehealth.us Monroe County Gilmore Memorial Reg. Medical Center 1105 Earl Frye Blvd. P. O. Box 459 Amory, Mississippi 38821 Dwayne Blaylock, Administrator Telephone: 662-256-7111 Fax: 662-256-6007 Licensed Beds: 95 License #12-074 Accred/Cert: 1-2-3-4 www.gilmorehealth.com Pioneer Community Hospital of Aberdeen 400 South Chestnut Street P. O. Box 548 Aberdeen, Mississippi 39730 Steve Fontaine, Administrator Telephone: 662-369-2455 Fax: 662-319-2125 Licensed Beds: 35 10 Geri/psy License #16-230 Accred/Cert: 2-3-4 Critical Access Hospital
Montgomery County Kilmichael Hospital 301 Lamar Street P.O. Box 188 Kilmichael, Mississippi 39747 Calvin D. Johnson, Sr, Administrator Telephone: 662-262-4311 Fax: 662-262-5586 Limited to OB, minor surgery and medicine Licensed Beds: 19 License #21-183 Accred/Cert: 2-3-4 Tyler Holmes Memorial Hospital 409 Tyler Holmes Drive Winona, Mississippi 38967 R.M. Tyler, Administrator Telephone: 662-283-4114 Fax: 662-283-6125 Licensed Beds: 25 License #11-209 Accred/Cert: 2-3-4 Critical Access Hospital Nesoba County Neshoba County General Hospital 1001 Holland Avenue P. O. Box 648 Philadelphia, Mississippi 39350 Joseph T Bland, Interim Administrator Telephone: 601-663-1200 Fax: 601-663-1497 Licensed Beds: 82 10 Geriatric Psychiatric License #11-227 Accred/Cert: 2-3-4 www.neshobageneral.com Newton County Laird Hospital 25117 Highway 15 Union, Mississippi 39365 Thomas Bartlett, Administrator Telephone: 601-774-8214 Fax: 601-774-8379 Licensed Beds: 25 License #13-310 Accred/Cert: 1-2-3-4 Critical Access Hospital

-98-
Pioneer Community Hospital of Newton (Newton Regional Hospital) 9421 Eastside Drive Ext. P. O. Box 299 Newton, Mississippi 39345 Mark Norman, Administrator Telephone: 601-683-2031 Fax: 601-683-0363 Licensed Beds: 30 9 Geriatric Psychiatric License #12-321 Accred/Cert: 2-3-4 www.phshospitals.com Noxubee County Noxubee General Critical Access Hospital 606 North Jefferson Street P. O. Box 480 Macon, Mississippi 39341 Danny H. McKay, Administrator Telephone: 662-726-4231 Fax: 662-726-5784 Licensed Beds: 25 License #11-081 Accred/Cert: 2-3-4 Critical Access Hospital Oktibbeha County OCH Regional Medical Center (Oktibbeha County Hospital) 400 Hospital Road P. O. Drawer 1506 Starkville, Mississippi 39759 Arthur C. Kelly, Administrator Telephone: 662-323-4320 Fax: 662-615-2554 Licensed Beds: 96 License #11-269 Accred/Cert: 1-2-3-4 www.och.org
Panola County
Tri-Lakes Medical Center 303 Medical Center Drive Batesville, Mississippi 38606 Greg Cantrell, Administrator Telephone: 662-712-2371 Fax: 662-563-0155 Licensed Beds: 112 77 Acute 25 Psychiatric 10 Chemical Dependency 22 Geriatric Psychiatric License #13-287 Accred/Cert: 2-3-4 www.trilakesmc.com Pearl River County Highland Community Hospital 801 Goodyear Blvd. P. O. Box 909 Picayune, Mississippi 39466 Douglas A. Jones, Administrator Telephone: 601-798-4711 Fax: 601-749-3187 Licensed Beds: 95 License #11-086 Accred/Cert: 2-3-4 www.highlandch.com Pearl River County Hospital 305 West Moody Street P. O. Box 392 Poplarville, Mississippi 39470 Mike Boleware, Administrator Telephone: 601-795-4543 Fax: 601-795-4238 Licensed Beds: 24 License #21-087 Accred/Cert: 2-3-4 Critical Access Hospital
-99-
Perry County Perry County General Hospital 206 Bay Avenue P. O. Box 1665 Richton Mississippi 39476 J. David Paris, Administrator Telephone: 601-788-6316 Fax: 601-788-2223 Licensed Beds: 22 License #12-234 Accred/Cert: 2-3-4 www.pcghosp.com Critical Access Hospital Pike County Beacham Memorial Hospital 205 North Cherry Street P. O. Box 351 Magnolia, Mississippi 39652 Guy C. Geller, Administrator Telephone: 601-783-2351 Fax: 601-783-9003 Licensed Beds: 37 License #16-275 Accred/Cert: 2-3-4 www.beachammemorialh.com
Southwest Miss. Regional Medical Ctr 215 Marion Avenue P. O. Box 1307 McComb, Mississippi 39648 Norman M. Price, Administrator Telephone: 601-249-5500 Fax: 601-249-1800 Licensed Beds: 160 License #11-251 Accred/Cert: 1-2-3-4 www.smrmc.com Pontotoc County Pontotoc Critical Access Hospital 176 South Main Street P. O. Box 790 Pontotoc, Mississippi 38863-0790 Fred B. Hood, Administrator Telephone: 662-488-7640 Fax: 662-488-7675 Licensed Beds: 25 License #16-091 Accred/Cert: 1-2-3-4 www.nmhs.net
Prentiss County Baptist Memorial Hospital Booneville 100 Hospital Street Booneville, Mississippi 38829 Walter Grace, Administrator Telephone: 662-720-5000 Fax: 662-720-5005 Licensed Beds: 114 15 Geriatric Psychiatric License #16-161 Accred/Cert: 1-2-3-4 www.bmhcc.org/services/hospitals/ Booneville Quitman County Quitman County Hospital 340 Getwell Drive Marks, Mississippi 38646-9785 Richard Manning, Administrator Telephone: 662-326-8031 Fax: 662-326-8560 Licensed Beds: 33 8 Geriatric Psychiatric License #16-291 Accred/Cert: 2-3-4 Rankin County Brentwood Behavioral Healthcare of Mississippi 3531 East Lakeland Drive Jackson, Mississippi 39232 Michael J. Carney, Administrator Telephone: 601-936-2024 Fax: 601-936-7827 Licensed Beds: 107 License #32-330 Accred/Cert: 1-2-3-4 www.brentwoodjackson.com Crossgates River Oaks Hospital 350 Crossgates Blvd. Brandon, Mississippi 39042 J. Allen Tyra, Administrator Telephone: 601-824-8501 Fax: 601-824-8530 Licensed Beds: 134 20 Geriatric Psychiatric License #16-250 Accred/Cert: 1-2-3-4 www.crossgatesriveroaks.com

-100-
Mississippi State Hospital 3550 Highway 468 West P.O. Box 157A Whitfield, Mississippi 39193 James G. Chastain, Administrator Telephone: 601-351-8000 Fax: 601-351-8228 Licensed Beds: 1,479 1,347 Psychiatric 132 Adult Chemical/Dep. License #31-139 Accred/Cert: 1-2-3-4 Oak Circle Center Mississippi State Hospital 3550 Highway 468 West, Bldg 23 P.O. Box 157-A Whitfield, Mississippi 39193 James G. Chastain, Administrator Telephone: 601-351-8000 Fax: 601-939-0647 Licensed Beds: 60 Adolescent Psychiatric License #31-320 Accred/Cert: 1-4 www.msh.state.ms.us River Oaks Hospital 1030 River Oaks Drive P. O. Box 5100 Jackson, Mississippi 39232 Dennis R. Bruns, Administrator Telephone: 601-936-2390 Fax: 601-936-2275 Licensed Beds: 160 License #12-297 Accred/Cert: 1-2-3-4 www.riveroakshospital.org Whitfield Medical/Surgical Hospital Building 60, Oak Circle P.O. Box 157-A Whitfield, Mississippi 39193 Cindi Nail, Administrator Telephone: 601-351-8023 Fax: 601-351-8304 Licensed Beds: 43 32 Acute 11 Psychiatric License #11-298 Accred/Cert: 1-2-3-4 www.msh.state.ms.us
Woman's Hospital 1026 North Flowood Drive P. O. Box 4546 Flowood, Mississippi 39232 Sherry Pitts, Administrator Telephone: 601-932-1000 Fax: 601-936-3086 Licensed Beds: 109 License #12-300 Accred/Cert: 1-2-3 www.womanshospitalms.com Scott County S.E. Lackey Critical Access Hospital 330 North Broad Street P. O. Box 428 Forest, Mississippi 39074 Donna G. Riser, Administrator Telephone: 601-469-4151 Fax: 601-469-3681 Licensed Beds: 35 10 Geriatric Psychiatric License #13-033 Accred/Cert: 2-3-4 Scott Regional Hospital 317 Highway 13 South P.O. Box 259 Morton, Mississippi 39117 Michael R. Edwards, Administrator Telephone: 601-732-6301 Fax: 601-732-6476 Licensed Beds: 25 License #13-306 Accred/Cert: 2-3-4 Critical Access Hospital www.rushhealthsystems.org Sharkey County Sharkey-Issaquena Community Hospital 47 South Fourth Street P.O. Box 339 Rolling Fork, Mississippi 39159 Jerry Keever, Administrator Telephone: 662-873-4395 Fax: 662-873-5188 Licensed Beds: 29 10 Geriatric Psychiatric License #21-172 Accred/Cert: 2-3-4

-101-
Simpson County Magee General Hospital 300 Third Avenue S.E. Magee, Mississippi 39111 Althea H. Crumpton, Administrator Telephone: 601-849-5070 Fax: 601-849-7618 Licensed Beds: 64 License #13-274 Accred/Cert: 2-3-4 www.mghosp.org Simpson General Hospital 1842 Simpson, Highway 149 P.O. Box 457 Mendenhall, Mississippi 39114 Scott Kelly, Administrator Telephone: 601-847-2221 Fax: 601-847-5872 Licensed Beds: 35 10 Geriatric Psychiatric License #13-216 Accred/Cert: 2-3-4 www.simpsongeneralhospital.com Smith County Patients= Choice Medical Center 347 Magnolia Drive Raleigh, Mississippi 39153 Ray Shoemaker, Administrator Telephone: 601-782-9997 Fax: 601-782-5918 Licensed Beds: 29 10 Geri/psy License #16-255 Stone County Stone County Hospital 1434 East Central Avenue P.O. Drawer 97 Wiggins, Mississippi 39577 Julie Cain, Administrator Telephone: 601-928-6600 Fax: 601-928-6658 Licensed Beds: 25 License # 12-280 Accred-Cert: 2-3-4 Critical Access Hospital
Sunflower County North Sunflower Medical Center 840 North Oak Avenue P. O. Box 369 Ruleville, Mississippi 38771 Billy Marlow, Administrator Telephone: 662-756-2711 Fax: 662-756-4114 Licensed Beds: 35 10 Geriatric Psychiatric License #11-168 Accred/Cert: 2-3-4 Critical Access Hospital www.northsunflower.com South Sunflower County Hospital 121 East Baker Street Indianola, Mississippi 38751 H. J. Blessitt, Administrator Telephone: 662-887-5235 Fax: 662-887-4111 Licensed Beds: 49 License #11-102 Accred/Cert: 1-2-3-4 Tallahatchie County Tallahatchie General Hospital 201 South Market Street P. O. Box 230 Charleston, Mississippi 38921 Bobby J. Brunson Jr., Administrator Telephone: 662-647-5535 Fax: 662-647-3677 Licensed Beds: 9 License #11-211 Accred/Cert: 2-3-4 Critical Access Hospital Tate County North Oak Regional Medical Center 401 Getwell Drive P.O. Box 648 Senatobia, Mississippi 38668 Sonja Graham, RN, Administrator Telephone: 662-562-3100 Fax: 662-562-3138 Licensed Beds: 76 12 Geriatric Psychiatric License #16-286 Accred/Cert: 1-2-3-4
-102-
Tippah County Tippah County Hospital 1005 City Avenue North P. O. Box 499 Ripley, Mississippi 38663 Thomas R. Hood, Administrator Telephone: 662-837-9221 Fax: 662-837-2110 Licensed Beds: 45 10 Geri/psy License #11-159 Accred/Cert: 1-2-3-4 Tishomingo County Iuka Hospital 1777 Curtis Drive P. O. Box 860 Iuka, Mississippi 38852 Fred A. Truesdale, Jr., Administrator Telephone: 662-423-6051 Fax: 662-423-4550 Licensed Beds: 48 License #13-221 Accred/Cert: 1-2-3-4 www.nmhs.net Union County Baptist Memorial Hosp Union County 200 Highway 30 West New Albany, Mississippi 38652 James Huffman, Administrator Telephone: 662-538-7631 Fax: 662-538-2591 Licensed Beds: 153 License #16-239 Accred/Cert: 1-2-3-4 www.baptistonline.org Walthall County Walthall General Hospital 100 Hospital Drive Tylertown, Mississippi 39667 Jimmy Graves, Administrator Telephone: 601-876-0400 Fax: 601-876-0432 Licensed Beds: 25 License #11-257 Accred/Cert: 2-3-4 Critical Access Hospital
Warren County Promise Specialty Hosp of Vicksburg 1111 North Frontage Road, 2nd Floor Vicksburg, Mississippi 39180 Lee Huckaby, Administrator Telephone: 601-883-3439 Fax: 601-883-3492 Licensed Beds: 35 License #22-334 Accred/Cert: #3-4 www.promisehealthcare.com Long Term Acute Care River Region Health System 1111 North Frontage Road P.O. Box 590 Vicksburg, Mississippi 39183 Vance Reynolds, Administrator Telephone: 601-883-5000 Fax: 601-883-5197 Licensed Beds: 341 261 Acute 40 Adult Psychiatric 40 Chem/Dep. 27 Geriatric Psychiatric License #12-327 Accred/Cert: 1-2-3-4 www.Riverregion.com Washington County Allegiance Specialty Hospital of Greenville 300 South Washington, 3rd Floor Greenville, Mississippi 38701 Donald C. Cameron, Administrator Telephone: 662-332-7344 Fax: 662-332-7295 Licensed Beds: 39 License #22-346 Long Term Acute Care Hospital Licensed 12/08/10
-103-
Delta Regional Medical Center Main Campus 1400 East Union Street P. O. Box 5247 Greenville, Mississippi 38701 Mazie Whalen, Interim Administrator Telephone: 662-334-2169 Fax: 662-334-2189 Licensed Beds: 227 License #11-189 Accred/Cert: 1-2-3-4 www.deltaregional.com Delta Regional Medical Center West Campus 300 South Washington Avenue P. O. Box 5247 Greenville, Mississippi 38701 Mazie Whalen, Interim Administrator Telephone: 662-378-2020 Fax: 662-334-2189 Licensed Beds: 98 58 Acute 24 Rehab 9 Psychiatric 7 Chemical Dependency 14 Geriatric Psychiatric License #11-189S Accred/Cert: 1-2-3-4 www.deltaregional.com Wayne County Wayne General Hospital 950 Matthew Drive P. O. Box 1249 Waynesboro, Mississippi 39367 Donald Hemeter, Administrator Telephone: 601-735-5151 Fax: 601-735-7168 Licensed Beds: 80 License #11-288 Accred/Cert: 1-2-3-4 www.waynegeneralhospital.org
Webster County Webster Health Services 70 Medical Plaza Eupora, Mississippi 39744 Bob Jones, Administrator Telephone: 662-258-6221 Fax: 662-258-9291 Licensed Beds: 38 License #13-225 Accred/Cert: 1-2-3-4 www.nmhs.net/webster Wilkinson County Field Memorial Community Hospital 270 West Main Street P. O. Box 639 Centreville, Mississippi 39631 Chad Netterville, Administrator Telephone: 601-645-5221 Fax: 601-645-5842 Licensed Beds: 25 License #11-121 Accred/Cert: 1-2-3-4 Critical Access Hospital www.fmch.org Winston County Diamond Grove Center 2311 Highway 15 South P.O. Box 848 Louisville, Mississippi 39339 Patrick R. Swoopes, Administrator Telephone: 662-779-0119 Fax: 662-779-0126 Licensed Beds: 25 Psychiatric License #32-325 Accred/Cert: 1-2-4 www.diamondgrovecenter.com
-104-
Winston Medical Center 562 East Main P. O. Box 967 Louisville, Mississippi 39339 W. Dale Saulters, Administrator Telephone: 662-773-6211 Fax: 662-773-6223 Licensed Beds: 30 14 Geriatric Psychiatric License #16-208 Accred/Cert: 2-3-4 www.winstonmedical.org Yalobusha County Yalobusha General Hospital 630 South Main Street P. O. Box 728 Water Valley Mississippi 38965 Terry Varner, Administrator Telephone: 662-473-1411 Fax: 662-473-4922 Licensed Beds: 26 License #11-223 Accred/Cert: 2-3-4 www.yalobushageneral.com Yazoo County King's Daughters Hospital of Yazoo County 823 Grand Avenue Yazoo City, Mississippi 39194 Daryl W. Weaver, Administrator Telephone: 662-746-2261 Fax: 662-746-4839 Licensed Beds: 35 10 Geriatric Psychiatric License #16-203 Accred/Cert: 2-3-4 www.kdhyazoo.com Critical Access Hospital

-105-
Key to Code of Hospital License Numbers (DIGITS AT LEFT OF HYPHEN) First Digit Type of Hospital 1 General Medical/Surgical 2 Limited Services (As limited by hospital licensing agency) 3 Psychiatric and/or Chemical Dependency 4 Medical Specialty (Rehabilitation or other medical specialty) Second Digit Ownership 1 Public Ownership (state or local government) 2 Proprietary (for-profit single entrepreneur, partnership or corporation) 3 Not-for-profit corporation or association 4 Church affiliation 5 Industrial 6 Public ownership (state or local government - leased to another entity for operation of hospital) (DIGITS AT RIGHT OF HYPHEN) Is the Registration or application number EXAMPLE: License #12-345 Key to Code of Accreditations and Certifications (DIGITS ARE DESIGNATED BY NUMBERS AS FOLLOWS) 1 Accredited by JCAHO 2 Blue Cross participating 3 Medicare participating 4 Medicaid participating