2010 earnings results - newspress-kia.s3.amazonaws.com · 13 2011 business plan * based on shipment...
TRANSCRIPT

1
2010 Earnings Results
January 28, 2011
2
Notes for InvestorsThis presentation has been prepared with unaudited 4th quarter results of year 2010 for investors’ convenience.
Therefore, some numbers may change upon the review of Kia’s independent auditors.

33
Contents
Sales Overview
Income Statement
Balance Sheet
Cashflow Statement
Revenue Analysis
COGS and SG&A
Non-Operating Income/Expense
2011 Business Plan
New Model Launch Schedule
2011 Management Policy
I. 2010 Earnings ResultsI. 2010 Earnings Results II. 2011 Business PlanII. 2011 Business Plan

I. 2010 Earnings ResultsI. 2010 Earnings Results
Sales Overview
Income Statement
Balance Sheet
Cashflow Statement
Revenue Analysis
COGS and SG&A
Non-Operating
Income/Expense
5
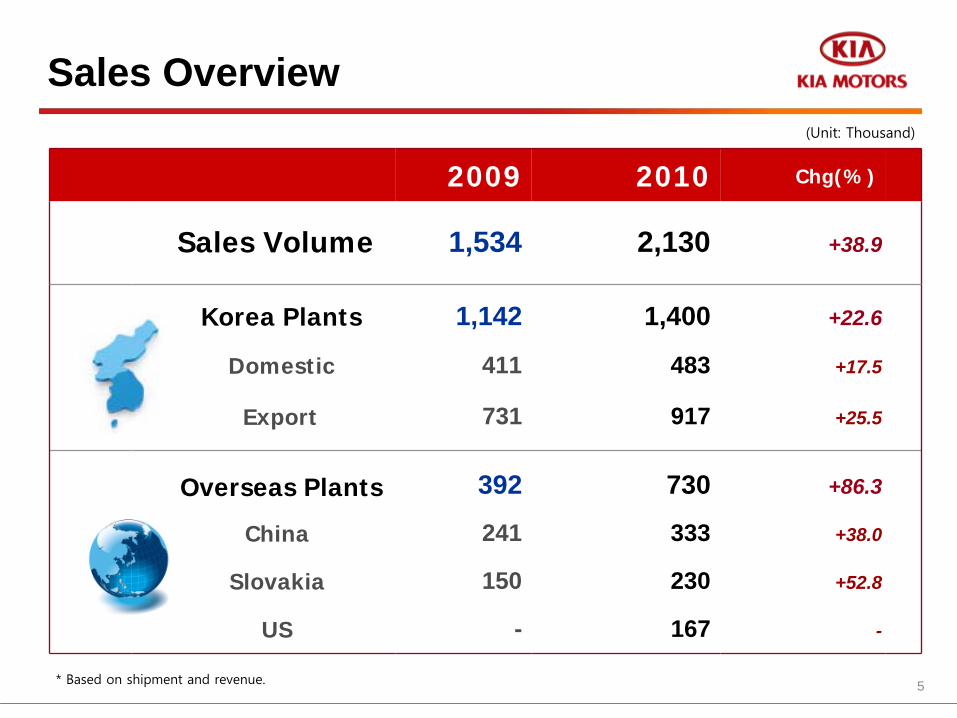
Sales Overview
2009 2010 Chg(%)
Sales Volume 1,534 2,130 +38.9
Korea Plants 1,142 1,400 +22.6
Domestic 411 483 +17.5
Export 731 917 +25.5
Overseas Plants 392 730 +86.3
China 241 333 +38.0
Slovakia 150 230 +52.8
US - 167 -
* Based on shipment and revenue.
(Unit: Thousand)

6
Income Statement
2009 (%) 2010 (%) Chg(%)
Sales Volume 1,142 100 1,400 100 +22.6
Domestic 411 36 483 35 +17.5
Export 731 64 917 65 +25.5
Revenue 18,416 100 23,261 100 +26.3Domestic 6,953 38 9,182 39 +32.1
Export 11,463 62 14,079 61 +22.8
Gross Profit 4,591 24.9 5,330 22.9 +16.1
Operating Profit 1,144 6.2 1,680 7.2 +46.8
Recurring Profit 1,700 9.2 2,776 11.9 +63.3
Net Profit 1,450 7.9 2,254 9.7 +55.4
EBITDA 1,828 9.9 2,310 9.9 +26.4
(Unit: Billion Won, Thousand)
*EBITDA = Operating Profit + Depreciation + Amortization
7
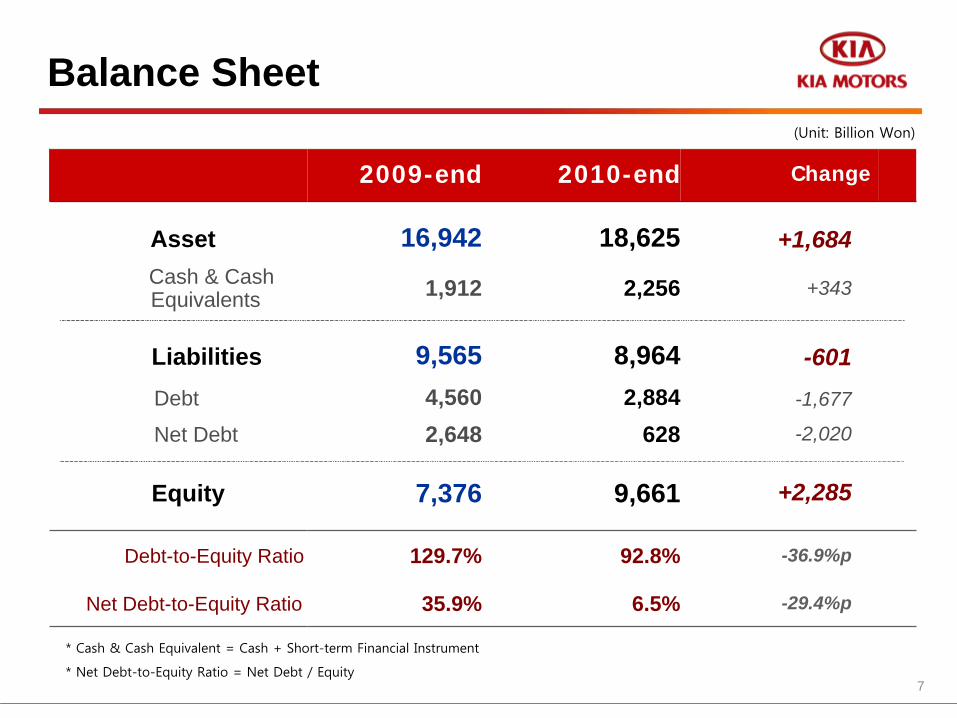
Balance Sheet
2009-end 2010-end Change
Asset 16,942 18,625 +1,684Cash & Cash Equivalents 1,912 2,256 +343
Liabilities 9,565 8,964 -601Debt 4,560 2,884 -1,677
Net Debt 2,648 628 -2,020
Equity 7,376 9,661 +2,285
Debt-to-Equity Ratio 129.7% 92.8% -36.9%p
Net Debt-to-Equity Ratio 35.9% 6.5% -29.4%p
(Unit: Billion Won)
* Cash & Cash Equivalent = Cash + Short-term Financial Instrument
* Net Debt-to-Equity Ratio = Net Debt / Equity
8
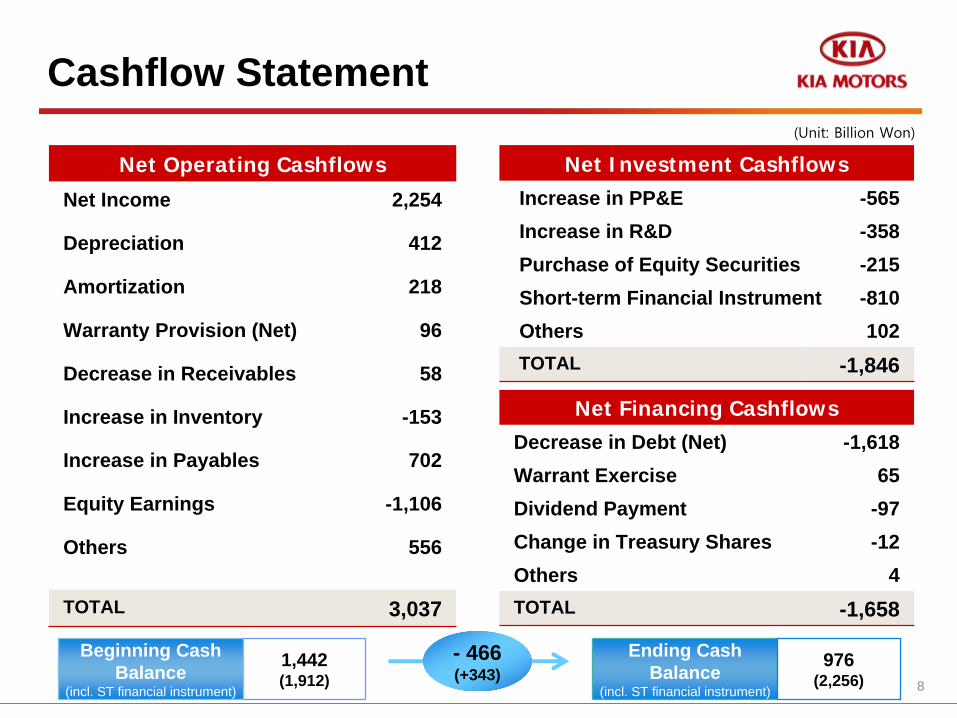
Cashflow Statement
Net Operating Cashflows
Net Income 2,254
Depreciation 412
Amortization 218
Warranty Provision (Net) 96
Decrease in Receivables 58
Increase in Inventory -153
Increase in Payables 702
Equity Earnings -1,106
Others 556
TOTAL 3,037
Net Investment CashflowsIncrease in PP&E -565Increase in R&D -358Purchase of Equity Securities -215Short-term Financial Instrument -810Others 102TOTAL -1,846
Net Financing CashflowsDecrease in Debt (Net) -1,618Warrant Exercise 65Dividend Payment -97Change in Treasury Shares -12Others 4TOTAL -1,658
Beginning Cash Balance
(incl. ST financial instrument)
1,442(1,912)
- 466(+343)
Ending Cash Balance
(incl. ST financial instrument)
976 (2,256)
(Unit: Billion Won)
9
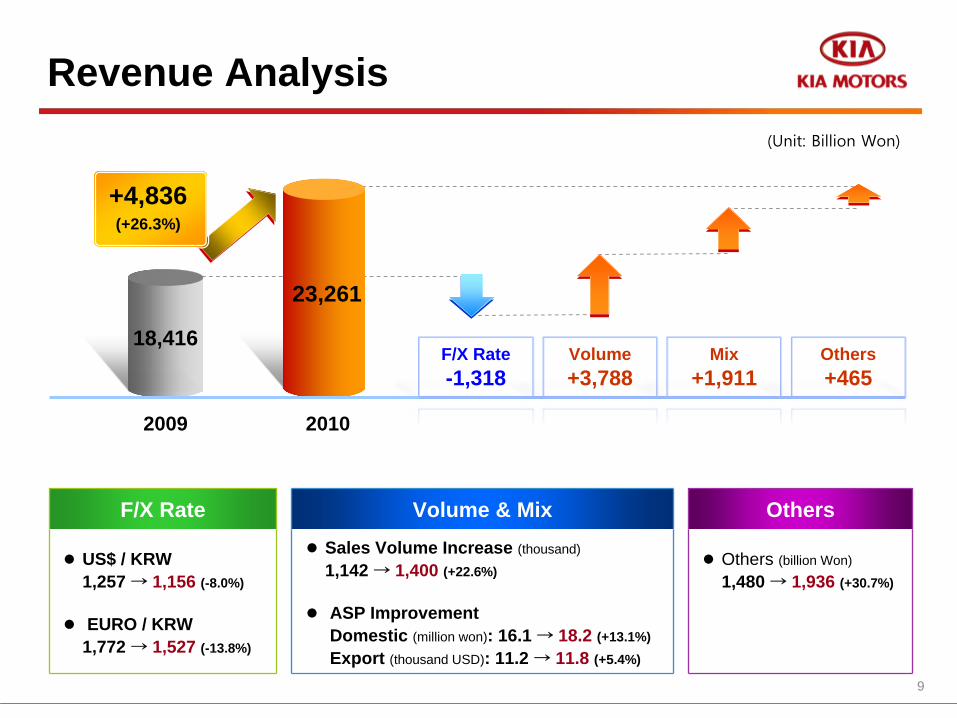
Revenue Analysis
F/X Rate-1,318
Volume+3,788
Mix+1,911
Others+465
F/X Rate
US$ / KRW 1,257 → 1,156 (-8.0%)
EURO / KRW 1,772 → 1,527 (-13.8%)
Volume & Mix
Sales Volume Increase (thousand)
1,142 → 1,400 (+22.6%)
ASP Improvement Domestic (million won): 16.1 → 18.2 (+13.1%) Export (thousand USD): 11.2 → 11.8 (+5.4%)
Others
Others (billion Won)
1,480 → 1,936 (+30.7%)
18,416
23,261
2009 2010
+4,836(+26.3%)
(Unit: Billion Won)
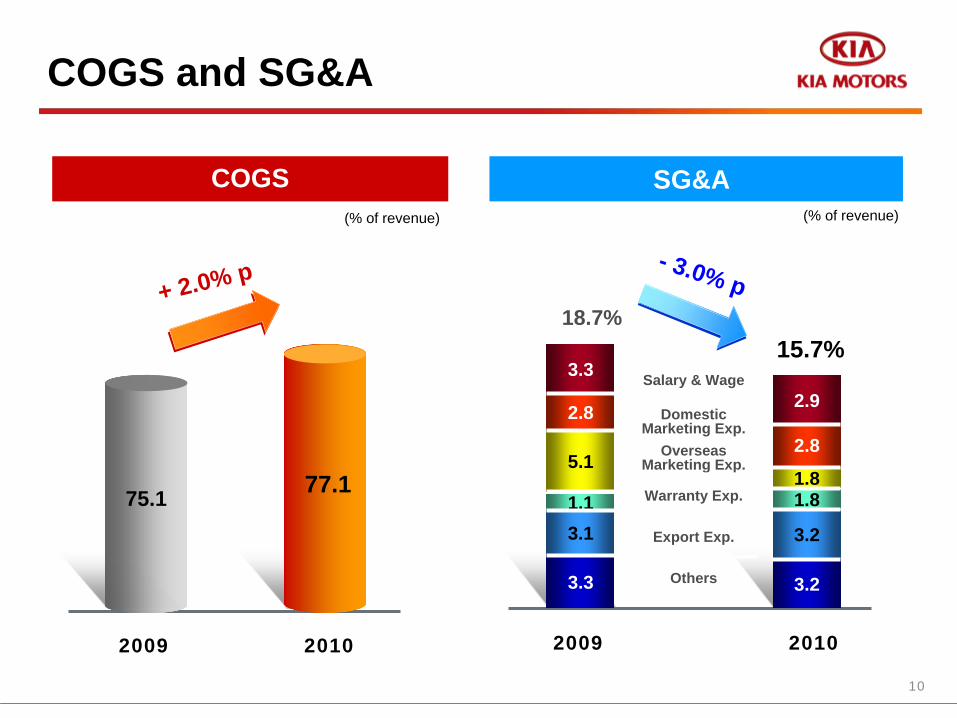
10
2009 2010
18.7%
(% of revenue)
COGS(% of revenue)
15.7%
2009 2010
3.3
2.8
5.1
1.13.1
3.3
Salary & Wage
Domestic Marketing Exp.
Overseas Marketing Exp.
Warranty Exp.
Export Exp.
Others
2.9
2.8
1.81.8
3.2
3.2
COGS and SG&A
SG&A
+ 2.0% p - 3.0% p
77.175.1
11
2009 2010
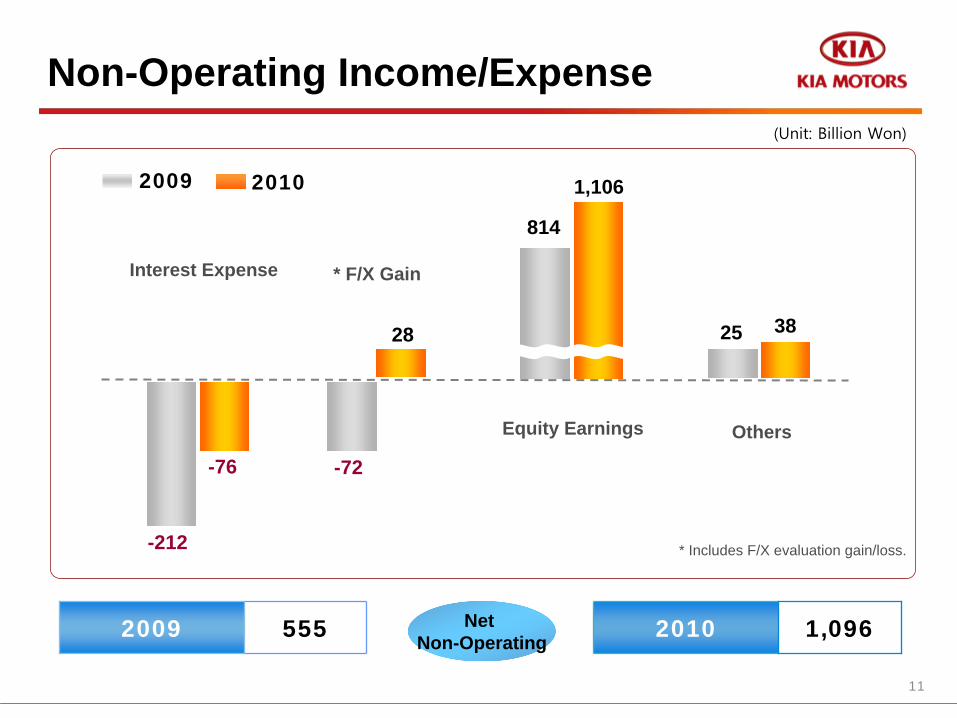
Non-Operating Income/Expense
OthersEquity Earnings
1,106
814
25 3828
-72
Interest Expense * F/X Gain
-76
-212 * Includes F/X evaluation gain/loss.
Net Non-Operating2009 555 2010 1,096
(Unit: Billion Won)
12
II. 2011 Business PlanII. 2011 Business Plan
2011 Business Plan
New Model Launch Schedule
2011 Management Policy
13
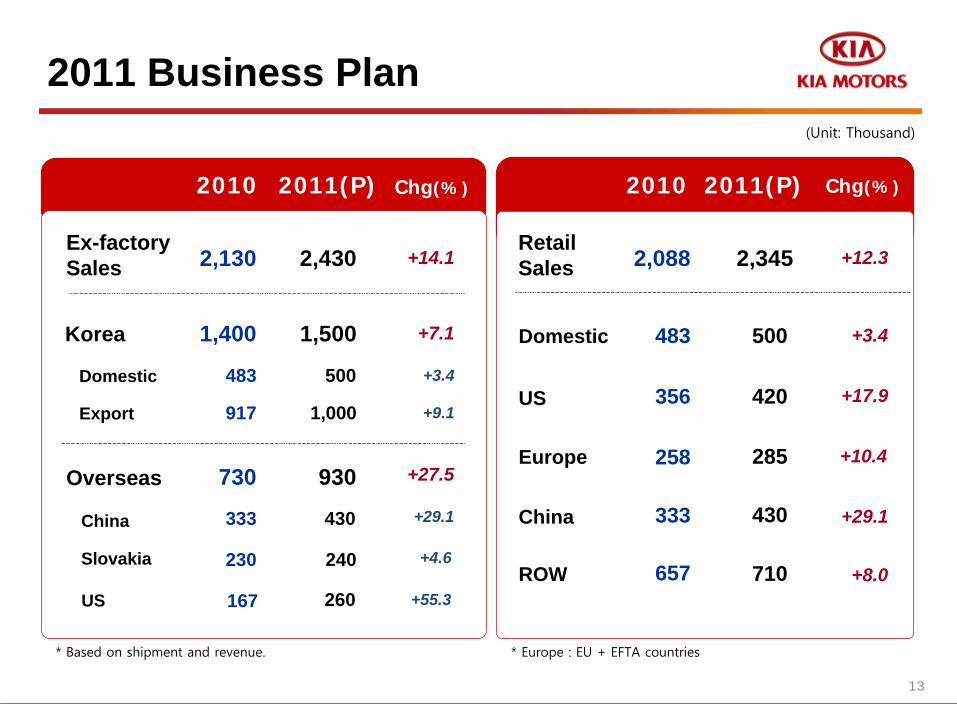
2011 Business Plan
* Based on shipment and revenue. * Europe : EU + EFTA countries
2,130 +14.1Ex-factory Sales
1,400 +7.1
483 +3.4Domestic
917 +9.1Export
2,430
1,500
500
1,000
2010 2011(P) Chg(%)
Korea
730 +27.5
333 +29.1China
230 +4.6Slovakia
930
430
240
Overseas
167 +55.3US 260
2,088 +12.3Retail Sales
+3.4
2,345
+17.9
+10.4
+29.1
+8.0
500
420
285
430
710
483
356
258
333
657
Domestic
US
Europe
China
ROW
2010 2011(P)
(Unit: Thousand)
Chg(%)
14* Retail sales started January 2011.
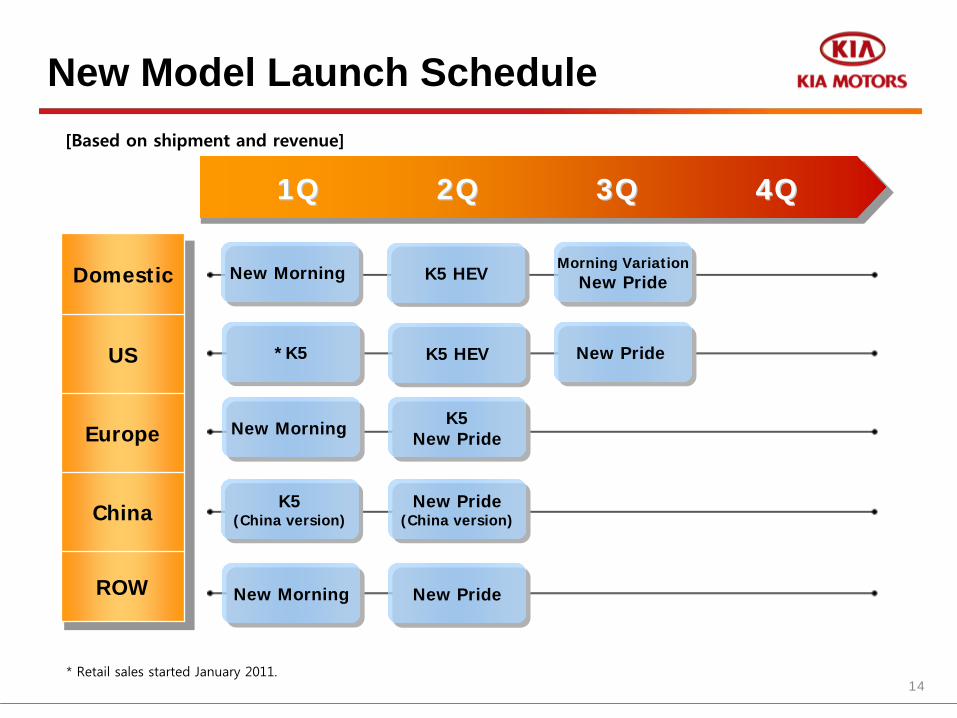
New Morning New Morning
1Q1Q 2Q2Q 3Q3Q 4Q4Q
Domestic
US
Europe
China
ROW
K5(China version)
K5(China version)
New Pride(China version)New Pride
(China version)
Morning VariationNew Pride
Morning VariationNew Pride
New Pride New Pride
New Morning New Morning K5New Pride
K5New Pride
New PrideNew Pride
*K5*K5
New Model Launch Schedule
New MorningNew Morning
K5 HEVK5 HEV
K5 HEVK5 HEV
[Based on shipment and revenue]
15
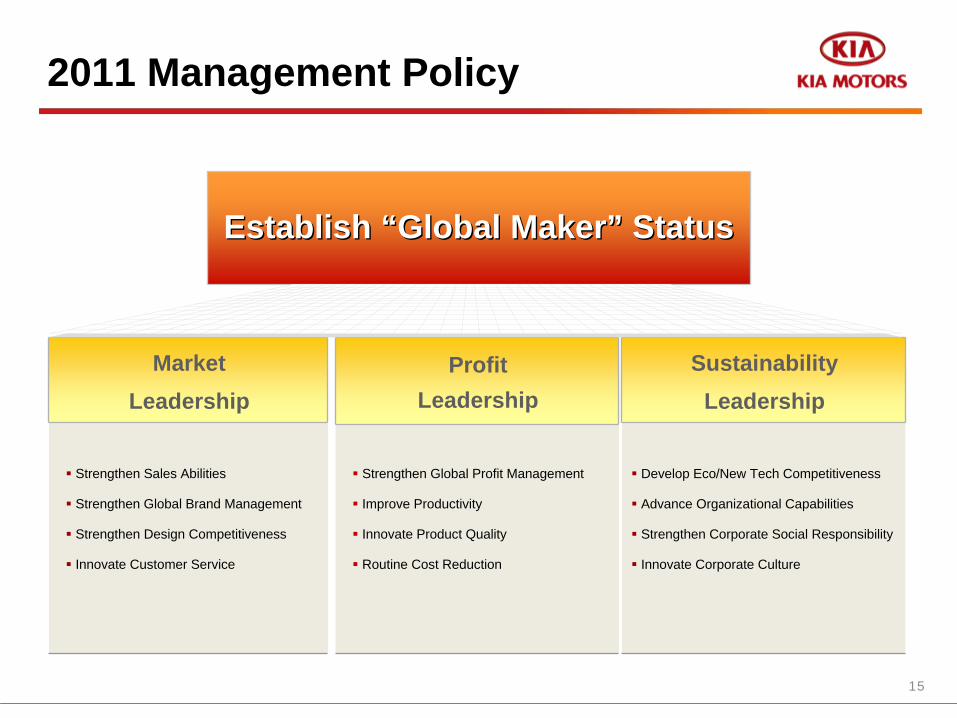
2011 Management Policy
Profit Leadership
Market Leadership
Establish Establish ““Global MakerGlobal Maker”” StatusStatus
SustainabilityLeadership
Strengthen Sales Abilities
Strengthen Global Brand Management
Strengthen Design Competitiveness
Innovate Customer Service
Strengthen Global Profit Management
Improve Productivity
Innovate Product Quality
Routine Cost Reduction
Develop Eco/New Tech Competitiveness
Advance Organizational Capabilities
Strengthen Corporate Social Responsibility
Innovate Corporate Culture

http://www.kmcir.comhttp://www.kmcir.com
Thank you.
17
III. AppendixIII. Appendix
Quarterly Income Statement
2010 Sales Overview
2011 Strategy by Market
- Korea
- US
- Europe
- China
- ROW
18
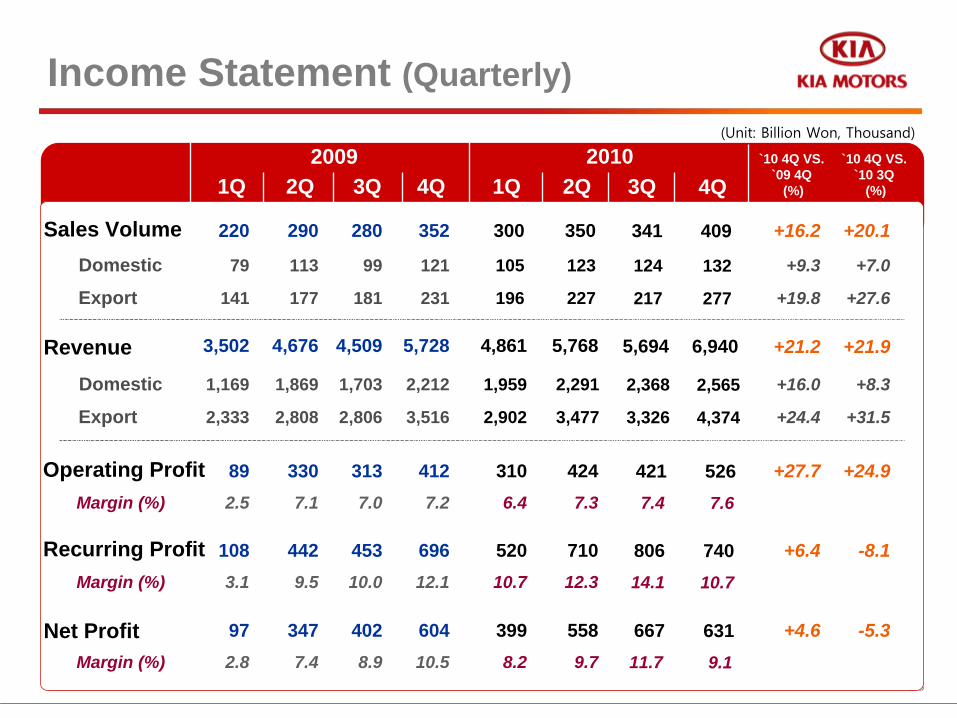
Sales VolumeDomestic
Export
220
79
141
290
113
177
280
99
181
352
121
231
1Q 2Q 3Q 4Q2009 2010
1Q 2Q`10 4Q VS.
`09 4Q (%)
`10 4Q VS. `10 3Q
(%)
300
105
196
350
123
227
+16.2
+9.3
+19.8
+20.1
+7.0
+27.6
RevenueDomestic
Export
3,502
1,169
2,333
4,676
1,869
2,808
4,509
1,703
2,806
5,728
2,212
3,516
4,861
1,959
2,902
5,768
2,291
3,477
+21.2
+16.0
+24.4
+21.9
+8.3
+31.5
Operating ProfitMargin (%)
892.5
3307.1
3137.0
4127.2
3106.4
4247.3
+27.7 +24.9
Recurring ProfitMargin (%)
1083.1
4429.5
45310.0
69612.1
52010.7
71012.3
+6.4 -8.1
Margin (%)
972.8
3477.4
4028.9
60410.5
3998.2
5589.7
+4.6 -5.3
3Q
341
124
217
2,368
3,326
4217.4
80614.1
66711.7
5,694
Net Profit
409
132
277
2,565
4,374
5267.6
74010.7
6319.1
6,940
4Q
Income Statement (Quarterly)(Unit: Billion Won, Thousand)

19
Sales Overview by Region
1,534 +38.9
1,142 +22.6
411 +17.5
731 +25.5
2,130
1,400
483
917
392 +86.3
241 +38.0
150 +52.8
730333
230
- -167
1,651 +26.5
+17.5
2,088
+18.7
+6.6
+38.0
+44.3
483
356
258
333
657
411
300
242
241
455
2009 2010 chg(%) 2009 2010 chg(%)
(Unit: Thousand)
Ex-factorySales
Domestic
Export
Korea
China
Slovakia
Overseas
US
Retail Sales
Domestic
US
Europe
China
ROW
* Based on shipment and revenue. * Europe : EU + EFTA countries

20
Market & Strategy
411
Sales & Market Share
29.5%
11%
26%
63%
33.0%
PC
RV
CV
11%
25%
64%
11%
25%
64%
483500
Korea Market
+3.4%
Market Outlook- Limited growth of +1.2% in ‘11E vs. +7% in ‘10.
- Better consumer sentiment with new model launches.
- Influence of Korea-EU FTA in 2H on imported car market.
2009 2010 2011(P)
(Thousand units)
Strategy - Reinforce New Model Sales Momentum
New Morning (Jan), K5 HEV (Jun),
Morning Variation (Aug), New Pride (Sept)
- Increase Market Presence with Full Line-up Equipment
- Build-up Sales Growth in Volume Models (K / R Series)
- Improve Brand Image via PR Activities
Promote “Design Kia,” Social Responsibility Marketing
21
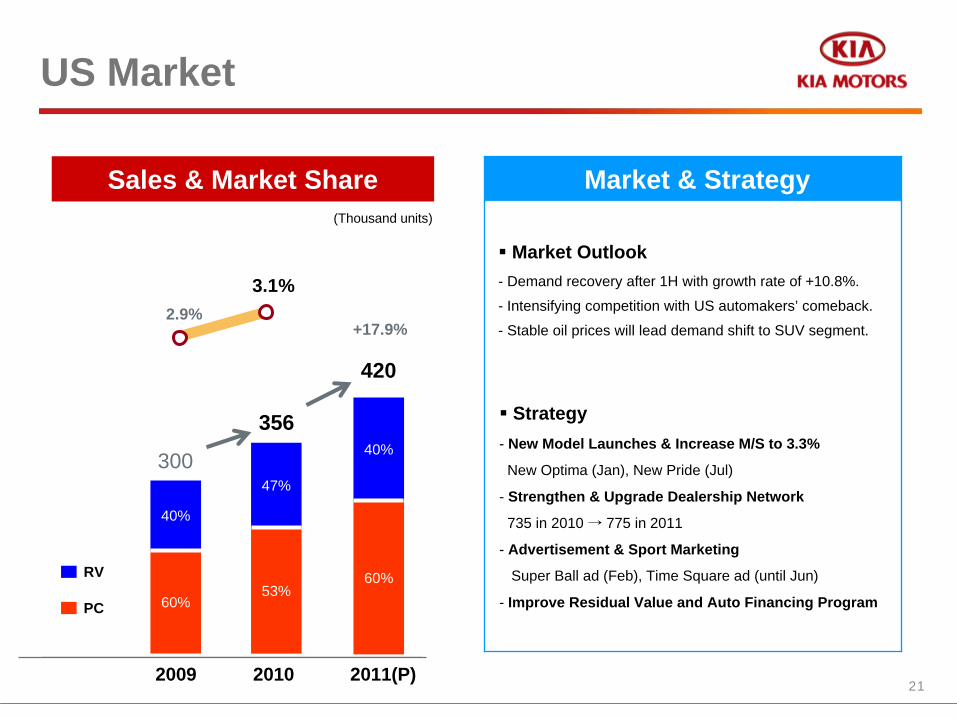
300
Sales & Market Share
2.9%
40%
60%
3.1%
PC
RV
47%
53%
40%
60%
356
420
US Market
+17.9%
Market & Strategy
‘09 ‘10 ‘11[P2009 2010 2011(P)
Market Outlook - Demand recovery after 1H with growth rate of +10.8%.
- Intensifying competition with US automakers’ comeback.
- Stable oil prices will lead demand shift to SUV segment.
Strategy- New Model Launches & Increase M/S to 3.3%
New Optima (Jan), New Pride (Jul)
- Strengthen & Upgrade Dealership Network
735 in 2010 → 775 in 2011
- Advertisement & Sport Marketing
Super Ball ad (Feb), Time Square ad (until Jun)
- Improve Residual Value and Auto Financing Program
(Thousand units)
22
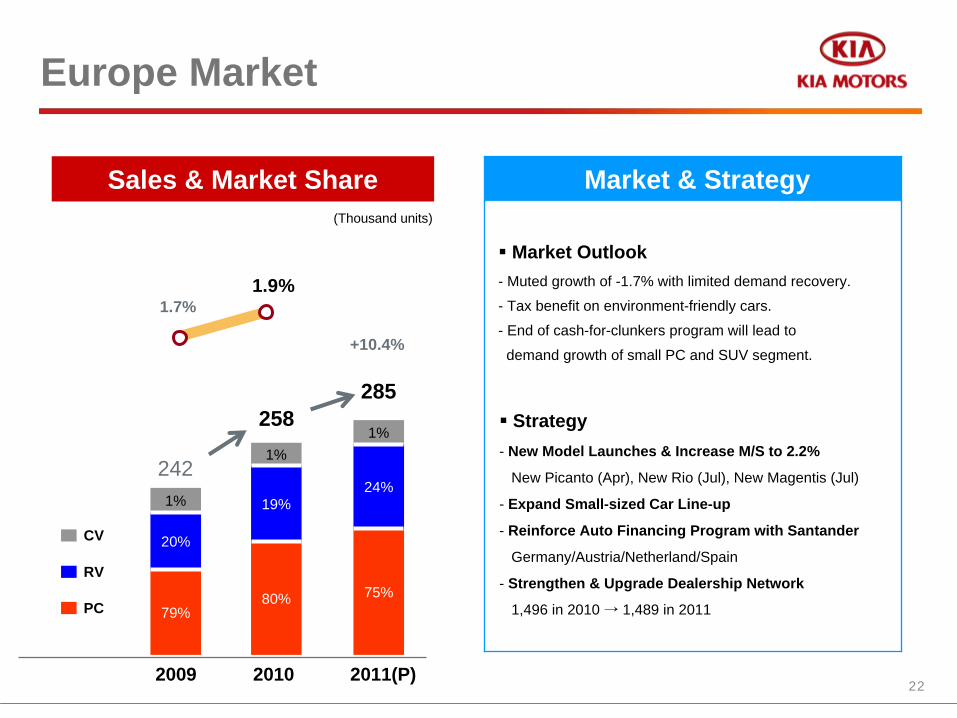
242
Sales & Market Share
1.7%
1%
20%
79%
1.9%
PC
RV
CV
1%
19%
80%
1%
24%
75%
258285
Europe Market
+10.4%
Market & Strategy
2009 2010 2011(P)
(Thousand units)
Market Outlook - Muted growth of -1.7% with limited demand recovery.
- Tax benefit on environment-friendly cars.
- End of cash-for-clunkers program will lead to
demand growth of small PC and SUV segment.
Strategy- New Model Launches & Increase M/S to 2.2%
New Picanto (Apr), New Rio (Jul), New Magentis (Jul)
- Expand Small-sized Car Line-up
- Reinforce Auto Financing Program with Santander
Germany/Austria/Netherland/Spain
- Strengthen & Upgrade Dealership Network
1,496 in 2010 → 1,489 in 2011
23
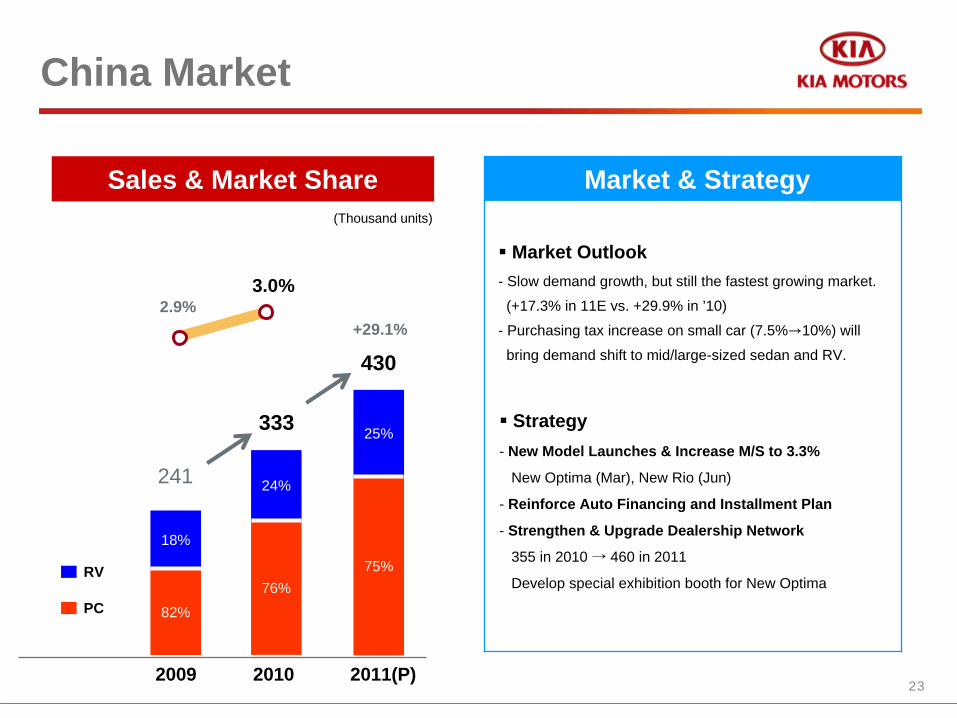
241
Sales & Market Share
2.9%
18%
82%
3.0%
PC
RV
24%
76%
25%
75%
333
430
China Market
+29.1%
Market & Strategy
2009 2010 2011(P)
(Thousand units)
Market Outlook - Slow demand growth, but still the fastest growing market.
(+17.3% in 11E vs. +29.9% in ’10)
- Purchasing tax increase on small car (7.5%→10%) will
bring demand shift to mid/large-sized sedan and RV.
Strategy- New Model Launches & Increase M/S to 3.3%
New Optima (Mar), New Rio (Jun)
- Reinforce Auto Financing and Installment Plan
- Strengthen & Upgrade Dealership Network
355 in 2010 → 460 in 2011
Develop special exhibition booth for New Optima

24
Sales & Market Share
Rest of World
Strategy
Sales by Region2010 2011[P] Growth
Rest of World 100% 100% +8.0%
Middle East/Africa 39% 38% +5.6%
East Europe 20% 21% +13.9%(Russia) (16%) (17%) (+16.9%)
South America 21% 20% +5.5%
Asia & Pacific 12% 12% +6.8%
Canada 8% 9% +13.2%455
7%
31%
62%PC
RV
CV
8%
28%
64%
7%
30%
63%
657710
+8.0%
‘09 ‘10 ‘11[]2009 2010 2011(P)
(Thousand units)
- Ride on new model sales momentum : New Picanto, New Rio, New Optima (Dec ’10)
- Increase market leadership in focused countries : Middle East (Africa), East Europe (Russia), South America
- Strengthen and upgrade dealership network