2010 dac report on multilateral aid
TRANSCRIPT
2010 DAC REPORT
ON MULTILATERAL AID
This second DAC Report on Multilateral Aid covers recent trends in multilateral aid and total use (core and non-core) of the multilateral system, with a special focus on UNDP and World Bank trust funds. It explores development perspectives of the climate change funding architecture, and provides an overview of the response of multilaterals to the financial and economic crisis. It also includes an update on members’ multilateral strategies and assessment approaches.
2
TABLE OF CONTENTS
ACKNOWLEDGEMENTS ............................................................................................................................ 7
EXECUTIVE SUMMARY ............................................................................................................................. 8
General Trends in the Multilateral System .................................................................................................. 8 Total use of the multilateral system ........................................................................................................... 10 Non-Core or ―Multi-bi‖ Aid ...................................................................................................................... 11 Non-core funding of the World Bank and UNDP ...................................................................................... 12 Development Perspectives for a Post-Copenhagen Climate Funding Architecture ................................... 13 Developments in the Multilateral System .................................................................................................. 14 Multilateral Strategies and Evaluation 2009-10 ......................................................................................... 14
CHECKLIST OF MAIN FINDINGS ............................................................................................................ 17
1. GENERAL TRENDS IN MULTILATERAL SYSTEM AND THEIR POLICY IMPLICATIONS ....... 19
1. Why multilateral ODA? ......................................................................................................................... 20 2. Main Trends ........................................................................................................................................... 21 3. Total Use of the Multilateral System ..................................................................................................... 34 Main Findings ............................................................................................................................................ 35 Questions for Future Policy Discussions ................................................................................................... 36
2. NON-CORE FUNDING OF MULTILATERALS ................................................................................... 37
1. Overview of DAC Members‘ Non-Core Funding ................................................................................. 37 2. Main issues Relating to Non-Core Funding of Multilaterals ................................................................. 38 3. Level of Non-Core Earmarking and Country-level Delivery of Aid ..................................................... 40 Main Findings ............................................................................................................................................ 43 Questions for Future Policy Discussions ................................................................................................... 43
3. NON-CORE FUNDING OF UNDP AND THE WORLD BANK ........................................................... 44
1. United Nations Development Programme (UNDP) ............................................................................... 45 2. The World Bank Group ......................................................................................................................... 50 3. UN and World Bank Trust Fund collaboration ...................................................................................... 56 Main Findings ............................................................................................................................................ 57
4. DEVELOPMENT PERSPECTIVES FOR A POST-COPENHAGEN CLIMATE FUNDING
ARCHITECTURE ......................................................................................................................................... 58
1. Introduction ............................................................................................................................................ 58 2. Sources of funding ................................................................................................................................. 59 3. Integration with Country-level Strategies .............................................................................................. 60 4. Current external public funding to address climate change ................................................................... 66 Future work ................................................................................................................................................ 69

3
Main Findings ............................................................................................................................................ 69 Questions for Future Policy Discussion ..................................................................................................... 70
5. DEVELOPMENTS IN THE MULTILATERAL SYSTEM IN 2009/10 .................................................. 71
Introduction ................................................................................................................................................ 71 1. Ongoing Reforms ................................................................................................................................... 71 2. How Have Multilateral Agencies Responded to the Global Economic Crisis? ..................................... 77 3. Resource Mobilisation: Capital Increase and Replenishments .............................................................. 82 Main Findings ............................................................................................................................................ 83
6. MULTILATERAL STRATEGIES AND EVALUATION IN 2009-2010 ............................................... 84
1. DAC Members‘ Multilateral Strategies ................................................................................................. 84 2. Evaluation of multilateral organisations ................................................................................................ 86 Main Findings ............................................................................................................................................ 88 Questions for Future Policy Discussions ................................................................................................... 88
ANNEX 1 ...................................................................................................................................................... 90 ANNEX 2 .................................................................................................................................................... 101 ANNEX 3 .................................................................................................................................................... 128 ANNEX 4 .................................................................................................................................................... 136 ANNEX 5 .................................................................................................................................................... 140
Tables
Table 1.1: Multilateral organisations receiving top 82% of multilateral ODA .......................................... 26 Table 1.2: DAC Gross Multilateral ODA Disbursements, Five-year average (2004-2008), constant 2008
USD ........................................................................................................................................................... 28 Table 1.3: Concentration Ratio of Multilateral and Bilateral Donors in Low-income Countries (LICs),
2008 ........................................................................................................................................................... 33 Table 2.3: Channels of CPA in nine partner countries .............................................................................. 43 Table 3.1: DAC contributions to UNDP 2007-2008 .................................................................................. 46 Table 3.2: World Bank Group Trust Fund Typology ................................................................................ 51 Table 3.3: DAC* Non-Core Contributions to the World Bank, 2007-8 .................................................... 51 Table 4.1: Funds disbursed for climate change to date .............................................................................. 67 Table 5.1: DAC share of calls for Recapitalisation and Replenishment .................................................... 82
Figures
Figure 0.1: Gross ODA provided by DAC member countries 1989-2008 .................................................. 8 Figure 0.2: Aid provided by DAC countries to select multilaterals (five-year average) ............................. 9 Figure 0.3: Gross ODA Disbursements in 2008 (excluding debt relief, contributions from EU Institutions
and Korea) .................................................................................................................................................. 11 Figure 0.4: Total use of the multilateral system, 2008 gross disbursements ............................................. 12 Figure 1.1: DAC Countries‘ Multilateral ODA (core, excluding Korea): Gross disbursements, outflows
and reflows, 1999-2008 ............................................................................................................................. 20 Figure 1.2: Gross ODA provided by DAC member countries 1989-2008 ................................................ 21 Figure 1.3: Gross Multilateral ODA Provided by DAC Member Countries as Share of Total ODA 1989-
2008 in 2008 constant USD ....................................................................................................................... 22 Figure 1.4: 2008 Gross DAC Bilateral ODA and Gross Multilateral Outflows (not including Korea) ..... 23 Figure 1.5: Multilateral ODA (excluding to EU) as % gross ODA, 2006-8 average ................................ 24 Figure 1.6: Aid provided by DAC countries to select multilaterals (five-year average) ........................... 30 Figure 1.7: Percent change in Country Programmable Aid (CPA): Bilateral and Multilateral Outflows . 31 Figure 1.8: Composition of Global Country Programmable Aid ............................................................... 32

4
Figure 1.9: Composition of gross multilateral outflows 2007 and 2008 .................................................... 32 Figure 1.10: Country Programmable Aid (CPA) to Low-Income Countries by Development Status and
MDG performance, 2009 ........................................................................................................................... 34 Figure 1.11: Gross ODA Disbursements in 2008 (excluding debt relief, contributions from EU
Institutions and Korea) ............................................................................................................................... 35 Figure 2.1: 2008 Gross non-Core multilateral ODA disbursements as share of reported total use of the
multilateral system (%), excluding to EU Institutions ............................................................................... 38 Figure 2.2: Total use of the multilateral system, 2008 gross disbursements ............................................. 40 Figure 2.3 Gross terms, 2008 USD (excluding debt relief) ....................................................................... 41 Figure 2.4: Share of flows going to Fragile and Conflict-affected States .................................................. 42 Figure 3.1: Methods of Providing Earmarked ODA to the United Nations ............................................... 48 Figure 3.2: Regional distribution of World Bank Recipient-Executed Trust Funds, 2008 ........................ 53 Figure 3.3: Components of World Bank Group‘s Trust Fund Portfolio, FY 2009 .................................... 54 Figure 4.1: Institutional framework for climate change in Bangladesh ..................................................... 61 Figure 4.2: Chart of existing multilateral climate change funds ................................................................ 65 Figure 5.1: Debt Sustainability Framework for LICs ................................................................................ 76
Boxes
Box 1.1: Definition of multilateral ODA ................................................................................................... 19 Box 1.2: Multilateral Agencies Reporting to the DAC .............................................................................. 25 Box 2.1: Definitions of Multilateral ODA and Non-Core or Multi-bi ODA ............................................. 37 Box 3.1: Methodological Issues relating to Non-Core Multilateral ODA ................................................. 44 Box 3.2: UNEP‘s Voluntary Indicative Scale of Contributions ................................................................ 45 Box 3.3: Local Resources to UNDP .......................................................................................................... 47 Box 3.4: Co-ordinated Approaches: the MDG Achievement Fund ........................................................... 50 Box 3.5: World Bank Trust Funds in Indonesia ........................................................................................ 55 Box 3.6: The World Bank‘s State and Peacebuilding Fund....................................................................... 56 Box 3.7: UNDP and World Bank Multi-donor Trust Funds ...................................................................... 57 Box 4.1: Mitigation and Adaptation .......................................................................................................... 59 Box 5.1: Recommendations of the Zedillo Commission Report ............................................................... 72 Box 5.2: Recommendations of the Manuel Committee‘s Report .............................................................. 73 Box 5.3: Proposals for the further improvement of UN system-wide coherence related to operational
activities for development .......................................................................................................................... 73 Box 5.4: Global food crisis initiatives ....................................................................................................... 76 Box 5.5: The IMF‘s Response to the Crisis ............................................................................................... 77 Box 5.6: The World Bank Group‘s Response to the Crisis ....................................................................... 78 Box 5.7: DFID Core Funding to the GAVI Alliance: Long-Term Funding Mechanism ........................... 83 Box 6.1: Performance Funding in the UN: the UK's Approach ................................................................. 86 Box 6.2: MOPAN and the DAC‘s Evaluation Network ............................................................................ 87

5
ABBREVIATIONS AND ACRONYMS
AAA Accra Agenda for Action
AfDB African Development Bank
AfDf African Development Fund
AsDB Asian Development Bank
AsDF Asian Development Fund
BETF Bank-Executed Trust Fund
BRICs Brazil, Russia, India and China
CarDB Caribbean Development Bank
CDM Clean Development Mechanism
CGIAR Consultative Group on
International Agricultural Research
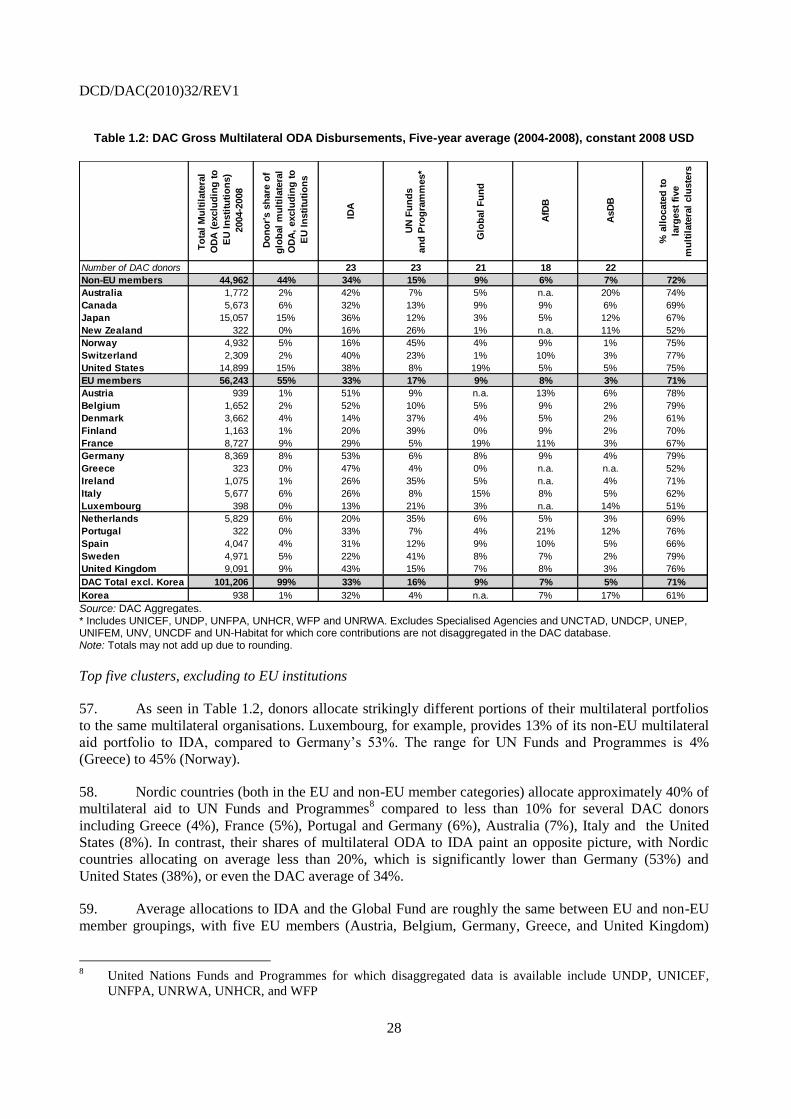
CIFs Climate Investment Funds
COP Conference of Parties
CPA Country programmable aid
CRS Creditor Reporting System (OECD)
CTF Clean Technology Fund
(World Bank)
DAC Development Assistance
Committee (OECD)
EBRD European Bank for Reconstruction
and Development
EC European Commission
ECOSOC Economic and Social Council (UN)
EDF European Development Fund
EFA-FTI Education for All – Fast Track
Initiative
EU European Union
FAO Food and Agriculture Organisation
FCPF Forest Carbon Partnership Facility
(World Bank)
FIF Financial Intermediary Fund
FIP Forest Investment Program
(World Bank)
GEF Global Environment Facility
GHG Greenhouse gases
GNI Gross National Income
HIPC Heavily Indebted Poor Country
IATI International Aid Transparency
Initiative
IBRD International Bank for
Reconstruction and Development
IDA International Development
Association
IDB Inter-American Development Bank
IFAD International Fund for Agriculture
Development
IFIs International Financial Institutions
IMF/‖Fund‖ International Monetary Fund
LDC Least Developed Country
LDCF Least Developed Country Fund
(UNFCCC)
LIC Low-income Country
MDBs Multilateral Development Banks
MDGs Millennium Development Goals
MDRI Multilateral Debt Relief Initiative
MDTF Multi-donor Trust Fund
MOPAN Multilateral Organisations
Performance Assessment Network
MTEF Medium-term Expenditure
Framework
NAPA National Adaptation Plan of Action
ODA Official Development Assistance
OECD Organisation for the Economic
Co-operation and Development
OOF Other official flows
PCCF Public climate change financing
PPCR Pilot Program for Climate
Resilience (World Bank)
PRS Poverty Reduction Strategy
RETF Recipient-Executed Trust Fund
SCCF Strategic Climate Change Fund
(UNFCCC)
SCF Strategic Climate Fund
(World Bank)
SDR Special Drawing Rights
SPA Strategic Priority on Adaptation
(GEF)
SREP Scaling-Up Renewable Energy
Program (World Bank)
UN United Nations
UNDP United Nations Development
Programme
UNEP United Nations Environment
Programme
UNFCCC United Nations Framework
Convention on Climate Change
UNFPA UN Population Fund
UNICEF UN Children‘s Fund
UNIFEM UN Development Fund for Women
UN-REDD UN Collaborative Programme on
Reducing Emissions from
Deforestation and Forest
Degradation in Developing
Countries
DCD/DAC(2010)32/REV1
6
UNRWA UN Relief and Works Agency for
Palestinian Refugees in the Near
East
WBG World Bank Group
WFP World Food Programme
WHO World Health Organisation

DCD/DAC(2010)32/REV1
7
ACKNOWLEDGEMENTS
This report was prepared by Emily Bosch, under the guidance of Andrew Rogerson. Fredrik Ericsson
provided statistical support and analysis. This report benefited from comments, inputs and suggestions
from many other colleagues, notably Suzanne Steensen, Kimberly Smith, Simon Scott, and Julia Benn. The
chapter on climate financing architecture benefited from inputs from, among others, Rémy Paris, Tamara
Levine, Alexandra Trzeciak-Duval, Richard Carey and the ENVIRONET Secretariat of DCD as well as
from Jane Corfee-Morlot and Helen Mountford of the Environment Directorate. Invaluable data support
was provided by Cécile Sangaré, Olivier Bouret, Andrzej Suchodolski, Elena Bernaldo and Aimée Nichols.
DAC Delegates and their colleagues at headquarters provided us with inputs throughout the process and
offered detailed and thorough comments in the final months of the report‘s preparation. Stephanie Coïc
designed the graphics and Stacey Bradbury and Claire Condon provided technical support. Colleagues at
UNDP, (Bruce Jenks, Jennifer Topping, Gerd Trogemann, Jennifer Moreau, Bibi Halima Khanam,
Mohamed Yar, Henriette Keijzers, and Amar Bokhari) and at the World Bank (Rocío Castro, Kjell
Nordlander, Christian Rey, Jane Kirby-Zaki, and Michael Koch), provided valuable information and kindly
reviewed the relevant sections of the report throughout its preparation.

DCD/DAC(2010)32/REV1
8
EXECUTIVE SUMMARY
1. The first DAC Report on Multilateral Aid was discussed in draft by the DAC in December 2008,
and published in June 2009. This second report takes up and updates this analysis. It covers recent trends in
multilateral aid; total use (core and non-core) of the multilateral system, with a special focus on UNDP and
World Bank trust funds; development perspectives on climate change funding architecture; and finally an
overview of the response of multilaterals to the financial and economic crisis. It provides an update on
members‘ multilateral strategies and assessment approaches.
General Trends in the Multilateral System
2. Today, DAC members report contributions to over 200 multilateral agencies in DAC statistics. In
turn, 23 of these agencies report their outflows to the DAC.
3. In the past 20 years, multilateral ODA has increased from USD 23 billion in 1989 to USD 35
billion in 2008 (Figure 0.1). The multilateral share of total ODA was relatively stable in this period,
ranging from 27% to 33%, excluding debt relief. Excluding contributions to EU institutions (which rose
faster than other components), the share of multilateral ODA declined slightly over these two decades,
from 22% in 1989 to 20% in 2008.
Figure 0.1: Gross ODA provided by DAC member countries 1989-2008
Source: DAC Aggregates.
4. Why provide multilateral ODA, and what might explain its flat or eroding share of growing
official development assistance? Some well-known arguments for providing multilateral aid were
advanced by donors in the 2008 DAC Report on Multilateral Aid (economies of scale, political neutrality
and legitimacy, large scale of capital and knowledge resources, lower unit costs, and the provision of
DCD/DAC(2010)32/REV1
9
public goods). In addition to these, this report considers the speed and flexibility of response by major
multilaterals to the financial and economic crisis. It also looks at evidence that multilateral aid may be less
geographically fragmented than bilateral aid, and that it delivers a higher proportion of country-
programmable aid than might be expected given the proportion of overall aid that is multilateral in the first
place.
5. Conversely, there are arguments typically advanced against providing multilateral aid. These
include multilateral agencies‘ perceived institutional complexity, procedures which can be cumbersome or
time-consuming, lack of transparency, higher absolute costs and salaries, remoteness and lack of
accountability. Core multilateral aid which is pooled before being allocated to partner countries also
reduces the visibility of a donor‘s assistance. More generally DAC members (see final section) continue to
report insufficient evidence of multilateral effectiveness and in particular of development impact and
value-for-money, despite multilateral agencies‘ major investments in evaluation, assessment, disclosure
and communication systems.
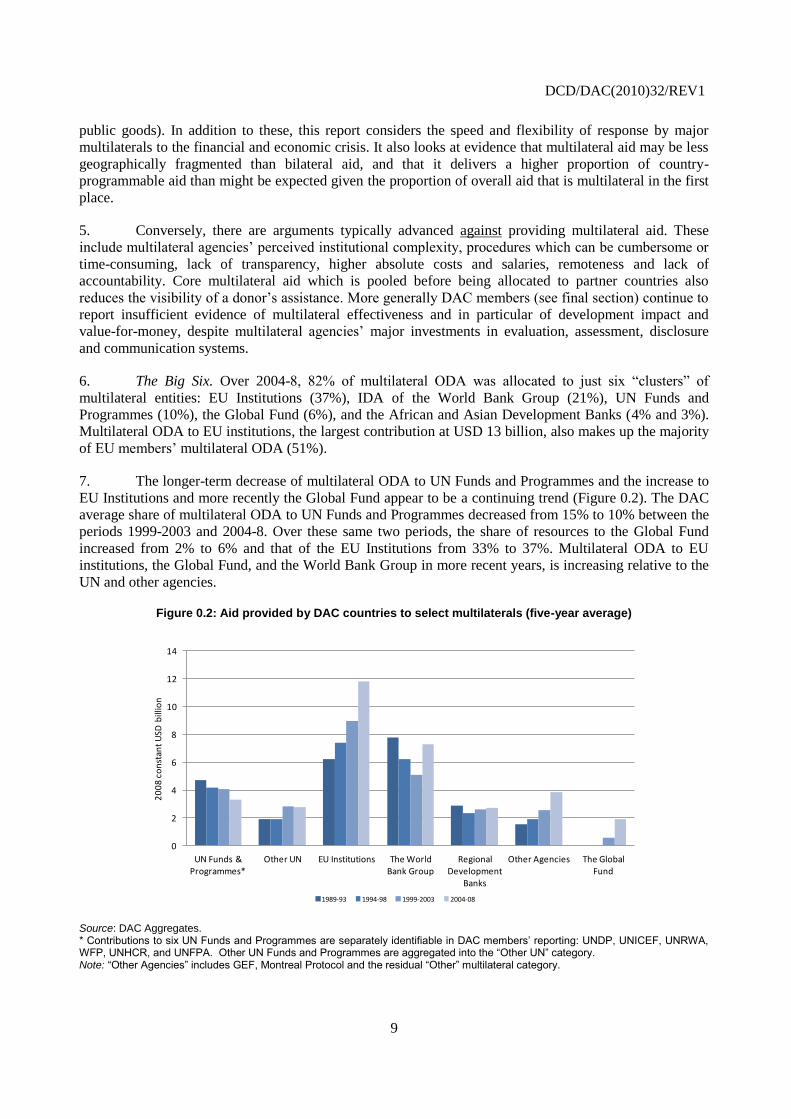
6. The Big Six. Over 2004-8, 82% of multilateral ODA was allocated to just six ―clusters‖ of
multilateral entities: EU Institutions (37%), IDA of the World Bank Group (21%), UN Funds and
Programmes (10%), the Global Fund (6%), and the African and Asian Development Banks (4% and 3%).
Multilateral ODA to EU institutions, the largest contribution at USD 13 billion, also makes up the majority
of EU members‘ multilateral ODA (51%).
7. The longer-term decrease of multilateral ODA to UN Funds and Programmes and the increase to
EU Institutions and more recently the Global Fund appear to be a continuing trend (Figure 0.2). The DAC
average share of multilateral ODA to UN Funds and Programmes decreased from 15% to 10% between the
periods 1999-2003 and 2004-8. Over these same two periods, the share of resources to the Global Fund
increased from 2% to 6% and that of the EU Institutions from 33% to 37%. Multilateral ODA to EU
institutions, the Global Fund, and the World Bank Group in more recent years, is increasing relative to the
UN and other agencies.
Figure 0.2: Aid provided by DAC countries to select multilaterals (five-year average)
0
2
4
6
8
10
12
14
UN Funds & Programmes*
Other UN EU Institutions The World Bank Group
Regional Development
Banks
Other Agencies The Global Fund
20
08
co
nst
ant
USD
bill
ion
1989-93 1994-98 1999-2003 2004-08
Source: DAC Aggregates. * Contributions to six UN Funds and Programmes are separately identifiable in DAC members’ reporting: UNDP, UNICEF, UNRWA, WFP, UNHCR, and UNFPA. Other UN Funds and Programmes are aggregated into the ―Other UN‖ category. Note: ―Other Agencies‖ includes GEF, Montreal Protocol and the residual ―Other‖ multilateral category.

DCD/DAC(2010)32/REV1
10
8. The “Long Tail”. Conversely, multilateral ODA to the remaining 200+ multilaterals accounts for
the other 18%, a share that is slowly shrinking. For the vast majority of these institutions, the DAC does
not receive reporting on their outflows to developing countries. However we know that many have
normative, standard-setting and technical mandates which are not best gauged in terms of their resource
transfers alone. Such mandates may oblige them to maintain broad geographical representation. This does
not necessarily mean they are ―fragmented‖ using standardised DAC metrics. Moreover, from the
perspective of countries they advise, they may not generate comparable transactions costs to those of a
small additional donor.
9. The 2008 DAC Report on Multilateral Aid examined the internal allocation processes of each
DAC member, both as between bilateral and multilateral aid and across multilaterals. In practice, these
choices are not determined simultaneously, and often not within the same ministry. Political decisions at
the margin, under fiscal pressure and factoring in both geographic and thematic priorities, and often the
balance between loans and grants, are the rule not the exception. It is also exceptional, but not unknown,
for countries to zero-base their contributions to some multilaterals, rather than maintain them at extremely
low levels with minimal staff capacity for oversight. Nonetheless, these ―portfolio‖ comparisons are useful
from the perspective of system-wide coherence.
10. A portfolio view. DAC donors allocate strikingly different portions of their multilateral portfolios
to the same major multilateral organisations. Luxembourg, for example, provides 13% of its non-EU
multilateral aid portfolio to IDA, compared to Germany‘s 53%. The range for UN Funds and Programmes
is 5% (France) to 45% (Norway), and even the relative share of the EU varies widely within the EU
membership.
11. Such large portfolio variations are significant in global policy terms to the extent that
contributions to each cluster can be considered voluntary and potentially fungible with others. For IDA
replenishments, participants negotiate contributions, which might well be heavily influenced by historic
shares, but are in principle discretionary. Contributions to UN Funds and Programmes, the Global Fund
and the African and Asian Development Funds are similarly voluntary. EU institutional funding is a mix of
a multi-year replenishment of the European Development Fund for assistance to Africa, the Caribbean and
the Pacific, based on negotiations and unanimous decisions about each member‘s contributions, and annual
EU budget attributions (following European Parliament and EU Council decisions) for other components
of the European Union‘s external action which qualify for ODA. A smaller fraction of overall multilateral
funding – relevant in particular for UN Specialised Agencies – is driven by assessed contributions, which
can be considered conditions of membership.
12. Non-DAC providers of multilateral support. Nineteen non-DAC members, of which Saudi Arabia
is the largest provider, report their aid flows to the DAC. They account for USD 8.8 billion of total non-
DAC aid, estimated between USD 12 and 14 billion, or 9 to 10 percent of global ODA according to recent
OECD estimates. Their multilateral share is on the whole higher than the DAC‘s, given that the majority
are recent EU members without large bilateral programmes of their own. This is unlikely to be true for the
BRICs, however, who are also members of many multilaterals, and are increasingly becoming contributors
to concessional funds, but whose bilateral programmes are growing even faster. Finally, mention should be
made of large foundation grants – overwhelmingly from the Bill and Melinda Gates Foundation – to some
of the global health partnerships, most notably the Global Fund and GAVI.
Total use of the multilateral system
13. In addition to multilateral ODA, donors choose to give non-core funding, earmarked for specific
sectors, themes, countries or regions and routed through multilateral agencies, as illustrated in Figure 0.3
below. Core multilateral ODA combined with non-core multilateral ODA constitutes the total use of the

DCD/DAC(2010)32/REV1
11
multilateral system. This represented 40% of total ODA in 2008, similar to the 2006 share. This proportion
may give a better indication of the role multilateral institutions play in the overall aid architecture today.
Figure 0.3: Gross ODA Disbursements in 2008 (excluding debt relief, contributions from EU Institutions and Korea)
Source: DAC Aggregates and Creditor Reporting System.
Non-Core or “Multi-bi” Aid
14. Australia, the United States, Norway and Spain have the highest non-core multilateral ODA as a
share of the reported total use of the multilateral system, well above the DAC average of 29%. France,
Greece and Germany have the lowest shares, though this may be partly due to under-reporting. The
volume of non-core funding is rising quickly from a relatively low base, but since this also coincides with
significantly better reporting, it is too early to tell if this forms a sustainable trend.
15. There are inherent tensions and complementarities in providing both core and non-core
contributions to multilateral organisations. From the point of view of the donor, providing non-core funds
to multilateral organisations allows it to target resources to specific sectors, regions or countries of interest,
with the kind of visibility that may be important to mobilise and to maintain public resources for
development.
16. From a multilateral organisation’s perspective, the supply of non-core funds can shift its overall
balance of activities. Non-core resources can incur higher transaction costs for the receiving organisation
considering the additional monitoring and reporting requirements that may be imposed. Governance
arrangements of earmarked funds may also offer less voice to partner countries in the decision-making
process, and/or limit Board oversight. On the other hand, non-core funds increase the overall envelope of
resources available to multilateral entities, allowing them to engage in a wider range of activities while
using existing institutional structures.
17. From an aid effectiveness perspective, multi-donor trust funds also have to be compared to the
alternative, which might be a proliferation of parallel bilateral initiatives, with their corresponding costs
and overlaps. However, the more DAC members‘ multilateral portfolios are shaped by non-core resources
with a limited time horizon, the less predictable the overall funding of multilaterals becomes.
DCD/DAC(2010)32/REV1
12
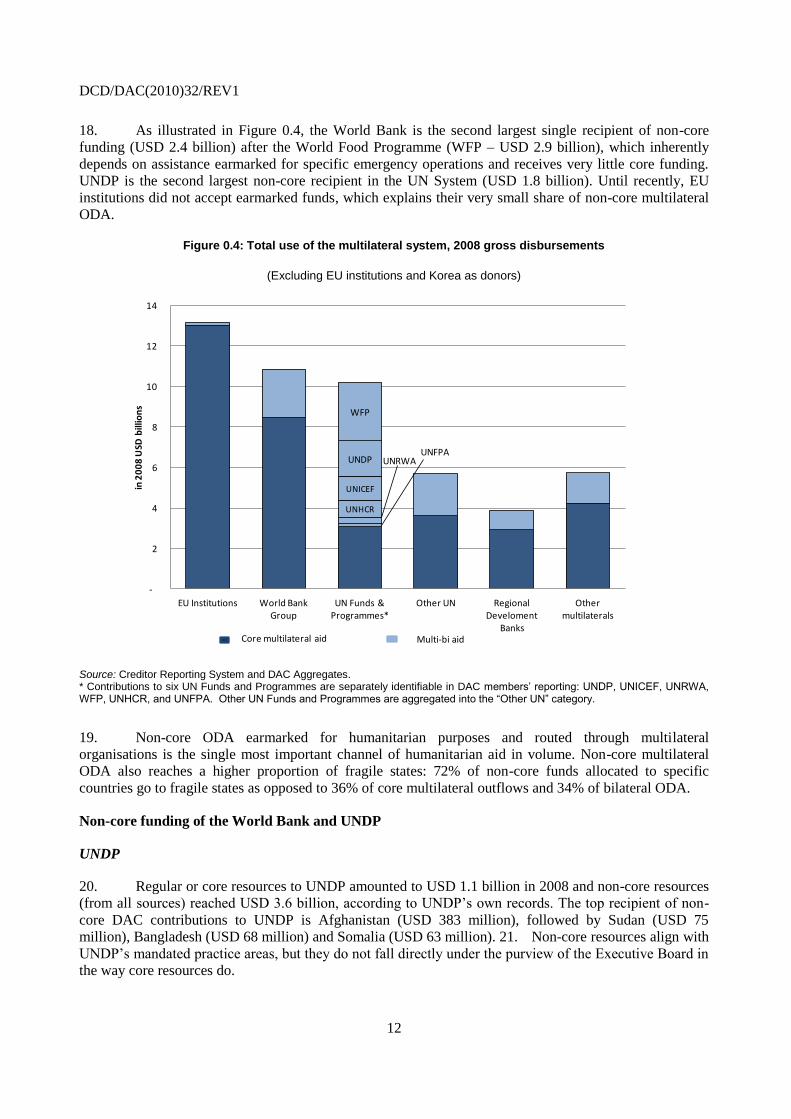
18. As illustrated in Figure 0.4, the World Bank is the second largest single recipient of non-core
funding (USD 2.4 billion) after the World Food Programme (WFP – USD 2.9 billion), which inherently
depends on assistance earmarked for specific emergency operations and receives very little core funding.
UNDP is the second largest non-core recipient in the UN System (USD 1.8 billion). Until recently, EU
institutions did not accept earmarked funds, which explains their very small share of non-core multilateral
ODA.
Figure 0.4: Total use of the multilateral system, 2008 gross disbursements
(Excluding EU institutions and Korea as donors)
UNFPAUNRWA
UNHCR
UNICEF
UNDP
WFP
-
2
4
6
8
10
12
14
EU Institutions World Bank Group
UN Funds & Programmes*
Other UN Regional Develoment
Banks
Other multilaterals
in 2
00
8 U
SD b
illio
ns
Core multilateral aid Multi-bi aid
Source: Creditor Reporting System and DAC Aggregates. * Contributions to six UN Funds and Programmes are separately identifiable in DAC members’ reporting: UNDP, UNICEF, UNRWA, WFP, UNHCR, and UNFPA. Other UN Funds and Programmes are aggregated into the ―Other UN‖ category.
19. Non-core ODA earmarked for humanitarian purposes and routed through multilateral
organisations is the single most important channel of humanitarian aid in volume. Non-core multilateral
ODA also reaches a higher proportion of fragile states: 72% of non-core funds allocated to specific
countries go to fragile states as opposed to 36% of core multilateral outflows and 34% of bilateral ODA.
Non-core funding of the World Bank and UNDP
UNDP
20. Regular or core resources to UNDP amounted to USD 1.1 billion in 2008 and non-core resources
(from all sources) reached USD 3.6 billion, according to UNDP‘s own records. The top recipient of non-
core DAC contributions to UNDP is Afghanistan (USD 383 million), followed by Sudan (USD 75
million), Bangladesh (USD 68 million) and Somalia (USD 63 million). 21. Non-core resources align with
UNDP‘s mandated practice areas, but they do not fall directly under the purview of the Executive Board in
the way core resources do.
DCD/DAC(2010)32/REV1
13
22. The UN Multi-Donor Trust Fund (MDTF) Office offers a ―one-stop-shop‖ for donors to
establish a single agreement with one UN organisation serving as the administrative agent (UNDP), instead
of entering into separate agreements with each relevant UN agency. MDTF activities and programmes are
actually implemented by over 40 UN agencies and some non-UN participating agencies. ―One UN‖ and
―Delivering as One‖ funds and other multi-donor trust funds may actually reduce transaction costs both for
UN agencies and partner governments and streamline efforts to bridge the financing gap at the country-
level.
The World Bank
23. As a share of combined Bank disbursements (IDA, IBRD, and trust funds), trust fund
disbursements (excluding Financial Intermediary Funds, which the Bank administers, but which do not
fund Bank operations) grew from 8% in fiscal year 2004 to 14% in fiscal year 2008. Trust funds have
enabled the Bank to provide additional or complementary financing to support fragile states and non-
member countries (e.g. Kosovo, and West Bank and Gaza) as well as to support countries facing
emergencies or natural disasters. There are also thematic or sector-specific trust funds, such as the
Education for All Fast Track Initiative (EFA-FTI). There is some evidence from a recent evaluation of
EFA-FTI that core IDA resources for education have been redirected to other country priorities, within an
overall performance-based country allocation, because of additional grant-financed trust funds earmarked
for this sector.
24. In 2007, the Bank launched a series of reforms aimed at enhancing the strategic alignment, risk
management, and efficiency of Bank-administered trust funds. As part of these reforms, the Bank
increased the minimum threshold for all new trust funds from USD 200,000 to USD 1 million and
introduced a new fee structure. Efforts are currently underway to enhance the alignment of trust funds with
Bank strategies and processes.
Development Perspectives for a Post-Copenhagen Climate Funding Architecture
25. The December 2009 Copenhagen Accord promises developing countries scaled up, predictable
and adequate funding to meet the challenges of climate change. Developed countries committed to provide
new and additional resources approaching USD 30 billion for the period 2010-2012 with balanced
allocation between adaptation and mitigation. They also committed to a goal of mobilising USD 100
billion dollars a year by 2020 to meet the needs of developing countries in this regard.
26. Key post-Copenhagen processes, including the next CoP-16 in Mexico, will need to mobilise
further resources and find robust mechanisms to measure climate change flows. At the moment, the DAC
―Rio marker‖ for climate change mitigation and the recently approved new marker for adaptation provide
the only systematic way for reporters to identify public finance flows that serve clearly defined adaptation
or mitigation objectives. However the markers are not by themselves a sufficient basis from which to
isolate the volume of spending going to these objectives compared to other development activities. Nor are
there agreed baselines against which additionality to ODA can be measured.
27. Despite a number of substantial commitments and much hard work implementing fiduciary and
management structures, actual disbursements have taken time. Today, cumulative disbursements by
existing global funds for climate change both inside and outside the UN Framework Convention for
Climate Change (UNFCCC) amount to only USD 2.9 billion since their inception, or about USD 246
million per year. To compare, the World Bank estimates total resources dedicated to climate change
mitigation and adaptation at USD 9-10 billion per year (USD 8-9 billion for mitigation and USD 1 billion
for adaptation).
DCD/DAC(2010)32/REV1
14
28. Arguments for creating parallel new funds simply because existing funds have not yet delivered
sufficient resources, or because the financial gaps for funding climate change mitigation and adaptation
efforts are so large, are not sufficient. Instead, it is important to draw lessons from global health funds, and
to start with an analysis of the functions and purposes of the envisaged new ventures to see whether
existing institutions fulfil these roles. Other configurations, including a ―networked‖ approach of
separating out functions and institutional responsibilities, may be equally desirable and/or manageable.
29. When plans are prioritised and integrated into a country‘s planning process to allow for active
participation of central and line ministries, civil society and the private sector, stakeholders can effectively
lead and steer efforts to address the effects of and to mitigate climate change. The ideal climate fund model
will provide flexible external resources to support intrinsically integrated interventions anchored in a
country‘s climate or national development strategy. New proposal-based systems should be avoided as
they usually require complex appraisal systems with high transaction costs for partner countries.
Developments in the Multilateral System
30. All multilateral agencies covered in this report have established specific reform programs to
attain one or more of the following objectives: (i) to become more effective and efficient, applicable to all
agencies; (ii) to ensure greater policy coherence for development, as in the case of EU Institutions;; (iii) to
reduce fragmentation, particularly as this affects the UN system; and (iv) to achieve governance and voting
structures that are more aligned with their membership, in particular the challenge faced by the Bretton
Woods Institutions.
31. Multilateral agencies reacted quickly to demands from partner countries for additional resources
as a result of the economic and financial crisis in 2009. In part as a result of this high crisis-related demand
and subsequently large disbursements, 2010 requires donors to make simultaneous decisions on the
replenishment and recapitalisation of several major concessional funds and multilateral development
banks.
Multilateral Strategies and Evaluation 2009-10
32. Finland, Portugal, Netherlands and Belgium have developed new multilateral strategies since the
2008 report. Of particular note, Belgium has adopted a policy shifting most of its contributions to
multilateral agencies towards full core resources, thus decreasing its non-core multilateral ODA over time.
Some donors (e.g. the UK) are also making additional voluntary core contributions, mostly linked to
performance targets set by the institutions themselves, as an alternative approach.
33. DAC members continue to report a need for better evidence of multilateral impact and
effectiveness for domestic accountability purposes, which may be enhanced by fiscal stringencies post-
crisis and the coincidence of major replenishment negotiations. They see an increasing need to justify
multilateral contributions – over which they have less direct oversight – to a sceptical public, and may
therefore require even more detailed reporting on the impact of these organisations in developing countries
than they possess for their own operations. How well multilateral organisations report this information
back to donors, and how well DAC members in turn represent them domestically, may influence domestic
constituents‘ perception of these organisations as much as the substantive evidence available.
34. As first discussed in the 2008 DAC Report on Multilateral Aid, ideally reporting by multilateral
agencies should be sufficiently comprehensive so as to satisfy bilateral donor information requirements,
making separate donor-driven assessments unnecessary. Indeed, a shift towards self-reporting by
multilaterals would be a way to apply Paris Declaration principles of ―ownership‖ and ―alignment‖ to the
funding of these organisations. Until such reporting is deemed adequate, however, collective assessments

DCD/DAC(2010)32/REV1
15
intended to lead to full harmonisation of monitoring instruments for multilaterals are at least an
improvement over a proliferation of single-donor assessment efforts.
35. Such harmonised efforts include the Multilateral Organisations‘ Performance Assessment
Network (MOPAN), and the work of the DAC‘s Evaluation Network. The latter is involved in peer
reviewing organisations‘ evaluation capacities. It is also developing an approach to joint assessments of the
development effectiveness of multilaterals, by combining elements of MOPAN assessments with reviews
of organisations‘ own evaluations on development results.
36. The 2011 DAC Report on Multilateral Aid will examine DAC members‘ processes and evidence
base used to allocate between their bilateral and multilateral aid, and in turn among the larger multilateral
organisations to which they contribute. It will look at whether such choices are made deliberately and
coherently or can only be inferred from multiple separate decision points within and across agencies and
government departments.

DCD/DAC(2010)32/REV1
16
Questions for Further Discussion: Issues being reviewed at the Development Assistance Committee
What explains the flat historical multilateral share of ODA? Which arguments for and against greater pooling have the most traction in the current context?
Should future work focus on the 15 multilaterals (6 clusters) which claim 82% of multilateral ODA volume, or also attempt to rationalise the 18% ―long tail‖?
What are the main determinants of large variations in multilateral portfolio choices across DAC members? Are any likely to be amenable to improved information sharing?
Are new non-DAC and non-EU funding sources less focused on multilaterals? If so, why and how might this change?
Is the EU a special case that requires a different analytical approach? If so, in what way?
Is there a growing trend towards non-core funding? What might the development effectiveness implications?
How might one envisage monitoring ―new and additional‖ funding for climate change?
Future efforts by the DAC’s Evaluation Network and MOPAN aim to combine surveys of multilateral effectiveness with better impact reporting by the multilaterals themselves. Is this the right mix?
Bilateral donors have reported an inability to demonstrate multilateral effectiveness. Is this primarily due to underlying multilateral performance problems, lack of robust data, or communication gaps?
DCD/DAC(2010)32/REV1
17
CHECKLIST OF MAIN FINDINGS
General Trends in the Multilateral System
As overall levels of ODA increase, the multilateral share of ODA is flat, or eroding when
contributions to EU Institutions are excluded. (Paragraph 43)
In many cases, donors allocate very different shares of their multilateral portfolio to the same
multilateral agencies. (Paragraph 54)
Non-DAC EU members reporting to the DAC have a high multilateral share, but this is unlikely
to be the case for the BRICs. (Paragraph 49)
Between 2004-8, on average 82% of DAC members‘ multilateral ODA went to six clusters of
organisations: EU institutions, IDA, UN Funds and Programmes, the Global Fund, and the
African and Asian Regional Development Banks (15 institutions in all). Conversely multilateral
ODA to the remaining 200+ multilateral organisations accounts for only 18%. (Paragraph 52)
Recent trends indicate a decrease in the core multilateral funding of UN Funds and Programmes
and an increase in funding to EU institutions and the Global Fund. (Paragraph 63)
Multilateral outflows are on balance more flexible in the short term as demonstrated by their
crisis response. (Paragraph 65)
Multilateral outflows are also more geographically concentrated and deliver 37% of country
programmable aid compared to bilateral flows, but this is subject to qualifications. (Paragraphs
66 & 70)
The total use of the multilateral system by DAC donors (core multilateral ODA plus bilateral
earmarked ODA channelled through multilateral organisations) was 40% of total ODA in 2008.
Indeed, this proportion may give a better indication of the role multilateral institutions play in the
overall aid architecture today. (Paragraph 74)
Non-core Funding of Multilateral Organisations
In 2008, 29% of DAC countries‘ total aid transiting through the multilateral system was
earmarked (non-core). This rises to 39% when excluding all contributions to EU Institutions.
(Paragraph 78)
Donors earmark funds to target specific countries and sectors and to have greater visibility and
influence in the multilateral system. (Paragraphs 80 & 81)
From a multilateral organisation‘s perspective, excessive earmarking risks hollowing out the
governance of an organisation and complicates accountability, but it may be better than the
alternative of multiple single-donor parallel initiatives. (Paragraphs 83 & 84)
Non-core, or earmarked, multilateral ODA is the single-most important channel for humanitarian
aid. It also targets a higher proportion of fragile states than multilateral outflows or bilateral
ODA. (Paragraphs 89 & 90)

DCD/DAC(2010)32/REV1
18
Non-core Funding of UNDP and the World Bank
UNDP non-core funding is used for similar thematic areas as its core funding. Funding to the
Multi-Donor Trust Fund Office helps align donors and UN agencies at a country-level, e.g.
through the ―One UN‖ funds. (Paragraph 104)
World Bank non-core flows help diversify its portfolio to countries where loan instruments are
unavailable (e.g. for arrears reasons or to non-members). (Paragraph 118)
Development Perspectives for a post-Copenhagen Climate Funding Architecture
The ideal climate fund model will provide flexible external resources to support intrinsically
integrated interventions anchored in a country‘s climate or national development strategy.
(Paragraph 153)
New complex proposal-based systems should be avoided as they usually require complex
appraisal systems with high transaction costs for partner countries. (Paragraph 152)
Instead of creating new funding mechanisms, it may be equally desirable for donors to examine
existing functions and determine whether existing institutions can perform those functions using
a ―networked‖ approach with each institution fulfilling an institutional responsibility. (Paragraph
154)
Total public resources currently dedicated to climate change mitigation and adaptation in
developing countries are estimated at roughly USD 10 billion per year. Existing climate change
funds have to-date disbursed on average only USD 246 million per year. (Paragraphs 155 &
159)
As Parties to UNFCCC discuss the additionality question, it will be important to apply and
improve OECD members‘ reporting using the markers for climate change mitigation and
adaptation as rapidly as possible. (Paragraph 136)
Developments in the Multilateral System and Evaluation
The World Bank and the IMF are moving forward with reforms towards a more representative
governance structure. Internal reforms also aim to provide more flexible and more adapted
instruments for their clients. (Paragraphs 175-178)
The year 2010 requires donors to make simultaneous decisions on the replenishment and
recapitalisation of major concessional funds and multilateral development banks. (Paragraph
206)
In the longer-term, self-assessments by multilateral agencies should be sufficiently
comprehensive to satisfy bilateral donor information requirements, making separate bilateral
evaluations and/or assessments unnecessary. (Paragraph 220)
Until self-reporting is deemed ―adequate‖, collective assessments intended to lead to full
harmonisation of monitoring instruments for multilaterals are encouraged as an improvement
over multiple single-donor assessment efforts. (Paragraph 221)

DCD/DAC(2010)32/REV1
19
1. GENERAL TRENDS IN MULTILATERAL SYSTEM AND THEIR POLICY
IMPLICATIONS
37. This chapter presents a picture of the evolving multilateral aid, updating the overall trends from
the 2008 DAC Report on Multilateral Aid with data through 2008. It sets this out by looking at historical
and main trends in multilateral aid, including the composition of multilateral ODA and members‘
multilateral portfolio choices. It also includes an introduction to the next chapter on non-core multilateral
aid.
38. Throughout the report we distinguish between (a) multilateral ODA (see Box 1.1), measured as
the funding to multilateral organisations (inflows to multilateral organisations); and (b) multilateral
outflows from those agencies to partner countries. Today, members report contributions to over 200
multilateral agencies in DAC statistics. In turn, 23 of these multilateral agencies report their core outflows
to the DAC (see Box 1.2). References to multilateral outflows in this report refer to concessional outflows
only. Korea became a DAC member in December 2009, so for data purposes will be included in the group
DAC Members starting for 2010 data; however, it is included as a separate line in tables and in Annex 2 of
this report.
Box 1.1: Definition of multilateral ODA
Multilateral ODA is a contribution made to a recipient institution that:
Conducts all or part of its activities in favour of development;
Is an international agency, institution or organisation whose members are governments, or a fund managed autonomously by such an agency; and
Pools contributions so that they lose their identity and become an integral part of its financial assets.
Multilateral ODA includes both assessed and voluntary un-earmarked contributions.
Source: DAC Statistical Reporting Directives.
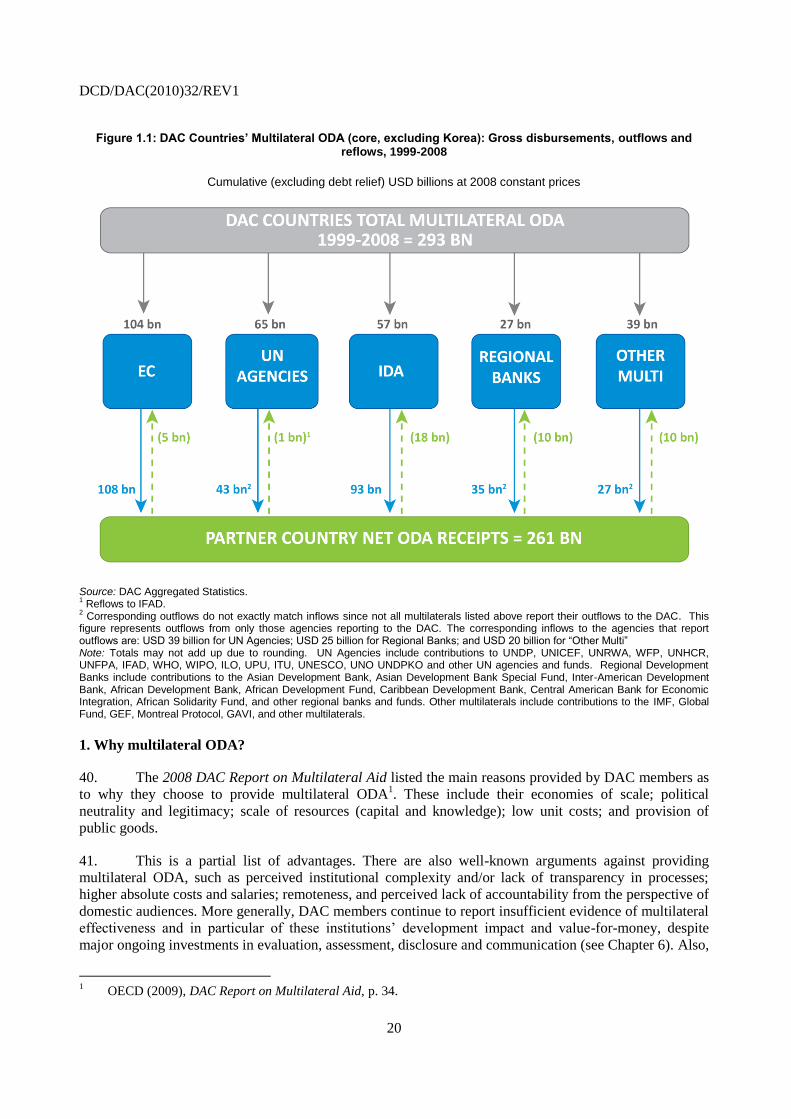
39. Figure 1.1 below illustrates inflows, outflows, and reflows of the multilateral system. DAC
countries‘ multilateral ODA, or inflows to agencies, is represented by the top grey arrows. The blue arrows
in the bottom half of the figure are the corresponding outflows from these agencies, and the dotted green
arrows pointing upwards represent the reflows, or loan repayments, back to these agencies from partner
countries. For IDA, for example, the volume shown at the top, under the grey arrow is significantly less
than the volume of the outflow next to the blue arrow. This is because they are able to leverage reflows
from earlier concessional loans and transfers from other windows in addition to fresh resources (inflows)
provided by contributors to replenishments.
DCD/DAC(2010)32/REV1
20
Figure 1.1: DAC Countries’ Multilateral ODA (core, excluding Korea): Gross disbursements, outflows and reflows, 1999-2008
Cumulative (excluding debt relief) USD billions at 2008 constant prices
Source: DAC Aggregated Statistics. 1 Reflows to IFAD.
2 Corresponding outflows do not exactly match inflows since not all multilaterals listed above report their outflows to the DAC. This
figure represents outflows from only those agencies reporting to the DAC. The corresponding inflows to the agencies that report outflows are: USD 39 billion for UN Agencies; USD 25 billion for Regional Banks; and USD 20 billion for ―Other Multi‖ Note: Totals may not add up due to rounding. UN Agencies include contributions to UNDP, UNICEF, UNRWA, WFP, UNHCR, UNFPA, IFAD, WHO, WIPO, ILO, UPU, ITU, UNESCO, UNO UNDPKO and other UN agencies and funds. Regional Development Banks include contributions to the Asian Development Bank, Asian Development Bank Special Fund, Inter-American Development Bank, African Development Bank, African Development Fund, Caribbean Development Bank, Central American Bank for Economic Integration, African Solidarity Fund, and other regional banks and funds. Other multilaterals include contributions to the IMF, Global Fund, GEF, Montreal Protocol, GAVI, and other multilaterals.
1. Why multilateral ODA?
40. The 2008 DAC Report on Multilateral Aid listed the main reasons provided by DAC members as
to why they choose to provide multilateral ODA1. These include their economies of scale; political
neutrality and legitimacy; scale of resources (capital and knowledge); low unit costs; and provision of
public goods.
41. This is a partial list of advantages. There are also well-known arguments against providing
multilateral ODA, such as perceived institutional complexity and/or lack of transparency in processes;
higher absolute costs and salaries; remoteness, and perceived lack of accountability from the perspective of
domestic audiences. More generally, DAC members continue to report insufficient evidence of multilateral
effectiveness and in particular of these institutions‘ development impact and value-for-money, despite
major ongoing investments in evaluation, assessment, disclosure and communication (see Chapter 6). Also,
1 OECD (2009), DAC Report on Multilateral Aid, p. 34.
DCD/DAC(2010)32/REV1
21
advantages and disadvantages need to be contextualised by donor country situations (for example, a
bilateral sharply focused on one region may prefer to act directly there, but use multilaterals as cost-
effective extensions elsewhere). The transactions cost case is neither straightforward, nor comparable
across institutions.
42. Even so, this report adds three more considerations why multilateral ODA might be an attractive
channel. First, a large portion of multilateral donors on the whole have more concentrated outflows than
bilateral donors, using the recent Secretariat definition of concentration2, which recognises the higher
proportion of countries in which they operate at or above their global share of aid. This is largely explained
by the fact that multilaterals are mostly mandated to apply rules-based allocation mechanisms that tend to
ensure a smoother geographical spread, relative to country income and population. Second, multilaterals
deliver a higher proportion of country programmable aid (CPA) than might be expected given the
proportion of overall aid that is multilateral in the first place. Both concentration levels and CPA are
discussed further in this chapter. Third, multilaterals demonstrated flexibility and were able to react
quickly to increase their outflows in response to the recent economic and financial crisis.
2. Main Trends
More aid, eroding multilateral share
Figure 1.2: Gross ODA provided by DAC member countries 1989-2008
USD billions at 2008 constant prices
19
89
19
90
19
91
19
92
19
93
19
94
19
95
19
96
19
97
19
98
19
99
20
00
20
01
20
02
20
03
20
04
20
05
20
06
20
07
20
08
0
20
40
60
80
100
120
140
Con
stan
t 200
8 U
SD b
illio
n
multilateral bilateral ODA excl. debt relief multilateral, excl. contributions to EU institutions
Source: DAC Aggregates
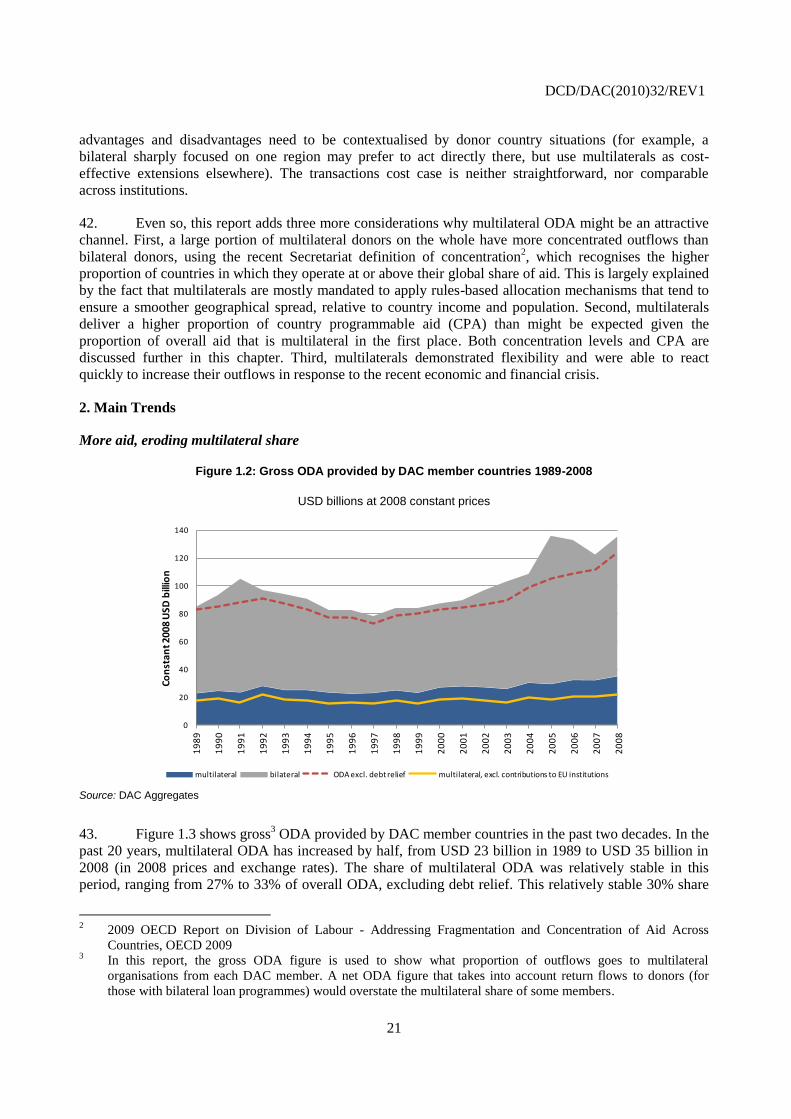
43. Figure 1.3 shows gross3 ODA provided by DAC member countries in the past two decades. In the
past 20 years, multilateral ODA has increased by half, from USD 23 billion in 1989 to USD 35 billion in
2008 (in 2008 prices and exchange rates). The share of multilateral ODA was relatively stable in this
period, ranging from 27% to 33% of overall ODA, excluding debt relief. This relatively stable 30% share
2 2009 OECD Report on Division of Labour - Addressing Fragmentation and Concentration of Aid Across
Countries, OECD 2009 3 In this report, the gross ODA figure is used to show what proportion of outflows goes to multilateral
organisations from each DAC member. A net ODA figure that takes into account return flows to donors (for
those with bilateral loan programmes) would overstate the multilateral share of some members.
DCD/DAC(2010)32/REV1
22
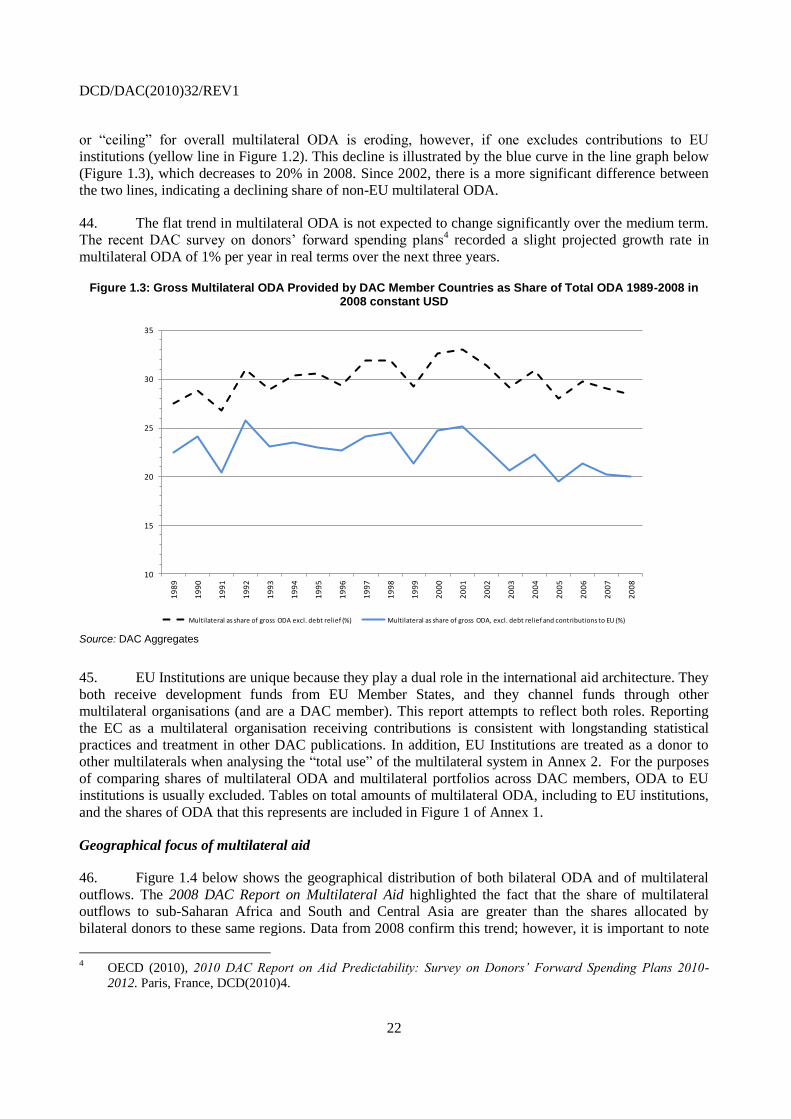
or ―ceiling‖ for overall multilateral ODA is eroding, however, if one excludes contributions to EU
institutions (yellow line in Figure 1.2). This decline is illustrated by the blue curve in the line graph below
(Figure 1.3), which decreases to 20% in 2008. Since 2002, there is a more significant difference between
the two lines, indicating a declining share of non-EU multilateral ODA.
44. The flat trend in multilateral ODA is not expected to change significantly over the medium term.
The recent DAC survey on donors‘ forward spending plans4 recorded a slight projected growth rate in
multilateral ODA of 1% per year in real terms over the next three years.
Figure 1.3: Gross Multilateral ODA Provided by DAC Member Countries as Share of Total ODA 1989-2008 in 2008 constant USD
10
15
20
25
30
35
19
89
19
90
19
91
19
92
19
93
19
94
19
95
19
96
19
97
19
98
19
99
20
00
20
01
20
02
20
03
20
04
20
05
20
06
20
07
20
08
Multilateral as share of gross ODA excl. debt relief (%) Multilateral as share of gross ODA, excl. debt relief and contributions to EU (%)
Source: DAC Aggregates
45. EU Institutions are unique because they play a dual role in the international aid architecture. They
both receive development funds from EU Member States, and they channel funds through other
multilateral organisations (and are a DAC member). This report attempts to reflect both roles. Reporting
the EC as a multilateral organisation receiving contributions is consistent with longstanding statistical
practices and treatment in other DAC publications. In addition, EU Institutions are treated as a donor to
other multilaterals when analysing the ―total use‖ of the multilateral system in Annex 2. For the purposes
of comparing shares of multilateral ODA and multilateral portfolios across DAC members, ODA to EU
institutions is usually excluded. Tables on total amounts of multilateral ODA, including to EU institutions,
and the shares of ODA that this represents are included in Figure 1 of Annex 1.
Geographical focus of multilateral aid
46. Figure 1.4 below shows the geographical distribution of both bilateral ODA and of multilateral
outflows. The 2008 DAC Report on Multilateral Aid highlighted the fact that the share of multilateral
outflows to sub-Saharan Africa and South and Central Asia are greater than the shares allocated by
bilateral donors to these same regions. Data from 2008 confirm this trend; however, it is important to note
4 OECD (2010), 2010 DAC Report on Aid Predictability: Survey on Donors’ Forward Spending Plans 2010-
2012. Paris, France, DCD(2010)4.

DCD/DAC(2010)32/REV1
23
that over one-fifth of bilateral ODA is ―unspecified‖ by region because it is currently allocated to global
thematic programmes, even if it will later be directed to specific regions. Figure 4 in Annex 1
disaggregates bilateral ODA and multilateral outflows by recipient country income. Thirty-three percent of
bilateral ODA is allocated to low-income countries (including LDCs), in comparison to 55% of multilateral
outflows. As in the figures below, bilateral ODA has a much larger share of ―unspecified‖ or ―unallocated‖
ODA, making conclusions as to which provides a larger share to low-income countries less obvious.
Figure 1.4: 2008 Gross DAC Bilateral ODA and Gross Multilateral Outflows (not including Korea)
(Excluding debt relief)
Sub-Saharan Africa27%
South & Central Asia
14%
Other Asia12%Middle East and
North Africa11%
Latin America & Caribbean
8%
Europe4%
Oceania2%
Unspecified22%
Sub-Saharan Africa46%
South & Central Asia
16%
Other Asia7%
Middle East and North Africa
8%
Latin America & Caribbean
5%
Europe11%
Oceania1%
Unspecified6%
Source: Creditor Reporting System Note: Korea’s ODA is not included in the total bilateral ODA. EU Institutions are included in multilateral outflows. Regional ODA to ―Africa‖ is included in the ―sub-Saharan Africa‖ category. Data on multilateral outflows are incomplete. Approximately 23 major multilateral organisations report their outflows to the DAC.
Multilateral ODA share varies across donors
47. The three-year DAC country average share of multilateral ODA, excluding contributions to EU
Institutions in order to compare across DAC countries, is illustrated in the bar graph below (Figure 1.5).
The average share is slightly above 20%, with two major outliers at each end, Italy (49%) and the United
States (11%). Multilateral aid showing both EU and non-EU contributions is illustrated in Figure 1 of
Annex 1 and multilateral aid to EU institutions alone is expressed as a percent of overall ODA in Figure 2
of Annex 1.

DCD/DAC(2010)32/REV1
24
Figure 1.5: Multilateral ODA (excluding to EU) as % gross ODA, 2006-8 average
(Excluding debt relief)
0
5
10
15
20
25
30
35
40
45
50
% g
ross
OD
A
Source: DAC Aggregates.
Multilateral caps
48. Two DAC members have decided to limit their share of multilateral ODA through legislative
means. Germany‘s multilateral ceiling is one-third of the budget of the Federal Ministry for Economic Co-
operation and Development. This does not include humanitarian aid or ODA to the EU Budget from the
Ministry of Finance (but does include EDF contributions). In December 2008, the Swiss Parliament
decided on a ceiling of 40% for multilateral development assistance through the end of 2012. This cap does
not apply to multilateral aid for humanitarian assistance or to aid for Eastern Europe (both of these
categories of aid fall under different legislation).
Non-DAC donors
49. Twenty non-DAC donors reported their aid flows to the Secretariat in the period from 2006-8
(see Table 1 in Annex 1), while some larger players (Brazil, China and India) did not. Non-DAC EU
members provide a larger proportion of multilateral aid (including to EU institutions). This ranges from a
low of 42% (Cyprus) to a high of 87% (Latvia) in the three-year period 2006-8. This is unlikely to be true
for the BRICs, who are members of multilateral organisations, and increasingly becoming contributors to
concessional funds, but who also have strong and growing bilateral programmes. Non-DAC donors
account for USD 8.8 billion of total non-DAC ODA estimated at between USD 12 and 14 billion, or 9-
10% of global ODA.5 The average multilateral ODA of non-DAC donors is 32% in 2006-8, excluding
5 OECD (2010) ―Beyond the DAC: the Welcome Role of other Providers of Development Co-operation,‖ DCD
Issues Brief (May 2010) http://www.oecd.org/dataoecd/58/24/45361474.pdf

DCD/DAC(2010)32/REV1
25
Kuwait, Saudi Arabia and the UAE since the data reported by these donors relates primarily to bilateral
aid.
50. Twenty-two non-DAC donors6 contributed to the Fifteenth Replenishment of the World Bank‘s
International Development Association (IDA15). Of these, China, Cyprus, Egypt, Estonia, Latvia and
Lithuania are the most recent IDA donors. Together non-DAC donors represent 3% of total IDA15
contributions.7 Current negotiations for the Sixteenth Replenishment of IDA (IDA16) will aim to include
additional non-DAC donors.
51. A number of multilateral organisations also report to the DAC, as described in Box 1.2. Finally,
mention should be made of large foundation grants – overwhelmingly from the Bill and Melinda Gates
Foundation – to some of the global health partnerships, most notably the Global Fund and GAVI.
Box 1.2: Multilateral Agencies Reporting to the DAC
The DAC collects data from multilateral agencies covering their operations in developing countries, including support costs directly linked to delivering these activities. Data are limited to regular (core) budget expenditures to avoid double counting. Contributions to multilateral organisations that are earmarked at any level – whether to a specific partner country, region, sector or theme – are reported as part of bilateral aid and identified through the channel of delivery classification.
Although there are no formal requirements for multilateral agencies (other than EU Institutions which are a DAC member) to report to the DAC, many agencies do so voluntarily. The DAC encourages all agencies with significant operational programmes in developing countries to begin reporting and has developed guidelines for multilateral reporting to the DAC. The table below shows all multilateral agencies that reported their 2008 data to the DAC:
Global Funds International Financial
Institutions Regional Development Banks
United Nations Funds, Programmes and
Specialised Agencies
The GAVI Alliance International Monetary Fund
African Development Bank IAEA UNHCR
The Global Fund World Bank Group (IDA, IBRD, IFC)
Asian Development Bank IFAD UNICEF
Global Environmental Facility*
Nordic Development Fund
Caribbean Development Bank UNAIDS UNRWA
The Montreal Protocol (Multilateral Fund)
European Bank for Reconstruction and Development
UNDP UNTA
Inter-American Development Bank
UNECE WFP
UNFPA
* Reporting obtained from GEF Secretariat presents a complete picture of total commitments, however, at present, disbursements data are reported for the World Bank and UNDP implemented activities only.
The past year has seen an increase in the quality and quantity of DAC statistical reporting from multilateral organisations. Major improvements include detailed, activity level reporting in CRS++ by the World Bank (all IDA and IBRD flows from 1999 through 2008) and by the GAVI Alliance (for flows in 2007 and 2008).
Efforts in 2010 will focus on:
Improving the sector identification of UNDP activities in DAC statistical databases. DAC and UNDP staffs are currently collaborating on this subject and hope to advance this issue in the coming months.
6 These include Barbados, Brazil, China, Cyprus, Czech Republic, Egypt, Estonia, Hungary, Iceland, Israel,
Kuwait, Latvia, Lithuania, Mexico, Poland, Russia, Saudi Arabia, Singapore, Slovak Republic, Slovenia, South
Africa, and Turkey. 7 World Bank (2008), ―Additions to IDA Resources: Fifteenth Replenishment,‖ Report from the Executive
Directors of the International Development Association to the Board of Governors, 28 February 2008.

DCD/DAC(2010)32/REV1
26
Pursuing improved activity-level reporting from the Regional Development Banks. Although we have some data at the activity level, it arrives in a non-standard format, or is downloaded from the web. Often, sector codes are assigned manually and the data is incomplete in many aspects. In an effort to improve data quality and coverage, full reporting in the CRS++ format is encouraged.
Obtaining statistics on WHO expenditures at the country level. The DAC and WHO have been collaborating on this issue and hope that reporting – at least at the regional level – will commence this year for core flexible funding at a minimum. The information will greatly improve the coverage of aid data especially in the health sector.
Obtaining accurate, detailed data on the expenditure of multilateral agencies is essential. Only by obtaining such data will the DAC be able to develop a complete picture of global aid flows and properly reflect the very substantial role of multilateral agencies in development co-operation. Detailed data on aid at the partner country level are also necessary for making accurate statistical analyses, as well as for informing discussions on aid fragmentation, division of labour and donor harmonisation.
Source: DAC Secretariat.
High concentration of DAC support on 15 multilaterals
52. Between 2004 and 2008, six multilateral clusters (15 agencies) together received and accounted
for 82% of multilateral ODA. They are the EU Institutions (37%), IDA (21%), the UN Funds and
Programmes (10%), the Global Fund (6%), and the African and Asian Development Banks (4% and 3%).
The counterpart to this concentration in the top six clusters is that about 200 other multilateral agencies
account for 18% of multilateral ODA volumes. The scattering or ―long tail‖ of those agencies that receive
the least amount of multilateral ODA may be worth examining more closely. However, it is important to
acknowledge that the transfer of resources is not the primary mandate of most of these institutions, many
of which provide technical assistance or serve a standard-setting purpose. A full list of ODA-eligible
multilateral organisations is included in Annex 5.
Table 1.1: Multilateral organisations receiving top 82% of multilateral ODA
EU Institutions World Bank - IDAUN Funds &
Programmes*Global Fund African Development Bank Asian Development Bank
- EU Budget - UNICEF - Global Fund - African Development Fund - Asian Development Fund
- UNDP - African Development Bank - Asian Development Bank
- UNFPA
- UNHCR
- WFP
- UNRWA
* Data are separately identifiable for these six UN Funds & Programmes only.
- International
Development
Association (IDA)
- European
Development
Fund (EDF)
- Eur. Investment
Bank (EIB)
DAC Member Multilateral Portfolio Shares
53. Last year‘s report examined the internal allocation processes of each DAC member, both between
bilateral and multilateral aid and across multilaterals. In practice, these are not determined simultaneously,
and often not within the same ministry. Political decisions at the margin, under fiscal pressure and
considering geographic and thematic priorities, and often the balance between loans and grants, are the rule
not the exception. It is also exceptional, but not unknown for countries to zero-base their contributions to a
multilateral rather than maintain it at very low levels, which can make staff costs of oversight increasingly
unsustainable.
54. DAC donors differ widely in their distribution of multilateral ODA. Such portfolio variations are
significant to the extent that contributions to each cluster are considered voluntary and fungible with
others. For IDA replenishments, participants negotiate contributions, which might well be heavily
DCD/DAC(2010)32/REV1
27
influenced by historic shares, but are in principle discretionary. Contributions to UN Funds and
Programmes, the Global Fund and the African and Asian Development Funds are similarly voluntary. EU
institutional funding is a mix of multi-year voluntary replenishment of the European Development Fund
(EDF) for assistance to Africa, the Caribbean and the Pacific based on negotiations and unanimous
decisions about each member‘s contributions, and annual EU budget attributions (following European
Parliament and EU Council decisions) for other components of the European Union‘s external action that
qualify for ODA. A smaller fraction of overall multilateral ODA – relevant in particular for UN
Specialised Agencies – is driven by assessed contributions, which can be considered conditions of
membership. These ―portfolio‖ comparisons are useful from the perspective of system-wide coherence.
55. EU institutions as a cluster are the largest recipients of DAC countries‘ multilateral aid. In 2008,
this amounted to USD 13 billion or 37% of DAC multilateral aid. The share of a DAC-EU members‘
multilateral aid to EU institutions depends largely on how many other multilateral agencies the member
funds. On average, EU institutions account for roughly 50% of EU members‘ multilateral ODA; however,
there are variations. Contributions to EU institutions account for as much as 77% of Greece‘s multilateral
aid, while Sweden‘s share is only 23%. See Table 5 in Annex 1 for data including contributions to EU
institutions.
56. A comparison of multilateral shares across the DAC membership needs to take into account the
fact that seven DAC countries are not EU members. For this reason, the next section and Table 1.2 look at
how these allocations change when contributions to the EU institutions are not included. This allows for
more accurate cross-country comparisons of multilateral portfolio allocations.
DCD/DAC(2010)32/REV1
28
Table 1.2: DAC Gross Multilateral ODA Disbursements, Five-year average (2004-2008), constant 2008 USD
To
tal
Mu
ltil
ate
ral
OD
A (
exclu
din
g t
o
EU
In
sti
tuti
on
s)
2004-2
008
Do
no
r's s
hare
of
glo
bal
mu
ltil
ate
ral
OD
A,
exclu
din
g t
o
EU
In
sti
tuti
on
s
IDA
UN
Fu
nd
s
an
d P
rog
ram
mes*
Glo
bal
Fu
nd
AfD
B
AsD
B
% a
llo
cate
d t
o
larg
est
five
mu
ltil
ate
ral
clu
ste
rs
Number of DAC donors 23 23 21 18 22
Non-EU members 44,962 44% 34% 15% 9% 6% 7% 72%
Australia 1,772 2% 42% 7% 5% n.a. 20% 74%
Canada 5,673 6% 32% 13% 9% 9% 6% 69%
Japan 15,057 15% 36% 12% 3% 5% 12% 67%
New Zealand 322 0% 16% 26% 1% n.a. 11% 52%
Norway 4,932 5% 16% 45% 4% 9% 1% 75%
Switzerland 2,309 2% 40% 23% 1% 10% 3% 77%
United States 14,899 15% 38% 8% 19% 5% 5% 75%
EU members 56,243 55% 33% 17% 9% 8% 3% 71%
Austria 939 1% 51% 9% n.a. 13% 6% 78%
Belgium 1,652 2% 52% 10% 5% 9% 2% 79%
Denmark 3,662 4% 14% 37% 4% 5% 2% 61%
Finland 1,163 1% 20% 39% 0% 9% 2% 70%
France 8,727 9% 29% 5% 19% 11% 3% 67%
Germany 8,369 8% 53% 6% 8% 9% 4% 79%
Greece 323 0% 47% 4% 0% n.a. n.a. 52%
Ireland 1,075 1% 26% 35% 5% n.a. 4% 71%
Italy 5,677 6% 26% 8% 15% 8% 5% 62%
Luxembourg 398 0% 13% 21% 3% n.a. 14% 51%
Netherlands 5,829 6% 20% 35% 6% 5% 3% 69%
Portugal 322 0% 33% 7% 4% 21% 12% 76%
Spain 4,047 4% 31% 12% 9% 10% 5% 66%
Sweden 4,971 5% 22% 41% 8% 7% 2% 79%
United Kingdom 9,091 9% 43% 15% 7% 8% 3% 76%
DAC Total excl. Korea 101,206 99% 33% 16% 9% 7% 5% 71%
Korea 938 1% 32% 4% n.a. 7% 17% 61%
Source: DAC Aggregates. * Includes UNICEF, UNDP, UNFPA, UNHCR, WFP and UNRWA. Excludes Specialised Agencies and UNCTAD, UNDCP, UNEP, UNIFEM, UNV, UNCDF and UN-Habitat for which core contributions are not disaggregated in the DAC database. Note: Totals may not add up due to rounding.
Top five clusters, excluding to EU institutions
57. As seen in Table 1.2, donors allocate strikingly different portions of their multilateral portfolios
to the same multilateral organisations. Luxembourg, for example, provides 13% of its non-EU multilateral
aid portfolio to IDA, compared to Germany‘s 53%. The range for UN Funds and Programmes is 4%
(Greece) to 45% (Norway).
58. Nordic countries (both in the EU and non-EU member categories) allocate approximately 40% of
multilateral aid to UN Funds and Programmes8 compared to less than 10% for several DAC donors
including Greece (4%), France (5%), Portugal and Germany (6%), Australia (7%), Italy and the United
States (8%). In contrast, their shares of multilateral ODA to IDA paint an opposite picture, with Nordic
countries allocating on average less than 20%, which is significantly lower than Germany (53%) and
United States (38%), or even the DAC average of 34%.
59. Average allocations to IDA and the Global Fund are roughly the same between EU and non-EU
member groupings, with five EU members (Austria, Belgium, Germany, Greece, and United Kingdom)
8 United Nations Funds and Programmes for which disaggregated data is available include UNDP, UNICEF,
UNFPA, UNRWA, UNHCR, and WFP
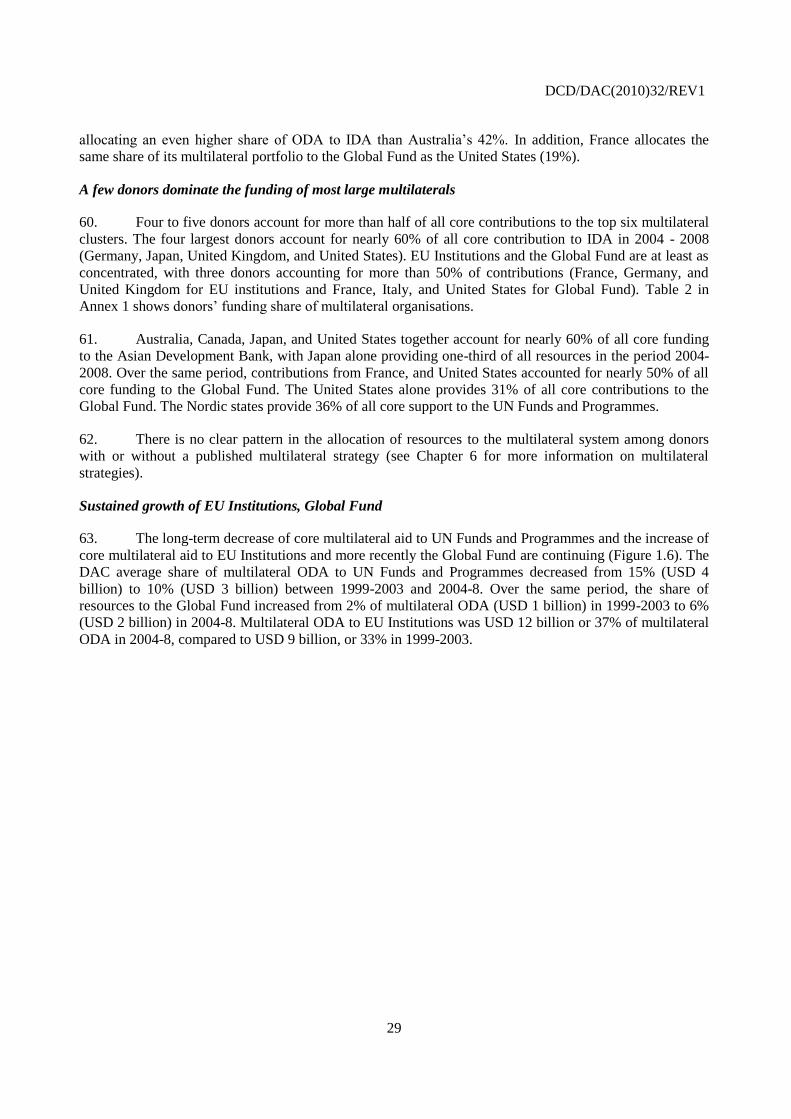
DCD/DAC(2010)32/REV1
29
allocating an even higher share of ODA to IDA than Australia‘s 42%. In addition, France allocates the
same share of its multilateral portfolio to the Global Fund as the United States (19%).
A few donors dominate the funding of most large multilaterals
60. Four to five donors account for more than half of all core contributions to the top six multilateral
clusters. The four largest donors account for nearly 60% of all core contribution to IDA in 2004 - 2008
(Germany, Japan, United Kingdom, and United States). EU Institutions and the Global Fund are at least as
concentrated, with three donors accounting for more than 50% of contributions (France, Germany, and
United Kingdom for EU institutions and France, Italy, and United States for Global Fund). Table 2 in
Annex 1 shows donors‘ funding share of multilateral organisations.
61. Australia, Canada, Japan, and United States together account for nearly 60% of all core funding
to the Asian Development Bank, with Japan alone providing one-third of all resources in the period 2004-
2008. Over the same period, contributions from France, and United States accounted for nearly 50% of all
core funding to the Global Fund. The United States alone provides 31% of all core contributions to the
Global Fund. The Nordic states provide 36% of all core support to the UN Funds and Programmes.
62. There is no clear pattern in the allocation of resources to the multilateral system among donors
with or without a published multilateral strategy (see Chapter 6 for more information on multilateral
strategies).
Sustained growth of EU Institutions, Global Fund
63. The long-term decrease of core multilateral aid to UN Funds and Programmes and the increase of
core multilateral aid to EU Institutions and more recently the Global Fund are continuing (Figure 1.6). The
DAC average share of multilateral ODA to UN Funds and Programmes decreased from 15% (USD 4
billion) to 10% (USD 3 billion) between 1999-2003 and 2004-8. Over the same period, the share of
resources to the Global Fund increased from 2% of multilateral ODA (USD 1 billion) in 1999-2003 to 6%
(USD 2 billion) in 2004-8. Multilateral ODA to EU Institutions was USD 12 billion or 37% of multilateral
ODA in 2004-8, compared to USD 9 billion, or 33% in 1999-2003.
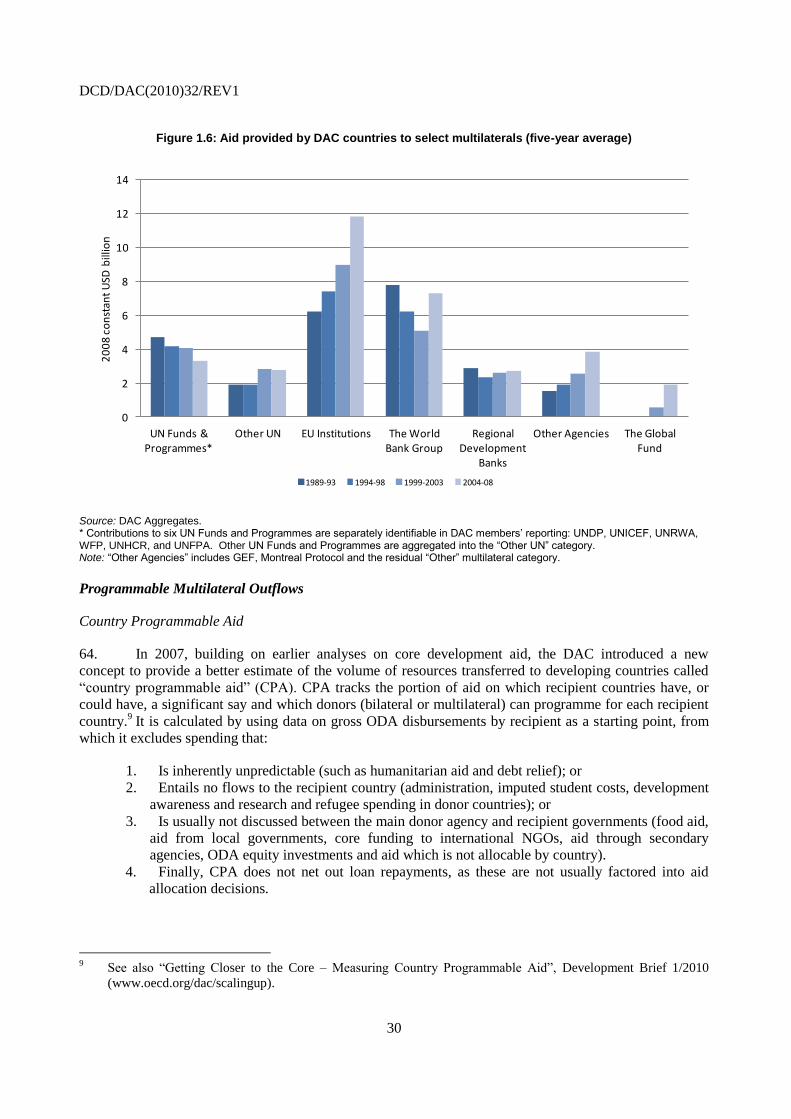
DCD/DAC(2010)32/REV1
30
Figure 1.6: Aid provided by DAC countries to select multilaterals (five-year average)
0
2
4
6
8
10
12
14
UN Funds & Programmes*
Other UN EU Institutions The World Bank Group
Regional Development
Banks
Other Agencies The Global Fund
20
08
co
nst
ant
USD
bill
ion
1989-93 1994-98 1999-2003 2004-08
Source: DAC Aggregates. * Contributions to six UN Funds and Programmes are separately identifiable in DAC members’ reporting: UNDP, UNICEF, UNRWA, WFP, UNHCR, and UNFPA. Other UN Funds and Programmes are aggregated into the ―Other UN‖ category. Note: ―Other Agencies‖ includes GEF, Montreal Protocol and the residual ―Other‖ multilateral category.
Programmable Multilateral Outflows
Country Programmable Aid
64. In 2007, building on earlier analyses on core development aid, the DAC introduced a new
concept to provide a better estimate of the volume of resources transferred to developing countries called
―country programmable aid‖ (CPA). CPA tracks the portion of aid on which recipient countries have, or
could have, a significant say and which donors (bilateral or multilateral) can programme for each recipient
country.9
It is calculated by using data on gross ODA disbursements by recipient as a starting point, from
which it excludes spending that:
1. Is inherently unpredictable (such as humanitarian aid and debt relief); or
2. Entails no flows to the recipient country (administration, imputed student costs, development
awareness and research and refugee spending in donor countries); or
3. Is usually not discussed between the main donor agency and recipient governments (food aid,
aid from local governments, core funding to international NGOs, aid through secondary
agencies, ODA equity investments and aid which is not allocable by country).
4. Finally, CPA does not net out loan repayments, as these are not usually factored into aid
allocation decisions.
9 See also ―Getting Closer to the Core – Measuring Country Programmable Aid‖, Development Brief 1/2010
(www.oecd.org/dac/scalingup).

DCD/DAC(2010)32/REV1
31
65. Recent important increases in levels of multilateral outflows are a reflection of the response from
international financial institutions to country demand for crisis-related finance in 2009. As can be seen in
Figure 1.7, multilateral outflows increased by 18% in 2009 from the previous year, when at the same time,
bilateral ODA was flat. More generally, annual increments of bilateral and multilateral CPA appear
negatively correlated, which may reduce risks for partner countries.10
Figure 1.7: Percent change in Country Programmable Aid (CPA): Bilateral and Multilateral Outflows
-5.0%
0.0%
5.0%
10.0%
15.0%
20.0%
2005 2006 2007 2008 2009 2010 2011 2012
Pe
rce
nt c
han
ge fr
om
pre
vio
us
year
DAC countries Multilaterals incl EC Source: DAC Aggregates and 2010 DAC Forward Spending Survey
66. In 2008, the multilateral share of global country programmable aid was 37%, despite the flat and
eroding share of multilateral ODA (inflows to multilateral agencies), which was 28% of gross ODA,
excluding debt relief. Multilaterals are responsible for a higher share of global CPA outflows than might be
expected given multilateral inflows. Of course, the fact that non-DAC members, including other countries,
recipients repaying earlier loans and other organisations (including private foundations) as well as the
agencies themselves also inject resources to multilateral organisations and do not report these to the DAC
should also be taken into consideration.
10
Note that data from 2009 to 2012 in Figure 1.2 is an estimate based on donors‘ responses to the 2010 Forward
Spending Survey. OECD (2010), 2010 DAC Report on Aid Predictability, Survey on Donors’ Forward Spending
Plans 2010-2012, OECD, Paris, forthcoming. See www.oecd.org/dac/scalingup for the final report, available
online from September 2010.
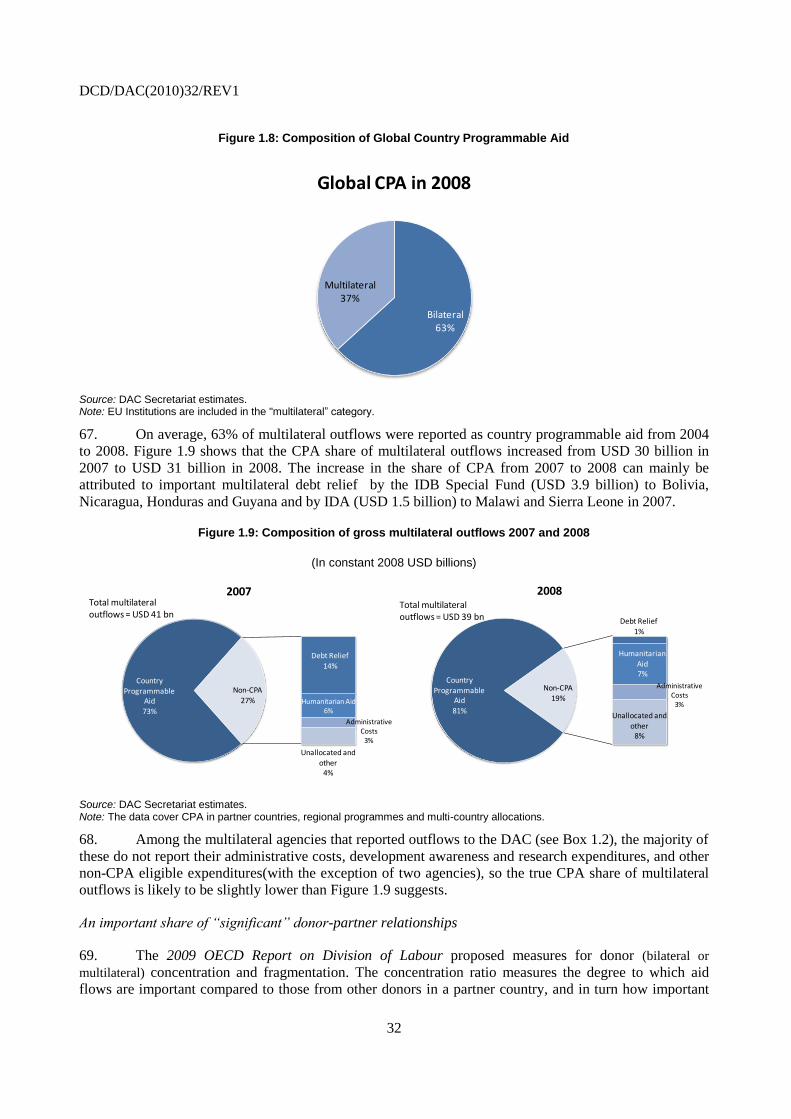
DCD/DAC(2010)32/REV1
32
Figure 1.8: Composition of Global Country Programmable Aid
Bilateral63%
Multilateral37%
Global CPA in 2008
Source: DAC Secretariat estimates. Note: EU Institutions are included in the "multilateral‖ category.
67. On average, 63% of multilateral outflows were reported as country programmable aid from 2004
to 2008. Figure 1.9 shows that the CPA share of multilateral outflows increased from USD 30 billion in
2007 to USD 31 billion in 2008. The increase in the share of CPA from 2007 to 2008 can mainly be
attributed to important multilateral debt relief by the IDB Special Fund (USD 3.9 billion) to Bolivia,
Nicaragua, Honduras and Guyana and by IDA (USD 1.5 billion) to Malawi and Sierra Leone in 2007.
Figure 1.9: Composition of gross multilateral outflows 2007 and 2008
(In constant 2008 USD billions)
Country Programmable
Aid73%
Debt Relief
14%
Humanitarian Aid6%
Administrative Costs
3%
Unallocated and
other4%
Non-CPA
27%
2007Total multilateral outflows = USD 41 bn
Country Programmable
Aid81%
Debt Relief1%
Humanitarian
Aid7%
Administrative Costs
3%
Unallocated and
other8%
Non-CPA19%
2008Total multilateral outflows = USD 39 bn
Source: DAC Secretariat estimates. Note: The data cover CPA in partner countries, regional programmes and multi-country allocations.
68. Among the multilateral agencies that reported outflows to the DAC (see Box 1.2), the majority of
these do not report their administrative costs, development awareness and research expenditures, and other
non-CPA eligible expenditures(with the exception of two agencies), so the true CPA share of multilateral
outflows is likely to be slightly lower than Figure 1.9 suggests.
An important share of “significant” donor-partner relationships
69. The 2009 OECD Report on Division of Labour proposed measures for donor (bilateral or
multilateral) concentration and fragmentation. The concentration ratio measures the degree to which aid
flows are important compared to those from other donors in a partner country, and in turn how important

DCD/DAC(2010)32/REV1
33
the partner country is to the donor in question.11
The table below presents the total number of significant
relationships in low-income countries of multilateral agencies and bilateral donors (DAC countries). From
a partner country perspective, having less ―non-significant‖ donor relationships allows Ministries of
Finance and/or Planning to concentrate more time and effort managing more ―significant‖ partnerships.
70. Based on 2008 data, (Table 1.3) multilaterals are somewhat more concentrated (75%) compared
to bilateral donors (57%). In part this is due to the fact that some large multilateral organisations have a
regional, rather than global mandate, but this alone does not explain the 18-point disparity. For large
multilaterals disbursing larger volumes than other donors and operating on specific needs- and
performance-based allocations, this concentration is not surprising. Likewise, it is not too difficult for a
small donor to appear ―concentrated‖ if its global share of CPA is minimal12
(see Annex 1 for a table with
disaggregated bilateral and multilateral concentration ratios). Many multilateral agencies with low
concentration ratios have normative, standard-setting and technical mandates that are not best measured in
terms of resource transfers alone.
Table 1.3: Concentration Ratio of Multilateral and Bilateral Donors in Low-income Countries (LICs), 2008
DAC donors and
major multilateral
agencies
Number of
"significant"
relationships
Number of
"non-
significant"
relationships
Total
relationships
(number of
partner
countries)
Concentration
ratio
A B (A+B) (A) / (A+B)
Multilateral 524 175 699 75%
Bilateral 438 335 773 57%
Total 962 510 1472 65%
Source: 2009 OECD Report on Division of Labour - Addressing Fragmentation and Concentration of Aid across Countries, OECD 2009
MDG performance and aid allocations
71. To examine MDG performance and aid allocations in the context of Donors‘ Forward Spending
Plans, the DAC Secretariat identified six clusters of low-income countries (LICs) based on their MDG
status and their progress towards the MDGs. The current status was based on composite scores from 12
MDG indicators used for MDGs 1 to 7. Progress made towards reaching the MDGs was determined by a
composite trend score for each country. Figure 1.10 shows the six broad categories of low-income
countries (LICs) and the amount of country programmable aid each group of countries receives from both
bilateral and multilateral partners. Bilateral ODA is more important in volume than multilateral outflows in
the clusters with ―very low‖ or ―low‖ development status and no progress; however, in the third cluster of
LICs with ―low‖ development status and some progress in meeting the MDGs multilateral outflows
11
The number of ―significant‖ relationships is determined when either (1) a donor (bilateral or multilateral)
contributes a higher percentage of a recipient‘s country programmable aid (CPA) than of its global share of total
CPA. The donor is then concentrated in this country; and/or (2) a donor (bilateral or multilateral) accounts for
among the top 90% of aid in the partner country. The ―non-significant‖ category refers to a donor / partner
country relation that does not fit either of the two criteria. For more details see the 2010 DAC Report on Aid
Predictability, Survey on Donors’ Forward Spending Plans 2010-2012, OECD, Paris, forthcoming. Available
online from September 2010: www.oecd.org/dac/scalingup. 12
Because there is a higher share of smaller multilateral donors compared to smaller DAC bilateral donors, this
works in the favour of multilaterals. For example, for those donors reporting to the DAC, the median global
CPA share of multilateral organisations is 0.6%, whereas the median bilateral share of global CPA is 1.4%.
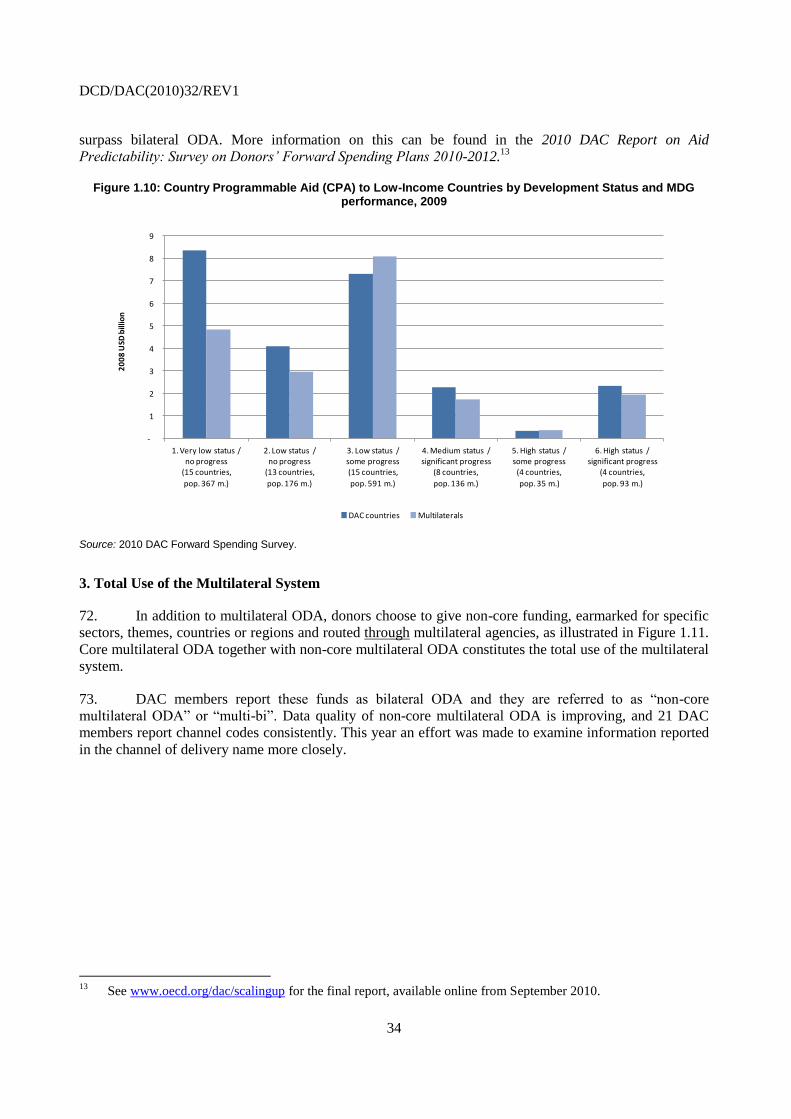
DCD/DAC(2010)32/REV1
34
surpass bilateral ODA. More information on this can be found in the 2010 DAC Report on Aid
Predictability: Survey on Donors’ Forward Spending Plans 2010-2012.13
Figure 1.10: Country Programmable Aid (CPA) to Low-Income Countries by Development Status and MDG performance, 2009
-
1
2
3
4
5
6
7
8
9
1. Very low status / no progress
(15 countries,
pop. 367 m.)
2. Low status / no progress
(13 countries,
pop. 176 m.)
3. Low status / some progress(15 countries,
pop. 591 m.)
4. Medium status / significant progress
(8 countries,
pop. 136 m.)
5. High status / some progress
(4 countries,
pop. 35 m.)
6. High status / significant progress
(4 countries,
pop. 93 m.)
20
08
USD
bill
ion
DAC countries Multilaterals
Source: 2010 DAC Forward Spending Survey.
3. Total Use of the Multilateral System
72. In addition to multilateral ODA, donors choose to give non-core funding, earmarked for specific
sectors, themes, countries or regions and routed through multilateral agencies, as illustrated in Figure 1.11.
Core multilateral ODA together with non-core multilateral ODA constitutes the total use of the multilateral
system.
73. DAC members report these funds as bilateral ODA and they are referred to as ―non-core
multilateral ODA‖ or ―multi-bi‖. Data quality of non-core multilateral ODA is improving, and 21 DAC
members report channel codes consistently. This year an effort was made to examine information reported
in the channel of delivery name more closely.
13
See www.oecd.org/dac/scalingup for the final report, available online from September 2010.
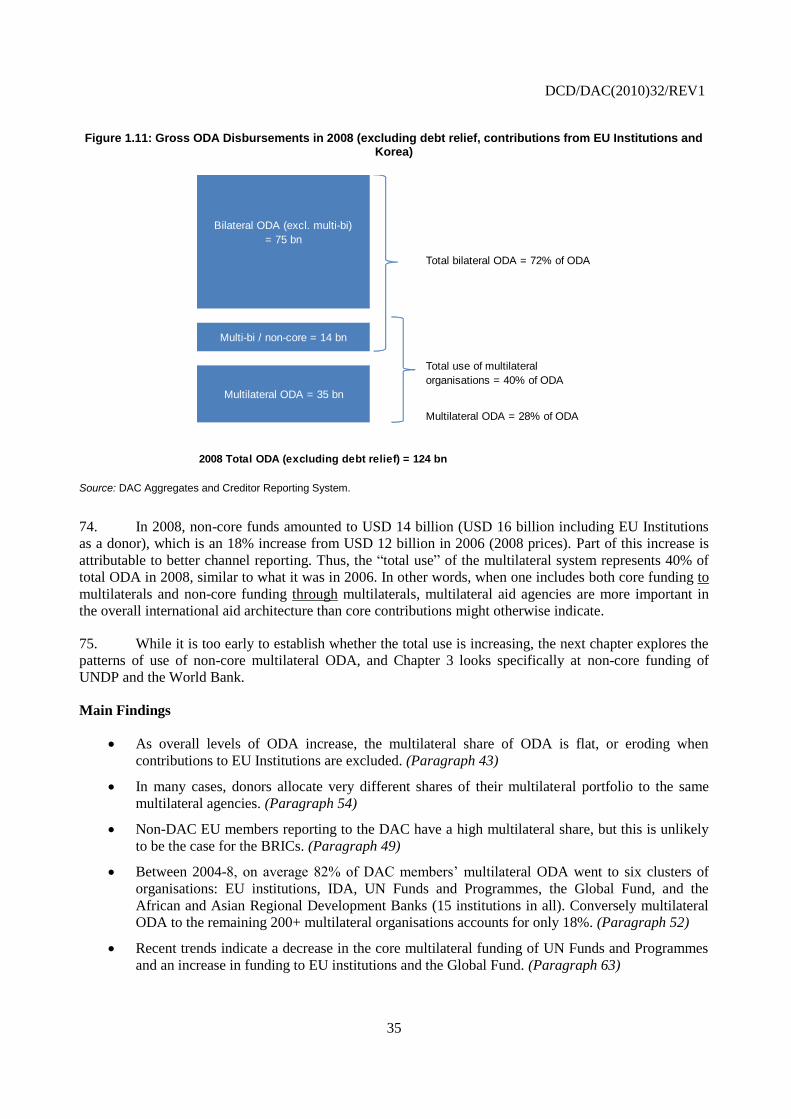
DCD/DAC(2010)32/REV1
35
Figure 1.11: Gross ODA Disbursements in 2008 (excluding debt relief, contributions from EU Institutions and Korea)
Multilateral ODA = 28% of ODA
2008 Total ODA (excluding debt relief) = 124 bn
Multi-bi / non-core = 14 bn
Multilateral ODA = 35 bn
Total use of multilateral
organisations = 40% of ODA
Total bilateral ODA = 72% of ODA
Bilateral ODA (excl. multi-bi)
= 75 bn
Source: DAC Aggregates and Creditor Reporting System.
74. In 2008, non-core funds amounted to USD 14 billion (USD 16 billion including EU Institutions
as a donor), which is an 18% increase from USD 12 billion in 2006 (2008 prices). Part of this increase is
attributable to better channel reporting. Thus, the ―total use‖ of the multilateral system represents 40% of
total ODA in 2008, similar to what it was in 2006. In other words, when one includes both core funding to
multilaterals and non-core funding through multilaterals, multilateral aid agencies are more important in
the overall international aid architecture than core contributions might otherwise indicate.
75. While it is too early to establish whether the total use is increasing, the next chapter explores the
patterns of use of non-core multilateral ODA, and Chapter 3 looks specifically at non-core funding of
UNDP and the World Bank.
Main Findings
As overall levels of ODA increase, the multilateral share of ODA is flat, or eroding when
contributions to EU Institutions are excluded. (Paragraph 43)
In many cases, donors allocate very different shares of their multilateral portfolio to the same
multilateral agencies. (Paragraph 54)
Non-DAC EU members reporting to the DAC have a high multilateral share, but this is unlikely
to be the case for the BRICs. (Paragraph 49)
Between 2004-8, on average 82% of DAC members‘ multilateral ODA went to six clusters of
organisations: EU institutions, IDA, UN Funds and Programmes, the Global Fund, and the
African and Asian Regional Development Banks (15 institutions in all). Conversely multilateral
ODA to the remaining 200+ multilateral organisations accounts for only 18%. (Paragraph 52)
Recent trends indicate a decrease in the core multilateral funding of UN Funds and Programmes
and an increase in funding to EU institutions and the Global Fund. (Paragraph 63)

DCD/DAC(2010)32/REV1
36
Multilateral outflows are on balance more flexible in the short term as demonstrated by their
crisis response. (Paragraph 65)
Multilateral outflows are also more geographically concentrated and deliver 37% of country
programmable aid compared to bilateral flows, but this is subject to qualifications. (Paragraphs
66 & 70)
The total use of the multilateral system by DAC donors (core multilateral ODA plus bilateral
earmarked ODA channelled through multilateral organisations) was 40% of total ODA in 2008.
Indeed, this proportion may give a better indication of the role multilateral institutions play in the
overall aid architecture today. (Paragraph 74)
Questions for Future Policy Discussions
What explains the flat historical multilateral share of ODA? Which arguments for and against
greater pooling have the most traction in the current context?
Should future work focus on the 15 multilaterals (6 clusters) which claim 82% of multilateral
ODA volume, or also attempt to rationalise the 18% ―long tail‖?
What are the main determinants of large variations in multilateral portfolio choices across DAC
members? Are any likely to be amenable to improved information sharing?
Are new non-DAC and non-EU funding sources less focused on multilaterals? If so, why and
how might this change?
Is the EU a special case that requires a different analytical approach? If so, in what way?
DCD/DAC(2010)32/REV1
37
2. NON-CORE FUNDING OF MULTILATERALS
76. The previous chapter discussed trends in multilateral aid, and explained both core and non-core
multilateral ODA. Box 2.1 provides definitions of core and non-core funding, according to DAC
directives.
Box 2.1: Definitions of Multilateral ODA and Non-Core or Multi-bi ODA
1. Multilateral ODA is a contribution made to a recipient institution that:
Conducts all or part of its activities in favour of development;
Is an international agency, institution or organisation whose members are governments, or a fund managed autonomously by such an agency; and
Pools contributions so that they lose their identity and become an integral part of its financial assets.
Multilateral ODA includes both assessed and voluntary un-earmarked contributions.
2. If the donor channels ODA earmarked by sector, theme, country or region through a multilateral institution, this is reported as bilateral ODA. This is also referred to as non-core multilateral ODA or multi-bi ODA.
Source: DAC Reporting Directives and DAC Secretariat.
77. This chapter and the next conclude that non-core funding can contribute to a wide range of
complementary activities, but that although there are some less positive aspects also discussed. The
existence of a large number of multi-donor trust funds is a testament to the growing use of non-core
funding. Since non-core funding is likely to continue its upward trend, donors should ensure that it is
additional and complementary to a minimum of core contributions, and that it does not undermine the
multilateral organisation‘s core objectives. To date, few evaluations of multi-donor trust funds have been
conducted.
1. Overview of DAC Members’ Non-Core Funding
78. Australia, the United States, Norway and Spain have the highest non-core multilateral ODA as a
share of the reported ―total use‖ of the multilateral system (core plus non-core multilateral aid), well above
the DAC average of 29%. When contributions to EU Institutions are excluded, the DAC average rises to
39% (see Figure 2.1), and the same top four donors emerge. Until recently contributions to EU institutions
were only un-earmarked (core), meaning that EU members‘ multilateral ODA by implication included a
larger portion of core multilateral ODA. France, Greece and Germany have the lowest shares, though this
may partially be due to under-reporting of non-core multilateral aid. More detailed information, including
on each donor‘s specific non-core allocations can be found in Annex 2.
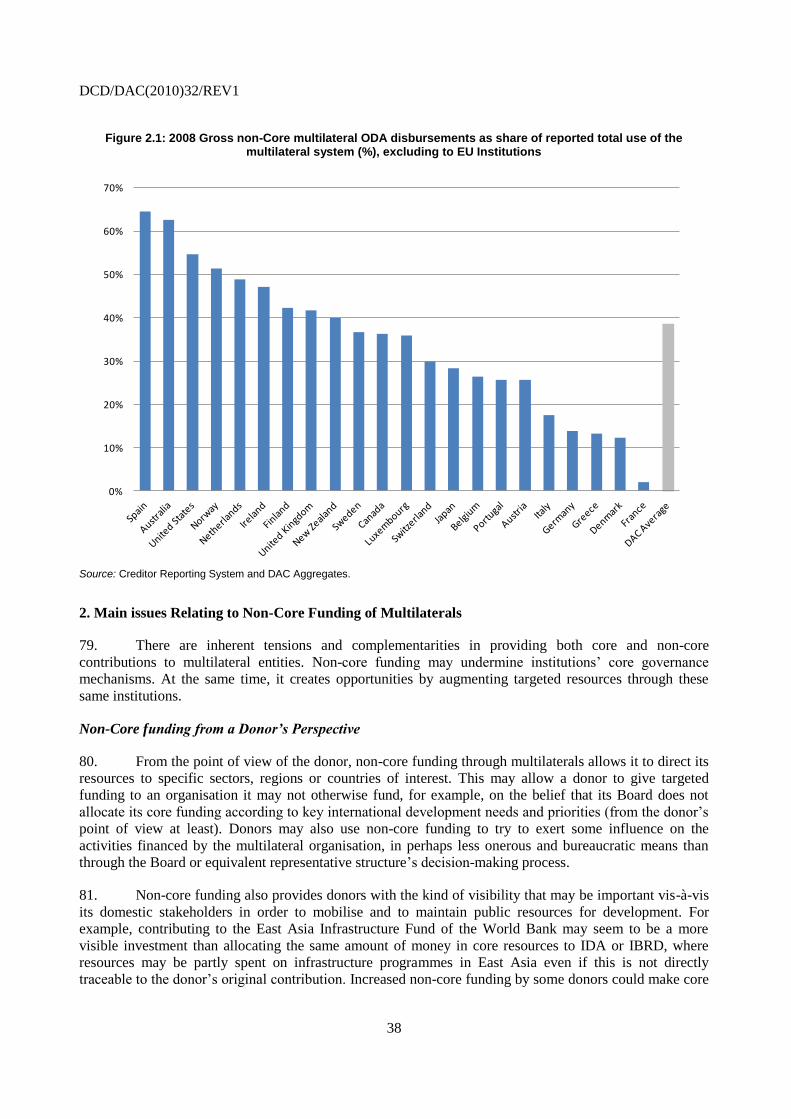
DCD/DAC(2010)32/REV1
38
Figure 2.1: 2008 Gross non-Core multilateral ODA disbursements as share of reported total use of the multilateral system (%), excluding to EU Institutions
0%
10%
20%
30%
40%
50%
60%
70%
Source: Creditor Reporting System and DAC Aggregates.
2. Main issues Relating to Non-Core Funding of Multilaterals
79. There are inherent tensions and complementarities in providing both core and non-core
contributions to multilateral entities. Non-core funding may undermine institutions‘ core governance
mechanisms. At the same time, it creates opportunities by augmenting targeted resources through these
same institutions.
Non-Core funding from a Donor’s Perspective
80. From the point of view of the donor, non-core funding through multilaterals allows it to direct its
resources to specific sectors, regions or countries of interest. This may allow a donor to give targeted
funding to an organisation it may not otherwise fund, for example, on the belief that its Board does not
allocate its core funding according to key international development needs and priorities (from the donor‘s
point of view at least). Donors may also use non-core funding to try to exert some influence on the
activities financed by the multilateral organisation, in perhaps less onerous and bureaucratic means than
through the Board or equivalent representative structure‘s decision-making process.
81. Non-core funding also provides donors with the kind of visibility that may be important vis-à-vis
its domestic stakeholders in order to mobilise and to maintain public resources for development. For
example, contributing to the East Asia Infrastructure Fund of the World Bank may seem to be a more
visible investment than allocating the same amount of money in core resources to IDA or IBRD, where
resources may be partly spent on infrastructure programmes in East Asia even if this is not directly
traceable to the donor‘s original contribution. Increased non-core funding by some donors could make core
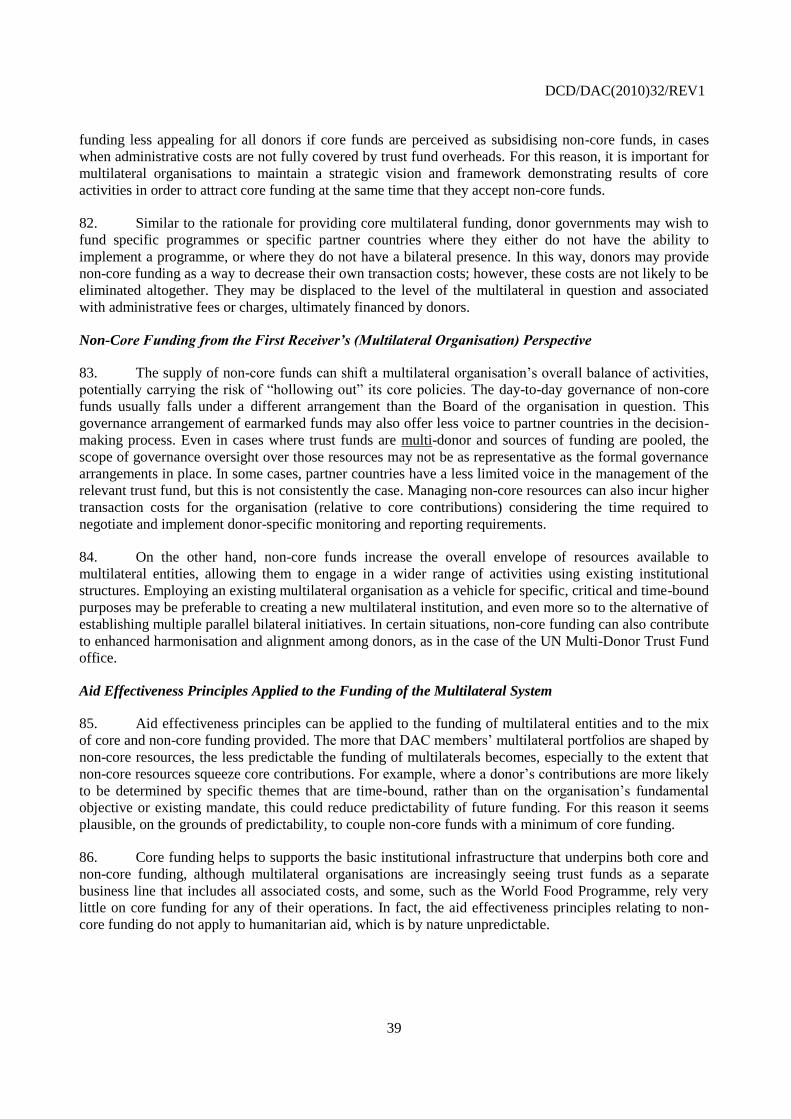
DCD/DAC(2010)32/REV1
39
funding less appealing for all donors if core funds are perceived as subsidising non-core funds, in cases
when administrative costs are not fully covered by trust fund overheads. For this reason, it is important for
multilateral organisations to maintain a strategic vision and framework demonstrating results of core
activities in order to attract core funding at the same time that they accept non-core funds.
82. Similar to the rationale for providing core multilateral funding, donor governments may wish to
fund specific programmes or specific partner countries where they either do not have the ability to
implement a programme, or where they do not have a bilateral presence. In this way, donors may provide
non-core funding as a way to decrease their own transaction costs; however, these costs are not likely to be
eliminated altogether. They may be displaced to the level of the multilateral in question and associated
with administrative fees or charges, ultimately financed by donors.
Non-Core Funding from the First Receiver’s (Multilateral Organisation) Perspective
83. The supply of non-core funds can shift a multilateral organisation‘s overall balance of activities,
potentially carrying the risk of ―hollowing out‖ its core policies. The day-to-day governance of non-core
funds usually falls under a different arrangement than the Board of the organisation in question. This
governance arrangement of earmarked funds may also offer less voice to partner countries in the decision-
making process. Even in cases where trust funds are multi-donor and sources of funding are pooled, the
scope of governance oversight over those resources may not be as representative as the formal governance
arrangements in place. In some cases, partner countries have a less limited voice in the management of the
relevant trust fund, but this is not consistently the case. Managing non-core resources can also incur higher
transaction costs for the organisation (relative to core contributions) considering the time required to
negotiate and implement donor-specific monitoring and reporting requirements.
84. On the other hand, non-core funds increase the overall envelope of resources available to
multilateral entities, allowing them to engage in a wider range of activities using existing institutional
structures. Employing an existing multilateral organisation as a vehicle for specific, critical and time-bound
purposes may be preferable to creating a new multilateral institution, and even more so to the alternative of
establishing multiple parallel bilateral initiatives. In certain situations, non-core funding can also contribute
to enhanced harmonisation and alignment among donors, as in the case of the UN Multi-Donor Trust Fund
office.
Aid Effectiveness Principles Applied to the Funding of the Multilateral System
85. Aid effectiveness principles can be applied to the funding of multilateral entities and to the mix
of core and non-core funding provided. The more that DAC members‘ multilateral portfolios are shaped by
non-core resources, the less predictable the funding of multilaterals becomes, especially to the extent that
non-core resources squeeze core contributions. For example, where a donor‘s contributions are more likely
to be determined by specific themes that are time-bound, rather than on the organisation‘s fundamental
objective or existing mandate, this could reduce predictability of future funding. For this reason it seems
plausible, on the grounds of predictability, to couple non-core funds with a minimum of core funding.
86. Core funding helps to supports the basic institutional infrastructure that underpins both core and
non-core funding, although multilateral organisations are increasingly seeing trust funds as a separate
business line that includes all associated costs, and some, such as the World Food Programme, rely very
little on core funding for any of their operations. In fact, the aid effectiveness principles relating to non-
core funding do not apply to humanitarian aid, which is by nature unpredictable.

DCD/DAC(2010)32/REV1
40
Figure 2.2: Total use of the multilateral system, 2008 gross disbursements
(Excluding EU institutions and Korea as donors)
UNFPAUNRWA
UNHCR
UNICEF
UNDP
WFP
-
2
4
6
8
10
12
14
EU Institutions World Bank Group
UN Funds & Programmes*
Other UN Regional Develoment
Banks
Other multilaterals
in 2
00
8 U
SD b
illio
ns
Core multilateral aid Multi-bi aid
Source: Creditor Reporting System and DAC Aggregates. * Contributions to six UN Funds and Programmes are separately identifiable in DAC members’ reporting: UNDP, UNICEF, UNRWA, WFP, UNHCR, and UNFPA. Other UN Funds and Programmes are aggregated into the ―Other UN‖ category.
87. The next chapter looks more closely at the non-core funding of UNDP and World Bank. As
illustrated in Figure 2.2, and according to data reported to the DAC, the World Bank is the largest single
recipient of non-core funding at USD 2.4 billion. UNDP is the second largest UN non-core recipient (USD
1.8 billion), after the World Food Programme (WFP – USD 2.9 billion), which by nature depends on
assistance earmarked for specific emergency operations, and receives very little core funding. Until
recently, EU institutions did not accept earmarked funds. This explains their very small share of non-core
multilateral ODA.
3. Level of Non-Core Earmarking and Country-level Delivery of Aid
88. Over 80% of non-core funds are earmarked for a specific country or region. The remaining one-
fifth of funding is for thematic purposes, which are not country-specific at the onset, but rather earmarked
by sector.
Sectors and recipients of non-core support compared to other channels
89. Multilateral outflows reported to the DAC relate only to disbursements from core un-earmarked
contributions. Non-core multilateral aid has a much higher share directed towards humanitarian activities
(39%, or USD 5.5 billion) compared to multilateral outflows (7%, or USD 2.1 billion), as illustrated in
Figure 2.3 below. In fact, non-core ODA earmarked for humanitarian purposes and routed through
multilateral organisations is the single most important channel of humanitarian aid in volume
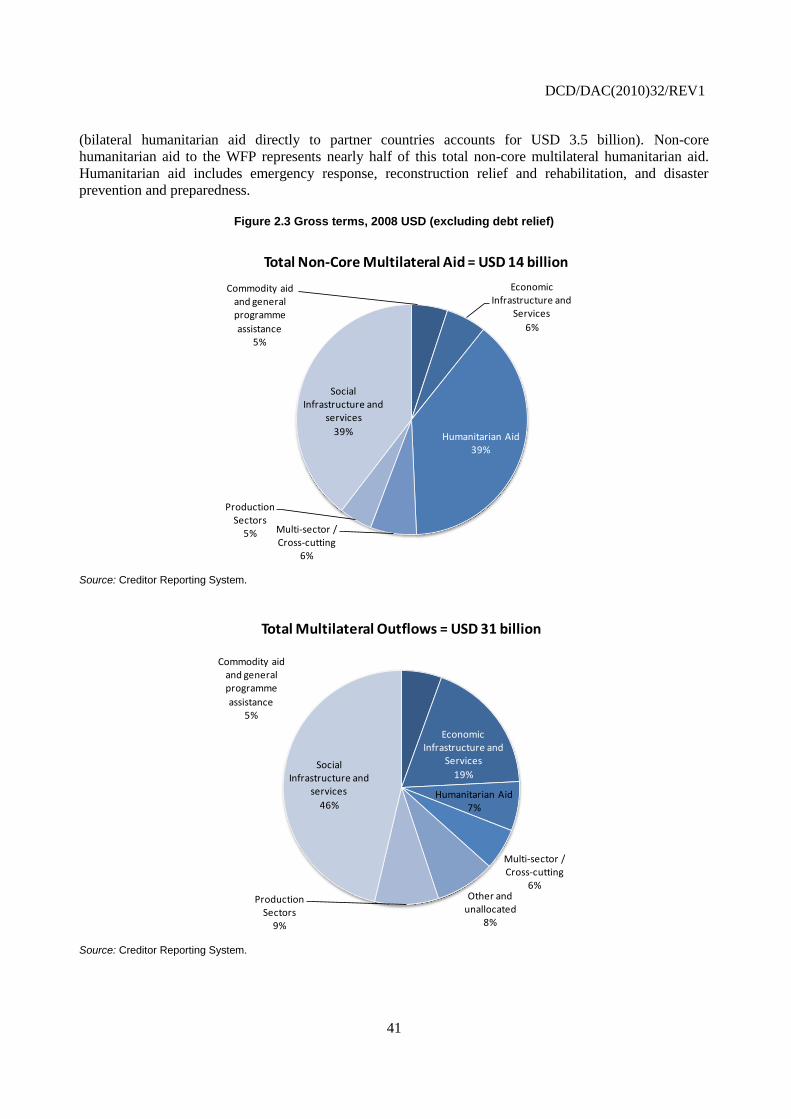
DCD/DAC(2010)32/REV1
41
(bilateral humanitarian aid directly to partner countries accounts for USD 3.5 billion). Non-core
humanitarian aid to the WFP represents nearly half of this total non-core multilateral humanitarian aid.
Humanitarian aid includes emergency response, reconstruction relief and rehabilitation, and disaster
prevention and preparedness.
Figure 2.3 Gross terms, 2008 USD (excluding debt relief)
Commodity aid and general programme
assistance5%
Economic Infrastructure and
Services
6%
Humanitarian Aid39%
Multi-sector / Cross-cutting
6%
Production Sectors
5%
Social Infrastructure and
services
39%
Total Non-Core Multilateral Aid = USD 14 billion
Source: Creditor Reporting System.
Commodity aid and general programme
assistance5%
Economic Infrastructure and
Services
19%
Humanitarian Aid7%
Multi-sector / Cross-cutting
6%Other and
unallocated8%
Production Sectors
9%
Social Infrastructure and
services
46%
Total Multilateral Outflows = USD 31 billion
Source: Creditor Reporting System.
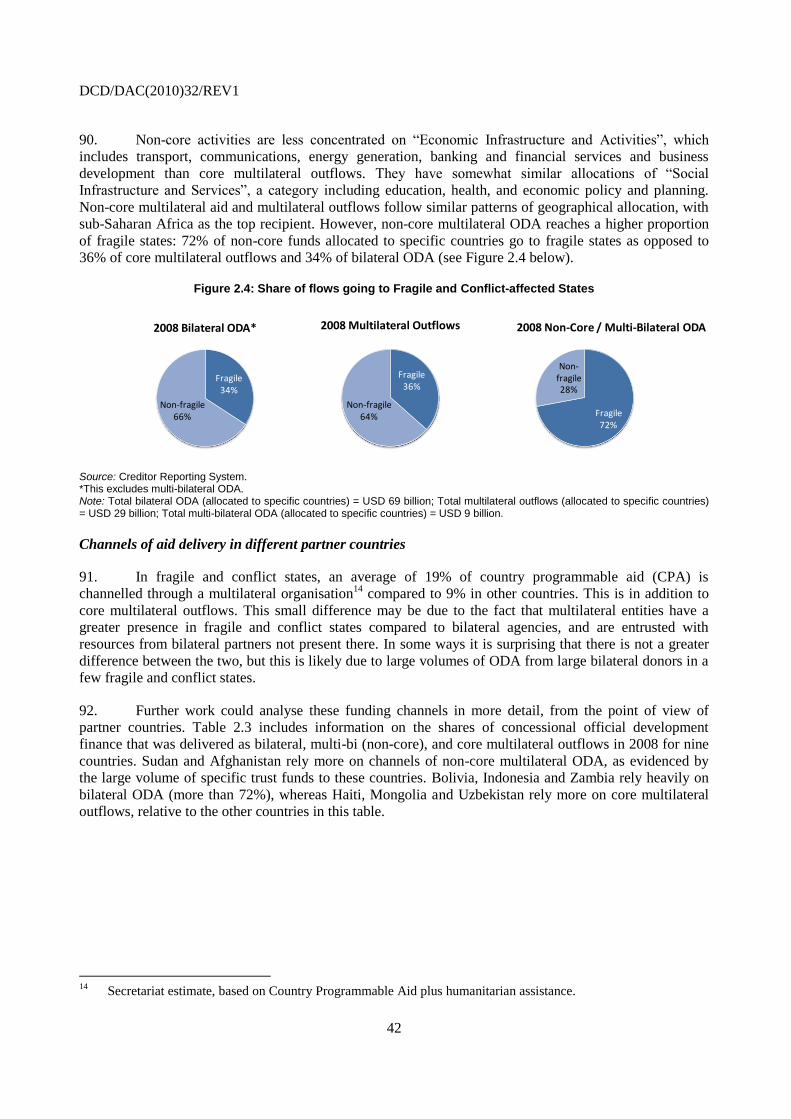
DCD/DAC(2010)32/REV1
42
90. Non-core activities are less concentrated on ―Economic Infrastructure and Activities‖, which
includes transport, communications, energy generation, banking and financial services and business
development than core multilateral outflows. They have somewhat similar allocations of ―Social
Infrastructure and Services‖, a category including education, health, and economic policy and planning.
Non-core multilateral aid and multilateral outflows follow similar patterns of geographical allocation, with
sub-Saharan Africa as the top recipient. However, non-core multilateral ODA reaches a higher proportion
of fragile states: 72% of non-core funds allocated to specific countries go to fragile states as opposed to
36% of core multilateral outflows and 34% of bilateral ODA (see Figure 2.4 below).
Figure 2.4: Share of flows going to Fragile and Conflict-affected States
Fragile34%
Non-fragile66%
2008 Bilateral ODA*
Fragile36%
Non-fragile64%
2008 Multilateral Outflows
Fragile72%
Non-fragile28%
2008 Non-Core / Multi-Bilateral ODA
Source: Creditor Reporting System. *This excludes multi-bilateral ODA. Note: Total bilateral ODA (allocated to specific countries) = USD 69 billion; Total multilateral outflows (allocated to specific countries) = USD 29 billion; Total multi-bilateral ODA (allocated to specific countries) = USD 9 billion.
Channels of aid delivery in different partner countries
91. In fragile and conflict states, an average of 19% of country programmable aid (CPA) is
channelled through a multilateral organisation14
compared to 9% in other countries. This is in addition to
core multilateral outflows. This small difference may be due to the fact that multilateral entities have a
greater presence in fragile and conflict states compared to bilateral agencies, and are entrusted with
resources from bilateral partners not present there. In some ways it is surprising that there is not a greater
difference between the two, but this is likely due to large volumes of ODA from large bilateral donors in a
few fragile and conflict states.
92. Further work could analyse these funding channels in more detail, from the point of view of
partner countries. Table 2.3 includes information on the shares of concessional official development
finance that was delivered as bilateral, multi-bi (non-core), and core multilateral outflows in 2008 for nine
countries. Sudan and Afghanistan rely more on channels of non-core multilateral ODA, as evidenced by
the large volume of specific trust funds to these countries. Bolivia, Indonesia and Zambia rely heavily on
bilateral ODA (more than 72%), whereas Haiti, Mongolia and Uzbekistan rely more on core multilateral
outflows, relative to the other countries in this table.
14
Secretariat estimate, based on Country Programmable Aid plus humanitarian assistance.

DCD/DAC(2010)32/REV1
43
Table 2.3: Channels of CPA in nine partner countries
Bilateral Non-core multilateral
Afghanistan 65% 27% 8%
Bolivia 76% 6% 17%
Haiti 52% 17% 31%
Indonesia 74% 7% 19%
Mongolia 65% 7% 28%
Sudan 33% 58% 9%
Uzbekistan 69% 4% 27%
Viet Nam 60% 6% 34%
Zambia 72% 2% 25%
Bilateral ODAMultilateral Outflows
Source: DAC Aggregates and Creditor Reporting System
Main Findings
In 2008, 29% of DAC countries‘ total aid transiting through the multilateral system was
earmarked (non-core). This rises to 39% when excluding all contributions to EU Institutions.
(Paragraph 78)
Donors earmark funds to target specific countries and sectors and to have greater visibility and
influence in the multilateral system. (Paragraphs 80 & 81)
From a multilateral organisation‘s perspective, excessive earmarking risks hollowing out the
governance of an organisation and complicates accountability, but it may be better than the
alternative of multiple single-donor parallel initiatives. (Paragraphs 83 & 84)
Non-core, or earmarked, multilateral ODA is the single-most important channel for humanitarian
aid. It also targets a higher proportion of fragile states than multilateral outflows or bilateral
ODA. (Paragraphs 89 & 90)
Questions for Future Policy Discussions
Is there a growing trend towards non-core funding? What might be the development effectiveness
implications?
DCD/DAC(2010)32/REV1
44
3. NON-CORE FUNDING OF UNDP AND THE WORLD BANK
93. The chapter provides an overview of the role of non-core funding in the functioning of UNDP
and the World Bank, primarily concerning trust funds. The World Bank Group is the largest single
recipient of non-core funding (USD 2.7 billion in 2008),15
and UNDP is the second largest UN agency
recipient (USD 1.8 billion in 2008). Non-core funding – often in the form of multi-donor trust funds – to
UNDP and the World Bank accounts for 30% of total DAC non-core aid to the multilateral system and
constitutes an important share of total resources entrusted to these agencies.
Methodological Issues
94. The data used for this chapter comes from both DAC members‘ reporting to the Secretariat as
well as from the multilateral organisations themselves. Box 3.1 explains some of the reasons why there
may be discrepancies in these numbers
Box 3.1: Methodological Issues relating to Non-Core Multilateral ODA
The amount of core and non-core contributions reported to the DAC and the amount recorded by multilateral agencies themselves may vary. There are some practical reasons for these differences, including:
Difference in USD exchange rates used
Multi-year contributions reported in a single year
End-of-year contributions reported in the following calendar year
Misidentification of non-core funds as ―core‖ or vice-versa.
There are also some explanations that relate specifically to UNDP and the World Bank:
UNDP considers its non-core contributions to be those resources earmarked to specific themes, programmes and activities. It does not include contributions to the 29 trust funds administered by the Multi-Donor Trust Fund (MDTF) Office of UNDP on behalf of the UN System in this figure. However, DAC members report contributions to the MDTF Office as part of their non-core ODA
16 channelled
through UNDP, since it is the Administrative Agent.
The World Bank considers contributions to global funds and programmes, including the Global Fund against AIDS, Tuberculosis and Malaria, GAVI, IFFIm, the Global Environment Facility, MDRI and HIPC as part of its non-core contributions. However, DAC members report un-earmarked contributions to these global funds and programs as multilateral ODA, since they are included on the list of international organisations to which official contributions may be reported as ODA (see Annex 5.)
Source: DAC Secretariat
15
All numbers cited are based on DAC members‘ reporting to the Creditor Reporting System. 16
With the exception of the UN Peacebuilding Fund (Window 1), which is eligible to receive multilateral ODA.
DCD/DAC(2010)32/REV1
45
1. United Nations Development Programme (UNDP)
95. This section describes the core and non-core funding of UNDP, the use of multi-donor trust
funds, and the effect this mix of funding has on the organisation.
Funding of UNDP
96. UNDP, like all the UN Funds and Programmes is entirely funded by voluntary contributions,
earmarked or not. Un-earmarked regular or core resources amounted to USD 1.1 billion in 2008 and non-
core resources (from all sources) reached USD 3.6 billion, according to UNDP‘s own records (see Table
1). This means that the non-core ―dependency rate‖ is about 77%. Regular resources represent
contributions to the UNDP core budget, which follows the criteria and appropriations established by the
UNDP Executive Board in support of the organisation‘s multilateral mandate, including for policy
advisory services. Other, or non-core, resources are comprised of contributions earmarked to themes,
countries, regions and/or specific projects.
UNDP Core Resources
97. Core resources are un-earmarked, voluntary contributions to UNDP‘s regular budget. Around 50
to 60 governments contribute to UNDP‘s core resources in a given year. Ten partner governments account
for around 80% of core contributions in 2008.17
Overdependence on a limited number of major donors and
the voluntary, often residual nature of core contributions make UNDP highly vulnerable to any shifts in
contributions, even among a small number of donors.18
98. Multi-year commitments made by a number of DAC donors have helped to enhance the
predictability of UNDP‘s core resources, but the majority of donors still pledge on an annual basis despite
UNDP‘s adoption of the multi-year funding framework (MYFF) in 1999 as an instrument to enhance the
predictability of voluntary core resource flows and to ensure policy coherence. Some UN agencies have
taken steps to decrease donor concentration and broaden the burden-sharing of donor governments (see
Box 3.2).
Box 3.2: UNEP’s Voluntary Indicative Scale of Contributions
Apart from a small contribution from the United Nations Regular Budget, which is less than 4% of the United Nations Environment Programme’s (UNEP) total budget, UNEP depends entirely on voluntary contributions. In 2002, UNEP approved the application of the Voluntary Indicative Scale of Contributions (VISC) to its Environment Fund. The purpose of the VISC was to broaden the base of voluntary contributions, enhance predictability, improve financial stability and attract higher voluntary payments.
The voluntary indicative scale is based in part on the UN scale of assessments, and includes a few additional guidelines that provide limits on the proportion of funding for the Fund:
Minimum indicative rate of 0.0001 %
Maximum indicative rate of 22 %
Maximum indicative rate for LDCs of 0.01 %
An assessment of the VISC in December 2008 found that the donor base had broadened, from about 76 member
17
Norway, the Netherlands, Sweden, the United States, the United Kingdom, Japan, Denmark, Canada, Spain, and
Switzerland. (Source: UNDP) 18
United Nations Secretariat (2009) ―Strengthening the system-wide funding architecture of operational activities
of the United Nations for development.‖ New York, 3 May 2009.

DCD/DAC(2010)32/REV1
46
states in the period from 1973-2002 to 117 member states in 2003-7. In addition, there is lower concentration of the top ten donors: in 2008-9, the top 10 donors
19 were expected to contribute 71% of total funds. While short-term
predictability improved in 2002, since then predictability has not improved as donors continue to make single-year commitments. Stability has improved and volumes have also increased, although it is probably too early to tell if these results are directly linked to the implementation of the VISC.
Source: UNEP (December 2008), ―Voluntary indicative scale of contributions: assessment of the operation of the extended pilot phase.‖ UNEP/GC.25/INF/14 http://www.unep.org/rms/en/pdf/VISC2008-9contributions.pdf
Table 3.1: DAC contributions to UNDP 2007-2008
DAC Statistics 2007 2008
Core resources 1.2 1.1
Non-core resources 2.0 1.8
UNDP Records
Core resources 1.1 1.1
Non-core resources, of which: 3.6 3.6
- OECD/DAC Bilateral donors 1.1 1.4
- Multilateral donors (incl. EC) 1.2 1.2
- Local resources 1.3 1.0
* OECD/DAC bilateral donors, excluding Korea and EC
Source: Creditor Reporting System and UNDP data.
DAC* contributions to UNDP 2007-2008
(nominal USD billions)
UNDP Non-Core Resources
99. UNDP non-core resources are earmarked to specific themes, programmes and activities, and
represent a critical complement to the regular resources base of UNDP. The overall level of non-core
resources made available to UNDP as the result of many individual donor decisions to allocate resources to
specific themes and countries was USD 3.6 billion in 2008. For the most part, non-core resources are
mobilised at the country-level around distinct project engagements under the umbrella of UNDP‘s country
programmes. Because of this, non-core resources are difficult to forecast in aggregate terms and tend to be
highly concentrated in a subset of partner countries. More than 60% of non-core contributions from
bilateral and multilateral donors in 2008 (USD 2.7 billion) target around 20 programme countries.
100. The composition of non-core resources as recorded by both the DAC and UNDP is further
detailed in Table 1 above. UNDP considers three sources of non-core funding: (1) OECD/DAC donors; (2)
Multilateral partners; and (3) local resources. Almost 40% or USD 1.4 billion of UNDP‘s non-core
contributions are from OECD/DAC donors. In addition, multilateral partners including the European
Commission, the Global Fund to Fight AIDS, Tuberculosis and Malaria, the Global Environment Fund
entrusted USD 1.2 billion in non-core resources to UNDP in 2008. Finally, local resources annually
account for some USD 1 billion of UNDP‘s non-core resources (see Box 3.3).
19
Does not include the United States, which chose to be removed from the VISC.
DCD/DAC(2010)32/REV1
47
Box 3.3: Local Resources to UNDP
Programme country governments work with and through UNDP to implement their domestic development priorities. These ―local resources‖ are not considered flows as such as they stay within the partner country, and thus, are not included in ODA. Local resources are frequently provided to UNDP by low- and middle-income countries, initially mostly in the Latin and Central American region, but in recent years also from countries in other regions.
Local resources are a way for UNDP to effectively support a country’s capacity to mobilise and manage internal and external resources and to ultimately contribute to the national ability to articulate and implement the MDGs. Like core and other non-core resources, local resources form part of the multi-year country programme agreed between partner governments and UNDP, and are governed and reported on in the same way as all UNDP resources at country-level.
Source: UNDP Partnerships Bureau.
101. According to UNDP, the top recipient of DAC members‘ non-core contributions to UNDP (not
including those transiting through the Multi-Donor Trust Fund Office referred to later) is Afghanistan
(USD 382.9 million), followed by Sudan (USD 74.5 million), Bangladesh (USD 67.6 million) and Somalia
(USD 63 million).
Relationship of Core and Non-Core Funding
102. There are inherent tensions, but also opportunities resulting from the mix of core and non-core
funding to UNDP. In general, non-core resources tend to incur higher transaction costs for the receiving
organisation, considering the time required to negotiate individual funding agreements and to comply with
donor-specific monitoring and reporting requirements. All of these add significant costs of UNDP‘s
general operations.20
On the other hand, the channelling of programmatic funds from a wide range of
sources through UNDP mirrors the international funding environment and attests to the fact that it is seen
as sufficiently accountable for targeted activities and interventions.
103. The UN General Assembly, most recently in Resolution 62/208, has frequently stressed that
―…core resources, because of their untied nature continue to be the bedrock of the operational activities for
development of the United Nations System and, in this regard, notes with concern that the share of core
contributions to United Nations funds and programmes has declined in recent years…‖ Indeed, while core
funding from DAC donors to UNDP have been relatively stagnant, non-core resources have grown
considerably, exceeding core contributions in recent years.
104. Non-core resources align with UNDP‘s mandated practice areas (poverty reduction/MDGs;
democratic governance; crisis prevention and recovery; and sustainable energy and environment) and form
part of UNDP‘s country programmes, which are agreed with national partners and endorsed by UNDP‘s
Executive Board, but they do not fall directly under the purview of the Executive Board in the same way as
core resources. Partner countries hold 24 of the 36 seats of the Executive Board, which gives them 2/3
voting power. Executive Board governance, however, is effectively bypassed in the day-to-day
management of non-core resources. This may be more or less important depending on the volume and type
of funding.
20
United Nations Secretariat (2009) ―Strengthening the system-wide funding architecture of operational activities
of the United Nations for development.‖ New York, 3 May 2009, p. 6.

DCD/DAC(2010)32/REV1
48
105. Perhaps because it is an organisation dependent on voluntary contributions, the top six
contributors to UNDP regular resources map almost exactly to the top six non-core contributors.21
This
indicates that donors are not necessarily using non-core funding as a way to bypass core funding. In the
2008-13 Strategic Plan endorsed by the Executive Board, UNDP aims to rebalance the ratio of core and
non-core resources to the extent that this is possible in the current international funding environment. In a
July 2010 Resolution on System Wide Coherence22
, Member States agreed to introduce a new approach to
determine the ―critical mass‖ of core funding for funds and programmes, according to their individual
mandates.
The Multi-Donor Trust Fund Office
106. The Multi-Donor Trust Fund (MDTF) Office offers a ―one-stop-shop‖ for donors to establish one
agreement with one UN organisation serving as the administrative agent instead of entering into separate
agreements with each UN agency. This reduces costs and may save time for both donors and UN agencies,
at least in the first instance. The first UN multi-agency MDTF was the UNDG Iraq Trust Fund, established
in December 2003 with funds from UN entities and the World Bank. Today, 29 trust funds are managed by
the UNDP MDTF Office (see Figure 3.1). The MDTF Office has taken specific and concrete steps to
ensure that contributions made by donors towards the various UN MDTFs it administers are kept separate
and distinct from UNDP‘s own accounts and operations. Cumulative deposits reached over USD 4 billion
at the end of 2009 and transfers to participating organisations for implementation made to-date were just
over USD 3 billion.
Figure 3.1: Methods of Providing Earmarked ODA to the United Nations
Source: DAC Secretariat, based on information from the UN MDTF Office and UNDP.
21
DAC Secretariat analysis. 22
General Assembly Resolution 64/289

DCD/DAC(2010)32/REV1
49
Donor Perspectives on Trust Funds of the MDTF Office
107. Some donors (primarily small donors) appreciate the visibility that funding through the MDTF
Office provides them (e.g. Romania‘s participation in the Lebanon Recovery Fund might have been
overshadowed if it had given the same amount directly to a UN entity for implementation, while as a
contributor to a multi-donor trust fund it attains greater visibility). This conduit through the MDTF
provides a streamlined process and offers incentives for UN entities and donors to adhere to and to
promote UN reform. MDTF activities and programmes are actually implemented by over 40 UN agencies
and some non-UN participating agencies. For example, in 2008 the MDTF Office transferred 21% (USD
129 million) to UNDP and 17% (USD 82 million) to UNICEF for implementation of trust fund activities.23
108. Donor involvement in the management of MDTFs varies. While some donors request weekly
updates of the Fund‘s activities at the country-level or request the inclusion of separate clauses in their
agreements, others are satisfied to engage with only regular reporting. Although earmarking by sector or
theme (but not by specific projects) within a particular trust fund can take place at a country-level, a
specific UN agency cannot be singled-out for implementation. It may be because some bilateral donors
have regulations that do not allow for flexible allocation of resources to UN agencies at the country level
that bilateral donors continue to provide funding in parallel to the One UN Funds (initially for 8 countries:
Albania, Cape Verde, Mozambique, Pakistan, Rwanda, Tanzania, Uruguay and Vietnam, and recently
expanded to 11 more ―Delivering as One‖ Funds in 2009-10).24
DAC members encourage the use of ―One
UN‖ and ―Delivering as One‖ funds in eligible countries to avoid multiple transactions, but evidence
suggests that this is not yet a reality.
MDTF Policies and Future Work
109. Unlike the World Bank, which established a minimum threshold for establishing new trust funds
at USD 1 million (from USD 200,000) in 200725
, the UNDP MDTF Office does not have a minimum floor
for establishing trust funds. This is a key concern since the costs to set-up, implement, and monitor a very
small fund may outweigh its benefits, especially if there is no guarantee of increased funding in the
future.26
The MDTF Office also acknowledges a need for more experienced staff to participate in national
steering committees in the implementation of MDTFs at the country-level. Over the course of 2010, the
UNDG is developing guidelines for establishing MDTFs that will address governance, evaluation and audit
issues. The phasing-out of MDTFs, where relevant, is seen as an area where World Bank expertise could
be relevant. Future work could look at the additionality of MDTF funding, and UN agencies‘ incentives to
collaborate on MDTFs.
UN Country Team Perspectives: more co-ordinated approaches align with UN reform
110. In the aggregate, funding at a country-level comes from three sources, although not all countries
will have access to all three. These are (1) regular resources; (2) non-core resources; and (3) ―One UN‖
country funds or other multi-donor trust funds. ―One UN‖ country funds are available to the eight ―One
UN‖ pilot countries mentioned above, while the Expanded ―Delivering as One‖ (DAO) Funding Window
for Achievement of MDGs was launched in September 2008 to provide un-earmarked gap funding to
23
UNDP Multi-Donor Trust Fund Office.
24 UNDP MDTF Office (2009), ―UN Multi-Donor Trust Funds & ‗Delivering as One‘ Funds: A lessons learned
non-paper.‖ 1 July 2009. 25
World Bank (2007) ―A Management Framework for World Bank-Administered Trust Funds.‖ 14 September
2007. 26
UNDP (2010), ―Background Note for the UNDG-Donor Meeting on Multi-Donor Trust Funds.‖ 21 January
2010.

DCD/DAC(2010)32/REV1
50
additional partner countries in a similar fashion as the ―One UN‖ initiative.27
In effect, these and other
multi-donor trust funds may actually reduce transaction costs both for UN agencies and partner
governments.
Box 3.4: Co-ordinated Approaches: the MDG Achievement Fund
UN co-ordination was a major motivation in Spain’s large non-core contribution (USD 239.9 million in 2008 alone) to create the MDG Achievement Fund (MDG-F). This single-donor trust fund generates many large joint programmes (200 programmes present in 59 partner countries), encouraging partnerships and serving as a framework that aligns with the implementation of UN reform. It has also generated the multi-donor Expanded ―Delivering as One‖ Window, which has attracted three additional donors: the Netherlands, Norway, and the UK.
The MDG-F is not a permanent source of funding. Most joint programmes started this year have a lifespan of 3 years. Evidence thus far demonstrates that the Steering Committee of the MDG-F and the Ministries of Planning at the country-level reinforce each other’s role, strengthening country ownership in reaching consensus. A mid-term evaluation of the MDG-F ―windows‖ will take place in 2010. This may be a good example of an initiative with a natural sunset clause that found a relevant home in UNDP rather than functioning as a parallel organisation.
Source: UNDP Multi-Donor Trust Fund Office and DAC Statistics.
111. To illustrate how this works at a country-level, one can take the example of a UN country team
(UNCT) that sits down to look at the country‘s priorities, allocates regular resources across priorities and
comes to the conclusion that there is a 20-40% funding gap. In countries where multi-donor trust fund
resources are not available, each UN agency is mobilised at country and headquarter levels to bridge the
gap with existing country-level non-core resources. This creates competition between agencies as each
programme officer responsible for unfunded priorities goes around to the same donors to request additional
funds.
112. In partner countries eligible for either ―One UN‖ or ―Delivering as One‖ funding the same
situation of addressing a funding gap referenced above will unfold differently since the process for
bridging the gap is much more streamlined through the use of available trust funds, therefore lessening
transaction costs of agencies, bilateral donors, and probably partner countries as well. In this instance, the
Resident Co-ordinator dialogue with donors at a country-level and partner countries becomes the modus
operandi of the UN in the field (enhanced to a higher degree when reinforced by good leadership and a
common vision).
2. The World Bank Group
113. Trust funds, or non-core contributions, have been an important instrument for channelling donor
funding to the World Bank. This section provides an overview of the type of Bank trust funds, the Bank‘s
recent policies relating to trust funds, and the effect that the mix of core and non-core funding can have on
the functioning of the organisation.
World Bank Trust Funds
114. In recent years, the Bank‘s trust fund portfolio has grown rapidly in size and complexity. Total
trust fund disbursements in fiscal year 2008 continued to increase, reaching USD 6.72 billion. As a share
of combined Bank disbursements (IDA, IBRD, and trust funds), trust fund disbursements grew from 16%
27
For 2009 and 2010, the UNDG approved Malawi, Papua New Guinea, Bhutan, Kiribati, Samoa, Botswana,
Lesotho, Comoros, Sierra Leone, Kyrgyzstan and Montenegro.

DCD/DAC(2010)32/REV1
51
in fiscal year 2004 to 25% in fiscal year 2008. Excluding Financial Intermediary Funds (FIFs) which are
arrangements for which the Bank provides specific administrative or financial services with a limited
fiduciary or operational role28
, the share of trust fund disbursements grew even more rapidly, from 8% of
combined disbursements in fiscal year 2004 to 14% in fiscal year 2008.29
115. The Bank currently manages 1 045 donor contribution accounts. At the contribution level the
Bank has three types of trust funds: Financial Intermediary Funds (FIFs); IFC Trust Funds and
IBRD/IDA/MIGA Trust Funds. The latter are used to finance Bank Executed (BETF) and Recipient
Executed (RETF) activities (Table 3.2).
Table 3.2: World Bank Group Trust Fund Typology
IBRD/IDA/MIGA TFs Financial Intermediary Funds IFC TFs
BETFs: Funds that support the Bank‘s work program.
RETFs: Funds that the Bank passes on to a third party and for which
the Bank plays an operational role – i.e ., the Bank normally appraises
and supervises activities financed by these funds.
Arrangements where the Bank is responsible for or supervises the
activities financed by the trust fund.
-Arrangements where the Bank is not
responsible for supervising the activities
financed from the trust fund.
BETFs: TFs financing a set of activities following administrative
policies and procedures for Bank budget execution. Bank implements
activities.
RETFs: TFs financing a set of activities following IBRD/IDA
operational policies and procedures. Activities are implemented by
recipient and supervised by the Bank.
Arrangements where IFC is
responsible for or supervises the
activities financed by the trust fund.
FIFs: Funds that involve financial engineering
or complex finance schemes, or where the
Bank provides a specified set of administrative,
financial, or operational services.
Operational
practice
Policy
framework
-Bank as trustee is responsible for the funds
until such time as it transfers the funds to third
parties (which may include IBRD/IDA) who
are responsible to donors or a governance
entity for the use of funds.
IFC Policy (Management
Directive) effective January 1,
2009
Source: World Bank
Non-Core Contributions to the World Bank
116. Differences in what DAC members report as non-core funding to the World Bank and what the
Bank itself records vary, in large part because the Bank includes those large multilateral funds (often FIFs)
for which it is a trustee in its own records, including the Global Fund for AIDS, Tuberculosis and Malaria,
the Global Environment Facility (GEF), and the Heavily-Indebted Poor Countries (HIPC) fund. Even
accounting for difference in what the WBG and DAC donors consider as non-core funding (see Box 3.1),
there are significant discrepancies, as can be seen in Table 3.3 below. This is likely on account of some of
the methodological issues raised at the outset of this chapter, including the under-reporting of such flows
by DAC members.
Table 3.3: DAC* Non-Core Contributions to the World Bank, 2007-8
2007 2008
DAC Statistics 2.2 2.4
World Bank 3.3 3.1
of which:
IBRD/IDA Trust Funds 3.2 3.2
IFC/MIGA Trust Funds 0.2 0.3
28
The major funds in this category include the Heavily Indebted Poor Countries Initiative (HIPC), The Global
Environment Facility (GEF), the Global Fund to Fight AIDS, Tuberculosis and Malaria, Carbon Funds, and the
International Finance Facility for Immunisation (IFFIm). 29
World Bank (2009), ―Partnership and Trust Fund Annual Report: Year Ended June 30, 2008.‖ Global
Partnership and Trust Fund Operations Department, Concessional Finance and Global Partnerships.
DCD/DAC(2010)32/REV1
52
Source: Creditor Reporting System and World Bank data. * OECD/DAC members, excluding Korea and EC Note: Financial Intermediary Funds accounted for USD 4.5 billion in cash contributions in 2008
Regional Allocation of World Bank Trust Funds
117. The World Bank‘s recipient-executed trust funds are those funds that are passed on to a third-
party recipient, and for which the Bank plays an operational role, including the appraisal and supervision
of funded activities. The regional allocation of these trust funds in 2008 is illustrated in the pie chart below.
Sub-Saharan Africa is the first recipient (34%), followed by South Asia (26%), Middle East and North
Africa (19%), East Asia and the Pacific (13%), Europe and Central Asia (5%), and Latin America and the
Caribbean (3%).
In sub-Saharan Africa, disbursements include Education for All Fast Track Initiative (USD 183.2
million) and the Global Food Crisis Response Program (USD 65.5 million).
In the South Asian region, the Afghanistan Reconstruction Trust Fund accounted for 80% of
disbursements (USD 549.1 million).
Middle East and North Africa trust fund disbursements included the Iraq Reconstruction Trust
Fund (USD 92.7 million), and the two West Bank and Gaza trust funds (USD 109.3 million).
Top disbursements in the East Asia and Pacific region include the Ozone Phase Out Fund (USD
59 million), and the Aceh, Indonesia Multi-Donor Trust Fund Program (USD 30.4 million).
118. World Bank multilateral outflows follow a similar geographical distribution as trust funds. For
example, the majority of IDA commitments in fiscal year 2009 went to sub-Saharan Africa (56%) followed
by South Asia (29%), East Asia (9%), Europe and Central Asia (3%) and Latin America and the Caribbean
and Middle East and North Africa at the bottom with 1%.30
In non-member countries such as Kosovo and
the West Bank and Gaza, as well as in fragile and conflict states, trust funds are the main source of World
Bank financing (see Box 3.6).
30
World Bank (2009) ―IDA15 Mid-Term Review Implementation Report.‖ IDA Resources Mobilization
Department (CFPIR), November 2009, pp. 3-4.
http://siteresources.worldbank.org/IDA/Resources/Seminar%20PDFs/73449-
1257448780237/Implementation_Report_IDA15MTR.pdf
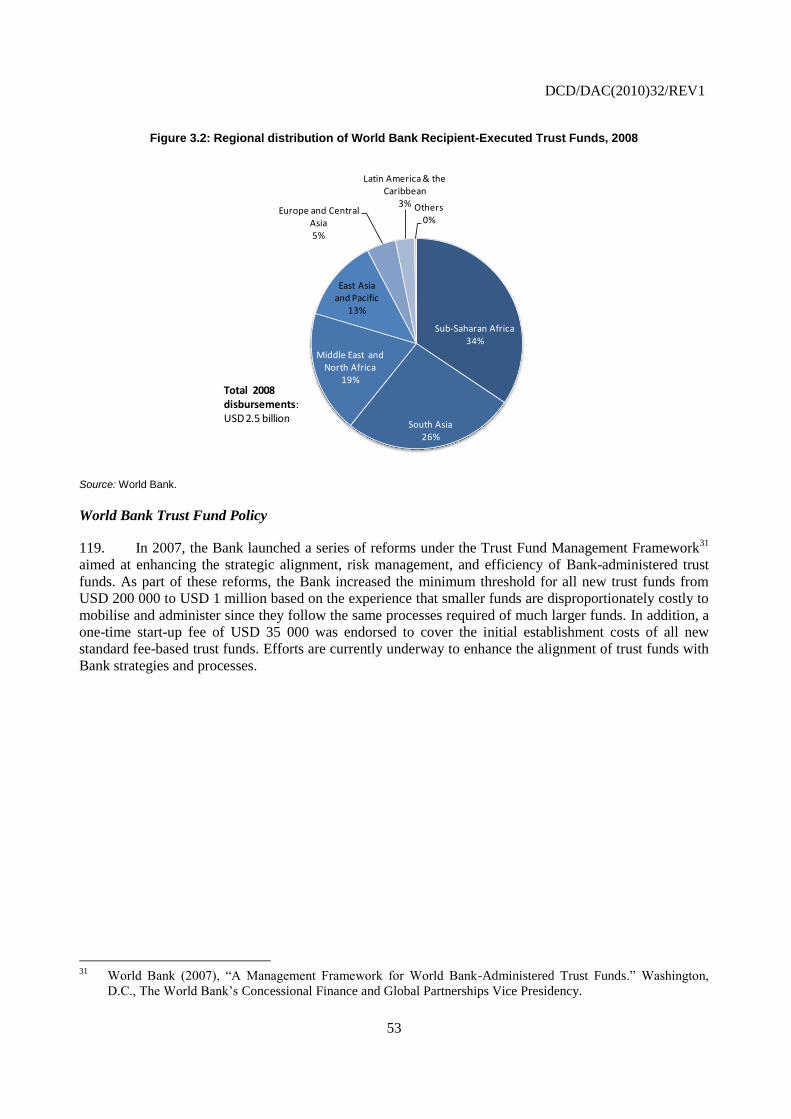
DCD/DAC(2010)32/REV1
53
Figure 3.2: Regional distribution of World Bank Recipient-Executed Trust Funds, 2008
Sub-Saharan Africa34%
South Asia26%
Middle East and North Africa
19%
East Asia and Pacific
13%
Europe and Central Asia5%
Latin America & the Caribbean
3% Others0%
Total 2008 disbursements:USD 2.5 billion
Source: World Bank.
World Bank Trust Fund Policy
119. In 2007, the Bank launched a series of reforms under the Trust Fund Management Framework31
aimed at enhancing the strategic alignment, risk management, and efficiency of Bank-administered trust
funds. As part of these reforms, the Bank increased the minimum threshold for all new trust funds from
USD 200 000 to USD 1 million based on the experience that smaller funds are disproportionately costly to
mobilise and administer since they follow the same processes required of much larger funds. In addition, a
one-time start-up fee of USD 35 000 was endorsed to cover the initial establishment costs of all new
standard fee-based trust funds. Efforts are currently underway to enhance the alignment of trust funds with
Bank strategies and processes.
31
World Bank (2007), ―A Management Framework for World Bank-Administered Trust Funds.‖ Washington,
D.C., The World Bank‘s Concessional Finance and Global Partnerships Vice Presidency.
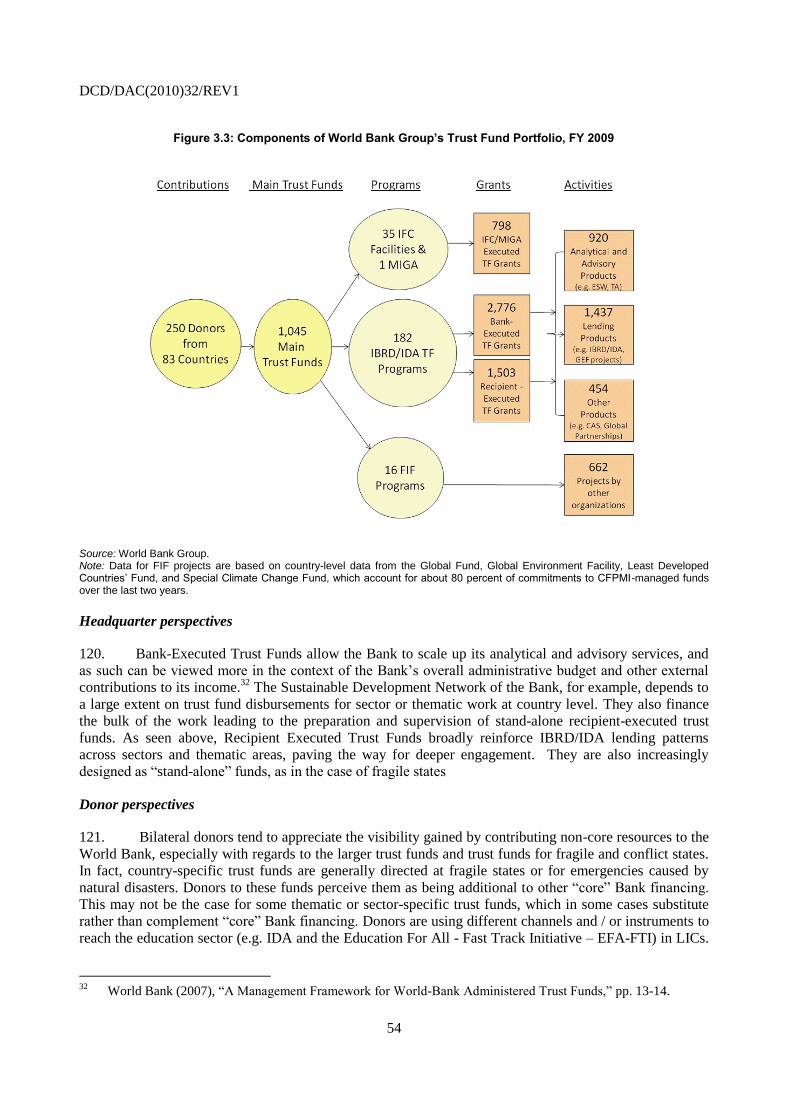
DCD/DAC(2010)32/REV1
54
Figure 3.3: Components of World Bank Group’s Trust Fund Portfolio, FY 2009
Source: World Bank Group. Note: Data for FIF projects are based on country-level data from the Global Fund, Global Environment Facility, Least Developed Countries’ Fund, and Special Climate Change Fund, which account for about 80 percent of commitments to CFPMI-managed funds over the last two years.
Headquarter perspectives
120. Bank-Executed Trust Funds allow the Bank to scale up its analytical and advisory services, and
as such can be viewed more in the context of the Bank‘s overall administrative budget and other external
contributions to its income.32
The Sustainable Development Network of the Bank, for example, depends to
a large extent on trust fund disbursements for sector or thematic work at country level. They also finance
the bulk of the work leading to the preparation and supervision of stand-alone recipient-executed trust
funds. As seen above, Recipient Executed Trust Funds broadly reinforce IBRD/IDA lending patterns
across sectors and thematic areas, paving the way for deeper engagement. They are also increasingly
designed as ―stand-alone‖ funds, as in the case of fragile states
Donor perspectives
121. Bilateral donors tend to appreciate the visibility gained by contributing non-core resources to the
World Bank, especially with regards to the larger trust funds and trust funds for fragile and conflict states.
In fact, country-specific trust funds are generally directed at fragile states or for emergencies caused by
natural disasters. Donors to these funds perceive them as being additional to other ―core‖ Bank financing.
This may not be the case for some thematic or sector-specific trust funds, which in some cases substitute
rather than complement ―core‖ Bank financing. Donors are using different channels and / or instruments to
reach the education sector (e.g. IDA and the Education For All - Fast Track Initiative – EFA-FTI) in LICs.
32
World Bank (2007), ―A Management Framework for World-Bank Administered Trust Funds,‖ pp. 13-14.
DCD/DAC(2010)32/REV1
55
Given the scale of FTI, there is a real risk that FTI might crowd-out IDA education funding.33
World Bank
data presented in a recent midterm evaluation found that the share of primary education in total IDA
education disbursements had fallen steeply between 1995–99 and 2005–09, from 57% in 1995-99 to 30%
in 2005–09.34
122. As a result, one would expect the Bank‘s core resources to focus on specific sectors neglected by
trust funds. For example, in Malawi and Rwanda IDA resources appear to target growth sectors rather than
the education and health sectors that are more likely to benefit from grant-financed trust funds. While these
examples illustrate how core resources can be redirected by the creation of trust funds, there is no evidence
that this detracts from the Bank‘s core activities, which cover a wide range of sectors.
Country-level perspectives
123. IBRD/IDA trust funds are financing over 1 500 recipient-executed activities. In addition, over
600 country-level projects are financed by FIFs (and implemented by other organisations). This can get
complicated in countries with a high number of trust funds since government officials are less likely to
have a good overview of the multiple trust fund accounts. In these instances, the Paris Declaration
principles of country ownership and the Accra Agenda for Action goals for alignment, transparency and
predictability risk not being applied.
Box 3.5: World Bank Trust Funds in Indonesia
Trust funds are an integral part of the World Bank Group’s support to Indonesia, where over 26 country-specific trust funds and 24 global and regional trust funds co-exist. The trust fund portfolio includes both country-specific multi-donor trust funds (USD 891 million) and single-donor trust funds (USD 237 million).
These trust fund arrangements generate 231 grant activities that must be prepared, monitored and supervised by both the Bank and the Government. In addition, the majority of trust funds (Recipient-Executed) require a legal agreement between the Government and the World Bank. This is an additional burden on both the World Bank’s country-level infrastructure and on the Ministry of Planning/Finance.
Some of the large multi-donor trust funds include programs to respond to natural disasters and conflicts (Aceh, Java Reconstruction Fund), and partnerships to support the poverty reduction efforts, basic service delivery (including education), decentralization, public financial management, and trade and investment. There are also some recent and planned contributions for climate change (e.g. in forestry and geothermal), including support from the Climate
Investment Funds
Some of the features of the trust fund program in Indonesia:
Indonesian institutions - both government and non-governmental - implement a large majority of the trust funded work in Indonesia, which is in line with the World Bank's strategy to invest in Indonesian institutions. The Government uses its own budgeting system for Recipient-Executed Trust Funds whenever sectoral or line ministries implement activities.
The World Bank conducts regular reviews with the government of Indonesia of the trust fund portfolio, as part of the Country Portfolio Performance Review (CPPR), to ensure that results are being achieved and are consistent with the Country Partnership Strategy.
Governing bodies of large trust fund programs (such as the Multi-Donor Fund for Aceh) include representatives of the Ministry of Planning, other donors, and multilateral organisations (including the World Bank). NGOs and civil society are also involved as non-voting members.
Source: The World Bank’s Vice Presidency on Concessional Finance and Global Partnerships.
33
Cambridge Education, Mokoro Ltd. et al. (2009), ―Midterm Evaluation of the EFA Fast Track Initiative: Draft
Synthesis Report,‖ 19 November 2009, p. 84. 34
In parallel, commitments show a strong growth in the share of general education (from 5% in 1990-94 to 32% in
2005–09) and support to secondary education (from 9% to 17% over the same period). Ibid., p. 36.

DCD/DAC(2010)32/REV1
56
124. In countries which may have small IDA allocations either due to their population size (e.g. small
island Pacific states) or more modest performance (e.g. post-conflict countries), these may be
supplemented through the use of country specific trust funds to assist in providing additional financing. For
fragile and conflict affected countries without active IDA portfolios, additional resources to bridge the gap
towards reconstruction may come from the State and Peace building Fund, for example, but such situations
may also be constrained by the World Bank's more limited engagement (see Box 3.6).
125. Indeed, trust funds also serve to provide ―blend‖ financing terms when they inject concessional
financing into IBRD countries, or change the credit/grant mix in IDA countries. In this way, trust fund
disbursements can result in ―blend‖ financing at a country-level and somewhat complicate the World Bank
disbursement picture. Specific cases such as transitional non-creditworthy (or even non-member) post-
conflict situations also require tailor-made grants and finance.
Box 3.6: The World Bank’s State and Peacebuilding Fund
The State and Peacebuilding Fund of the World Bank supported by Netherlands, Norway and Australia was established in 2008 to replace the Post-Conflict and Low-Income Countries under Stress (LICUS) Funds.
Its purpose is to:
1. Support measures to improve governance and institutional performance in countries emerging from, in, or at risk of sliding into crisis or arrears; and
2. Support the reconstruction and development of countries prone to, in, or emerging from conflict.
Support is given to conflict-affected states for stabilisation efforts. Reconstruction efforts primarily take place in countries with either no or minimal IDA portfolios. SPF funding complements World Bank financing and provides support to countries in arrears for small and urgent activities not easily funded under regular Bank credit or grant operations. The SPF also supports two countries in arrears: Zimbabwe and Somalia.
As of March 2010, over half of the amounts of approved SPF projects were for Africa (USD 30.5 million). Overall, some of the largest approved projects (USD 5 million) were for Colombia, Guinea-Bissau, Haiti, Iraq, and Zimbabwe. To date the Netherlands, Australia and Norway have contributed USD 19 million to this Fund.
Source: World Bank.
3. UN and World Bank Trust Fund collaboration
126. In most fragile, conflict and transition states both UN and World Bank multi-donor trust funds
are operating. Where they appear to attract funding from the same donors and respond to similar demands,
it is tempting to ask why a single funding channel is not the preferred option. In some cases, competing
demands may not be satisfied by a single channel or institution, as discussed in the Afghanistan example in
Box 3.7.
127. One of the recommendations from the ―Good Humanitarian Donorship‖, a commissioned review
of humanitarian financing instruments, is that donors should not rely exclusively on any single funding
modality. Nonetheless, dual administrative systems can add complexity and sometimes, delay, as has been
amply documented in the case of South Sudan where eight different pooled mechanisms were created to
fund largely overlapping recovery priorities.35
It is, therefore, important for donors to discuss how to make
these arrangements compatible with further calls for alignment, harmonisation, and predictability.
35
OECD (2010), Transition Financing: Building a Better Response.

DCD/DAC(2010)32/REV1
57
128. At the end of 2008, a number of UN agencies, funds and programmes36
and the World Bank
developed and agreed on an instrument (including the Fiduciary Principles Accord) to facilitate the transfer
of funds from a World Bank-administered trust fund for crisis and post-crisis situations to a UN
organisation, or vice-versa, from a UNDG trust fund for crisis and post-crisis situations to the World Bank.
This allows the recipient to apply its own regulations, rules and procedures – including those relating to
procurement, audit, and programme support costs – when managing these funds.
Box 3.7: UNDP and World Bank Multi-donor Trust Funds
The division of labour between trust funds of the World Bank and the UN on the ground is not always obvious. In some cases, both organisations fund similar activities. In the case of Afghanistan, hindsight offers a view on the complementary efforts of World Bank and UN trust funds, even if this was not as clearly defined and evident when they were first established.
In the beginning of 2002, the Afghan Interim Authority did not have the domestic resources to pay civil servants or offer basic social services. Because UNDP already had a strong presence in Afghanistan, it was able to quickly provide short-term funding for the most important elements of re-establishing the civil service (recruitment, payment of salaries of teachers and other civil servants, winterisation of government buildings, procurement of office equipment, vehicles for ministers) by setting up the Afghanistan Interim Authority Fund (AIAF).
The AIAF lasted for a period of six months, until arrangements for longer-term budget support and reconstruction were in place. At the same time, donors endorsed the concept of an Afghanistan Reconstruction Trust Fund (ARTF) to be administered by the World Bank. By May 2002 the ARTF began operating under two windows to continue funding recurrent costs, and to invest in infrastructure and to provide budget support in the context of Afghanistan’s temporary National Development Framework.
Since World Bank-administered funds cannot finance security-related activities, which are critical for any successful and durable implementation of ARTF activities, the Law and Order Trust Fund for Afghanistan (LOTFA) was established by UNDP. The LOTFA operates in parallel to the ARTF to ensure the remuneration of police staff and to support the rehabilitation and operationalisation of police facilities in close co-ordination with the Ministries of the Interior and Finance. Both the ARTF and the LOTFA continue to operate today.
Source: OECD (2010), Transition Financing: Building a Better Response.
Main Findings
UNDP non-core funding is used for similar thematic areas as its core funding. Funding to the
Multi-Donor Trust Fund Office helps align donors and UN agencies at a country-level, e.g.
through the ―One UN‖ funds. (Paragraph 104)
World Bank non-core flows help diversify its portfolio to countries where loan instruments are
unavailable (e.g. for arrears reasons or to non-members). (Paragraph 118)
36
WHO, ILO, UNESCO, FAO, WFP, UNDP, UNICEF, UNFPA, UNHCR, UN-Habitat and UNOPS
DCD/DAC(2010)32/REV1
58
4. DEVELOPMENT PERSPECTIVES FOR A POST-COPENHAGEN CLIMATE FUNDING
ARCHITECTURE
1. Introduction
129. This chapter examines the funding mechanisms and governance arrangements used to deliver
financial resources to address climate change. The focus is on the institutional framework, rather than the
resources themselves. This paper reviews the various levers and components of existing funds, focusing on
public, and primarily multilateral, funds. This chapter‘s aim is to map the type of configurations that could
best meet developing countries‘ requirements to adapt to and to mitigate the effects of climate change.
Copenhagen Accord
130. The December 2009 Copenhagen Accord promises developing countries ―scaled up, new and
additional, predictable and adequate funding as well as improved access ... to enable and support enhanced
action on mitigation…adaptation, technology development and transfer and capacity-building, for
enhanced implementation of the Convention‖ (Paragraph 8). Developed countries committed to provide
new and additional resources approaching USD 30 billion for the period 2010-2012 with balanced
allocation between adaptation and mitigation. In the longer-term, they committed to a goal of mobilising
USD 100 billion dollars a year by 2020 to meet the needs of developing countries. This funding will come
from a wide variety of sources – public and private, bilateral and multilateral – including alternative
sources of finance. A UN High Level Advisory Group on Climate Change Financing was established to
examine the potential sources of revenue towards meeting this goal. The resources are likely to be
delivered via multiple channels including the funds established under the Convention and the Kyoto
Protocol, including the Copenhagen Green Climate Fund, as well as other multilateral, bilateral, and
regional channels.
Mitigation and Adaptation
131. Greenhouse gas (GHG) mitigation is a global public good – its decrease in one region of the
world benefits all by reducing global GHG concentrations that cause climate change. The direct benefits of
adaptation action are mainly local or regional even if the indirect effects of climate change can cross
borders (see Box 4.1 below). Adaptation is inextricably linked to development, not least because the
poorest countries are the most vulnerable to the effects of climate change. Conversely, mitigation offers the
longer horizon promise of establishing new paths for sustainable development. For the purposes of this
paper, we use medium-term UNFCCC estimates for annual funding needed in 2030. For mitigation this
ranges from USD 82-87 billion and USD 28-67 billion for adaptation, for a total range of USD 110-154
million for mitigation and adaptation. Estimates vary widely, but are largely consistent with the
Copenhagen Accord proposed additional resources. The most recent meeting of the UN Secretary-
General‘s High-level Advisory Group on Climate Change Financing (AGF) argued that adaptation,
mitigation and development objectives should not be addressed in a compartmentalised fashion.37
This is
37
UN SG‘s High-level Advisory Group on Climate Change, report on the first meeting 31 March 2010.
http://www.un.org/wcm/webdav/site/climatechange/shared/Documents/LondonMeetingReport_31%20Mar%202
010.pdf

DCD/DAC(2010)32/REV1
59
significant because in the past compartmentalised investments have led to ineffective or even counter-
productive results.
Box 4.1: Mitigation and Adaptation
Mitigation: In the context of climate change, a human intervention to reduce the sources or enhance the sinks of greenhouse gases. Examples include using fossil fuels more efficiently for industrial processes or electricity generation, switching to solar energy or wind power, improving the insulation of buildings, and expanding forests and other "sinks" to remove greater amounts of carbon dioxide from the atmosphere.
Adaptation: Adjustment in natural or human systems in response to actual or expected climatic stimuli or their effects, which moderates harm or exploits beneficial opportunities. Examples include (1) shore protection (e.g., dikes, sea walls, beach nourishment), which can prevent sea level rise from inundating low-lying coastal areas; and (2) farmers planting more climate-resilient crops.
Source: UNFCCC website.
2. Sources of funding
132. Much of these needs will be funded through domestic sources, including many millions of purely
private transactions. The following identity (treating external public assistance as the balancing item) gives
a sense of how one would determine external public resource requirements in developing countries:
Total needs - All private (domestic and foreign) resources – public domestic resources =
External public resources required
133. Private international flows will include FDI and flows stimulated by cap-and-trade schemes.38
Public domestic revenues will account for some funding of climate change needs, depending on the
country context. The balance is the gap that could be filled by external public flows. To provide some
comparison or context, total gross official development assistance (ODA), excluding debt relief was equal
to USD 130 billion in 2009, and has grown in real terms by some 4 % per annum in real terms since
2005.39
134. Even if in the long-term private finance including carbon market finance will be able to
generate the incremental investment necessary, this is not likely to be the case in the short-term. Attracting
public finance (i.e. tax-generated) will be critical to establish the regulatory framework necessary to attract
private finance. The implementation of countries‘ national development and climate change strategies will
serve as a key signal and lever to attract private flows, including debt guarantees and other incentive
structures.
135. A list of potential new funding sources is included for information in Annex 3.
38
Collier, Conway and Venables (2008), p. 349 argue that if each person was endowed with the same emission
rights, the financial flows to Africa resulting from sales of carbon permits might be of comparable size to its
current aid receipts. 39
OECD (2010), ―DAC Members‘ 2009 Preliminary ODA.‖ Available online:
http://www.oecd.org/LongAbstract/0,3425,en_2649_34447_45067482_119656_1_1_1,00.html

DCD/DAC(2010)32/REV1
60
Additionality and the use of ODA in relation to climate change
136. Key post-Copenhagen processes, including the Mexico CoP-16, will need to find robust
mechanisms for measuring, reporting and verifying (MRV) mitigation support and actions undertaken (and
monitoring, reviewing and reporting for adaptation investments). At the moment, the DAC ―Rio marker‖
for climate change mitigation and the recently approved new marker for adaptation provide the only
systematic way for DAC members to identify public finance flows that serve clearly defined adaptation or
mitigation objectives. Markers could also apply to non-concessional financing from international financial
institutions and form a useful basis for wider tracking of non-DAC and even private flows, if resources are
available and stakeholders agree. However, the markers are not a sufficient basis from which to isolate the
volume of spending going to these objectives compared to other development activities.
137. The question of ―additionality‖ of climate change finance to DAC, or indeed world, ODA cannot
be resolved by adopting markers to identify climate flows. Markers show us which components of country
assistance portfolios are at least partly dual purpose (development, and one or both aspects of climate
change action), but do not apportion amounts within each programme to each objective. The high intrinsic
purpose overlap of both adaptation and mitigation with development makes any such attribution difficult.
If it was even technically feasible to distinguish between adaptation and development actions, for example,
it would be a challenging task for the DAC to decide on attribution guidelines for different types of
programmes (depending on sectors, extent of earmarks, etc.) to approximate the accounting by volume
between ―climate‖ and ―non-climate.‖ For this process to be seen as objective, it would moreover have to
draw in a broad range of expertise from partner countries and other stakeholders involved post-
Copenhagen.
138. Even if a system were developed to split climate from non-climate ODA within each single
project, it is not clear that this would be sufficient for monitoring international commitments. For example,
some might see the Copenhagen Accord as allowing the full value of relevant mitigation and adaptation
projects to be counted, whereas others might insist that only the ―climate-specific‖ share, or the
incremental cost to ―climate-proof‖ an activity, would qualify. Moreover, does ―new and additional‖ mean
additional to future ODA levels already committed to but not yet reached, or only to current levels? Such
issues must also be seen in a wider political setting that goes well beyond the membership of the DAC.
3. Integration with Country-level Strategies
139. Drawing from country-level experiences, it is clear that developing country ownership and use of
existing country systems are key elements for the effective implementation of programmes. This section
offers some guidance as to how flows can effectively support developing countries to pursue low carbon
and climate resilient development pathways. Resources and support must be ―…effectively governed and
channelled towards explicit mitigating activities and action…backed by comprehensive national
governance and strategies.‖40
Integrating climate change efforts at country-level
140. Drawing on four countries‘ national action on climate change (Bangladesh, Mexico, Ghana,
Indonesia), this section highlights the factors that contribute to effective country level action on climate
change. While there is no blueprint or even proven best practice, a range of common approaches adapted to
the country context and driven by the country is emerging.
40
European Commission (June 2009), ―Report on International financing mechanisms for supporting climate
policies‖ p. 11.

DCD/DAC(2010)32/REV1
61
141. In Bangladesh, the National Climate Change Strategy and associated Action Plan (2008) are
linked to the 2008-2011 Poverty Reduction Strategy. This cross-sectoral approach engages all aspects of
planning, investment, and decision-making and applies it to the challenges of climate change. The Action
Plan covers 37 government programmes in six thematic areas – food security, social protection, disaster
management, mitigation/low carbon development, and capacity development. A multi-donor trust fund co-
ordinates external resources and blends these with domestic resources to implement the national climate
change strategy. Figure 4.1 below illustrates these relationships.
Figure 4.1: Institutional framework for climate change in Bangladesh
Source: ENVIRONET secretariat.
142. In Ghana, there is a strong focus on defining targets and measuring results for climate change
and monitoring progress towards these. The Performance Assessment Frameworks of the sectors engaged
in implementing climate change actions serve to track progress, facilitating monitoring and evaluation of
specific activities. National budget allocations are fully integrated in the Medium Term Expenditure
Frameworks (MTEF) of the sectors involved.
143. Indonesia, like Bangladesh, has established the Indonesia Climate Change Trust Fund that allows
international funds to be delivered horizontally across a range of sectors and in line with the national
budget, thus using country systems. As international finance for climate change is scaled-up in the future, it
will be important to use and strengthen partners‘ public financial management systems so that they can
absorb larger amounts of funding and enhance their climate change efforts.
144. In Mexico, all 32 states are preparing a State Climate Change Strategy, as are the major cities.
There, decentralised planning complements national planning and ensures broad-based ownership and a
focus on local priorities as an example of vertical integration across all levels of the Government
National Climate Change Strategy - 2008
Poverty Reduction Strategy
(2008-2011)
National Environment Committee (Prime minister, MPs, line ministries, CSOs) NAPA ’05
Action plan - 2008
37 Government programmes in 6 thematic areas (food security, social
protection, disaster mgmt, mitigation / low carbon dev’mt, capacity dev’mt)
Coastal Zone Policy 2005
National Water Policy
Inter-Ministerial Committee on Climate
change (MoEnv, line ministries, CSOs)
Comprehensive Disaster Management
Programme National Budget (MoFinance) and
Multi-Donor Trust Fund (MDTF)

DCD/DAC(2010)32/REV1
62
145. Sustained capacity development was found to be necessary in all four countries; not just for
those working directly on climate change, but also those engaged in sectors affected by climate change and
those involved in public financial management, monitoring and reporting. A country‘s capacity to address
climate change and make the most of any opportunities it offers (through, for example, the carbon market)
is dependent on the skills of a broad cross-section of government, the private sector and civil society.
146. One key indicator of the initial success of the strategies employed in the countries examined may
be that they have attracted both domestic and international financial resources to implement climate change
actions.41
What emerges is that genuine country ownership of relevant plans and strategies, regardless of
the form chosen, is essential to the successful funding and implementation of these plans.42
Tailoring the
planning process to a country‘s needs and institutions, rather than using a standardised approach, can
increase ownership and ensure that plans are translated into appropriate action.
147. It is too early to evaluate the impact of these approaches on reducing emissions and increasing
climate resilience. Key challenges persist, including developing a national strategy with broad ownership
across a wide range of stakeholders and maintaining a focus on local priorities that also takes into account
the longer-term implications of climate change. In addition, mechanisms to direct domestic and
international financial resources towards the implementation of climate change actions need to be
established. These mechanisms will need to be able to absorb and manage the scaled-up resources expected
post-2012 and to provide robust monitoring and consistent reporting.
Lessons learned from Global Funds in other sectors
148. Global funds are defined as large multi-country funds that contain a significant element of
earmarked funding for specific objectives with thematic, sectoral or sub-sectoral coverage. In health, global
funds were created by donors to focus on achieving results in a sector where results achieved by significant
resource transfers were deemed unsatisfactory. As a result, new funds, financed by private donors and
governments, were established to address specific goals. Examples include the Global Fund to Fight AIDS,
Tuberculosis and Malaria and the Global Alliance for Vaccines and Immunisation (GAVI). As global
funds have increased in number and expanded in size, this has led to an increase in the importance of the
specific interventions they support in proportion to the overall funding received by a given country.43
149. The multiplicity and diversity of funding sources to address climate change is similar to that for
health care, so the experience with global funds in the health sector44
may be useful in informing future
discussions. There is a useful body of work to draw upon since the OECD selected health as a tracer sector
for examining aid effectiveness.45
Overall levels of health funding have increased at a rate of 14% per year
from 2000 to 2007 from USD 5.5 billion to USD 13.5 billion.46
This has helped in scaling up investments
to reach health outcomes. Given that the estimated scale of funding for climate change is expected to be
even larger than for health, much can be learned from the health experience.
41
Emphasis on both: national strategies motivated solely to attract external funding are rarely successful, as
discussed in more detail below. 42
Sharma, Anju (2009), ―Planning to Deliver: Making the Rio Conventions more Effective on the Ground‖ GTZ,
Federal Ministry for Economic Co-operation and Development, Eschborn, Germany. 43
World Bank (2008), ―Global Program Funds at Country Level: what we have learned.‖ Washington, D.C. 44
A number of global funds have been established to increase flows to address global health challenges such as
HIV/AIDS and other infectious diseases such as TB. Global funds active in the health sector include the Global
Fund to Fight AIDS, Malaria and TB, and the Global Alliance for Vaccines and Immunization (GAVI), also
administering the International Finance Facility for Immunization (IFFIm). 45
Aid Effectiveness in Health Portal online:
www.aideffectiveness.org/web/index.php?option=com_content&view=article&id=48&Itemid=65 46
OECD Creditor Reporting System.

DCD/DAC(2010)32/REV1
63
150. The global health fund experience suggests that funds for specialised purposes – energy
efficiency, renewable, REDD+, technology transfer, capacity building, etc. – can be effective in the short-
term, but that in the longer-term, they must be integrated into the development strategies of partner
countries for them to be sustainable. Because the bulk of the increase in health spending benefited global
funds as well as similarly earmarked bilateral funding instruments, the situation also presents challenges
for partner countries since the number, diversity and relative inflexibility of aid channels have increased in
parallel, thereby putting a greater administrative burden on all concerned, and in particular on partner
countries where human resources are likely to be more limited.
Aid Effectiveness Principles
151. Climate-related funding will often be only one component of the total donor resources in a
partner country, so harmonising the differing requirements and procedures with other funding sources is
likely to be complex. In the presence of multiple funding mechanisms, each with its own administrative
and reporting requirements, the resulting workload overburdens partner countries‘ administrative
capacity.47
Multiple funding sources for adaptation, mitigation, and REDD+ already exist. In this context,
it appears that the health experience is destined to be repeated unless efforts are made to consolidate these.
152. The high volume of funding from global funds for health has delayed questions of predictability
and sustainability that are implicitly a key part of the development effectiveness debate. Global funds are
typically proposal-based and strictly conditional on results, so ensuring predictability and sustainability of
access to funding can be challenging for two reasons. First, access to this funding can be unpredictable
from one year to the next if a proposal competes for limited funds with another party whose proposal might
be more compelling. Second, if one has to demonstrate results, how does one ensure that a multi-year
project is not ―switched off‖ just when it is most needed? Can continued success in proposals to global
funds be sufficiently relied upon by parties receiving the awards to factor into the country‘s medium-term
planning? Given the global health fund experience, it would seem that new proposal-based systems should
be avoided since they cannot be relied upon in the long-term and because they usually require complex
appraisal systems with high transaction costs for partner countries. On the other hand, both GAVI and the
Global Fund are now able to provide more sustainable and predictable funding because of donors‘
commitments to innovative financing mechanisms such as the IFFIm and UNITAID.
153. When national development or climate plans are prioritised and integrated into a country‘s
planning and budgeting processes, national stakeholders can effectively lead and steer efforts to mitigate
and to address the negative effects of climate change. OECD policy guidance on Integrating Climate
Change Adaptation into Development Co-operation48
proposes the use of a climate lens to examine the
risks arising from climate variability, the vulnerabilities and opportunities associated with new policies,
plans or projects, and how to adapt existing policies and plans to address these risks and opportunities.
154. To sum up, arguments for creating parallel new funds simply because existing funds have not yet
delivered, or because the financial gaps for funding climate change mitigation and adaptation efforts is so
large, are not sufficiently convincing.49
Instead, it might be worth starting with an analysis of the functions
and purposes of the envisaged new regime and seeing whether existing institutions can fulfil these roles.50
47
Commission on Climate Change and Development (2009). Stockholm, Sweden. 48
OECD (2009), Integrating Climate Change Adaptation into Development Co-operation: Policy Guidance,
OECD, Paris. 49
Paragraph 19(c) of the Accra Agenda for Action states that ―As new global challenges emerge, donors will
ensure that existing channels for aid delivery are used and, if necessary, strengthened before creating separate
new channels that risk further fragmentation and complicate co-ordination at country level.‖ 50
Müller (2009), ―Procrustes‘ Bed & Ockham‘s Razor: The debate on existing institutions in climate finance,‖
Oxford Institute for Energy studies, November.

DCD/DAC(2010)32/REV1
64
Other solutions and configurations, including a ―networked‖ approach of separating out functions and
institutional responsibilities may be equally desirable and/or manageable. Whether or not the assistance is
delivered as official development assistance or not, the success will be determined by whether this
institutional arrangement meets the financial needs to adapt to and to mitigate the effects of climate
change, while improving the prospects for full national ownership, alignment, harmonisation and effective
management on the whole.

DCD/DAC(2010)32/REV1
65
Figure 4.2: Chart of existing multilateral climate change funds
Source: DAC Secretariat design based on www.climatefundsupdate.org
DCD/DAC(2010)32/REV1
66
4. Current external public funding to address climate change
155. Developed country Parties are expected to provide information on the bilateral and multilateral
assistance they provide in their national communications to the UNFCCC. Due to gaps and inconsistencies
in reporting approaches in the third and fourth national communications, it is not yet possible to calculate
the total financial assistance provided. However, it is estimated that total resources dedicated to climate
change mitigation and adaptation are currently in the range of USD 9-10 billion per year (USD 8-9 billion
for mitigation and USD 1 billion for adaptation).51
Much of this financing is on a non-concessional or
market terms.
156. Bilateral ODA for climate change mitigation has amounted to USD 5.2 billion in recent years as
identified by the Rio marker for climate change mitigation (see Annex 3 for more information on the Rio
marker). Adaptation activities are not separately identifiable in DAC statistics, but DAC members agreed
on a statistical marker to identify bilateral and multilateral projects targeting climate change adaptation to
be applied to 2010 data.
157. Multilateral outflows for climate change mitigation and adaptation are identifiable only for the
EU Institutions and the World Bank Group in DAC statistics. This is an important share of total public
resources since public climate change flows consist of a growing share of funding from multilateral
agencies and global funds. Concessional IDA commitments for climate change were about USD 334
million in 2008 and trust fund disbursements were USD 44 million.52
Of course, this figure is only a partial
overview of the total resources from multilateral development banks.
Existing climate change funds
158. The existing institutional climate change framework consists of the financial mechanism of the
Convention, the Adaptation Fund under the Kyoto Protocol, and bilateral, multilateral and regional flows
of public and private funds. As the landscape in Figure 4.2 illustrates, many climate change funds in
existence today are outside the UN Framework Convention on Climate Change (UNFCCC), the
international environmental treaty aimed at stabilising greenhouse gas concentrations in the atmosphere.
159. Today, cumulative disbursements by the global funds for climate change amount to USD 2.9
billion (Table 4.1) or about USD 246 million per year.53
This does not include recent disbursements of the
Adaptation Fund, about USD 6 million as of January 2010. Clearly the amount of disbursements from
these funds to date is well short of the demonstrated need.
51
World Bank (2009), World Development Report 2010: Development and Climate Change, Chapter 6. Corfee-
Morlot et al. (2009) estimate an upper-bound for mitigation-specific support to developing countries of around
USD 53 billion in 2007 if one includes GEF and CDM flows (the number is lower depending on how CDM
flows are accounted for). 52
Steckhan (2009), "Financial Flows for Environment: World Bank, UNDP and UNEP." Concessional Finance
and Global Partnerships Vice Presidency, World Bank. 53
Secretariat estimates.

DCD/DAC(2010)32/REV1
67
Table 4.1: Funds disbursed for climate change to date
Strategy / ProposalReview /
AssessmentTrustee
Strategic Priority
on Adaptation
July 2004 Adaptation 50.0 Pilot & demonstration
projects
GEF Secretariat &
Council review GEF
LDC Fund October 2002 Adaptation 111.9 (1) Support for National
Adaptation
Programmes of Action
(NAPAs);
(2) project proposals
on the basis of NAPAs.
GEF Secretariat &
Council review,
coordinating with
Convention
secretariat
GEF
Special Climate
Change Fund
October 2002 Adaptation 91.2 Project proposals
concerning risk
reduction strategies,
adaptation measures
and capacity building.
GEF Secretariat &
Council review,
coordinating with
Convention
secretariat
GEF
MDG
Achievement
Fund
March 2007 Adpatation &
Mitigation
85.5 Programme proposals
from UN country teams
on basis of national
strategies.
Technical
subcommittee
reviews proposals
from eligible
countries
UNDP
GEF Trust Fund -
Climate Change
focal area
1994 Adaptation &
Mitigation
2,600.0 Projects for mitigation
and adaptation,
including support for
national
communications.
GEF Secretariat &
Council review IBRD
Review of disburing funds
Cumulative
amount
disbursed
(USD millions)
Core PurposeDate fund
operationalExisting Funds
Source: DAC Secretariat based on www.climatefundsupdate.org Note: Annex 3 maps countries receiving disbursements for adaptation and mitigation from these five funds
Funds under the Convention
160. Three funds are included under the UN Framework Convention on Climate Change (UNFCCC):
the Least Developed Countries Fund (LDC Fund), Special Climate Change Fund (SCCF), and the
Adaptation Fund.
161. The Global Environment Facility (GEF) manages the LDC Fund and the SCCF established under
the Convention. In the first phase of the LDC Fund, LDCs were supported to develop National Adaptation
Programmes of Action (NAPA). The second phase involves submitting project concepts developed on the
basis of the NAPA for funding. An evaluation of the LDC Fund concluded that disbursement of funds for
priority projects has been of an insignificant scale compared to adaptation needs in LDCs.54
Recommendations suggest that a climate change adaptation planning cycle where Ministries of Finance
and Planning play a key role needs to be initiated to provide a way of co-ordinating the investment of funds
available from other sources. The evaluation also suggests that the present institutional arrangements and
delivery mechanisms of the LDC Fund should be reviewed to provide sufficient funding to implement
NAPA programmes rather than individual projects.
162. The SCCF was established to support longer term implementation of adaptation actions in non-
Annex I parties. These projects must be in line with strategies set out in national communications or
54
Danida and GEF Evaluation Office (2009), ―Evaluation of Least Developed Countries Fund for Adaptation.‖

DCD/DAC(2010)32/REV1
68
NAPAs. Priority areas include water, land management, agriculture, health, infrastructure development,
fragile ecosystems, integrated coastal zone management, disaster risk management and prevention.
163. The Adaptation Fund under the Kyoto Protocol was established to finance concrete adaptation
projects and programmes in developing country Parties to the Protocol, especially those most vulnerable to
the adverse effects of climate change. Qualified developing country institutions can receive funds directly
from the Adaptation Fund. Management of the Adaptation Fund is subject to the authority and guidance of
the COP. The GEF serves as the secretariat and the World Bank serves as the trustee of the Adaptation
Fund Board, both on an interim basis. Today, the Adaptation Fund‘s main source of revenue is 2% of the
certified emission reductions (CERs) issued for Clean Development Mechanism projects, but the first
voluntary contributions to the Fund from Spain and Germany were also received in 2010. As of January
2010, USD 5.95 million had been disbursed. The first four projects of the Adaptation Fund were approved
in June 2010.
Other Climate Funds
164. The GEF, in addition to being the financial mechanism for the LDC Fund and the SCCF, also
oversees the Strategic Priority on Adaptation and the GEF Trust Fund. The Strategic Priority on
Adaptation was a three-year pilot programme aiming to show how adaptation planning and assessment
could be practically translated into full-scale projects. The GEF Trust Fund has disbursed the vast majority
of climate funds to date, around USD 2.6 billion (cumulative). The GEF uses implementing agencies, such
as UNDP, UNEP and IBRD (the World Bank), for the projects it funds. Some developing countries believe
this delays decisions, increases the cost and adds conditions that could otherwise be avoided by funds
operating on a ―direct access‖ principle whereby approved implementing entities at the country level can
access funds directly for approved projects and programmes.
165. The UNDP serves as the Administrative Agent on behalf of UNEP and the FAO for the United
Nations Collaborative Programme on Reducing Emissions from Deforestation and Forest Degradation in
Developing Countries (UN-REDD), a multi-donor trust fund, as well as for the MDG Achievement Fund.
The MDG Achievement Fund covers eight thematic areas, among them environment and climate change,
and resources are allocated based on UN Country Teams‘ proposals and countries‘ national strategies and
climate change plans. Both these funds are administered by the UNDP Multi-donor Trust Fund office as an
inter-agency UN resource.
166. The 2005 G8 Gleneagles communiqué on Climate Change, Energy and Sustainable Development
gave the World Bank a key role in ―…creating a new framework for clean energy and development,
including investment and financing.‖55
This was reaffirmed at the September 2009 G20 summit in
Pittsburgh.56
The Climate Investment Funds (CIFs) were created in 2008 and established at the World
Bank. The CIFs comprise two funds, the Clean Technology Fund to support investments in low-carbon
technologies and the Strategic Climate Fund to test innovative approaches to climate change mitigation.
The Pilot Program for Climate Resilience (PPCR) falls under the umbrella of the Strategic Climate Fund.
For the PPCR, resources are initially allocated to nine countries and two regions chosen by a steering
committee. These funds are implemented jointly by the regional development banks and the WBG. The
Forest Carbon Partnership Facility was also established at the World Bank (independent from the CIFs) to
support countries preparing REDD strategies and to remunerate countries with verifiable reductions in
emissions.
55
Paragraph 11(b) of the Gleneagles communiqué (2005), ―Climate Change, Energy, and Sustainable
Development.‖ 56
See Pittsburgh G20 communiqué: http://www.pittsburghsummit.gov/mediacenter/129639.htm
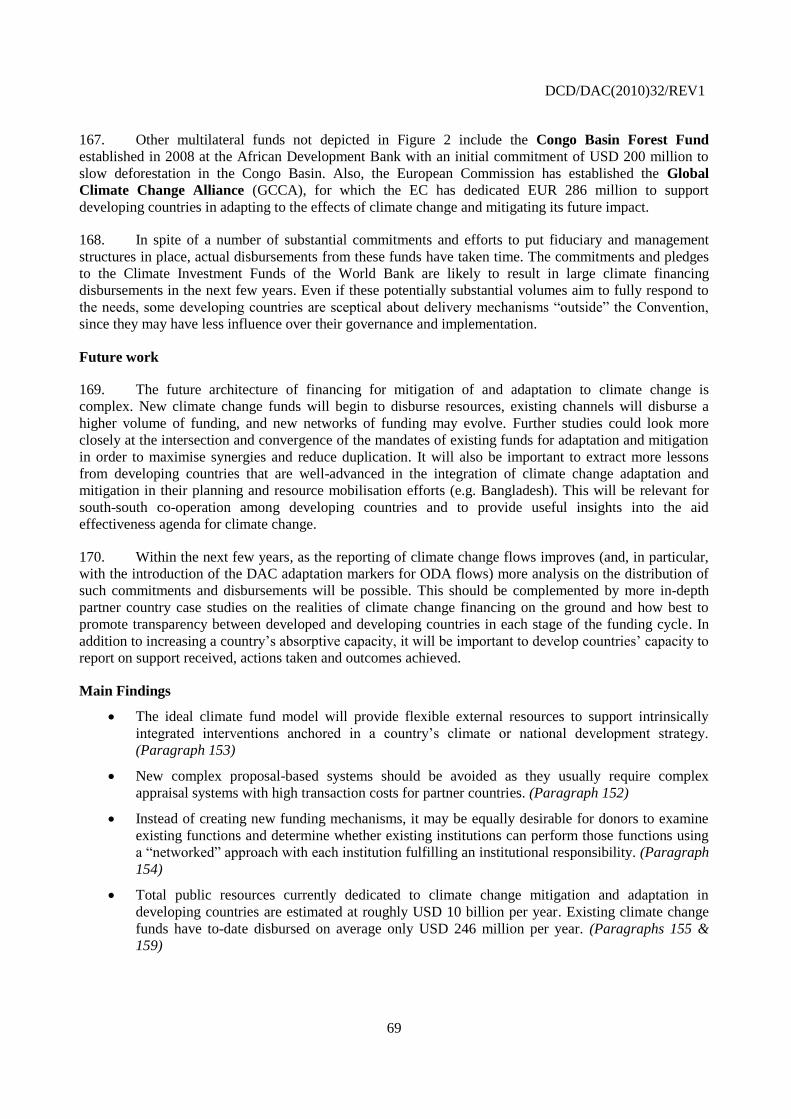
DCD/DAC(2010)32/REV1
69
167. Other multilateral funds not depicted in Figure 2 include the Congo Basin Forest Fund
established in 2008 at the African Development Bank with an initial commitment of USD 200 million to
slow deforestation in the Congo Basin. Also, the European Commission has established the Global
Climate Change Alliance (GCCA), for which the EC has dedicated EUR 286 million to support
developing countries in adapting to the effects of climate change and mitigating its future impact.
168. In spite of a number of substantial commitments and efforts to put fiduciary and management
structures in place, actual disbursements from these funds have taken time. The commitments and pledges
to the Climate Investment Funds of the World Bank are likely to result in large climate financing
disbursements in the next few years. Even if these potentially substantial volumes aim to fully respond to
the needs, some developing countries are sceptical about delivery mechanisms ―outside‖ the Convention,
since they may have less influence over their governance and implementation.
Future work
169. The future architecture of financing for mitigation of and adaptation to climate change is
complex. New climate change funds will begin to disburse resources, existing channels will disburse a
higher volume of funding, and new networks of funding may evolve. Further studies could look more
closely at the intersection and convergence of the mandates of existing funds for adaptation and mitigation
in order to maximise synergies and reduce duplication. It will also be important to extract more lessons
from developing countries that are well-advanced in the integration of climate change adaptation and
mitigation in their planning and resource mobilisation efforts (e.g. Bangladesh). This will be relevant for
south-south co-operation among developing countries and to provide useful insights into the aid
effectiveness agenda for climate change.
170. Within the next few years, as the reporting of climate change flows improves (and, in particular,
with the introduction of the DAC adaptation markers for ODA flows) more analysis on the distribution of
such commitments and disbursements will be possible. This should be complemented by more in-depth
partner country case studies on the realities of climate change financing on the ground and how best to
promote transparency between developed and developing countries in each stage of the funding cycle. In
addition to increasing a country‘s absorptive capacity, it will be important to develop countries‘ capacity to
report on support received, actions taken and outcomes achieved.
Main Findings
The ideal climate fund model will provide flexible external resources to support intrinsically
integrated interventions anchored in a country‘s climate or national development strategy.
(Paragraph 153)
New complex proposal-based systems should be avoided as they usually require complex
appraisal systems with high transaction costs for partner countries. (Paragraph 152)
Instead of creating new funding mechanisms, it may be equally desirable for donors to examine
existing functions and determine whether existing institutions can perform those functions using
a ―networked‖ approach with each institution fulfilling an institutional responsibility. (Paragraph
154)
Total public resources currently dedicated to climate change mitigation and adaptation in
developing countries are estimated at roughly USD 10 billion per year. Existing climate change
funds have to-date disbursed on average only USD 246 million per year. (Paragraphs 155 &
159)
DCD/DAC(2010)32/REV1
70
As Parties to UNFCCC discuss the additionality question, it will be important to apply and
improve OECD members‘ reporting using the markers for climate change mitigation and
adaptation as rapidly as possible. (Paragraph 136)
Questions for Future Policy Discussion
How might one envisage monitoring ―new and additional‖ funding for climate change?

DCD/DAC(2010)32/REV1
71
5. DEVELOPMENTS IN THE MULTILATERAL SYSTEM IN 2009/10
Introduction
171. Recent challenges, and in particular the global financial and economic crisis have required
multilateral agencies to take centre stage. New policy forums, such as the G20, were created or upgraded in
order to manage and coordinate the crisis response. Reforming multilateral agencies so that they can better
meet the new challenges was a key part of this endeavour. This chapter will review and summarise reforms
that are taking place at the International Monetary Fund, the World Bank and other multilateral bodies with
the focus on the role of multilateral agencies in the context of the global economic crisis, on their delivery
of global public goods and on resource mobilisation efforts for these agencies.
172. This chapter consists of three sections. The first section summarises ongoing reforms at the
Bretton Woods Institutions (BWIs), the UN system, the European Commission and the multilateral
development banks (MDBs). Section 2 describes how multilateral agencies responded to the global
economic crisis. Section 3 covers issues of resource mobilisation and replenishments in 2009-10.
1. Ongoing Reforms
173. All multilateral agencies covered in this report have established specific reform programs to
attain one or more of the following objectives: (i) to become more effective and efficient, applicable to all
agencies; (ii) to ensure greater policy coherence for development, as in the case of EU Institutions; (iii) to
reduce fragmentation, particularly as this affects the UN system; and (iv) to achieve governance and voting
structures better aligned with their memberships, more particularly the challenge faced by the Bretton
Woods Institutions.
April 2010 Development Committee Outcomes
174. The Development Committee communiqué from 25 April 2010 recognised the critical role of
both the support from the IMF (almost USD 175 billion) and from the World Bank Group (over USD 100
billion) since the start of the crisis. On voice and participation, the Development Committee endorsed an
increase in the voting power of developing57
and transition countries in IBRD by 3.13%. When added to
the 1.46% increase under the first phase of adjustment, this brings the developing and transition country
voice to 47.19%.58
This realignment is the basis for the current selective capital increase. The next
shareholding review in 2015 will establish a roadmap for a dynamic formula for lasting realignment of
voting powers.
57
In the World Bank‘s definition which is broader than those used by other international organisations, developing
countries are defined, according to its most recent classification (2008), as those with Gross National Income per
capita below USD 11 905 and thus cover all low- and middle-income countries. 58
World Bank (2010), ―Development Committee Communiqué‖ Washington, D.C., April 25, 2010.

DCD/DAC(2010)32/REV1
72
World Bank Group Reforms
175. As noted above, the World Bank Group (WBG) has been pursuing programmes of external and
internal reforms to enable the institution to become more efficient, effective, and accountable. At the
request of the World Bank President, Mr. Zedillo, the former Mexican President, led a commission to look
beyond the issue of voice and participation, review the institution‘s governance and identify the urgent
needs for modernisation to better equip the WBG to confront future global challenges. The World Bank
Board has not endorsed all of the Zedillo Report recommendations, namely those relating to the Bank‘s
governance and management reports. (see Box 5.1)
Box 5.1: Recommendations of the Zedillo Commission Report
The Zedillo Commission Report recommends core changes in the structure and role of the board and the relationship between the Board and the President. Released in October 2009, the report made five key recommendations to be considered as a bundle in which each element is essential to the other. They propose to:
1. Enhance voice and participation of developing countries with a view toward achieving an even split between developed and developing countries;
2. Restructure the WBG’s governing bodies by raising the political level of the Executive Board and delegating authority over financing operations to Management;
3. Reform the leadership selection process by opening the process to all qualified candidates regardless of their nationality;
4. Strengthen management accountability; and 5. Strengthen the WBG’s resource base and how best to achieve a recapitalisation of institution.
176. The WBG has also taken concrete and significant steps to reform internally. These internal
reforms are articulated around three broad categories:
1. Modernising and enhancing the effectiveness of the Bank’s financial and non-financial
instruments to tailor them to client needs, improve the speed of delivery, and demonstrate results
on the ground;
2. Enhancing service delivery through changes in the way the Bank is organised, including
improvements to the matrix and an enhanced field presence, coupled with a greater devolution of
responsibility and accountability; and
3. Supporting more effective services and better delivery of services through changes in
policies, infrastructure and the incentives system.
177. Under the first category, a risk-based Investment Lending (IL) model is now used to differentiate
projects and their processing requirements based on the risks they present. This allows for simpler
procedures in low-risk settings (and more devolution to the country-level), and enhanced supervision and
implementation support for more complex projects. The Bank‘s new disclosure policy (effective 1st July
2010) will make information on the preparation of lending operations, the formulation of Bank policies and
strategies, and Board proceedings available to the public.
IMF Reforms: For Securing Global Financial Stability
178. The Fund has initiated a process designed to realign members‘ voting power to enhance its
effectiveness and legitimacy. In 2008, the Manuel Committee, named after its chair, Minister Trevor
Manuel of South Africa was asked to address the larger question as to the adequacy of the Fund‘s
institutional framework (Box 5.2). The report, issued in March 2009, came to the conclusion that the lack

DCD/DAC(2010)32/REV1
73
of an explicit mandate to oversee global financial stability in all of its dimensions – financial sector,
domestic macroeconomic policies, and currency arrangements – has reduced the effectiveness of Fund
surveillance. At the same time because of the Fund‘s ability to effectively respond to the crisis, its
popularity grew by the end of 2009, as will be discussed later in this chapter.
Box 5.2: Recommendations of the Manuel Committee’s Report
The Manuel Committee recommended a series of governance reform measures, which should be agreed as a single package:
1. Accelerate the quota revision process; eliminate the practice of appointed chairs to reflect current economic realities; and elevate the Board’s role from operational decisions to giving advice on strategic issues and to supervision and oversight;
2. Expand the Fund’s surveillance mandate by giving it more authority; 3. Lower the voting threshold on critical decisions from 85% to 70–75% and extend double majorities to a
wider range of decisions, thus ensuring that key decisions command the support of the majority of members; and
4. Introduce an open, transparent and merit-based system for the appointment of the Managing Director and Deputy Managing Directors.
In addition to the above, augmenting the Fund’s available financial resources and enhancing its expertise, and role in macroeconomic co-ordination, financial and capital account issues are also required.
UN Reforms: Implementing the ‘Delivering as One’ Initiative
179. The Secretary-General launched the United Nations system's current effort to become more
coherent, effective and relevant in February 2006. ―Delivering as One‖, the genesis of which was described
in detail in last year‘s Multilateral Aid Report, has been implemented on a pilot basis in eight countries. In
addition to ―One UN‖ programmes, the UN is currently focusing on four other areas of the system-wide
coherence process: funding, governance, gender, and the harmonisation of business practices. In December
2009, the UN Secretary General issued a report with proposals and options for broader governance reforms
to improve the effectiveness of the UN Development Group, the main elements of which are summarised
in Box 5.3.
Box 5.3: Proposals for the further improvement of UN system-wide coherence related to operational activities for development
1. Strengthen functional coherence between UN-wide governing bodies, namely the General Assembly, the Economic and Social Council and the Executive Boards of the Funds and Programmes, as well as the governing bodies of the specialised agencies;
2. Strengthen financial reporting on operational activities for development; 3. Create a central repository on operational activities for development; 4. Undertake the independent evaluation of lessons learned from ―Delivering as One‖ programme country
pilots; and 5. Enhance harmonisation of business practices within the United Nations development system.
Source: UN, Report of the Secretary General, Follow-up to General Assembly resolution 63/311 on system-wide coherence related to operational activities for development, December 2009.

DCD/DAC(2010)32/REV1
74
180. A number of important assessments including the Triennial Comprehensive Policy Review
(TCPR) and the stocktaking of the eight country-based ―One UN‖ programmes have identified some
important funding issues:59
The fragmented nature of the funding architecture of UN operational activities for development;
High transaction cost is undermining the effectiveness of UN development co-operation at
country-level. The growth in single-donor non-core funding is an important factor in increasing
transaction cost for UN agencies
The rapidly declining share of core resources – less than 30% of overall contributions in recent
years – encourages supply-driven approaches and undermines the principle of country leadership
and ownership;
Introduction of multi-year funding frameworks and strategic plans has advanced the
predictability of funding to some UN entities, helped to define results indicators, reduced
transaction cost, and helped focus activities on high-priority areas.
181. Evidence from the eight pilot countries evaluation indicates that partner country governments are
exercising increased national leadership over UN programmes and taking a stronger role in steering UN
agencies to support national development priorities. The exercise has already helped to align UN
programmes and funding more closely to national priorities. The Multi-Donor Trust Fund approach to
funding One UN programmes has proven to be attractive for donors thanks to cost efficiency through ―one-
stop shop‖ joint agreement with all UN agencies and streamlined process. It has also given the UN
agencies incentives to co-ordinate, plan and implement together. Many challenges remain. Foremost is the
difficulty in raising predictable resources since donors are still financing UN agencies and projects directly.
Reforms of the Multilateral Development Banks (MDBs)
182. To scale up the effectiveness of the institution and the development impact of its operations, the
African Development Bank (AfDB) has pushed for reform in four key areas:
i. Human resources management,
ii. Operational business processes,
iii. Decentralisation and operationalisation of its field offices (FOs), and
iv. Budget reforms.
183. The most recent budget framework helps to ensure that resource allocations are in line with the
Medium Term Strategy (2008-2012) and also reinforces Management‘s accountability for delivery and
results, by linking program deliverables to Key Performance Indicators (KPIs). The Bank continued its
activities in the area of knowledge management and development, which the Medium-Term Strategy
identified as a key complement to its lending activities. To this end, the Bank approved the Knowledge
Management and Development Strategy (KMDS) in July 2008 to promote synergies between operations
and knowledge management with the overarching goal of consolidating the Bank‘s role as a premier
knowledge institution for Africa, and a leading change agent for sustainable socioeconomic development.
184. The Asian Development Bank‘s (AsDB) Strategy 2020 recognised five core specialisations that
reflect its comparative strengths and its clients‘ needs: (i) infrastructure; (ii) environment, including
climate change; (iii) regional co-operation and integration; (iv) financial sector development; and (v)
education. In translating its results framework into operational terms, the AsDB set out to monitor
59
United Nations Secretariat, ―Strengthening the system-wide funding architecture of operational activities of the
United Nations for development‖. New York, 3 May 2009

DCD/DAC(2010)32/REV1
75
outcomes at the regional and country-levels, operational effectiveness and development effectiveness
(including by measuring efficient use of internal resources and by implementing reforms). The 2008
Development Effectiveness Review suggested that the AsDB is improving its overall development
effectiveness, and that the majority of performance indicators are on track to meet targets. AsDB is
implementing a number of time-bound remedial actions to strengthen project performance reporting,
knowledge creation and sharing, co-financing, gender mainstreaming through operations, and gender
equality within the organisation.
IMF and World Bank Collaboration
185. More consistent collaboration between the World Bank and International Monetary Fund was in
large part prompted by the rapid succession of global crises beginning in 2008. The 2007 external review
of Bank-Fund collaboration (the ―Malan Report‖) led to a Joint Management Action Plan (JMAP) to
further enhance the way the two institutions work together based on existing ―good-practice approaches.‖
186. The March 2010 review of the JMAP suggests that it has played a supporting, rather than central
role in this closer collaboration and future focus should include:
providing incentives for joint country-team consultations;
making greater use of cross-institutional feedback in assessing performance;
strengthening staff mobility between the institutions;
enhancing clarity on information sharing; and
improving awareness of organisational structures.
187. The recent crisis showed how important it is for both institutions to collaborate closely in
providing financial assistance and policy advice. For example, both the Fund and the World Bank give
advice on fiscal issues, but their roles in supporting partner countries are determined by their respective
mandates: the Fund focuses on the aggregate fiscal policy stance consistent with overall macroeconomic
stability, as well as providing technical assistance to strengthen the overall fiscal position; and the Bank
advises on the composition and effectiveness of spending.
188. In August 2009, the IMF approved new guidelines on debt limits. Debt limits seek to prevent the
build-up of unsustainable debts, while allowing for adequate external financing. The new framework,
which became effective in December 2009 (IMF) and April 2010 (World Bank), moves away from a single
design for debt limits (or, to use the usual terminology, concessionality requirements) towards a menu of
options. This menu approach takes better account of the diversity of situations faced by low-income
countries (LICs) with regard to their debt vulnerabilities—as informed by debt sustainability analyses
(DSAs) under the low-income country debt sustainability framework (DSF)—and their ―capacity‖ (both
macroeconomic and public financial management capacity).60
189. Under the new framework, a country with relatively high debt vulnerabilities should adopt tighter
concessionality requirements. Conversely, if debt vulnerabilities are relatively low, looser requirements
can be considered. Similarly, the higher a country‘s management capacity, the better a country will be able
to implement and benefit from more flexible but also more technically demanding approaches to
concessionality requirements. Each of the two factors, namely debt vulnerabilities and capacity, can
therefore take two values, ―lower‖ or ―higher‖. Thus, this framework results in four different types of
concessionality requirements (Figure 5.1). Unless debt sustainability is a serious concern (―higher‖ value)
and capacity is limited (―lower‖ value), the applicable concessionality requirements normally allow for
60
IMF 2009, Debt limits, page 7.
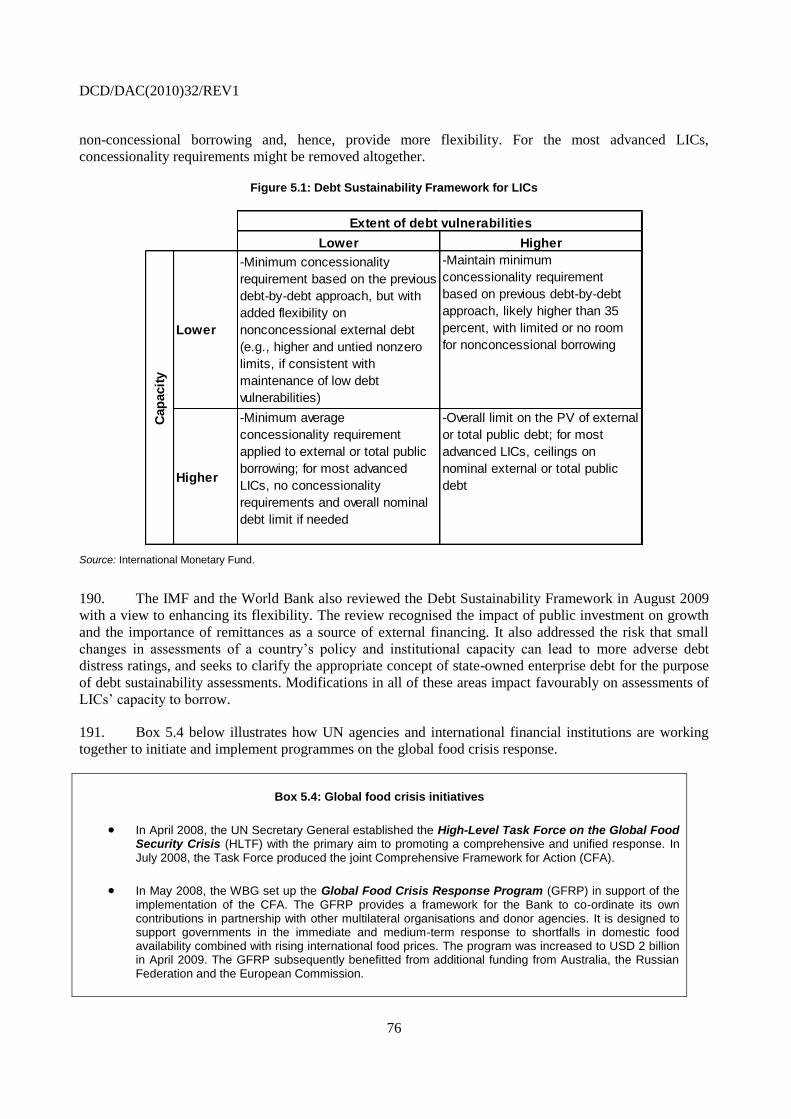
DCD/DAC(2010)32/REV1
76
non-concessional borrowing and, hence, provide more flexibility. For the most advanced LICs,
concessionality requirements might be removed altogether.
Figure 5.1: Debt Sustainability Framework for LICs
Lower Higher
Lower
-Minimum concessionality
requirement based on the previous
debt-by-debt approach, but with
added flexibility on
nonconcessional external debt
(e.g., higher and untied nonzero
limits, if consistent with
maintenance of low debt
vulnerabilities)
-Maintain minimum
concessionality requirement
based on previous debt-by-debt
approach, likely higher than 35
percent, with limited or no room
for nonconcessional borrowing
Higher
-Minimum average
concessionality requirement
applied to external or total public
borrowing; for most advanced
LICs, no concessionality
requirements and overall nominal
debt limit if needed
-Overall limit on the PV of external
or total public debt; for most
advanced LICs, ceilings on
nominal external or total public
debt
Extent of debt vulnerabilities
Cap
acit
y
Source: International Monetary Fund.
190. The IMF and the World Bank also reviewed the Debt Sustainability Framework in August 2009
with a view to enhancing its flexibility. The review recognised the impact of public investment on growth
and the importance of remittances as a source of external financing. It also addressed the risk that small
changes in assessments of a country‘s policy and institutional capacity can lead to more adverse debt
distress ratings, and seeks to clarify the appropriate concept of state-owned enterprise debt for the purpose
of debt sustainability assessments. Modifications in all of these areas impact favourably on assessments of
LICs‘ capacity to borrow.
191. Box 5.4 below illustrates how UN agencies and international financial institutions are working
together to initiate and implement programmes on the global food crisis response.
Box 5.4: Global food crisis initiatives
In April 2008, the UN Secretary General established the High-Level Task Force on the Global Food Security Crisis (HLTF) with the primary aim to promoting a comprehensive and unified response. In July 2008, the Task Force produced the joint Comprehensive Framework for Action (CFA).
In May 2008, the WBG set up the Global Food Crisis Response Program (GFRP) in support of the implementation of the CFA. The GFRP provides a framework for the Bank to co-ordinate its own contributions in partnership with other multilateral organisations and donor agencies. It is designed to support governments in the immediate and medium-term response to shortfalls in domestic food availability combined with rising international food prices. The program was increased to USD 2 billion in April 2009. The GFRP subsequently benefitted from additional funding from Australia, the Russian Federation and the European Commission.

DCD/DAC(2010)32/REV1
77
Responding to a request from the G20 Summit, the World Bank set up the Global Agriculture and Food Security Program (GAFSP) in January 2010. The GAFSP is a multilateral trust fund designed
to operationalise the commitments to agriculture and food security in poor countries made by the G8 at L’ Aquila in July 2009. There, donors pledged to contribute USD 22 billion to an Agricultural and Food Security Initiative (AFSI).
Two windows will be created under the GAFSP to hold targeted donor contributions. The public sector window will be available for Supervising Entities including the World Bank, other MDBs, IFAD, FAO, and WFP which will manage projects and disburse funds. The private sector window will be managed by IFC.
Funding under this program is eligible to IDA countries and, where warranted, to IDA blend countries. The GAFSP Trust Fund, expected to reach USD 1 to 1.5 billion, has been agreed to by Canada, Spain and the United States with additional contributions expected from other donors.
2. How Have Multilateral Agencies Responded to the Global Economic Crisis?
192. The World Bank, regional development banks and the EU all moved rapidly to offer crisis-
related finance from within existing concessional envelopes. The IMF implemented G20 calls to issue new
Special Drawing Rights (SDRs), and it overhauled its concessional lending framework, also scaling up its
concessional finance. Multilateral agencies were able to respond quickly and flexibly due to the resources
entrusted to them by member states.
IMF
193. The London G20 Summit agreed to support a package of measures to increase the crisis response
role of the IMF described in Box 5.5, all of which will require agreement under the IMF‘s governance
procedures.
Box 5.5: The IMF’s Response to the Crisis
Scaling up financial assistance
Since September 2008, the IMF has provided more than USD 170 billion in new lending
commitments. Concessional lending commitments tripled in 2009, to USD 3.8 billion.
The IMF’s lending capacity was also substantially increased: contributions from several IMF
member countries boosted loan resources initially by USD 250 billion, followed by agreement to a USD 500 billion expansion under a renewed and expanded New Arrangements to Borrow, or NAB
61. The
IMF’s concessional lending capacity was doubled to USD 17 billion through 2014, including up to USD 8 billion in 2009-10. This will require additional subsidy resources of USD 2.8 billion to bridge the gap between market interest rates and lower concessional rates charged to LIC borrowers, part of which will come from the sales of IMF gold.
Following a call by the G20 Heads of State and the IMFC in April 2009, in August-September 2009 the IMF implemented new allocations of SDRs equivalent to USD 283 billion, of which about USD 18
billion went to low-income countries. This was meant to help liquidity-constrained countries address
the fallout from the global crisis by limiting the need for adjustment through contradictory policies in the face of deflation risks.
Interest relief, with zero payments on outstanding IMF concessional loans through end-2011 to help
61
Quota subscriptions from member countries are the IMF‘s main source of financing, but it can supplement its
resources through borrowing if current resources might fall short of member countries‘ financing needs. The
IMF currently has in place a number of bilateral loan and note purchase agreements, and it has two standing
borrowing arrangements, the General Arrangements to Borrow (GAB) and the New Arrangements to Borrow
(NAB).

DCD/DAC(2010)32/REV1
78
LICs cope with the crisis. Thereafter, it expects to implement permanently higher concessionality of Fund financial support.
More flexible lending instruments
A new form of financial support – the flexible credit line – was introduced for strong-performing
economies, providing a high level of upfront access to IMF resources, with no ongoing policy conditions.
To make its financial support more flexible and tailored to the diversity of low-income countries, a new Poverty Reduction and Growth Trust (PRGT) was established with three new lending windows:
1. The Extended Credit Facility (ECF) replaces the Poverty Reduction and Growth Facility (PRGF) and is the Fund’s main tool for providing support to LICs with protracted balance of payment problems. It allows higher levels of access, more concessional financing terms, more flexible programme design features, as well as a streamlined and more focused conditionality.
2. The Standby Credit Facility (SCF) replaces the Exogenous Shocks Facility’s (ESF) high access component for countries that face short-term balance of payments problems from time to time, allows for higher access, and can also be used on a precautionary basis to provide insurance; and
3. The Rapid Credit Facility (RCF) provides rapid financial assistance to LICs facing an urgent balance of payments need without the need for programme-based conditionality.
Recent reforms abolished ―hard‖ structural conditionality in all IMF-supported programmes, putting a greater focus on objectives rather than specific actions and deadlines.
Together with a review of the flexibility of the Debt Sustainability Framework (DSF) described in
more detail in Figure 5.1, debt limits applied under Fund programmes have been made more flexible (relating them systematically to countries’ DSAs and debt management capacity). This could create more flexibility for the strongest LICs to borrow at lower level of concessionality while pursuing sound macroeconomic policies.
World Bank Group
194. The WBG designed a number of initiatives to mobilise more resources, both public and private
to protect the poorest and stimulate private sector activities. These are explained in more detailed in Box
5.6. Among these, a total of USD 20.7 billion was provided for infrastructure, a sector critical for rapid
recovery and job creation. Similarly overall agricultural lending by the WBG will increase to USD 12
billion over the next two years, up from USD 4 billion in 2008. This is critical not least because the World
Bank‘s earlier scaling-back of engagement (both financial and policy) in infrastructure and agriculture in
the 1990s62
is widely considered to have been short-sighted. Investments in safety nets and other social
protection programs in health and education are also projected to reach USD 12 billion over next two
years.63
Box 5.6: The World Bank Group’s Response to the Crisis
Scaling up financial assistance
Overall, the World Bank Group's new commitments increased by 54% in fiscal year (FY) 09 over the previous year to reach a record high of USD 60 billion.
IBRD’s lending almost tripled to USD 32.9 billion—a new record—from USD 13.5 billion in 2008. In
2010, IBRD lending is projected to exceed USD 40 billion. The IBRD is developing an approach to
62
World Bank (2007), ―World Bank Assistance to Agriculture in Sub-Saharan Africa – An IEG Review.‖
Washington, D.C., The World Bank. 63
These amounts for agriculture and safety nets are IDA or IBRD loans (the Bank‘s regular resources), and do not
include trust fund disbursements.

DCD/DAC(2010)32/REV1
79
expand the use of its resources for specific projects in IDA countries based on the IBRD Enclave Framework for loans and/or partial risk guarantees.
IDA commitments hit a record level of USD 14 billion in FY09, 25% higher than a year earlier, and
further increased to USD 14.5 billion in FY10. IDA disbursements were also significant at USD 9.2 billion in FY09 and USD 11.5 billion in FY10.
Up to USD 2 billion of IDA15 resources will be provided under the IDA Fast-Track Facility, which has
accelerated processing and approval procedures, and provides for a greater degree of front-loading of IDA resources (up to 50% of country allocations). As of March 2010, USD 1.5 billion had been committed.
Targeted initiatives
The Global Food Crisis Response Program (GFRP) with commitments of USD 1.2 billion, and
disbursements of USD 870 million in over 30 countries in FY09 described in Box 5.4.
The Rapid Social Response (RSR) designed to support safety nets and other social protection
programs totalling USD 4.3 billion in FY09 funded primarily from IBRD and IDA resources and contributions to a multi-donor trust fund.
The Infrastructure Recovery and Assets Platform (INFRA), a multi-donor, co-ordinated effort to
help developing countries invest in their infrastructure sectors as economic drivers in the face of the current global crisis.
Supporting private sector activities
Co financing innovations by the IBRD64
, and the expanded use of guarantees, insurance instruments and risk management products by both the IBRD and MIGA support private sector
activities.
The IFC committed USD 7 billion in financing through targeted initiatives in FY09. This in turn mobilised an additional USD 11 billion of funding from partners under IFC management or parallel arrangements:
On trade, the IFC expanded its Global Trade Finance Program to USD 3 billion in trade guarantees and launched the Global Trade Liquidity Program (GTLP), which has already supported USD 3 billion in trade to-date, benefitting mostly African countries.
On infrastructure, the IFC launched the Infrastructure Crisis Facility (ICF) to help viable, privately funded or PPP projects that face financial distress as a result of the crisis.
On microfinance, the IFC launched the Microfinance Enhancement Facility (MEF) to help microfinance institutions primarily with debt financing.
On bank capitalisation, the IFC Capitalisation Fund (USD 3 billion in debt and equity) is designed to strengthen the capital base of banks in emerging markets.
IDA Crisis Response Window
195. At the IDA15 Mid-Term Review that took place in late November, IDA deputies endorsed the
creation of a dedicated Pilot Crisis Response Window (CRW) in IDA to provide additional funding for
the protection of core spending. The Pilot CRW, established for the remaining half of IDA15 (January
2010-June 2011), will help protect core spending on health, education, social safety nets, infrastructure,
and agriculture. The USD 1.6 billion IDA15 CRW will be funded through a redeployment of internal IDA
resources and new voluntary donor contributions. CRW country allocations are designed to complement
IDA‘s performance-based system (PBA), and provide additional financial support to those non-oil
exporting IDA-only countries with the greatest crisis related financing needs, and the least capacity to raise
financing from other sources.
64
An IBRD USD 2 billion loan with deferred drawdown option together with standby commitments from Asian
Development Bank (ADB), Japan and Australia has allowed Indonesia to raise USD 12 billion of private funds
in 2009 under difficult market conditions.

DCD/DAC(2010)32/REV1
80
196. IDA deputies endorsed moving forward with the preparation of a proposal for a permanent
CRW to respond to ―exceptional‖ crises caused by exogenous shocks. This was further detailed at the
Second IDA16 Replenishment meeting that took place in Bamako in June 2010. The permanent CRW
would respond to major natural disasters or to severe economic crises. Participants recognised that the
CRW would need to combine a rules-based approach with informed judgment given difficulties with
predicting crises, and requested further work on the criteria for economic crisis, including coordination
with the IMF, triggers, and country eligibility. Participants agreed that the CRW be capped at 5% of the
total IDA16 replenishment resources, but expressed a range of views on the mix of ex-ante and ex-post
financing.65
Regional Development Banks
197. The AfDB took steps to accelerate resource transfers to its member countries by frontloading its
allocations and speeding up disbursements and by restructuring portfolios. In addition, the AfDB Group
adopted the "Bank‘s Response to the Economic Impact of the Financial Crisis‖ in March 2009. This
comprises: (i) a USD 1.5 billion Emergency Liquidity Facility; and (ii) a USD 1 billion Trade Finance
Initiative consisting of two phases. The first phase supports trade finance by African banks and the second
phase is a contribution to the IFC-led Global Trade Facility Programme again for African trade finance.
The 2009 Joint Action Plan to support Africa‘s financial systems and lending to the private sector (small
and medium enterprises and infrastructure) was agreed by eight international financial institutions,
including the AfDB Group and the WBG. This initiative is expected to increase their commitment by at
least USD 15 billion over the next 2-3 years.
198. The AsDB crisis-related assistance, framed under its long-term strategic framework 2008-2020 is
expected to increase by more than USD 10 billion in 2009-2010, bringing total AsDB assistance for these
two years to around USD 32 billion66
compared to about USD 22 billion in 2007-2008 (including project
investments, quick disbursing policy-based loans, guarantees, and new initiatives designed to address
specific crisis needs). The increase in lending comprises loans for trade finance, countercyclical support for
fiscal spending, and for infrastructure investment. AsDB will also expand its crisis-related support through
grants for policy analysis and capacity building. Given severe resource constraints faced by low-income
countries, the AsDB approved an additional liquidity of USD 400 million to AsDF-only countries. AsDF
borrowers are also allowed to front-load their entire 2009-2010 biennial allocation. The AsDB is working
closely with the ASEAN Secretariat to establish a credit guarantee and investment mechanism as a trust
fund to provide its members access to the Asian bond market for additional funding.
199. To boost lending in the short-term, the Inter-American Development Bank (IDB) eliminated
ceilings on its policy-based lending authority. Approvals programmed for later years were brought
forward. In October 2008, the IDB created a fast-disbursing USD 6 billion emergency facility to support
commercial lending. The funds are provided to governments, which in turn make the funds available to
commercial banks. These financial institutions can then use the resources to finance lending to companies.
The Bank's Trade Finance Facilitation Program (TFFP) increased its funds to USD 1 billion from USD
400 million and the credit line now supports non-dollar denominated trade finance transactions. The IDB
increased approvals of loans, credit guarantees and grants by 77% in the first nine months of 2009 to USD
9.6 billion compared to the same period a year earlier. The increased lending has been accompanied by
record disbursements. In the first nine months of 2009, the IDB disbursed USD 6.5 billion to the region,
63% more than in the same period last year.
65
World Bank (2010), ―Chairperson‘s Summary: IDA Deputies‘ Meeting, Bamako, Mali, June 16-19, 2010.‖
66 Asian Development Bank (2009), ―The Global Economic Crisis: Challenges for Developing Asia and ADB‘s
Response.‖ http://www.adb.org/Documents/Reports/Economic-Crisis/Global-Economic-Crisis-042709.pdf
DCD/DAC(2010)32/REV1
81
European Commission
200. The European Commission is frontloading EUR 3 billion, or 72% of its foreseen budget support
to African, Pacific and Caribbean (ACP) nations to protect social spending. The Commission set up an ad-
hoc mechanism, the "EU Vulnerability FLEX" (V-FLEX) instrument in August 2009 to assist ACP
countries in response to the economic crisis, up to EUR 500 million. The Commission approved the first
package of financing decisions for a total of EUR 215 million in December 2009. V-Flex works pre-
emptively based on forecasts of fiscal losses and other economic and social vulnerability criteria to ease the
impact of the crisis. For this first tranche, all amounts are paid in form of budget support, to enable partner
countries to maintain their level of public spending in priority areas, including in the social sectors, without
jeopardising their macroeconomic stability. Most of these funds are expected to be disbursed rapidly and
act as a complement to assistance of World Bank, International Monetary Fund and other regional
development banks.
201. In addition to V-FLEX, the European Commission reinforced and reshaped the EU-Africa
Infrastructure Trust Fund, increasing the grant capital together with bilateral funds from EU Member
States to a total of EUR 500 million by 2010. This will allow it to mobilise an additional EUR 2.5 billion in
loans.
Lessons of the Crisis for the International Financial Institutions and Regional Development Banks
202. Multilateral institutions have drawn many lessons from the recent crisis. The Fund (IMF) has
undertaken extensive deliberations on macroeconomic67
and financial policies and regulations, along the
lines of the Manuel Report‘s recommendations. First, surveillance must be sharpened to focus on systemic
risks and spillover effects, including those risks related to macro-financial issues. Second, in order to
restore confidence, lending for crisis response must provide members with access to large and upfront
disbursements, using instruments tailored to the strength of countries‘ policies. And, third, the IMF must
continue to study and assess the credibility and feasibility of various policy options to promote the long-
term stability and proper functioning of the international monetary system.
203. In the months ahead, the Fund will consider various ideas to further strengthen its crisis
prevention toolkit. This will include making improvements to existing instruments, creating a new
precautionary credit line to serve a broader group of members, and a new multi-country swap/credit line.
Work in this area includes understanding the origins and behaviour of capital flows and developing a
toolkit to manage volatility as well as work related to the supply of reserve assets.
204. While more time will necessarily be needed to draw up a comprehensive list of lessons from the
global economic crisis, the WBG has identified areas where action and rethinking are needed. First, there
is a need for broader reforms to improve financial system stability and soundness (relying on a broader and
more representative Financial Stability Board and an expanded IMF role). Second there is recognition of
the importance of safety nets as effective policy responses. Third, there is a need to reassess the role of
government. And, fourth, the approach of a broad range of policy issues ranging from public-private
partnerships, to exchange rate regimes and the degree of capital account openness needs to be
reconsidered.
67
Most noteworthy are recent reflections by IMF staff about the need to rethink macroeconomic policy including
combining monetary policy and regulatory tools and the desirability of a higher inflation target—around 4%
compared to 2%, which has been the norm adopted by central banks in developed economies—to give more
room to expansionary monetary policy through lower interest rates. With inflation at 2%, the margin for nominal
interest reductions is limited. Another stream of work at the IMF concerns capital account liberalisation.

DCD/DAC(2010)32/REV1
82
205. On the basis of its global and cross-sectoral presence and knowledge, finance, leadership in
global public goods and catalytic and convening abilities, the WBG sees its comparative advantage in the
post-crisis era shaped by five interrelated priorities:
1. target the poor and the vulnerable with a focus on the ―bottom billion‖ of Africa and South
Asia, expanding the provision of basis needs and targeted social safety nets;
2. create opportunities for growth centring on agriculture and food security, infrastructure,
investment climate and private sector involvement, including engaging in critical public finance
issues such as effective use of public resources and public financial management;
3. provide appropriate knowledge and policy expertise to developing countries;
4. support the global public goods agenda – pressing global challenges such as climate change, and
communicable diseases; and
5. strengthen governance and fight corruption both at the country and global/regional levels.
3. Resource Mobilisation: Capital Increase and Replenishments
206. The year 2010 requires donors to make simultaneous decisions on the replenishment and
recapitalisation of major concessional funds and multilateral development banks. Donors are increasingly
looking for innovative ways to provide predictable funding to funds, even under budget constraints. One
such example is highlighted in Box 5.7.
207. The year 2010 calls for the recapitalisation, or general capital increase of the Inter-American
Development Bank, the IBRD, and the African Development Bank. While the loans they leverage do not
count as ODA, shareholder contributions to their equity do. The DAC share of the costs will vary
depending on the relevant shareholder bases indicated in the coefficient column of the table below. Based
on published estimates of equity shortfalls 5-6 years out, and straight-line reconstitution, general capital
increases alone could produce additional ODA annual claims for DAC donors‘ paid-in capital of about
USD 879 million a year from 2014 (depending on the adjusted IBRD shareholder formula).
208. Concurrent decisions on the replenishment of all major concessional funds are taking place in
2010. To indicate the order of magnitude, previous replenishments were: IDA (USD 42 billion over 3
years); the AfDF (USD 8.9 billion over 3 years); GEF (USD 4.2 billion over 4 years); and the Global Fund
(USD 9.7 billion over 3 years). Obviously real needs and inflation are generally increasing and absorption
capacity is also rising, so these may be considered floor estimates. Table 5.1 indicates estimated minimum
calls on DAC members for recapitalisation and replenishments over the next nine years.
Table 5.1: DAC share of calls for Recapitalisation and Replenishment
(in USD millions)DAC
coefficient2010 2011 2012 2013 2014 2015 2016 2017 2018
General capital increases - 465 465 465 879 879 414 414 414
IBRD - GCI * 59% - - - - 414 414 414 414 414
IDB - 9th GCI 50% 169 169 169 169 169 - - -
AfDB - 6th GCI 37% 296 296 296 296 296
Replenishments 3,916 6,764 17,660 14,679 10,896 - - - -
IDA-16 78% - - 10,896 10,896 10,896 - - - -
AfDF-12 96% - 2,848 2,848 2,848 - - - - -
Global Fund 92% 2,982 2,982 2,982 - - - - - -
GEF-5 89% 935 935 935 935 - - - - -
Total 3,916 7,229 18,125 15,144 11,775 879 414 414 414
Source: Secretariat estimates based on World Bank, Global Fund, Inter-American Development Bank, GEF share of subscriptions and replenishment documents. * Based on the current shareholder formula for the general capital increase. Note: Amounts have been adjusted to reflect the DAC share.
DCD/DAC(2010)32/REV1
83
209. Further information on each of these general capital increases and replenishments can be found in
Annex 4 of this report.
Box 5.7: DFID Core Funding to the GAVI Alliance: Long-Term Funding Mechanism
Analysis commissioned by GAVI68
suggests that predictable funding could increase immunisation outcomes by at least 10%, compared to the same amount of funds provided on a non-predictable basis. If all GAVI donors provided long-term funding, this could potentially result in an additional 230,000 lives saved from 2009 to 2015 (if GAVI spends the forecast total of USD 8.1bn over this period).
The UK’s Department for International Development will provide predictable funding to GAVI through a 10 year pledge formulated with a rolling three year ahead binding element. Within the overall 10 year framework, they will issue a series of binding Promissory Notes. In the first year DFID will issue a promissory note for the first three years. Each subsequent year (from year 2) they will extend the Promissory Note commitments so that these always cover the next 3 years ahead. In this way, the overall funding pledge would gradually become a binding commitment. The decision to issue each Promissory Note would be subject to GAVI demonstrating performance against a mutually agreed long term results based framework linked to GAVI’s Key Performance Indicators and Business Plan.
The objective of DFID’s support is to provide a long term commitment using a mechanism that (i) provides GAVI increased confidence to plan long term funding (up to 10 years) to countries; and (ii) enables GAVI to make binding commitments to countries up to 3 years ahead on the strength of our commitment (and without having to hold a cash balance to cover the obligation).
Source: The United Kingdom’s Department for International Development (DFID)
Main Findings
The World Bank and the IMF are moving forward with reforms towards a more representative
governance structure. Internal reforms also aim to provide more flexible and more adapted
instruments for their clients. (Paragraphs 175-178)
The year 2010 requires donors to make simultaneous decisions on the replenishment and
recapitalisation of major concessional funds and multilateral development banks. (Paragraph
206)
68
McElligot, Sean (2009), ―Health Impact Predictable Long-Term Funding: Study‖ University of Pennsylvania,
May 2009

DCD/DAC(2010)32/REV1
84
6. MULTILATERAL STRATEGIES AND EVALUATION IN 2009-2010
210. More than half of DAC members now have a multilateral aid strategy, though they differ in
nature and scope. Some are broad political statements to guide multilateral aid allocation; others define
specific priorities and implementation processes. No country has a fixed allocation formula across its entire
multilateral portfolio. Countries often also have separate partnership agreements with their most important
multilateral partners. In determining multilateral allocations, the effectiveness of multilateral institutions is
one of the key considerations. The second section looks at current multilateral evaluation processes in this
context.
1. DAC Members’ Multilateral Strategies
211. As described in detail for each country last year, multilateral aid allocations are typically made in
parallel by two (or sometimes more) different ministries. Ministries of Finance tend to lead on policy
dialogue and contributions to the international financial institutions, while the Ministries of Foreign Affairs
decide on contributions to UN agencies and regional organisations. Aid allocations to EU institutions may
also be decided by the Ministry of Foreign Affairs, but not necessarily the same department responsible for
UN allocations. Allocation decisions appear to be made in a decentralised manner, often independently
from other allocation decisions within the same government. This makes the discussion on division of
labour among and between bilateral and multilateral donors all the more difficult. For each Peer Review,
the DAC Secretariat routinely consults with nine multilateral aid agencies in order to get a clearer
understanding of each Member‘s contributions to, and engagement with, these agencies. In an attempt to
create a co-ordinated allocation process, many countries have established an overall ―multilateral strategy.‖
Last year‘s report highlighted Sweden and Switzerland as examples of countries with new multilateral
strategies. Belgium, Portugal, Finland, and the Netherlands have recently adopted new multilateral
strategies.
Belgium
212. In November 2008, the Minister of Development Co-operation announced a new multilateral
strategy to concentrate its multilateral aid, avoid the creation of new funds and increase the share of its
core, as opposed to non-core (earmarked) aid. In 2008, Belgium concentrated and limited its multilateral
aid to 21 multilateral entities.69
Beginning in 2009, earmarked aid to multilateral agencies funded by the
Directorate General for Development Co-operation (the DGDC is responsible for 55-65% of Belgium‘s
ODA) was converted to core funding. Belgian officials now expect to devote more time and effort to
policy dialogue at the Executive Body level. In this way, the Government anticipates extending strong
support to results based management and reporting, as well as for the strengthening of monitoring and
evaluation functions within the organisations they fund. Article 23 of the new draft law on development
co-operation submitted to Parliament in April 2010 states that voluntary multilateral contributions are
directed to the core, un-earmarked budget of partner organisations, with the exception of eventual
69
UNDP, UNFPA, UNHCR, UNESCO, UNICEF, UNCDF, UNEP, OHCHR, OCHA, UNRWA, UNAIDS, FAO,
WHO, ILO, the World Bank, CGIAR, IOM, ICRC, the Global Fund, WFP.
DCD/DAC(2010)32/REV1
85
delegated co-operation.70
Belgium became a formal member of the Multilateral Organisation Performance
Assessment Network (MOPAN) in February 2010.
Portugal
213. The Government of Portugal adopted the Estratégia Portugesa de Cooperação Multilateral in
2009. The strategy identifies three guiding principles for allocating multilateral support: (1) MDGs and aid
effectiveness; (2) co-ordination, coherence and complementarity; and (3) policy coherence for
development. It aims to strengthen Portugal‘s capacity to influence multilateral organisations‘ policies by
promoting increased coherence between the different actors in the Portuguese administration responsible
for multilateral co-operation (Portuguese Institute for Development Assistance – IPAD, Ministry of
Foreign Affairs, the Ministry of Finance and Public Administration, Portuguese embassies and diplomatic
missions, and line ministries) as well as between multilateral and bilateral co-operation. The strategy
recommends maintaining the overall ratio between bilateral and multilateral ODA, but it recognises the
importance of multilateral ODA as an instrument to: (i) leverage total Portuguese ODA, including ODA
allocated to programmes and projects following a bi-multi approach;(ii) increase Portuguese ODA
predictability; and (iii) finance Global Public Goods.
Finland
214. Finland‘s policy for multilateral development co-operation focuses on the eradication of poverty
and achievement of the MDGs. It considers the United Nations as its leading multilateral partner in
achieving these. The guiding principles of multilateral co-operation include coherence, complementarity,
and effectiveness. In terms of coherence, Finland supports the UN reform process and stresses the
decentralisation of operations and decision-making to the country-level. Complementarity between
bilateral, multilateral and EU co-operation is emphasised. Thematic and regional priorities are determined
based on the development needs of the particular region / country and the mandate of the multilateral
organisation through which they choose to implement these priorities. The Nordic group of countries forms
an important reference group for multilateral co-operation, and Finland uses its influence in governing
bodies to promote the effective use of its multilateral aid. Cross-cutting themes across bilateral and
multilateral co-operation include the rights of women and girls, strengthening the rights of marginalised
and vulnerable groups, and combating HIV/AIDS.71
Netherlands
215. The Dutch Minister for Development Co-operation presented the Multilateral Strategy to
Parliament in April 2009. Four priorities for multilateral engagement include (1) growth and equity; (2)
fragile states; (3) gender and sexual and reproductive health rights; and (4) climate change and renewable
energy. The Government will step up its multilateral engagement, both in terms of funding and policy
dialogue for four reasons. First, meeting the MDGs and safeguarding global public goods can only be
realised through effective international co-operation. Second, increased fragmentation of aid programmes
means governments have incurred higher transaction costs, and co-ordinating more closely can at least
alleviate some of these costs. Third, due to their specialisation and legitimacy, multilateral organisations
can address some issues, such as e.g. setting standards and regulations, advising countries on reproductive
health policies, and macroeconomic policy more easily than some bilateral agencies. Finally, the
Netherlands sees multilateral ODA as a means to influence the multilateral system as a whole. The most
relevant and best performing institutions will be rewarded more systematically than before with additional
ODA contributions and less earmarking.
70
Belgian Foreign Ministry (2009), ―Multilateral Aid Policy, Going for Full Core‖, PowerPoint presentation and
2010 DAC Belgian Peer Review. 71
Ministry for Foreign Affairs (2009), ―Multilateral Co-operation in Finland‘s Development Policy‖, Helsinki.

DCD/DAC(2010)32/REV1
86
Spain
216. Spain‘s Multilateral Strategy has two objectives: (1) the eradication of poverty, and (2) the
achievement of MDGs. In order to implement its Strategy, Spain identified the United Nations as one of
the most important channels for multilateral cooperation. For this reason, Spain is actively involved in the
UN System Wide Coherence process and is a strong proponent of the ―Delivering as One‖ initiative. Since
2006, when Spain started increasing its multilateral ODA, the goals of Spanish multilateral cooperation
have become more ambitious. These include focusing on aid and development effectiveness, increasing
multilateral commitments selectively, promoting policy coherence and playing a more active role in
international forums. To focus and improve the quality of relations between Spain and the multilateral
organisations to which it belongs, the Ministry of Foreign Affairs and Cooperation has signed Strategic
Framework Agreements. These Strategic Agreements consider aid effectiveness principles such as
predictability of funding, mutual accountability and the further alignment Spain‘s cooperation priorities
with the organisations it funds. In 2009, two Strategic Agreements were signed with UNDP and UNICEF.
Two more agreements will be signed in 2010 with UNFPA and UNIFEM.
217. During 2008 and 2009, the UK developed Institutional Strategies that link the release of
voluntary core funding to some UN agencies with the achievement of targets contained in Performance
Frameworks. This is described in further detail in Box 6.1.
Box 6.1: Performance Funding in the UN: the UK's Approach
The United Kingdom has developed Institutional Strategies including Performance Frameworks with some UN agencies to link performance to the UK’s voluntary core funding. First, a ―baseline core‖ is allocated based on overall performance, followed by a ―bonus core‖ for progress made against a sub-set of high priority targets. For example, in 2009, the UK’s Department for International Development (DFID) provided UNDP, UNFPA, WHO and UNAIDS with GBP 104 million of un-earmarked core funding that was released following satisfactory progress against the Performance Framework targets. Of this, GBP 6.5 million was bonus un-earmarked core funding awarded for progress against targets for UN reform and improved delivery. In this way, UK core funding is contingent on agency performance, improving direct accountability to the UK tax payer. In some cases where agencies’ own targets are not sufficiently robust to be included in the Performance Frameworks DFID has developed new targets in collaboration with the agencies.
Source: The UK’s Department for International Development.
2. Evaluation of multilateral organisations
218. Given that DAC members cite many positive reasons for increased multilateral engagement, the
reality of a flat, if not eroding, multilateral share of ODA does not seem attuned to this rationale. Why is
this so?
219. DAC members continue to report a need for better evidence of multilateral impact and
effectiveness for domestic accountability purposes, which may be enhanced by the coincidence of the large
number of major replenishment negotiations discussed in the previous chapter. They also see an increasing
need to justify multilateral contributions – over which they have less direct oversight – to a sceptical
public, and may therefore require more exacting results on the impact of these organisations in developing
countries. How multilateral organisations report this information back to donors, and how they in turn
represent them domestically, may influence domestic constituents‘ perception of these organisations as
much as the evidence available. The reality of today‘s world does not seem to coincide with that in which

DCD/DAC(2010)32/REV1
87
Milner concluded that in times of ―aid scepticism‖ the public believed multilateral organisations were more
efficient, and preferable to bilateral assistance.72
220. As discussed in the last multilateral aid report, ideally reporting by multilateral agencies would
be sufficiently comprehensive to satisfy bilateral donor information requirements and would make separate
donor-driven assessments unnecessary. The multilateral development banks‘ Common Performance
Assessment System (COMPAS) is a joint effort to improve the reporting of results. The latest report (2008)
records progress towards harmonisation in the area of evaluation, but identifies greater scope for
harmonisation of monitoring development results.
221. A shift towards self-reporting by multilaterals would be a way to apply Paris Declaration
principles of ―ownership‖ and ―alignment‖ to the funding of these organisations. Until self-reporting is
deemed adequate, however, collective assessments intended to lead to full harmonisation of monitoring
instruments for multilaterals are at least an improvement over a proliferation of single-donor assessment
efforts. Such harmonised efforts include the Multilateral Organisations‘ Performance Assessment Network
(MOPAN), and the work of the DAC‘s Evaluation Network. The latter is involved in peer reviewing
organisations‘ evaluation capacities. It is also developing an approach to jointly assess the development
effectiveness of multilateral partners by combining elements of MOPAN assessments with reviews of
organisations‘ own development results evaluation at country-level (see Box 6.2).
Box 6.2: MOPAN and the DAC’s Evaluation Network
Various assessment tools and approaches such as peer reviews of multilaterals’ evaluation functions, multi-donor evaluations of multilaterals’ programs and initiatives, assessments by MOPAN, and reports from multilaterals themselves, all contribute information on multilateral effectiveness. However, individually they may not fully satisfy the performance information needs of stakeholders such as bilateral funders.
Sixteen DAC members73
also belong to the Multilateral Organisation Performance Assessment Network (MOPAN). This ―common approach‖ is an annual assessment built around four dimensions of organisational effectiveness, namely:
1. strategic management (corporate governance, corporate and other strategies); 2. operational management (use of performance information, financial resources management, human
resources management, portfolio management); 3. relationship management (ownership, alignment, harmonisation); and 4. knowledge management (performance monitoring and evaluation, performance reporting, application
of lessons learned).
Donors (MOPAN member representatives) at headquarters and at country level, ministry and Non-Government Organisation representatives in the selected developing countries complete the survey on the multilateral organisations assessed in those countries. This process includes an important dimension of dialogue with the multilateral organisations on the findings. In 2010, MOPAN will survey the Asian Development Bank,
72
Milner (2006), ―Why multilateralism? Foreign aid and domestic principal-agent problems,‖ in Delegation and
Agency in International Organisations, ed. Hawkins, Lake, et al. Cambridge University Press. The argument is
that donor governments use foreign aid to advance their own interests, while publics are more interested in
addressing the needs of recipient countries, or perhaps more likely, are reluctant to give their tax dollars for aid
when they have a difficult time monitoring the government. On the other hand, multilateral organisations are
seen as providing more needs-based aid and cannot easily be controlled by just one donor. Therefore, when
publics are more sceptical about aid, the government will find it in its interest to give more multilateral aid. Of
course, there is a time lag in that the more the public dislikes aid in the prior period, the more the government is
induced to spend on multilateral aid in the next period. Milner bases these conclusions primarily on
humanitarian aid. 73
Members as of April 2010 include: Australia, Austria, Belgium, Canada, Denmark, Finland, France, Germany,
Ireland, The Netherlands, Norway, Republic of Korea, Spain, Sweden, Switzerland and the United Kingdom.

DCD/DAC(2010)32/REV1
88
WHO, UNFPA, and IFAD in ten partner countries. The 2009 survey examined the World Bank, UNDP, the African Development Bank and UNICEF in nine partner countries. This year’s survey will also take into consideration a review of documents published by each of these organisations.
The DAC Evaluation Network, led by Canada, is developing an approach on how to jointly assess the effectiveness of individual multilateral partners by bringing together evaluators, multilateral policy department staff, and representatives from multilateral organisations and MOPAN. The approach will draw on existing data and information, such as the different reviews and reports in order to avoid duplication of work, evaluation fatigue and to lessen the burden placed on multilaterals for information. In short, the assumption is that when organisational effectiveness, as surveyed by MOPAN, is deemed adequate by donors, meta-evaluations will provide additional information on development effectiveness. If the MOPAN survey or the new approach developed cannot shed enough light on the effectiveness of a particular multilateral, a more important joint evaluation of that multilateral may be considered in order to acquire further information on development effectiveness. The approach is seen as an interim solution as, in the long run, the approach should lead to improved results reporting on development effectiveness by the multilaterals themselves.
Source: DAC Secretariat.
Main Findings
In the longer-term, self-assessments by multilateral agencies should be sufficiently
comprehensive to satisfy bilateral donor information requirements, making separate bilateral
evaluations and/or assessments unnecessary. (Paragraph 220)
Until self-reporting is deemed ―adequate‖, collective assessments intended to lead to full
harmonisation of monitoring instruments for multilaterals are encouraged as an improvement
over multiple single-donor assessment efforts. (Paragraph 221)
Questions for Future Policy Discussions
Future efforts by the DAC‘s Evaluation Network and MOPAN aim to combine surveys of
multilateral effectiveness with better impact reporting by the multilaterals themselves. Is this the
right mix?
Bilateral donors have reported an inability to demonstrate multilateral effectiveness. Is this
primarily due to underlying multilateral performance problems, lack of robust data, or
communication gaps.

DCD/DAC(2010)32/REV1
89
ANNEXES

DCD/DAC(2010)32/REV1
90
ANNEX 1
Figure 1: Gross Multilateral ODA of DAC Members
Three-year annual average (2006-8), constant 2008 USD
0.0
0.5
1.0
1.5
2.0
2.5
3.0
3.5
4.0
4.5
5.0
Ge
rman
y
Fran
ce
Un
ite
d K
ingd
om
Jap
an
Un
ite
d S
tate
s
Ital
y
Spai
n
Ne
the
rlan
ds
Swe
de
n
Can
ada
De
nm
ark
No
rway
Be
lgiu
m
Au
stri
a
Swit
zerl
and
Fin
lan
d
Ire
lan
d
Au
stra
lia
Gre
ece
Po
rtu
gal
Luxe
mb
ou
rg
Ne
w Z
eal
and
Ave
rage
DA
C
Ko
rea
USD
20
08
bill
ion
s
EU Institutions Multilateral ODA, excluding to EU institutions
Source: DAC Aggregates.
Figure 2: DAC Multilateral ODA to EU Institutions as % gross ODA
Three-year annual average (2006-8), constant 2008 USD (excluding debt relief)
0%
5%
10%
15%
20%
25%
30%
35%
40%
45%
50%
% g
ross
OD
A
Source: DAC Aggregates.
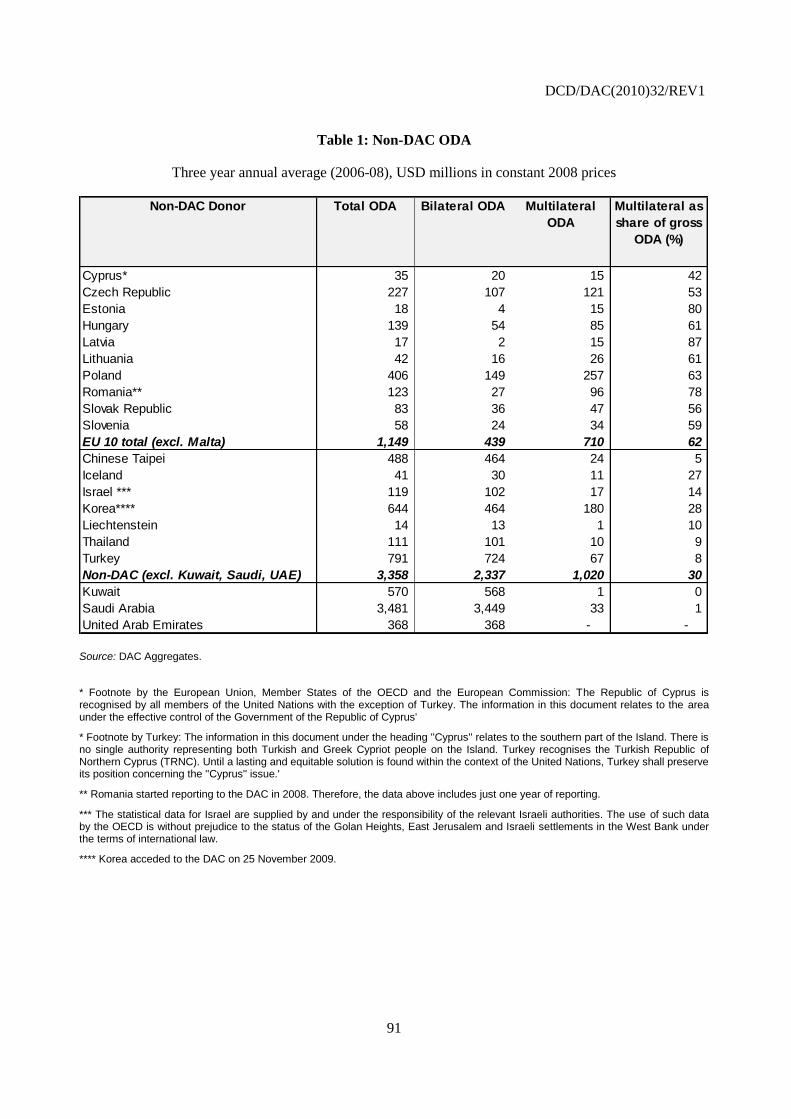
DCD/DAC(2010)32/REV1
91
Table 1: Non-DAC ODA
Three year annual average (2006-08), USD millions in constant 2008 prices
Non-DAC Donor Total ODA Bilateral ODA Multilateral
ODA
Multilateral as
share of gross
ODA (%)
Cyprus* 35 20 15 42
Czech Republic 227 107 121 53
Estonia 18 4 15 80
Hungary 139 54 85 61
Latvia 17 2 15 87
Lithuania 42 16 26 61
Poland 406 149 257 63
Romania** 123 27 96 78
Slovak Republic 83 36 47 56
Slovenia 58 24 34 59
EU 10 total (excl. Malta) 1,149 439 710 62
Chinese Taipei 488 464 24 5
Iceland 41 30 11 27
Israel *** 119 102 17 14
Korea**** 644 464 180 28
Liechtenstein 14 13 1 10
Thailand 111 101 10 9
Turkey 791 724 67 8
Non-DAC (excl. Kuwait, Saudi, UAE) 3,358 2,337 1,020 30
Kuwait 570 568 1 0
Saudi Arabia 3,481 3,449 33 1
United Arab Emirates 368 368 - -
Source: DAC Aggregates.
* Footnote by the European Union, Member States of the OECD and the European Commission: The Republic of Cyprus is recognised by all members of the United Nations with the exception of Turkey. The information in this document relates to the area under the effective control of the Government of the Republic of Cyprus'
* Footnote by Turkey: The information in this document under the heading ''Cyprus'' relates to the southern part of the Island. There is no single authority representing both Turkish and Greek Cypriot people on the Island. Turkey recognises the Turkish Republic of Northern Cyprus (TRNC). Until a lasting and equitable solution is found within the context of the United Nations, Turkey shall preserve its position concerning the ''Cyprus'' issue.'
** Romania started reporting to the DAC in 2008. Therefore, the data above includes just one year of reporting.
*** The statistical data for Israel are supplied by and under the responsibility of the relevant Israeli authorities. The use of such data by the OECD is without prejudice to the status of the Golan Heights, East Jerusalem and Israeli settlements in the West Bank under the terms of international law.
**** Korea acceded to the DAC on 25 November 2009.

DCD/DAC(2010)32/REV1
92
Table 2: DAC countries’ “burden sharing” of global multilateral agencies
Five-year annual average (2004-2008), constant 2008 USD
Mu
ltil
ate
ral
OD
A
2004-2
008
Do
no
r's s
hare
of
glo
bal
mu
ltil
ate
ral
OD
A
EU
in
sti
tuti
on
s
IDA
UN
Fu
nd
s
an
d P
rog
ram
mes*
Glo
bal
Fu
nd
Number of DAC donors 15 23 23 21
Non-EU members 44,962 28% n.a. 45% 41% 44%
Australia 1,772 1% n.a. 2% 1% 1%
Canada 5,673 4% n.a. 5% 5% 5%
Japan 15,057 9% n.a. 16% 11% 5%
New Zealand 322 0% n.a. 0% 0% 0%
Norway 4,932 3% n.a. 2% 13% 2%
Switzerland 2,309 1% n.a. 3% 3% 0%
United States 14,899 9% n.a. 17% 7% 30%
EU members 115,529 72% 100% 54% 59% 56%
Austria 2,318 1% 2% 1% 1% n.a.
Belgium 4,037 3% 4% 3% 1% 1%
Denmark 4,933 3% 2% 1% 8% 2%
Finland 2,083 1% 2% 1% 3% 0%
France 20,556 13% 20% 7% 3% 18%
Germany 21,306 13% 22% 13% 3% 7%
Greece 1,390 1% 2% 0% 0% 0%
Ireland 1,756 1% 1% 1% 2% 1%
Italy 13,678 8% 13% 4% 3% 9%
Luxembourg 562 0% 0% 0% 1% 0%
Netherlands 8,609 5% 5% 3% 12% 4%
Portugal 1,089 1% 1% 0% 0% 0%
Spain 8,967 6% 8% 4% 3% 4%
Sweden 6,466 4% 3% 3% 12% 4%
United Kingdom 17,780 11% 15% 12% 8% 7%
DAC Total excl. Korea 160,491 99% 100% 99% 100% 100%
Korea 938 1% n.a. 1% 0% n.a.
Source: DAC Aggregates
* Includes UNICEF, UNDP, UNFPA, UNHCR, WFP and UNRWA. Excludes Specialised Agencies and UNCTAD, UNDCP, UNEP, UNIFEM, UNV, UNCDF and UN-Habitat for which core contributions are not disaggregated in the DAC database.
Note: Totals may not add up due to rounding.

DCD/DAC(2010)32/REV1
93
Figure 3: Distribution of Aid by Sector
2008 Bilateral ODA by Sector (not including Korea) 2008 Multilateral Outflows by Sector
Gross Disbursements, excluding debt relief Gross disbursements, excluding debt relief
(constant 2008 prices) (constant 2008 prices)
Total bilateral ODA = USD 88 billion Total multilateral outflows = USD 31 billion
Commodity aid and general programme
assistance6%
Economic Infrastructure and
Services
14%
Humanitarian Aid10%
Multi-sector / Cross-cutting
8%
Other and unallocated
13%
Production Sectors
6%
Social Infrastructure and
services
43%
Commodity aid and general programme
assistance5%
Economic Infrastructure and
Services
19%
Humanitarian Aid7%
Multi-sector / Cross-cutting
6%
Other and unallocated
8%
Production Sectors
9%
Social Infrastructure and
services
46%
Source: Creditor Reporting System. Note: EU Institutions are included in multilateral outflows. Data on multilateral outflows are incomplete. Approximately 23 major multilateral organisations report their outflows.

DCD/DAC(2010)32/REV1
94
Figure 4: Distribution of Aid by Partner Country Income
2008 Bilateral ODA (not including Korea) 2008 Multilateral Outflows
Gross Disbursements, excluding debt relief Gross disbursements, excluding debt relief
(constant 2008 prices) (constant 2008 prices)
Total bilateral ODA = USD 88 billion Total multilateral outflows = USD 31 billion
LDCs25%
Other Low-income
8%Lower Middle-income
29%
Upper Middle-income
7%
Unallocated31%
LDCs43%
Other Low-
income
12%
Lower Middle-income
23%
Upper Middle-income
11%
Unallocated11%
Source: Creditor Reporting System. Note: EU Institutions are included in multilateral outflows. Data on multilateral outflows are incomplete. Approximately 23 major multilateral organisations report their outflows to the DAC.

DCD/DAC(2010)32/REV1
95
Figure 5: Distribution of Aid by Conflict / Fragility Status
2008 Bilateral ODA 2008 Multilateral Outflows
Gross Disbursements, excluding debt relief Gross disbursements, excluding debt relief
(constant 2008 prices) (constant 2008 prices)
Total allocated bilateral ODA = USD 69 billion Total allocated multilateral outflows = USD 29 billion
Non-fragile66%
Fragile / Conflict
34%
Non-fragile64%
Fragile / Conflict
36%
Source: Creditor Reporting System. Note: Total allocated bilateral ODA does not include ODA or outflows to ―unallocated or unspecified‖ recipients. EU Institutions are included in multilateral outflows. Data on multilateral outflows are incomplete. Approximately 23 major multilateral organisations report their outflows to the DAC.

DCD/DAC(2010)32/REV1
96
Table 3: DAC Gross Multilateral ODA
Three-year annual average (2006-8) disbursements, USD millions in constant 2008 prices
DAC country EU InstitutionsThe World
Bank Group
UN Funds and
ProgrammesOther UN
Regional Dev.
Banks
The Global
Fund
Other
multilateral
agencies
Multilateral
ODA, total
Australia - 175 22 41 71 22 42 372
Austria 286 120 17 24 31 - 18 496
Belgium 502 175 35 31 45 16 35 839
Canada - 451 144 128 241 119 148 1,231
Denmark 265 148 255 114 65 30 94 971
Finland 195 48 91 46 35 2 36 453
France 2,398 560 102 157 243 393 424 4,278
Germany 2,663 1,004 89 195 275 174 134 4,535
Greece 226 47 3 13 15 0 14 318
Ireland 144 78 89 45 14 19 19 409
Italy 1,642 291 88 202 127 193 102 2,644
Japan - 1,433 189 435 534 118 354 3,063
Luxembourg 34 21 19 33 9 3 6 126
Netherlands 588 207 396 164 85 98 97 1,636
New Zealand - 11 20 13 7 - 19 68
Norway - 153 399 155 105 59 85 955
Portugal 155 25 4 8 27 3 7 229
Spain 1,027 318 142 146 161 114 127 2,035
Sweden 329 237 436 159 124 101 66 1,452
Switzerland - 189 104 45 64 6 67 476
United Kingdom 1,886 1,023 275 257 286 156 140 4,023
United States - 946 235 445 245 644 301 2,817
Total DAC 12,340 7,662 3,152 2,856 2,809 2,272 2,336 33,427
Korea - 51 7 35 74 - 12 180
Share of total multilateral ODA (%) 37 23 9 9 8 7 7 100
Source: DAC Aggregate Statistics
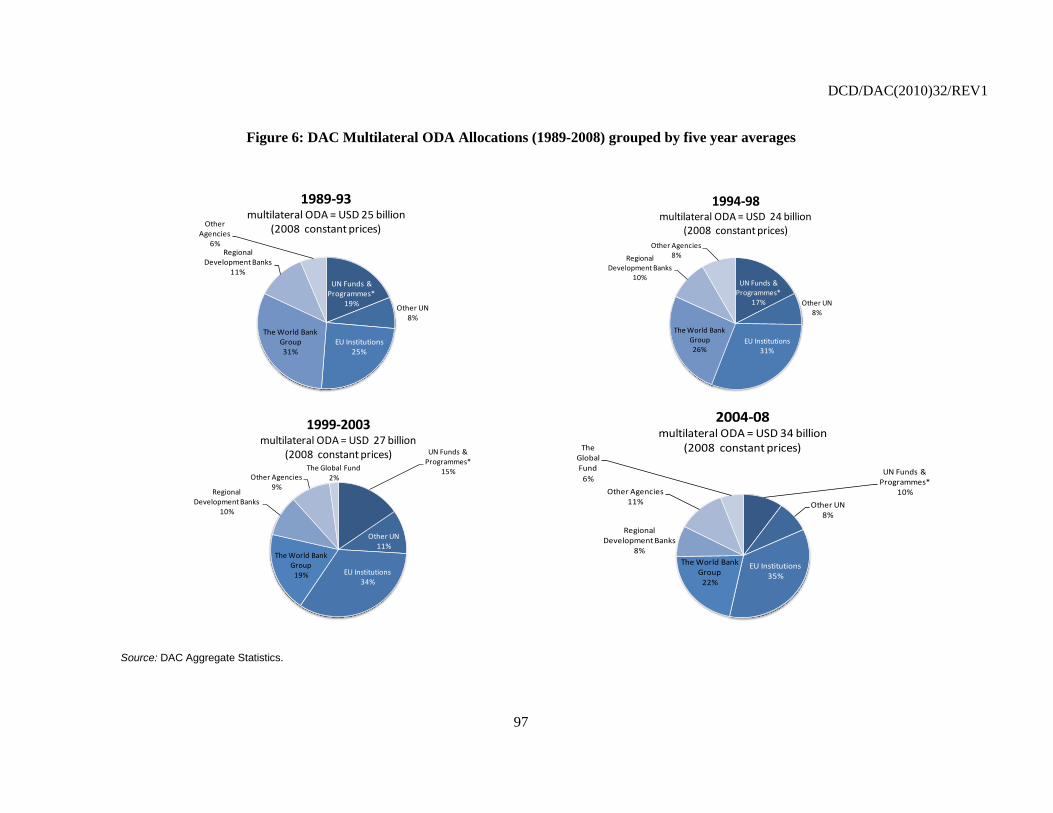
DCD/DAC(2010)32/REV1
97
Figure 6: DAC Multilateral ODA Allocations (1989-2008) grouped by five year averages
Source: DAC Aggregate Statistics.
UN Funds & Programmes*
19%Other UN
8%
EU Institutions25%
The World Bank Group31%
Regional Development Banks
11%
Other Agencies
6%
1989-93multilateral ODA = USD 25 billion
(2008 constant prices)
UN Funds & Programmes*
17% Other UN8%
EU Institutions31%
The World Bank Group26%
Regional Development Banks
10%
Other Agencies8%
1994-98multilateral ODA = USD 24 billion
(2008 constant prices)
UN Funds & Programmes*
15%
Other UN11%
EU Institutions34%
The World Bank Group
19%
Regional Development Banks
10%
Other Agencies9%
The Global Fund2%
1999-2003multilateral ODA = USD 27 billion
(2008 constant prices)
UN Funds & Programmes*
10%
Other UN8%
EU Institutions35%
The World Bank Group
22%
Regional Development Banks
8%
Other Agencies11%
The Global Fund
6%
2004-08multilateral ODA = USD 34 billion
(2008 constant prices)

DCD/DAC(2010)32/REV1
98
Table 4: 2008 Concentration Ratios of Multilateral and Bilateral Donors in Low-Income Countries
Source: 2009 OECD Report on Division of Labour - Addressing Fragmentation and Concentration of Aid across Countries, OECD 2009
Table 5: DAC Gross Multilateral ODA Disbursements
Five-year average (2004-2008), constant 2008 USD
Mu
ltil
ate
ral
OD
A
2004-2
008
Do
no
r's s
hare
of
glo
bal
mu
ltil
ate
ral
OD
A
EU
In
sti
tuti
on
s
IDA
UN
Fu
nd
s
an
d P
rog
ram
mes*
Glo
bal
Fu
nd
AfD
B
AsD
B
% a
llo
cate
d t
o l
arg
est
six
mu
ltil
ate
ral
clu
ste
rs
Number of DAC donors 15 23 23 21 18 22
Non-EU members 44,962 28% n.a. 34% 15% 9% 6% 7% 72%
Australia 1,772 1% n.a. 42% 7% 5% n.a. 20% 74%
Canada 5,673 4% n.a. 32% 13% 9% 9% 6% 69%
Japan 15,057 9% n.a. 36% 12% 3% 5% 12% 67%
New Zealand 322 0% n.a. 16% 26% 1% n.a. 11% 52%
Norway 4,932 3% n.a. 16% 45% 4% 9% 1% 75%
Switzerland 2,309 1% n.a. 40% 23% 1% 10% 3% 77%
United States 14,899 9% n.a. 38% 8% 19% 5% 5% 75%
EU members 115,529 72% 51% 16% 9% 5% 4% 2% 86%
Austria 2,318 1% 60% 20% 4% n.a. 5% 2% 91%
Belgium 4,037 3% 59% 21% 4% 2% 4% 1% 91%
Denmark 4,933 3% 26% 10% 28% 3% 3% 1% 71%
Finland 2,083 1% 44% 11% 22% 0% 5% 1% 83%
France 20,556 13% 58% 12% 2% 8% 4% 1% 86%
Germany 21,306 13% 61% 21% 2% 3% 4% 1% 92%
Greece 1,390 1% 77% 11% 1% 0% n.a. n.a. 89%
Ireland 1,756 1% 39% 16% 22% 3% n.a. 2% 82%
Italy 13,678 8% 58% 11% 3% 6% 3% 2% 84%
Luxembourg 562 0% 29% 9% 15% 2% n.a. 10% 66%
Netherlands 8,609 5% 32% 13% 23% 4% 4% 2% 79%
Portugal 1,089 1% 70% 10% 2% 1% 6% 3% 93%
Spain 8,967 6% 55% 14% 5% 4% 4% 2% 85%
Sweden 6,466 4% 23% 17% 31% 6% 6% 1% 84%
United Kingdom 17,780 11% 49% 22% 8% 4% 4% 1% 88%
DAC Total excl. Korea 160,491 99% 37% 21% 10% 6% 4% 3% 82%
Korea 938 1% n.a. 32% 4% n.a. 7% 17% 61%
Source: DAC Aggregates.
* Includes UNICEF, UNDP, UNFPA, UNHCR, WFP and UNRWA. Excludes Specialised Agencies and UNCTAD, UNDCP, UNEP, UNIFEM, UNV, UNCDF and UN-Habitat for which core contributions are not disaggregated in the DAC database.
Note: Totals may not add up due to rounding.
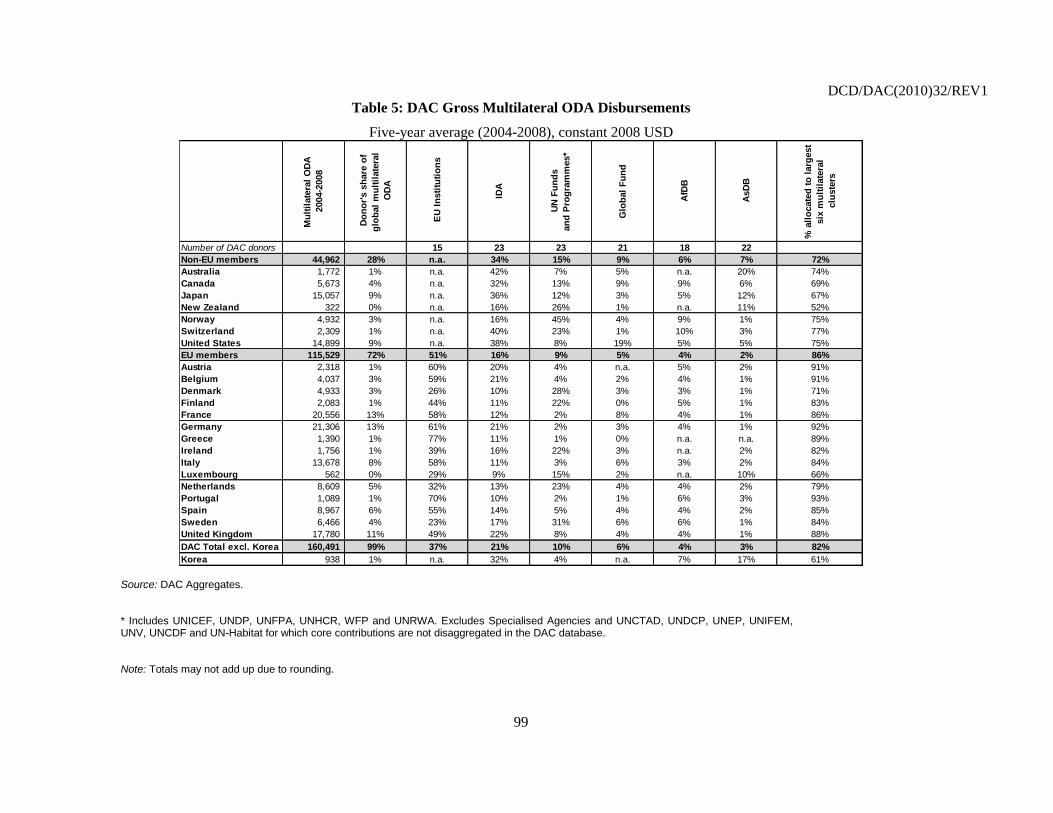
DCD/DAC(2010)32/REV1
99
Table 5: DAC Gross Multilateral ODA Disbursements
Five-year average (2004-2008), constant 2008 USD
Mu
ltil
ate
ral
OD
A
2004-2
008
Do
no
r's s
hare
of
glo
bal
mu
ltil
ate
ral
OD
A
EU
In
sti
tuti
on
s
IDA
UN
Fu
nd
s
an
d P
rog
ram
mes*
Glo
bal
Fu
nd
AfD
B
AsD
B
% a
llo
cate
d t
o l
arg
est
six
mu
ltil
ate
ral
clu
ste
rs
Number of DAC donors 15 23 23 21 18 22
Non-EU members 44,962 28% n.a. 34% 15% 9% 6% 7% 72%
Australia 1,772 1% n.a. 42% 7% 5% n.a. 20% 74%
Canada 5,673 4% n.a. 32% 13% 9% 9% 6% 69%
Japan 15,057 9% n.a. 36% 12% 3% 5% 12% 67%
New Zealand 322 0% n.a. 16% 26% 1% n.a. 11% 52%
Norway 4,932 3% n.a. 16% 45% 4% 9% 1% 75%
Switzerland 2,309 1% n.a. 40% 23% 1% 10% 3% 77%
United States 14,899 9% n.a. 38% 8% 19% 5% 5% 75%
EU members 115,529 72% 51% 16% 9% 5% 4% 2% 86%
Austria 2,318 1% 60% 20% 4% n.a. 5% 2% 91%
Belgium 4,037 3% 59% 21% 4% 2% 4% 1% 91%
Denmark 4,933 3% 26% 10% 28% 3% 3% 1% 71%
Finland 2,083 1% 44% 11% 22% 0% 5% 1% 83%
France 20,556 13% 58% 12% 2% 8% 4% 1% 86%
Germany 21,306 13% 61% 21% 2% 3% 4% 1% 92%
Greece 1,390 1% 77% 11% 1% 0% n.a. n.a. 89%
Ireland 1,756 1% 39% 16% 22% 3% n.a. 2% 82%
Italy 13,678 8% 58% 11% 3% 6% 3% 2% 84%
Luxembourg 562 0% 29% 9% 15% 2% n.a. 10% 66%
Netherlands 8,609 5% 32% 13% 23% 4% 4% 2% 79%
Portugal 1,089 1% 70% 10% 2% 1% 6% 3% 93%
Spain 8,967 6% 55% 14% 5% 4% 4% 2% 85%
Sweden 6,466 4% 23% 17% 31% 6% 6% 1% 84%
United Kingdom 17,780 11% 49% 22% 8% 4% 4% 1% 88%
DAC Total excl. Korea 160,491 99% 37% 21% 10% 6% 4% 3% 82%
Korea 938 1% n.a. 32% 4% n.a. 7% 17% 61% Source: DAC Aggregates.
* Includes UNICEF, UNDP, UNFPA, UNHCR, WFP and UNRWA. Excludes Specialised Agencies and UNCTAD, UNDCP, UNEP, UNIFEM, UNV, UNCDF and UN-Habitat for which core contributions are not disaggregated in the DAC database.
Note: Totals may not add up due to rounding.

DCD/DAC(2010)32/REV1
100
Table 6: DAC Gross Multilateral and Non-Core Multilateral ODA Disbursements
2006-2008, USD millions in constant 2008 prices
2006 2007 2008
Total core multilateral aid
DAC Countries 32,547 32,455 35,305
DAC Countries (excluding to EU
institutions)20,864 20,158 22,266
EU Institutions 656 331 324
Korea 100 177 263
Total non-core multilateral aid*
DAC Countries 12,000 11,466 14,195
DAC Countries (excluding to EU
institutions)11,962 11,435 14,056
EU Institutions 1,906 1,524 1,807
Korea 6 17 33
Total use of the multilateral system
DAC Countries 44,547 43,851 49,500
DAC Countries (excluding to EU
institutions)32,826 31,592 36,321
EU Institutions 2,562 1,855 2,130
Korea 107 194 296
Core as share of total use of the multilateral system (%)
DAC Countries 73 74 71
DAC Countries (excluding to EU
institutions)64 64 61
EU Institutions 26 18 15
Korea 94 91 89
Non-core as share of total use of multilateral system (%)
DAC Countries 27 26 29
DAC Countries (excluding to EU
institutions)36 36 39
EU Institutions 74 82 85
Korea 6 9 11
Total use of multilateral system as % of total ODA
DAC Countries 41 39 40
EU Institutions 20 15 14
Korea 23 31 36
Total non-core as % of total ODA
DAC Countries 11 10 11
EU Institutions 15 12 12
Korea 1 3 4 Source: DAC Aggregates and Creditor Reporting System * Non-core data for 2006 are commitments, not disbursements.

DCD/DAC(2010)32/REV1
101
ANNEX 2
Methodology Note: Data on non-core multilateral aid can be found in the Creditor Reporting
System database. Non-core multilateral aid is reported as bilateral aid, with a multilateral
agency identified in the channel code. A few donors do not provide detailed channel codes
beyond the overall multilateral code of 40000. For this reason, an attempt was made to examine
channel names of bilateral ODA flows in order to gain a more accurate picture of 2008 non-
core multilateral disbursements for this report. As a result, queries of the Creditor Reporter
System may yield slight discrepancies with the tables presented in Annex 2.

DCD/DAC(2010)32/REV1
102
Table 1: 2008 DAC Gross Multilateral and Non-Core Multilateral ODA Disbursements
USD millions in constant 2008 prices (excluding debt relief)
Donor Total bilateral aid of which; channelled through
multilateral agencies (non-
core)
Total core multilateral
aid
Total use of the
multilateral system
Core multilateral
as share of total
ODA (%)
Core and non-core
as share of total
ODA (%)
Core as share of
total use of the
multilateral
system (%)
(A) (B) (C) (B+C) (C/(A+C)) ((B+C)/(A+C)) (C/(B+C))
Australia 2,361 563 337 900 13 33 37
Austria 508 80 480 560 49 57 86
Belgium 1,378 180 1,010 1,189 42 50 85
Canada 3,263 814 1,428 2,243 30 48 64
Denmark 1,765 98 975 1,073 36 39 91
Finland 691 200 473 673 41 58 70
France 6,675 45 4,643 4,687 41 41 99
Germany 7,753 349 4,918 5,267 39 42 93
Greece 312 23 391 414 56 59 94
Ireland 931 215 397 613 30 46 65
Italy 1,174 276 3,022 3,299 72 79 92
Japan 11,892 1,085 2,756 3,841 19 26 72
Luxembourg 279 57 136 193 33 47 71
Netherlands 5,366 1,132 1,793 2,925 25 41 61
New Zealand 278 47 70 117 20 34 60
Norway 2,993 983 928 1,911 24 49 49
Portugal 379 31 247 278 39 44 89
Spain 4,724 1,913 2,065 3,978 30 59 52
Sweden 3,145 726 1,589 2,315 34 49 69
Switzerland 1,463 209 487 696 25 36 70
United Kingdom 7,260 1,554 4,167 5,721 36 50 73
United States 24,430 3,614 2,992 6,606 11 24 45
Total DAC 89,020 14,195 35,305 49,500 28 40 71
Korea 568 33 263 296 32 36 89
EU Institutions* 14,655 1,807 324 2,130 2 14 15 Source: DAC Aggregates (columns A & C) and Creditor Reporting System (column B) * The DAC is currently looking into the nature of EU Institutions' multilateral aid and how this should be classified, in particular to UN agencies, funds and programmes and to multilateral development banks.
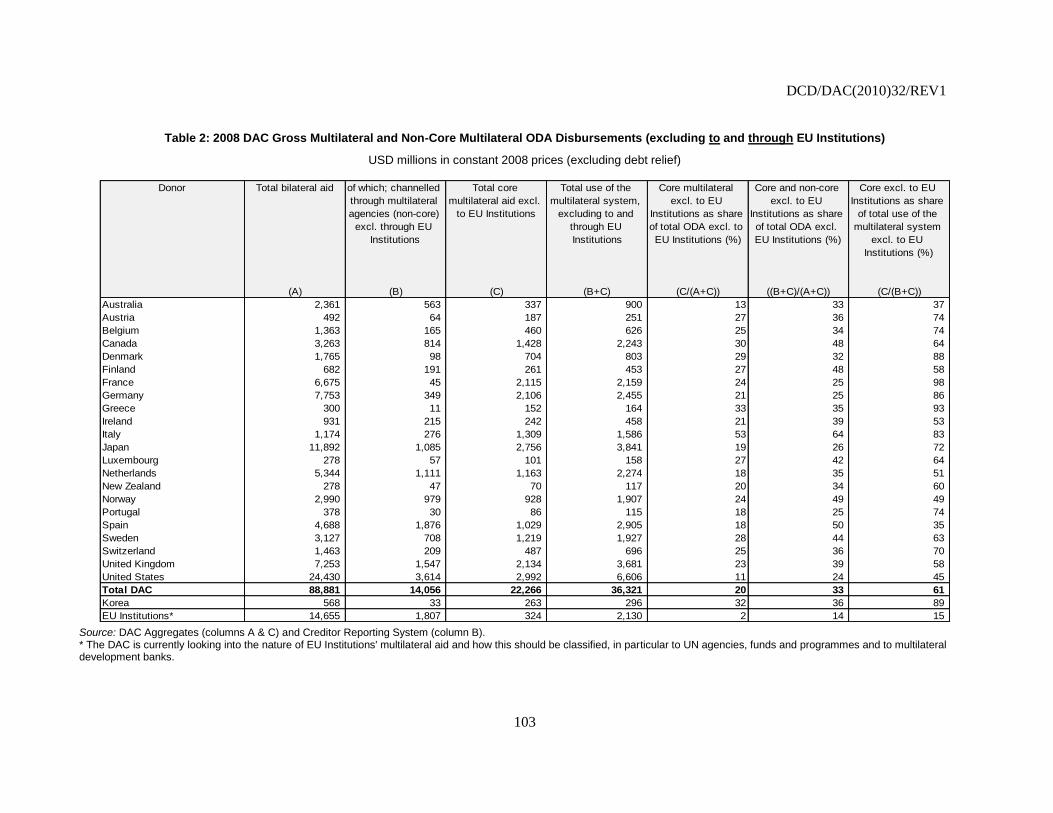
DCD/DAC(2010)32/REV1
103
Table 2: 2008 DAC Gross Multilateral and Non-Core Multilateral ODA Disbursements (excluding to and through EU Institutions)
USD millions in constant 2008 prices (excluding debt relief)
Donor Total bilateral aid of which; channelled
through multilateral
agencies (non-core)
excl. through EU
Institutions
Total core
multilateral aid excl.
to EU Institutions
Total use of the
multilateral system,
excluding to and
through EU
Institutions
Core multilateral
excl. to EU
Institutions as share
of total ODA excl. to
EU Institutions (%)
Core and non-core
excl. to EU
Institutions as share
of total ODA excl.
EU Institutions (%)
Core excl. to EU
Institutions as share
of total use of the
multilateral system
excl. to EU
Institutions (%)
(A) (B) (C) (B+C) (C/(A+C)) ((B+C)/(A+C)) (C/(B+C))
Australia 2,361 563 337 900 13 33 37
Austria 492 64 187 251 27 36 74
Belgium 1,363 165 460 626 25 34 74
Canada 3,263 814 1,428 2,243 30 48 64
Denmark 1,765 98 704 803 29 32 88
Finland 682 191 261 453 27 48 58
France 6,675 45 2,115 2,159 24 25 98
Germany 7,753 349 2,106 2,455 21 25 86
Greece 300 11 152 164 33 35 93
Ireland 931 215 242 458 21 39 53
Italy 1,174 276 1,309 1,586 53 64 83
Japan 11,892 1,085 2,756 3,841 19 26 72
Luxembourg 278 57 101 158 27 42 64
Netherlands 5,344 1,111 1,163 2,274 18 35 51
New Zealand 278 47 70 117 20 34 60
Norway 2,990 979 928 1,907 24 49 49
Portugal 378 30 86 115 18 25 74
Spain 4,688 1,876 1,029 2,905 18 50 35
Sweden 3,127 708 1,219 1,927 28 44 63
Switzerland 1,463 209 487 696 25 36 70
United Kingdom 7,253 1,547 2,134 3,681 23 39 58
United States 24,430 3,614 2,992 6,606 11 24 45
Total DAC 88,881 14,056 22,266 36,321 20 33 61
Korea 568 33 263 296 32 36 89
EU Institutions* 14,655 1,807 324 2,130 2 14 15 Source: DAC Aggregates (columns A & C) and Creditor Reporting System (column B). * The DAC is currently looking into the nature of EU Institutions' multilateral aid and how this should be classified, in particular to UN agencies, funds and programmes and to multilateral development banks.
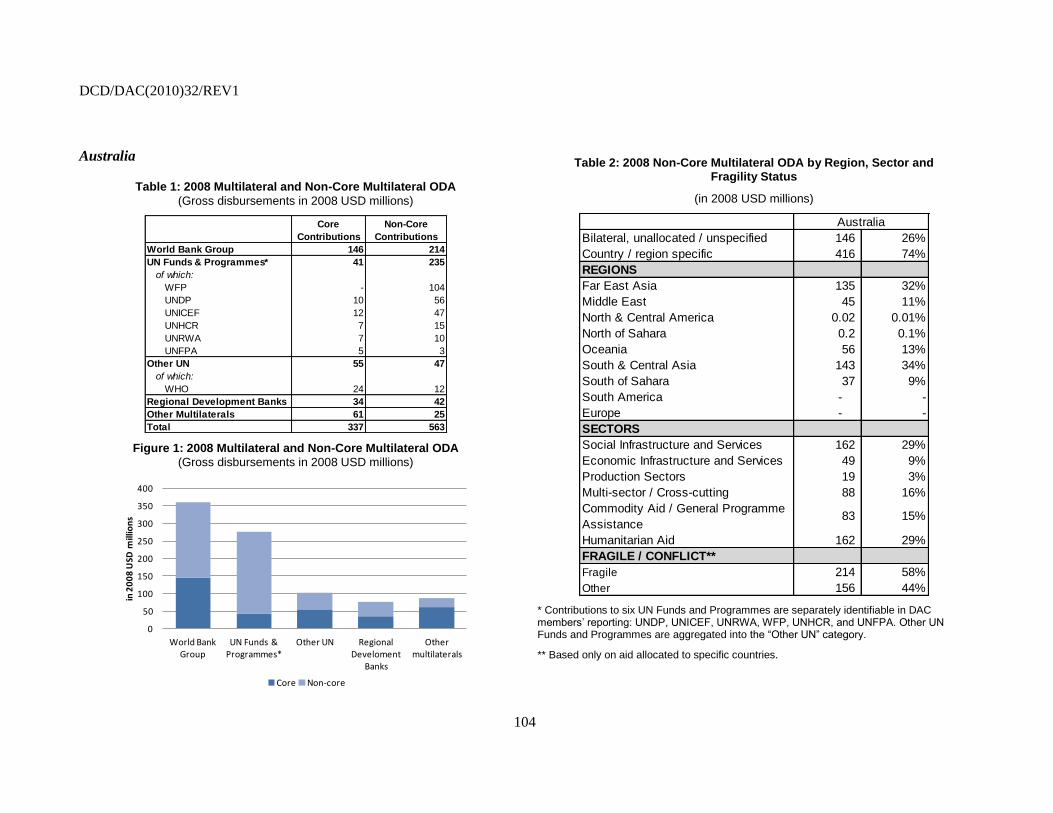
DCD/DAC(2010)32/REV1
104
Australia
Table 1: 2008 Multilateral and Non-Core Multilateral ODA
(Gross disbursements in 2008 USD millions)
Core
Contributions
Non-Core
Contributions
World Bank Group 146 214
UN Funds & Programmes* 41 235
of which:
WFP - 104
UNDP 10 56
UNICEF 12 47
UNHCR 7 15
UNRWA 7 10
UNFPA 5 3
Other UN 55 47
of which:
WHO 24 12
Regional Development Banks 34 42
Other Multilaterals 61 25
Total 337 563
Figure 1: 2008 Multilateral and Non-Core Multilateral ODA
(Gross disbursements in 2008 USD millions)
0
50
100
150
200
250
300
350
400
World Bank Group
UN Funds & Programmes*
Other UN Regional Develoment
Banks
Other multilaterals
in 2
00
8 U
SD m
illio
ns
Core Non-core
Table 2: 2008 Non-Core Multilateral ODA by Region, Sector and Fragility Status
(in 2008 USD millions)
Bilateral, unallocated / unspecified 146 26%
Country / region specific 416 74%
REGIONS
Far East Asia 135 32%
Middle East 45 11%
North & Central America 0.02 0.01%
North of Sahara 0.2 0.1%
Oceania 56 13%
South & Central Asia 143 34%
South of Sahara 37 9%
South America - -
Europe - -
SECTORS
Social Infrastructure and Services 162 29%
Economic Infrastructure and Services 49 9%
Production Sectors 19 3%
Multi-sector / Cross-cutting 88 16%
Commodity Aid / General Programme
Assistance83 15%
Humanitarian Aid 162 29%
FRAGILE / CONFLICT**
Fragile 214 58%
Other 156 44%
Australia
* Contributions to six UN Funds and Programmes are separately identifiable in DAC members’ reporting: UNDP, UNICEF, UNRWA, WFP, UNHCR, and UNFPA. Other UN Funds and Programmes are aggregated into the ―Other UN‖ category.
** Based only on aid allocated to specific countries.

DCD/DAC(2010)32/REV1
105
Austria
Table 1: 2008 Multilateral and Non-Core Multilateral ODA
(Gross disbursements in 2008 USD millions)
Core
Contributions
Non-Core
Contributions
EU Institutions 293 16
World Bank Group 122 23
UN Funds & Programmes* 20 13
of which:
UNDP 9 4
UNRWA 1 4
WFP 6 2
UNHCR 1 2
UNICEF 2 1
UNFPA 2 1
Other UN 22 9
of which:
ILO 0.5 1
Regional Development Banks 9 5
Other Multilaterals 14 14
Total 480 80
Figure 1: 2008 Multilateral and Non-Core Multilateral ODA
(Gross disbursements in 2008 USD millions)
0
50
100
150
200
250
300
350
EU Institutions World Bank Group
UN Funds & Programmes*
Other UN Regional Develoment
Banks
Other multilaterals
in 2
00
8 U
SD m
illio
ns
Core Non-core
Table 2: 2008 Non-Core Multilateral ODA by Region, Sector and Fragility Status
(in 2008 USD millions)
Bilateral, unallocated / unspecified 15 19%
Country / region specific 65 81%
REGIONS
Far East Asia 1 2%
Middle East 6 9%
North & Central America 3 4%
North of Sahara 1 2%
Oceania 24 37%
South & Central Asia 13 20%
South of Sahara 15 24%
South America 0.1 0.1%
Europe 1 1%
SECTORS
Social Infrastructure and Services 25 32%
Economic Infrastructure and Services 27 33%
Production Sectors 7 9%
Multi-sector / Cross-cutting 12 15%
Commodity Aid / General Programme
Assistance1 1%
Humanitarian Aid 9 11%
FRAGILE / CONFLICT**
Fragile 9 27%
Other 24 73%
Austria
* Contributions to six UN Funds and Programmes are separately identifiable in DAC members’ reporting: UNDP, UNICEF, UNRWA, WFP, UNHCR, and UNFPA. Other UN Funds and Programmes are aggregated into the ―Other UN‖ category.
** Based only on aid allocated to specific countries.
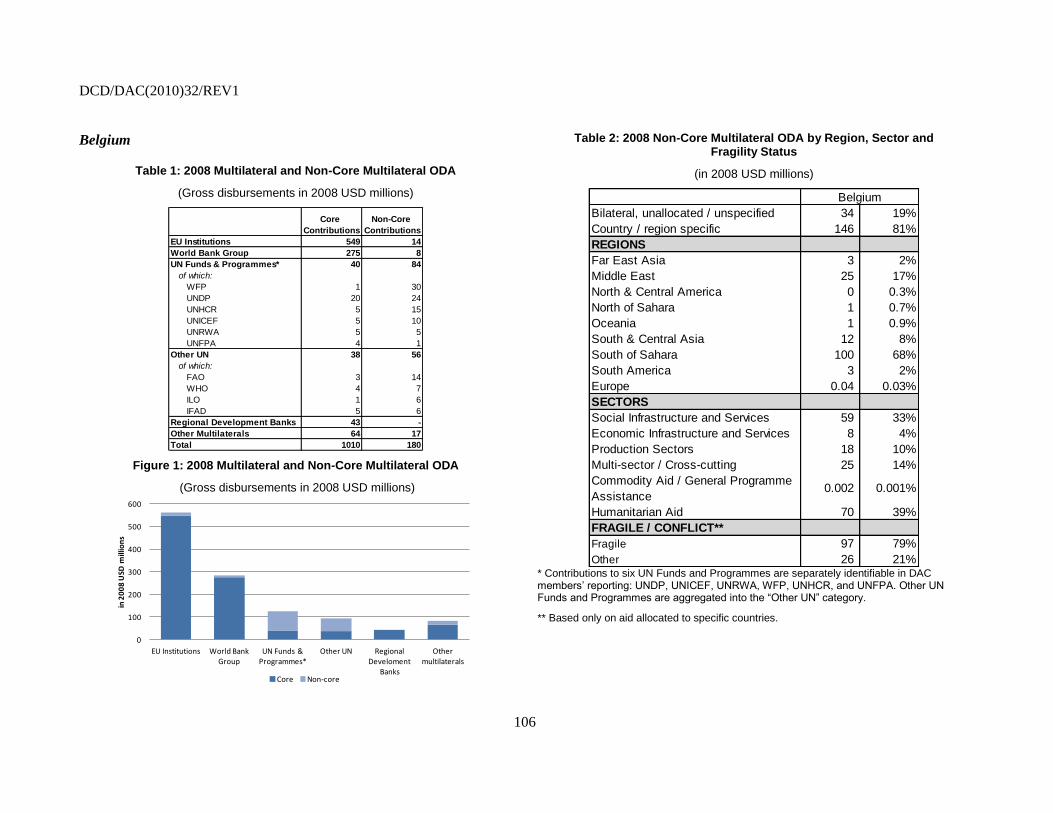
DCD/DAC(2010)32/REV1
106
Belgium
Table 1: 2008 Multilateral and Non-Core Multilateral ODA
(Gross disbursements in 2008 USD millions)
Core
Contributions
Non-Core
Contributions
EU Institutions 549 14
World Bank Group 275 8
UN Funds & Programmes* 40 84
of which:
WFP 1 30
UNDP 20 24
UNHCR 5 15
UNICEF 5 10
UNRWA 5 5
UNFPA 4 1
Other UN 38 56
of which:
FAO 3 14
WHO 4 7
ILO 1 6
IFAD 5 6
Regional Development Banks 43 -
Other Multilaterals 64 17
Total 1010 180
Figure 1: 2008 Multilateral and Non-Core Multilateral ODA
(Gross disbursements in 2008 USD millions)
0
100
200
300
400
500
600
EU Institutions World Bank Group
UN Funds & Programmes*
Other UN Regional Develoment
Banks
Other multilaterals
in 2
00
8 U
SD m
illio
ns
Core Non-core
Table 2: 2008 Non-Core Multilateral ODA by Region, Sector and Fragility Status
(in 2008 USD millions)
Bilateral, unallocated / unspecified 34 19%
Country / region specific 146 81%
REGIONS
Far East Asia 3 2%
Middle East 25 17%
North & Central America 0 0.3%
North of Sahara 1 0.7%
Oceania 1 0.9%
South & Central Asia 12 8%
South of Sahara 100 68%
South America 3 2%
Europe 0.04 0.03%
SECTORS
Social Infrastructure and Services 59 33%
Economic Infrastructure and Services 8 4%
Production Sectors 18 10%
Multi-sector / Cross-cutting 25 14%
Commodity Aid / General Programme
Assistance0.002 0.001%
Humanitarian Aid 70 39%
FRAGILE / CONFLICT**
Fragile 97 79%
Other 26 21%
Belgium
* Contributions to six UN Funds and Programmes are separately identifiable in DAC members’ reporting: UNDP, UNICEF, UNRWA, WFP, UNHCR, and UNFPA. Other UN Funds and Programmes are aggregated into the ―Other UN‖ category.
** Based only on aid allocated to specific countries.

DCD/DAC(2010)32/REV1
107
Canada
Table 1: 2008 Multilateral and Non-Core Multilateral ODA
(Gross disbursements in 2008 USD millions)
Core
Contributions
Non-Core
Contributions
World Bank Group 689 138
UN Funds & Programmes* 130 505
of which:
WFP 18 251
UNDP 53 122
UNICEF 17 89
UNHCR 13 27
UNRWA 14 10
UNFPA 16 6
Other UN 99 112
of which:
WHO - 23
FAO 7 6
ILO 2 1
Regional Development Banks 286 10
Other Multilaterals 225 50
Total 1428 814
Figure 1: 2008 Multilateral and Non-Core Multilateral ODA
(Gross disbursements in 2008 USD millions)
0
100
200
300
400
500
600
700
800
900
World Bank Group
UN Funds & Programmes*
Other UN Regional Develoment
Banks
Other multilaterals
in 2
00
8 U
SD m
illio
ns
Core Non-core
Table 2: 2008 Non-Core Multilateral ODA by Region, Sector and Fragility Status
(in 2008 USD millions)
Bilateral, unallocated / unspecified 33 4%
Country / region specific 782 96%
REGIONS
Far East Asia 53 7%
Middle East 47 6%
North & Central America 71 9%
North of Sahara 1 0.1%
Oceania 4 0.5%
South & Central Asia 202 26%
South of Sahara 369 47%
South America 37 5%
Europe - 0%
SECTORS
Social Infrastructure and Services 424 52%
Economic Infrastructure and Services 37 5%
Production Sectors 18 2%
Multi-sector / Cross-cutting 4 1%
Commodity Aid / General
Programme Assistance85 10%
Humanitarian Aid 246 30%
FRAGILE / CONFLICT**
Fragile 516 76%
Other 161 24%
Canada
* Contributions to six UN Funds and Programmes are separately identifiable in DAC members’ reporting: UNDP, UNICEF, UNRWA, WFP, UNHCR, and UNFPA. Other UN Funds and Programmes are aggregated into the ―Other UN‖ category.
** Based only on aid allocated to specific countries.

DCD/DAC(2010)32/REV1
108
Denmark
Table 1: 2008 Multilateral and Non-Core Multilateral ODA
(Gross disbursements in 2008 USD millions)
Core
Contributions
Non-Core
Contributions
EU Institutions 271 0.1
World Bank Group 183 2
UN Funds & Programmes* 233 74
of which:
UNHCR 28 27
UNICEF 35 22
WFP 38 14
UNDP 74 5
UNFPA 45 4
UNRWA 14 2
Other UN 113 11
of which:
FAO 2 0.3
Regional Development Banks 44 -
Other Multilaterals 130 11
Total 975 98
Figure 1: 2008 Multilateral and Non-Core Multilateral ODA
(Gross disbursements in 2008 USD millions)
0
50
100
150
200
250
300
350
EU Institutions
World Bank Group
UN Funds & Programmes*
Other UN Regional Develoment
Banks
Other multilaterals
in 2
00
8 U
SD m
illio
ns
Core Non-core
Table 2: 2008 Non-Core Multilateral ODA by Region, Sector and Fragility Status
(in 2008 USD millions)
Bilateral, unallocated / unspecified 17 17%
Country / region specific 81 83%
REGIONS
Far East Asia 4 5%
Middle East 9 11%
North & Central America 0.3 0.4%
North of Sahara 0.0002 0.0002%
Oceania - 0%
South & Central Asia 20 24%
South of Sahara 48 59%
South America - 0%
Europe - 0%
SECTORS
Social Infrastructure and Services 31 31%
Economic Infrastructure and Services 0.4 0.4%
Production Sectors 1 1%
Multi-sector / Cross-cutting 5 5%
Commodity Aid / General
Programme Assistance - 0%
Humanitarian Aid 61 62%
FRAGILE / CONFLICT**
Fragile 55 83%
Other 11 17%
Denmark
* Contributions to six UN Funds and Programmes are separately identifiable in DAC members’ reporting: UNDP, UNICEF, UNRWA, WFP, UNHCR, and UNFPA. Other UN Funds and Programmes are aggregated into the ―Other UN‖ category.
** Based only on aid allocated to specific countries.

DCD/DAC(2010)32/REV1
109
European Union Institutions
Table 1: 2008 Multilateral and Non-Core Multilateral ODA
(Gross disbursements in 2008 USD millions)
Core
Contributions
Non-Core
Contributions
World Bank Group - 278
UN Funds & Programmes* 95 931
of which:
UNDP - 314
WFP - 314
UNHCR - 120
UNRWA 95 85
UNICEF - 82
UNFPA - 16
Other UN 2 476
of which:
FAO 1 79
Regional Development Banks - 65
Other Multilaterals 226 57
Total 324 1807
Figure 1: 2008 Multilateral and Non-Core Multilateral ODA
(Gross disbursements in 2008 USD millions)
0
200
400
600
800
1000
1200
World Bank Group
UN Funds & Programmes*
Other UN Regional Develoment
Banks
Other multilaterals
in 2
00
8 U
SD m
illio
ns
Core Non-core
Table 2: 2008 Non-Core Multilateral ODA by Region, Sector and Fragility Status
(in 2008 USD millions)
Bilateral, unallocated / unspecified 150 8%
Country / region specific 1,656 92%
REGIONS
Far East Asia 146 9%
Middle East 156 9%
North & Central America 24 1%
North of Sahara 48 3%
Oceania 82 5%
South & Central Asia 472 29%
South of Sahara 691 42%
South America 32 2%
Europe 4 0.3%
SECTORS
Social Infrastructure and Services 579 32%
Economic Infrastructure and Services 52 3%
Production Sectors 80 4%
Multi-sector / Cross-cutting 131 7%
Commodity Aid / General
Programme Assistance147 8%
Humanitarian Aid 818 45%
FRAGILE / CONFLICT**
Fragile 815 58%
Other 602 42%
EU Institutions
* Contributions to six UN Funds and Programmes are separately identifiable in DAC members’ reporting: UNDP, UNICEF, UNRWA, WFP, UNHCR, and UNFPA. Other UN Funds and Programmes are aggregated into the ―Other UN‖ category.
** Based only on aid allocated to specific countries.
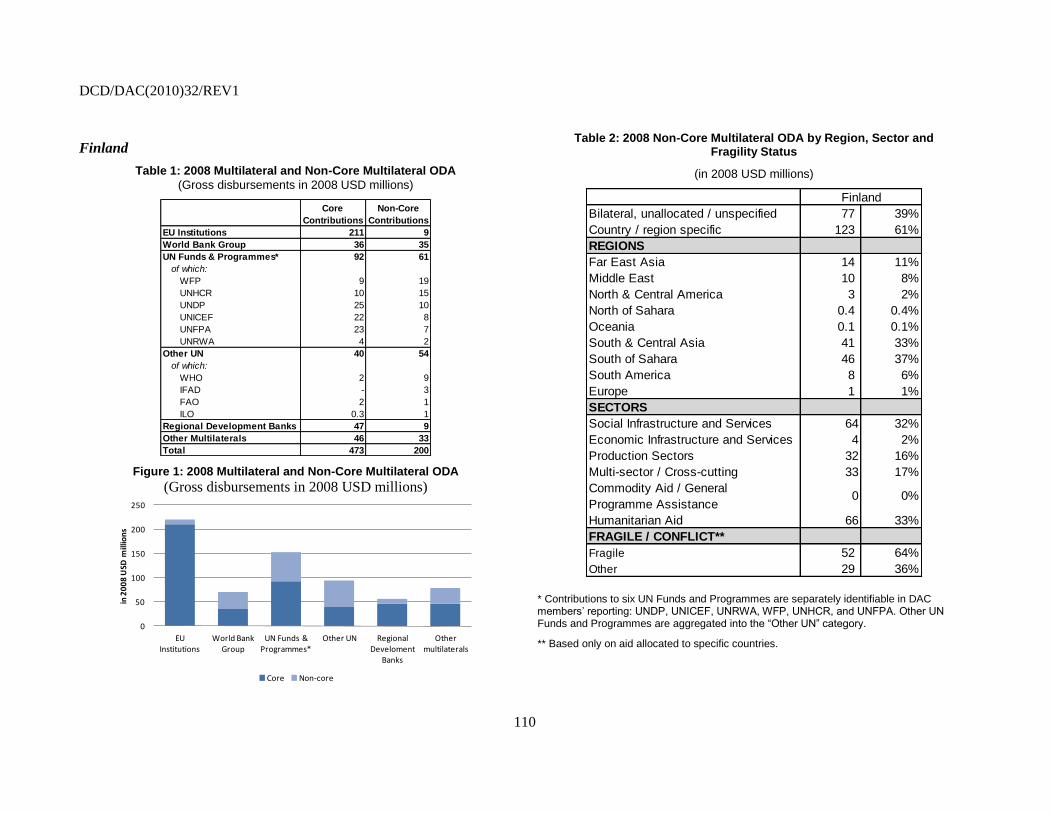
DCD/DAC(2010)32/REV1
110
Finland
Table 1: 2008 Multilateral and Non-Core Multilateral ODA
(Gross disbursements in 2008 USD millions)
Core
Contributions
Non-Core
Contributions
EU Institutions 211 9
World Bank Group 36 35
UN Funds & Programmes* 92 61
of which:
WFP 9 19
UNHCR 10 15
UNDP 25 10
UNICEF 22 8
UNFPA 23 7
UNRWA 4 2
Other UN 40 54
of which:
WHO 2 9
IFAD - 3
FAO 2 1
ILO 0.3 1
Regional Development Banks 47 9
Other Multilaterals 46 33
Total 473 200
Figure 1: 2008 Multilateral and Non-Core Multilateral ODA
(Gross disbursements in 2008 USD millions)
0
50
100
150
200
250
EU Institutions
World Bank Group
UN Funds & Programmes*
Other UN Regional Develoment
Banks
Other multilaterals
in 2
00
8 U
SD m
illio
ns
Core Non-core
Table 2: 2008 Non-Core Multilateral ODA by Region, Sector and Fragility Status
(in 2008 USD millions)
Bilateral, unallocated / unspecified 77 39%
Country / region specific 123 61%
REGIONS
Far East Asia 14 11%
Middle East 10 8%
North & Central America 3 2%
North of Sahara 0.4 0.4%
Oceania 0.1 0.1%
South & Central Asia 41 33%
South of Sahara 46 37%
South America 8 6%
Europe 1 1%
SECTORS
Social Infrastructure and Services 64 32%
Economic Infrastructure and Services 4 2%
Production Sectors 32 16%
Multi-sector / Cross-cutting 33 17%
Commodity Aid / General
Programme Assistance0 0%
Humanitarian Aid 66 33%
FRAGILE / CONFLICT**
Fragile 52 64%
Other 29 36%
Finland
* Contributions to six UN Funds and Programmes are separately identifiable in DAC members’ reporting: UNDP, UNICEF, UNRWA, WFP, UNHCR, and UNFPA. Other UN Funds and Programmes are aggregated into the ―Other UN‖ category.
** Based only on aid allocated to specific countries.

DCD/DAC(2010)32/REV1
111
France
Table 1: 2008 Multilateral and Non-Core Multilateral ODA
(Gross disbursements in 2008 USD millions)
Core
Contributions
Non-Core
Contributions
EU Institutions 2528 -
World Bank Group 540 -
UN Funds & Programmes* 102 37
of which:
WFP 5 32
UNRWA 9 4
UNICEF 18 1
Other UN 172 7
of which:
ILO 4 4
FAO 16 3
Regional Development Banks 244 -
Other Multilaterals 1056 -
Total 4643 45
Figure 1: 2008 Multilateral and Non-Core Multilateral ODA
(Gross disbursements in 2008 USD millions)
0
500
1000
1500
2000
2500
3000
EU Institutions
World Bank Group
UN Funds & Programmes*
Other UN Regional Develoment
Banks
Other multilaterals
in 2
00
8 U
SD m
illio
ns
Core Non-core
Table 2: 2008 Non-Core Multilateral ODA by Region, Sector and Fragility Status
(in 2008 USD millions)
Bilateral, unallocated / unspecified - 0%
Country / region specific 45 100%
REGIONS
Far East Asia - 0%
Middle East 8 17%
North & Central America 4 9%
North of Sahara - 0%
Oceania - 0%
South & Central Asia 6 12%
South of Sahara 27 61%
South America - 0%
Europe - 0%
SECTORS
Social Infrastructure and Services 4 9%
Economic Infrastructure and Services - 0%
Production Sectors - 0%
Multi-sector / Cross-cutting - 0%
Commodity Aid / General Programme
Assistance 41 91%
Humanitarian Aid - 0%
FRAGILE / CONFLICT**
Fragile 40 99%
Other 1 1%
France
* Contributions to six UN Funds and Programmes are separately identifiable in DAC members’ reporting: UNDP, UNICEF, UNRWA, WFP, UNHCR, and UNFPA. Other UN Funds and Programmes are aggregated into the ―Other UN‖ category.
** Based only on aid allocated to specific countries.

DCD/DAC(2010)32/REV1
112
Germany
Table 1: 2008 Multilateral and Non-Core Multilateral ODA
(Gross disbursements in 2008 USD millions)
Core
Contributions
Non-Core
Contributions
EU Institutions 2813 9
World Bank Group 1136 15
UN Funds & Programmes* 93 131
of which:
WFP - 80
UNDP 41 35
UNHCR 8 11
UNRWA 10 2
UNFPA 26 2
UNICEF 8 1
Other UN 202 66
of which:
FAO 21 14
WHO 31 10
ILO 4 8
UNESCO 14 1
Regional Development Banks 270 -
Other Multilaterals 405 128
Total 4918 349
Figure 1: 2008 Multilateral and Non-Core Multilateral ODA
(Gross disbursements in 2008 USD millions)
0
500
1000
1500
2000
2500
3000
EU Institutions
World Bank Group
UN Funds & Programmes*
Other UN Regional Develoment
Banks
Other multilaterals
in 2
00
8 U
SD m
illio
ns
Core Non-core
Table 2: 2008 Non-Core Multilateral ODA by Region, Sector and Fragility Status
(in 2008 USD millions)
Bilateral, unallocated / unspecified 99 28%
Country / region specific 250 72%
REGIONS
Far East Asia 12 5%
Middle East 22 9%
North & Central America 1 0.5%
North of Sahara 16 7%
Oceania 1 1%
South & Central Asia 101 40%
South of Sahara 91 36%
South America 6 2%
Europe 0.2 0.1%
SECTORS
Social Infrastructure and Services 111 32%
Economic Infrastructure and Services 35 10%
Production Sectors 31 9%
Multi-sector / Cross-cutting 23 7%
Commodity Aid / General Programme
Assistance33 10%
Humanitarian Aid 115 33%
FRAGILE / CONFLICT**
Fragile 140 65%
Other 75 35%
Germany
* Contributions to six UN Funds and Programmes are separately identifiable in DAC members’ reporting: UNDP, UNICEF, UNRWA, WFP, UNHCR, and UNFPA. Other UN Funds and Programmes are aggregated into the ―Other UN‖ category.
** Based only on aid allocated to specific countries.
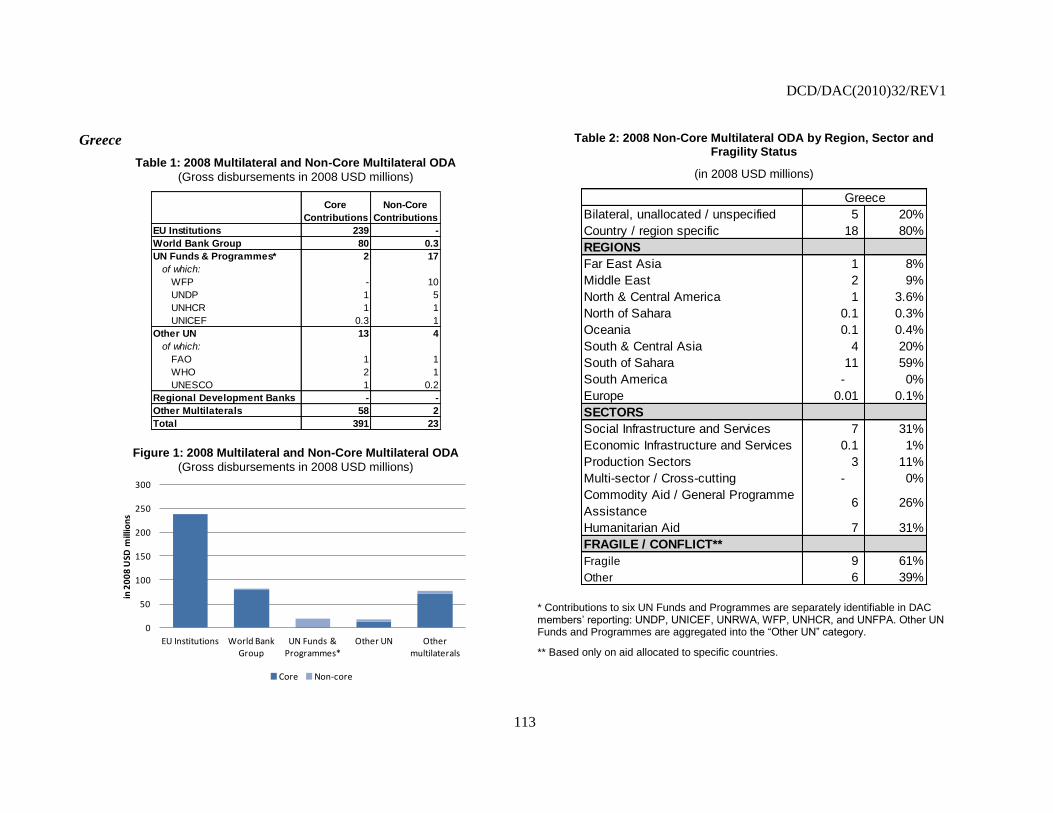
DCD/DAC(2010)32/REV1
113
Greece
Table 1: 2008 Multilateral and Non-Core Multilateral ODA
(Gross disbursements in 2008 USD millions)
Core
Contributions
Non-Core
Contributions
EU Institutions 239 -
World Bank Group 80 0.3
UN Funds & Programmes* 2 17
of which:
WFP - 10
UNDP 1 5
UNHCR 1 1
UNICEF 0.3 1
Other UN 13 4
of which:
FAO 1 1
WHO 2 1
UNESCO 1 0.2
Regional Development Banks - -
Other Multilaterals 58 2
Total 391 23
Figure 1: 2008 Multilateral and Non-Core Multilateral ODA
(Gross disbursements in 2008 USD millions)
0
50
100
150
200
250
300
EU Institutions World Bank Group
UN Funds & Programmes*
Other UN Other multilaterals
in 2
00
8 U
SD m
illio
ns
Core Non-core
Table 2: 2008 Non-Core Multilateral ODA by Region, Sector and Fragility Status
(in 2008 USD millions)
Bilateral, unallocated / unspecified 5 20%
Country / region specific 18 80%
REGIONS
Far East Asia 1 8%
Middle East 2 9%
North & Central America 1 3.6%
North of Sahara 0.1 0.3%
Oceania 0.1 0.4%
South & Central Asia 4 20%
South of Sahara 11 59%
South America - 0%
Europe 0.01 0.1%
SECTORS
Social Infrastructure and Services 7 31%
Economic Infrastructure and Services 0.1 1%
Production Sectors 3 11%
Multi-sector / Cross-cutting - 0%
Commodity Aid / General Programme
Assistance6 26%
Humanitarian Aid 7 31%
FRAGILE / CONFLICT**
Fragile 9 61%
Other 6 39%
Greece
* Contributions to six UN Funds and Programmes are separately identifiable in DAC members’ reporting: UNDP, UNICEF, UNRWA, WFP, UNHCR, and UNFPA. Other UN Funds and Programmes are aggregated into the ―Other UN‖ category.
** Based only on aid allocated to specific countries.

DCD/DAC(2010)32/REV1
114
Ireland
Table 1: 2008 Multilateral and Non-Core Multilateral ODA
(Gross disbursements in 2008 USD millions)
Core
Contributions
Non-Core
Contributions
EU Institutions 155 0.03
World Bank Group 46 31
UN Funds & Programmes* 103 87
of which:
UNDP 32 35
WFP 14 22
UNICEF 24 15
UNHCR 18 12
UNFPA 8 3
Other UN 31 81
of which:
WHO 2 13
ILO 0.3 5
FAO 1 4
UNESCO 0.4 1
Regional Development Banks 11 -
Other Multilaterals 53 16
Total 397 215
Figure 1: 2008 Multilateral and Non-Core Multilateral ODA
(Gross disbursements in 2008 USD millions)
0
20
40
60
80
100
120
140
160
180
200
EU Institutions World Bank Group
UN Funds & Programmes*
Other UN Regional Develoment
Banks
Other multilaterals
in 2
00
8 U
SD m
illio
ns
Core Non-core
Table 2: 2008 Non-Core Multilateral ODA by Region, Sector and Fragility Status
(in 2008 USD millions)
Bilateral, unallocated / unspecified 59 27%
Country / region specific 156 73%
REGIONS
Far East Asia 28 18%
Middle East 3 2%
North & Central America 1 1%
North of Sahara - 0%
Oceania 3 2%
South & Central Asia 13 8%
South of Sahara 109 70%
South America - 0%
Europe - 0%
SECTORS
Social Infrastructure and Services 82 38%
Economic Infrastructure and Services 3 1%
Production Sectors 14 6%
Multi-sector / Cross-cutting 2 1%
Commodity Aid / General Programme
Assistance1 0.4%
Humanitarian Aid 114 53%
FRAGILE / CONFLICT**
Fragile 81 72%
Other 32 28%
Ireland
* Contributions to six UN Funds and Programmes are separately identifiable in DAC members’ reporting: UNDP, UNICEF, UNRWA, WFP, UNHCR, and UNFPA. Other UN Funds and Programmes are aggregated into the ―Other UN‖ category.
** Based only on aid allocated to specific countries.
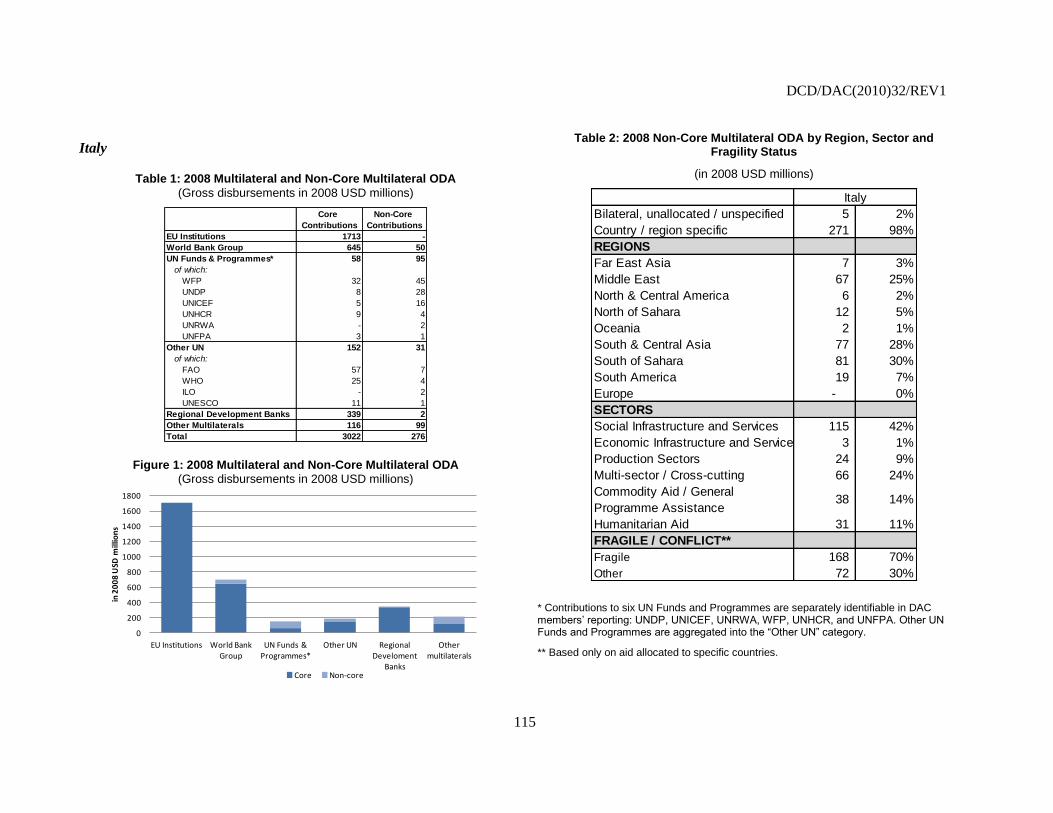
DCD/DAC(2010)32/REV1
115
Italy
Table 1: 2008 Multilateral and Non-Core Multilateral ODA
(Gross disbursements in 2008 USD millions)
Core
Contributions
Non-Core
Contributions
EU Institutions 1713 -
World Bank Group 645 50
UN Funds & Programmes* 58 95
of which:
WFP 32 45
UNDP 8 28
UNICEF 5 16
UNHCR 9 4
UNRWA - 2
UNFPA 3 1
Other UN 152 31
of which:
FAO 57 7
WHO 25 4
ILO - 2
UNESCO 11 1
Regional Development Banks 339 2
Other Multilaterals 116 99
Total 3022 276
Figure 1: 2008 Multilateral and Non-Core Multilateral ODA
(Gross disbursements in 2008 USD millions)
0
200
400
600
800
1000
1200
1400
1600
1800
EU Institutions World Bank Group
UN Funds & Programmes*
Other UN Regional Develoment
Banks
Other multilaterals
in 2
00
8 U
SD m
illio
ns
Core Non-core
Table 2: 2008 Non-Core Multilateral ODA by Region, Sector and Fragility Status
(in 2008 USD millions)
Bilateral, unallocated / unspecified 5 2%
Country / region specific 271 98%
REGIONS
Far East Asia 7 3%
Middle East 67 25%
North & Central America 6 2%
North of Sahara 12 5%
Oceania 2 1%
South & Central Asia 77 28%
South of Sahara 81 30%
South America 19 7%
Europe - 0%
SECTORS
Social Infrastructure and Services 115 42%
Economic Infrastructure and Services 3 1%
Production Sectors 24 9%
Multi-sector / Cross-cutting 66 24%
Commodity Aid / General
Programme Assistance38 14%
Humanitarian Aid 31 11%
FRAGILE / CONFLICT**
Fragile 168 70%
Other 72 30%
Italy
* Contributions to six UN Funds and Programmes are separately identifiable in DAC members’ reporting: UNDP, UNICEF, UNRWA, WFP, UNHCR, and UNFPA. Other UN Funds and Programmes are aggregated into the ―Other UN‖ category.
** Based only on aid allocated to specific countries.

DCD/DAC(2010)32/REV1
116
Japan
Table 1: 2008 Multilateral and Non-Core Multilateral ODA
(Gross disbursements in 2008 USD millions)
Core
Contributions
Non-Core
Contributions
World Bank Group 1251 0.3
UN Funds & Programmes* 147 615
of which:
WFP 10 191
UNDP 73 165
UNICEF 23 135
UNHCR 10 107
UNRWA - 9
UNFPA 31 8
Other UN 434 62
of which:
UNESCO 26 14
FAO 41 7
ILO 9 2
WHO 41 1
Regional Development Banks 581 290
Other Multilaterals 343 118
Total 2756 1085
Figure 1: 2008 Multilateral and Non-Core Multilateral ODA
(Gross disbursements in 2008 USD millions)
0
200
400
600
800
1000
1200
1400
World Bank Group
UN Funds & Programmes*
Other UN Regional Develoment
Banks
Other multilaterals
in 2
00
8 U
SD m
illio
ns
Core Non-core
Table 2: 2008 Non-Core Multilateral ODA by Region, Sector and Fragility Status
(in 2008 USD millions)
Bilateral, unallocated / unspecified 3 0%
Country / region specific 1,082 100%
REGIONS
Far East Asia 21 2%
Middle East 52 5%
North & Central America 8 1%
North of Sahara - 0%
Oceania 79 7%
South & Central Asia 168 16%
South of Sahara 753 70%
South America 1 0.1%
Europe - 0%
SECTORS
Social Infrastructure and Services 210 19%
Economic Infrastructure and Services 290 27%
Production Sectors 98 9%
Multi-sector / Cross-cutting 92 9%
Commodity Aid / General Programme
Assistance166 15%
Humanitarian Aid 228 21%
FRAGILE / CONFLICT**
Fragile 493 86%
Other 83 14%
Japan
* Contributions to six UN Funds and Programmes are separately identifiable in DAC members’ reporting: UNDP, UNICEF, UNRWA, WFP, UNHCR, and UNFPA. Other UN Funds and Programmes are aggregated into the ―Other UN‖ category.
** Based only on aid allocated to specific countries.

DCD/DAC(2010)32/REV1
117
Korea
Table 1: 2008 Multilateral and Non-Core Multilateral ODA
(Gross disbursements in 2008 USD millions)
Core
Contributions
Non-Core
Contributions
World Bank Group 79 2
UN Funds & Programmes* 9 9
of which:
UNDP 4 4
WFP 0.1 2
UNICEF 3 2
UNFPA 0.1 1
UNHCR 2 0.4
Other UN 37 13
of which:
WHO 8 2
ILO 1 1
UNESCO 3 1
FAO 3 1
IFAD 1 0.3
Regional Development Banks 126 0.2
Other Multilaterals 12 10
Total 263 33
Figure 1: 2008 Multilateral and Non-Core Multilateral ODA
(Gross disbursements in 2008 USD millions)
0
20
40
60
80
100
120
140
World Bank Group
UN Funds & Programmes*
Other UN Regional Develoment
Banks
Other multilaterals
in 2
00
8 U
SD m
illio
ns
core non-core
Table 2: 2008 Non-Core Multilateral ODA by Region, Sector and Fragility Status
(in 2008 USD millions)
Bilateral, unallocated / unspecified 13 40%
Country / region specific 20 60%
REGIONS
Far East Asia 11 57%
Middle East 0.2 1%
North & Central America 0.03 0.1%
North of Sahara - 0%
Oceania 0.3 1%
South & Central Asia 1 6%
South of Sahara 7 33%
South America 0.3 1.3%
Europe - 0%
SECTORS
Social Infrastructure and Services 12 36%
Economic Infrastructure and Services 5 14%
Production Sectors 2 6%
Multi-sector / Cross-cutting 8 23%
Commodity Aid / General
Programme Assistance2 5%
Humanitarian Aid 6 17%
FRAGILE / CONFLICT**
Fragile 4 79%
Other 1 21%
Korea
* Contributions to six UN Funds and Programmes are separately identifiable in DAC members’ reporting: UNDP, UNICEF, UNRWA, WFP, UNHCR, and UNFPA. Other UN Funds and Programmes are aggregated into the ―Other UN‖ category.
** Based only on aid allocated to specific countries.

DCD/DAC(2010)32/REV1
118
Luxembourg
Table 1: 2008 Multilateral and Non-Core Multilateral ODA
(Gross disbursements in 2008 USD millions)
Core
Contributions
Non-Core
Contributions
EU Institutions 35 0.2
World Bank Group 16 1
UN Funds & Programmes* 36 44
of which:
UNDP 12 12
UNFPA 7 11
WFP 4 9
UNHCR 3 8
UNICEF 7 3
UNRWA 3 2
Other UN 33 10
of which:
FAO 0.2 3
ILO 1 2
WHO 12 2
IFAD 1 0.2
Regional Development Banks 2 -
Other Multilaterals 15 1
Total 136 57
Figure 1: 2008 Multilateral and Non-Core Multilateral ODA
(Gross disbursements in 2008 USD millions)
0
10
20
30
40
50
60
70
80
90
EU Institutions World Bank Group
UN Funds & Programmes*
Other UN Regional Develoment
Banks
Other multilaterals
in 2
00
8 U
SD m
illio
ns
Core Non-core
Table 2: 2008 Non-Core Multilateral ODA by Region, Sector and Fragility Status
(in 2008 USD millions)
Bilateral, unallocated / unspecified 2 3%
Country / region specific 55 97%
REGIONS
Far East Asia 10 18%
Middle East 2 3%
North & Central America 3 5.8%
North of Sahara - 0%
Oceania 0.2 0.4%
South & Central Asia 7 12%
South of Sahara 33 60%
South America 1 1%
Europe - 0%
SECTORS
Social Infrastructure and Services 29 51%
Economic Infrastructure and Services 1 1%
Production Sectors 4 7%
Multi-sector / Cross-cutting 0.4 1%
Commodity Aid / General
Programme Assistance3 5%
Humanitarian Aid 20 36%
FRAGILE / CONFLICT**
Fragile 16 32%
Other 35 68%
Luxembourg
* Contributions to six UN Funds and Programmes are separately identifiable in DAC members’ reporting: UNDP, UNICEF, UNRWA, WFP, UNHCR, and UNFPA. Other UN Funds and Programmes are aggregated into the ―Other UN‖ category.
** Based only on aid allocated to specific countries.
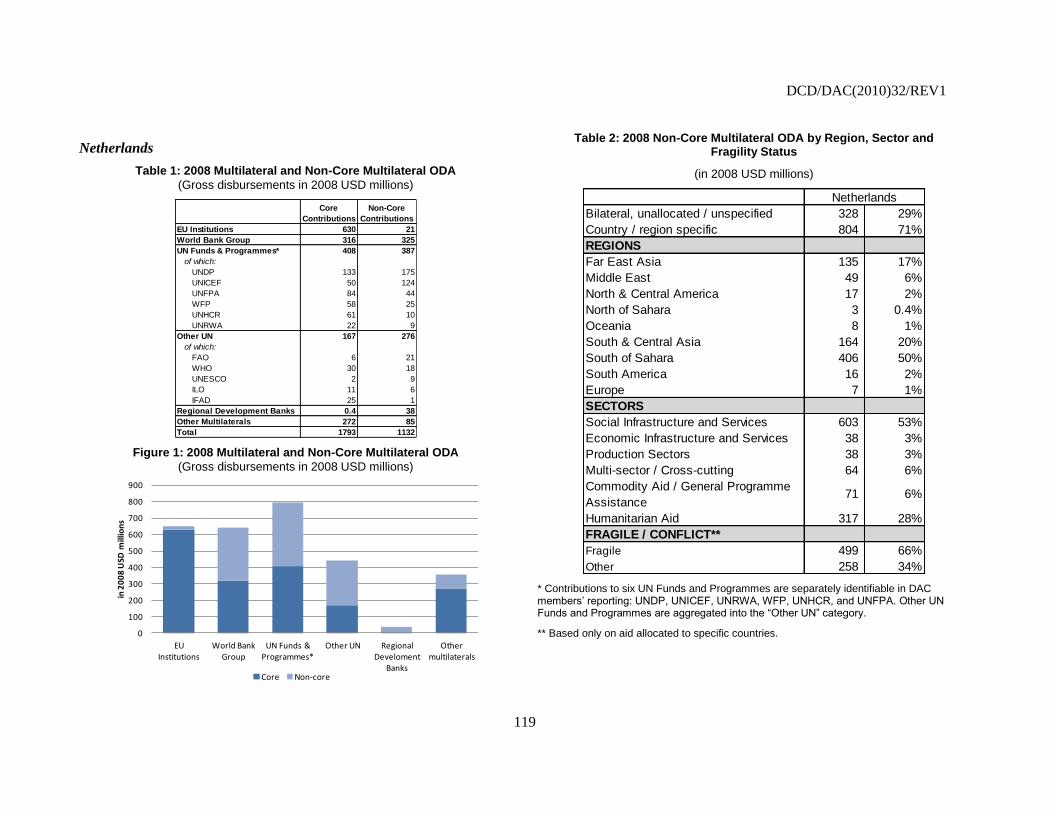
DCD/DAC(2010)32/REV1
119
Netherlands
Table 1: 2008 Multilateral and Non-Core Multilateral ODA
(Gross disbursements in 2008 USD millions)
Core
Contributions
Non-Core
Contributions
EU Institutions 630 21
World Bank Group 316 325
UN Funds & Programmes* 408 387
of which:
UNDP 133 175
UNICEF 50 124
UNFPA 84 44
WFP 58 25
UNHCR 61 10
UNRWA 22 9
Other UN 167 276
of which:
FAO 6 21
WHO 30 18
UNESCO 2 9
ILO 11 6
IFAD 25 1
Regional Development Banks 0.4 38
Other Multilaterals 272 85
Total 1793 1132
Figure 1: 2008 Multilateral and Non-Core Multilateral ODA
(Gross disbursements in 2008 USD millions)
0
100
200
300
400
500
600
700
800
900
EU Institutions
World Bank Group
UN Funds & Programmes*
Other UN Regional Develoment
Banks
Other multilaterals
in 2
00
8 U
SD m
illio
ns
Core Non-core
Table 2: 2008 Non-Core Multilateral ODA by Region, Sector and Fragility Status
(in 2008 USD millions)
Bilateral, unallocated / unspecified 328 29%
Country / region specific 804 71%
REGIONS
Far East Asia 135 17%
Middle East 49 6%
North & Central America 17 2%
North of Sahara 3 0.4%
Oceania 8 1%
South & Central Asia 164 20%
South of Sahara 406 50%
South America 16 2%
Europe 7 1%
SECTORS
Social Infrastructure and Services 603 53%
Economic Infrastructure and Services 38 3%
Production Sectors 38 3%
Multi-sector / Cross-cutting 64 6%
Commodity Aid / General Programme
Assistance71 6%
Humanitarian Aid 317 28%
FRAGILE / CONFLICT**
Fragile 499 66%
Other 258 34%
Netherlands
* Contributions to six UN Funds and Programmes are separately identifiable in DAC members’ reporting: UNDP, UNICEF, UNRWA, WFP, UNHCR, and UNFPA. Other UN Funds and Programmes are aggregated into the ―Other UN‖ category.
** Based only on aid allocated to specific countries.
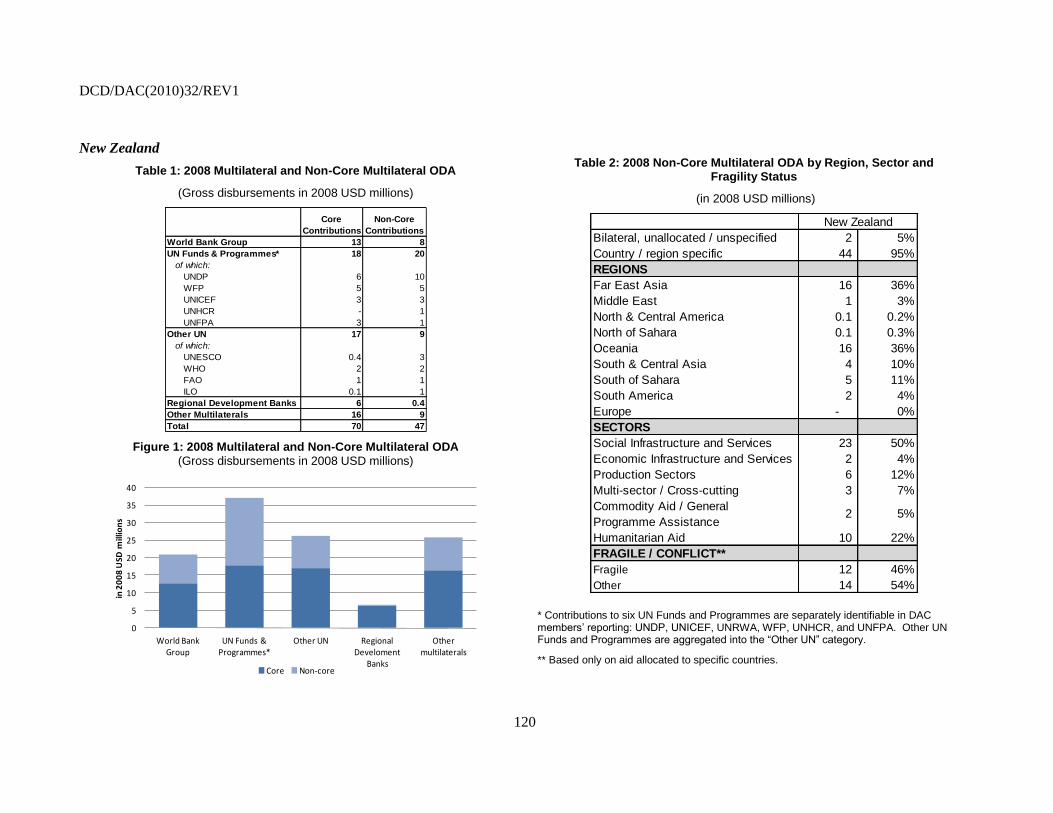
DCD/DAC(2010)32/REV1
120
New Zealand
Table 1: 2008 Multilateral and Non-Core Multilateral ODA
(Gross disbursements in 2008 USD millions)
Core
Contributions
Non-Core
Contributions
World Bank Group 13 8
UN Funds & Programmes* 18 20
of which:
UNDP 6 10
WFP 5 5
UNICEF 3 3
UNHCR - 1
UNFPA 3 1
Other UN 17 9
of which:
UNESCO 0.4 3
WHO 2 2
FAO 1 1
ILO 0.1 1
Regional Development Banks 6 0.4
Other Multilaterals 16 9
Total 70 47
Figure 1: 2008 Multilateral and Non-Core Multilateral ODA
(Gross disbursements in 2008 USD millions)
0
5
10
15
20
25
30
35
40
World Bank Group
UN Funds & Programmes*
Other UN Regional Develoment
Banks
Other multilaterals
in 2
00
8 U
SD m
illio
ns
Core Non-core
Table 2: 2008 Non-Core Multilateral ODA by Region, Sector and Fragility Status
(in 2008 USD millions)
Bilateral, unallocated / unspecified 2 5%
Country / region specific 44 95%
REGIONS
Far East Asia 16 36%
Middle East 1 3%
North & Central America 0.1 0.2%
North of Sahara 0.1 0.3%
Oceania 16 36%
South & Central Asia 4 10%
South of Sahara 5 11%
South America 2 4%
Europe - 0%
SECTORS
Social Infrastructure and Services 23 50%
Economic Infrastructure and Services 2 4%
Production Sectors 6 12%
Multi-sector / Cross-cutting 3 7%
Commodity Aid / General
Programme Assistance2 5%
Humanitarian Aid 10 22%
FRAGILE / CONFLICT**
Fragile 12 46%
Other 14 54%
New Zealand
* Contributions to six UN Funds and Programmes are separately identifiable in DAC members’ reporting: UNDP, UNICEF, UNRWA, WFP, UNHCR, and UNFPA. Other UN Funds and Programmes are aggregated into the ―Other UN‖ category.
** Based only on aid allocated to specific countries.
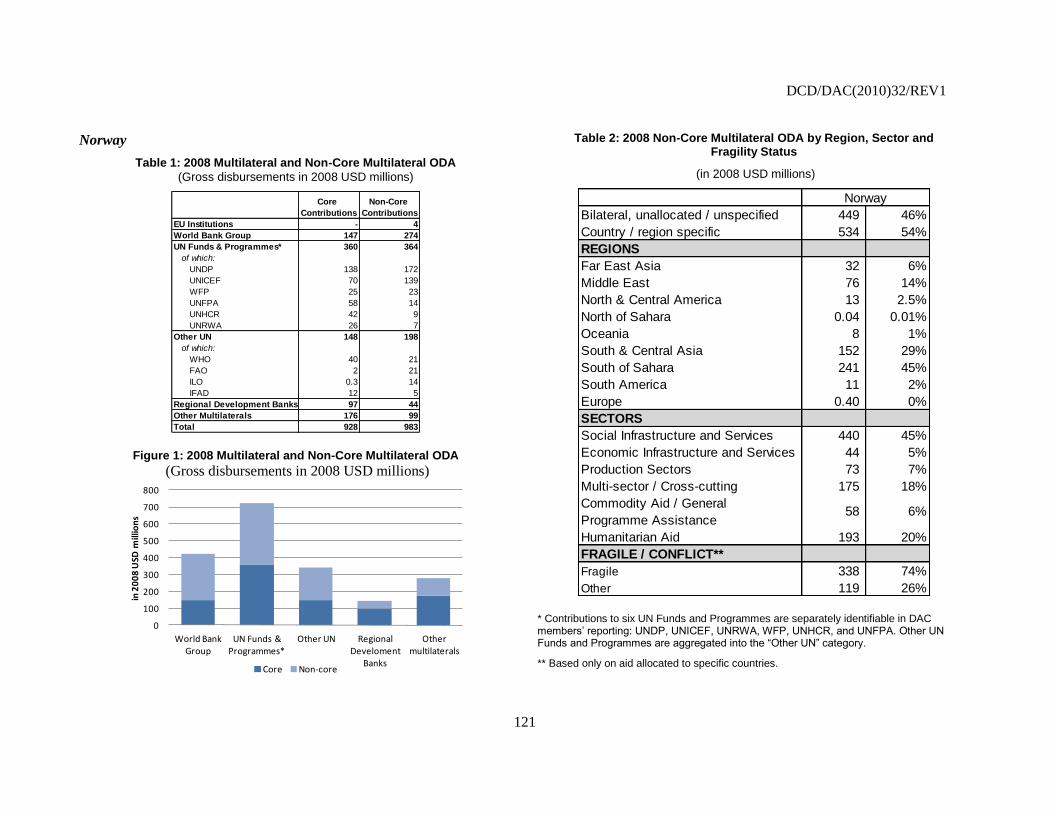
DCD/DAC(2010)32/REV1
121
Norway
Table 1: 2008 Multilateral and Non-Core Multilateral ODA
(Gross disbursements in 2008 USD millions)
Core
Contributions
Non-Core
Contributions
EU Institutions - 4
World Bank Group 147 274
UN Funds & Programmes* 360 364
of which:
UNDP 138 172
UNICEF 70 139
WFP 25 23
UNFPA 58 14
UNHCR 42 9
UNRWA 26 7
Other UN 148 198
of which:
WHO 40 21
FAO 2 21
ILO 0.3 14
IFAD 12 5
Regional Development Banks 97 44
Other Multilaterals 176 99
Total 928 983
Figure 1: 2008 Multilateral and Non-Core Multilateral ODA
(Gross disbursements in 2008 USD millions)
0
100
200
300
400
500
600
700
800
World Bank Group
UN Funds & Programmes*
Other UN Regional Develoment
Banks
Other multilaterals
in 2
00
8 U
SD m
illio
ns
Core Non-core
Table 2: 2008 Non-Core Multilateral ODA by Region, Sector and Fragility Status
(in 2008 USD millions)
Bilateral, unallocated / unspecified 449 46%
Country / region specific 534 54%
REGIONS
Far East Asia 32 6%
Middle East 76 14%
North & Central America 13 2.5%
North of Sahara 0.04 0.01%
Oceania 8 1%
South & Central Asia 152 29%
South of Sahara 241 45%
South America 11 2%
Europe 0.40 0%
SECTORS
Social Infrastructure and Services 440 45%
Economic Infrastructure and Services 44 5%
Production Sectors 73 7%
Multi-sector / Cross-cutting 175 18%
Commodity Aid / General
Programme Assistance58 6%
Humanitarian Aid 193 20%
FRAGILE / CONFLICT**
Fragile 338 74%
Other 119 26%
Norway
* Contributions to six UN Funds and Programmes are separately identifiable in DAC members’ reporting: UNDP, UNICEF, UNRWA, WFP, UNHCR, and UNFPA. Other UN Funds and Programmes are aggregated into the ―Other UN‖ category.
** Based only on aid allocated to specific countries.

DCD/DAC(2010)32/REV1
122
Portugal
Table 1: 2008 Multilateral and Non-Core Multilateral ODA
(Gross disbursements in 2008 USD millions)
Core
Contributions
Non-Core
Contributions
EU Institutions 160 1
World Bank Group 41 1
UN Funds & Programmes* 4 3
of which:
UNDP 2 3
UNRWA - 0.1
UNHCR 2 0.1
Other UN 7 25
of which:
ILO 0.3 1
Regional Development Banks 24 -
Other Multilaterals 11 0.4
Total 247 31
Figure 1: 2008 Multilateral and Non-Core Multilateral ODA
(Gross disbursements in 2008 USD millions)
0
20
40
60
80
100
120
140
160
180
EU Institutions
World Bank Group
UN Funds & Programmes*
Other UN Regional Develoment
Banks
Other multilaterals
in 2
00
8 U
SD m
illio
ns
Core Non-core
Table 2: 2008 Non-Core Multilateral ODA by Region, Sector and Fragility Status
(in 2008 USD millions)
Bilateral, unallocated / unspecified 1 4%
Country / region specific 30 96%
REGIONS
Far East Asia 18 62%
Middle East 0.1 0.3%
North & Central America 0.2 0.6%
North of Sahara - 0%
Oceania 1 3%
South & Central Asia 3 12%
South of Sahara 7 22%
South America - 0%
Europe - 0%
SECTORS
Social Infrastructure and Services 29 95%
Economic Infrastructure and Services 0.1 0.3%
Production Sectors - 0%
Multi-sector / Cross-cutting 1 2%
Commodity Aid / General Programme
Assistance- 0%
Humanitarian Aid 1 3%
FRAGILE / CONFLICT**
Fragile 23 82%
Other 5 18%
Portugal
* Contributions to six UN Funds and Programmes are separately identifiable in DAC members’ reporting: UNDP, UNICEF, UNRWA, WFP, UNHCR, and UNFPA. Other UN Funds and Programmes are aggregated into the ―Other UN‖ category.
** Based only on aid allocated to specific countries.

DCD/DAC(2010)32/REV1
123
Spain
Table 1: 2008 Multilateral and Non-Core Multilateral ODA
(Gross disbursements in 2008 USD millions)
Core
Contributions
Non-Core
Contributions
EU Institutions 1037 37
World Bank Group 342 210
UN Funds & Programmes* 149 696
of which:
UNDP 61 414
UNICEF 26 109
WFP 15 106
UNFPA 20 33
UNHCR 15 20
UNRWA 12 14
Other UN 118 296
of which:
FAO 6 60
UNESCO 4 18
ILO 1 12
IFAD 7 5
Regional Development Banks 183 462
Other Multilaterals 237 213
Total 2065 1913
Figure 1: 2008 Multilateral and Non-Core Multilateral ODA
(Gross disbursements in 2008 USD millions)
0
200
400
600
800
1000
1200
EU Institutions
World Bank Group
UN Funds & Programmes*
Other UN Regional Develoment
Banks
Other multilaterals
in U
SD 2
00
8 m
illio
ns
Core Non-core
Table 2: 2008 Non-Core Multilateral ODA by Region, Sector and Fragility Status
(in 2008 USD millions)
Bilateral, unallocated / unspecified 337 18%
Country / region specific 1,575 82%
REGIONS
Far East Asia 128 8%
Middle East 94 6%
North & Central America 109 7%
North of Sahara 24 2%
Oceania 23 1%
South & Central Asia 82 5%
South of Sahara 442 28%
South America 672 43%
Europe 2 0%
SECTORS
Social Infrastructure and Services 1,106 58%
Economic Infrastructure and Services 52 3%
Production Sectors 64 3%
Multi-sector / Cross-cutting 142 7%
Commodity Aid / General Programme
Assistance78 4%
Humanitarian Aid 471 25%
FRAGILE / CONFLICT**
Fragile 353 50%
Other 353 50%
Spain
* Contributions to six UN Funds and Programmes are separately identifiable in DAC members’ reporting: UNDP, UNICEF, UNRWA, WFP, UNHCR, and UNFPA. Other UN Funds and Programmes are aggregated into the ―Other UN‖ category.
** Based only on aid allocated to specific countries.
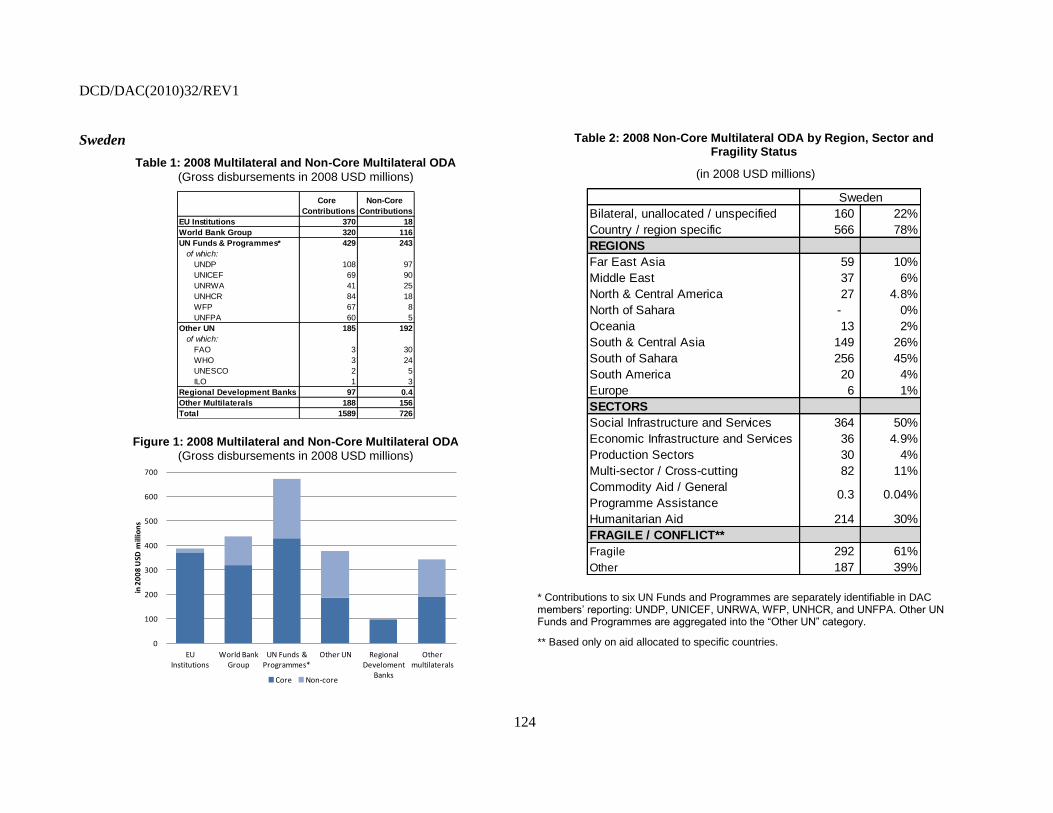
DCD/DAC(2010)32/REV1
124
Sweden
Table 1: 2008 Multilateral and Non-Core Multilateral ODA
(Gross disbursements in 2008 USD millions)
Core
Contributions
Non-Core
Contributions
EU Institutions 370 18
World Bank Group 320 116
UN Funds & Programmes* 429 243
of which:
UNDP 108 97
UNICEF 69 90
UNRWA 41 25
UNHCR 84 18
WFP 67 8
UNFPA 60 5
Other UN 185 192
of which:
FAO 3 30
WHO 3 24
UNESCO 2 5
ILO 1 3
Regional Development Banks 97 0.4
Other Multilaterals 188 156
Total 1589 726
Figure 1: 2008 Multilateral and Non-Core Multilateral ODA
(Gross disbursements in 2008 USD millions)
0
100
200
300
400
500
600
700
EU Institutions
World Bank Group
UN Funds & Programmes*
Other UN Regional Develoment
Banks
Other multilaterals
in 2
00
8 U
SD m
illio
ns
Core Non-core
Table 2: 2008 Non-Core Multilateral ODA by Region, Sector and Fragility Status
(in 2008 USD millions)
Bilateral, unallocated / unspecified 160 22%
Country / region specific 566 78%
REGIONS
Far East Asia 59 10%
Middle East 37 6%
North & Central America 27 4.8%
North of Sahara - 0%
Oceania 13 2%
South & Central Asia 149 26%
South of Sahara 256 45%
South America 20 4%
Europe 6 1%
SECTORS
Social Infrastructure and Services 364 50%
Economic Infrastructure and Services 36 4.9%
Production Sectors 30 4%
Multi-sector / Cross-cutting 82 11%
Commodity Aid / General
Programme Assistance0.3 0.04%
Humanitarian Aid 214 30%
FRAGILE / CONFLICT**
Fragile 292 61%
Other 187 39%
Sweden
* Contributions to six UN Funds and Programmes are separately identifiable in DAC members’ reporting: UNDP, UNICEF, UNRWA, WFP, UNHCR, and UNFPA. Other UN Funds and Programmes are aggregated into the ―Other UN‖ category.
** Based only on aid allocated to specific countries.

DCD/DAC(2010)32/REV1
125
Switzerland
Table 1: 2008 Multilateral and Non-Core Multilateral ODA
(Gross disbursements in 2008 USD millions)
Core
Contributions
Non-Core
Contributions
EU Institutions - 0.4
World Bank Group 186 49
UN Funds & Programmes* 107 81
of which:
WFP 2 43
UNDP 49 17
UNHCR 11 12
UNICEF 18 4
UNRWA 14 4
UNFPA 13 0.3
Other UN 51 45
of which:
FAO 3 5
WHO 10 4
ILO 1 2
UNESCO 2 0.4
IFAD 6 0.05
Regional Development Banks 59 2
Other Multilaterals 85 32
Total 487 209
Figure 1: 2008 Multilateral and Non-Core Multilateral ODA
(Gross disbursements in 2008 USD millions)
0
50
100
150
200
250
World Bank Group
UN Funds & Programmes*
Other UN Regional Develoment
Banks
Other multilaterals
in 2
00
8 U
SD m
illio
ns
Core Non-core
Table 2: 2008 Non-Core Multilateral ODA by Region, Sector and Fragility Status
(in 2008 USD millions)
Bilateral, unallocated / unspecified 63 30%
Country / region specific 146 70%
REGIONS
Far East Asia 15 11%
Middle East 11 8%
North & Central America 9 6.5%
North of Sahara 3 2%
Oceania 6 4%
South & Central Asia 46 32%
South of Sahara 46 32%
South America 8 5%
Europe - 0%
SECTORS
Social Infrastructure and Services 55 26%
Economic Infrastructure and Services 34 16.2%
Production Sectors 25 12%
Multi-sector / Cross-cutting 20 10%
Commodity Aid / General Programme
Assistance0.2 0.1%
Humanitarian Aid 75 36%
FRAGILE / CONFLICT**
Fragile 64 52%
Other 59 48%
Switzerland
* Contributions to six UN Funds and Programmes are separately identifiable in DAC members’ reporting: UNDP, UNICEF, UNRWA, WFP, UNHCR, and UNFPA. Other UN Funds and Programmes are aggregated into the ―Other UN‖ category.
** Based only on aid allocated to specific countries.

DCD/DAC(2010)32/REV1
126
United Kingdom
Table 1: 2008 Multilateral and Non-Core Multilateral ODA
(Gross disbursements in 2008 USD millions)
Core
Contributions
Non-Core
Contributions
EU Institutions 2034 7
World Bank Group 1072 674
UN Funds & Programmes* 268 640
of which:
UNDP 156 314
UNICEF 38 175
WFP 5 109
UNFPA 0 24
UNHCR 36 18
Other UN 201 165
of which:
WHO 42 38
IFAD 28 10
FAO 6 5
ILO 6 1.3
UNESCO 10 0.5
Regional Development Banks 304 54
Other Multilaterals 287 15
Total 4167 1554
Figure 1: 2008 Multilateral and Non-Core Multilateral ODA
(Gross disbursements in 2008 USD millions)
0
500
1000
1500
2000
2500
EU Institutions
World Bank Group
UN Funds & Programmes*
Other UN Regional Develoment
Banks
Other multilaterals
in 2
00
8 m
illio
ns
USD
Core Non-core
Table 2: 2008 Non-Core Multilateral ODA by Region, Sector and Fragility Status
(in 2008 USD millions)
Bilateral, unallocated / unspecified 293 19%
Country / region specific 1,261 81%
REGIONS
Far East Asia 132 11%
Middle East 95 8%
North & Central America 15 1%
North of Sahara - 0%
Oceania 0.4 0.03%
South & Central Asia 398 33%
South of Sahara 583 48%
South America 1 0.1%
Europe - 0%
SECTORS
Social Infrastructure and Services 906 58%
Economic Infrastructure and Services 86 6%
Production Sectors 76 5%
Multi-sector / Cross-cutting 43 3%
Commodity Aid / General Programme
Assistance32 2%
Humanitarian Aid 411 26%
FRAGILE / CONFLICT**
Fragile 839 72%
Other 328 28%
United Kingdom
* Contributions to six UN Funds and Programmes are separately identifiable in DAC members’ reporting: UNDP, UNICEF, UNRWA, WFP, UNHCR, and UNFPA. Other UN Funds and Programmes are aggregated into the ―Other UN‖ category.
** Based only on aid allocated to specific countries.
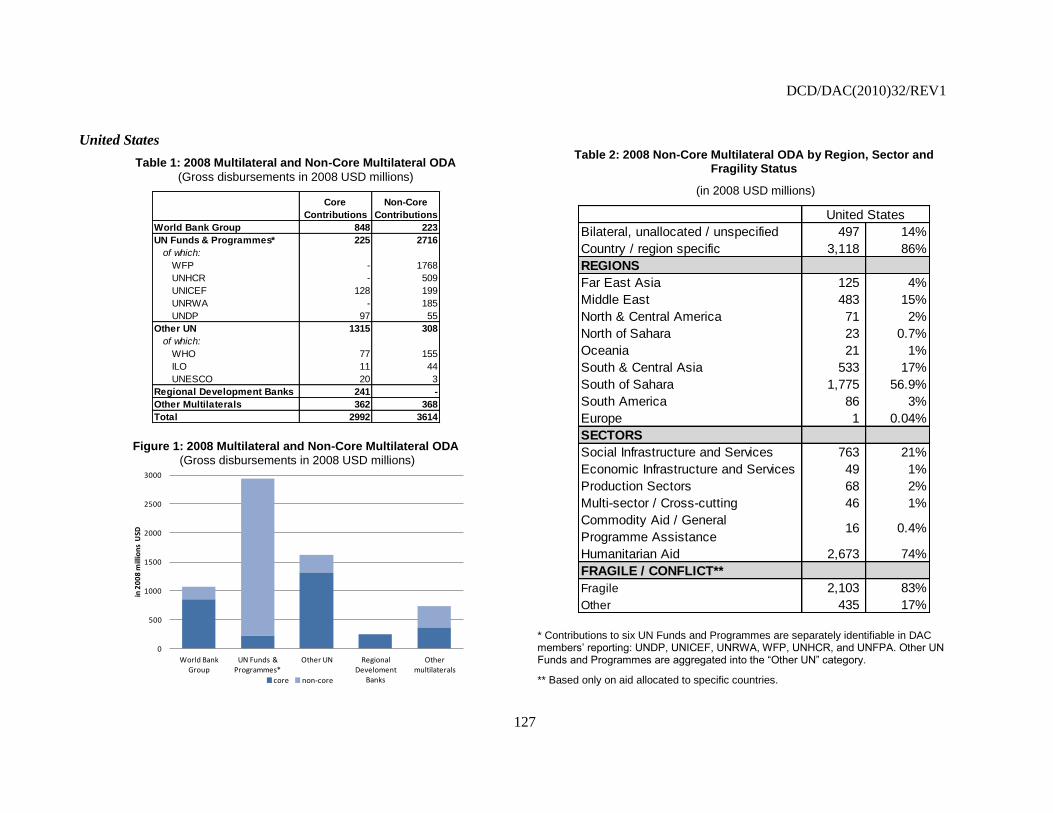
DCD/DAC(2010)32/REV1
127
United States
Table 1: 2008 Multilateral and Non-Core Multilateral ODA
(Gross disbursements in 2008 USD millions)
Core
Contributions
Non-Core
Contributions
World Bank Group 848 223
UN Funds & Programmes* 225 2716
of which:
WFP - 1768
UNHCR - 509
UNICEF 128 199
UNRWA - 185
UNDP 97 55
Other UN 1315 308
of which:
WHO 77 155
ILO 11 44
UNESCO 20 3
Regional Development Banks 241 -
Other Multilaterals 362 368
Total 2992 3614
Figure 1: 2008 Multilateral and Non-Core Multilateral ODA
(Gross disbursements in 2008 USD millions)
0
500
1000
1500
2000
2500
3000
World Bank Group
UN Funds & Programmes*
Other UN Regional Develoment
Banks
Other multilaterals
in 2
00
8 m
illio
ns
USD
core non-core
Table 2: 2008 Non-Core Multilateral ODA by Region, Sector and
Fragility Status
(in 2008 USD millions)
Bilateral, unallocated / unspecified 497 14%
Country / region specific 3,118 86%
REGIONS
Far East Asia 125 4%
Middle East 483 15%
North & Central America 71 2%
North of Sahara 23 0.7%
Oceania 21 1%
South & Central Asia 533 17%
South of Sahara 1,775 56.9%
South America 86 3%
Europe 1 0.04%
SECTORS
Social Infrastructure and Services 763 21%
Economic Infrastructure and Services 49 1%
Production Sectors 68 2%
Multi-sector / Cross-cutting 46 1%
Commodity Aid / General
Programme Assistance16 0.4%
Humanitarian Aid 2,673 74%
FRAGILE / CONFLICT**
Fragile 2,103 83%
Other 435 17%
United States
* Contributions to six UN Funds and Programmes are separately identifiable in DAC members’ reporting: UNDP, UNICEF, UNRWA, WFP, UNHCR, and UNFPA. Other UN Funds and Programmes are aggregated into the ―Other UN‖ category.
** Based only on aid allocated to specific countries.

DCD/DAC(2010)32/REV1
128
ANNEX 3
Table 1: Potential Source of Climate Change Funding
Option
Esti
mat
ed
An
nu
al
Re
ven
ue
(bil
lio
n U
SD)
Spe
cifi
c to
Mit
igat
ion
,
Ad
apta
tio
n
or
Tech
no
logy
Un
de
r th
e
Co
nve
nti
on
De
fin
ed
Co
ntr
ibu
tio
n
Go
th
rou
gh
Go
vern
me
nt
Bu
dge
t
The GEF Trust Fund Currently 0.25 N Y Y Y
SCCF and LDCF Currently 0.10 A Y N Y
The CDM and Other Possible Crediting Currently 3-10 M Y N N
The Adaptation Fund 0.50-2 A Y N N
Cool Earth Initiative 2 N N N Y
International Climate Protection Initiative 0.15 N N Y Y
Clean Investment Fund 1-2 N N N Y
Convention Adaptation Fund, Technology
Fund, and Insurance Mechanism
N Y Y Y
Adaptation Fund and Multilateral Technology
Acquisition Fund
170 N Y Y Y
Efficiency Penny 20 M N Y Y
World Climate Change Fund 10 N Y Y Y
Multilateral Adaptation Fund 18 A Y Y Y
Auction of Assigned Amount Units 5 A Y Y N
Nationally Appropriate Mitigation Actions M Y N N
Extension of the 2% levy on CDM to other
Market Mechanisms
0.5 or 5 N Y Y N
International Air Travel Adaptation Levy 13 A N Y N
International Maritime Emission Reduction 3 N N Y N
Auction of Allowances for International
Aviation and Marine Emissions
20 to 40 N N N N
Funds to Invest Foreign Exchange Reserves Fund of up to
200
M N N N
Access to Renewables Programmes in
Developed Countries
0.5 M N N N
Tobin Tax 15 to 20 N N Y N
Donated Special Drawing Rights 18 N N N N
Debt-for-clean-energy Swap M N N Y
Proposals Funded by defined Contributions from Developed Countries
Increasing the Scale of Existing Mechanisms
Proposals Funded by Contributions from Developed and Developing Countries
More Stringent Commitments by Developed Countries
Other Sources of Funds
New Bilateral and Multilateral Funds
Source: Haites (2008). ―Negotiations on Additional Investment and Financial Flows to Address Climate Change in Developing Countries,‖ UNDP. New York, July, Table 6, p. 35
Note: A = Adaptation, M = Mitigation, N = No, and Y = Yes
DCD/DAC(2010)32/REV1
129
Chinese +0.5%-1% GDP Proposal: Developed countries should annually provide financial support to
support actions by developing countries to address climate change. This would lead to USD 185-402z billion
per annum.
Mexican Multilateral Climate Change Fund: Withdrawals limited to countries that contribute amounts
to be determined by a formula based on current GHG emissions, population and gross domestic product. It
would aim to mobilise no less than USD 10 billion per annum. LDCs would have a quota of the revenue at
their disposal without being expected to contribute.
Carbon Auction Levy: Auction a percentage of annual emission allowances for climate change
activities.
Clean Development Mechanism: Defined in Article 12 of the Protocol, it helps finance mitigation
actions in developing countries through the sale of credits (CERs), each equivalent to one tonne of CO2, for
the certified emission reductions achieved. The credits issued for each project and the market price of CERs
are readily available, but buyers often contract to purchase credits generated over a number of years early in
the life of a project. Two percent of the share of proceeds of CERs issued for a CDM project activity goes to
the Adaptation Fund. As of 16 September 2009, 1.13 million CERs had been sold, generating approximately
USD 18.7 million in revenues.
Export credit agencies (ECAs) typically provide loans or guarantees to facilitate exports to riskier
markets.74
Net export credits provided by or on behalf of OECD governments to developing countries are
reported to the OECD. Long-term credits (a repayment term of 5 years or more) are reported with sector detail
so it is possible to estimate the credits going to mitigation relevant sectors. Between 2002 and 2008 an average
of USD 16.9 billion annually (54% of the total) flowed to mitigation relevant sectors. As in the case of ODA,
not all of the funds going to mitigation relevant sectors are for mitigation. For example, less than 20% of the
credits for the energy sector go to ―low-carbon energy technologies‖ including nuclear, hydro, geothermal,
solar, wind, tidal and biomass.
Swiss Proposal Global Carbon Adaptation Tax Proposal: Uniform global carbon tax of USD 2 per ton
of CO2 on all fossil fuel emissions. Countries emitting less than 1.5 tons CO2 would be exempt from the tax.
Expected revenues would be USD 48.5 billion per annum.
EU Global Climate Financing Mechanism: Building on the International Financing Facility, expand the
global carbon market by issuing bonds to capital markets against legally binding pledges for future repayment
by (donor) countries to frontload funding.
Norwegian Proposal: At the international level, a small portion of ―assigned amount units‖ could be
withheld from national quota allocation and auctioned by the appropriate institution. Expected revenues would
be USD 14 billion per annum.
Burden Sharing Mechanism (Tuvalu Adaptation Blueprint): A collection of levies on international
aviation and maritime transport. Expected to raise USD 40 million from Annex 2 and USD 30 million from
non-Annex 1.
74
Corfee-Morlot, J., B. Guay and K.M. Larsen, 2009. Financing Mitigation Support: Towards a Framework for
Measurement, Reporting and Verification, COM/ENV/EPOC/IEA/SLT(2009)6, OECD/IEA, Paris, Section 3.1.4, p.
21.
DCD/DAC(2010)32/REV1
130
International Air Travel Adaptation Levy: Levy funds from polluting individuals better off to help the
less well-off victims of their pollution purely on grounds. Expected to raise USD 8-10 billion per annum.
International Maritime Emission Reduction Schemes: Global bunker levy using the global average
price of carbon to achieve GHG emission reductions through the maritime industry and raise USD 9 billion
annually if applied world-wide.
Source: UNFCCC website, Müller (2008), ―International Adaptation Finance‖ and www.climatefundsupdate.org
Rio markers for climate change
When developed countries signed the three Rio Conventions in 1992, they agreed to support developing
countries in the implementation of these Conventions. For the purposes of this report, monitoring data relative
to the UN Framework Convention on Climate Change is the most relevant. Since 1998, the DAC has
monitored aid targeting the objectives of the Rio Conventions by integrating the ―Rio markers‖ into its
Creditor Reporting System (CRS).
At the end of 2009, the World Bank started reporting its multilateral outflows using the Rio (climate
change) marker. Other multilateral institutions (with the exception of EU Institutions) do not use the markers,
but may choose to do so in the future. Other multilateral donors do not report data using the Rio markers. As
with all policy markers, the Rio markers are not applicable to general budget support, which, by definition, is
not allocated by sector. To date, Japan and Germany combined account for the majority of flows marked for
climate change. While adaptation activities are not yet separately identifiable in DAC statistics, members are
working on a statistical marker to identify investments targeting climate change adaptation.
The graph below shows trends in climate change aid of DAC members (including the EC) and the World
Bank outflows. In 2008, total activities marked for climate change equal USD 7.7 billion, representing about
10.5% of total ODA that year. Given the relatively recent introduction of the climate change marker, however,
it is difficult to determine trends at this early stage.

DCD/DAC(2010)32/REV1
131
Figure 1
0%
1%
2%
3%
4%
5%
6%
7%
8%
9%
10%
11%
0.0
1.0
2.0
3.0
4.0
5.0
6.0
7.0
8.0
9.0
1999 2000 2001 2002 2003 2004 2005 2006 2007 2008
% o
f sec
tor a
lloca
ble
ODA
in co
nsta
nt 2
007
USD
billi
ons
Climate change marker Climate Change as % of sector allocable ODA (right axis)
Source: DAC Aggregates and Creditor Reporting System.
Note: Does not include data for 1998 to 2001 from a special pilot study in 2002, which would increase the amounts from 1999-2001.Does not include data from Korea, which recorded USD 205 million for mitigation in 2008, or the World Bank (IDA), which for the years above disbursed USD 244 million marked for climate change mitigation.
In practice, there are some limitations to the climate change marker because it is applicable only to
mitigation75
, not adaptation flows (which are efforts to adapt as a result of climate change and not as an effort
to change it). The DAC Secretariat is currently deciding how to implement the newly-agreed adaptation
marker. In addition, multilateral agencies (apart from the EC and the World Bank) do not use the marker when
they report their flows to the DAC.
The Rio markers were in a long pilot phase, and reporting is yet incomplete: three members (Norway,
Luxembourg and the United States) do not report on climate change markers to the CRS over the period 2005-
8. One should also be careful in comparing data across countries since each member could interpret the
definition and its application differently, which is why this information is not given for a cross-country
comparison in this report. Nonetheless, marker data gives a best estimate of the policy objectives of aid, even
if it does not allow for an automatic quantification of these flows.
75
While the Rio marker on climate change refers primarily to mitigation, examples of typical activities included in the
definition could also be considered adaptation, making it all the more ambiguous for reporters to determine just what
to include in this category.
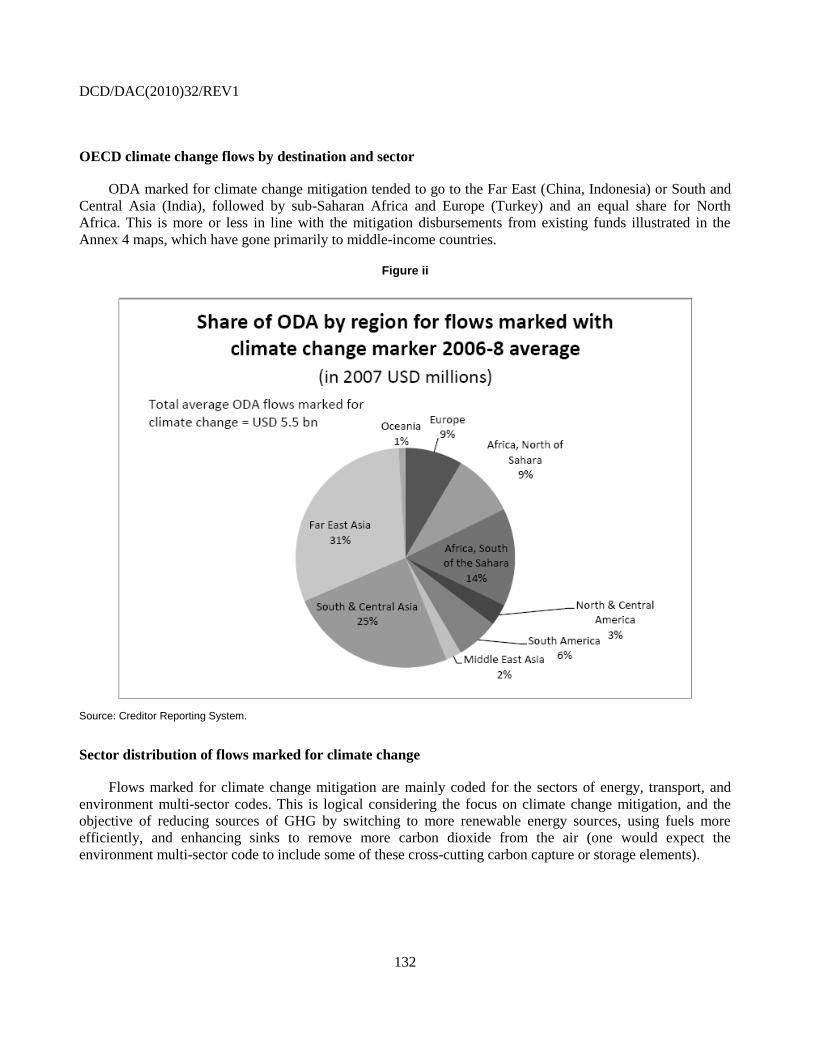
DCD/DAC(2010)32/REV1
132
OECD climate change flows by destination and sector
ODA marked for climate change mitigation tended to go to the Far East (China, Indonesia) or South and
Central Asia (India), followed by sub-Saharan Africa and Europe (Turkey) and an equal share for North
Africa. This is more or less in line with the mitigation disbursements from existing funds illustrated in the
Annex 4 maps, which have gone primarily to middle-income countries.
Figure ii
Source: Creditor Reporting System.
Sector distribution of flows marked for climate change
Flows marked for climate change mitigation are mainly coded for the sectors of energy, transport, and
environment multi-sector codes. This is logical considering the focus on climate change mitigation, and the
objective of reducing sources of GHG by switching to more renewable energy sources, using fuels more
efficiently, and enhancing sinks to remove more carbon dioxide from the air (one would expect the
environment multi-sector code to include some of these cross-cutting carbon capture or storage elements).

DCD/DAC(2010)32/REV1
133
Figure iii
Source: Creditor Reporting System.
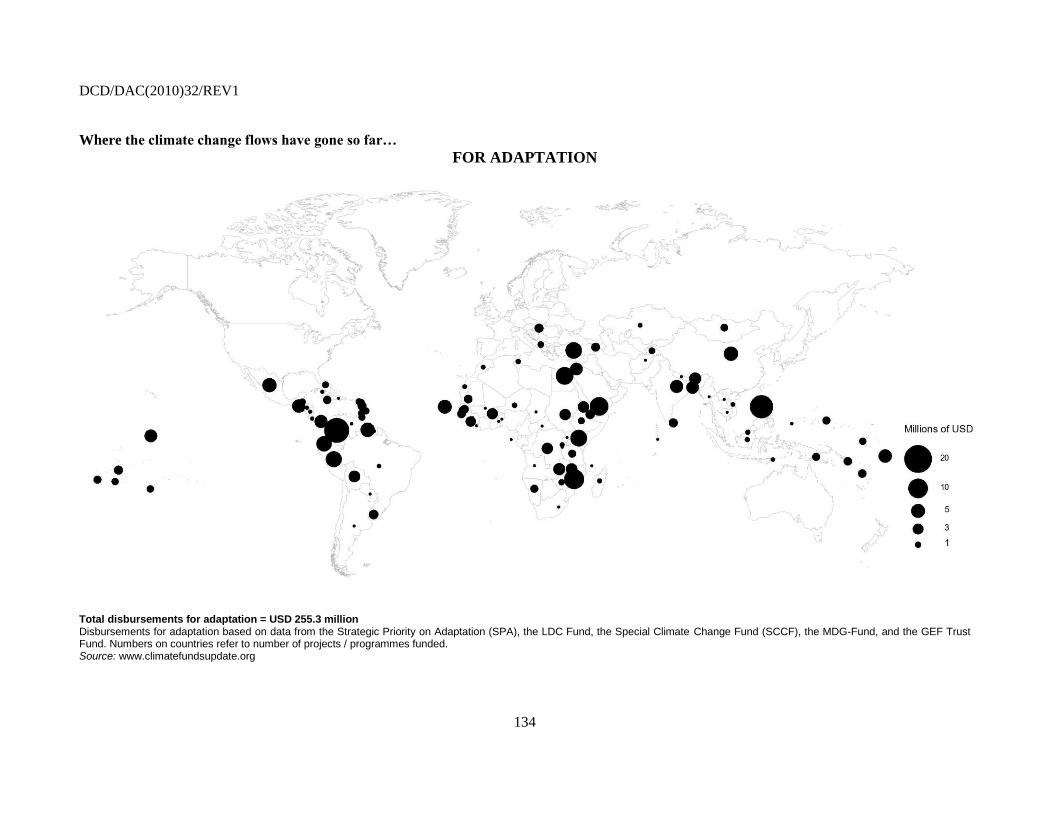
DCD/DAC(2010)32/REV1
134
Where the climate change flows have gone so far…
FOR ADAPTATION
Total disbursements for adaptation = USD 255.3 million Disbursements for adaptation based on data from the Strategic Priority on Adaptation (SPA), the LDC Fund, the Special Climate Change Fund (SCCF), the MDG-Fund, and the GEF Trust Fund. Numbers on countries refer to number of projects / programmes funded. Source: www.climatefundsupdate.org

DCD/DAC(2010)32/REV1
135
FOR MITIGATION
Total disbursements for mitigation = USD 2.4 billion Disbursements for mitigation based on data from the Strategic Priority on Adaptation (SPA), the LDC Fund, the Special Climate Change Fund (SCCF), the MDG-Fund, and the GEF Trust Fund. Numbers on countries refer to number of projects / programmes funded. Source :www.climatefundsupdate.org

DCD/DAC(2010)32/REV1
136
ANNEX 4
2010 General Capital Increases and Replenishments
IBRD Capital Adequacy Review
Looking beyond the crisis, the World Bank predicts that demands for IBRD lending will continue to
increase in order to address the augmented numbers of new poor in middle-income countries, to support the
global public goods agenda, and to respond to future crises. To begin expanding its financial capacity, the
IBRD has already adopted measures to stretch the use of its existing capital to support lending. At the same
time, the IBRD has been actively working with relevant shareholders to release their national currency paid-in
capital.76
The IBRD also instituted a 20-basis-point general loan price increase which is projected to enhance
IBRD‘s end-FY19 usable equity by about USD 2.0 billion under the expected scenario. Following these
efforts, a remaining gap in IBRD‘s equity capital base of about USD 4.8-6.3 billion by FY19 is projected. The
potential actions to fill this gap are a Selective Capital Increase (SCI), a General Capital Increase (GCI) and a
further price increase for long maturity loans. At the 2009 Annual Meetings, the Development Committee
asked for an updated review, including on the WBG‘s general capital increase needs. At the 2010 spring
meeting of the Development Committee, members endorsed a GCI for IBRD of USD 58.4 billion, of which
6%, or USD 3.5 billion, would be paid in capital
IFC Capital Adequacy Review
The financial crisis has adversely affected IFC‘s profitability and tightened its capital position. A two-
step approach is being considered to address IFC‘s capital constraint. In the interim period, shareholders can
provide early support to IFC‘s growth strategy through what is known as ―hybrid capital77
‖ to be replaced by
additional paid-in capital from IFC‘s shareholders as the next step. It is estimated that a capital increase in the
range of USD 1.8 billion to USD 2.4 billion would enable IFC to grow the investment portfolio to about USD
47 - USD 49 billion over the next few years without jeopardising its AAA rating. The most recent (April 2010)
Development Committee endorsed a package to enhance IFC‘s financial capacity, including consideration of a
long-term hybrid instrument to shareholders, subject to the Board review of terms and conditions, and earnings
retention.78
IDA16 Replenishment
IDA deputies met in Bamako 15-18 June 2010 for the second meeting on the IDA16 replenishment. Most
participants supported the focus on fragile and conflict-affected countries, gender, crisis response and climate
change as special themes, but stressed that these should be framed in the broader context of achieving
development results. In the recently concluded Mid-Term review of IDA15, it was reported that during the first
15 months of IDA15 (July 2008-October 2009), IDA commitments reached a record level of USD 16.9 billion;
a 50% increase over the comparable period in IDA14. Given IDA‘s fixed resource envelope during a
76
Under the Articles of the IBRD, members need to only contribute 10% of their paid-in capital in USD, which can be
freely used by the IBRD in its operations. The remaining 90% can be paid-in in the national currency of the
subscribing member. Of the total unreleased national currency paid-in capital of USD 2 billion, the IBRD has thus
far obtained indications for the release of USD 0.5 billion. 77
Through raising low or non-interest bearing subordinated loans from shareholders, potentially with contingent pay-in
and redemption triggers tied to IFC capital adequacy, as a near-term alternative to a capital increase. 78
World Bank (2010), ―Development Committee Communique‖ Washington, D.C., April 25, 2010.

DCD/DAC(2010)32/REV1
137
replenishment period, this strong delivery has come about primarily through countries front-loading their
assistance which will result in lower levels of resources during the remaining IDA15 period.
Participants reiterated strong support for the proposed focus on development results in IDA16. In this
context, Participants welcomed the further strengthening of the IDA Results Measurement System and
encouraged Management to explore additional ways to assess IDA performance, while maintaining country
ownership and accountability. Participants supported the ongoing internal reform agenda, and some urged the
Bank to accelerate the implementation of investment lending reform during IDA16, including steps to support
an increase in the use of country systems. Participants welcomed the realism of the proposed financing
scenarios, and several welcomed the internal resource mobilisation efforts, including IBRD transfers. The next
IDA16 replenishment meeting will take place at the time of the World Bank-IMF Annual Meetings.79
African Development Bank: 6th
General Capital Increase
A committee of Governors representing the African Development Bank‘s shareholders endorsed and
accepted a tripling of the Bank‘s capital resources from USD 33 billion to USD 99 billion at the annual
meetings in Abidjan, Côte d‘Ivoire on 27 May 2010. Of the USD 66 billion increase, 6% or USD 4 billion is
required as paid-in capital from shareholders. The last General Capital Increase (GCI) took place in 1998, and
the Bank‘s medium term strategy (2008-2012) had not envisaged a new GCI until at least 2013. Nonetheless,
the impact of the global economic crisis on Africa has heightened demand for measures to mitigate its effects,
and at the current rate, 90% of the Bank‘s risk capital would be exhausted by 2012.
African Development Fund
At its Annual Meetings in Dakar, Senegal, in May 2009, the AfDB Board of Governors passed a
resolution to initiate discussions on the Bank's general capital increase (GCI) and the replenishment of its
concessional window, the African Development Fund. The AfDF is replenished every three years by 26 donor
countries. The most recent and 11th replenishment of the ADF (ADF-11) for the Fund‘s 2008-2010 operations
was concluded in December 2007 at a record level of USD 8.9 billion. The Fund‘s core strategic priorities
under ADF-11 include infrastructure, governance, support for fragile states and regional integration. At the
ADF-11 Mid-Term Review (MTR), held in October 2009, there was strong support for consolidation and
deepening of current strategic priorities as a prime focus for the ADF-12 cycle due to begin in January 2011. In
addition there were calls for the AfDF to integrate food security and climate change as cross cutting issues.
Deputies also emphasised the need for the Bank to continue building its delivery capacity, with a particular
focus on high quality, decentralisation, human resources development, and aid effectiveness. The
replenishment for ADF-12 will be concluded by September 2010.
Inter-American Development Bank: 9th General Capital Increase
In the 15 years since the Eighth General Increase in the Resources of the Bank (IDB-8), the IDB has
become the main source of development finance for the Latin American and Caribbean region, with loan
approvals of USD 108.6 billion. The Fund for Special Operations provided USD 6.6 billion in concessional
lending to the region‘s poorest countries, making it the main source of multilateral concessional lending. From
2007 onwards, and more recently with efforts to alleviate the impact of the global economic crisis, lending has
increased sharply and prompted a review of the Bank‘s own capital needs. In October 2009, the Board of
79
World Bank (2010), ―Chairperson‘s Summary: IDA Deputies‘ Meeting, Bamako, Mali, June 16-19, 2010.‖
DCD/DAC(2010)32/REV1
138
Governors agreed to move ahead with the final review of the need for a general capital increase of the
Ordinary Capital and replenishment of the Fund for Special Operations. On March 22 2010 at their annual
meeting IDB´s Board of Governors initiated the process for the Ninth General Capital Increase (GCI-9) to
increase the Bank‘s ordinary capital by USD 70 billion, the largest expansion of resources in the Bank‘s
history. They also agreed to provide an unprecedented package of financial support to Haiti, and to replenish
the Fund for Special Operations, which finances operations in the region´s poorest nations.
Global Fund to Fight AIDS, Tuberculosis and Malaria: Replenishment in 2010
The Global Fund to Fight AIDS, Tuberculosis and Malaria which was created in 2002 was originally
funded through mostly annual individual contributions from close to 50 countries as well as private
foundations, corporations and individuals. As programs were scaled up in more than 140 countries, the need
for sustained and predictable support grew substantially, which led to a decision by the Board of the Global
Fund to introduce a funding model based on periodic replenishments. To date, two replenishments have taken
place: the first for the period 2006-07 and the second for 2008-10. Since the inception of the Global Fund,
public, private and non-government donors have jointly pledged a total of USD 22.1 billion covering the
period 2001 to 2015 (although at this stage most donors have only pledged through 2010). The Board of the
Global Fund endorsed the decision to launch a third replenishment covering 2011-13. The pledging conference
for the 3rd
replenishment will take place in October 2010 in New York.
Though significant, total voluntary pledges represent only part of the USD 40-90 billion experts estimate
is needed from all sources each year from 2010-2015 to prevent and treat HIV, TB and malaria effectively on a
global scale.80
Efforts are underway to bring in more funding from the private sector and through innovative
finance mechanisms. To fund ongoing programmes, without launching new rounds, it is estimated the Global
Fund needs USD 8.2 billion. The Global Fund‘s management is striving to achieve efficiency gains of 10% as
mandated by its Board. Since 2009, a new framework for the Global Fund's 2009 key performance indicators
allows for a comprehensive assessment of its performance across four dimensions: operational performance;
grant performance, effectiveness (whether its aid is effective in achieving development results), strengthening
health systems and promoting value for money – and impact.
Global Environment Facility: GEF-5 Replenishment in 2010
Established in 1991, the GEF is today the largest funder of projects to improve the global environment.
The GEF serves as the financial mechanism for the Convention on Biological Diversity (CBD), the United
Nations Framework Convention on Climate Change (UNFCCC), the Stockholm Convention on Persistent
Organic Pollutants and the Convention to Combat Desertification (UNCCD). In addition, it provides support
for the Montreal Protocol on Substances that Deplete the Ozone Layer. As a result, the GEF provides grants to
developing countries and countries with economies in transition for projects in several interrelated areas
covering biodiversity, climate change, international waters, land degradation, the ozone layer, and persistent
organic pollutants.
There was strong support for the replenishment of GEF-5 at the recent Copenhagen COP15 meeting and
by the NGO community. Negotiations for the fifth replenishment of the GEF Trust Fund for the period of 1
July 2010 and ending 30 June 2014 (FY11-FY14) were completed in May 2010. The targeted replenishment
80
The Global Fund to Fight AIDS, Tuberculosis and Malaria (2010), p. 5

DCD/DAC(2010)32/REV1
139
level of USD 4.2 billion represents a 34% increase over GEF-4 levels, providing for modest increases in all
focus areas. Based on the Final GEF-5 Programming Document, the climate change portion would likely be
around USD 1.4 billion over four years, almost all for mitigation.

DCD/DAC(2010)32/REV1
140
ANNEX 5
Channel
Category
Code
Channel
Code
Acronym
(ENG)Full Name (English)
Coefficient
for core
contributions
Overall Sector Category
40000 40000 MULTILATERAL INSTITUTIONS
41000 41000 UNITED NATIONS AGENCIES, FUNDS AND COMMISSIONS
41101 UNCCD Convention to Combat Desertification 100 Multi-sector / Cross-cutting
41102 DLCO-EA Desert Locust Control Organisation for Eastern Africa 100 Production Sectors
41103 ECA Economic Commission for Africa 100 Social Infrastructure and services
41104 ECLAC Economic Commission for Latin America and the Caribbean 100 Social Infrastructure and services
41105 ESCWA Economic and Social Commission for Western Asia 100 Social Infrastructure and services
41106 ESCAP Economic and Social Commission for Asia and the Pacific 100 Social Infrastructure and services
41107 IAEA-TCFInternational Atomic Energy Agency (Contributions to
Technical Cooperation Fund Only)100 Economic Infrastructure and Services
41108 IFAD International Fund for Agricultural Development 100 Production Sectors
41109 INSTRAWInternational Research and Training Institute for the
Advancement of Women 100 Social Infrastructure and services
41110 UNAIDS Joint United Nations Programme on HIV/AIDS 100 Social Infrastructure and services
41111 UNCDF United Nations Capital Development Fund 100 Economic Infrastructure and Services
41112 UNCTAD United Nations Conference on Trade and Development 100 Production Sectors
41114 UNDP United Nations Development Programme 100 Multi-sector / Cross-cutting
41116 UNEP United Nations Environment Programme 100 Multi-sector / Cross-cutting
41118 UNFCCC United Nations Framework Convention on Climate Change 100 Multi-sector / Cross-cutting
41119 UNFPA United Nations Population Fund 100 Social Infrastructure and services
41120 UN Habitat United Nations Human Settlement Programme 100 Multi-sector / Cross-cutting
41121 UNHCRUnited Nations Office of the United Nations High Commissioner
for Refugees 100 Humanitarian Aid
41122 UNICEF United Nations Children’s Fund 100 Social Infrastructure and services
41123 UNIDO United Nations Industrial Development Organisation 100 Production Sectors
41124 UNIFEM United Nations Development Fund for Women 100 Social Infrastructure and services
41125 UNITAR United Nations Institute for Training and Research 100 Multi-sector / Cross-cutting
41126 UNMAS United Nations Mine Action Service 100 Social Infrastructure and services
41127 UNOCHA United Nations Office of Co-ordination of Humanitarian Affairs 100 Humanitarian Aid
41128 UNODC United Nations Office on Drugs and Crime 100 Social Infrastructure and services
41129 UNRISD United Nations Research Institute for Social Development 100 Social Infrastructure and services
41130 UNRWAUnited Nations Relief and Works Agency for Palestine
Refugees in the Near East100 Humanitarian Aid
41131 UNSSC United Nations System Staff College 100 Social Infrastructure and services
41132 UNSCN United Nations System Standing Committee on Nutrition 100 Social Infrastructure and services
41133 UNSIA United Nations Special Initiative on Africa 100 Social Infrastructure and services
41134 UNU United Nations University (including Endowment Fund) 100 Multi-sector / Cross-cutting
41135 UNV United Nations Volunteers 100 Multi-sector / Cross-cutting
41136 UNVFD United Nations Voluntary Fund on Disability 100 Social Infrastructure and services
41137 UNVFTCUnited Nations Voluntary Fund for Technical Co-operation in
the Field of Human Rights100 Social Infrastructure and services
41138 UNVFVT United Nations Voluntary Fund for Victims of Torture 100 Social Infrastructure and services
41140 WFP World Food Programme 100
41141PBF Window
2
United Nations Peacebuilding Fund (Window Two: Restricted
Contributions Only)100 Social Infrastructure and services
41142 UNDEF United Nations Democracy Fund 100 Social Infrastructure and services
41143 WHO-CVCAWorld Health Organisation - core voluntary contributions
account100 Social Infrastructure and services
List of International Organisations
Official Contributions to which may be Reported in Whole or in Part as ODA
Commodity aid and general
programme assistance

DCD/DAC(2010)32/REV1
141
Channel
Category
Code
Channel
Code
Acronym
(ENG)Full Name (English)
Coefficient
for core
contributions
Overall Sector Category
41300 41300 OTHER UN (Core Contributions Reportable in Part)
41301 FAO Food and Agricultural Organisation 51 Production Sectors
41302 ILO International Labour Organisation 15 Social Infrastructure and services
41303 ITU International Telecommunications Union 18 Economic Infrastructure and Services
41304 UNESCOUnited Nations Educational, Scientific and Cultural
Organisation44 Social Infrastructure and services
41305 UN United Nations 12 Multi-sector / Cross-cutting
41306 UPU Universal Postal Union 16 Economic Infrastructure and Services
41307WHO-
AssessedWorld Health Organisation - assessed contributions 76 Social Infrastructure and services
41308 WIPO World Intellectual Property Organisation 3 Social Infrastructure and services
41309 WMO World Meteorological Organisation 4 Social Infrastructure and services
41310 UNDPKOUnited Nations Department of Peacekeeping Operations
(excluding UNTSO, UNMOGIP, UNFICYP, UNDOF)7 Social Infrastructure and services
41311PBF Window
1
United Nations Peacebuilding Fund (Window One: Flexible
Contributions Only)80 Social Infrastructure and services
41312IAEA-
AssessedInternational Atomic Energy Agency - assessed contributions 33 Economic Infrastructure and Services
41313 OHCHRUnited Nations High Commissioner for Human Rights
(extrabudgetary contributions only)64 Social Infrastructure and services
41314 UNECEUnited Nations Economic Commission for Europe
(extrabudgetary contributions only)89 Social Infrastructure and services
42000 42000 EUROPEAN UNION INSTITUTIONS
42001 EC European Commission - Development Share of Budget 100 Multi-sector / Cross-cutting
42003 EDF European Commission - European Development Fund 100 Multi-sector / Cross-cutting
42004 EIB European Investment Bank (interest subsidies only) 100 Social Infrastructure and services
42005 FEMIPFacility for Euro-Mediterranean Investment and Partnership
Trust Fund100 Economic Infrastructure and Services
42006 GEEREF Global Energy Efficiency and Renewable Energy Fund 100 Economic Infrastructure and Services
43000 43000 INTERNATIONAL MONETARY FUND
43001IMF-PRGF
Trust
International Monetary Fund - Poverty Reduction and Growth
Facility Trust 100 Multi-sector / Cross-cutting
43002IMF-PRGF-
HIPC Trust
International Monetary Fund - Poverty Reduction and Growth
Facility - Heavily Indebted Poor Countries Initiative Trust
(includes HIPC, PRGF and PRGF-HIPC sub-accounts)
100 Action related to debt
43003 IMF-ENDAInternational Monetary Fund - Subsidization of IMF Emergency
Assistance for Natural Disasters100 Humanitarian Aid
44000 44000 WORLD BANK GROUP
44001 IBRD International Bank for Reconstruction and Development 100 Multi-sector / Cross-cutting
44002 IDA International Development Association 100 Multi-sector / Cross-cutting
44003 IDA-HIPCInternational Development Association - Heavily Indebted
Poor Countries Debt Initiative Trust Fund 100 Action related to debt
44004 IFC International Finance Corporation 100 Economic Infrastructure and Services
44005 MIGA Multilateral Investment Guarantee Agency 100 Economic Infrastructure and Services
44006 AMCs Advance Market Commitments 100 Social Infrastructure and services
44007 IDA-MDRIInternational Development Association - Multilateral Debt
Relief Initiative100 Action related to debt
45000 45000 WORLD TRADE ORGANISATION
45001 WTO-ITC World Trade Organisation - International Trade Centre 100 Production Sectors
45002 WTO-ACWL World Trade Organisation - Advisory Centre on WTO Law 100 Production Sectors
45003WTO-
DDAGTF
World Trade Organisation - Doha Development Agenda Global
Trust Fund 100 Production Sectors
46000 46000 REGIONAL DEVELOPMENT BANKS
46001 ASF African Solidarity Fund 100 Multi-sector / Cross-cutting
46002 Afr.DB African Development Bank 100 Multi-sector / Cross-cutting
46003 Afr.DF African Development Fund 100 Multi-sector / Cross-cutting
46004 AsDB Asian Development Bank 100 Multi-sector / Cross-cutting
46005 AsDF Asian Development Fund 100 Multi-sector / Cross-cutting
46006 BSTDB Black Sea Trade and Development Bank 61 Multi-sector / Cross-cutting
46007 CABEI Central American Bank for Economic Integration 100 Multi-sector / Cross-cutting
46008 CAF Andean Development Corporation 100 Multi-sector / Cross-cutting
46009 CDB Caribbean Development Bank 100 Multi-sector / Cross-cutting
46012 IDBInter-American Development Bank, Inter-American
Investment Corporation and Multilateral Investment Fund 100 Multi-sector / Cross-cutting
46013 IDB Sp.F. Inter-American Development Fund for Special Operations 100 Multi-sector / Cross-cutting
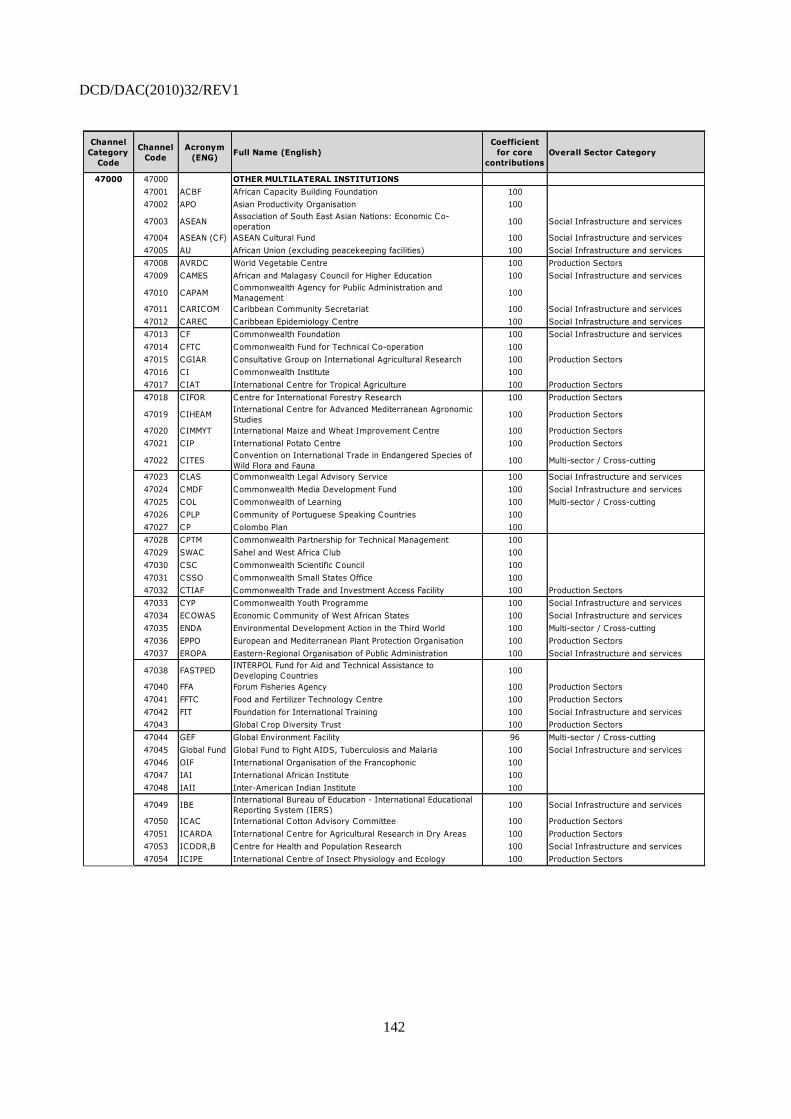
DCD/DAC(2010)32/REV1
142
Channel
Category
Code
Channel
Code
Acronym
(ENG)Full Name (English)
Coefficient
for core
contributions
Overall Sector Category
47000 47000 OTHER MULTILATERAL INSTITUTIONS
47001 ACBF African Capacity Building Foundation 100
47002 APO Asian Productivity Organisation 100
47003 ASEANAssociation of South East Asian Nations: Economic Co-
operation 100 Social Infrastructure and services
47004 ASEAN (CF) ASEAN Cultural Fund 100 Social Infrastructure and services
47005 AU African Union (excluding peacekeeping facilities) 100 Social Infrastructure and services
47008 AVRDC World Vegetable Centre 100 Production Sectors
47009 CAMES African and Malagasy Council for Higher Education 100 Social Infrastructure and services
47010 CAPAMCommonwealth Agency for Public Administration and
Management 100
47011 CARICOM Caribbean Community Secretariat 100 Social Infrastructure and services
47012 CAREC Caribbean Epidemiology Centre 100 Social Infrastructure and services
47013 CF Commonwealth Foundation 100 Social Infrastructure and services
47014 CFTC Commonwealth Fund for Technical Co-operation 100
47015 CGIAR Consultative Group on International Agricultural Research 100 Production Sectors
47016 CI Commonwealth Institute 100
47017 CIAT International Centre for Tropical Agriculture 100 Production Sectors
47018 CIFOR Centre for International Forestry Research 100 Production Sectors
47019 CIHEAMInternational Centre for Advanced Mediterranean Agronomic
Studies 100 Production Sectors
47020 CIMMYT International Maize and Wheat Improvement Centre 100 Production Sectors
47021 CIP International Potato Centre 100 Production Sectors
47022 CITESConvention on International Trade in Endangered Species of
Wild Flora and Fauna100 Multi-sector / Cross-cutting
47023 CLAS Commonwealth Legal Advisory Service 100 Social Infrastructure and services
47024 CMDF Commonwealth Media Development Fund 100 Social Infrastructure and services
47025 COL Commonwealth of Learning 100 Multi-sector / Cross-cutting
47026 CPLP Community of Portuguese Speaking Countries 100
47027 CP Colombo Plan 100
47028 CPTM Commonwealth Partnership for Technical Management 100
47029 SWAC Sahel and West Africa Club 100
47030 CSC Commonwealth Scientific Council 100
47031 CSSO Commonwealth Small States Office 100
47032 CTIAF Commonwealth Trade and Investment Access Facility 100 Production Sectors
47033 CYP Commonwealth Youth Programme 100 Social Infrastructure and services
47034 ECOWAS Economic Community of West African States 100 Social Infrastructure and services
47035 ENDA Environmental Development Action in the Third World 100 Multi-sector / Cross-cutting
47036 EPPO European and Mediterranean Plant Protection Organisation 100 Production Sectors
47037 EROPA Eastern-Regional Organisation of Public Administration 100 Social Infrastructure and services
47038 FASTPEDINTERPOL Fund for Aid and Technical Assistance to
Developing Countries 100
47040 FFA Forum Fisheries Agency 100 Production Sectors
47041 FFTC Food and Fertilizer Technology Centre 100 Production Sectors
47042 FIT Foundation for International Training 100 Social Infrastructure and services
47043 Global Crop Diversity Trust 100 Production Sectors
47044 GEF Global Environment Facility 96 Multi-sector / Cross-cutting
47045 Global Fund Global Fund to Fight AIDS, Tuberculosis and Malaria 100 Social Infrastructure and services
47046 OIF International Organisation of the Francophonic 100
47047 IAI International African Institute 100
47048 IAII Inter-American Indian Institute 100
47049 IBEInternational Bureau of Education - International Educational
Reporting System (IERS)100 Social Infrastructure and services
47050 ICAC International Cotton Advisory Committee 100 Production Sectors
47051 ICARDA International Centre for Agricultural Research in Dry Areas 100 Production Sectors
47053 ICDDR,B Centre for Health and Population Research 100 Social Infrastructure and services
47054 ICIPE International Centre of Insect Physiology and Ecology 100 Production Sectors

DCD/DAC(2010)32/REV1
143
Channel
Code
Acronym
(ENG)Full Name (English)
Coefficient
for core
contributions
Overall Sector Category
47055 ICRAInternational Centre for Development Oriented Research in
Agriculture 100 Production Sectors
47056 ICRAF World AgroForestry Centre 100 Production Sectors
47057 ICRISAT International Crop Research for Semi-Arid Tropics 100 Production Sectors
47058 IDEA International Institute for Democracy and Electoral Assistance 100 Social Infrastructure and services
47059 IDLO International Development Law Organisation 100 Social Infrastructure and services
47060 IIC International Institute for Cotton 100 Production Sectors
47061 IICA Inter-American Institute for Co-operation on Agriculture 100 Production Sectors
47062 IITA International Institute of Tropical Agriculture 100 Production Sectors
47063 ILRI International Livestock Research Institute 100 Production Sectors
47064 INBAR International Network for Bamboo and Rattan 100 Production Sectors
47065 IOC Intergovernmental Oceanographic Commission 100 Multi-sector / Cross-cutting
47066 IOM International Organisation for Migration 100 Multi-sector / Cross-cutting
47067 IPCC Intergovernmental Panel on Climate Change 100 Multi-sector / Cross-cutting
47068 APFIC Asia-Pacific Fishery Commission 100 Production Sectors
47069 Biodiversity International 100 Multi-sector / Cross-cutting
47070 IRRI International Rice Research Institute 100 Production Sectors
47071 ISTA International Seed Testing Association 100 Production Sectors
47073 ITTO International Tropical Timber Organisation 100 Production Sectors
47074 IVI International Vaccine Institute 100 Social Infrastructure and services
47075 IWMI International Water Management Institute 100 Social Infrastructure and services
47076 JSCA Justice Studies Centre of the Americas 100 Social Infrastructure and services
47077 MRC Mekong River Commission 100 Social Infrastructure and services
47078Montreal
Protocol
Multilateral Fund for the Implementation of the Montreal
Protocol 100 Multi-sector / Cross-cutting
47079 OAS Organisation of American States 100 Social Infrastructure and services
47080 OECD
Organisation for Economic Co-operation and Development
(Contributions to special funds for Technical Co-operation
Activities Only)
100 Multi-sector / Cross-cutting
47081OECD-Dev.
CentreOECD Development Centre 100 Multi-sector / Cross-cutting
47082 OECS Organisation of Eastern Caribbean States 100 Social Infrastructure and services
47083 PAHO Pan-American Health Organisation 100 Social Infrastructure and services
47084 PAIGH Pan-American Institute of Geography and History 100 Multi-sector / Cross-cutting
47085 PARCA Pan-American Railway Congress Association 100 Economic Infrastructure and Services
47086 PIDG Private Infrastructure Development Group 100 Economic Infrastructure and Services
47087 PIFS Pacific Islands Forum Secretariat 100 Social Infrastructure and services
47088 RN Relief Net 100 Humanitarian Aid
47089 SADC Southern African Development Community 100 Social Infrastructure and services
47090 SATCC Southern African Transport and Communications Commission 100 Economic Infrastructure and Services
47091 SCAAP(Colombo Plan) Special Commonwealth African Assistance
Programme 100
47092 SEAFDC South East Asian Fisheries Development Centre 100 Production Sectors
47093 SEAMEO South East Asian Ministers of Education 100 Social Infrastructure and services
47094 SOPAC South Pacific Applied Geoscience Commission 100
47095 SPBEA South Pacific Board for Educational Assessment 100 Social Infrastructure and services
47096 SPC Secretariat of the Pacific Community 100 Multi-sector / Cross-cutting
47097 SPREP Pacific Regional Environment Programme 100 Multi-sector / Cross-cutting
47098 UNPO Unrepresented Nations and Peoples’ Organisation 100 Social Infrastructure and services
47099 USP University of the South Pacific 100 Social Infrastructure and services
47100 WAMU West African Monetary Union 100 Economic Infrastructure and Services
47101 WARDA Africa Rice Centre 100 Production Sectors
47102
WCO-
Fellowship
Prog.
World Customs Organisation Fellowship Programme 100 Production Sectors
47103 WMU World Maritime University 100 Economic Infrastructure and Services
47104WorldFish
CentreWorldFish Centre 100 Production Sectors
47105 CFC Common Fund for Commodities 100 Economic Infrastructure and Services
47106 DCAF Geneva Centre for the Democratic Control of Armed Forces 100 Social Infrastructure and services
47107 IFFIm International Finance Facility for Immunisation 100 Social Infrastructure and services
47108 MDRP Multi-Country Demobilisation and Reintegration Program 100 Social Infrastructure and services
47109 APEC ASFAsia-Pacific Economic Cooperation Support Fund (except
contributions tied to counter-terrorism activities)100 Multi-sector / Cross-cutting
47110 BSEC Organisation of the Black Sea Economic Cooperation 78
47111 Adaptation Fund 100 Multi-sector / Cross-cutting
47112CEI-Climate
Fund
Central European Initiative - Special Fund for Climate and
Environmental Protection100 Multi-sector / Cross-cutting
47113 CEMAC Economic and Monetary Community of Central Africa 100 Economic Infrastructure and Services
47116 IFIntegrated Framework for Trade-Related Technical Assistance
to Least Developed Countries100 Production Sectors
47117 NEPAD New Partnership for Africa's Development 100 Social Infrastructure and services
47118 CREFIAFRegional Organisation for the Strengthening of Supreme Audit
Institutions of Francophone Sub-Saharan Countries100
47119 OSS Sahara and Sahel Observatory 100 Multi-sector / Cross-cutting
47120 SAARC South Asian Association for Regional Cooperation 100 Multi-sector / Cross-cutting
47121 UCLGA United Cities and Local Governments of Africa 100 Social Infrastructure and services
47122 GAVI Global Alliance for Vaccines and Immunization 100 Social Infrastructure and services
47123 GICHD Geneva International Centre for Humanitarian Demining 100 Social Infrastructure and services
47125 ETCEuropean Bank for Reconstruction and Development - Early
Transition Countries Initiative100 Economic Infrastructure and Services
47126European Bank for Reconstruction and Development -
Western Balkans Trust Fund100 Economic Infrastructure and Services
47127 OLADE Latin-American Energy Organisation 100 Economic Infrastructure and Services