2010-2011 annual report - dc public charter school · pdf fileiii. annual report narrative ......
TRANSCRIPT

2010-2011
Annual Report
Center City Public Charter Schools
7 New York Avenue, Suite 200-300
Washington, DC 20002
202-589-0202
Annual Report submitted by: Ralph Boyd, Board Chair
2010-2011 Center City PCS Annual Report Page 2
I. TABLE OF CONTENTS I. TABLE OF CONTENTS .................................................................................................................................................. 2
II. BOARD AND SCHOOL LEADERS .................................................................................................................................. 3
III. ANNUAL REPORT NARRATIVE .................................................................................................................................... 5
I. School Description ........................................................................................................................................ 5
A. Mission Statement and Vision .......................................................................................................... 5
B. School Program ................................................................................................................................ 5
C. School Staff ....................................................................................................................................... 8
D. School Characteristics .................................................................................................................... 12
E. Governance .................................................................................................................................... 19
F. Finance ........................................................................................................................................... 20
II. School Performance .................................................................................................................................... 23
A. Evidence of Performance and Progress ......................................................................................... 23
B. Lessons Learned ............................................................................................................................. 48
C. Reporting Management Framework Information .......................................................................... 57
D. Unique Accomplishments............................................................................................................... 58
IV. 2010-2011 BUDGET .................................................................................................................................................. 60
V. ANNUAL REPORT WORKSHEETS .............................................................................................................................. 62
VI. APPENDIX ................................................................................................................................................................. 90
2010-2011 Center City PCS Annual Report Page 3
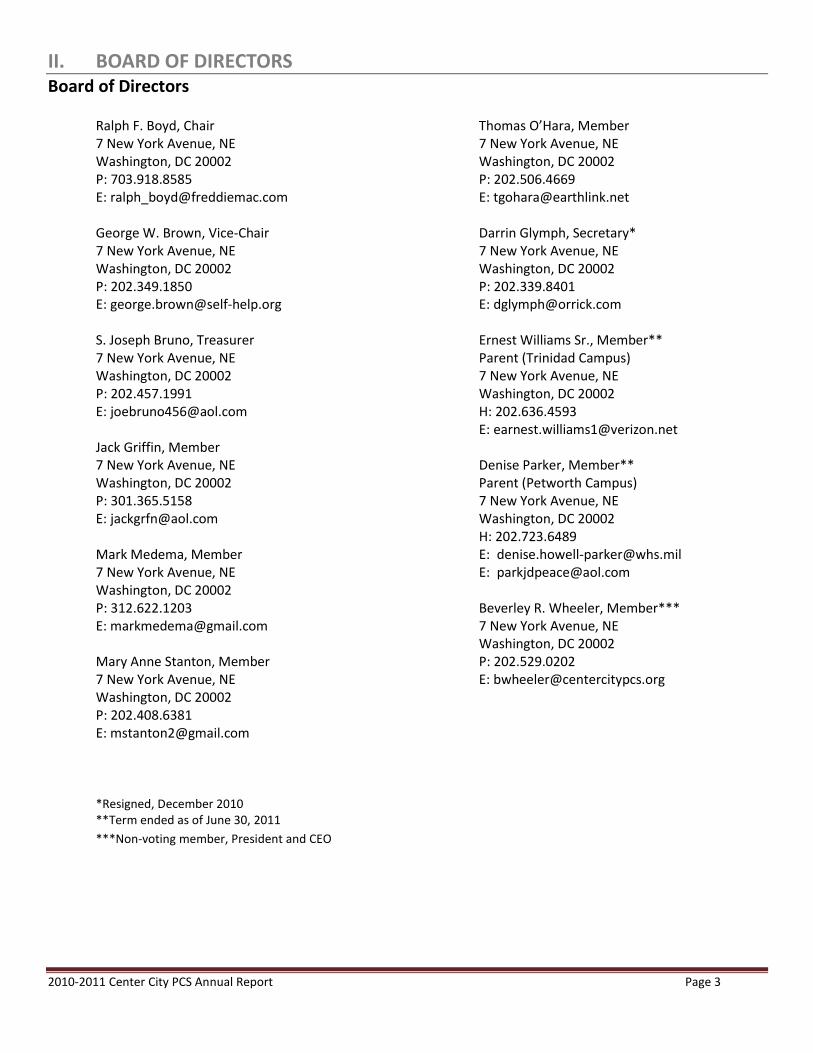
II. BOARD OF DIRECTORS Board of Directors
Ralph F. Boyd, Chair 7 New York Avenue, NE Washington, DC 20002 P: 703.918.8585 E: [email protected] George W. Brown, Vice-Chair 7 New York Avenue, NE Washington, DC 20002 P: 202.349.1850 E: [email protected] S. Joseph Bruno, Treasurer 7 New York Avenue, NE Washington, DC 20002 P: 202.457.1991 E: [email protected] Jack Griffin, Member 7 New York Avenue, NE Washington, DC 20002 P: 301.365.5158 E: [email protected] Mark Medema, Member 7 New York Avenue, NE Washington, DC 20002 P: 312.622.1203 E: [email protected] Mary Anne Stanton, Member 7 New York Avenue, NE Washington, DC 20002 P: 202.408.6381 E: [email protected]
Thomas O’Hara, Member 7 New York Avenue, NE Washington, DC 20002 P: 202.506.4669 E: [email protected] Darrin Glymph, Secretary* 7 New York Avenue, NE Washington, DC 20002 P: 202.339.8401 E: [email protected] Ernest Williams Sr., Member** Parent (Trinidad Campus) 7 New York Avenue, NE Washington, DC 20002 H: 202.636.4593 E: [email protected]
Denise Parker, Member** Parent (Petworth Campus) 7 New York Avenue, NE Washington, DC 20002 H: 202.723.6489 E: [email protected] E: [email protected] Beverley R. Wheeler, Member*** 7 New York Avenue, NE Washington, DC 20002 P: 202.529.0202 E: [email protected]
*Resigned, December 2010 **Term ended as of June 30, 2011
***Non-voting member, President and CEO
2010-2011 Center City PCS Annual Report Page 4
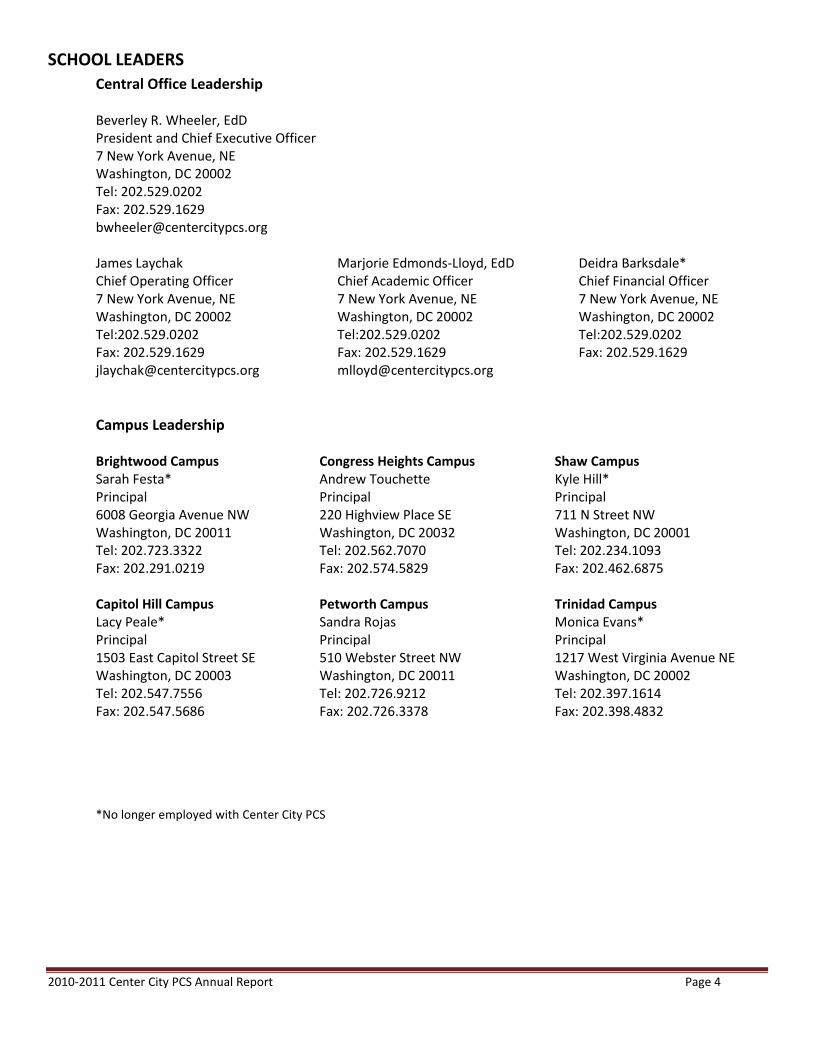
SCHOOL LEADERS
Central Office Leadership Beverley R. Wheeler, EdD President and Chief Executive Officer 7 New York Avenue, NE Washington, DC 20002 Tel: 202.529.0202 Fax: 202.529.1629 [email protected]
James Laychak Chief Operating Officer 7 New York Avenue, NE Washington, DC 20002 Tel:202.529.0202 Fax: 202.529.1629 [email protected]
Marjorie Edmonds-Lloyd, EdD Chief Academic Officer 7 New York Avenue, NE Washington, DC 20002 Tel:202.529.0202 Fax: 202.529.1629 [email protected]
Deidra Barksdale* Chief Financial Officer 7 New York Avenue, NE Washington, DC 20002 Tel:202.529.0202 Fax: 202.529.1629
Campus Leadership
Brightwood Campus Sarah Festa* Principal 6008 Georgia Avenue NW Washington, DC 20011 Tel: 202.723.3322 Fax: 202.291.0219 Capitol Hill Campus Lacy Peale* Principal 1503 East Capitol Street SE Washington, DC 20003 Tel: 202.547.7556 Fax: 202.547.5686
Congress Heights Campus Andrew Touchette Principal 220 Highview Place SE Washington, DC 20032 Tel: 202.562.7070 Fax: 202.574.5829 Petworth Campus Sandra Rojas Principal 510 Webster Street NW Washington, DC 20011 Tel: 202.726.9212 Fax: 202.726.3378
Shaw Campus Kyle Hill* Principal 711 N Street NW Washington, DC 20001 Tel: 202.234.1093 Fax: 202.462.6875 Trinidad Campus Monica Evans* Principal 1217 West Virginia Avenue NE Washington, DC 20002 Tel: 202.397.1614 Fax: 202.398.4832
*No longer employed with Center City PCS

2010-2011 Center City PCS Annual Report Page 5
III. ANNUAL REPORT NARRATIVE
I. School Description
A. Mission Statement and Vision Mission The Center City Public Charter Schools’ (Center City PCS) mission is to empower our children for success through a rigorous academic program and strong character education while challenging students to pursue personal excellence in character, conduct, and scholarship in order to develop skills necessary to both serve and lead others in the 21st century. Vision Armed with said mission, it is the vision of the organization to ultimately:
Prepare 21st century global learners and leaders;
Empower our students for success;
Recruit and retain 21st century highly qualified staff; and
Equip our schools with 21st century smart classrooms. To accomplish the articulated vision, Center City PCS has as its focus rigor and relevance. Simply put and in line with national indicators, the emphasis is on authentic literacy (oral, written, and reading comprehension), with the expectation that our students will be reading at the advanced level by 2nd grade, doing advanced math by 5th grade, and scoring at the advanced level on the DC CAS between grades 3-8. Ultimately, it is expected that students will perform two grade levels ahead by the time that they finish Center City PCS. This will be accomplished by our yearly rigorous and research-based School Improvement Plan which currently has as its outcomes that students will progress two grade level equivalents per month in reading, will comprehend five math strands per month, and will demonstrate proficiency in month open response benchmarks (BCR’s).
B. School Program School year and hours, grade and age levels served During the 2010-2011 school year, Center City PCS educated 1306 students at our six campuses which are named after the neighborhoods they are located in: Brightwood, Capitol Hill, Congress Heights, Petworth, Shaw, and Trinidad. Each campus served students in PreK through 8th grade, ages four to fifteen. The school year started August 30st, 2010 and ended June 17th, 2011 and our students attended school for an extended school day from 8:00AM to 4:00PM Mondays-Thursdays and from 8:00AM to 1:00PM on Fridays.
Curriculum at Center City PCS Center City Public Charter School seeks to provide urban students with a whole education that ignites the imagination, cultivates curiosity, and imbues habits of mind for 21st century leadership and service. Embedded in the national Core Common Standards, this broadened liberal arts curriculum is expressed through the following five competencies:
Core Content
Character Education
Community Exploration
Service Learning
Authentic Experiences

2010-2011 Center City PCS Annual Report Page 6
As such, each year, from grades Pre-K – 8, students will follow curricula that encompass the core subject areas of English language arts, mathematics, science, social studies, art, music, dance, foreign language and physical education. Daily morning meetings and a monthly focus on Center City PCS’ ten core values serve to support the character education. Finally, theme focused field trips facilitate community exploration, while Capstone projects and grade-level performance tasks support service learning and authentic educational experiences. The goal of the curriculum is to provide differentiated opportunities with the expectation that our students will be reading at the advanced level by 2nd grade and doing advanced math by 5th grade. Research has shown that when students perform at advanced levels in their elementary years, they are more likely to succeed in high school, college, and beyond. To realize this goal for each of our 1300 college-bound students, our schools is focus authentic literacy (reading, writing, and oral fluency and comprehension) starting at Pre-K. Center City PCS understands that each child is unique and we meet the needs of each individual learner. To that end, in order to ensure academic success for all, students struggling with the demands of the rigorous curriculum will be supported in enrichment programs sponsored in the mornings, afternoons, Saturdays, and summer school. Finally, as a vital component of the curricula, the students are regularly assessed to ensure that they are meeting grade-level benchmarks. As such, students are evaluated using the following tools: monthly formative (exit slips, oral drills), summative assessments (quizzes and tests), standardized benchmarks (ANET, DIBELS, TEMA, etc.), and culminating projects. Here at Center City Public Charter School, we ensure a Free Appropriate Public Education to our students with disabilities by providing a high-quality, meaningful educational opportunities. Our special education program educates students, to the extent possible, under inclusive, co-teaching models, ensuring all students are integrated into the school-wide culture. Student needs are met through varying levels of services as indicated on their IEP. Special Education is defined as a specially designed set of services in combination with best practices/methodologies created for your child to meet their needs that are related to their disability. Services may include: specialized instruction in reading, written expression, mathematics, adaptive physical education, vision, hearing, orientation/mobility; related services in speech/language therapy, occupational therapy, counseling, behavior support and physical therapy and any of these on a consultative basis. The foundation of our English as a Second Language program is our conviction that our English Language Learners (ELL) can be successful, given a supportive educational environment, research-based programs, and comprehensive instruction. As Center City PCS we work to address our students’ needs in a manner consistent with our educational philosophy and with the English Language Acquisition, Language Enhancement, and Academic Achievement Act under Title III. In the SY10-11, 176 language minority students qualified for direct ESL services at Center City PCS. Center City PCS utilizes a Content-Based ESL Program, in which teachers use English as the medium for providing content area instruction, adapting their language to the proficiency level of the students. This approach allows teachers to accommodate students from different language backgrounds in the same class and to provide instruction without being proficient in the students’ own languages. Mission-related programs In addition to our broadened liberal arts curriculum that ensures excellence through a rigorous academic program, Center City PCS believes in the importance of character education and service to others. These aspects of our mission are fulfilled in a number of ways and are framed by the competencies of character education and service learning, and the annual Capstone project.
Center City PCS emphasizes character education throughout all six campuses. Our morning meetings and morning gatherings allow the students and the school to gather as a community
2010-2011 Center City PCS Annual Report Page 7
and engage and reflect upon our ten core values. Each month our students will hear and learn about the core value, define it as a community, practice the value through a service and/or leadership activity, and then reflect upon the relationship between the value and their role. The core value of the month is also celebrated school-wide through common practices, ongoing dialogue, and a culminating student-centered activity.
In living our motto of character, excellence, and service, each student at Center City PCS completed a Capstone Project in the Spring of 2011. The theme of the project was researching the importance and problematic situation of food, hunger, fitness and carbon foot print. Each child participated in a research project, a service experience, and a school-wide presentation that reflected knowledge and understanding of one aspect of sustainable living. The Capstone Project manual was used by all teachers to develop projects in collaboration with students. Students actively participated in service projects such as cultivating schoolyard gardens, setting up a community luncheon and a nutrition-themed musical, identifying edible plants, holding a canned food drive, developing videos on how to stay fit and how to prepare healthy meals, and putting together a cook book.

2010-2011 Center City PCS Annual Report Page 8
C. School Staff
Center City PCS (LEA)
Key Leadership President and Chief Executive Officer: Beverley R. Wheeler, EdD Chief Operating Officer: James Laychak Chief Academic Officer: Marjorie Edmonds-Lloyd, EdD Chief Financial Officer: Deidra Barksdale*
Number of teachers 102 FTE
Number of teacher aides 21 FTE
Average class size 21.8
Qualifications and assignments of school staff
Assignments Qualifications
6 Principals 64 Classroom teachers 14 Art, Music, Dance, Spanish teachers 3 PE teacher 7 Bilingual/ESL teachers 14 SPED teachers 4.75 Reading Specialist 6 Counselors 4 Instructional Coaches 21 Classroom Aides
BA MA Degree in field HQT
N/A 100% 100% 100% 100% 100% 100% 100% 100% 52%
N/A 43% 18% 17% 86% 61% 58% 100% 50% 0%
N/A 22% 48% N/A 75% 39% 21% 100% 0% N/A
N/A 94% 100% N/A N/A N/A 79% N/A N/A 100%
Staff attrition rate 45%
Salary range for teachers and administrators
$45,595-$105,000
Average salary for teachers and administrators
$57,368
*No longer employed with Center City PCS
Please see Appendix A for HQT listing provided to OSSE for SY10-11
2010-2011 Center City PCS Annual Report Page 9
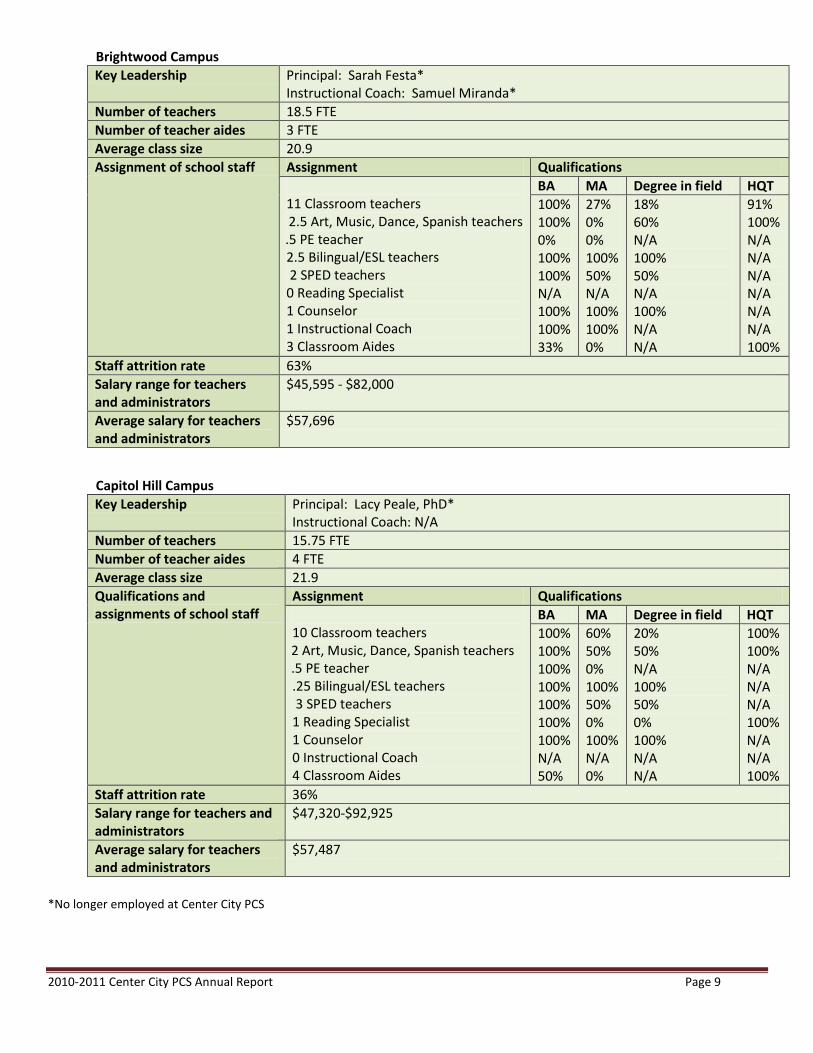
Brightwood Campus
Key Leadership Principal: Sarah Festa* Instructional Coach: Samuel Miranda*
Number of teachers 18.5 FTE
Number of teacher aides 3 FTE
Average class size 20.9
Assignment of school staff Assignment Qualifications
11 Classroom teachers 2.5 Art, Music, Dance, Spanish teachers .5 PE teacher 2.5 Bilingual/ESL teachers 2 SPED teachers 0 Reading Specialist 1 Counselor 1 Instructional Coach 3 Classroom Aides
BA MA Degree in field HQT
100% 100% 0% 100% 100% N/A 100% 100% 33%
27% 0% 0% 100% 50% N/A 100% 100% 0%
18% 60% N/A 100% 50% N/A 100% N/A N/A
91% 100% N/A N/A N/A N/A N/A N/A 100%
Staff attrition rate 63%
Salary range for teachers and administrators
$45,595 - $82,000
Average salary for teachers and administrators
$57,696
Capitol Hill Campus
Key Leadership Principal: Lacy Peale, PhD* Instructional Coach: N/A
Number of teachers 15.75 FTE
Number of teacher aides 4 FTE
Average class size 21.9
Qualifications and assignments of school staff
Assignment Qualifications
10 Classroom teachers 2 Art, Music, Dance, Spanish teachers .5 PE teacher .25 Bilingual/ESL teachers 3 SPED teachers 1 Reading Specialist 1 Counselor 0 Instructional Coach 4 Classroom Aides
BA MA Degree in field HQT
100% 100% 100% 100% 100% 100% 100% N/A 50%
60% 50% 0% 100% 50% 0% 100% N/A 0%
20% 50% N/A 100% 50% 0% 100% N/A N/A
100% 100% N/A N/A N/A 100% N/A N/A 100%
Staff attrition rate 36%
Salary range for teachers and administrators
$47,320-$92,925
Average salary for teachers and administrators
$57,487
*No longer employed at Center City PCS

2010-2011 Center City PCS Annual Report Page 10
Congress Heights Campus
Key Leadership Principal: Andrew Touchette Instructional Coach: N/A
Number of teachers 15.5 FTE
Number of teacher aides 4 FTE
Average class size 20
Qualifications and assignments of school staff
Assignment Qualifications
11 Classroom teachers 2 Art, Music, Dance, Spanish teachers 0.5 PE Teacher 0 Bilingual/ESL Teachers 2 SPED teachers 1 Reading Specialist 1 Counselor 0 Instructional Coach 4 Classroom Aides
BA MA Degree in field HQT
100% 100% 100% N/A 100% 100% 100% N/A 75%
36% 0% 0% N/A 50% 0% 100% N/A 0%
18% 100% N/A N/A 50% 0% 100% N/A N/A
91% 100% N/A N/A N/A 100% N/A N/A 100%
Staff attrition rate 76%
Salary range for teachers and administrators
$45,595 - $105,000
Average salary for teachers and administrators
$57,487
Petworth Campus
Key Leadership
Principal: Sandra Rojas Instructional Coach: Bianca Mitchell*
Number of teachers 18.5 FTE
Number of teacher aides 3 FTE
Average class size 22.9
Qualifications and assignments of school staff
Assignment Qualifications
11 Classroom teachers 3 Art, Music, Dance, Spanish teachers .5 PE Teacher 2.5 Bilingual/ESL teachers 2 SPED teachers 0 Reading Specialist 1 Counselor 1 Instructional Coach 3 Classroom Aides
BA MA Degree in field HQT
100% 100% 0% 100% 100% N/A 100% 100% 33%
27% 0% 0% 100% 50% N/A 100% 100% 0%
18% 66% N/A 100% 50% N/A 100% 0% N/A
91% 100% N/A N/A N/A N/A N/A N/A 100%
Staff attrition rate 63%
Salary range for teachers and administrators
$45,595 - $82,000
Average salary for teachers and administrators
$57,696
*No longer employed at Center City PCS

2010-2011 Center City PCS Annual Report Page 11
Shaw Campus
Key Leadership Principal: Kyle Hill* Instructional Coach: Elizabeth Dussan
Number of teachers 18 FTE
Number of teacher aides 3 FTE
Average class size 22.3
Qualifications and assignments of school staff
Assignment Qualifications
11 Classroom teachers 2 Art, Music, Dance, Spanish teachers .5 PE teacher 1.5 Bilingual/ESL teacher 3 SPED teachers 1 Reading Specialist 1 Counselor 1 Instructional Coach 3 Classroom Aides
BA MA Degree in field HQT
100% 100% 100% 100% 100% 100% 100% 100% 66%
63% 0% 0% 100% 66% 100% 100% 0% 0%
18% 50% N/A 0% 0% 0% 100% 0% N/A
91% 100% N/A N/A N/A 100% N/A N/A 100%
Staff attrition rate 54%
Salary range for teachers and administrators
$45,595 - $92,000
Average salary for teachers and administrators
$56,647
Trinidad Campus
Key Leadership Principal: Monica Evans* Instructional Coach: Travis Bouldin
Number of teachers 16.25 FTE
Number of teacher aides 4 FTE
Average class size 22.6
Qualifications and assignments of school staff
Assignment Qualifications
11 Classroom teachers 2.5 Art, Music, Dance, Spanish teachers 0.5 PE teacher .25 Bilingual/ESL teachers 2 SPED teachers .75 Reading Specialist 1 Counselor 1 Instructional Coach 4 Classroom Aides
BA MA Degree in field HQT
100% 100% 100% 100% 100% 100% 100% 100% 25%
36% 20% 100% 100% 100% 100% 100% 100% 0%
18% 50% N/A 0% 0% 0% 100% 0% N/A
91% 100% N/A N/A N/A 100% N/A N/A 100%
Staff attrition rate 9%
Salary range for teachers and administrators
$50,324 - $91,850
Average salary for teachers and administrators
$56,647
*No longer employed at Center City PCS

2010-2011 Center City PCS Annual Report Page 12
D. School Characteristics
Center City PCS (LEA)
Number of students enrolled by grade Grade Number
PreK K 1st 2nd 3rd 4th 5th 6th 7th 8th Total
119 139 139 144 133 149 134 136 114 99 1306
Student Attrition Rate during the year reported
5.1% (Powerschool)
Student Re-enrollment 71.6%
Demographics Ethnicity Number %
Hispanic Non-Hispanic
206 1100
15.8% 84.2%
Race Number %
Black Asian White American Indian/Native Mixed
1085 6 13 200 2
83.1% 0.5% 1% 15.3% 0.1%
Gender Number %
Female Male
659 647
50.5% 49.5%
Percentage of limited- and non-English proficient students
14.70%
Percentage of students with special education IEPs
10.70%
Percentage of students qualifying for free or reduced price lunch program
84.30%
Average daily membership 91.2% (Powerschool)
Average daily attendance 92.1% (Powerschool)
Promotion Rate 96.4% (Powerschool)
*based on count day data submitted, not audited

2010-2011 Center City PCS Annual Report Page 13
Brightwood Campus
Number of students enrolled by grade Grade Number
PreK K 1st 2nd 3rd 4th 5th 6th 7th 8th Total
19 25 26 25 26 26 18 15 14 15 209
Student Attrition Rate during the year reported
2.9% (Powerschool)
Student Re-enrollment 74.9%
Demographics Ethnicity Number %
Hispanic Non-Hispanic
84 125
40.2% 59.8%
Race Number %
Black Asian White American Indian/Native Mixed
123 0 2 84 0
58.9% 0% 1% 40.1% 0%
Gender Number %
Female Male
102 107
48.8% 51.2%
Percentage of limited- and non-English proficient students
41%
Percentage of students with special education IEPs
9%
Percentage of students qualifying for free or reduced price lunch program
94%
Average daily membership 93.9% (Powerschool)
Average daily attendance 94.2% (Powerschool)
Promotion Rate 98% (Powerschool)

2010-2011 Center City PCS Annual Report Page 14
Capitol Hill Campus
Number of students enrolled by grade Grade Number
PreK K 1st 2nd 3rd 4th 5th 6th 7th 8th Total
21 20 25 25 20 27 25 24 17 15 219
Student Attrition Rate during the year reported
6.4% (Powerschool)
Student Re-enrollment 71.3%
Demographics Ethnicity Number %
Hispanic Non-Hispanic
3 216
1.4% 98.6%
Race Number %
Black Asian White American Indian/Native Mixed
209 2 4 2 2
95.4% 0.9% 1.9% 0.9% 0.9%
Gender Number %
Female Male
106 113
48.4% 51.6%
Percentage of limited- and non-English proficient students
1%
Percentage of students with special education IEPs
14%
Percentage of students qualifying for free or reduced price lunch program
77%
Average daily membership 95% (Powerschool)
Average daily attendance 92.5% (Powerschool)
Promotion Rate 98.1% (Powerschool)

2010-2011 Center City PCS Annual Report Page 15
Congress Heights Campus
Number of students enrolled by grade Grade Number
PreK K 1st 2nd 3rd 4th 5th 6th 7th 8th Total
18 21 16 18 17 24 16 27 26 17 200
Student Attrition Rate during the year reported
11.5% (Powerschool)
Student Re-enrollment 53.3%
Demographics Ethnicity Number %
Hispanic Non-Hispanic
0 200
0% 100%
Race Number %
Black Asian White American Indian/Native Mixed
200 0 0 0 0
100% 0% 0% 0% 0%
Gender Number %
Female Male
105 95
52.5% 47.5%
Percentage of limited- and non-English proficient students
0%
Percentage of students with special education IEPs
6.8%
Percentage of students qualifying for free or reduced price lunch program
91%
Average daily membership 71.9% (Powerschool)
Average daily attendance 87.9% (Powerschool)
Promotion Rate 95.1% (Powerschool)

2010-2011 Center City PCS Annual Report Page 16
Petworth Campus
Number of students enrolled by grade Grade Number
PreK K 1st 2nd 3rd 4th 5th 6th 7th 8th Total
20 25 25 25 24 26 25 23 20 16 229
Student Attrition Rate during the year reported
2.6% (Powerschool)
Student Re-enrollment 78.2%
Demographics Ethnicity Number %
Hispanic Non-Hispanic
93 136
40.6% 59.4%
Race Number %
Black Asian White American Indian/Native Mixed
134 0 3 92 0
58.5% 0% 1.3% 40.2% 0%
Gender Number %
Female Male
112 117
48.9% 51.1%
Percentage of limited- and non-English proficient students
32%
Percentage of students with special education IEPs
22%
Percentage of students qualifying for free or reduced price lunch program
80%
Average daily membership 97% (Powerschool)
Average daily attendance 95.7% (Powerschool)
Promotion Rate 96% (Powerschool)

2010-2011 Center City PCS Annual Report Page 17
Shaw Campus
Number of students enrolled by grade Grade Number
PreK K 1st 2nd 3rd 4th 5th 6th 7th 8th Total
20 26 24 25 24 23 25 23 18 15 223
Student Attrition Rate during the year reported
2.7% (Powerschool)
Student Re-enrollment 70.1%
Demographics Ethnicity Number %
Hispanic Non-Hispanic
22 201
9.9% 90.1%
Race Number %
Black Asian White American Indian/Native Mixed
196 4 4 19 0
87.9% 1.8% 1.8% 8.5% 0%
Gender Number %
Female Male
113 110
50.7% 49.3%
Percentage of limited- and non-English proficient students
7%
Percentage of students with special education IEPs
14.7%
Percentage of students qualifying for free or reduced price lunch program
88%
Average daily membership 96.2% (Powerschool)
Average daily attendance 94.9% (Powerschool)
Promotion Rate 97.7% (Powerschool)

2010-2011 Center City PCS Annual Report Page 18
Trinidad Campus
Number of students enrolled by grade Grade Number
PreK K 1st 2nd 3rd 4th 5th 6th 7th 8th Total
21 22 23 26 22 23 25 24 19 21 226
Student Attrition Rate during the year reported
4.9% (Powerschool)
Student Re-enrollment 80.2%
Demographics Ethnicity Number %
Hispanic Non-Hispanic
4 222
1.8% 98.2%
Race Number %
Black Asian White American Indian/Native Mixed
223 0 0 3 0
98.7% 0% 0% 1.3% 0%
Gender Number %
Female Male
119 107
52.7% 47.3%
Percentage of limited- and non-English proficient students
1%
Percentage of students with special education IEPs
11%
Percentage of students qualifying for free or reduced price lunch program
76%
Average daily membership 95.7% (Powerschool)
Average daily attendance 90% (Powerschool)
Promotion Rate 94% (Powerschool)
2010-2011 Center City PCS Annual Report Page 19
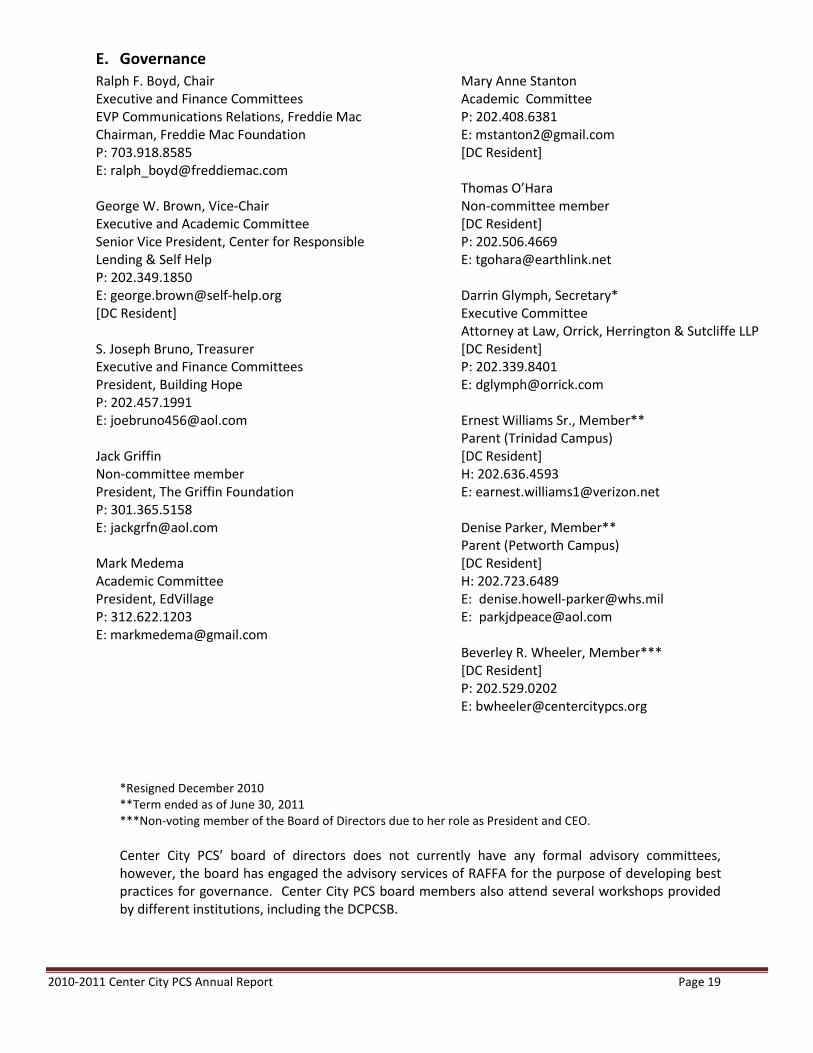
E. Governance
Ralph F. Boyd, Chair Executive and Finance Committees EVP Communications Relations, Freddie Mac Chairman, Freddie Mac Foundation P: 703.918.8585 E: [email protected] George W. Brown, Vice-Chair Executive and Academic Committee Senior Vice President, Center for Responsible Lending & Self Help P: 202.349.1850 E: [email protected] [DC Resident] S. Joseph Bruno, Treasurer Executive and Finance Committees President, Building Hope P: 202.457.1991 E: [email protected] Jack Griffin Non-committee member President, The Griffin Foundation P: 301.365.5158 E: [email protected] Mark Medema Academic Committee President, EdVillage P: 312.622.1203 E: [email protected]
Mary Anne Stanton Academic Committee P: 202.408.6381 E: [email protected] [DC Resident]
Thomas O’Hara Non-committee member [DC Resident] P: 202.506.4669 E: [email protected] Darrin Glymph, Secretary* Executive Committee Attorney at Law, Orrick, Herrington & Sutcliffe LLP [DC Resident] P: 202.339.8401 E: [email protected] Ernest Williams Sr., Member** Parent (Trinidad Campus) [DC Resident] H: 202.636.4593 E: [email protected]
Denise Parker, Member** Parent (Petworth Campus) [DC Resident] H: 202.723.6489 E: [email protected] E: [email protected] Beverley R. Wheeler, Member*** [DC Resident] P: 202.529.0202 E: [email protected]
*Resigned December 2010 **Term ended as of June 30, 2011 ***Non-voting member of the Board of Directors due to her role as President and CEO.
Center City PCS’ board of directors does not currently have any formal advisory committees, however, the board has engaged the advisory services of RAFFA for the purpose of developing best practices for governance. Center City PCS board members also attend several workshops provided by different institutions, including the DCPCSB.
2010-2011 Center City PCS Annual Report Page 20
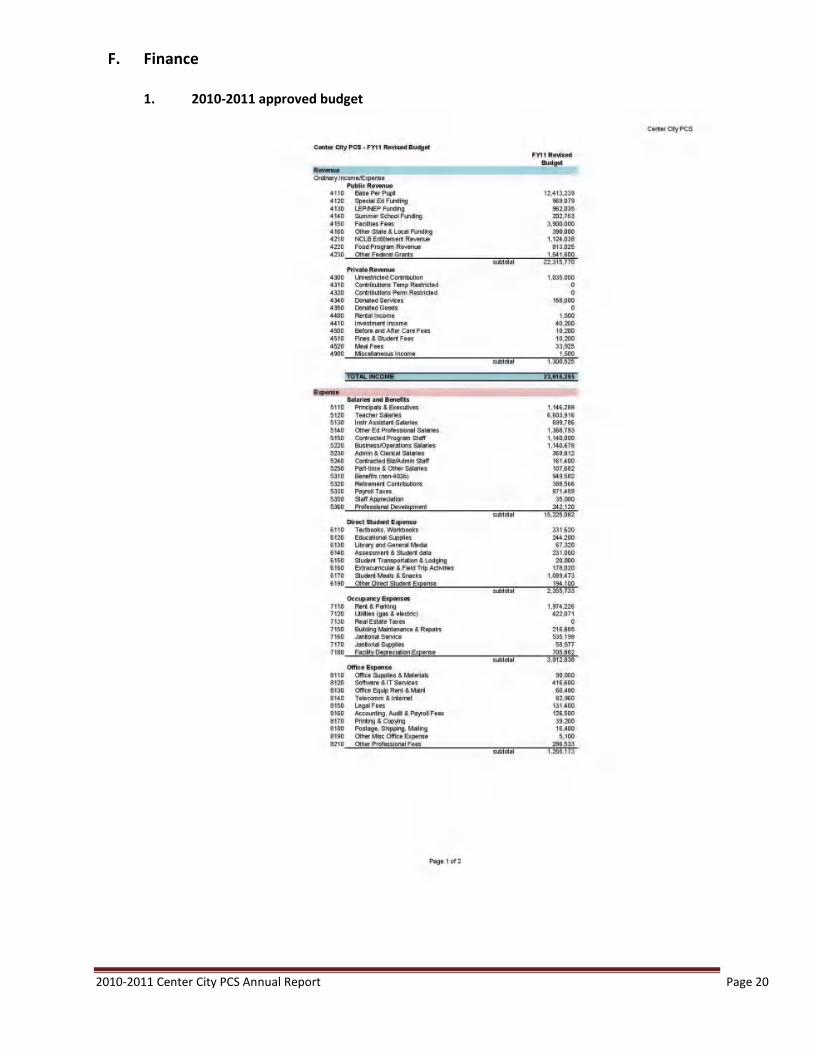
F. Finance
1. 2010-2011 approved budget

2010-2011 Center City PCS Annual Report Page 21

2010-2011 Center City PCS Annual Report Page 22
2. Donors and grantors equaling or exceeding $500
Center City Public Charter Schools
List of Donors with Amount over $500
For the period: July 1, 2010 to June 30, 2011
S. Nos. Name of Donors Amount $ Notes
1 M&T Charitable Foundation 2,500.00 Awards for educational staff
2 Hattie M. Strong Foundation
30,000.00 for out of school time science programs
3 Anonymous Donor 3,800.00 for a board and a projector -technology needs
4 Blessed Sacrament Sanctuary Sodality 1,000.00 for technology and student incentives
TOTAL
37,300.00

2010-2011 Center City PCS Annual Report Page 23
II. School Performance
A. Evidence of Performance and Progress
1. Performance Management Measures Center City PCS continued to use the Performance Management Measures laid out by the DCPCSB last school year to inform our School Improvement Plans and measure student growth. Center City PCS uses system-wide assessments, in addition to DCCAS, to evaluate student performance in core subjects and learning objectives. Student achievement and growth are measured using the Dynamic Indicator of Basic Early Literacy Skills (DIBELS) Language Arts benchmark assessments for our early childhood grades, in addition to Text Reading Comprehension (TRC) Screening, and the Test for Early Mathematics Ability (TEMA). For our PreK students, both the Phonological Awareness and Literacy Skills (PALS) and mCLASS: CIRCLE assessments provide both a measure of school readiness in the Fall and Kindergarten readiness in the Spring. The Performance Series Reading and Math tests for our elementary and middle school students help measure student knowledge among subject areas and content in preparation for DC-CAS. (Please see Appendix G for test examples). a. Student Academic Performance
Brightwood Campus Early Childhood Framework Student Progress Center City PCS Brightwood Pre-Kindergarten students maintained the same level of achievement (100%) in the Spring benchmark of the PALS Assessment in Spring 2010 and Spring 2011. Center City PCS Brightwood Kindergarten – 2nd grade cohort maintained a comparable level of proficiency in the DIBELS assessment (69% in 2010 and 65% in 2011), and experienced growth in TEMA (91.3%) compared to the 2010 benchmark (63%). For the 2010-11 SY, Center City PCS added TRC Screenings for the PreK – 2nd grade cohort, with 61.3% of students at benchmark or above. Student Achievement 100% of Center City PCS Brightwood Pre-Kindergarten students met the Spring benchmark on the PALS Assessment. The number of proficient and advanced students grew from 45% and 20% respectively in the Fall to 6% and 94% respectively in the Spring. 100% of Center City PCS Brightwood Pre-Kindergarten students also assessed at the satisfactory level on the Circle Math Assessment. These are positive indicators for Kindergarten readiness. Students at Center City PCS Brightwood take: the DIBELS Assessment and TRC Screening three times a year to assess their proficiency on phonics, reading fluency, and comprehension related measures; and the TEMA assessments three times a year to assess their math proficiency. Their results at the Spring benchmark assessment were:

2010-2011 Center City PCS Annual Report Page 24
Class DIBELS
(Reading Indicators) Students at Benchmark
TRC (Reading Level) Students at/above
Benchmark
TEMA (Math Ability) Students at or
above grade level
Kindergarten 82% 81% 86%
1st Grade 50% 23% 92%
2nd
Grade 63% 80% 96%
The number of Kindergarten and 1st grade students making the DIBELS Benchmark increased by 26% and 7% respectively between the Winter and Spring testing cycles and the percentage of Intensive 1st grade students decreased by 50% between Winter and Spring.
For SY2011-2012, it is Center City PCS Brightwood’s goal that all PreK-2nd grade students will meet 100% the benchmarks set in the above assessments.
Leading Indicators The attendance rate for the 2010-2011 school year was 93.5% at Center City PCS Brightwood and the reenrollment rate was 81.25% for the returning Kindergarten – 2nd grade cohort.
Elementary School Framework Student Progress Overall, Center City PCS Brightwood experienced growth from the 2010 DC CAS scores to the 2011 DC CAS scores. Brightwood’s 5th grade experienced growth both in Reading and Math, having scored 59% proficiency and advanced in Reading, up from 55% in 2010 and 35% proficiency and advanced in Math, up from 30% in 2010. Brightwood’s 4th grade experienced growth both in Reading and Math, having scored 40% proficiency or advanced in Reading, up from 25% in 2010 and 36% proficiency or advanced in Math, up from 8% in 2010. Brightwood’s 3rd grade experienced growth both in Reading and Math, having scored 35% proficiency and advanced in Reading, up from 18% in 2010 and 12% proficiency and advanced in Math, up from 9% in 2010.
In the 2010-11 SY, Center City PCS engaged in a robust discussion on measuring student growth and proficiency. Proficiency was defined as the number of students meeting the target goal of two grade levels per year in reading and a 75% comprehension of mathematics, and progress was defined as the number of students who showed measurable growth toward the target goal. In the 4th quarter, Center City PCS set out to measure progress: students were tested to determine growth toward the target goals in reading and math and to assess SIP goals. At Center City PCS Brightwood, of the 3rd through 5th graders tested on the Performance Series Reading and Math assessments, 69.1% showed statistically significant growth in Reading and 80.8% showed statistically significant growth in Math. The percentage of students growing a year or more was 40.8% in Reading and 46.8% in Math.
Student Achievement 29 students (42.6%) in the 3rd through 5th grades at the Center City PCS Brightwood scored proficient or advanced in Reading on the 2011 DC CAS and 18 students (26.4%)

2010-2011 Center City PCS Annual Report Page 25
scored proficient or advanced in Math. We saw growth in Math in the 3rd-5th grade cohort, up from 16% in the 2010 tests.
Gateway 9 students (34.6%) in the third grade scored proficient or advanced in Reading on the 2011 DC CAS. This represents growth in Reading, up from 18% in the 2010 test. Leading Indicators The attendance rate for the 2010-2011 school year was 93.5% at the Center City PCS Brightwood and the reenrollment rate was 80.4% for the returning 3rd – 5th grade cohort. Mission Specific Indicators Having reframed annual growth level targets in reading at two grade levels above, and in math as 75% understanding of mathematical concepts taught, assessing and reporting growth has dramatically changed from the previous school year. In Reading, according to Brightwood’s data from Performance Series Assessments:
At the end of the year, 34.6% of 3rd grade students met the target;
At the end of the year, 44% of 4th grade students met the target; and
At the end of the year, 41.2% of 5th grade students met the target. In Math, according to Brightwood’s data from Performance Series Assessments:
At the end of the year, 88% of 3rd grade students demonstrated growth;
At the end of the year, 79% of 4th grade students demonstrated growth; and
At the end of the year, 47% of 5th grade students demonstrated growth with 23% meeting the growth target.
Center City PCS Brightwood saw growth in the last quarter of the 2010-11 school year in reading and in math. Having set rigorous targets for both reading and math, fourth quarter assessments captured the growth students were experiencing. Middle School Framework Student Progress Overall, Center City PCS Brightwood experienced growth from the 2010 DC CAS scores to the 2011 DC CAS scores. Brightwood’s 8th grade experienced growth both in Reading and Math, having scored 57% proficiency and advanced in Reading, up from 56% in 2010 and 57% proficiency and advanced in Math, up from 28% in 2010. Brightwood’s 7th grade experienced growth in Math, having scored 45% proficiency and advanced, up from 26% in 2010. Brightwood’s 6th grade experienced growth in Reading, having scored 50% proficiency and advanced, up from 33% in 2010.
In the 2010-11 SY, Center City PCS engaged in a robust discussion on measuring student growth and proficiency. Proficiency was defined as the number of students meeting the target goal of two grade levels per year in reading and a 75% comprehension of mathematics, and progress was defined as the number of students who showed measurable growth toward the target goal. In the 4th quarter, Center City PCS set out to measure progress: students were tested to determine growth toward the target goals in reading and math and to assess SIP goals.

2010-2011 Center City PCS Annual Report Page 26
At Center City PCS Brightwood, of the 6th through 8th graders tested on the Performance Series Reading and Math assessments, 59.5% showed statistically significant growth in Reading and 59.5% showed growth in Math. Student Achievement 18 students (42.8%) in the 6th through 8th grades at Center City PCS Brightwood scored proficient or advanced in Reading on the 2010 DC CAS and 17 students (40.4%) scored proficient or advanced in Math. We saw growth in Math in the 6th – 8th grade cohort, up from 26% in the 2010 tests. Gateway 8 students (53.3%) in the eighth grade scored proficient or advanced in Math on the 2011 DC CAS. This represents growth in Math, up from 28% in the 2010 test.
Leading Indicators The attendance rate for the 2010-2011 school year was 93.5% at Center City PCS Brightwood and the reenrollment rate was 59.6% for returning 6th – 8th grade cohort. Mission Specific Indicators Having reframed annual growth level targets in reading at two grade levels above, and in math as 75% understanding of mathematical concepts taught, assessing and reporting growth has dramatically changed from the previous school year. In Reading, according to Brightwood’s data from Performance Series Assessments:
At the end of the year, 26.7% of 6th grade students met the target;
At the end of the year, 41.7% of 7th grade students met the target; and
At the end of the year, 33.3% of 8th grade students met the target. In Mathematics, according to Brightwood’s data from Performance Series Assessments:
At the end of the year, 60% of 6th grade students demonstrated growth with 26% meeting the growth target;
At the end of the year, 75% of 7th grade students demonstrated growth with 13% meeting the growth target; and
At the end of the year, 66% of 8th grade students demonstrated growth.
Center City PCS Brightwood saw growth in both reading and math. At the end of the year assessments, a considerable portion of the 6th – 8th grade cohort saw growth from the beginning of the year. Having set rigorous targets for growth in reading and math, Center City PCS Brightwood will continue to build on 2010-11 in the upcoming 2011-12 school year.
Capitol Hill Campus Early Childhood Framework Student Progress Center City PCS Capitol Hill Pre-Kindergarten students maintained the same level of achievement (100%) in the Spring benchmark of the PALS Assessment in Spring 2010 and Spring 2011. Center City PCS Capitol Hill Kindergarten – 2nd grade cohort experienced growth in the DIBELS assessment from 54% in 2010 to 70% in 2011, and in

2010-2011 Center City PCS Annual Report Page 27
TEMA (80%) compared to the 2010 benchmark (68%). For the 2010-11 SY, Center City PCS added TRC Screenings for the PreK – 2nd grade cohort, with 71.6% of students at benchmark or above.
Student Achievement 89% of Center City PCS Capitol Hill Pre-Kindergarten students met the Spring benchmark on the PALS Assessment. 100% of Center City PCS Capitol Hill Pre-Kindergarten students also assessed at the satisfactory level on the Circle Math Assessment. These are positive indicators of Kindergarten readiness. Students at Center City PCS Capitol Hill take: the DIBELS Assessment and TCR Screening three times a year to assess their proficiency on phonics, reading fluency, and comprehension related measures; and the TEMA Assessments three times a year to assess their math proficiency. Their results at the Spring benchmark assessment were:
Class DIBELS (Reading Indicators)
Students at Benchmark
TRC (Reading Level) Students at/above
Benchmark
TEMA (Math Ability) Students at or
above grade level
Kindergarten 100% 100% 95%
1st Grade 77% 63% 63%
2nd
Grade 32% 52% 82%
For SY2011-2012, it is Center City PCS Capitol Hill’s goal that all PreK-2nd grade students will meet 100% the benchmarks set in the above assessments.
Leading Indicators The attendance rate for the 2010-2011 school year was 92.1% at Center City PCS Capitol Hill and the reenrollment rate was 67.7% for the returning Kindergarten – 2nd grade cohort.
Elementary School Framework Student Progress Overall, Center City PCS Capitol Hill experienced growth from the 2010 DC CAS scores to the 2011 DC CAS scores. In particular, Capitol Hill’s 5th grade scored 54% proficient or advanced in Math in 2011, up from 28% in 2010, and 33% in Reading, up from 28% in 2010. Capitol Hill’s 3rd grade also saw growth, scoring 40% proficient or advanced in Reading, up from 20% in 2010. In the 2010-11 SY, Center City PCS engaged in a robust discussion on measuring student growth and proficiency. Proficiency was defined as the number of students meeting the target goal of two grade levels per year in reading and a 75% comprehension of mathematics, and progress was defined as the number of students who showed measurable growth toward the target goal. In the 4th quarter, Center City PCS set out to measure progress: students were tested to determine growth toward the target goals in reading and math and to assess SIP goals. Further discussion can be found under the Mission Indicator section.

2010-2011 Center City PCS Annual Report Page 28
Student Achievement 24 students (33.8%) in the 3rd through 5th grades at Center City PCS Capitol Hill scored proficient or advanced in Reading on the 2011 DC CAS and 24 students (33.8%) scored proficient or advanced in Math. Gateway 8 students (40%) in the third grade scored proficient or advanced in Reading on the 2011 DC CAS. This represents growth in Reading, up from 20% in the 2010 test. Leading Indicators The attendance rate for the 2010-2011 school year was 92.1% at the Center City PCS Capitol Hill and the reenrollment rate was 76.1% for the returning 3rd – 5th grade cohort.
Mission Specific Indicators Having reframed annual growth level targets in reading at two grade levels above, and in math as 75% understanding of mathematical concepts taught, assessing and reporting growth has dramatically changed from the previous school year. In Reading, according to Capitol Hill’s data from Performance Series Assessments:
At the end of the year, 50% of 3rd grade students met the target;
At the end of the year, 51.9% of 4th grade students met the target; and
At the end of the year, 41.7% of 5th grade students met the target. In Math, according to Capitol Hill’s data from Performance Series Assessments:
At the end of the year, 80% of 3rd grade students demonstrated growth, with 50% meeting the growth target;
At the end of the year, 71% of 4th grade students demonstrated growth, with 36% having met the growth target; and
At the end of the year, 68% of 5th grade students, with 64% having met the growth target.
Center City PCS Capitol Hill is encouraged by the growth shown at both the 3rd and 4th grade level, where over half of the students in both grades are reading two whole grade levels above their grade. Equally encouraging is the growth shown in the 3rd – 5th grade cohort in math. Middle School Framework Student Progress Overall, Center City PCS Capitol Hill experienced growth from the 2010 DC CAS scores to the 2011 DC CAS scores. In particular, Capitol Hill’s 6th grade scored 58% proficient or advanced in Reading in 2011, up from 22% in 2010 and 50% in Math, up from 17% in 2010. Capitol Hill’s 7th grade also saw growth in Reading, having scored 50% proficient or advanced in 2011, up from 47% in 2010. Additionally, Capitol Hill’s 8th grade saw growth in Math, having scored 46% proficient or advanced in 2011, up from 37% in 2010. In the 2010-11 SY, Center City PCS engaged in a robust discussion on measuring student growth and proficiency. Proficiency was defined as the number of students meeting the target goal of two grade levels per year in reading and a 75% comprehension of mathematics, and progress was defined as the number of students who showed measurable growth toward the target goal. In the 4th quarter, Center City PCS set out to measure progress: students were tested to determine growth toward the target goals in

2010-2011 Center City PCS Annual Report Page 29
reading and math and to assess SIP goals. Further discussion can be found under the Mission Indicator section.
Student Achievement 26 students (49%) in the 6th through 8th grades at Center City PCS Capitol Hill scored proficient or advanced in Reading on the 2011 DC CAS and 26 students (49%) scored proficient or advanced in Math. This represents growth in Math, up from 34% in the 2010 test. Gateway 6 students (46%) in the eighth grade scored proficient or advanced in Math on the 2011 DC CAS. This represents growth in Math, up from 27% in the 2010 test. Leading Indicators The attendance rate for the 2010-2011 school year was 92.1% at Center City PCS Capitol Hill and the reenrollment rate was 69.7% in the returning 6th – 8th grade cohort.
Mission Specific Indicators Having reframed annual growth level targets in reading at two grade levels above, and in math as 75% understanding of mathematical concepts taught, assessing and reporting growth has dramatically changed from the previous school year. In Reading, according to Capitol Hill’s data from Performance Series Assessments:
At the end of the year, 41.7% of 6th grade students met the target;
At the end of the year, 52.9% of 7th grade students met the target; and
At the end of the year, 50% of 8th grade students met the target. In Mathematics, according to Capitol Hill’s data from Performance Series Assessments:
At the end of the year, 50% of 6th grade students showed growth, with 29% having met the growth target;
At the end of the year, 71% of 7th grade students showed growth, with 24% having met the growth target; and At the end of the year, 56% of 8th grade students showed growth, with 25% having met the growth target.
Center City PCS Capitol Hill is encouraged by the growth shown at both the 7th and 8th grade level, where over half of the students in both grades are reading two whole grade levels above their grade. Center City PCS is particularly encouraged by its 6th and 7th grade results in math, with at least half of the student population having shown growth since the beginning of the school year.
Congress Heights Campus Early Childhood Framework Student Progress Center City PCS Congress Heights Pre-Kindergarten students maintained the same level of achievement (100%) in the Spring benchmark of the PALS Assessment in Spring 2010 and Spring 2011. Center City PCS Congress Heights Kindergarten – 2nd grade cohort experienced growth in the DIBELS assessment from 35% in 2010 to 80.3% in 2011, and in TEMA for Kindergarten (100%) and 1st Grade (80%) compared to 78% in 2010’s

2010-2011 Center City PCS Annual Report Page 30
Kindergarten – 2nd grade cohort (Congress Heights 2nd grade TEMA scores are not available). For the 2010-11 SY, Center City PCS added TRC Screenings for the PreK – 2nd grade cohort, with 83.3% of students at benchmark or above. Student Achievement 100% of Center City PCS Congress Heights Pre-Kindergarten students met the Spring benchmark on the PALS Assessment. 100% of Center City PCS Congress Heights Pre-Kindergarten students also assessed at the satisfactory level on the Circle Math Assessment. These are positive indicators of Kindergarten readiness. Students at Center City PCS Congress Heights take: the DIBELS Assessment and TRC Screening three times a year to assess their proficiency on phonics, reading fluency, and comprehension related measures; and the TEMA Assessments three times a year to assess their math proficiency. Their results at the Spring benchmark assessment were:
Class DIBELS (Reading Indicators)
Students at Benchmark
TRC (Reading Level) Students at/above
Benchmark
TEMA (Math Ability) Students at or
above grade level
Kindergarten 95% 100% 100%
1st Grade 75% 75% 80%
2nd
Grade 71% 75% N/A
For SY2011-2012, it is Center City PCS Congress Height’s goal that all PreK-2nd grade students will meet 100% the benchmarks set in the above assessments. Leading Indicators The attendance rate for the 2010-2011 school year was 87.9% at the Center City Congress Heights Campus and the reenrollment rate was 63% in the returning Kindergarten – 2nd grade cohort. Elementary School Framework Student Progress Center City PCS Congress Heights experienced growth from the 2010 DC CAS scores to the 2011 DC CAS scores. In particular, Congress Heights’ 5th grade scored 16% proficient or advanced in Math in 2011, up from 7% in 2010 and 24% in Reading, up from 20% in 2010. Congress Heights’ 4th grade also saw growth, scoring 17% proficient or advanced in Reading, up from 6% in 2010. In the 2010-11 SY, Center City PCS engaged in a robust discussion on measuring student growth and proficiency. Proficiency was defined as the number of students meeting the target goal of two grade levels per year in reading and a 75% comprehension of mathematics, and progress was defined as the number of students who showed measurable growth toward the target goal. In the 4th quarter, Center City PCS set out to measure progress: students were tested to determine growth toward the target goals in reading and math and to assess SIP goals. Further discussion can be found in the Mission Specific section.
Student Achievement 13 students (23.6%) in the 3rd through 5th grades at Center City PCS Congress Heights scored proficient or advanced in Reading on the 2011 DC CAS and 9 students (16.4%)

2010-2011 Center City PCS Annual Report Page 31
scored proficient or advanced in Math. We saw growth in Math, up from 6% in the 2010 test. Gateway 2 students (12.5%) in the third grade scored proficient or advanced in Reading on the 2010 DC CAS. Leading Indicators The attendance rate for the 2010-2011 school year was 87.9% at the Center City PCS Congress Heights Campus and the reenrollment rate was 46.7% in the returning 3rd – 5th grade cohort. Mission Specific Indicators Having reframed annual growth level targets in reading at two grade levels above, and in math as 75% understanding of mathematical concepts taught, assessing and reporting growth has dramatically changed from the previous school year. In Reading, according to Congress Heights’ data from Performance Series Assessments:
At the end of the year, 44.4% of 3rd grade students met the target;
At the end of the year, 56.5% of 4th grade students met the target; and
At the end of the year, 68.7% of 5th grade students met the target. In Math, according to Congress Heights’ data from Performance Series Assessments:
At the end of the year, 86% of 3rd grade students demonstrated growth;
At the end of the year, 86% of 4th grade students demonstrated growth; and
At the end of the year, 56% of 5th grade students demonstrated growth with 18% having met the growth target.
Center City PCS Congress Heights is encouraged by the growth shown at both the 4th and 5thy grade level, where over half of the students in both grades are reading two whole grade levels above their grade. Equally encouraging is the growth shown at the 3rd and 4th grade level in math.
Middle School Framework Student Progress Center City PCS Congress Heights’ experienced growth from the 2010 DC CAS scores to the 2011 DC CAS scores. In particular, Congress Height’s 8th grade scored 71% proficiency or advanced in Reading, up from 59% in 2010. As well, Congress Heights’ 6th grade experienced growth in Reading, having scored 13% proficiency or advanced, up from 0% in 2010, and in Math, having scored 21% proficiency or advanced, up from 7% in 2010.
In the 2010-11 SY, Center City PCS engaged in a robust discussion on measuring student growth and proficiency. Proficiency was defined as the number of students meeting the target goal of two grade levels per year in reading and a 75% comprehension of mathematics, and progress was defined as the number of students who showed measurable growth toward the target goal. In the 4th quarter, Center City PCS set out to measure progress: students were tested to determine growth toward the target goals in reading and math and to assess SIP goals. Further discussion can be found under the Mission Specific section.
2010-2011 Center City PCS Annual Report Page 32
Student Achievement 24 students (39.3%) in the 6th through 8th grades at Center City PCS Congress Heights scored proficient or advanced in Reading on the 2011 DC CAS and 15 students (24.6%) scored proficient or advanced in Math. We saw growth in both Reading and Math in comparison to the 2010 test. A highlight is that 10 students (71%) in the eighth grade scored proficient or advanced in Reading on the 2011 DC CAS. Gateway 4 students (28.6%) in the eighth grade scored proficient or advanced in Math on the 2010 DC CAS. Leading Indicators The attendance rate for the 2010-2011 school year was 87.9% at the Center City Congress Heights Campus and the reenrollment rate was 51.5% in the returning 6th – 8th grade cohort. Mission Specific Indicators Having reframed annual growth level targets in reading at two grade levels above, and in math as 75% understanding of mathematical concepts taught, assessing and reporting growth has dramatically changed from the previous school year. In Reading, according to Congress Heights’ data from Performance Series Assessments:
At the end of the year, 44% of 6th grade students met the target;
At the end of the year, 43.5% of 7th grade students met the target; and
At the end of the year, 37.5% of 8th grade students met the target.
In Mathematics, according to Congress Heights’ data from Performance Series Assessments:
At the end of the year, 63% of 6th grade students demonstrated growth;
At the end of the year, 50% of 7th grade students demonstrated growth; and
At the end of the year, 57% of 8th grade students demonstrated growth.
Center City PCS Congress Heights experienced growth in 6th- 8th grade cohort. The eighth grade level results are of particular interest. Congress Heights’ 8th grade achieved 71% proficiency or advanced in the 2011 DC CAS. However, Performance Series data shows that half of these students met the growth targets. This case illustrates Center City PCS’s expectations for student growth and achievement. Having set rigorous goals in Reading, Center City PCS expects more than just proficiency from all its students. Additionally, 6th – 8th grade cohort demonstrated growth in math. Over half of all 6th- 8th grade students showed growth from the beginning of the year. With rigorous targets set for both reading and math, Center City PCS Congress Heights seeks to build on the growth seen in 2010-2011 during the 2011-2012 school year.

2010-2011 Center City PCS Annual Report Page 33
Petworth Campus Early Childhood Framework Student Progress Center City PCS Petworth Pre-Kindergarten students maintained the same level of achievement (100%) in the Spring benchmark of the PALS Assessment in Spring 2010 and Spring 2011. Center City PCS Petworth Kindergarten – 2nd grade cohort experienced a regression in the DIBELS assessment from 63% in 2010 to 53% in 2011, and experienced growth in TEMA (71.7%) compared to the 2010 benchmark (49%). For the 2010-11 SY, Center City PCS added TRC Screenings for the PreK – 2nd grade cohort, with 75.6% of students at benchmark or above. Student Achievement 100% of Center City Petworth Pre-K students met the Spring benchmark on the PALS. The number of students who scored proficient increased from 21% to 100% from Fall to Spring. In addition, the average Summary Score nearly doubled from Fall to Spring (37.7 to 64.1 respectively). 84% of Center City PCS Petworth Pre-K students were also assessed at the satisfactory level on the Circle Math Assessment. These are positive indicators of Kindergarten readiness. Students at Center City PCS Petworth take: the DIBELS Assessment and TRC Screening three times a year to assess their proficiency on phonics, reading fluency, and comprehension related measures; and the TEMA Assessments three times a year to assess their math proficiency. Their results at the Spring benchmark assessment were:
Class DIBELS (Reading Indicators)
Students at Benchmark
TRC (Reading Level) Students at/above
Benchmark
TEMA (Math Ability) Students at or
above grade level
Kindergarten 83% 100% 79%
1st Grade 63% 71% 88%
2nd
Grade 13% 56% 48%
Noticeably, 83% of students in Kindergarten are at or above grade level in the DIBELS benchmark and 100% met the TRC target of proficiency levels. In 1st grade, 88% of the students scored at or above grade level on TEMA, a predictor of a good foundation for 2nd grade.
For SY2011-2012, it is Center City PCS Petworth’s goal that all PreK-2nd grade students will meet 100% the benchmarks set in the above assessments. Leading Indicators The attendance rate for the 2010-2011 school year was 95.7% at the Center City Petworth Campus and the reenrollment rate was 79.7% in the returning Kindergarten – 2nd grade cohort.
Elementary School Framework Student Progress Center City PCS Petworth experienced growth from the 2010 DC CAS scores to the 2011 DC CAS scores. Petworth’s 3rd grade experienced growth in both Reading and Math, having scored 46% proficiency and advanced in Reading, up from 22% in 2010, and 17%

2010-2011 Center City PCS Annual Report Page 34
proficiency and advanced in Math, up from 4% in 2010. Additionally, Petworth’s 5th grade experienced growth in Reading, having scored 46% in Reading, up from 26% in 2010.
In the 2010-11 SY, Center City PCS engaged in a robust discussion on measuring student growth and proficiency. Proficiency was defined as the number of students meeting the target goal of two grade levels per year in reading and a 75% comprehension of mathematics, and progress was defined as the number of students who showed measurable growth toward the target goal. In the 4th quarter, Center City PCS set out to measure progress: students were tested to determine growth toward the target goals in reading and math and to assess SIP goals. At Center City PCS Petworth, students take the Performance Series assessment to measure growth using Scaled Scores. During the school year, students in grades 3rd to 8th in Reading went from 2461 to 2527 (gains of 66 points) and in Math from 2301 to 2429 (gains of 128 points).
Student Achievement 33 students (43%) in the 3rd through 5th grades at Center City PCS Petworth scored proficient or advanced in Reading on the 2011 DC CAS and 21 students (27.6%) scored proficient or advanced in Math. We saw growth in Reading, up from 30% in the 2010 test. During the school year, students at the Petworth Campus take the Performance Series assessment to measure growth using Scaled Scores. During the school year, students in grades 3rd to 8th in Reading went from 2461 to 2527 (gains of 66 points) and in Math from 2301 to 2429 (gains of 128 points).
Gateway 11 students (45.8%) in the third grade scored proficient or advanced in Reading on the 2011 DC CAS. Leading Indicators The attendance rate for the 2010-2011 school year was 95.7% at the Center City Petworth Campus and the reenrollment rate was 83.8% in the returning 3rd – 5th grade cohort. Mission Specific Indicators Having reframed annual growth level targets in reading at two grade levels above, and in math as 75% understanding of mathematical concepts taught, assessing and reporting growth has dramatically changed from the previous school year. In Reading, according to Petworth’s data from Performance Series Assessments:
At the end of the year, 34.8% of 3rd grade students met the target;
At the end of the year, 46.2% of 4th grade students met the target; and
At the end of the year, 48% of 5th grade students met the target.

2010-2011 Center City PCS Annual Report Page 35
In Math, according to Petworth’s data from Performance Series Assessments:
At the end of the year, 65% of 3rd grade students demonstrated growth, with 17% meeting the growth target;
At the end of the year, 8% of 4th grade students demonstrated growth, with 54% meeting the growth target; and
At the end of the year, 50% of 5th grade demonstrated growth, with 31% meeting the growth target.
At Center City PCS Petworth experienced growth in the 3rd – 5th grade level cohort in both reading and math. Although over half of the 4th grade students made the growth target in math, there was minimal growth shown. Center City PCS Petworth is encouraged by the overall growth at the 5th grade level, and the growth in math experienced by its 3rd grade. Middle School Framework Student Progress Overall, Center City PCS Petworth experienced growth from the 2010 DC CAS scores to the 2011 DC CAS scores. In particular, Petworth’s 8th grade as the distinction of being the only class to achieve adequate yearly progress (AYP) in the district, with 94% proficiency in both Reading and Math, up from 69% in both Reading and Math in 2010. Additionally, Petworth’s 7th grade scored 65% proficient or advanced in both Reading and Math in 2011, which represents growth in Reading, up from 50% in 2010. Petworth’s 6th grade experienced growth in reading, having scored 43% proficient or advanced, up from 39% in 2010.
In the 2010-11 SY, Center City PCS engaged in a robust discussion on measuring student growth and proficiency. Proficiency was defined as the number of students meeting the target goal of two grade levels per year in reading and a 75% comprehension of mathematics, and progress was defined as the number of students who showed measurable growth toward the target goal. In the 4th quarter, Center City PCS set out to measure progress: students were tested to determine growth toward the target goals in reading and math and to assess SIP goals. At Center City PCS Petworth, students take the Performance Series assessment to measure growth using Scaled Scores. During the school year, students in grades 3rd to 8th in Reading went from 2461 to 2527 (gains of 66 points) and in Math from 2301 to 2429 (gains of 128 points). Student Achievement 37 students (62.7%) in the 6th through 8th grades at Center City PCS Petworth scored proficient or advanced in Reading on the 2011 DC CAS and 34 students (57.6%) scored proficient or advanced in Math. We saw growth in Reading, up from 52% in the 2010 test. A highlight is that 15 students (93.8%) in the eighth grade scored proficient or advanced in Reading on the 2011 DC CAS.
Gateway 15 students (93.8%) in the eighth grade scored proficient or advanced in Math on the 2011 DC CAS. This represents growth from 69% in the 2010 test.

2010-2011 Center City PCS Annual Report Page 36
Leading Indicators The attendance rate for the 2010-2011 school year was 95.7% at the Center City Petworth Campus and the reenrollment rate was 70.6% in the returning 6th – 8th grade cohort. Mission Specific Indicators Having reframed annual growth level targets in reading at two grade levels above, and in math as 75% understanding of mathematical concepts taught, assessing and reporting growth has dramatically changed from the previous school year. In Reading, according to Petworth’s data from Performance Series Assessments:
At the end of the year, 34.8% of 6th grade students met the target;
At the end of the year, 38.9% of 7th grade students met the target; and
At the end of the year, 18.8% of 8th grade students met the target. In Mathematics, according to Petworth’s data from Performance Series Assessments:
At the end of the year, 65.2% of 6th grade students demonstrated growth, with 13% having met the growth target;
At the end of the year, 44% of 7th grade students demonstrated growth, with 50% having met the growth target; and
At the end of the year, 50% of 8th grade students demonstrated growth, with 31.3% having met the growth target.
For reading, Center City PCS Petworth experienced overall growth. The eighth grade level results are of particular interest. Petworth’s 8th grade made AYP in the 2011 DC CAS, with a 93.8% score of proficiency or advanced. However, Performance Series data shows that only a small percentage of Petworth’s 8th grade students are reading at the advanced level. This case illustrates Center City PCS’s expectations for student growth and achievement. Having set rigorous goals in Reading, Center City PCS expects more than just proficiency from all its students. Center City PCS Petworth experienced growth in math as well at the 6th – 8th grade level. While half of the 7th grade students met the growth target, actual growth was measured at less than half. Center City PCS will seek to address those students with advanced progress through leveled interventions to continue to challenge them to additional achievement.
Shaw Campus
Early Childhood Framework Student Progress Center City PCS Shaw Pre-Kindergarten students experienced growth in the Spring benchmark of the PALS Assessment from 90% in Spring 2010 to 100%in Spring 2011. Center City PCS Shaw Kindergarten – 2nd grade cohort experienced growth in the DIBELS assessment, up from 44% in 2010 to 70.3% in 2011, and experienced growth in TEMA (70.7%) compared to the 2010 benchmark (49%). For the 2010-11 SY, Center City PCS added TRC Screenings for the PreK – 2nd grade cohort, with 72.3% of students at benchmark or above.
2010-2011 Center City PCS Annual Report Page 37
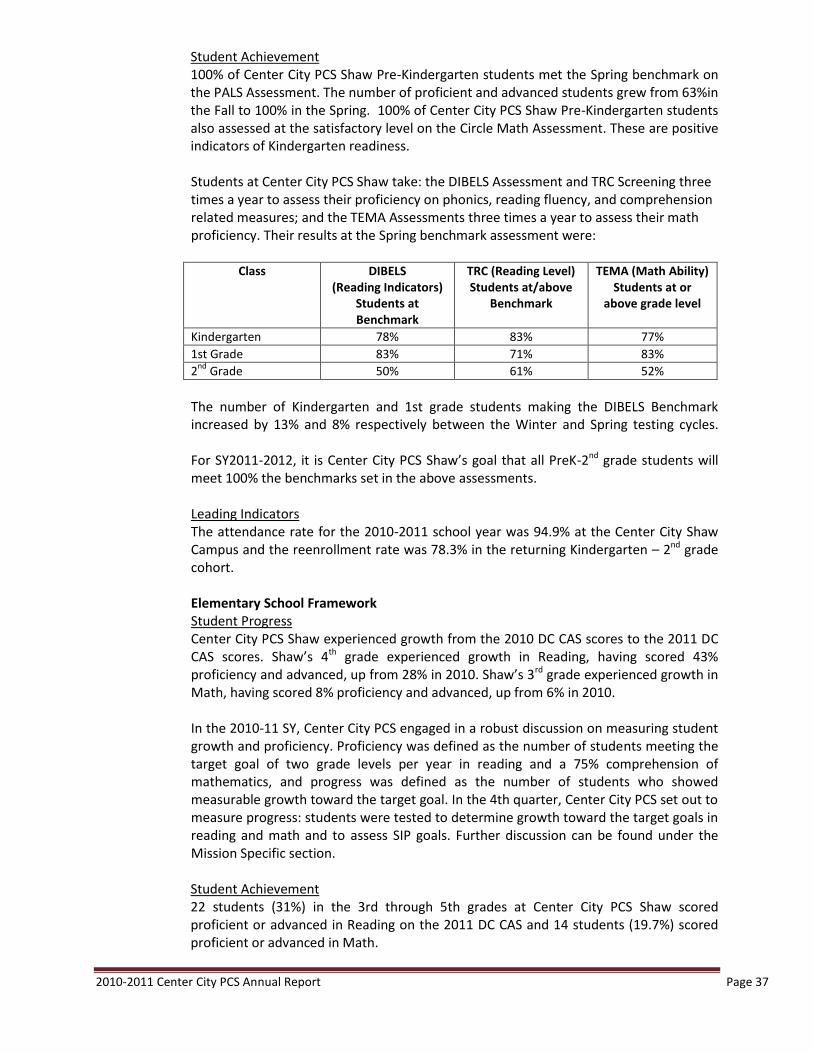
Student Achievement 100% of Center City PCS Shaw Pre-Kindergarten students met the Spring benchmark on the PALS Assessment. The number of proficient and advanced students grew from 63%in the Fall to 100% in the Spring. 100% of Center City PCS Shaw Pre-Kindergarten students also assessed at the satisfactory level on the Circle Math Assessment. These are positive indicators of Kindergarten readiness. Students at Center City PCS Shaw take: the DIBELS Assessment and TRC Screening three times a year to assess their proficiency on phonics, reading fluency, and comprehension related measures; and the TEMA Assessments three times a year to assess their math proficiency. Their results at the Spring benchmark assessment were:
Class DIBELS (Reading Indicators)
Students at Benchmark
TRC (Reading Level) Students at/above
Benchmark
TEMA (Math Ability) Students at or
above grade level
Kindergarten 78% 83% 77%
1st Grade 83% 71% 83%
2nd
Grade 50% 61% 52%
The number of Kindergarten and 1st grade students making the DIBELS Benchmark increased by 13% and 8% respectively between the Winter and Spring testing cycles. For SY2011-2012, it is Center City PCS Shaw’s goal that all PreK-2nd grade students will meet 100% the benchmarks set in the above assessments. Leading Indicators The attendance rate for the 2010-2011 school year was 94.9% at the Center City Shaw Campus and the reenrollment rate was 78.3% in the returning Kindergarten – 2nd grade cohort.
Elementary School Framework Student Progress Center City PCS Shaw experienced growth from the 2010 DC CAS scores to the 2011 DC CAS scores. Shaw’s 4th grade experienced growth in Reading, having scored 43% proficiency and advanced, up from 28% in 2010. Shaw’s 3rd grade experienced growth in Math, having scored 8% proficiency and advanced, up from 6% in 2010. In the 2010-11 SY, Center City PCS engaged in a robust discussion on measuring student growth and proficiency. Proficiency was defined as the number of students meeting the target goal of two grade levels per year in reading and a 75% comprehension of mathematics, and progress was defined as the number of students who showed measurable growth toward the target goal. In the 4th quarter, Center City PCS set out to measure progress: students were tested to determine growth toward the target goals in reading and math and to assess SIP goals. Further discussion can be found under the Mission Specific section.
Student Achievement 22 students (31%) in the 3rd through 5th grades at Center City PCS Shaw scored proficient or advanced in Reading on the 2011 DC CAS and 14 students (19.7%) scored proficient or advanced in Math.

2010-2011 Center City PCS Annual Report Page 38
Gateway 4 students (16%) in the third grade scored proficient or advanced in Reading on the 2011 DC CAS. Leading Indicators The attendance rate for the 2010-2011 school year was 94.9% at the Center City Shaw Campus and the reenrollment rate was 70% in the returning 3rd – 5th grade cohort. Mission Specific Indicators Having reframed annual growth level targets in reading at two grade levels above, and in math as 75% understanding of mathematical concepts taught, assessing and reporting growth has dramatically changed from the previous school year. In Reading, according to Shaw’s data from Performance Series Assessments:
At the end of the year, 45.8% of 3rd grade students met the target;
At the end of the year, 52.2% of 4th grade students met the target; and
At the end of the year, 40% of 5th grade students met the target. In Math, according to Shaw’s data from Performance Series Assessments:
At the end of the year, 69.5% of 3rd grade students demonstrated growth, with 13% having met growth target;
At the end of the year, 65.2% of 4th grade students demonstrated growth, with 20% having met the growth target; and
At the end of the year, 68% of 5th grade students demonstrated growth, with 18% having met the growth target.
Center City PCS Shaw is encouraged by the growth in the 4th grade level, where over half of the students met the growth target of reading two whole grade levels above the 4th grade. In Math, Shaw experienced growth in the entire 6th – 8th grade cohort. In the 2011-12 SY, Shaw expects to build on the growth experienced during the 2010-11 SY for all students to demonstrate growth and meet the growth targets. Middle School Framework Student Progress Center City PCS Shaw experienced growth from the 2010 DC CAS scores to the 2011 DC CAS scores. Shaw’s 8th grade experienced growth in Math, having scored 67% proficiency or advanced, up from 22% in 2010. Shaw’s 7th grade experienced both growth in Reading and Math, having scored 35% proficiency or advanced in both, up from 20% in Math and 30% in Reading in 2010. Shaw’s 6th grade experienced growth in Math, having scored 40% proficiency, up from 28% in 2010. In the 2010-11 SY, Center City PCS engaged in a robust discussion on measuring student growth and proficiency. Proficiency was defined as the number of students meeting the target goal of two grade levels per year in reading and a 75% comprehension of mathematics, and progress was defined as the number of students who showed measurable growth toward the target goal. In the 4th quarter, Center City PCS set out to measure progress: students were tested to determine growth toward the target goals in reading and math and to assess SIP goals. Further discussion can be found under the Mission Specific section.

2010-2011 Center City PCS Annual Report Page 39
Student Achievement 22 students (43.1%) in the 6th through 8th grades at Center City PCS Shaw scored proficient or advanced in Reading on the 2011 DC CAS and 23 students (45.1%) scored proficient or advanced in Math. The campus saw growth in Reading, up from 38% in the 2010 test. Gateway 10 students (66%) in the eighth grade scored proficient or advanced in Math on the 2011 DC CAS. Leading Indicators The attendance rate for the 2010-2011 school year was 94.9% at the Center City Shaw Campus and the reenrollment rate was 61.5% in the returning 6th – 8th grade cohort. Mission Specific Indicators Having reframed annual growth level targets in reading at two grade levels above, and in math as 75% understanding of mathematical concepts taught, assessing and reporting growth has dramatically changed from the previous school year. In Reading, according to Shaw’s data from Performance Series Assessments:
At the end of the year, 43.5% of 6th grade students met the target;
At the end of the year, 76.5% of 7th grade students met the target; and
At the end of the year, 13% of 8th grade students met the target. In Mathematics, according to Shaw’s data from Performance Series Assessments:
At the end of the year, 81% of 6th grade students demonstrated growth, with 28% having met the growth target;
At the end of the year, 82.3% of 7th grade students demonstrated growth, with 29% having met the growth target; and
At the end of the year, 66.6% of 8th grade students demonstrated growth, with 20% having met the growth target.
Center City PCS Shaw is encouraged by the growth in the 7th grade level, where over three quarters of the students met the growth target of reading two whole grade levels above the 7th grade. In Math, Shaw experienced growth in the 6th- 8th grade cohort overall. In the 2011-12 SY, Shaw expects to build on the growth experienced during the 2010-11 SY for all students to demonstrate growth and meet the growth targets.
Trinidad Campus
Early Childhood Framework Student Progress Center City PCS Trinidad Pre-Kindergarten students maintained the same level of achievement (100%) in the Spring benchmark of the PALS Assessment in Spring 2010 and Spring 2011. Center City PCS Trinidad Kindergarten – 2nd grade cohort experienced a regression in the level of proficiency from 71% in 2010 to 62.3% in 2011, and experienced growth in TEMA (83.6%) compared to the 2010 benchmark (63%). For the 2010-11 SY, Center City PCS added TRC Screenings for the PreK – 2nd grade cohort, with 79.3% of students at benchmark or above.

2010-2011 Center City PCS Annual Report Page 40
Student Achievement 95% of Center City PCS Trinidad Pre-Kindergarten students met the Spring benchmark on the PALS Assessment. 100% of Center City PCS Trinidad Pre-Kindergarten students also assessed at the satisfactory level on the Circle Math Assessment. These are positive indicators of Kindergarten readiness. Students at Center City PCS Trinidad take: the DIBELS Assessment and TRC Screening three times a year to assess their proficiency on phonics, reading fluency, and comprehension related measures; and the TEMA Assessments three times a year to assess their math proficiency. Their results at the Spring benchmark assessment were:
Class DIBELS (Reading Indicators)
Students at Benchmark
TRC (Reading Level) Students at/above
Benchmark
TEMA (Math Ability) Students at or
above grade level
Kindergarten 95% 100% 100%
1st Grade 61% 61% 78%
2nd
Grade 31% 77% 73%
For SY2011-2012, it is Center City PCS Trinidad’s goal that all PreK-2nd grade students will meet 100% the benchmarks set in the above assessments.
Leading Indicators The attendance rate for the 2010-2011 school year was 90% at Center City PCS Trinidad and the reenrollment rate was 88.1% in the Kindergarten – 2nd grade cohort. Elementary School Framework Student Progress Overall, Center City PCS Trinidad experienced growth from the 2010 DC CAS scores to the 2011 DC CAS scores. In particular, Trinidad’s 3rd grade experienced growth in both Reading and Math, having scored 61% proficiency and advanced in Reading, and 26% in Math, up from 16% in Reading and 21% in Math in 2010. Trinidad’s 5th grade also experienced growth in both Reading and Math, having scored 50% proficiency and advanced in Reading, and 29% in Math, up from 18% in Reading and 12% in Math in 2010. Trinidad’s 4th grade also experienced growth, having scored 43% proficiency or advanced in both Reading and Math, up from 9% in Reading and 28% in Math in 2010. In the 2010-11 SY, Center City PCS engaged in a robust discussion on measuring student growth and proficiency. Proficiency was defined as the number of students meeting the target goal of two grade levels per year in reading and a 75% comprehension of mathematics, and progress was defined as the number of students who showed measurable growth toward the target goal. In the 4th quarter, Center City PCS set out to measure progress: students were tested to determine growth toward the target goals in reading and math and to assess SIP goals. Further discussion can be found under the Mission Specific section.
Student Achievement 36 students (51%) in the 3rd through 5th grades at the Center City PCS Trinidad scored proficient or advanced in Reading on the 2011 DC CAS and 23 students (32.9%) scored proficient or advanced in Math. This represents growth in Reading, up from 14% and growth in Math, up from 15% in the 2010 tests.

2010-2011 Center City PCS Annual Report Page 41
Gateway 14 students (61%) in the third grade scored proficient or advanced in Reading on the 2011 DC CAS. This represents significant growth in Reading, up from 16% in the 2010 test. Leading Indicators The attendance rate for the 2010-2011 school year was 90% at Center City PCS Trinidad and the reenrollment rate was 79.2% in the returning 3rd – 5th grade cohort.
Mission Specific Indicators Having reframed annual growth level targets in reading at two grade levels above, and in math as 75% understanding of mathematical concepts taught, assessing and reporting growth has dramatically changed from the previous school year. In Reading, according to Trinidad’s data from Performance Series Assessments:
At the end of the year, 56.5% of 3rd grade students met the target;
At the end of the year, 39.1% of 4th grade students met the target; and
At the end of the year, 40% of 5th grade students met the target.
In Math, according to Trinidad’s data from Performance Series Assessments:
At the end of the year, 88% of 3rd grade students demonstrated growth;
At the end of the year, 87% of 4th grade students demonstrated growth; and
At the end of the year, 88% of 5th grade students demonstrated growth.
Center City PCS Trinidad is encouraged by the growth in the 3rd grade level, where over half of the students met the growth target of reading two whole grade levels above the 5th grade. In Math, Trinidad showed overall growth in the 3rd – 5th grade cohort. In particular, 4th grade’s end of the year average showed that students were ready for 5th grade mathematics. Middle School Framework Student Progress Overall, Center City PCS Trinidad experienced growth from the 2010 DC CAS scores to the 2011 DC CAS scores. Trinidad’s 8th grade experienced growth in both Reading and Math, having scored 65% proficiency and advanced in both Reading and Math, up from 63% in Reading and 60% in Math. Both Trinidad’s 6th and 7th grade experienced growth in Reading, with 7th grade having scored 65% proficiency and advanced, up from 61% in 2010, and 6th grade having scored 52% proficiency and advanced, up from 47% in 2010.
In the 2010-11 SY, Center City PCS engaged in a robust discussion on measuring student growth and proficiency. Proficiency was defined as the number of students meeting the target goal of two grade levels per year in reading and a 75% comprehension of mathematics, and progress was defined as the number of students who showed measurable growth toward the target goal. In the 4th quarter, Center City PCS set out to measure progress: students were tested to determine growth toward the target goals in reading and math and to assess SIP goals. Further discussion can be found under the Mission Specific section.

2010-2011 Center City PCS Annual Report Page 42
Student Achievement 35 students (58.3%) in the 6th through 8th grades at Center City PCS Trinidad scored proficient or advanced in Reading on the 2011 DC CAS and 29 students (48.3%) scored proficient or advanced in Math. Gateway 14 students (70%) in the eighth grade scored proficient or advanced in Math on the 2011 DC CAS. This represents growth in Math, up from 59% in the 2010 test. Leading Indicators The attendance rate for the 2010-2011 school year was 90% at Center City PCS Trinidad and the reenrollment rate was 73.5% in the returning 6th – 8th grade cohort. Mission Specific Indicators Having reframed annual growth level targets in reading at two grade levels above, and in math as 75% understanding of mathematical concepts taught, assessing and reporting growth has dramatically changed from the previous school year. In Reading, according to Trinidad’s data from Performance Series Assessments:
At the end of the year, 16.7% of 6th grade students met the target;
At the end of the year, 26.3% of 7th grade students met the target; and
At the end of the year, 35% of 8th grade students met the target. In Mathematics, according to Trinidad’s data from Performance Series Assessments:
At the end of the year, 63% of 6th grade students demonstrated growth;
At the end of the year, 82% of 7th grade students demonstrated growth; and
At the end of the year, 86% of 8th grade students demonstrated growth.
For reading and math, Center City PCS Trinidad experienced growth in its 6th – 8th grade cohort. Focus on growth in the 4th quarter lead to an increase in the 4th quarter testing cycle of Performance Series, which was not captured in the 2011 DC CAS. In the 2011-12 SY, Trinidad expects to build on the growth experienced during the 2010-11 SY for all students to demonstrate growth and meet the growth targets.
Special Education Vision Center City’s Department of Special Education works to ensure a Free Appropriate Public Education to our students with disabilities by providing a high-quality, meaningful educational opportunities. Our special education program educates students, to the extent possible, under inclusive, co-teaching models, ensuring all students are integrated into the school-wide culture. Student needs are met through varying levels of services as indicated on their IEP. Mission All learners will be prepared to navigate secondary and post-secondary experiences with the necessary skills and confidence. Goals

2010-2011 Center City PCS Annual Report Page 43
For the 2011-12 School Year, the Department of Special Education has created specific goals to meet the unique needs of students with disabilities. An important component of achieving these goals is ensuring all of our schools can meet the needs of our students. Our main goals for the 2011-12 School Year are:
Student with disabilities will achieve increases on interim assessments (DIBELS, A-Net, Performance Series) at 25% above the baseline from End-of-Year (EOY) 2010-11;
Students with disabilities will meet 100% of their IEP goals; and
All student records will be in 100% compliance with Federal (IDEA), Local (DCMR and OSSE Policies) laws and Central Office Processes and Procedures.
In order to achieve these goals, Center City Public Charter School will engage in a number of tasks that will lead to measurable student outcomes. Some of the required tasks Center City will complete to accomplish our goals for the Special Education Department include but are not limited to: creating a data dashboard for continuous monitoring of Special Education compliance data; training our inclusion specialists on special education process from the case manager’s perspective; training our inclusion specialists on instructional best practices for diverse learners; training inclusion specialists on data collection; teaming with the Office of the State Superintendent of Education (OSSE) on compliance and training issues to maximize program capacity.
English Language Learners
English as a Second Language (ESL) Program Curriculum Design and Instructional Approach at Center City PCS The foundation of our program is our conviction that our ELLs (English Language Learners) can be successful, given a supportive educational environment, research-based programs, and comprehensive instruction. As Center City PCS we work to address our students’ needs in a manner consistent with our educational philosophy and with the English Language Acquisition, Language Enhancement, and Academic Achievement Act under Title III. In doing so our goal is to:
Meet the annual measurable achievement objectives;
Make adequate yearly progress for Non- and Limited English Proficiency (NEP and LEP) students; and
Assess English proficiency of NEP and LEP students to ensure student progress in both language and content standards.
Program Design In designing our ESL program, we worked with the George Washington University Center for Equity and Excellence in Education (CEEE). We have incorporated their recommendations into our practices to build a program that promotes a coherent, connected, and systemic approach to educating our English language learners. Our guiding principles form the core of our program:
Learners are held to high expectations;
Learners develop full reading, writing, and spoken English language proficiency;
Learners are taught challenging core content;
Learners receive appropriate instruction;
Learners are assessed using valid assessments aligned to standards; and

2010-2011 Center City PCS Annual Report Page 44
Responsibility is shared between educators and parents for learners’ academic success.
Identification of Students The process for identifying a student begins with administering a Home Language Survey (HLS) to all students as part of the enrollment process. This HLS serves to identify language minority students, those for whom English is not their native language or who come from homes where a language other than English is spoken. Once language minority students are identified, they are assessed to determine if language support services are needed. This includes students who speak a dialect or a Native American language. Additionally, HLS also aids in the identification of families who may need to receive communication in languages other than English and other support services. Placement and Services The ACCESS for ELLs is the standard-based assessment used to measure English language proficiency in the areas of speaking, reading, writing, and listening comprehension of English. ACCESS for ELLs is only administered at the end of the school year. An abbreviated version of the ACCESS for ELLs assessment is available for placement purposes. The W-APT (WIDA ACCESS Placement Test) for students in the second semester of 1st grade to 12th grade, and the K-WAPT (Kindergarten WIDA ACCESS Placement test) for students in the first semester of PK to the first semester of 1st grade; are the state-approved placement tests that Center City PCS administers. This placement test is given once in the life-time of a student. It is administered at the beginning of the year or within 30 days of any language minority student enrolling in the school with no prior assessment of English proficiency. Students who score 1.0- 4.9 (ACCESS for ELLs/W-APT), or Low-High (K-WAPT) receive direct ESL services. Parents receive notification of their child’s eligibility prior to the start of services. In the SY10-11, 176 language minority students qualified for direct ESL services at Center City PCS. Eighty-one (81) LEP students received services at our Brightwood campus and seventy-four (74) LEP students were served at our Petworth campus. Only 9% (16 students), 2% (3 students) and 1% (2 students) of LEP students were served at Shaw, Capitol Hill and Trinidad campus, respectively. Center City PCS uses the WIDA English Language Proficiency Standards developed by the WIDA (World-Class Instructional Design and Assessment) Consortium in 2004 and revised in 2007, as the foundation for ELL students’ instruction and assessment. The WIDA ELP Standards reflect the social and academic language expectations of ELL students in grades PreK-12 attending schools in the United States. Center City PCS selected an English as a Second Language (ESL) Program Model to serve our Limited English Proficient (LEP) or non-English Proficient(NEP) students. This approach allows teachers to accommodate students from different language backgrounds in the same class and to provide instruction without being proficient in the students’ own languages. However, being aware of the effective nature of enabling language minority students to continue to develop academic content knowledge while learning the new language, we encourage teachers to use the students’ native tongue or L1 when possible and appropriate. More specifically, Center City PCS utilizes a Content-Based ESL Program or Sheltered Instruction Observational Protocol (SIOP) , teachers use English as the medium for providing content area instruction, adapting their language to the proficiency level of the students.

2010-2011 Center City PCS Annual Report Page 45
Mainstream teachers serving NEP and LEP students meet weekly with an ESL teacher responsible to serve NEP/LEP students in their classroom to create lessons that will meet the needs of all learners. ESL and mainstream teacher co-plan for different co-teaching models to take place. The following co-teaching models are the most commonly used by ESL and mainstream teachers at Center City PCS: “One-teach, one drift” and “Station Teaching.” ESL teachers are mostly responsible for vocabulary development. Grammar, phonics and reading comprehension review are also focus of attention of ESL teachers with LEP students needing support in these areas. Center City PCS may also use a pull-out ESL model to support ELLs at entering and beginning levels of proficiency in English (levels 1.0-2.5 or Low) and in need of more individualized instruction, thus ensuring both intensity of instruction in English language skills and content coverage. LEP students at entering levels of proficiency (level 1) may be pulled out by an ESL teacher 5 times a week for 45-75 minutes, while LEP students at beginning levels (2.0-2.5) may receive pull-out services 2-3 times a week for 45 minutes. Center City PCS offers professional development opportunities to ESL and mainstream teachers to strengthen their use of sheltered English methods. Center City PCS has adopted the Sheltered Instruction Observation Protocol (SIOP) model as our Sheltered English lesson planning and delivery system. SIOP is a research-based model that proposes the use of instructional strategies such as writing and reviewing language objectives, providing frequent opportunities for interaction and language practice opportunities in all language domains, emphasizing key vocabulary, modeling, using gestures, visuals, and adapting content to all levels of proficiency for ELL students. Transition/Exiting The Center City PCS adheres to No Child Left Behind (NCLB) requirements and ensures that students, who are eligible, take the DC-CAS. ELL students who have lived in the United States and been in school for less than one year will be exempted from taking the Reading and Writing portions of the DC-CAS, but will be required to take the mathematics and science portions. ELL students who have lived in the United States and been in school for two years or more will take the full DC-CAS with the appropriate accommodations. Once a student exhibits proficiency in all modalities of language including, reading, writing, speaking, and listening, and is able to gain a composite score of 5.0 or above in the ACCESS for ELLs assessment, the student is placed on monitoring status for at least two years. While under monitoring status, the ELL student’s language, academic, and cultural growth progress is periodically evaluated. Within the two-year period or following the two years, a student may at any time be referred for re-admittance into the ESL program if deemed necessary by the team responsible for monitoring ELL students’ success in school. Performance Data for English Language Learners Based on WIDA-Access Results for the SY10-11 The ACCESS for ELLs, state-approved assessment to measure English Language Proficiency, was administered to 99%of the English Language Learners at CCPCS in the spring 2011. CCPCS met the targets for annual increases in the percentage of students making progress in learning English (AMAO 1- 55%) and the percentage of students attaining English language proficiency (AMAO 2-14%) measured by the ACCESS for ELLs

2010-2011 Center City PCS Annual Report Page 46
state-approved assessment. 60 students (55%) made progress of 0.6 points or more in their Overall Composite Score between the 2010 and 2011 test administrations. 41 students (25%) attained English language proficiency, defined by a score of 5.0 or above in the ACCESS for ELLs Overall Composite Score. The NEP/LEP subgroup at Center City PCS did not make Annual Yearly Progress (AYP) for the SY10-11. CCPCS plans to hold schools accountable for meeting AMAOs (Annual Measurable Achievement Objectives) in four different ways: Monitoring student progress on benchmark assessments; observing and providing feedback on teachers’ implementation of SIOP strategies; providing professional development to paraprofessionals serving ELLs; and facilitating frequent parent workshops dedicated to model strategies to reinforce reading fluency and comprehension, as well math computation and problem-solving skills at home. Additionally, ELLs will have more access to leveled readers and highly-engaging as well as culturally-relevant reading materials, such as graphic novels and award-winning literature in English and native language when possible. Classrooms will provide students with access to bilingual dictionaries and thesauri, word walls highlighting vocabulary with visuals, as well as connections between words in English and Spanish or cognates. Explicit math vocabulary instruction will also be observed.
b. Non-Academic Performance
Compliance review Center City PCS passed the initial screen of its compliance review.
Governance
Governance Practices Center City PCS’ Board of Directors instituted a suite of governance practices, policies and documents at inception in 2007 that included but are not limited to the following:
By-laws that outline roles, responsibilities and processes of the board (including its committee structure);
Conflict of Interest Policy;
Whistleblower Policy; and
Board member agreement document that clearly defines expectations around roles and responsibilities.
Now in its fourth year, the Board is undergoing a maturation process and is actively engaged in a formalization of key governance policies and procedures in three areas:
Committee Structure;
Succession Planning; and
Recruitment of new talent.
Governance Self-Assessment

2010-2011 Center City PCS Annual Report Page 47
The Executive Committee of the Board retained RAFFA Consulting to assist in evaluating and making recommendations with regard to governance best practices during the 2010-2011 SY. RAFFA conducted an assessment of processes, policies and/or procedures, board composition, board orientation, committee structure, and fundraising to make several recommendations to the Board of Directors to continue to discharge its responsibilities with care and passion for Center City PCS’s mission and best interest with greater effectiveness. Challenges
1. Increasing the size of the board to be better aligned with the average board composition and size of other charters in the region.
2. Increasing the breadth and depth of the Board’s expertise in key areas relevant to operating highly successful charter from a student performance and financial sustainability perspective.
3. Stabilizing turnover of the executive leadership team to ensure organizational stability and to allow the Board to become less involved in day-to-day management of the organization more focused on core Board responsibilities of governance, fiduciary oversight and strategic vision.
Successes
1. Strategically attracting, recruiting, and on-boarding several new board members during SY2010-2011.
2. Upholding the organization’s mission and vision to serve all comers and ensure that students are offered a comprehensive liberal arts education which emphasizing civic and personal virtues around character, excellence and service.
3. Achievement of academic goals as a result of recruiting and hiring the current senior leadership team.
4. Increased focus on governance through implementation of best practices and procedures as the board transitions from a founding and operating board to a governance board.
Certificate of Authorizations
Center City PCS has and maintains all authorizations (certificate of occupancies, insurance, and leases) required to operate Center City PCS are in full force and effect for each of Center City PCS’ six campuses: Brightwood, Capitol Hill, Congress Heights, Petworth, Shaw, and Trinidad. Please see the Appendix B for the board certified letter.

2010-2011 Center City PCS Annual Report Page 48
B. Lessons Learned 1. What issues, if any, were encountered in collecting and reporting data for applicable performance management framework(s)? In light of the new frameworks, what changes or improvements will be made in order to remedy these data collection issues?
Center City PCS struggled with accurately measuring student proficiency and academic growth, as well as the validity of assessments used during 2010-11 SY. Attempting to measure both proficiency and growth lead to monthly testing through Performance Series. In the 2011-12 SY, Center City PCS has adopted the best practice of using the Performance Series testing four to five times a year to more accurately assess proficiency and growth. Since longitudinal data has not been the focus, Center City PCS struggles with measuring growth of its grade level cohorts in a comparative fashion. To improve the data collection management and interpretation of student data, Center City PCS will focus in establishing both internal and external assessment tools. With authentic assessments, teachers will be asked to collect weekly student data. This process will be managed by the Assistant Principal, newly added for the 2011-12 SY with oversight by the Academic Committee. Center City PCS has implemented is upcoming 2011-12 SY a multi-tiered data reflection process. Center City PCS developed in-house assessments and performance tests in core content areas to better reflect student proficiency as well as evaluate their authentic learning experiences. We continue to experience significant challenges in collecting and reporting data around our mission-specific indicator. Given focus on character education and service learning, Center City PCS will require consistency in the daily morning meetings and gatherings across all six campuses, implement with fidelity the character education curriculum, and use a survey tool developed by a vendor to measure character growth. Early Childhood Framework During the 2010-11 SY, in addition to the use of DIBELS and TEMA at the PreK-2nd grade level, Center City PCS incorporated the Text Reading Comprehension (TRC) Screening to measure students reading at or above benchmark levels. At the PreKindergarten level, mCLASS CIRCLE was used to test for numeracy alongside the PALS for literacy. For the 2011-12 SY, the 2nd grade has been added to the Performance Series testing cycle to ensure that Center City PCS is measuring grade proficiency and is able to address deficiencies prior to the 2nd to 3rd grade transition.
2. What student-related academic issues were identified as a result of the evaluation of the school’s performance framework(s)? What program changes will be undertaken or are under consideration as a result of the evaluation of the school’s performance? As a result of careful evaluation of the student performance framework(s) for Center City PCS, it was identified that academic reform was needed to address a district-wide weakness in early literacy and mathematics. As an example, the data indicates a regression of literacy starting at 1st grade. By 2nd grade, district-wide, benchmarks were not achieved. In an effort to curtail the impact of low-performance at the early ages, a two-phase programmatic change was implemented, having as its foci increased rigor system-wide. Program implementations for Phase I included the addition of Tier 1 and Tier 2 interventions consisting of Rosetta Stone, Lexia, Treasures, Singapore Math, Math Trackers, and Gizmos.

2010-2011 Center City PCS Annual Report Page 49
Additionally, these curricula enhancements included technological integration. Netbook classroom learning stations were installed in all campuses to support differentiated instruction with web-based software and to begin the vision specific transformation into 21st century schools. District-wide evaluations have been the impetus for Phase II that has as its focus academic rigor with the full implementation of the educational plan. Hence, the goal is to have a level of rigor with broadened liberal arts curricula, consistent with the Common Core Standards, the mission, and the vision of the Center City PCS along five competencies:
Core Content
Character Education
Community Exploration
Service Learning
Authentic Experiences Center City PCS entered into School Improvement (SIP), Year 1. As such, all Center City PCS schools developed comprehensive plans with clearly delineated benchmarks for student growth and achievement. In its second year of SIP, the organization has adopted rigorous goals. These goals will impact how teachers are evaluated and how students perform academically. Delineated as such, Center City PCS will insure that 75% of its students maintain 80% or higher classroom grade point averages through small group instruction, non-web based and web-based interventions, increased staffing to reduce class size, full implementation of the curriculum, and strategic staffing at the Central Office level. 3. What program changes or improvements will be undertaken or are under consideration as a result of the most recent Program Development/Self Study Review findings?
LEA-wide In response to feedback and identified needs, Center City PCS implemented three key initiatives: increased staffing levels, culturally relevant (web-based and non-web-based) interventions, and rolled out a principal and teacher evaluation process. Increased Staffing Levels To reduce class sizes and support the data collection, management and analysis, as well as address math literacy concerns, the need for an Assistant Principal and Math Specialist were identified. Center City PCS addressed these needs for the 2011-12 SY by hiring Assistant Principals for all six campuses. The Assistant Principals will provide additional leadership, instructional support and serve as the data lead for their campus as Center City PCS strives for increased student achievement. In addition to the Reading Specialist at each campus, the position of Math Specialist was created and recruited for. (Please see Appendix F for campus staff structure). Culturally Relevant Interventions During the 2010-11 SY, Center City PCS implemented a number of culturally-relevant interventions in alignment with the organization’s mission and vision:
E-books, providing students with access to new ways to interface with technology keeping in line with our vision of 21st century learners and classrooms;
Leveled reading libraries, to support our literacy efforts; and

2010-2011 Center City PCS Annual Report Page 50
Socially just curricula with a focus on cultural relevance to include gender, class and race.
Principal and Teacher Evaluation Process During the 2010-11 SY, Center City PCS implemented a new evaluation system aligned with the core values of the organization and aligned to our mission of developing 21st Century learners and leaders, steeped in "character, excellence, and service." Given the rapid implementation of the tool and organizational realignment, ensuring that evaluations were robust enough to ensure that reflect all aspects of teacher performance was a challenge. Additionally, the organization is working to improve the frequency of evaluation so that teachers will be regularly evaluated by three members of the leadership team on a regular basis. (Please see Appendix E for successful teacher profiles). Center City PCS is still working to align early human capital decisions to data-driven evaluations. Given that our professional development calendar was pre-set and we worked with outside contractors, ensuring that professional development was individualized for teachers was also difficult. The 2011-12SY will see more individualized professional development for teachers across all six campuses, as well as greater use of prescribed interventions.
Instructional Resources Center City PCS was awarded two Office of the State Superintendent for Education (OSSE) grants this year – the Replication and Growth grant and the Quality Schools Incentive grant. These and other grant funds were used for:
Enrichment for the advanced students during the day and programming for before and after care;
Interventions for struggling students;
Relevant and targeted professional development for staff, supporting organizational goals; and
Teacher selected materials and supplies to support culturally relevant classrooms.
Data Warehousing The Pearson PowerSchool student information management system will be used to warehouse all student data. Individual student, class, and campus assessment data as well as attendance, discipline, and demographic data will be warehoused in these central locations and available for access by various Center City PCS stakeholders. Central Office and campus leadership will be the first to be trained on and receive access to both systems, followed by teachers and staff and eventually parents. Center City PCS will be investing in the ProActive, an instructional improvement system, in the SY2011-12. ProActive will provide comprehensive data to assess student achievement from a variety of perspectives, namely, student, teacher, campus, and district. Performance data will be extrapolated and made available to all stakeholders, including Central Office administration, school leaders, teachers, students, parents, and partners in order to drive student achievement and create a data-driven culture of high expectations for all. This system will also align and track scheduling, curriculum, assessment, and professional development.
Brightwood The Center City Public Charter Schools-Brightwood Campus faced another challenging year of inconsistency. For the third time in three years, the school had a new principal and many new staff, especially in the middle school. With these major staff changes there was much to be

2010-2011 Center City PCS Annual Report Page 51
done in the areas of mission, vision, culture and climate building. The school maintained a safe and respectful climate; but struggled to define and execute effective instruction. Statistically, students in our primary division (Prekindergarten through second grade) showed academic growth. Kindergarten, grade 1 and grade 2 students met the district benchmark for mathematics as based on results from the TEMA (math ability assessment). Additionally, prekindergarten students met the district benchmark in pre-math and pre-reading skills as evidenced by achievement on the Circles and PALS assessments. In our upper elementary and middle school grades, students showed the most growth in mathematics evidenced by a 9.48 point gain on the DC-CAS. Additionally, the FARM and female subgroups made AYP in mathematics on the DC-CAS. Other highlights across the campus include a $5000 competitive grant received by the middle school math and science teachers from Youth Service America-STEMester program. This grant allowed our middle school students to engage in a semester-long opportunity to address environmental issues connected to climate change, green space availability, health effects, and disaster management with the occasion to use technology to deepen and demonstrate results of their learning. The students at Brightwood constructed a sustainable garden as part of the district’s Capstone project. Youth Service America conducted an independent study which tabulated findings from students involved in the project and there is statistically significant data which reports higher academic engagement, increased ability to collaborate, and students whom develop and possess leadership skills as a result of project engagement. In the Center City District Science Fair, the Brightwood Campus experienced tremendous success. Our students won the district awards in the grades 3-5 and grades 6-8 division for “Best in Show.” In the individual competition, the Brightwood campus students won nine of the 17 awards. Two Brightwood students’ science fair projects were entered into the Citywide Science Fair and won honorable mention accolades. For the 2011-12 school year, the Brightwood Campus has the fortune of having the majority of staff members returning and the benefit of adding crucial instructional support positions, namely Assistant Principal, Math Specialist, Reading Specialist and an additional ELL Specialist. Our professional development and school goals will be based around a common, shared definition of effective instruction. With the district’s new teacher and administrator evaluation tool, this common definition will be essential to our campus success. In the classrooms, all students in Kindergarten through grade 5 will participate in homogeneous guided reading groups. By presenting reading instruction on the students’ own reading level, teachers can further meet students reading development needs in the areas of reading skill and reading strategy. In the areas of reading instruction, the Brightwood Campus will also employ the Reading Specialist and Inclusion Specialists to provide targeted small group remedial reading instruction to far below grade level students utilizing the Wilson Fundations and Wilson Reading programs. Finally, ongoing professional development will be conducted throughout the year in the areas of developing problem solving skills in mathematics.
Capitol Hill The Capitol Hill Campus of Center City PCS faced several difficult challenges in 2010-2011. One major challenge last year was a division in the staff. Some teachers felt that a few teachers were favored by the leadership team. As a result of the latter, many instructional staff members

2010-2011 Center City PCS Annual Report Page 52
lost focus of a student centered environment, which in turn resulted in a culture dominated by adult needs. In addition, many teachers felt that they did not get enough feedback from the leadership team. Because of the perceived lack of feedback, the staff did not understand what was expected of them. The lack of support was allegedly due to a “one man” leadership led solely by the Principal. There was a sense that all teachers had to operate independently. The staff identified that they needed to increase the quality of instruction to improve student achievement. They are hungry to learn how to be better for their students. The school implemented a homegrown positive behavior intervention system. The implementation of the system was inconsistently implemented. In addition, teachers felt that nothing would be done when students were sent out of their class for misbehavior. This led to an adult culture where teachers felt overwhelmed and unsupported. The lack of consistency in implementation also confused students and parents. There were several teachers who performed at very effective levels despite the overall instability of the school. The Pre-K, Kindergarten and first grade classes were able to get all of their students ready for the next grade by the end of the school year. As a result, the expectation is changing so that all students in grades Pre-K through 2nd grade will be performing above grade level by the end of each grade. This will set up our students to perform advanced when they take the DC CAS for the first time in third grade. A leadership change was enacted in the school over the summer of 2011. A “Cultural Reset” program was undertaken. Structures, routines and set behavioral standards were implemented. The master schedule was altered to allow for more student time in class, less time in transition, and day-to-day consistency of schedule. A positive behavior incentive system was adopted by the staff after reviewing what worked in the previous year’s system. This Reset initiative includes plans to invest the 2011-2012 teaching staff in a highly-structured, “no excuses” program that will empower Capitol Hill students to compete for admission into highly selective high school programs. To increase the rigor in academic performance the leadership team will continue to indoctrinate the teachers in the data-feedback loop. This will allow for a more productive conversation amongst staff of how student achievement is measured and hold all adults accountable for the success of all Scholars. The instructional leadership’s key focus will be in aligning all functions so that information and data flows smoothly and can be captured and used for effective instruction in the classroom. Lastly, common language, common routines, and common practices align all factions, which will assure a more cohesive organized school which functions as a unit rather than a divided body.
Congress Heights The Congress Heights Campus of Center City PCS faced several difficult challenges in 2010-2011. That school year witnessed a great deal of transition and the campus struggled to deliver an effective program to the students enrolled there. The school’s leadership transitioned in the Summer of 2010, and the principal did not bring a coherent vision to the team or to the greater school community. At one point early in the school year, there were seven vacancies on staff. The school had to develop multiple variations of the master schedule. As a result, the students did not have a reliably consistent set of routines in which to take comfort. Truancy rates were

2010-2011 Center City PCS Annual Report Page 53
high. Student, and staff, absenteeism reached unacceptably high levels. Academic performance was low, with the average DC-CAS score registering well below the public school average in the District of Columbia. There were several teachers who performed at very effective levels despite the overall instability of the school. Congress Heights’ pre-kindergarten, kindergarten, and first grade classes were particularly strong. The teachers of those classes managed their students’ behaviors in a fair, consistent manner, and the classes were well-planned and competently executed. Students demonstrated a great deal of growth in all of the early childhood classes. Indeed, many students in grades pre-K through one achieved more than 2 years of growth in both reading and mathematics. All three of these effective teachers are returning to the Congress Heights team in 2011-2012. This bodes well for the future of the school and its students. Some students, too, performed well despite the difficulties experienced by the school as a whole. Middle school student Donia Miller took first place in the Center City PCS district-wide Spelling Bee and she advanced deep into the city-wide competition. A leadership change was enacted on the school at the end of the third academic quarter in April 2011. A “Cultural Re-Set” program was undertaken. Structures, routines, and set behavioral standards were implemented. The master schedule was altered to allow for more student time in class, less time in transition, and day-to-day consistency of schedule. A positive behavior incentive system was adopted and showed appealing results (ie number of classroom referrals diminished, more time spent on task). This Re-Set initiative will continue throughout the summer, and plans are underway to invest the 2011-2012 teaching staff in a highly-structured, “no excuses” program that will empower Congress Heights students to compete for admission into highly selective high school programs.
Petworth The Petworth campus began the 2010-2011 school year having made small gains in both reading and math in the DC CAS. The students in grades 3 through 8 made 4.9 % gains in math and the students in grades 3 through 8 made only 0.68% gains in reading. Using this data a strategic improvement plan was put into place to address the areas of reading, math and writing. The yearly goals for these areas were as follows:
Priority Goal 1: Increase the number of students reading on grade level
Priority Goal 2: Increase student proficiency in mathematics
Priority Goal 3: Increase student proficiency in technical writing. The focus for the year was to move all students to proficiency and or advanced by the end of the school year. During the school year, students at the Petworth Campus took several assessments to track their performance. The assessments used provided data on proficiency and growth. Students in grades third through eighth grades took the Achievement Network Assessment four times during the school year to track their growth towards proficiency. Assessments were also given monthly to track progress towards the School Improvement goals using the computer based assessment Performance Series. During each administration, students scored better in reading than in Math. The Petworth Campus found that the students did not meet the benchmarks in math during the 2nd, 3rd and 4th quarter. It is important to note that the Petworth Campus lost its Middle School Math teacher during the middle of the school year, which affected the overall

2010-2011 Center City PCS Annual Report Page 54
performance of the school. Teachers worked together to ensure that students were covering and mastering standards by using small group instruction and interventions on a daily basis. Students tracked their performance after the interventions were put in place and specialists worked with students using on line interventions to ensure that students were making progress. At the campus we held Math Bees and other incentives to help students master math standards. Despite these interventions, during the 2010-2011 school year, Center City PCS Petworth Campus saw its greatest challenge in maintaining the growth of students in math. End of the year assessments given to students in Pre-K through second grade show the Pre-Kindergarten, Kindergarten and 1st grade classes meeting all of their benchmark goals. However, our second grade class did not meet any of the targets and benchmarks. To remediate some of the challenges the second grade class was divided in small groups and worked with the ESL and Reading Specialists in small groups and also with on line interventions such as Razzkids and Lexia. Despite this approach, the second graders did not meet the benchmarks in DIBELS and TEMA. Writing was also major area of challenge. Classroom writing protocols were implemented to help students begin to think more critically about writing. Brief Constructed Responses were used in all subject areas to maximize the amount of time students had for writing. Writing strategies and exemplars were used to ensure that our students improved their writing skills. In terms of culture and climate, the Petworth Campus has high parental involvement, but needs to continue to work on ways to communicate more effectively with parents. A newsletter is sent home every week, but often times it is not read or distributed by the students. Also, there were a lot of new teachers in the school and a new Instructional Coach. The lack of time during the school day for faculty meetings made it very difficult to get together and share best practices. It also did not allow for face to face conversations and teacher feedback. At the end of the school year, teachers and staff started to meet weekly on Fridays to share important information and updates. This really helped build more community and increased communication between the principal and faculty. The school year ended well with the notable improvement in Reading in the DCCAS with a 12% gain and making Safe Harbor in this area. The area of Math also saw improvements with a 3% gain. During the Summer School, our emphasis was in both Reading and Math. Students made great progress during the 4 weeks of school, mastering skills to be ready for the next grade.
Shaw
The Shaw Campus of Center City PCS experienced several difficult challenges during the 2010-11 school year. There was a great deal of transition amongst the leadership team, teachers, and support staff. This made it difficult for the students enrolled at the Shaw Campus to get the education they so greatly deserve. The principal resigned in early September, without having created effective operational, instructional, and behavioral expectations and procedures. The staff at the Shaw Campus rallied and demonstrated an “All hands on deck” spirit, but without a leader, was unable to establish the procedures and consistency needed to run an effective school. Many staff members had to step outside of their roles and responsibilities to ensure the day to day operation of the school, resulting in many teachers and students not receiving the support they needed to achieve success. While a new principal was hired in October, he did not actualize a coherent vision or build community amongst the staff members, students, and families. There were many behavioral challenges throughout the year, truancy rates were high, and there were limited opportunities for parents to engage in their student’s

2010-2011 Center City PCS Annual Report Page 55
education. Academic performance in grades 3-8 was low, with the average DC CAS score registering below the public school average in the District of Columbia. Despite the challenges, there were many bright spots throughout the year. The teachers in the PreK-1 grade band collaborated to establish effective procedures and classroom management systems, allowing them to maximize their instruction and students’ learning. The students in grades PreK-1 demonstrated high rates of academic success, with more than seventy-five percent of the students meeting their benchmarks on the CIRCLE, PALS, DIBELS, and TEMA assessments. All three of these effective teachers are returning to the Shaw Campus team for the 2011-12 school year. This is an extremely important step in creating a culture of high academic success and building the foundational skills of our students. All of the students at the Shaw Campus participated in a multi-disciplinary Capstone Project to research and promote healthy eating habits. As part of the project, students participated in service learning experiences. While first grade students held a bake sale of healthy treats to raise money for the Hunger Project, the sixth grade students volunteered at Old City Green nursery in the Shaw community. These service learning opportunities helped the students experience the Capstone Project on a much deeper level than simply learning about healthy food in class and allowed the students to truly live Center City’s mission of character, excellence, and service. The leadership configuration at the Shaw Campus has changed to allow for both a principal and assistant principal. This change will ensure that there is both instructional and operational leadership within the school. A master schedule has been created to allow for more targeted time on task, as well as common planning time across the grade bands and with the specialist team. This will allow teachers and administration time to reflect on and analyze student achievement data and implement the support necessary for all students at the Shaw Campus to reach their academic potential.
Trinidad The Trinidad campus began the 2010-2011 school year having made gains in the math on the DC CAS and having lost ground in reading on the DC CAS. The students in 3rd – 8th grade made 7.4% gains in math; however the students in grades 3 through 8 went down 8.09% in reading. Using this data a strategic improvement plan was put into place to address the areas of reading, math and writing. The yearly goals for these areas were as follows:
Priority Goal 1: Increase the number of students reading on grade level
Priority Goal 2: Increase student proficiency in mathematics
Priority Goal 3: Increase student proficiency in technical writing. The focus for the year was to move all students to proficiency and or advanced by the end of the school year. Students at the Trinidad Campus take several assessments throughout the school year to track their performance. The assessments used provided data on proficiency and growth. Students in grades third through eighth grades took the Achievement Network Assessment four times during the school year to track their growth towards proficiency. Assessments were also given monthly to track progress towards the School Improvement goals. During each administration students consistently scored at the proficient level. Final scores denote significant growth in

2010-2011 Center City PCS Annual Report Page 56
reading and math. Also, students in grades third through eighth consistently met the school improvement goals in reading and math for all four quarters and writing for the fourth quarter. End of the year assessments given to students in Pre-K through second grade show the Pre-Kindergarten Kindergarten classes meeting all of their benchmark goals. These gains were possible through very specific interventions and programs that were implemented during the school year. They included Saturday Academy, In-school and after school tutoring, after school study hall, focused and timely small group instruction and the implementation of on-line resources. The on-line resources used were Study Island, Dream Box, Lexia, Raz Kidz, Rosetta Stone and Renzulli. During the 2010-2011 school year, Center City PCS Trinidad saw its greatest challenge in maintaining the growth of students in math. The school creatively implemented interventions that continued to support students in the areas of math with a focus on Middle School, which is one of the largest areas of need. For example, students received whole group instruction on current standards and received small group instruction to review formally covered standards. In addition students were placed into intervention groups based on proficiency levels. They were then given the on-line accounts with Study Island that was used in class and at home. A math consultant was also used to work with identified students to continue small group focus on their areas of need. Writing was also major area of challenge. Classroom writing protocols were implemented to help students begin to think more critically about writing. A read and respond time was implemented campus wide and all students spent the beginning of each class reading and responding in writing to their reading. Center City PCS Trinidad has an established culture of high expectations for students and families. Major emphasis was put on the character program. Teachers effectively integrated the character program into all academic areas. Students and teachers are recognized for their contributions to the culture and climate of the building. Character awards were given out, shout outs for positive classroom interactions, and random acts of kindness.
Attention is needed with the integration of students with emotional disabilities into their culture of the campus. There were many struggles with effectively managing these students and the way their behaviors effected the classroom and campus environments. Also, a continued focus on engaging all parents will help to ensure all students understand and buy in to the culture of high expectations and high achievement.

2010-2011 Center City PCS Annual Report Page 57
C. Reporting Performance Management Framework Information and School Improvement Plan to Students, Teachers, Parents, and the Public Students receive the reporting information via campus and system-wide communications that address the recommendations. These may be either in oral communications in assemblies or in written communiqués such as newsletters. Quarterly parent meetings are held to engage families in their student’s learning at each stage of the year. Student progress and achievement data are reported to parents after each assessment cycle throughout the year. Teachers create reports which provide parents with information, such as student skill mastery and growth as well as suggestions for how parents can assist their children at home. Teachers attend professional development every Friday and are brought together as a group to discuss reporting information from the same sources. Additional information is provided to teachers in communications from their principals, central office emails, and campus newsletters. The public is engaged via the Center City PCS website and other electronic mediums like Facebook and community email lists. On the homepage there are consistent updates and alerts for all interested parties. Parents were encouraged to be more visible on campus and at campus events to include parenting academic workshops, content and grade level nights and academic achievement meetings. Each principal met with or spoke on the phone with every parent from their campus this year around their student’s academic achievement and areas of growth. The Common Core State Standards will be introduced to parents during the 2011-12 SY at Parent Orientation meetings in the third week of August 2011 or during Back-to-School Nights during the month of September 2011. At these meetings, parents and community members will have the opportunity to learn about the Common Core State Standards, the academic expectations of Center City as rooted in the Common Core, and the ways they can help children at home. Laminated bookmarks, with Center City-wide benchmarks and key standards, will be printed for each grade level (PreK through 8th grade) and provided to parents and community members.

2010-2011 Center City PCS Annual Report Page 58
D. Unique Accomplishments Academic Highlights District-wide growth was seen at Center City in both reading and math on the 2011 DC CAS. In the area of English Language Arts, significant growth was seen at one third of the schools. Both Petworth and Trinidad made safe harbor in ELA with scores of 52.2% and 54.6%, respectively. Both schools exceeded the DCPS and Charter School Consortium district averages of 43% and 46.1%, respectively. (Please see appendix C for further details). In the area of mathematics, gains were seen at each campus with the largest growth being seen at Brightwood, Capitol Hill, Trinidad and Petworth, with Brightwood was just shy of safe harbor with a 9.48 points gain. Noteworthy were the gains in math for subgroups at the four campuses. Table I lists the subgroups that made safe harbor in math:
Campus Sub-groups making safe harbor
Brightwood FARM, female
Capitol Hill FARM, female
Petworth LEP, Hispanic
Trinidad FARM, boys
To ensure further gains in both reading and math across the district, the district has invested in web-based and non-web-based interventions, enhanced the curricula benchmarks in math and science to increase rigor, and acquired award winning cross-core content literature to increase literacy across the district. High standards have also been set for the staff, including of monthly evaluations, and mandates for highly qualifies teachers and licensed administrators to strategically move the organization forward. Furthermore, Center City PCS has reconstituted the central office academic team with a mission to be building based while we ask that building staff be student centered. With a systems approach and a commitment to character, excellence and service, it is the belief of the Senior Leadership Team that Safe Harbor can be made in 2012. Non-Academic Highlights This past school year, Center City PCS continued several programs that were great successes. We expanded our arts program, headed by three professional educators in music, dance, and studio arts who organized the annual Visual and Performing Arts Recital. Center City PCS hosted its two signature annual academic events: a Spelling Bee and a Science Fair (Please see Appendix D). Another accomplishment that is now in its third year is the Capstone project in which all students participate. This project combines our mission of service with an academic research project. Lastly, we are proud of our large selection of clubs and sports that students may participate in during after school.
The Arts at Center City Featured in all of our six campuses, Center City PCS arts program goes beyond a simple enrichment or “specials” program as a dynamic way to incorporate academics through music, art, and dance by delivering outstanding presentations and in-class supports for core subject areas. The Center City PCS Music Department strives to educate and develop each student’s love of music. Students receive advanced preparation in music theory and sight-singing, in addition to
2010-2011 Center City PCS Annual Report Page 59
rigorous instruction in choral, scared, classical and contemporary modalities. The Dance Department strives to achieve excellence in dance performance and choreography by fostering technical and creative growth in a positive, energetic, and disciplined environment. The Art Program sparks the creative genius within each child while reinforcing the academic and social principles in our mission. Center City PCS young artists spend the school year experiencing various artistic techniques and processes, like printmaking, sculpture, and watercolor painting. These departments organized Center City PCS’ annual Visual and Performing Arts Recital in May 2011. Showcasing the artistic spirits of all of our students, Center City PCS’ recital, held at Howard University’s Cramton Auditorium was a celebration of the arts – not just dance and music, but also an art exposition to showcase the artistic talents of all our students. Academic Events Center City PCS held its two academic annual events: a system-wide Spelling Bee in December 2009 and a system-wide Science Fair in March 2010. Center City PCS’ Spelling Bee was an opportunity for all students in grades 3 – 8 to participate in a high stakes academic competition. All schools held school-wide spelling bees to select their representatives, culminating with the system-wide competition that brought together students, teachers, and parents from all of the Center City PCS campuses to crown champions for the 3rd through 4th grade, 5th through 6th grade, and 7th through 8th grade groups. This experience was again repeated in March 2011 with a system-wide Science Fair. Using scientific methodology, all PreK through 2nd grades completed class projects, while students in grades 3-8 worked individually or in teams to explore topics of their choosing. Center City PCS also partnered for a second year with the Walter Reed Army Institutes for Research, bringing recent college graduates to work with students in grades 6-8 on refining and executing their science fair projects. The system-wide Science Fair, in which winning projects from all six campuses were presented and judged, brought hundreds of parents and community members to view student work. 8th Grade Promotion 8th grade students were accepted into top high schools in the area ranging from Magnet schools, charter schools, private schools and boarding schools. Schools include: Stone Ridge, Archbishop Carroll, Gonzaga High School, McKinley Tech HS, Holy Cross, Duke Ellington, E.L Haynes, Richard Wright for Journalism HS, Bell Multi-cultural, Don Bosco Cristo Rey, and Thurgood Marshall Academy. 96% of all of the 8th graders graduated.
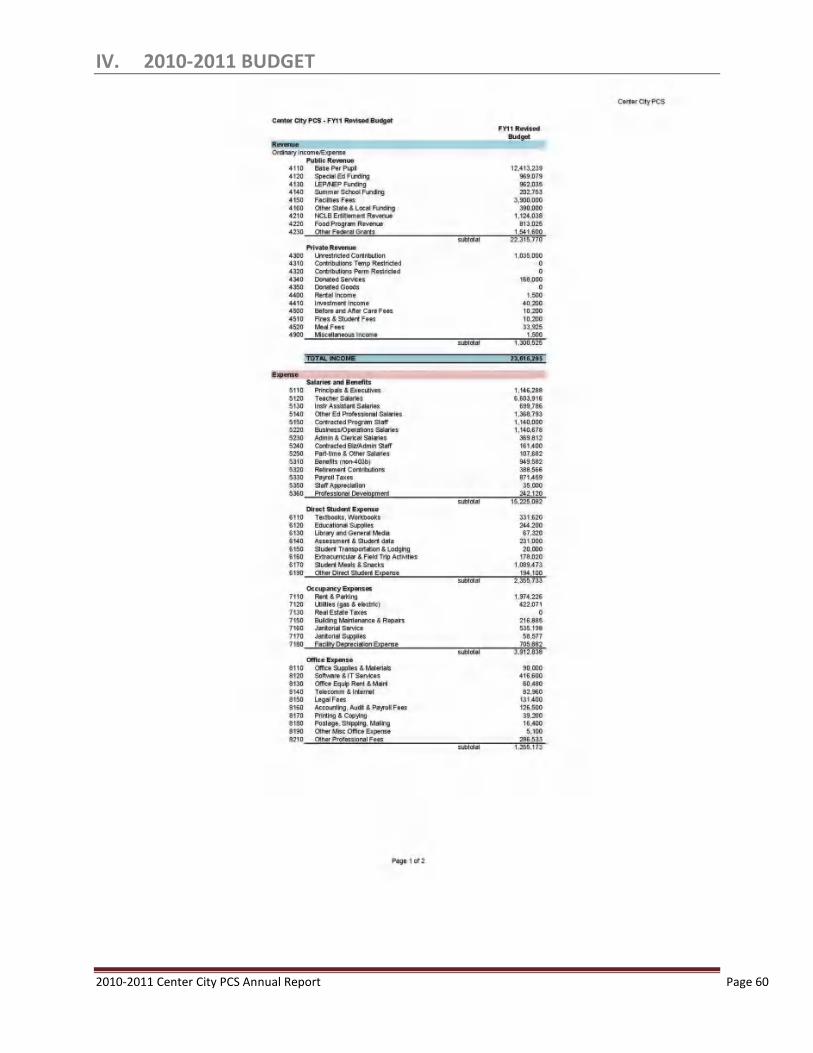
2010-2011 Center City PCS Annual Report Page 60
IV. 2010-2011 BUDGET

2010-2011 Center City PCS Annual Report Page 61

Center City PCS Central Office
2010-2011 Center City PCS Annual Report Page 62
ANNUAL REPORT DATA COLLECTION TOOL WORKSHEETS Use these sheets to enter your data in the ANNUAL REPORT DATA COLLECTION TOOL. Include the information from these sheets in your Annual Report.
1. Enter the school’s Mission Statement in the space provided below.
The Center City Public Charter Schools’ (Center City PCS) mission is to empower our children for success through a rigorous academic program and strong character education while challenging students to pursue personal excellence in character, conduct, and scholarship in order to develop skills necessary to both serve and lead others in the 21st century.
2. Please choose your Campus/LEA's School and Name from the drop down choices provided below. Each campus must submit a separate data sheet. (For Central Office submissions, use the CENTRAL OFFICE choice provided for your organization).
Center City PCS Central Office
3. Is your organization accredited? If yes, please list the name (s) of the accrediting organization (s) and the accreditation term (month/year start- month/year end). If your accreditation is pending, meaning your organization has formally submitted an application to a nationally recognized accrediting organization, please provide details with the expected date of accreditation in the space provided below
Yes Center City PCS is accredited by the Middle States Associations. This accreditation started in July 2008 and expired in June 2011.
4. Please list the complete contact information for the person completing the Online Annual Report for your Campus/LEA. This may or may not be a member of school leadership, however be advised that information collected will be used by the PCSB. Fill out all information completely. Contact information should be direct and current.
Name Jennifer Yi
Title Special Projects Associate
School Street Address 7 New York Avenue NE, Suite 200
School Zip 20002
School Ward 5
Direct Phone Number (202) 589-0202
Email [email protected]
5. Please select the lowest grade level served by your Campus/LEA in the 2010-2011 school year.
PreK
6. Please select the highest grade level served by your Campus/LEA in the 2010-2011 school years.
8

Center City PCS Central Office
2010-2011 Center City PCS Annual Report Page 63
7. Hours of Operation: Enter the Start time for the REGULAR school day for the 10-11 school year. For schools with Multiple Regular Start times please provide details in the additional comments section. Enter time as “8:05 AM” format (See “Definitions”)
8:00:00 AM
8. Please enter the End time for the REGULAR school day for the 10-11 school year. For schools with Multiple Regular Bell Dismissal Times, please provide details in the additional comments section. (See “Definitions”)
4:00:00 PM
9. Enter any additional comments regarding Start time/End time for Regular School Day.
M-Th is 8 PM - 4 PM, Fridays is 8 AM - 1 PM. Before Care from 7:00 AM - 8:00 AM, Afterschool from 4 - 6
PM (M-TH) and from 1:30 - 6:30 PM on Fridays.
10. Please enter the Start and End Dates for the 2010-2011 School Year.
Start Date 8/30/2010
End Date 6/17/2011
11. Did your campus/LEA operate as a year-round school for the 2010-2011 school year?
YES (If Yes describe your school's year round structure in the space provided below. Include the dates that indicate the
start and end of the academic school year.)
X NO Additional
Comments
12. Please enter the average class size and student teacher ratio for the 2010-2011 school year in the space provided below.
Average Class Size: 21.8
Student/Teacher Ratio: 1 to 12.8
13. For the 2010-2011 school year, please provide the total number of students/incidents falling into each category listed below.
# Transferring out of school/Withdrawls (total students) 66
# Short-Term Out of School Suspensions (5 days or less) 179
# Long-Term Out of School Suspensions (more than 5 days) 30
# of Expulsions (total students) 0
# of Dropouts (total students) 0
# Retained at grade level (total students) 44
(Suspension counts should reference the total number of “incidents”. For example, one student that is suspended short term 3 times will count as 3 “incidents” of short-term suspension)
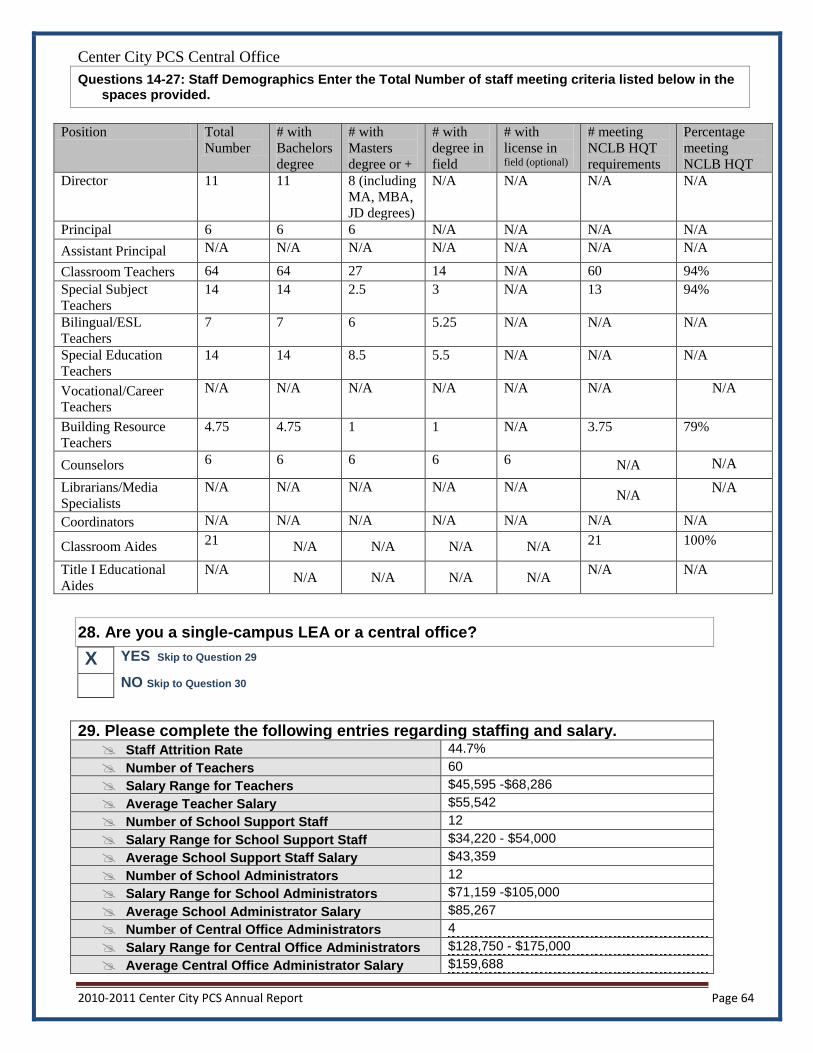
Center City PCS Central Office
2010-2011 Center City PCS Annual Report Page 64
Questions 14-27: Staff Demographics Enter the Total Number of staff meeting criteria listed below in the spaces provided.
Position Total
Number
# with
Bachelors
degree
# with
Masters
degree or +
# with
degree in
field
# with
license in field (optional)
# meeting
NCLB HQT
requirements
Percentage
meeting
NCLB HQT
Director 11 11 8 (including
MA, MBA,
JD degrees)
N/A N/A N/A N/A
Principal 6 6 6 N/A N/A N/A N/A
Assistant Principal N/A N/A N/A N/A N/A N/A N/A
Classroom Teachers 64 64 27 14 N/A 60 94%
Special Subject
Teachers
14 14 2.5 3 N/A 13 94%
Bilingual/ESL
Teachers
7 7 6 5.25 N/A N/A N/A
Special Education
Teachers
14 14 8.5 5.5 N/A N/A N/A
Vocational/Career
Teachers
N/A N/A N/A N/A N/A N/A N/A
Building Resource
Teachers
4.75 4.75 1 1 N/A 3.75 79%
Counselors 6 6 6 6 6 N/A N/A
Librarians/Media
Specialists
N/A N/A N/A N/A N/A N/A
N/A
Coordinators N/A N/A N/A N/A N/A N/A N/A
Classroom Aides 21
N/A N/A N/A N/A 21 100%
Title I Educational
Aides
N/A N/A N/A N/A N/A
N/A N/A
28. Are you a single-campus LEA or a central office?
X YES Skip to Question 29
NO Skip to Question 30
29. Please complete the following entries regarding staffing and salary. Staff Attrition Rate 44.7%
Number of Teachers 60
Salary Range for Teachers $45,595 -$68,286
Average Teacher Salary $55,542
Number of School Support Staff 12
Salary Range for School Support Staff $34,220 - $54,000
Average School Support Staff Salary $43,359
Number of School Administrators 12
Salary Range for School Administrators $71,159 -$105,000
Average School Administrator Salary $85,267
Number of Central Office Administrators 4
Salary Range for Central Office Administrators $128,750 - $175,000
Average Central Office Administrator Salary $159,688

Center City PCS Central Office
2010-2011 Center City PCS Annual Report Page 65
30. To ensure that PCSB has up to date information for the 2011-2012 School Year, provide
contact information in the fields listed below for the following: School/Organization Board Chair, Executive Director, Principal/Head of School, Assistant Principal, Business Manager, Special Education Coordinator, and Attendance Manager.
Board Chair Name Ralph Boyd
Board Chair Title Chair
Board Chair Email [email protected]
Board Chair Phone (703) 918-8585
Board Chair Mailing Address 7 New York Avenue NE, Suite 200
Board Chair Mailing City, State Washington, DC
Board Chair Mailing Zip 20002
Exec. Director Name Beverley R. Wheeler, EdD
Exec. Director Title President & CEO
Exec. Director Email [email protected]
Exec. Director Phone (202) 589-0202
Exec. Director Mailing Address 7 New York Avenue, NE Suite 200
Exec. Director Mailing City, State Washington, DC
Exec. Director Mailing Zip 20002
Principal Name N/A
Principal Title N/A
Principal Email N/A
Principal Phone N/A
Asst. Principal Name N/A
Asst. Principal Title N/A
Asst. Principal Email N/A
Asst. Principal Phone N/A
Business Manager Name Jim Laychak
Business Manager Title Chief Operating Officer
Business Manager Email [email protected]
Business Manager Phone (202) 589-0202
Business Manager Mailing Address Washington, DC
Business Manager Mailing City, State 7 New York Avenue, NE Suite 200
Business Manager Mailing Zip 20002
31. Parents, employees, and community members call the PCSB with individual and specific school-related issues and concerns. These issues and concerns include questions and at times, complaints about individual schools. In the space provided below, list the desired representatives from your Campus/LEA's staff and one member of your school's Board of Trustees to receive all initial correspondence from PCSB regarding these concerns for the 2011-2012 school year.
Campus/LEA Staff Member Name Jim Laychak
Campus/LEA Staff Member Title Chief Operating Officer
Campus/LEA Staff Member Phone [email protected]
Campus/LEA Staff Member Email (202) 589-0202
Board Member Name Ralph Boyd
Board Member Title Chair
Board Member Phone (703) 918-8585
Board Member Email [email protected]

Center City PCS Brightwood Campus
2010-2011 Center City PCS Annual Report Page 66
ANNUAL REPORT DATA COLLECTION TOOL WORKSHEETS Use these sheets to enter your data in the ANNUAL REPORT DATA COLLECTION TOOL. Include the information from these sheets in your Annual Report.
1. Enter the school’s Mission Statement in the space provided below.
The Center City Public Charter Schools’ (Center City PCS) mission is to empower our children for success through a rigorous academic program and strong character education while challenging students to pursue personal excellence in character, conduct, and scholarship in order to develop skills necessary to both serve and lead others in the 21st century.
2. Please choose your Campus/LEA's School and Name from the drop down choices provided below. Each campus must submit a separate data sheet. (For Central Office submissions, use the CENTRAL OFFICE choice provided for your organization).
Center City PCS Brightwood Campus
3. Is your organization accredited? If yes, please list the name (s) of the accrediting organization (s) and the accreditation term (month/year start- month/year end). If your accreditation is pending, meaning your organization has formally submitted an application to a nationally recognized accrediting organization, please provide details with the expected date of accreditation in the space provided below
Yes Center City PCS is accredited by the Middle States Associations. This accreditation started in July 2008 and expired in June 2011.
4. Please list the complete contact information for the person completing the Online Annual Report for your Campus/LEA. This may or may not be a member of school leadership, however be advised that information collected will be used by the PCSB. Fill out all information completely. Contact information should be direct and current.
Name Jennifer Yi
Title Special Projects Associate
School Street Address 6008 Georgia Avenue, NW
School Zip 20011
School Ward 4
Direct Phone Number (202) 723-3322
Email [email protected]
5. Please select the lowest grade level served by your Campus/LEA in the 2010-2011 school year.
PreK
6. Please select the highest grade level served by your Campus/LEA in the 2010-2011 school years.
8
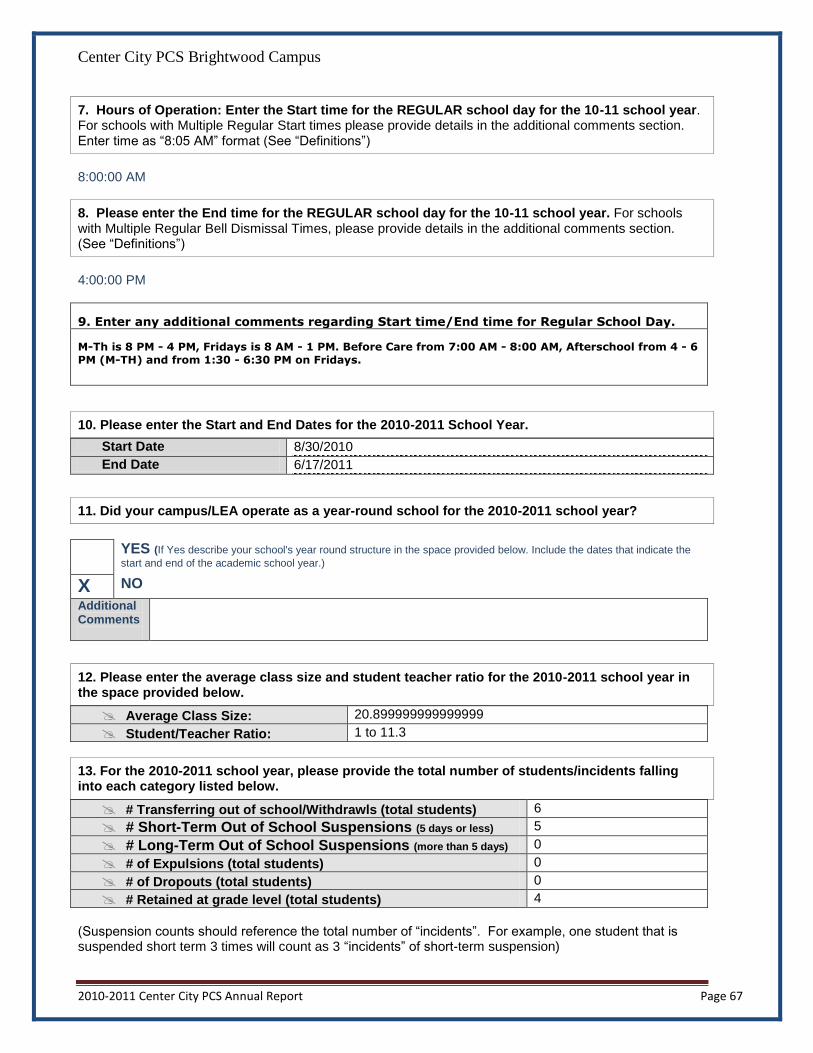
Center City PCS Brightwood Campus
2010-2011 Center City PCS Annual Report Page 67
7. Hours of Operation: Enter the Start time for the REGULAR school day for the 10-11 school year. For schools with Multiple Regular Start times please provide details in the additional comments section. Enter time as “8:05 AM” format (See “Definitions”)
8:00:00 AM
8. Please enter the End time for the REGULAR school day for the 10-11 school year. For schools with Multiple Regular Bell Dismissal Times, please provide details in the additional comments section. (See “Definitions”)
4:00:00 PM
9. Enter any additional comments regarding Start time/End time for Regular School Day.
M-Th is 8 PM - 4 PM, Fridays is 8 AM - 1 PM. Before Care from 7:00 AM - 8:00 AM, Afterschool from 4 - 6
PM (M-TH) and from 1:30 - 6:30 PM on Fridays.
10. Please enter the Start and End Dates for the 2010-2011 School Year.
Start Date 8/30/2010
End Date 6/17/2011
11. Did your campus/LEA operate as a year-round school for the 2010-2011 school year?
YES (If Yes describe your school's year round structure in the space provided below. Include the dates that indicate the
start and end of the academic school year.)
X NO Additional
Comments
12. Please enter the average class size and student teacher ratio for the 2010-2011 school year in the space provided below.
Average Class Size: 20.899999999999999
Student/Teacher Ratio: 1 to 11.3
13. For the 2010-2011 school year, please provide the total number of students/incidents falling into each category listed below.
# Transferring out of school/Withdrawls (total students) 6
# Short-Term Out of School Suspensions (5 days or less) 5
# Long-Term Out of School Suspensions (more than 5 days) 0
# of Expulsions (total students) 0
# of Dropouts (total students) 0
# Retained at grade level (total students) 4
(Suspension counts should reference the total number of “incidents”. For example, one student that is suspended short term 3 times will count as 3 “incidents” of short-term suspension)

Center City PCS Brightwood Campus
2010-2011 Center City PCS Annual Report Page 68
Questions 14-27: Staff Demographics Enter the Total Number of staff meeting criteria listed below in the spaces provided.
Position Total
Number
# with
Bachelors
degree
# with
Masters
degree or +
# with
degree in
field
# with
license in field (optional)
# meeting
NCLB HQT
requirements
Percentage
meeting
NCLB HQT
Director 11 11 8 (including
MA, MBA,
JD degrees)
N/A N/A N/A N/A
Principal 1 1 1 N/A N/A N/A N/A
Assistant Principal N/A N/A N/A N/A N/A N/A N/A
Classroom Teachers 11 11 3 2 N/A 10 91%
Special Subject
Teachers
2.5 2.5 0 1.5 N/A 2.5 100%
Bilingual/ESL
Teachers
2.5 2.5 2.5 2.5 N/A N/A N/A
Special Education
Teachers
2 2 1 1 N/A N/A N/A
Vocational/Career
Teachers
N/A N/A N/A N/A N/A N/A N/A
Building Resource
Teachers
0 N/A N/A N/A N/A N/A N/A
Counselors 1 1 1 1 1 N/A N/A
Librarians/Media
Specialists
N/A N/A N/A N/A N/A N/A
N/A
Coordinators N/A N/A N/A N/A N/A N/A N/A
Classroom Aides 3
N/A N/A N/A N/A 3 100%
Title I Educational
Aides
N/A N/A N/A N/A N/A
N/A N/A
28. Are you a single-campus LEA or a central office?
YES Skip to Question 29
X NO Skip to Question 30
29. Please complete the following entries regarding staffing and salary. Staff Attrition Rate 63%
Number of Teachers 15
Salary Range for Teachers $47,320 - $68,120
Average Teacher Salary $55, 235
Number of School Support Staff 2
Salary Range for School Support Staff $34,220 - $54,000
Average School Support Staff Salary $43,359
Number of School Administrators 2
Salary Range for School Administrators $71,159 -$105,000
Average School Administrator Salary $85,267
Number of Central Office Administrators 4
Salary Range for Central Office Administrators $128,750 - $175,000
Average Central Office Administrator Salary $159,688

Center City PCS Brightwood Campus
2010-2011 Center City PCS Annual Report Page 69
30. To ensure that PCSB has up to date information for the 2011-2012 School Year, provide
contact information in the fields listed below for the following: School/Organization Board Chair, Executive Director, Principal/Head of School, Assistant Principal, Business Manager, Special Education Coordinator, and Attendance Manager.
Board Chair Name Ralph Boyd
Board Chair Title Chair
Board Chair Email [email protected]
Board Chair Phone (703) 918-8585
Board Chair Mailing Address 7 New York Avenue NE, Suite 200
Board Chair Mailing City, State Washington, DC
Board Chair Mailing Zip 20002
Exec. Director Name Beverley R. Wheeler, EdD
Exec. Director Title President & CEO
Exec. Director Email [email protected]
Exec. Director Phone (202) 589-0202
Exec. Director Mailing Address 7 New York Avenue, NE Suite 200
Exec. Director Mailing City, State Washington, DC
Exec. Director Mailing Zip 20002
Principal Name Sarah Festa*
Principal Title Principal
Principal Email [email protected]
Principal Phone (202) 723-3322
Asst. Principal Name N/A
Asst. Principal Title N/A
Asst. Principal Email N/A
Asst. Principal Phone N/A
Business Manager Name Jim Laychak
Business Manager Title Chief Operating Officer
Business Manager Email [email protected]
Business Manager Phone (202) 589-0202
Business Manager Mailing Address Washington, DC
Business Manager Mailing City, State 7 New York Avenue, NE Suite 200
Business Manager Mailing Zip 20002
31. Parents, employees, and community members call the PCSB with individual and specific school-related issues and concerns. These issues and concerns include questions and at times, complaints about individual schools. In the space provided below, list the desired representatives from your Campus/LEA's staff and one member of your school's Board of Trustees to receive all initial correspondence from PCSB regarding these concerns for the 2011-2012 school year.
Campus/LEA Staff Member Name Sarah Festa*
Campus/LEA Staff Member Title Principal
Campus/LEA Staff Member Phone [email protected]
Campus/LEA Staff Member Email (202) 723-3322
Board Member Name Ralph Boyd
Board Member Title Chair
Board Member Phone (703) 918-8585
Board Member Email [email protected]
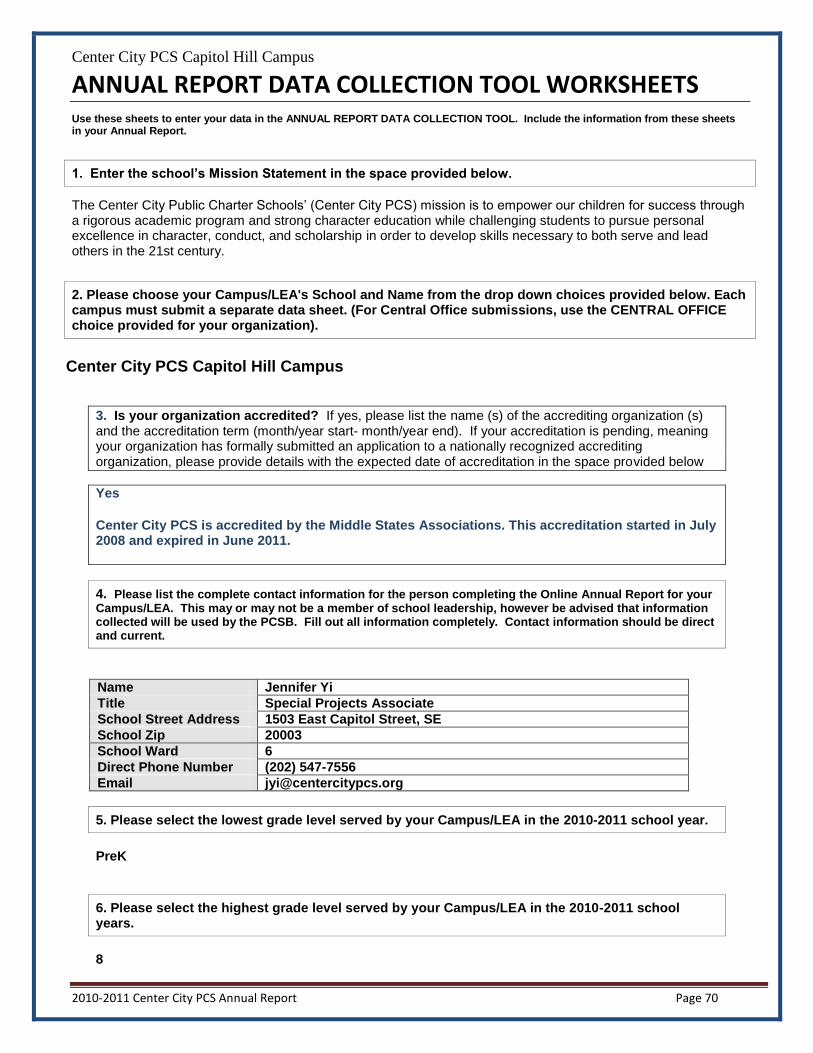
Center City PCS Capitol Hill Campus
2010-2011 Center City PCS Annual Report Page 70
ANNUAL REPORT DATA COLLECTION TOOL WORKSHEETS Use these sheets to enter your data in the ANNUAL REPORT DATA COLLECTION TOOL. Include the information from these sheets in your Annual Report.
1. Enter the school’s Mission Statement in the space provided below.
The Center City Public Charter Schools’ (Center City PCS) mission is to empower our children for success through a rigorous academic program and strong character education while challenging students to pursue personal excellence in character, conduct, and scholarship in order to develop skills necessary to both serve and lead others in the 21st century.
2. Please choose your Campus/LEA's School and Name from the drop down choices provided below. Each campus must submit a separate data sheet. (For Central Office submissions, use the CENTRAL OFFICE choice provided for your organization).
Center City PCS Capitol Hill Campus
3. Is your organization accredited? If yes, please list the name (s) of the accrediting organization (s) and the accreditation term (month/year start- month/year end). If your accreditation is pending, meaning your organization has formally submitted an application to a nationally recognized accrediting organization, please provide details with the expected date of accreditation in the space provided below
Yes Center City PCS is accredited by the Middle States Associations. This accreditation started in July 2008 and expired in June 2011.
4. Please list the complete contact information for the person completing the Online Annual Report for your Campus/LEA. This may or may not be a member of school leadership, however be advised that information collected will be used by the PCSB. Fill out all information completely. Contact information should be direct and current.
Name Jennifer Yi
Title Special Projects Associate
School Street Address 1503 East Capitol Street, SE
School Zip 20003
School Ward 6
Direct Phone Number (202) 547-7556
Email [email protected]
5. Please select the lowest grade level served by your Campus/LEA in the 2010-2011 school year.
PreK
6. Please select the highest grade level served by your Campus/LEA in the 2010-2011 school years.
8

Center City PCS Capitol Hill Campus
2010-2011 Center City PCS Annual Report Page 71
7. Hours of Operation: Enter the Start time for the REGULAR school day for the 10-11 school year. For schools with Multiple Regular Start times please provide details in the additional comments section. Enter time as “8:05 AM” format (See “Definitions”)
8:00:00 AM
8. Please enter the End time for the REGULAR school day for the 10-11 school year. For schools with Multiple Regular Bell Dismissal Times, please provide details in the additional comments section. (See “Definitions”)
4:00:00 PM
9. Enter any additional comments regarding Start time/End time for Regular School Day.
M-Th is 8 PM - 4 PM, Fridays is 8 AM - 1 PM. Before Care from 7:00 AM - 8:00 AM, Afterschool from 4 - 6
PM (M-TH) and from 1:30 - 6:30 PM on Fridays.
10. Please enter the Start and End Dates for the 2010-2011 School Year.
Start Date 8/30/2010
End Date 6/17/2011
11. Did your campus/LEA operate as a year-round school for the 2010-2011 school year?
YES (If Yes describe your school's year round structure in the space provided below. Include the dates that indicate the
start and end of the academic school year.)
X NO Additional
Comments
12. Please enter the average class size and student teacher ratio for the 2010-2011 school year in the space provided below.
Average Class Size: 21.899999999999999
Student/Teacher Ratio: 1 to 13.9
13. For the 2010-2011 school year, please provide the total number of students/incidents falling into each category listed below.
# Transferring out of school/Withdrawls (total students) 14
# Short-Term Out of School Suspensions (5 days or less) 67
# Long-Term Out of School Suspensions (more than 5 days) 2
# of Expulsions (total students) 0
# of Dropouts (total students) 0
# Retained at grade level (total students) 4
(Suspension counts should reference the total number of “incidents”. For example, one student that is suspended short term 3 times will count as 3 “incidents” of short-term suspension)

Center City PCS Capitol Hill Campus
2010-2011 Center City PCS Annual Report Page 72
Questions 14-27: Staff Demographics Enter the Total Number of staff meeting criteria listed below in the spaces provided.
Position Total
Number
# with
Bachelors
degree
# with
Masters
degree or +
# with
degree in
field
# with
license in field (optional)
# meeting
NCLB HQT
requirements
Percentage
meeting
NCLB HQT
Director 11 11 8 (including
MA, MBA,
JD degrees)
N/A N/A N/A N/A
Principal 1 1 1 N/A N/A N/A N/A
Assistant Principal N/A N/A N/A N/A N/A N/A N/A
Classroom Teachers 10 10 6 2 N/A 10 100%
Special Subject
Teachers
2 2 1 1 N/A 2 100%
Bilingual/ESL
Teachers
0.25 0.25 0.25 0.25 N/A N/A N/A
Special Education
Teachers
3 3 1.5 1.5 N/A N/A N/A
Vocational/Career
Teachers
N/A N/A N/A N/A N/A N/A N/A
Building Resource
Teachers
1 1 0 0 N/A 1 100%
Counselors 1 1 1 1 1 N/A N/A
Librarians/Media
Specialists
N/A N/A N/A N/A N/A N/A
N/A
Coordinators N/A N/A N/A N/A N/A N/A N/A
Classroom Aides 4
N/A N/A N/A N/A 4 100%
Title I Educational
Aides
N/A N/A N/A N/A N/A
N/A N/A
28. Are you a single-campus LEA or a central office?
YES Skip to Question 29
X NO Skip to Question 30
29. Please complete the following entries regarding staffing and salary. Staff Attrition Rate 36%
Number of Teachers 8
Salary Range for Teachers $45,595 - $68,120
Average Teacher Salary $56, 252
Number of School Support Staff 2
Salary Range for School Support Staff $34,220 - $54,000
Average School Support Staff Salary $43,359
Number of School Administrators 2
Salary Range for School Administrators $71,159 -$105,000
Average School Administrator Salary $85,267
Number of Central Office Administrators 4
Salary Range for Central Office Administrators $128,750 - $175,000
Average Central Office Administrator Salary $159,688

Center City PCS Capitol Hill Campus
2010-2011 Center City PCS Annual Report Page 73
30. To ensure that PCSB has up to date information for the 2011-2012 School Year, provide
contact information in the fields listed below for the following: School/Organization Board Chair, Executive Director, Principal/Head of School, Assistant Principal, Business Manager, Special Education Coordinator, and Attendance Manager.
Board Chair Name Ralph Boyd
Board Chair Title Chair
Board Chair Email [email protected]
Board Chair Phone (703) 918-8585
Board Chair Mailing Address 7 New York Avenue NE, Suite 200
Board Chair Mailing City, State Washington, DC
Board Chair Mailing Zip 20002
Exec. Director Name Beverley R. Wheeler, EdD
Exec. Director Title President & CEO
Exec. Director Email [email protected]
Exec. Director Phone (202) 589-0202
Exec. Director Mailing Address 7 New York Avenue, NE Suite 200
Exec. Director Mailing City, State Washington, DC
Exec. Director Mailing Zip 20002
Principal Name Lacy Peale*
Principal Title Principal
Principal Email [email protected]
Principal Phone (202) 547-7556
Asst. Principal Name N/A
Asst. Principal Title N/A
Asst. Principal Email N/A
Asst. Principal Phone N/A
Business Manager Name Jim Laychak
Business Manager Title Chief Operating Officer
Business Manager Email [email protected]
Business Manager Phone (202) 589-0202
Business Manager Mailing Address Washington, DC
Business Manager Mailing City, State 7 New York Avenue, NE Suite 200
Business Manager Mailing Zip 20002
31. Parents, employees, and community members call the PCSB with individual and specific school-related issues and concerns. These issues and concerns include questions and at times, complaints about individual schools. In the space provided below, list the desired representatives from your Campus/LEA's staff and one member of your school's Board of Trustees to receive all initial correspondence from PCSB regarding these concerns for the 2011-2012 school year.
Campus/LEA Staff Member Name Lacy Peale*
Campus/LEA Staff Member Title Principal
Campus/LEA Staff Member Phone [email protected]
Campus/LEA Staff Member Email (202) 547-7556
Board Member Name Ralph Boyd
Board Member Title Chair
Board Member Phone (703) 918-8585
Board Member Email [email protected]

Center City PCS Congress Heights Campus
2010-2011 Center City PCS Annual Report Page 74
ANNUAL REPORT DATA COLLECTION TOOL WORKSHEETS Use these sheets to enter your data in the ANNUAL REPORT DATA COLLECTION TOOL. Include the information from these sheets in your Annual Report.
1. Enter the school’s Mission Statement in the space provided below.
The Center City Public Charter Schools’ (Center City PCS) mission is to empower our children for success through a rigorous academic program and strong character education while challenging students to pursue personal excellence in character, conduct, and scholarship in order to develop skills necessary to both serve and lead others in the 21st century.
2. Please choose your Campus/LEA's School and Name from the drop down choices provided below. Each campus must submit a separate data sheet. (For Central Office submissions, use the CENTRAL OFFICE choice provided for your organization).
Center City PCS Congress Heights Campus
3. Is your organization accredited? If yes, please list the name (s) of the accrediting organization (s) and the accreditation term (month/year start- month/year end). If your accreditation is pending, meaning your organization has formally submitted an application to a nationally recognized accrediting organization, please provide details with the expected date of accreditation in the space provided below
Yes Center City PCS is accredited by the Middle States Associations. This accreditation started in July 2008 and expired in June 2011.
4. Please list the complete contact information for the person completing the Online Annual Report for your Campus/LEA. This may or may not be a member of school leadership, however be advised that information collected will be used by the PCSB. Fill out all information completely. Contact information should be direct and current.
Name Jennifer Yi
Title Special Projects Associate
School Street Address 220 Highview Place, SE
School Zip 20032
School Ward 8
Direct Phone Number (202) 562-7070
Email [email protected]
5. Please select the lowest grade level served by your Campus/LEA in the 2010-2011 school year.
PreK
6. Please select the highest grade level served by your Campus/LEA in the 2010-2011 school years.
8

Center City PCS Congress Heights Campus
2010-2011 Center City PCS Annual Report Page 75
7. Hours of Operation: Enter the Start time for the REGULAR school day for the 10-11 school year. For schools with Multiple Regular Start times please provide details in the additional comments section. Enter time as “8:05 AM” format (See “Definitions”)
8:00:00 AM
8. Please enter the End time for the REGULAR school day for the 10-11 school year. For schools with Multiple Regular Bell Dismissal Times, please provide details in the additional comments section. (See “Definitions”)
4:00:00 PM
9. Enter any additional comments regarding Start time/End time for Regular School Day.
M-Th is 8 PM - 4 PM, Fridays is 8 AM - 1 PM. Before Care from 7:00 AM - 8:00 AM, Afterschool from 4 - 6
PM (M-TH) and from 1:30 - 6:30 PM on Fridays.
10. Please enter the Start and End Dates for the 2010-2011 School Year.
Start Date 8/30/2010
End Date 6/17/2011
11. Did your campus/LEA operate as a year-round school for the 2010-2011 school year?
YES (If Yes describe your school's year round structure in the space provided below. Include the dates that indicate the
start and end of the academic school year.)
X NO Additional
Comments
12. Please enter the average class size and student teacher ratio for the 2010-2011 school year in the space provided below.
Average Class Size: 20
Student/Teacher Ratio: 1 to 12.9
13. For the 2010-2011 school year, please provide the total number of students/incidents falling into each category listed below.
# Transferring out of school/Withdrawls (total students) 23
# Short-Term Out of School Suspensions (5 days or less) 16
# Long-Term Out of School Suspensions (more than 5 days) 24
# of Expulsions (total students) 0
# of Dropouts (total students) 0
# Retained at grade level (total students) 9
(Suspension counts should reference the total number of “incidents”. For example, one student that is suspended short term 3 times will count as 3 “incidents” of short-term suspension)

Center City PCS Congress Heights Campus
2010-2011 Center City PCS Annual Report Page 76
Questions 14-27: Staff Demographics Enter the Total Number of staff meeting criteria listed below in the spaces provided.
Position Total
Number
# with
Bachelors
degree
# with
Masters
degree or +
# with
degree in
field
# with
license in field (optional)
# meeting
NCLB HQT
requirements
Percentage
meeting
NCLB HQT
Director 11 11 8 (including
MA, MBA,
JD degrees)
N/A N/A N/A N/A
Principal 1 1 1 N/A N/A N/A N/A
Assistant Principal N/A N/A N/A N/A N/A N/A N/A
Classroom Teachers 11 11 4 2 N/A 10 91%
Special Subject
Teachers
2 2 0 2 N/A 2 100%
Bilingual/ESL
Teachers
0 0 0 0 N/A N/A N/A
Special Education
Teachers
2 2 1 1 N/A N/A N/A
Vocational/Career
Teachers
N/A N/A N/A N/A N/A N/A N/A
Building Resource
Teachers
1 1 0 0 N/A 1 100%
Counselors 1 1 1 1 1 N/A N/A
Librarians/Media
Specialists
N/A N/A N/A N/A N/A N/A
N/A
Coordinators N/A N/A N/A N/A N/A N/A N/A
Classroom Aides 4
N/A N/A N/A N/A 4 100%
Title I Educational
Aides
N/A N/A N/A N/A N/A
N/A N/A
28. Are you a single-campus LEA or a central office?
YES Skip to Question 29
X NO Skip to Question 30
29. Please complete the following entries regarding staffing and salary. Staff Attrition Rate 76%
Number of Teachers 16
Salary Range for Teachers $45,595 - $65,692
Average Teacher Salary $55,723
Number of School Support Staff 2
Salary Range for School Support Staff $34,220 - $54,000
Average School Support Staff Salary $43,359
Number of School Administrators 2
Salary Range for School Administrators $71,159 -$105,000
Average School Administrator Salary $85,267
Number of Central Office Administrators 4
Salary Range for Central Office Administrators $128,750 - $175,000
Average Central Office Administrator Salary $159,688

Center City PCS Congress Heights Campus
2010-2011 Center City PCS Annual Report Page 77
30. To ensure that PCSB has up to date information for the 2011-2012 School Year, provide
contact information in the fields listed below for the following: School/Organization Board Chair, Executive Director, Principal/Head of School, Assistant Principal, Business Manager, Special Education Coordinator, and Attendance Manager.
Board Chair Name Ralph Boyd
Board Chair Title Chair
Board Chair Email [email protected]
Board Chair Phone (703) 918-8585
Board Chair Mailing Address 7 New York Avenue NE, Suite 200
Board Chair Mailing City, State Washington, DC
Board Chair Mailing Zip 20002
Exec. Director Name Beverley R. Wheeler, EdD
Exec. Director Title President & CEO
Exec. Director Email [email protected]
Exec. Director Phone (202) 589-0202
Exec. Director Mailing Address 7 New York Avenue, NE Suite 200
Exec. Director Mailing City, State Washington, DC
Exec. Director Mailing Zip 20002
Principal Name Andrew Touchette
Principal Title Principal
Principal Email [email protected]
Principal Phone (202) 562-7070
Asst. Principal Name N/A
Asst. Principal Title N/A
Asst. Principal Email N/A
Asst. Principal Phone N/A
Business Manager Name Jim Laychak
Business Manager Title Chief Operating Officer
Business Manager Email [email protected]
Business Manager Phone (202) 589-0202
Business Manager Mailing Address Washington, DC
Business Manager Mailing City, State 7 New York Avenue, NE Suite 200
Business Manager Mailing Zip 20002
31. Parents, employees, and community members call the PCSB with individual and specific school-related issues and concerns. These issues and concerns include questions and at times, complaints about individual schools. In the space provided below, list the desired representatives from your Campus/LEA's staff and one member of your school's Board of Trustees to receive all initial correspondence from PCSB regarding these concerns for the 2011-2012 school year.
Campus/LEA Staff Member Name Andrew Touchette
Campus/LEA Staff Member Title Principal
Campus/LEA Staff Member Phone [email protected]
Campus/LEA Staff Member Email (202) 562-7070
Board Member Name Ralph Boyd
Board Member Title Chair
Board Member Phone (703) 918-8585
Board Member Email [email protected]

Center City PCS Petworth Campus
2010-2011 Center City PCS Annual Report Page 78
ANNUAL REPORT DATA COLLECTION TOOL WORKSHEETS Use these sheets to enter your data in the ANNUAL REPORT DATA COLLECTION TOOL. Include the information from these sheets in your Annual Report.
1. Enter the school’s Mission Statement in the space provided below.
The Center City Public Charter Schools’ (Center City PCS) mission is to empower our children for success through a rigorous academic program and strong character education while challenging students to pursue personal excellence in character, conduct, and scholarship in order to develop skills necessary to both serve and lead others in the 21st century.
2. Please choose your Campus/LEA's School and Name from the drop down choices provided below. Each campus must submit a separate data sheet. (For Central Office submissions, use the CENTRAL OFFICE choice provided for your organization).
Center City PCS Petworth Campus
3. Is your organization accredited? If yes, please list the name (s) of the accrediting organization (s) and the accreditation term (month/year start- month/year end). If your accreditation is pending, meaning your organization has formally submitted an application to a nationally recognized accrediting organization, please provide details with the expected date of accreditation in the space provided below
Yes Center City PCS is accredited by the Middle States Associations. This accreditation started in July 2008 and expired in June 2011.
4. Please list the complete contact information for the person completing the Online Annual Report for your Campus/LEA. This may or may not be a member of school leadership, however be advised that information collected will be used by the PCSB. Fill out all information completely. Contact information should be direct and current.
Name Jennifer Yi
Title Special Projects Associate
School Street Address 510 Webster Street, NW
School Zip 20011
School Ward 4
Direct Phone Number (202) 726-9312
Email [email protected]
5. Please select the lowest grade level served by your Campus/LEA in the 2010-2011 school year.
PreK
6. Please select the highest grade level served by your Campus/LEA in the 2010-2011 school years.
8

Center City PCS Petworth Campus
2010-2011 Center City PCS Annual Report Page 79
7. Hours of Operation: Enter the Start time for the REGULAR school day for the 10-11 school year. For schools with Multiple Regular Start times please provide details in the additional comments section. Enter time as “8:05 AM” format (See “Definitions”)
8:00:00 AM
8. Please enter the End time for the REGULAR school day for the 10-11 school year. For schools with Multiple Regular Bell Dismissal Times, please provide details in the additional comments section. (See “Definitions”)
4:00:00 PM
9. Enter any additional comments regarding Start time/End time for Regular School Day.
M-Th is 8 PM - 4 PM, Fridays is 8 AM - 1 PM. Before Care from 7:00 AM - 8:00 AM, Afterschool from 4 - 6
PM (M-TH) and from 1:30 - 6:30 PM on Fridays.
10. Please enter the Start and End Dates for the 2010-2011 School Year.
Start Date 8/30/2010
End Date 6/17/2011
11. Did your campus/LEA operate as a year-round school for the 2010-2011 school year?
YES (If Yes describe your school's year round structure in the space provided below. Include the dates that indicate the
start and end of the academic school year.)
X NO Additional
Comments
12. Please enter the average class size and student teacher ratio for the 2010-2011 school year in the space provided below.
Average Class Size: 22.899999999999999
Student/Teacher Ratio: 1 to 12.3
13. For the 2010-2011 school year, please provide the total number of students/incidents falling into each category listed below.
# Transferring out of school/Withdrawls (total students) 6
# Short-Term Out of School Suspensions (5 days or less) 25
# Long-Term Out of School Suspensions (more than 5 days) 1
# of Expulsions (total students) 0
# of Dropouts (total students) 0
# Retained at grade level (total students) 9
(Suspension counts should reference the total number of “incidents”. For example, one student that is suspended short term 3 times will count as 3 “incidents” of short-term suspension)
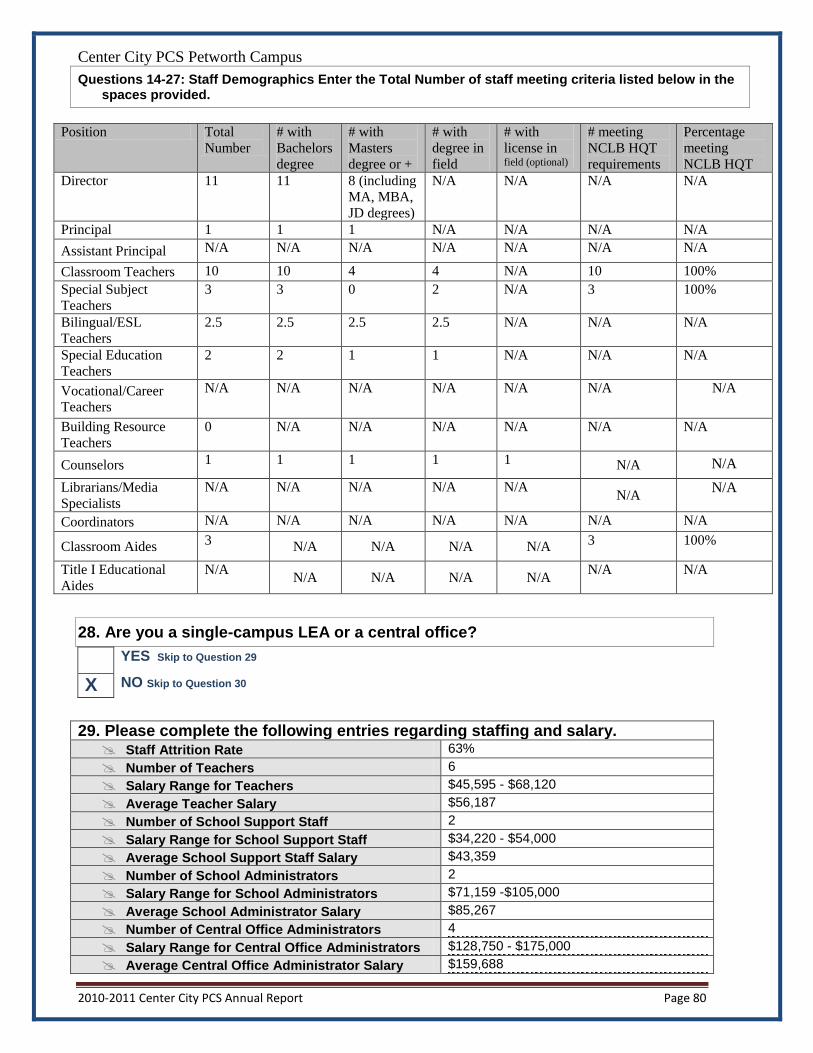
Center City PCS Petworth Campus
2010-2011 Center City PCS Annual Report Page 80
Questions 14-27: Staff Demographics Enter the Total Number of staff meeting criteria listed below in the spaces provided.
Position Total
Number
# with
Bachelors
degree
# with
Masters
degree or +
# with
degree in
field
# with
license in field (optional)
# meeting
NCLB HQT
requirements
Percentage
meeting
NCLB HQT
Director 11 11 8 (including
MA, MBA,
JD degrees)
N/A N/A N/A N/A
Principal 1 1 1 N/A N/A N/A N/A
Assistant Principal N/A N/A N/A N/A N/A N/A N/A
Classroom Teachers 10 10 4 4 N/A 10 100%
Special Subject
Teachers
3 3 0 2 N/A 3 100%
Bilingual/ESL
Teachers
2.5 2.5 2.5 2.5 N/A N/A N/A
Special Education
Teachers
2 2 1 1 N/A N/A N/A
Vocational/Career
Teachers
N/A N/A N/A N/A N/A N/A N/A
Building Resource
Teachers
0 N/A N/A N/A N/A N/A N/A
Counselors 1 1 1 1 1 N/A N/A
Librarians/Media
Specialists
N/A N/A N/A N/A N/A N/A
N/A
Coordinators N/A N/A N/A N/A N/A N/A N/A
Classroom Aides 3
N/A N/A N/A N/A 3 100%
Title I Educational
Aides
N/A N/A N/A N/A N/A
N/A N/A
28. Are you a single-campus LEA or a central office?
YES Skip to Question 29
X NO Skip to Question 30
29. Please complete the following entries regarding staffing and salary. Staff Attrition Rate 63%
Number of Teachers 6
Salary Range for Teachers $45,595 - $68,120
Average Teacher Salary $56,187
Number of School Support Staff 2
Salary Range for School Support Staff $34,220 - $54,000
Average School Support Staff Salary $43,359
Number of School Administrators 2
Salary Range for School Administrators $71,159 -$105,000
Average School Administrator Salary $85,267
Number of Central Office Administrators 4
Salary Range for Central Office Administrators $128,750 - $175,000
Average Central Office Administrator Salary $159,688

Center City PCS Petworth Campus
2010-2011 Center City PCS Annual Report Page 81
30. To ensure that PCSB has up to date information for the 2011-2012 School Year, provide
contact information in the fields listed below for the following: School/Organization Board Chair, Executive Director, Principal/Head of School, Assistant Principal, Business Manager, Special Education Coordinator, and Attendance Manager.
Board Chair Name Ralph Boyd
Board Chair Title Chair
Board Chair Email [email protected]
Board Chair Phone (703) 918-8585
Board Chair Mailing Address 7 New York Avenue NE, Suite 200
Board Chair Mailing City, State Washington, DC
Board Chair Mailing Zip 20002
Exec. Director Name Beverley R. Wheeler, EdD
Exec. Director Title President & CEO
Exec. Director Email [email protected]
Exec. Director Phone (202) 589-0202
Exec. Director Mailing Address 7 New York Avenue, NE Suite 200
Exec. Director Mailing City, State Washington, DC
Exec. Director Mailing Zip 20002
Principal Name Sandra Rojas
Principal Title Principal
Principal Email [email protected]
Principal Phone (202) 726-9312
Asst. Principal Name N/A
Asst. Principal Title N/A
Asst. Principal Email N/A
Asst. Principal Phone N/A
Business Manager Name Jim Laychak
Business Manager Title Chief Operating Officer
Business Manager Email [email protected]
Business Manager Phone (202) 589-0202
Business Manager Mailing Address Washington, DC
Business Manager Mailing City, State 7 New York Avenue, NE Suite 200
Business Manager Mailing Zip 20002
31. Parents, employees, and community members call the PCSB with individual and specific school-related issues and concerns. These issues and concerns include questions and at times, complaints about individual schools. In the space provided below, list the desired representatives from your Campus/LEA's staff and one member of your school's Board of Trustees to receive all initial correspondence from PCSB regarding these concerns for the 2011-2012 school year.
Campus/LEA Staff Member Name Sandra Rojas
Campus/LEA Staff Member Title Principal
Campus/LEA Staff Member Phone [email protected]
Campus/LEA Staff Member Email (202) 726-9312
Board Member Name Ralph Boyd
Board Member Title Chair
Board Member Phone (703) 918-8585
Board Member Email [email protected]
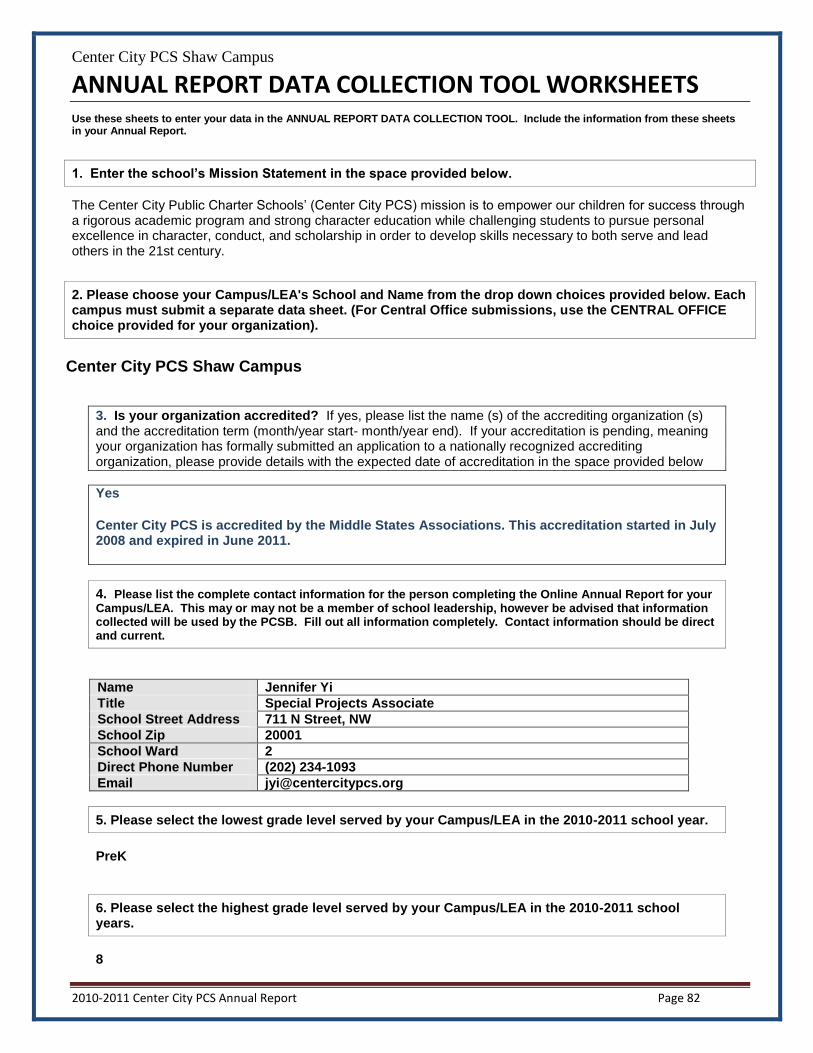
Center City PCS Shaw Campus
2010-2011 Center City PCS Annual Report Page 82
ANNUAL REPORT DATA COLLECTION TOOL WORKSHEETS Use these sheets to enter your data in the ANNUAL REPORT DATA COLLECTION TOOL. Include the information from these sheets in your Annual Report.
1. Enter the school’s Mission Statement in the space provided below.
The Center City Public Charter Schools’ (Center City PCS) mission is to empower our children for success through a rigorous academic program and strong character education while challenging students to pursue personal excellence in character, conduct, and scholarship in order to develop skills necessary to both serve and lead others in the 21st century.
2. Please choose your Campus/LEA's School and Name from the drop down choices provided below. Each campus must submit a separate data sheet. (For Central Office submissions, use the CENTRAL OFFICE choice provided for your organization).
Center City PCS Shaw Campus
3. Is your organization accredited? If yes, please list the name (s) of the accrediting organization (s) and the accreditation term (month/year start- month/year end). If your accreditation is pending, meaning your organization has formally submitted an application to a nationally recognized accrediting organization, please provide details with the expected date of accreditation in the space provided below
Yes Center City PCS is accredited by the Middle States Associations. This accreditation started in July 2008 and expired in June 2011.
4. Please list the complete contact information for the person completing the Online Annual Report for your Campus/LEA. This may or may not be a member of school leadership, however be advised that information collected will be used by the PCSB. Fill out all information completely. Contact information should be direct and current.
Name Jennifer Yi
Title Special Projects Associate
School Street Address 711 N Street, NW
School Zip 20001
School Ward 2
Direct Phone Number (202) 234-1093
Email [email protected]
5. Please select the lowest grade level served by your Campus/LEA in the 2010-2011 school year.
PreK
6. Please select the highest grade level served by your Campus/LEA in the 2010-2011 school years.
8

Center City PCS Shaw Campus
2010-2011 Center City PCS Annual Report Page 83
7. Hours of Operation: Enter the Start time for the REGULAR school day for the 10-11 school year. For schools with Multiple Regular Start times please provide details in the additional comments section. Enter time as “8:05 AM” format (See “Definitions”)
8:00:00 AM
8. Please enter the End time for the REGULAR school day for the 10-11 school year. For schools with Multiple Regular Bell Dismissal Times, please provide details in the additional comments section. (See “Definitions”)
4:00:00 PM
9. Enter any additional comments regarding Start time/End time for Regular School Day.
M-Th is 8 PM - 4 PM, Fridays is 8 AM - 1 PM. Before Care from 7:00 AM - 8:00 AM, Afterschool from 4 - 6
PM (M-TH) and from 1:30 - 6:30 PM on Fridays.
10. Please enter the Start and End Dates for the 2010-2011 School Year.
Start Date 8/30/2010
End Date 6/17/2011
11. Did your campus/LEA operate as a year-round school for the 2010-2011 school year?
YES (If Yes describe your school's year round structure in the space provided below. Include the dates that indicate the
start and end of the academic school year.)
X NO Additional
Comments
12. Please enter the average class size and student teacher ratio for the 2010-2011 school year in the space provided below.
Average Class Size: 22.300000000000001
Student/Teacher Ratio: 1 to 12.3
13. For the 2010-2011 school year, please provide the total number of students/incidents falling into each category listed below.
# Transferring out of school/Withdrawls (total students) 6
# Short-Term Out of School Suspensions (5 days or less) 30
# Long-Term Out of School Suspensions (more than 5 days) 1
# of Expulsions (total students) 0
# of Dropouts (total students) 0
# Retained at grade level (total students) 5
(Suspension counts should reference the total number of “incidents”. For example, one student that is suspended short term 3 times will count as 3 “incidents” of short-term suspension)

Center City PCS Shaw Campus
2010-2011 Center City PCS Annual Report Page 84
Questions 14-27: Staff Demographics Enter the Total Number of staff meeting criteria listed below in the spaces provided.
Position Total
Number
# with
Bachelors
degree
# with
Masters
degree or +
# with
degree in
field
# with
license in field (optional)
# meeting
NCLB HQT
requirements
Percentage
meeting
NCLB HQT
Director 11 11 8 (including
MA, MBA,
JD degrees)
N/A N/A N/A N/A
Principal 1 1 1 N/A N/A N/A N/A
Assistant Principal N/A N/A N/A N/A N/A N/A N/A
Classroom Teachers 11 11 7 2 N/A 10 91%
Special Subject
Teachers
2 2 0 1 N/A 2 100%
Bilingual/ESL
Teachers
1.5 1.5 1.5 0 N/A N/A N/A
Special Education
Teachers
3 3 2 0 N/A N/A N/A
Vocational/Career
Teachers
N/A N/A N/A N/A N/A N/A N/A
Building Resource
Teachers
1 1 1 0 N/A 1 100%
Counselors 1 1 1 1 1 N/A N/A
Librarians/Media
Specialists
N/A N/A N/A N/A N/A N/A
N/A
Coordinators N/A N/A N/A N/A N/A N/A N/A
Classroom Aides 3
N/A N/A N/A N/A 3 100%
Title I Educational
Aides
N/A N/A N/A N/A N/A
N/A N/A
28. Are you a single-campus LEA or a central office?
YES Skip to Question 29
X NO Skip to Question 30
29. Please complete the following entries regarding staffing and salary. Staff Attrition Rate 54%
Number of Teachers 13
Salary Range for Teachers $45,595 - $64,034
Average Teacher Salary $54,374
Number of School Support Staff 2
Salary Range for School Support Staff $34,220 - $54,000
Average School Support Staff Salary $43,359
Number of School Administrators 2
Salary Range for School Administrators $71,159 -$105,000
Average School Administrator Salary $85,267
Number of Central Office Administrators 4
Salary Range for Central Office Administrators $128,750 - $175,000
Average Central Office Administrator Salary $159,688

Center City PCS Shaw Campus
2010-2011 Center City PCS Annual Report Page 85
30. To ensure that PCSB has up to date information for the 2011-2012 School Year, provide
contact information in the fields listed below for the following: School/Organization Board Chair, Executive Director, Principal/Head of School, Assistant Principal, Business Manager, Special Education Coordinator, and Attendance Manager.
Board Chair Name Ralph Boyd
Board Chair Title Chair
Board Chair Email [email protected]
Board Chair Phone (703) 918-8585
Board Chair Mailing Address 7 New York Avenue NE, Suite 200
Board Chair Mailing City, State Washington, DC
Board Chair Mailing Zip 20002
Exec. Director Name Beverley R. Wheeler, EdD
Exec. Director Title President & CEO
Exec. Director Email [email protected]
Exec. Director Phone (202) 589-0202
Exec. Director Mailing Address 7 New York Avenue, NE Suite 200
Exec. Director Mailing City, State Washington, DC
Exec. Director Mailing Zip 20002
Principal Name Kyle Hill*
Principal Title Principal
Principal Email [email protected]
Principal Phone (202) 234-1093
Asst. Principal Name N/A
Asst. Principal Title N/A
Asst. Principal Email N/A
Asst. Principal Phone N/A
Business Manager Name Jim Laychak
Business Manager Title Chief Operating Officer
Business Manager Email [email protected]
Business Manager Phone (202) 589-0202
Business Manager Mailing Address Washington, DC
Business Manager Mailing City, State 7 New York Avenue, NE Suite 200
Business Manager Mailing Zip 20002
31. Parents, employees, and community members call the PCSB with individual and specific school-related issues and concerns. These issues and concerns include questions and at times, complaints about individual schools. In the space provided below, list the desired representatives from your Campus/LEA's staff and one member of your school's Board of Trustees to receive all initial correspondence from PCSB regarding these concerns for the 2011-2012 school year.
Campus/LEA Staff Member Name Kyle Hill*
Campus/LEA Staff Member Title Principal
Campus/LEA Staff Member Phone [email protected]
Campus/LEA Staff Member Email (202) 234-1093
Board Member Name Ralph Boyd
Board Member Title Chair
Board Member Phone (703) 918-8585
Board Member Email [email protected]

Center City PCS Trinidad Campus
2010-2011 Center City PCS Annual Report Page 86
ANNUAL REPORT DATA COLLECTION TOOL WORKSHEETS Use these sheets to enter your data in the ANNUAL REPORT DATA COLLECTION TOOL. Include the information from these sheets in your Annual Report.
1. Enter the school’s Mission Statement in the space provided below.
The Center City Public Charter Schools’ (Center City PCS) mission is to empower our children for success through a rigorous academic program and strong character education while challenging students to pursue personal excellence in character, conduct, and scholarship in order to develop skills necessary to both serve and lead others in the 21st century.
2. Please choose your Campus/LEA's School and Name from the drop down choices provided below. Each campus must submit a separate data sheet. (For Central Office submissions, use the CENTRAL OFFICE choice provided for your organization).
Center City PCS Trinidad Campus
3. Is your organization accredited? If yes, please list the name (s) of the accrediting organization (s) and the accreditation term (month/year start- month/year end). If your accreditation is pending, meaning your organization has formally submitted an application to a nationally recognized accrediting organization, please provide details with the expected date of accreditation in the space provided below
Yes Center City PCS is accredited by the Middle States Associations. This accreditation started in July 2008 and expired in June 2011.
4. Please list the complete contact information for the person completing the Online Annual Report for your Campus/LEA. This may or may not be a member of school leadership, however be advised that information collected will be used by the PCSB. Fill out all information completely. Contact information should be direct and current.
Name Jennifer Yi
Title Special Projects Associate
School Street Address 1217 West Virginia Avenue, NE
School Zip 20002
School Ward 5
Direct Phone Number (202) 397-1614
Email [email protected]
5. Please select the lowest grade level served by your Campus/LEA in the 2010-2011 school year.
PreK
6. Please select the highest grade level served by your Campus/LEA in the 2010-2011 school years.
8

Center City PCS Trinidad Campus
2010-2011 Center City PCS Annual Report Page 87
7. Hours of Operation: Enter the Start time for the REGULAR school day for the 10-11 school year. For schools with Multiple Regular Start times please provide details in the additional comments section. Enter time as “8:05 AM” format (See “Definitions”)
8:00:00 AM
8. Please enter the End time for the REGULAR school day for the 10-11 school year. For schools with Multiple Regular Bell Dismissal Times, please provide details in the additional comments section. (See “Definitions”)
4:00:00 PM
9. Enter any additional comments regarding Start time/End time for Regular School Day.
M-Th is 8 PM - 4 PM, Fridays is 8 AM - 1 PM. Before Care from 7:00 AM - 8:00 AM, Afterschool from 4 - 6
PM (M-TH) and from 1:30 - 6:30 PM on Fridays.
10. Please enter the Start and End Dates for the 2010-2011 School Year.
Start Date 8/30/2010
End Date 6/17/2011
11. Did your campus/LEA operate as a year-round school for the 2010-2011 school year?
YES (If Yes describe your school's year round structure in the space provided below. Include the dates that indicate the
start and end of the academic school year.)
X NO Additional
Comments
12. Please enter the average class size and student teacher ratio for the 2010-2011 school year in the space provided below.
Average Class Size: 22.600000000000001
Student/Teacher Ratio: 1 to 13.9
13. For the 2010-2011 school year, please provide the total number of students/incidents falling into each category listed below.
# Transferring out of school/Withdrawls (total students) 11
# Short-Term Out of School Suspensions (5 days or less) 36
# Long-Term Out of School Suspensions (more than 5 days) 2
# of Expulsions (total students) 0
# of Dropouts (total students) 0
# Retained at grade level (total students) 13
(Suspension counts should reference the total number of “incidents”. For example, one student that is suspended short term 3 times will count as 3 “incidents” of short-term suspension)

Center City PCS Trinidad Campus
2010-2011 Center City PCS Annual Report Page 88
Questions 14-27: Staff Demographics Enter the Total Number of staff meeting criteria listed below in the spaces provided.
Position Total
Number
# with
Bachelors
degree
# with
Masters
degree or +
# with
degree in
field
# with
license in field (optional)
# meeting
NCLB HQT
requirements
Percentage
meeting
NCLB HQT
Director 11 11 8 (including
MA, MBA,
JD degrees)
N/A N/A N/A N/A
Principal 1 1 1 N/A N/A N/A N/A
Assistant Principal N/A N/A N/A N/A N/A N/A N/A
Classroom Teachers 11 11 4 2 N/A 10 91%
Special Subject
Teachers
2.5 2.5 0.5 1.25 N/A 2.5 100%
Bilingual/ESL
Teachers
0.25 0.25 0.25 0 N/A N/A N/A
Special Education
Teachers
2 2 2 0 N/A N/A N/A
Vocational/Career
Teachers
N/A N/A N/A N/A N/A N/A N/A
Building Resource
Teachers
0.75 0.75 0.75 0 N/A 0.75 100%
Counselors 1 1 1 1 1 N/A N/A
Librarians/Media
Specialists
N/A N/A N/A N/A N/A N/A
N/A
Coordinators N/A N/A N/A N/A N/A N/A N/A
Classroom Aides 4
N/A N/A N/A N/A 4 100%
Title I Educational
Aides
N/A N/A N/A N/A N/A
N/A N/A
28. Are you a single-campus LEA or a central office?
YES Skip to Question 29
X NO Skip to Question 30
29. Please complete the following entries regarding staffing and salary. Staff Attrition Rate 9%
Number of Teachers 2
Salary Range for Teachers $50,324 - $68,120
Average Teacher Salary $60,487
Number of School Support Staff 2
Salary Range for School Support Staff $34,220 - $54,000
Average School Support Staff Salary $43,359
Number of School Administrators 2
Salary Range for School Administrators $71,159 -$105,000
Average School Administrator Salary $85,267
Number of Central Office Administrators 4
Salary Range for Central Office Administrators $128,750 - $175,000
Average Central Office Administrator Salary $159,688

Center City PCS Trinidad Campus
2010-2011 Center City PCS Annual Report Page 89
30. To ensure that PCSB has up to date information for the 2011-2012 School Year, provide
contact information in the fields listed below for the following: School/Organization Board Chair, Executive Director, Principal/Head of School, Assistant Principal, Business Manager, Special Education Coordinator, and Attendance Manager.
Board Chair Name Ralph Boyd
Board Chair Title Chair
Board Chair Email [email protected]
Board Chair Phone (703) 918-8585
Board Chair Mailing Address 7 New York Avenue NE, Suite 200
Board Chair Mailing City, State Washington, DC
Board Chair Mailing Zip 20002
Exec. Director Name Beverley R. Wheeler, EdD
Exec. Director Title President & CEO
Exec. Director Email [email protected]
Exec. Director Phone (202) 589-0202
Exec. Director Mailing Address 7 New York Avenue, NE Suite 200
Exec. Director Mailing City, State Washington, DC
Exec. Director Mailing Zip 20002
Principal Name Monica Evans*
Principal Title Principal
Principal Email [email protected]
Principal Phone (202) 397-1614
Asst. Principal Name N/A
Asst. Principal Title N/A
Asst. Principal Email N/A
Asst. Principal Phone N/A
Business Manager Name Jim Laychak
Business Manager Title Chief Operating Officer
Business Manager Email [email protected]
Business Manager Phone (202) 589-0202
Business Manager Mailing Address Washington, DC
Business Manager Mailing City, State 7 New York Avenue, NE Suite 200
Business Manager Mailing Zip 20002
31. Parents, employees, and community members call the PCSB with individual and specific school-related issues and concerns. These issues and concerns include questions and at times, complaints about individual schools. In the space provided below, list the desired representatives from your Campus/LEA's staff and one member of your school's Board of Trustees to receive all initial correspondence from PCSB regarding these concerns for the 2011-2012 school year.
Campus/LEA Staff Member Name Monica Evans*
Campus/LEA Staff Member Title Principal
Campus/LEA Staff Member Phone [email protected]
Campus/LEA Staff Member Email (202) 397-1614
Board Member Name Ralph Boyd
Board Member Title Chair
Board Member Phone (703) 918-8585
Board Member Email [email protected]
2010-2011 Center City PCS Annual Report Page 90
VII. APPENDIX
Appendix A – HQT Listing as submitted to OSSE for SY 2010-11
Appendix B – Letter from Board Chair Certifying Authorizations
Appendix C – DCPCSB News Release, dated 8/2/2011
Appendix D – Center City PCS Spelling Bee, Science Fair and Annual Arts Event Invitations
Appendix E – Teacher Profiles
Appendix F – Organization Staffing Plan
Appendix G – Test Examples
Appendix H – List of Strategic Partners
Appendix I – Pictures

2010-2011 Center City PCS Annual Report Page 91
Appendix A - HQT Listing as submitted to OSSE for SY 2010-11

2010-2011 Center City PCS Annual Report Page 92
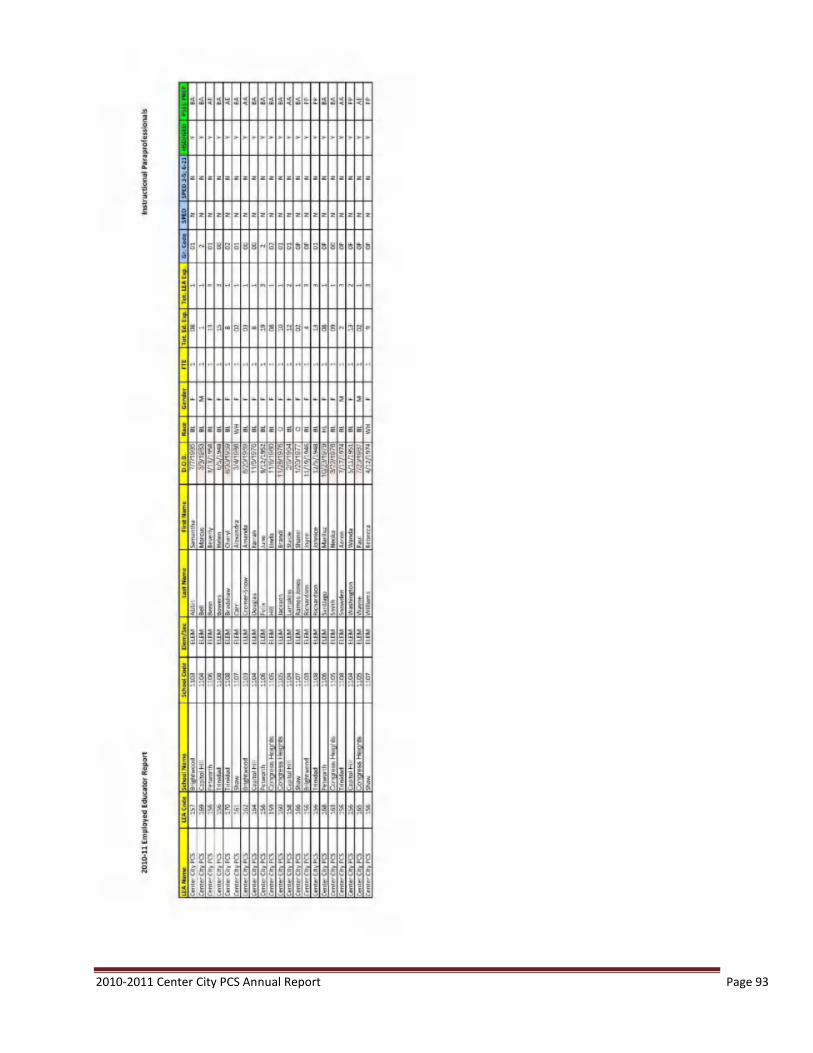
2010-2011 Center City PCS Annual Report Page 93

2010-2011 Center City PCS Annual Report Page 94
Appendix B - Letter from Board Chair Certifying Authorizations

2010-2011 Center City PCS Annual Report Page 95
Appendix C – DCPCSB News Release, 8/2/2011
NEWS RELEASE
3333 14th Street, N.W., Suite 210
Washington, DC 20010
Phone: 202-328-2660
www.dcpubliccharter.com
For Immediate Release: August 2, 2011 Contact: Audrey Williams 202-328-2748 / 301-351-6259 [email protected]
Final DC CAS Results Show Students Are Improving Across Charter Schools Washington, D.C. — DC public charter school students across the city showed impressive gains in both reading and mathematics on the District of Columbia Comprehensive Assessment System (DC CAS) tests. The DC Public Charter School Board today released the final analysis of the results of the tests that were taken in the spring. Nearly 60 percent of the charter school campuses -- 44 of the 76 tested -- showed improvement in this year’s scores compared to last year. There were also a large number of schools with high proficiency rates. Ten charter schools met Adequate Yearly Progress (AYP), as required by the federal No Child Left Behind Act of 2001(NCLB). (Click here for more information.) “The Board is extremely pleased with the performance we are seeing in a diverse array of schools across the city,” said Dr. Darren Woodruff, PCSB Board Member and Chair of the Schools Committee. “As we look across our portfolio of schools we are seeing higher proficiency rates in both the elementary and secondary grades. That means more students are performing at grade level or better in both reading and math.”
At the elementary level Achievement Prep Academy (Ward 8) had the highest proficiency in math (86.92%) and Two Rivers (Ward 6) had the highest proficiency in reading (77.94%).
At the middle school level, DC Prep Academy – Edgewood middle campus (Ward 5) had the highest proficiency in math with 92.15% of the students being proficient – 14 point increase over last year.
Washington Latin Middle School (Ward 4) had the highest reading proficiency of 83.93%.
At the high school level, KIPP DC College Preparatory (Ward 7) had the highest proficiency in math (91.67%) and Washington Latin High School (Ward 4) had the highest proficiency in reading (77.38%).

2010-2011 Center City PCS Annual Report Page 96
Schools Are Getting Better “Of particular interest to the PCSB are those schools that showed significant improvement in achievement over last year. “One of the key indicators of the Board’s evaluation of charter schools, using our performance management framework, is looking at student progress over time. We have seen marked improvement in quite a number of schools and that is testament to the work that school leaders are doing to raise student achievement,” Woodruff said.
In elementary schools, Community Academy’s Butler campus showed the most improvement in reading -- an increase of 25 points to 67.31% proficiency; and in math -- an increase of 21 points to 71.15% proficiency.
In secondary schools, Hospitality High School showed the most improvement in math – an increase of 26.22 points to 51.22% proficiency; and in reading – an increase of 22.20 points to 52.50% proficiency.
The PCSB will release the first results of its exclusive performance management framework (PMF) this November. The PMF enables more standardized evaluation of school quality and facilitates greater transparency about how the Board evaluates schools. Schools know how they are being measured and they have been participants in the development of the PMF. Parents will have access to easy- to-read school report cards and will be able to make informed decisions about enrollment in charter schools.
This coming school year the D.C. Public Charter School Board will oversee 53 public charter schools on 99 campuses, serving nearly 30,000 students living in every ward of the city. Public charter schools now serve approximately 40% of all public school students in Washington, D.C. Learn more about PCSB at www.dcpubliccharter.com Top Proficiency Rates for DC Charter Secondary Schools in Reading & Math
Charter School Ward Reading
2011
Charter School
Ward
Math 2011
Washington Latin - Middle School 4 83.93 D.C. Preparatory Academy Edgewood
Middle Campus 5
92.15
Howard University Math And Science 1 77.62 Kipp DC: College Preparatory 7 91.67
Kipp DC: College Preparatory 7 77.38 Kipp DC: Aim Academy 7 81.88
D.C. Preparatory Academy Edgewood Middle Campus 5 74.38
Howard University Math And Science
1 79.37
Washington Latin - High School 4 71.15 Cesar Chavez – Bruce Prep 1 77.83
Thurgood Marshall Academy 8 66.67 Washington Latin - Middle School 4 76.79
Kipp DC: Key Academy 7 64.89 SEED 7 76.37
Paul 4 64.59 Kipp DC: Key Academy 7 76.34
Kipp DC: Will Academy 2 62.46 Thurgood Marshall Academy 8 74.71
SEED 7 60.44 Paul 4 72.61
Kipp DC: Aim Academy 7 60.31 Kipp DC: Will Academy 2 71.84
Includes schools with at least 50% proficiency
Top Proficiency Rates for DC Charter Elementary Schools in Reading & Math
Charter School Ward Reading
2011
Charter School
Ward
Math 2011
Two Rivers 6 77.94
Achievement Preparatory Academy
8
86.92
Latin American Montessori Bilingual 4 76.09 E.L. Haynes 1 76.92
Capital City - Lower School 1 69.80 Community 71.15
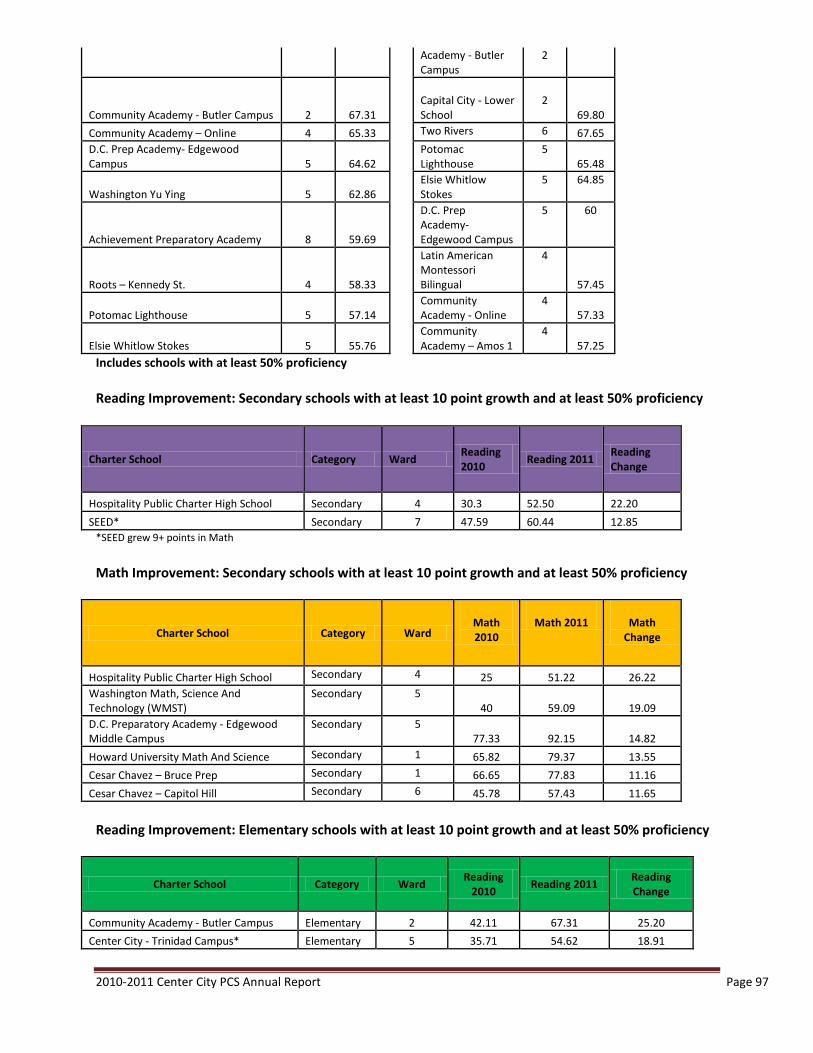
2010-2011 Center City PCS Annual Report Page 97
Academy - Butler Campus
2
Community Academy - Butler Campus 2 67.31
Capital City - Lower School
2
69.80
Community Academy – Online 4 65.33 Two Rivers 6 67.65
D.C. Prep Academy- Edgewood Campus 5 64.62
Potomac Lighthouse
5 65.48
Washington Yu Ying 5 62.86 Elsie Whitlow
Stokes 5 64.85
Achievement Preparatory Academy 8 59.69
D.C. Prep Academy- Edgewood Campus
5 60
Roots – Kennedy St. 4 58.33
Latin American Montessori Bilingual
4
57.45
Potomac Lighthouse 5 57.14 Community
Academy - Online 4
57.33
Elsie Whitlow Stokes 5 55.76 Community
Academy – Amos 1 4
57.25
Includes schools with at least 50% proficiency
Reading Improvement: Secondary schools with at least 10 point growth and at least 50% proficiency
Charter School Category Ward Reading 2010
Reading 2011 Reading Change
Hospitality Public Charter High School Secondary 4 30.3 52.50 22.20
SEED* Secondary 7 47.59 60.44 12.85
*SEED grew 9+ points in Math
Math Improvement: Secondary schools with at least 10 point growth and at least 50% proficiency
Charter School Category Ward
Math 2010
Math 2011
Math
Change
Hospitality Public Charter High School Secondary 4 25 51.22 26.22
Washington Math, Science And Technology (WMST)
Secondary 5 40 59.09 19.09
D.C. Preparatory Academy - Edgewood Middle Campus
Secondary 5 77.33 92.15 14.82
Howard University Math And Science Secondary 1 65.82 79.37 13.55
Cesar Chavez – Bruce Prep Secondary 1 66.65 77.83 11.16
Cesar Chavez – Capitol Hill Secondary 6 45.78 57.43 11.65
Reading Improvement: Elementary schools with at least 10 point growth and at least 50% proficiency
Charter School Category Ward Reading
2010 Reading 2011
Reading Change
Community Academy - Butler Campus Elementary 2 42.11 67.31 25.20
Center City - Trinidad Campus* Elementary 5 35.71 54.62 18.91
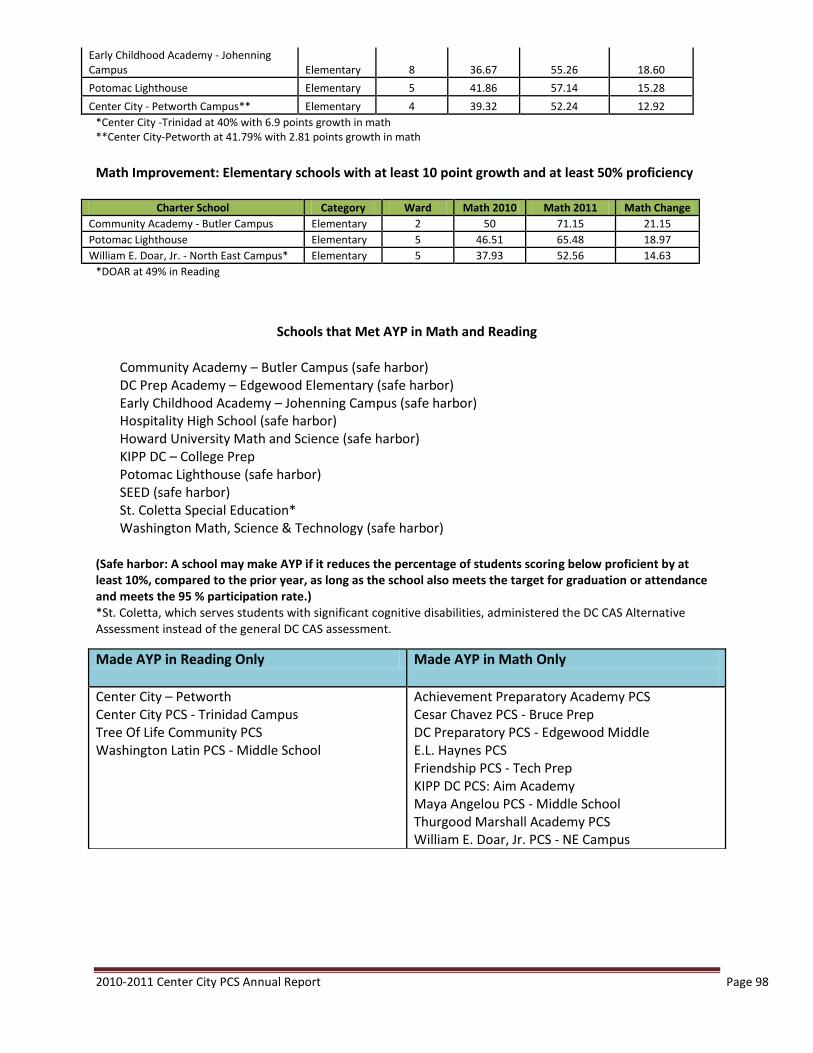
2010-2011 Center City PCS Annual Report Page 98
Early Childhood Academy - Johenning Campus Elementary 8 36.67 55.26 18.60
Potomac Lighthouse Elementary 5 41.86 57.14 15.28
Center City - Petworth Campus** Elementary 4 39.32 52.24 12.92
*Center City -Trinidad at 40% with 6.9 points growth in math **Center City-Petworth at 41.79% with 2.81 points growth in math Math Improvement: Elementary schools with at least 10 point growth and at least 50% proficiency
Charter School Category Ward Math 2010 Math 2011 Math Change
Community Academy - Butler Campus Elementary 2 50 71.15 21.15
Potomac Lighthouse Elementary 5 46.51 65.48 18.97
William E. Doar, Jr. - North East Campus* Elementary 5 37.93 52.56 14.63
*DOAR at 49% in Reading
Schools that Met AYP in Math and Reading
Community Academy – Butler Campus (safe harbor) DC Prep Academy – Edgewood Elementary (safe harbor) Early Childhood Academy – Johenning Campus (safe harbor) Hospitality High School (safe harbor) Howard University Math and Science (safe harbor) KIPP DC – College Prep Potomac Lighthouse (safe harbor) SEED (safe harbor) St. Coletta Special Education* Washington Math, Science & Technology (safe harbor)
(Safe harbor: A school may make AYP if it reduces the percentage of students scoring below proficient by at least 10%, compared to the prior year, as long as the school also meets the target for graduation or attendance and meets the 95 % participation rate.) *St. Coletta, which serves students with significant cognitive disabilities, administered the DC CAS Alternative Assessment instead of the general DC CAS assessment.
Made AYP in Reading Only Made AYP in Math Only
Center City – Petworth Center City PCS - Trinidad Campus Tree Of Life Community PCS Washington Latin PCS - Middle School
Achievement Preparatory Academy PCS Cesar Chavez PCS - Bruce Prep DC Preparatory PCS - Edgewood Middle E.L. Haynes PCS Friendship PCS - Tech Prep KIPP DC PCS: Aim Academy Maya Angelou PCS - Middle School Thurgood Marshall Academy PCS William E. Doar, Jr. PCS - NE Campus

2010-2011 Center City PCS Annual Report Page 99
Appendix D – Spelling Bee, Science Fair and Annual Visual and Performing Arts
Invitations

2010-2011 Center City PCS Annual Report Page 100

2010-2011 Center City PCS Annual Report Page 101

2010-2011 Center City PCS Annual Report Page 102
Appendix E – Teacher Profiles
Lauren Amrhein – Capitol Hill, 2nd Grade Center City PCS Capitol Hill 2nd grade teacher Lauren Amrhein wanted to be a teacher for as long as she can remember. “I’ve known that I’ve wanted to teach since I was very young,” Lauren says. A Wisconsin native, she moved with her family to Virginia before middle school and later attended the college of William and Mary. In her undergraduate studies, she majored in Hispanic Studies and Elementary Education, later gaining a Masters in special education. Her passion for education and learning is something she now wants to instill in her own students. “I live for the sparkle that students get in their eyes when they suddenly realize they can do something they thought was impossible.” Lauren and the primary team at Capitol Hill have worked to establish a theme for each classroom, including the jungle, ocean, and solar
system. “We’re trying to use themes to inspire students to be inquisitive about things we may not directly cover in the curriculum. It really makes the school year fun for the students, because we build on the themes continuously throughout the year.” “I think that Center City PCS is special because we’re truly centered and focused in the neighborhoods,” Lauren says. “It’s fun for us to run into the families we teach in the grocery store and be able to say hello around town.” Lauren has also developed this connection with her colleagues. “I knew as soon as I interviewed at Center City that it was the place I’d been searching for,” Lauren recalls. “In five years, I can definitely still see myself trying to perfect the art of teaching, because as teachers we learn more every year…I absolutely love working with my students, and it’s truly become home for me. I really couldn’t see myself teaching anywhere else or being with any other kids or families.” Liz Barriga – Shaw, Spanish Shaw Spanish teacher Elizabeth “Liz” Barriga was only five years old when she left her native home of Lima, Peru and moved to Delaware. She graduated with a Bachelor’s in Arts from the University of Delaware, with a double major in International Relations and Spanish, and she had the opportunity to study abroad twice in Argentina. It wasn’t education that first brought Liz to DC. In 2007, Liz was given the opportunity to intern with Joe Biden’s Presidential campaign. However, Liz had a change of heart. “Once I moved down here, I embraced the culture and diversity in the city,” she says. “After being here for a couple of months, I decided that I wanted to do something with my own culture. I was very passionate about teaching Spanish culture and language.” Liz has been with Center City PCS since it converted into a network of charter schools in 2008, something Liz describes as “a very good learning experience.” Through the Spanish teacher position, Liz has the unique opportunity to teach all of the students at the Shaw campus. “I get the biggest smile on my face when other teachers tell me they hear students in class counting numbers in Spanish, etc.,” she explains. “It just makes me feel like I’ve made a small difference in someone’s life, just knowing that they’re excited about sharing what they have learned.” Another unique experience Liz enjoys is the chance to work with other teachers beyond her department. Beyond the Spanish classroom, Liz has also worked to form a new Spanish curriculum for

2010-2011 Center City PCS Annual Report Page 103
Center City PCS, implemented in the 2010-2011 school year. She has also previously helped with reading and math in the fourth grade, and just this past year, she helped the second grade with additional literacy support.
David Friebele – Trinidad, Instructional Coach A double history and international studies major with a minor in Spanish, David Friebele did not see himself becoming a math teacher. It wasn’t until he became a teaching assistant (TA) for one of his professors his junior year of college that he became interested in teaching, and as David describes it, he “just sort of fell into the math position.” After rotating through several education-related jobs, David began working at Sacred Heart Catholic School, a part of the consortium that was not later converted into a charter school, but this familiarity with the community allowed David to move into his role at Center City PCS easily. After completing two years as the Petworth math and social studies teacher, David is transitioning over to the Trinidad campus as an instructional coach. “I saw an opportunity to be more of a leader, a
change maker,” David explains, “and that’s exciting for me…I’m just excited to meet more teachers and *help+ them with their craft.” Although David is leaving the classroom, his experience in the classroom is one he clearly cherishes, as it was an environment where he learned as much from the students as he could. When David joined Center City PCS, he was in the second year of his Master’s program, leaving him with a lot on his plate. “I was visibly stressed,” David recalls, “and my class supported me when I needed it.” David didn’t stretch himself too thin, and in fact, his 7th grade students made Adequate Yearly Progress (AYP). Excellence is certainly something David strives for and something that excites him the most about teaching. “My favorite part about teaching,” David says, “is when kids…experience success and that makes them thirsty for more success, makes them strive for success, and invested in their own learning, basically becoming learners for the sake of learning.” Joshua Johnson – Brightwood, MS Science Brightwood’s Middle School Science Teacher Josh Johnson received his Bachelor’s degree from St. Lawrence University with a major in Chemistry and a minor in Global Studies. Upon graduation, Josh joined Teach for America, which brought him to Center City PCS. On top of his teaching responsibilities at Center City, Josh is currently working toward his Master’s in Teaching Science at American University. Josh likes the close-knit community he found at Brightwood: “It’s a really small school. That’s one thing that I love, because it creates a family atmosphere between the teachers and also with the students.” Josh hadn’t always envisioned himself as a teacher, but found it to be a great outlet for his interests. “When it came down to it, teaching was a perfect way to combine my passion for science and for being around people. It brought two things I really liked together.” Josh has been working hard to bring this same passion to his students. “I try to incorporate a lot of real-world examples and make science accessible for my students, to show them that it is around them every day.” A particularly special experience for Josh was this year’s science fair. “It made me feel really great,” Josh recalled. “It was a moment I saw all of the kids really invested in science and loving it. I could hear kids down the hallway cheering for their classmates. One of the

2010-2011 Center City PCS Annual Report Page 104
winners ran into my room, jumping up and down because of how excited he was to win. That’s something I’m taking away from this year at Center City PCS as a big win, and I’m excited to make it an even bigger deal next year.”
Kamishia Lee – Capitol Hill/Trinidad, Art Art Teacher Kamishia Lee has always been good at adapting to change. She signed on with Center City PCS eight years ago and has stayed following the conversion to public charter schools. “The bottom line was to keep the schools open for the students,” she says. This past year, she stepped beyond her role of art teacher and acted as the artist in-residence for all six schools, working with all six art teachers and departments. “It was very good being able to go to different campuses and learning and working with different teachers. It helped me grow and develop as an art teacher as well.” This upcoming year, Kamishia hopes to expand a project she installs in the classroom every year, which is to relate the year’s projects back to a particular country. A previous year focused on Australia, which led to student created didgeridoos and boomerangs. Her country in mind for the upcoming year is India.
The time constraints of being a teacher have not stopped Kamishia from being an artist herself, but have allowed her to channel her creative energy into projects that add value to the schools. A particular masterpiece that Kamishia is proud of is the kindergarten classroom that she transformed into a rainforest, with 2D and 3D animals around the room. “Whenever I get the chance, I add something to it,” Kamishia said. “It’s something else.” Kamishia also enjoys finding creative ways to engage the students, such as field trips to DC, working in the style of children’s author Eric Carle, and even using big leaves around campus as painting canvases. Despite her acceptance of change, one thing that won’t be changing any time soon is Kamishia’s love for her job. “I can’t imagine teaching anything else or doing anything else. I’m happy with my job. I enjoy coming to work.” Kamishia also encourages all potential teachers to share this same level of devotion. “You have to love it, live it and breathe it. It’s a real part of your life. If you don’t have a passion for what you’re doing, don’t even try. It’s a very hard job, but it’s so rewarding. There’s nothing more rewarding than teaching.

2010-2011 Center City PCS Annual Report Page 105
Appendix F – Organization Staffing Plan

2010-2011 Center City PCS Annual Report Page 106
Appendix G – Test Examples

2010-2011 Center City PCS Annual Report Page 107
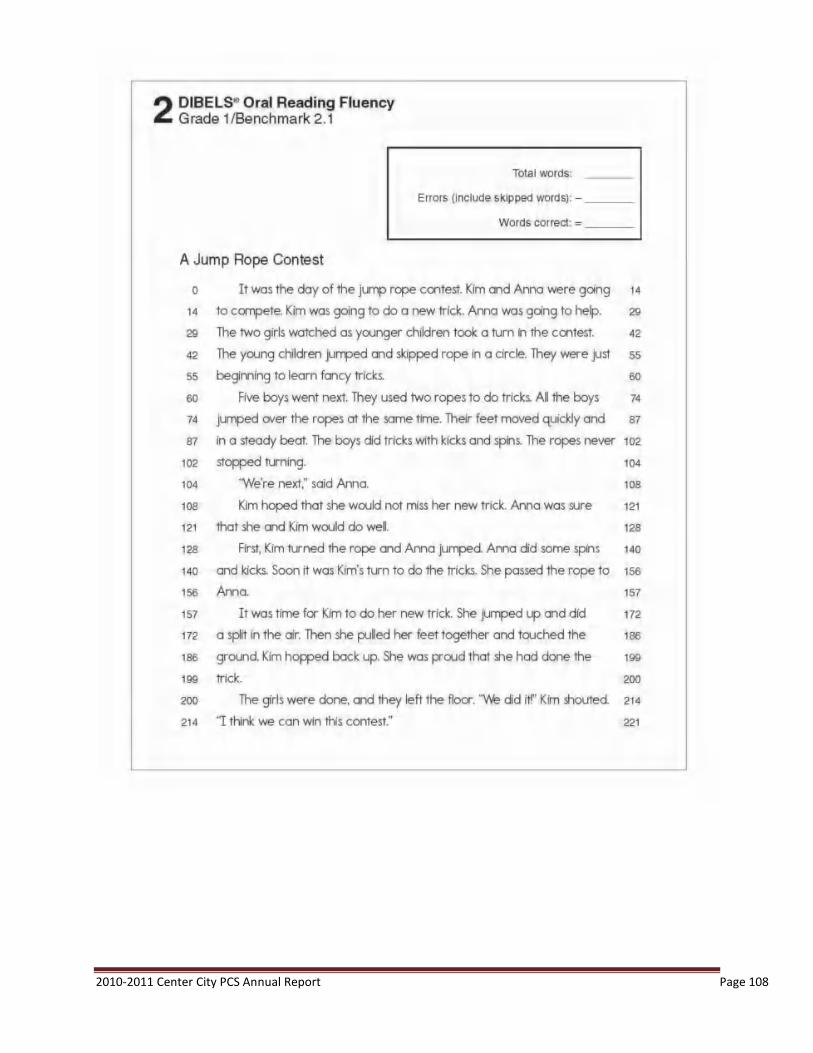
2010-2011 Center City PCS Annual Report Page 108
2010-2011 Center City PCS Annual Report Page 109

2010-2011 Center City PCS Annual Report Page 110

2010-2011 Center City PCS Annual Report Page 111

2010-2011 Center City PCS Annual Report Page 112
Appendix H – List of Strategic Partners
Academic Center City PCS partners with multiple organizations and non-profits to bring a variety of academic enrichment activities to our schools, both district-wide and by campus, to support the mission and vision of our organization. They are:
Name Campus Purpose Dosage Targeted Grades
RESET All CCPCS (some to roll out in January)
Improve scientific literacy and curiosity among teachers and students through experiential learning activities that are aligned to DCPS standards; Improve student attitudes toward science.
1 hr/wk for 6 Wks 3rd and 5th Grade
Higher Achievement Program All CCPCS (Capitol Hill serves as Ward 6 host site)
Close the achievement gap by developing academic skills, behaviors, and attitudes to improve their grades, test scores, attendance, and opportunities – resulting in acceptance to college preparatory high schools.
M, T, Th from 3:30-7pm
5th-8th
G.U.M.S.H.O.E. (Georgetown University Math and Science Hands-On Enrichment)
Brightwood, Shaw
Provide academic support in math and science.
1 hr/wk throughout the school year
6th-8th Grade
Champion's Science Club All CCPCS Provide hands on science-based enrichment activities that help make learning relevant and useful by establishing connections to life outside the classroom, addressing real world concerns, and developing real world skills.
1 hr/wk for 25 wks 4th Grade
DC Schools Project Brightwood, Petworth
Tutors visit the homes of immigrant families where they work one-on-one with their tutees and serve as a resource person for the entire family. Provide free English language classes (open to all CCPCS families).
1 hr.15min twice a week throughout the school year
PreK-8th Grade
Ashley Tutors All CCPCS Provide academic small group academic support in reading and math for student athletes
1 hr/Sat during duration of sports league
PreK-5th Grade
DC Reads Capitol Hill, Shaw
One-on-one tutorial program focused on increasing the reading skills of the D.C. children.
1 hr/wk throughout the school year
4th-8th Grade
Teatro De La Luna Petworth Provide students with the opportunity to develop language skills and celebrate Hispanic culture through their preparation for the Poetry Marathon.
1 x Wk; 1 hr.; 8 Wks 3rd-5th Grade
Reading Partners Congress Heights
One-on-one tutorial program focused on increasing the reading skills of the D.C. children. Provide full-time campus-based staff who manages and oversees program.
Each participating student receives 2 45min session/wk throughout the school year
2nd-8th Grades
In addition, Center City PCS has several partnerships to provide physical education and health services to all of our campuses and students. They include PlayWorks at all of our campuses to improve the health

2010-2011 Center City PCS Annual Report Page 113
and well-being of all students by increasing physical activity and safe play during and after the school day; and several nursing partnerships with local universities like Georgetown University, Catholic University and Marymount University. During the year, Center City PCS runs several intramural sports league to give opportunities to students to participate in sports like basketball, soccer, volleyball and more to promote team building skills and encourage parent participation and school support. Human Capital Partnerships The talent team has worked to grow and develop relationships with organizations that can continue to assist Center City in recruiting, supporting, and retaining excellent teachers, leaders, and management personnel for Center City PCS students.
1. Teach for America: Center City PCS partnered with Teach for America for the third year to hire several candidates. Our screening team is working to quickly identify high-caliber TFA candidates and use them to fill high-need vacancies. Overall, we have Teach for American corps members and alumni in critical roles across our campus teaching and leadership corps, and we will continue to work with them to fill openings at every level, given their groundbreaking work across the human capitol spectrum. 2. Urban Teacher Center: The Urban Teacher Center Partnership is now in its second year at Center City PCS. As an inaugural partner, 4 new teachers served as Center City PCS Fellows last year, and Center City PCS will begin the year with 14 fellows across 4 campuses for the 2011-12 school year. In addition, Center City PCS was a recipient of Race to the Top Funds in conjunctions with Urban Teacher Center and Cesar Chavez Public charter schools. The UTC program works to assign resident teachers, who will be taking coursework and then working at Center City for 3 additional years. The partnership piloted at the Brightwood and Capitol Hill campuses last year and has been expanded to include the Shaw and Trinidad Campuses. 3. The New Teacher Project (TNTP):
a) Talent Management Initiative: Center City has fully participated in TNTP’s assessment of talent management practices at DC Public Charter Schools. The results, which were made available in mid-July, provide critical teacher, administrator, and leadership input on Center City’s talent management practices. TNTP also presented these results to our entire campus-based leadership team and will be working to conduct the survey at points throughout the year. b) Principal Coaching: The second phase of this NSVF-supported partnership involves principal coaching. Currently, we have partnered with Petworth Campus to support human capital pipeline management at a pilot location and individual principal coaching. Center City PCS plans to expand this partnership to include all six campuses.
4. Education Pioneers: This summer, we hosted three Education Pioneers Fellows in the Central office. The Fellows were charged with functions critical to Center City PCS. Education Pioneer Fellows wrote the Center City PCS evaluation plan for teachers and leaders, ran the Summer School program, and created models to support the finance division. Education Pioneers are graduate school Fellows who work with a partner site for a summer to support mission-critical work. In addition, the talent team works closely to source management talent from the nationwide network of high-performing Fellows Alumni.

2010-2011 Center City PCS Annual Report Page 114
Appendix I – Pictures Spelling Bee 2010
Science Fair 2011

2010-2011 Center City PCS Annual Report Page 115
Annual Visual and Performing Arts 2011
Promotion Luncheon 2011
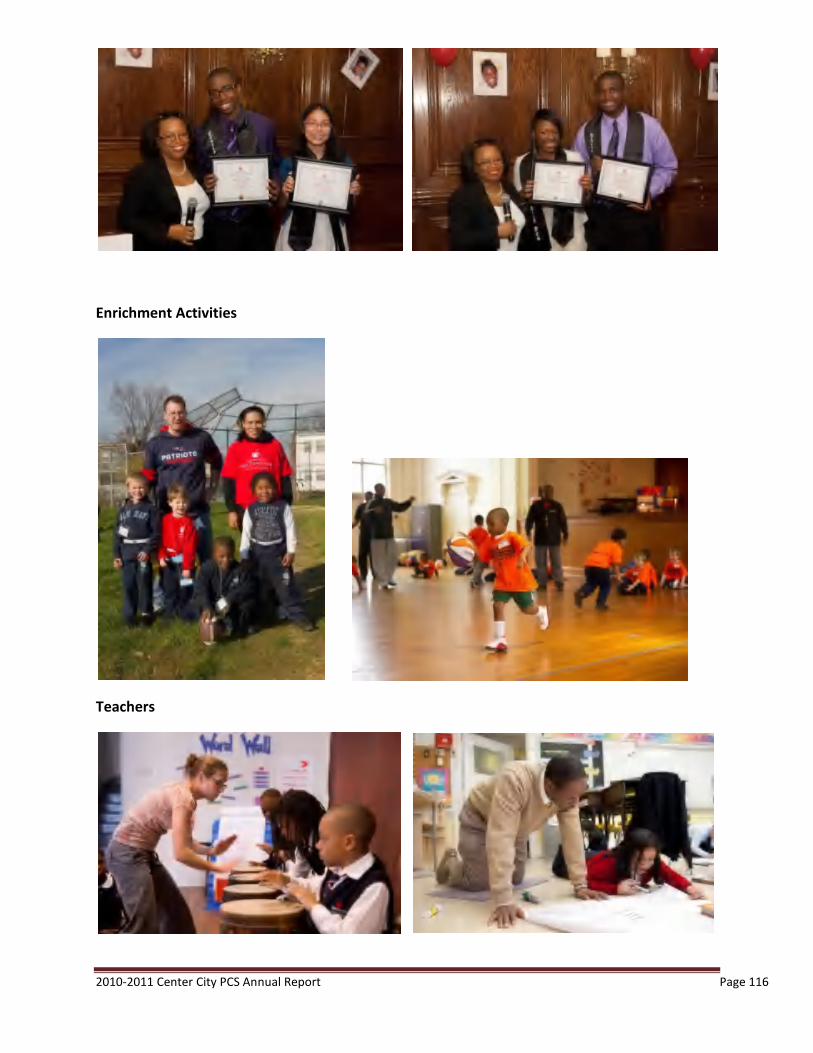
2010-2011 Center City PCS Annual Report Page 116
Enrichment Activities
Teachers