2009 profile of state assessment...
TRANSCRIPT
♦ 2009 PROFILE OF STATE ASSESSMENT PROGRAMS
A Profile of State Assessment Programs 2009
Since 2003, the National Center for Education Statistics (NCES) has supported research that compares the proficiency standards of the National Assessment of Educational Progress (NAEP) with those of individual states. State assessments are placed onto a common scale defined by NAEP, which allows states’ proficiency standards to be compared not only to NAEP, but also to each other.1 While the mapped NAEP equivalent scores of state standards are useful in determining the relative rigor of states’ proficiency standards, the results of the studies should be interpreted with caution. Variations among states can be due to many factors, including differences in assessment frameworks, test specifications, the psychometric properties of the tests, the definition of Adequate Yearly Progress (AYP) standards, and the standard-setting process.
In 2007, in collaboration with the Education Information Management Advisory Consortium (EIMAC)—Task Force on Assessment of the Council of Chief State School Officers—NCES conducted a survey of state assessment programs to gain contextual information about the states’ assessment programs in 2006–07 and to note changes in their assessments between the 2004–05 and 2006–07 school years that could affect the interpretation of the mapping results. The NAEP State Coordinator in every state was asked to provide information about the state’s testing program through an online survey. After this information was verified and confirmed by the NAEP State Coordinator of each state, it was summarized in individual state profiles.2 These profiles were designed in collaboration with a panel of NAEP State Coordinators.
In support of the 2009 Mapping Study, NAEP State Coordinators were asked by NCES to update the information collected on their state assessment program in 2007. Following similar verification steps, the information was summarized into profiles to provide a concise snapshot of all state assessment programs in the 2008–09 school year. Each profile presents information on the grades and subjects tested during the 2008–09 year, state performance levels and performance level descriptors, the composition of main state assessments, and changes to the state assessments between 2006–07 and 2008–09.
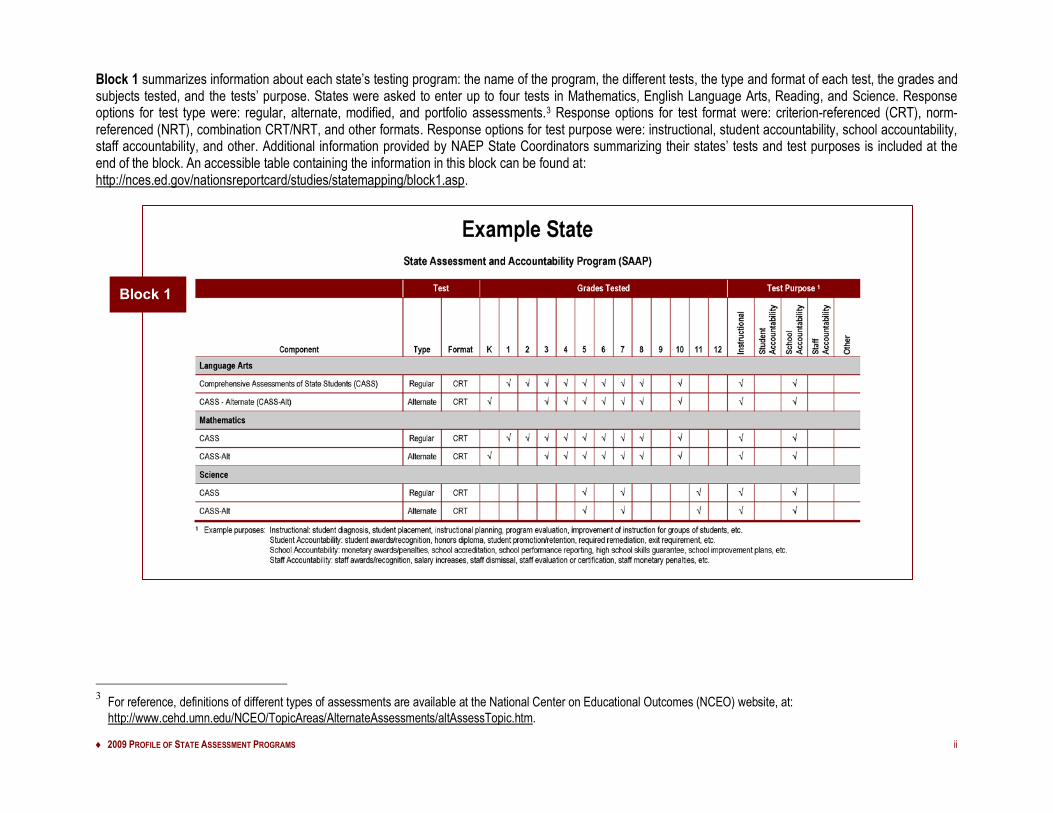
A sample profile is shown below. Information on the state assessment programs is presented in nine blocks. The first block combines all subjects. The remaining blocks (2–9) are presented twice, once for Reading/Language Arts and then for Mathematics. The example that follows is for Reading/Language Arts only. Some answers may have been edited for consistency or for space limitations; however, the substance of all answers is unchanged from what states provided to the NAEP State Coordinators. All web addresses in these profiles were verified on May 15, 2011. In any block, the symbol “—” indicates that a state’s information was either not provided (for example, if there is no information on performance level descriptors of an alternate assessment for meeting AYP) or not applicable (for example, if the information relates to the proportion of the test score from short constructed response items, but the test does not use short constructed response items).
1 Documents that discuss the research on NAEP and state proficiency standards are available at: http://nces.ed.gov/nationsreportcard/studies/statemapping/. 2 The 2007 State Profiles are available at: http://nces.ed.gov/nationsreportcard/studies/statemapping/profile standards 2007.asp.
♦ 2009 PROFILE OF STATE ASSESSMENT PROGRAMS ii
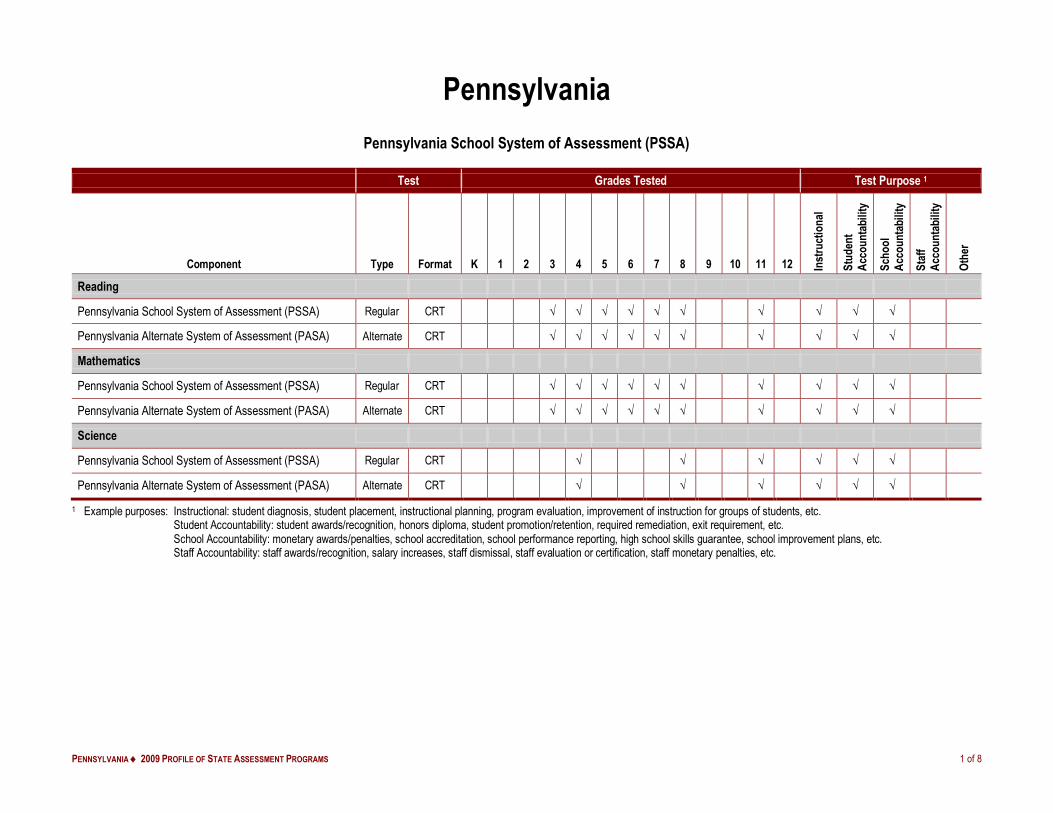
Block 1 summarizes information about each state’s testing program: the name of the program, the different tests, the type and format of each test, the grades and subjects tested, and the tests’ purpose. States were asked to enter up to four tests in Mathematics, English Language Arts, Reading, and Science. Response options for test type were: regular, alternate, modified, and portfolio assessments.3 Response options for test format were: criterion-referenced (CRT), norm-referenced (NRT), combination CRT/NRT, and other formats. Response options for test purpose were: instructional, student accountability, school accountability, staff accountability, and other. Additional information provided by NAEP State Coordinators summarizing their states’ tests and test purposes is included at the end of the block. An accessible table containing the information in this block can be found at: http://nces.ed.gov/nationsreportcard/studies/statemapping/block1.asp.
3 For reference, definitions of different types of assessments are available at the National Center on Educational Outcomes (NCEO) website, at:
http://www.cehd.umn.edu/NCEO/TopicAreas/AlternateAssessments/altAssessTopic.htm.
Block 1
♦ 2009 PROFILE OF STATE ASSESSMENT PROGRAMS iii
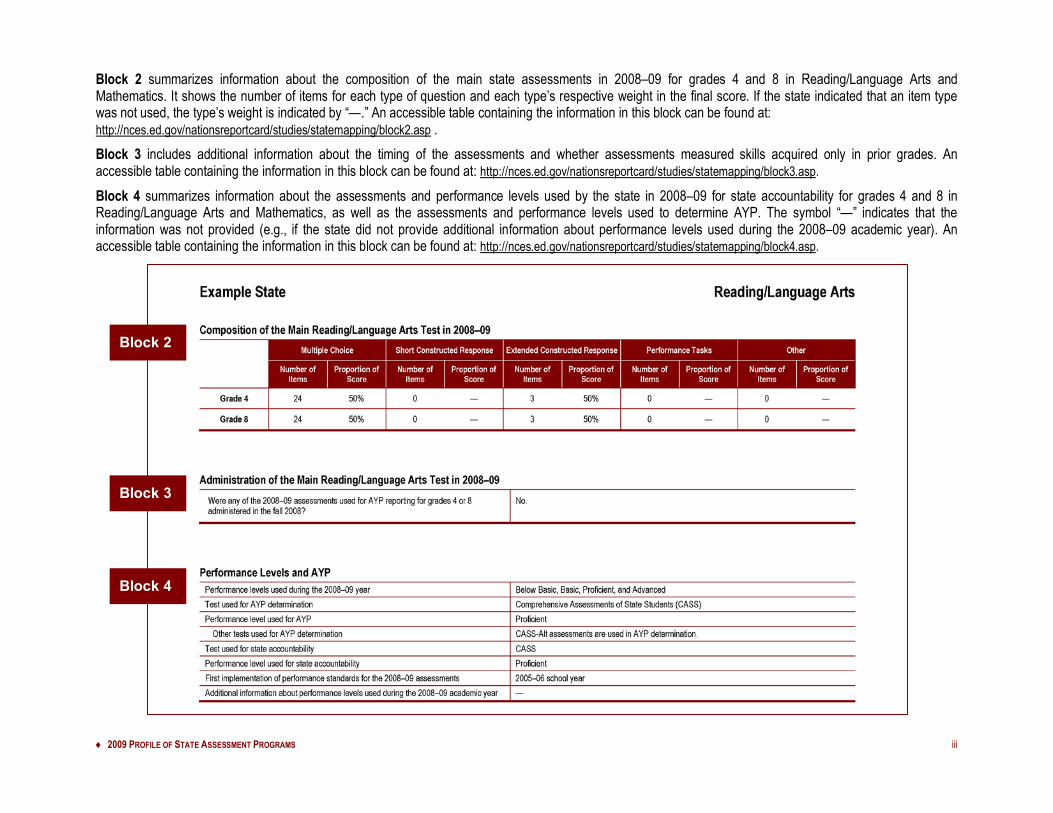
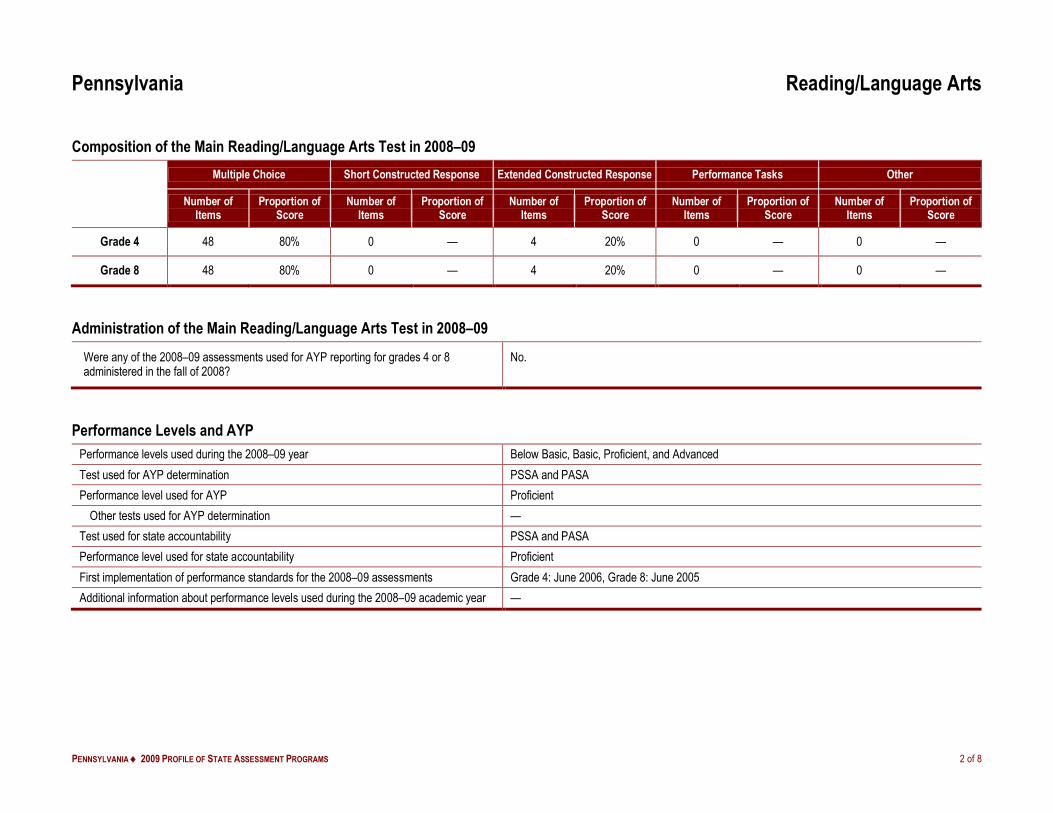
Block 2 summarizes information about the composition of the main state assessments in 2008–09 for grades 4 and 8 in Reading/Language Arts and Mathematics. It shows the number of items for each type of question and each type’s respective weight in the final score. If the state indicated that an item type was not used, the type’s weight is indicated by “—.” An accessible table containing the information in this block can be found at: http://nces.ed.gov/nationsreportcard/studies/statemapping/block2.asp . Block 3 includes additional information about the timing of the assessments and whether assessments measured skills acquired only in prior grades. An accessible table containing the information in this block can be found at: http://nces.ed.gov/nationsreportcard/studies/statemapping/block3.asp. Block 4 summarizes information about the assessments and performance levels used by the state in 2008–09 for state accountability for grades 4 and 8 in Reading/Language Arts and Mathematics, as well as the assessments and performance levels used to determine AYP. The symbol “—” indicates that the information was not provided (e.g., if the state did not provide additional information about performance levels used during the 2008–09 academic year). An accessible table containing the information in this block can be found at: http://nces.ed.gov/nationsreportcard/studies/statemapping/block4.asp.
Block 2
Block 3
Block 4

♦ 2009 PROFILE OF STATE ASSESSMENT PROGRAMS iv
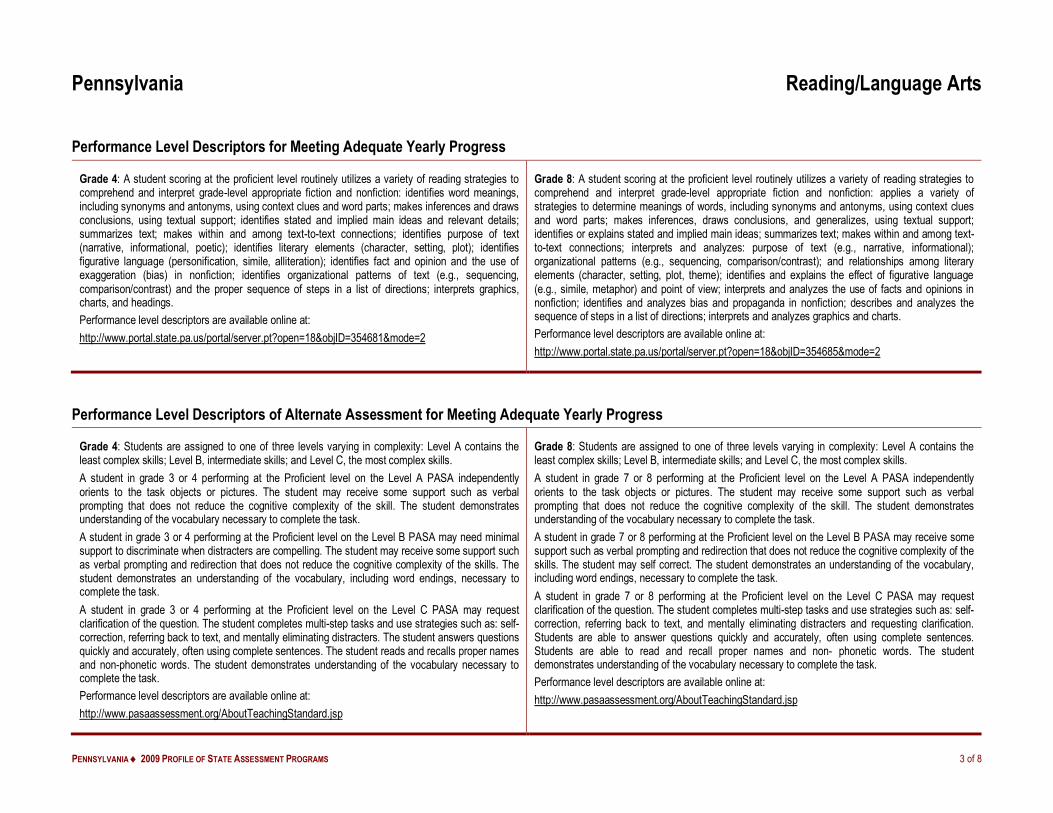
Block 5 provides the performance level descriptors used for meeting AYP in 2008–09 assessments for grades 4 and 8 in Reading/Language Arts and Mathematics. The descriptors correspond to the proficient performance level as it is defined by each state. A web address is included if the state provided a link. An accessible table containing the information in this block can be found at: http://nces.ed.gov/nationsreportcard/studies/statemapping/block5.asp.
Block 6 lists the performance level descriptors used for meeting AYP in 2008–09 alternate assessments for grades 4 and 8 in Reading/Language Arts and Mathematics. The descriptors correspond to the proficient performance level as it is defined by each state. A “—” indicates that the state did not provide performance level descriptors. A web address is included if the state provided a link. An accessible table containing the information in this block can be found at: http://nces.ed.gov/nationsreportcard/studies/statemapping/block6.asp.
Block 5
Block 6
♦ 2009 PROFILE OF STATE ASSESSMENT PROGRAMS v
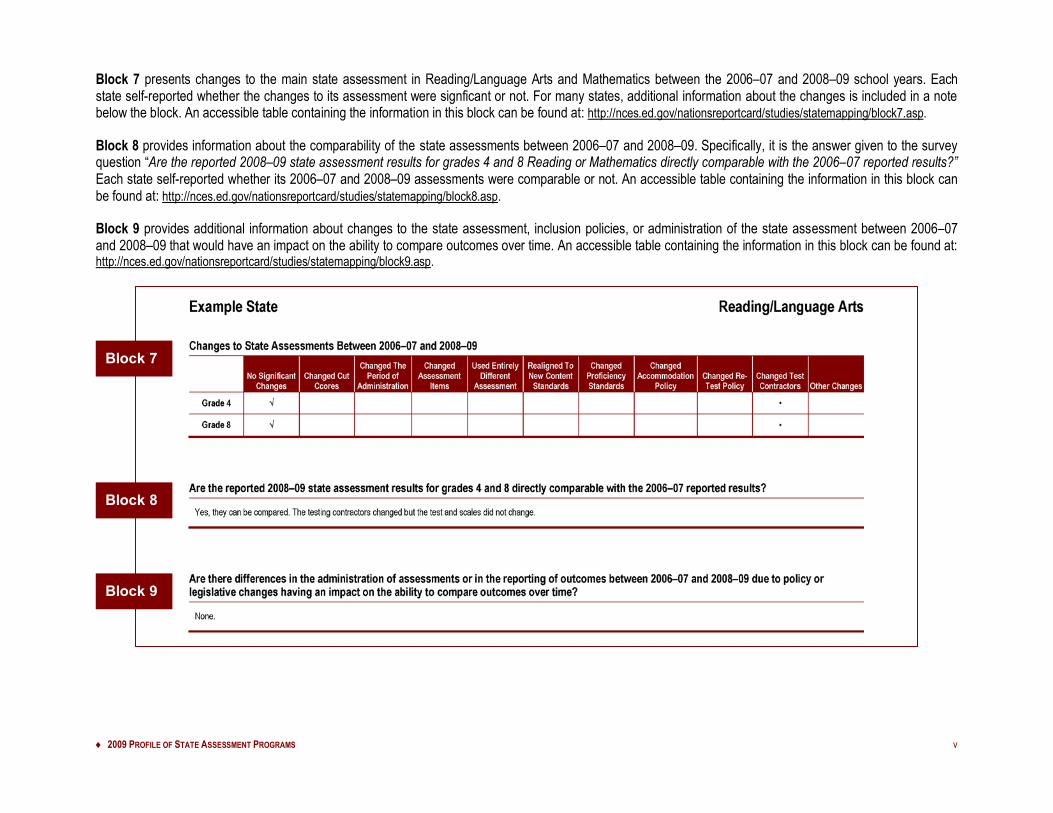
Block 7 presents changes to the main state assessment in Reading/Language Arts and Mathematics between the 2006–07 and 2008–09 school years. Each state self-reported whether the changes to its assessment were signficant or not. For many states, additional information about the changes is included in a note below the block. An accessible table containing the information in this block can be found at: http://nces.ed.gov/nationsreportcard/studies/statemapping/block7.asp.
Block 8 provides information about the comparability of the state assessments between 2006–07 and 2008–09. Specifically, it is the answer given to the survey question “Are the reported 2008–09 state assessment results for grades 4 and 8 Reading or Mathematics directly comparable with the 2006–07 reported results?” Each state self-reported whether its 2006–07 and 2008–09 assessments were comparable or not. An accessible table containing the information in this block can be found at: http://nces.ed.gov/nationsreportcard/studies/statemapping/block8.asp.
Block 9 provides additional information about changes to the state assessment, inclusion policies, or administration of the state assessment between 2006–07 and 2008–09 that would have an impact on the ability to compare outcomes over time. An accessible table containing the information in this block can be found at: http://nces.ed.gov/nationsreportcard/studies/statemapping/block9.asp.
Block 7
Block 8
Block 9
♦ 2009 PROFILE OF STATE ASSESSMENT PROGRAMS vi
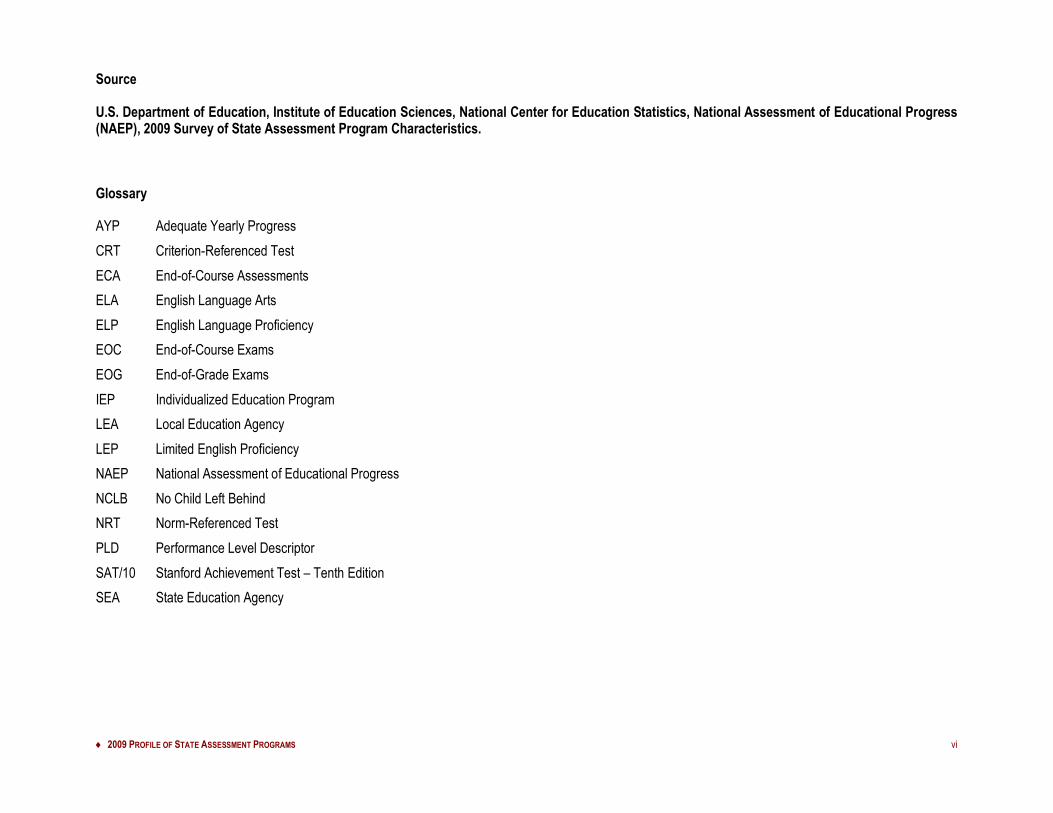
Source
U.S. Department of Education, Institute of Education Sciences, National Center for Education Statistics, National Assessment of Educational Progress (NAEP), 2009 Survey of State Assessment Program Characteristics.
Glossary
AYP Adequate Yearly Progress CRT Criterion-Referenced Test ECA End-of-Course Assessments ELA English Language Arts ELP English Language Proficiency EOC End-of-Course Exams EOG End-of-Grade Exams IEP Individualized Education Program LEA Local Education Agency LEP Limited English Proficiency NAEP National Assessment of Educational Progress NCLB No Child Left Behind NRT Norm-Referenced Test PLD Performance Level Descriptor SAT/10 Stanford Achievement Test – Tenth Edition SEA State Education Agency
PENNSYLVANIA ♦ 2009 PROFILE OF STATE ASSESSMENT PROGRAMS 1 of 8
Pennsylvania
Pennsylvania School System of Assessment (PSSA)
Test Grades Tested Test Purpose 1
Component Type Format K 1 2 3 4 5 6 7 8 9 10 11 12 Inst
ruct
iona
l
Stud
ent
Acco
unta
bilit
y
Scho
ol
Acco
unta
bilit
y
Staf
f Ac
coun
tabi
lity
Othe
r
Reading
Pennsylvania School System of Assessment (PSSA) Regular CRT √ √ √ √ √ √ √ √ √ √
Pennyslvania Alternate System of Assessment (PASA) Alternate CRT √ √ √ √ √ √ √ √ √ √
Mathematics
Pennsylvania School System of Assessment (PSSA) Regular CRT √ √ √ √ √ √ √ √ √ √
Pennsylvania Alternate System of Assessment (PASA) Alternate CRT √ √ √ √ √ √ √ √ √ √
Science
Pennsylvania School System of Assessment (PSSA) Regular CRT √ √ √ √ √ √
Pennsylvania Alternate System of Assessment (PASA) Alternate CRT √ √ √ √ √ √
1 Example purposes: Instructional: student diagnosis, student placement, instructional planning, program evaluation, improvement of instruction for groups of students, etc. Student Accountability: student awards/recognition, honors diploma, student promotion/retention, required remediation, exit requirement, etc. School Accountability: monetary awards/penalties, school accreditation, school performance reporting, high school skills guarantee, school improvement plans, etc. Staff Accountability: staff awards/recognition, salary increases, staff dismissal, staff evaluation or certification, staff monetary penalties, etc.
PENNSYLVANIA ♦ 2009 PROFILE OF STATE ASSESSMENT PROGRAMS 2 of 8
Pennsylvania Reading/Language Arts
Composition of the Main Reading/Language Arts Test in 2008–09 Multiple Choice Short Constructed Response Extended Constructed Response Performance Tasks Other
Number of Items
Proportion of Score
Number of Items
Proportion of Score
Number of Items
Proportion of Score
Number of Items
Proportion of Score
Number of Items
Proportion of Score
Grade 4 48 80% 0 — 4 20% 0 — 0 —
Grade 8 48 80% 0 — 4 20% 0 — 0 —
Administration of the Main Reading/Language Arts Test in 2008–09 Were any of the 2008–09 assessments used for AYP reporting for grades 4 or 8 administered in the fall of 2008?
No.
Performance Levels and AYP Performance levels used during the 2008–09 year Below Basic, Basic, Proficient, and Advanced Test used for AYP determination PSSA and PASA Performance level used for AYP Proficient
Other tests used for AYP determination — Test used for state accountability PSSA and PASA Performance level used for state accountability Proficient First implementation of performance standards for the 2008–09 assessments Grade 4: June 2006, Grade 8: June 2005 Additional information about performance levels used during the 2008–09 academic year —
PENNSYLVANIA ♦ 2009 PROFILE OF STATE ASSESSMENT PROGRAMS 3 of 8
Pennsylvania Reading/Language Arts
Performance Level Descriptors for Meeting Adequate Yearly Progress
Grade 4: A student scoring at the proficient level routinely utilizes a variety of reading strategies to comprehend and interpret grade-level appropriate fiction and nonfiction: identifies word meanings, including synonyms and antonyms, using context clues and word parts; makes inferences and draws conclusions, using textual support; identifies stated and implied main ideas and relevant details; summarizes text; makes within and among text-to-text connections; identifies purpose of text (narrative, informational, poetic); identifies literary elements (character, setting, plot); identifies figurative language (personification, simile, alliteration); identifies fact and opinion and the use of exaggeration (bias) in nonfiction; identifies organizational patterns of text (e.g., sequencing, comparison/contrast) and the proper sequence of steps in a list of directions; interprets graphics, charts, and headings. Performance level descriptors are available online at: http://www.portal.state.pa.us/portal/server.pt?open=18&objID=354681&mode=2
Grade 8: A student scoring at the proficient level routinely utilizes a variety of reading strategies to comprehend and interpret grade-level appropriate fiction and nonfiction: applies a variety of strategies to determine meanings of words, including synonyms and antonyms, using context clues and word parts; makes inferences, draws conclusions, and generalizes, using textual support; identifies or explains stated and implied main ideas; summarizes text; makes within and among text-to-text connections; interprets and analyzes: purpose of text (e.g., narrative, informational); organizational patterns (e.g., sequencing, comparison/contrast); and relationships among literary elements (character, setting, plot, theme); identifies and explains the effect of figurative language (e.g., simile, metaphor) and point of view; interprets and analyzes the use of facts and opinions in nonfiction; identifies and analyzes bias and propaganda in nonfiction; describes and analyzes the sequence of steps in a list of directions; interprets and analyzes graphics and charts. Performance level descriptors are available online at: http://www.portal.state.pa.us/portal/server.pt?open=18&objID=354685&mode=2
Performance Level Descriptors of AIternate Assessment for Meeting Adequate Yearly Progress
Grade 4: Students are assigned to one of three levels varying in complexity: Level A contains the least complex skills; Level B, intermediate skills; and Level C, the most complex skills. A student in grade 3 or 4 performing at the Proficient level on the Level A PASA independently orients to the task objects or pictures. The student may receive some support such as verbal prompting that does not reduce the cognitive complexity of the skill. The student demonstrates understanding of the vocabulary necessary to complete the task. A student in grade 3 or 4 performing at the Proficient level on the Level B PASA may need minimal support to discriminate when distracters are compelling. The student may receive some support such as verbal prompting and redirection that does not reduce the cognitive complexity of the skills. The student demonstrates an understanding of the vocabulary, including word endings, necessary to complete the task. A student in grade 3 or 4 performing at the Proficient level on the Level C PASA may request clarification of the question. The student completes multi-step tasks and use strategies such as: self-correction, referring back to text, and mentally eliminating distracters. The student answers questions quickly and accurately, often using complete sentences. The student reads and recalls proper names and non-phonetic words. The student demonstrates understanding of the vocabulary necessary to complete the task. Performance level descriptors are available online at: http://www.pasaassessment.org/AboutTeachingStandard.jsp
Grade 8: Students are assigned to one of three levels varying in complexity: Level A contains the least complex skills; Level B, intermediate skills; and Level C, the most complex skills. A student in grade 7 or 8 performing at the Proficient level on the Level A PASA independently orients to the task objects or pictures. The student may receive some support such as verbal prompting that does not reduce the cognitive complexity of the skill. The student demonstrates understanding of the vocabulary necessary to complete the task. A student in grade 7 or 8 performing at the Proficient level on the Level B PASA may receive some support such as verbal prompting and redirection that does not reduce the cognitive complexity of the skills. The student may self correct. The student demonstrates an understanding of the vocabulary, including word endings, necessary to complete the task. A student in grade 7 or 8 performing at the Proficient level on the Level C PASA may request clarification of the question. The student completes multi-step tasks and use strategies such as: self-correction, referring back to text, and mentally eliminating distracters and requesting clarification. Students are able to answer questions quickly and accurately, often using complete sentences. Students are able to read and recall proper names and non- phonetic words. The student demonstrates understanding of the vocabulary necessary to complete the task. Performance level descriptors are available online at: http://www.pasaassessment.org/AboutTeachingStandard.jsp
PENNSYLVANIA ♦ 2009 PROFILE OF STATE ASSESSMENT PROGRAMS 4 of 8
Pennsylvania Reading/Language Arts
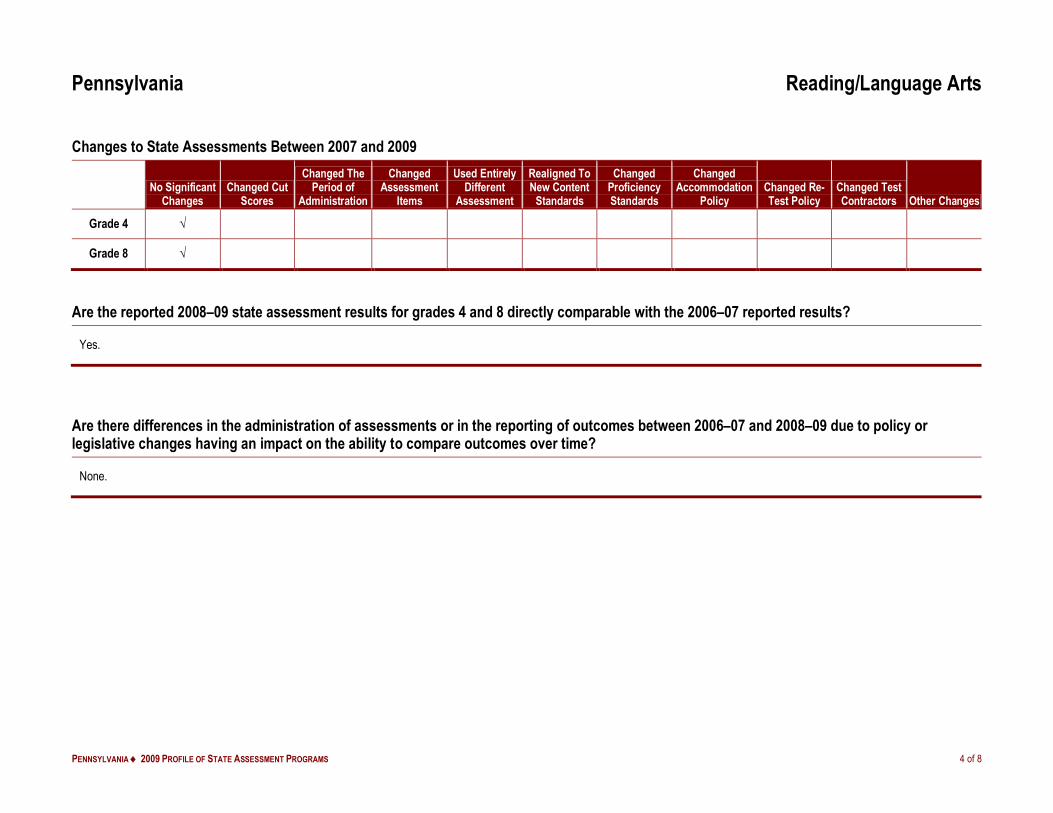
Changes to State Assessments Between 2007 and 2009
No Significant Changes
Changed Cut Scores
Changed The Period of
Administration
Changed Assessment
Items
Used Entirely Different
Assessment
Realigned To New Content
Standards
Changed Proficiency Standards
Changed Accommodation
Policy Changed Re-Test Policy
Changed Test Contractors Other Changes
Grade 4 √
Grade 8 √
Are the reported 2008–09 state assessment results for grades 4 and 8 directly comparable with the 2006–07 reported results?
Yes.
Are there differences in the administration of assessments or in the reporting of outcomes between 2006–07 and 2008–09 due to policy or legislative changes having an impact on the ability to compare outcomes over time?
None.

PENNSYLVANIA ♦ 2009 PROFILE OF STATE ASSESSMENT PROGRAMS 5 of 8
Pennsylvania Mathematics
Composition of the Main Mathematics Test in 2008–09 Multiple Choice Short Constructed Response Extended Constructed Response Performance Tasks Other
Number of Items
Proportion of Score
Number of Items
Proportion of Score
Number of Items
Proportion of Score
Number of Items
Proportion of Score
Number of Items
Proportion of Score
Grade 4 60 83% 0 — 3 17% 0 — 0 —
Grade 8 60 83% 0 — 3 17% 0 — 0 —
Administration of the Main Mathematics Test in 2008–09 Were any of the 2008–09 assessments used for AYP reporting for grades 4 or 8 administered in the fall of 2008?
No.
Performance Levels and AYP Performance levels used during the 2008–09 year Below Basic, Basic, Proficient, and Advanced Test used for AYP determination PSSA and PASA Performance level used for AYP Proficient
Other tests used for AYP determination — Test used for state accountability PSSA and PASA Performance level used for state accountability Proficient First implementation of performance standards for the 2008–09 assessments Grade 4: June 2006; Grade 8: June 2005 Additional information about performance levels used during the 2008–09 academic year —
PENNSYLVANIA ♦ 2009 PROFILE OF STATE ASSESSMENT PROGRAMS 6 of 8
Pennsylvania Mathematics
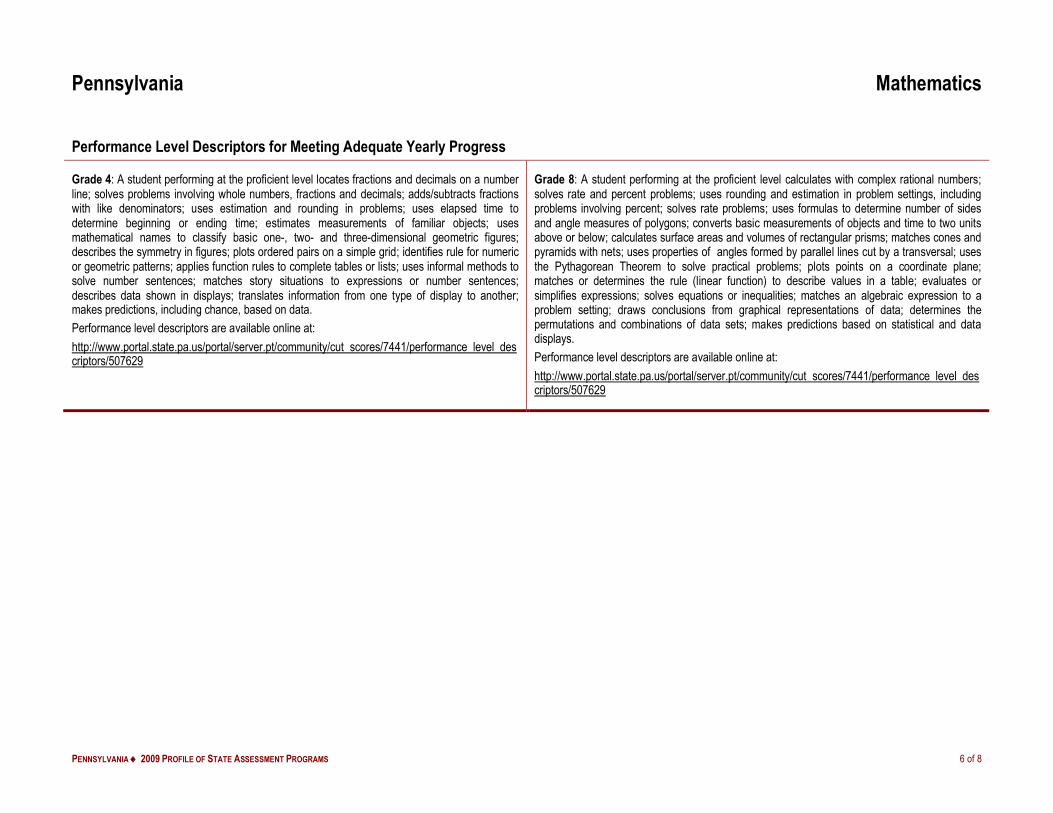
Performance Level Descriptors for Meeting Adequate Yearly Progress
Grade 4: A student performing at the proficient level locates fractions and decimals on a number line; solves problems involving whole numbers, fractions and decimals; adds/subtracts fractions with like denominators; uses estimation and rounding in problems; uses elapsed time to determine beginning or ending time; estimates measurements of familiar objects; uses mathematical names to classify basic one-, two- and three-dimensional geometric figures; describes the symmetry in figures; plots ordered pairs on a simple grid; identifies rule for numeric or geometric patterns; applies function rules to complete tables or lists; uses informal methods to solve number sentences; matches story situations to expressions or number sentences; describes data shown in displays; translates information from one type of display to another; makes predictions, including chance, based on data. Performance level descriptors are available online at: http://www.portal.state.pa.us/portal/server.pt/community/cut scores/7441/performance level descriptors/507629
Grade 8: A student performing at the proficient level calculates with complex rational numbers; solves rate and percent problems; uses rounding and estimation in problem settings, including problems involving percent; solves rate problems; uses formulas to determine number of sides and angle measures of polygons; converts basic measurements of objects and time to two units above or below; calculates surface areas and volumes of rectangular prisms; matches cones and pyramids with nets; uses properties of angles formed by parallel lines cut by a transversal; uses the Pythagorean Theorem to solve practical problems; plots points on a coordinate plane; matches or determines the rule (linear function) to describe values in a table; evaluates or simplifies expressions; solves equations or inequalities; matches an algebraic expression to a problem setting; draws conclusions from graphical representations of data; determines the permutations and combinations of data sets; makes predictions based on statistical and data displays. Performance level descriptors are available online at: http://www.portal.state.pa.us/portal/server.pt/community/cut scores/7441/performance level descriptors/507629
PENNSYLVANIA ♦ 2009 PROFILE OF STATE ASSESSMENT PROGRAMS 7 of 8
Pennsylvania Mathematics
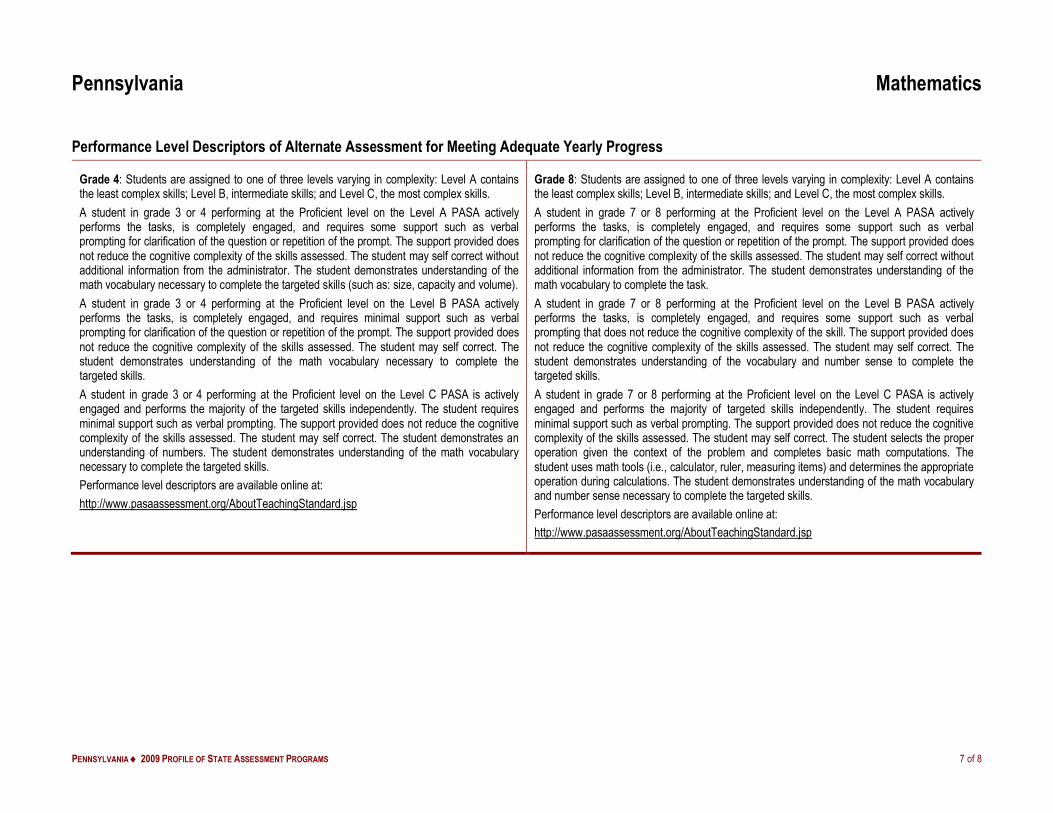
Performance Level Descriptors of AIternate Assessment for Meeting Adequate Yearly Progress
Grade 4: Students are assigned to one of three levels varying in complexity: Level A contains the least complex skills; Level B, intermediate skills; and Level C, the most complex skills. A student in grade 3 or 4 performing at the Proficient level on the Level A PASA actively performs the tasks, is completely engaged, and requires some support such as verbal prompting for clarification of the question or repetition of the prompt. The support provided does not reduce the cognitive complexity of the skills assessed. The student may self correct without additional information from the administrator. The student demonstrates understanding of the math vocabulary necessary to complete the targeted skills (such as: size, capacity and volume). A student in grade 3 or 4 performing at the Proficient level on the Level B PASA actively performs the tasks, is completely engaged, and requires minimal support such as verbal prompting for clarification of the question or repetition of the prompt. The support provided does not reduce the cognitive complexity of the skills assessed. The student may self correct. The student demonstrates understanding of the math vocabulary necessary to complete the targeted skills. A student in grade 3 or 4 performing at the Proficient level on the Level C PASA is actively engaged and performs the majority of the targeted skills independently. The student requires minimal support such as verbal prompting. The support provided does not reduce the cognitive complexity of the skills assessed. The student may self correct. The student demonstrates an understanding of numbers. The student demonstrates understanding of the math vocabulary necessary to complete the targeted skills. Performance level descriptors are available online at: http://www.pasaassessment.org/AboutTeachingStandard.jsp
Grade 8: Students are assigned to one of three levels varying in complexity: Level A contains the least complex skills; Level B, intermediate skills; and Level C, the most complex skills. A student in grade 7 or 8 performing at the Proficient level on the Level A PASA actively performs the tasks, is completely engaged, and requires some support such as verbal prompting for clarification of the question or repetition of the prompt. The support provided does not reduce the cognitive complexity of the skills assessed. The student may self correct without additional information from the administrator. The student demonstrates understanding of the math vocabulary to complete the task. A student in grade 7 or 8 performing at the Proficient level on the Level B PASA actively performs the tasks, is completely engaged, and requires some support such as verbal prompting that does not reduce the cognitive complexity of the skill. The support provided does not reduce the cognitive complexity of the skills assessed. The student may self correct. The student demonstrates understanding of the vocabulary and number sense to complete the targeted skills. A student in grade 7 or 8 performing at the Proficient level on the Level C PASA is actively engaged and performs the majority of targeted skills independently. The student requires minimal support such as verbal prompting. The support provided does not reduce the cognitive complexity of the skills assessed. The student may self correct. The student selects the proper operation given the context of the problem and completes basic math computations. The student uses math tools (i.e., calculator, ruler, measuring items) and determines the appropriate operation during calculations. The student demonstrates understanding of the math vocabulary and number sense necessary to complete the targeted skills. Performance level descriptors are available online at: http://www.pasaassessment.org/AboutTeachingStandard.jsp
PENNSYLVANIA ♦ 2009 PROFILE OF STATE ASSESSMENT PROGRAMS 8 of 8
Pennsylvania Mathematics
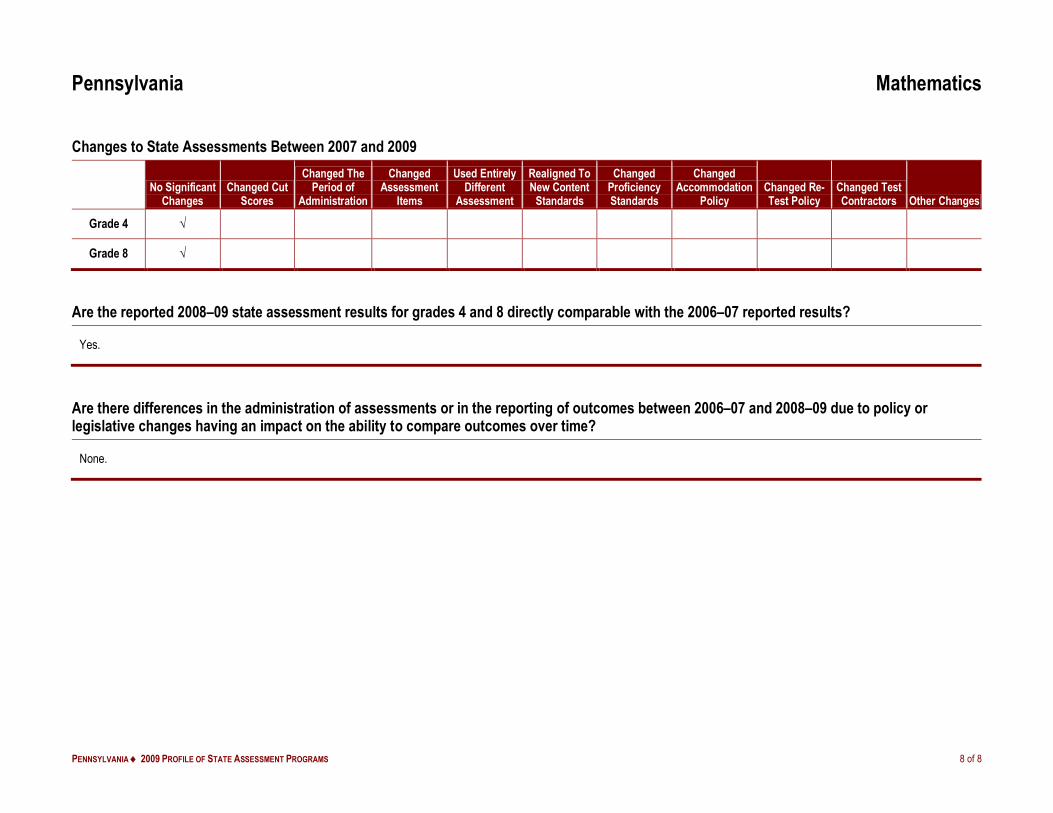
Changes to State Assessments Between 2007 and 2009
No Significant Changes
Changed Cut Scores
Changed The Period of
Administration
Changed Assessment
Items
Used Entirely Different
Assessment
Realigned To New Content
Standards
Changed Proficiency Standards
Changed Accommodation
Policy Changed Re-Test Policy
Changed Test Contractors Other Changes
Grade 4 √
Grade 8 √
Are the reported 2008–09 state assessment results for grades 4 and 8 directly comparable with the 2006–07 reported results?
Yes.
Are there differences in the administration of assessments or in the reporting of outcomes between 2006–07 and 2008–09 due to policy or legislative changes having an impact on the ability to compare outcomes over time?
None.