2009 financial results analyst conference … · 04 questions & answers carlos ghosn, ... 510...
TRANSCRIPT
FEBRUARY 11, 20102009 FINANCIAL RESULTS
2009 FINANCIAL RESULTSANALYST CONFERENCE

2FEBRUARY 11, 20102009 FINANCIAL RESULTS
01 2009 OPERATIONS UPDATEPATRICK PÉLATA, COO
02 2009 FINANCIAL RESULTSTHIERRY MOULONGUET, CFO
03 OUTLOOK 2010CARLOS GHOSN, CHAIRMAN & CEO
04 QUESTIONS & ANSWERSCARLOS GHOSN, PATRICK PÉLATA, THIERRY MOULONGUET
AGENDA
3FEBRUARY 11, 20102009 FINANCIAL RESULTS
2009 OPERATIONS UPDATEPATRICK PÉLATA, COO
01

4FEBRUARY 11, 20102009 FINANCIAL RESULTS
! Decrease G&A and overheads
+ € 2.1bnPOSITIVE FREE CASH FLOW
! Reduce inventories and reorganize the distribution system
! Adapt our production level
! Cut investments
! Cash in customer receivables
! Carry out real estate divestments
2009 ACTION PLAN ACHIEVED
! Increase market share
Optimization of WCR
! Reduce R&D expenses
Free Cash Flow management
Maximization of revenue sources
5FEBRUARY 11, 20102009 FINANCIAL RESULTS
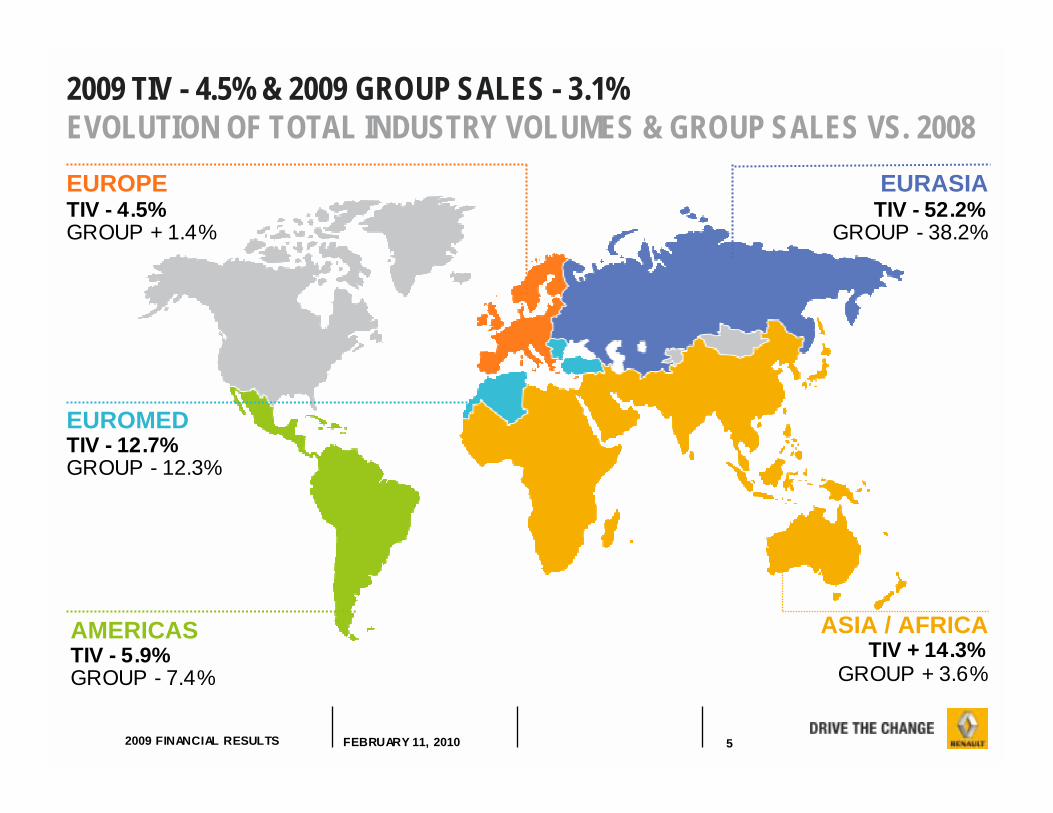
2009 TIV - 4.5% & 2009 GROUP SALES - 3.1%EVOLUTION OF TOTAL INDUSTRY VOLUMES & GROUP SALES VS. 2008
EURASIATIV - 52.2%
EUROPETIV - 4.5%
EUROMEDTIV - 12.7%
AMERICASTIV - 5.9%
ASIA / AFRICATIV + 14.3%
GROUP - 38.2%GROUP + 1.4%
GROUP - 12.3%
GROUP - 7.4% GROUP + 3.6%

6FEBRUARY 11, 20102009 FINANCIAL RESULTS
MARKET SHARE PC+LCV2009
VOLUMES2009
IN 2009, RENAULT GROUP GAINED MARKET SHAREIN 11 OF ITS TOP 15 MARKETS
EVOLUTION OF MARKET SHAREH2’09 vs. H2’0809 vs. 08
26.0%701,998France
6.0%240,049Germany
9.3%133,630
Italy 5.3%124,258
South Korea
3.9%117,524
Spain 10.9%115,217
Brazil
14.8%82,261Turkey
3.4%73,465
Belgium/Luxembourg
5.0%72,284Russia
23.9%56,094
Roumania
11.1%64,805
Argentina 12.4%61,019
Algeria
35.9%51,787
United Kingdom
33.7%37,106Morocco
2.8%37,190Iran
+ 0.6
+ 1.0
+ 0.8
+ 0.4
- 0.4
+ 0.6
- 1.1
+ 1.3
+ 6.3
+ 0.9
+ 0.3
+ 1.6
- 2.0
+ 5.5
- 0.1
+ 2.3
+ 1.4
+ 1.1
+ 1.5
- 0.1
+ 0.9
+ 1.6
+ 8.1
+ 1.0
+ 1.1
+ 0.6
- 2.6
+ 5.8
+ 0.4
+ 0.2

7FEBRUARY 11, 20102009 FINANCIAL RESULTS
8.6%
8.0%
8.3%
9.0%
7.0%
7.5%
8.0%
8.5%
9.0%
2006 2007 2008 2009
ZOOM ON EUROPE PC MARKET SHARESTRONG MOMENTUM VS. 2008
GROUP PC MS IN EUROPE2009 VS. 2008
GROUP PC MS IN EUROPE 2006-2009
-0.2pt0.1pt
0.9pt
2.1pt
-0.5pt
0.0pt
0.5pt
1.0pt
1.5pt
2.0pt
2.5pt
Q1 Q2 Q3 Q4

8FEBRUARY 11, 20102009 FINANCIAL RESULTS
IMPACTED BY SCRAPPING INCENTIVES
NO IMPACT OF SCRAPPING INCENTIVES
NEW MODEL DYNAMIC
EUROPEAN TIV & GROUP SALES BY SEGMENTEVOLUTION OF TOTAL INDUSTRY VOLUMES & GROUP SALES vs. 2008
29%
8%
-6%
-14%
-30%
34%
12%15%
-31%
-24%
-4.5%1.4%
A B C OTHERS LCV PC+LCV
TIV EUROPERENAULT GROUP
9FEBRUARY 11, 20102009 FINANCIAL RESULTS
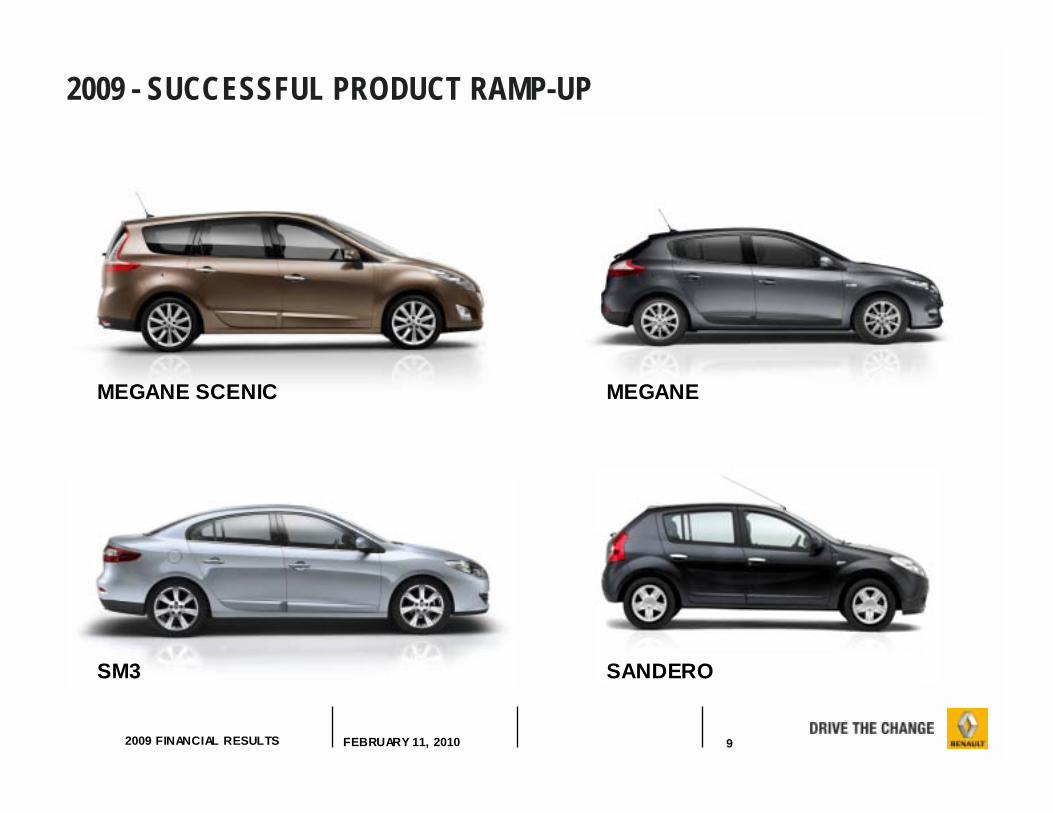
2009 - SUCCESSFUL PRODUCT RAMP-UP
MEGANE SCENIC
SM3
MEGANE
SANDERO

10FEBRUARY 11, 20102009 FINANCIAL RESULTS
POSITIVE WCR VARIATION IN 2009CONTRIBUTION TO AUTOMOBILE WCR IMPROVEMENT
ACCOUNTSPAYABLES
+ 486
INVENTORY REDUCTION
+ 1,372
ACCOUNTSRECEIVABLES
+ 640 OTHERS+ 425
TOTAL+ 2,923
H2
H1
million euros
11FEBRUARY 11, 20102009 FINANCIAL RESULTS
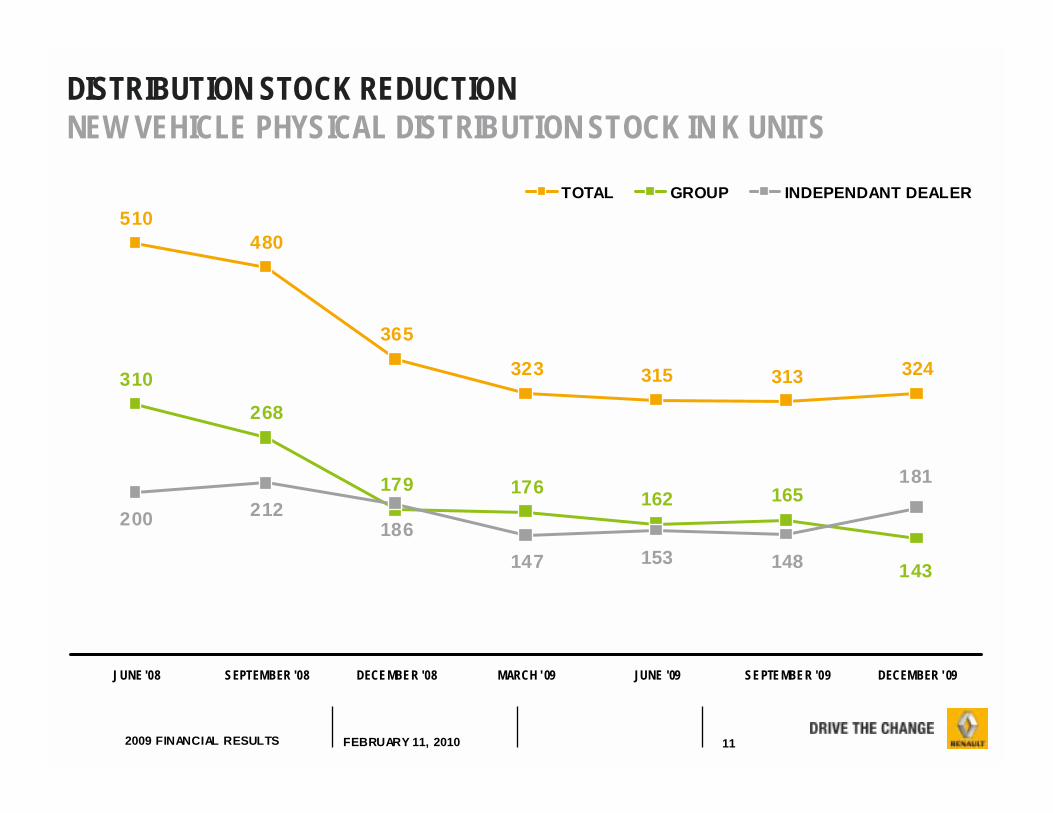
DISTRIBUTION STOCK REDUCTIONNEW VEHICLE PHYSICAL DISTRIBUTION STOCK IN K UNITS
510480
365
323 315 313 324310
268
179 176 162 165200 212
186147 153 148 143
181
JUNE '08 SEPTEMBER '08 DECEMBER '08 MARCH '09 JUNE '09 SEPTEMBER '09 DECEMBER ' 09
TOTAL GROUP INDEPENDANT DEALER
12FEBRUARY 11, 20102009 FINANCIAL RESULTS
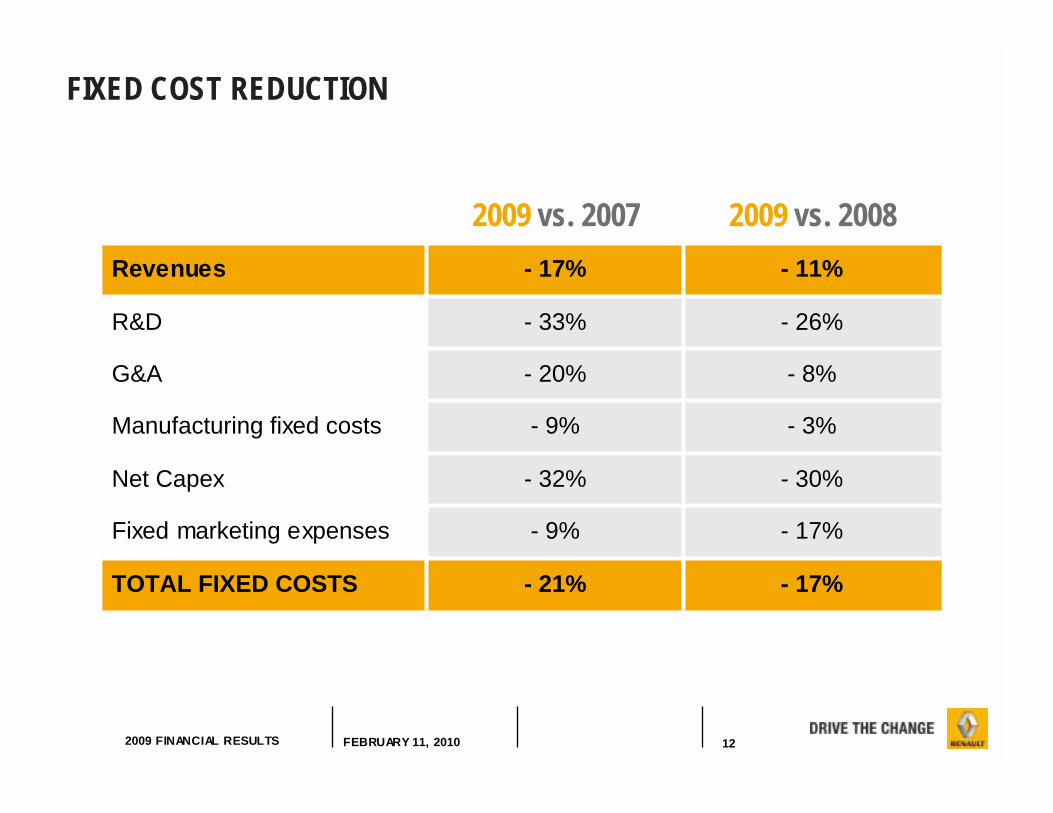
FIXED COST REDUCTION
- 17%
- 17%
- 30%
- 3%
- 8%
- 26%
- 11%
2009 vs. 2008
- 21%TOTAL FIXED COSTS
- 9%Fixed marketing expenses
- 32%Net Capex
- 9%Manufacturing fixed costs
- 20%G&A
- 33%R&D
- 17%Revenues
2009 vs. 2007
13FEBRUARY 11, 20102009 FINANCIAL RESULTS
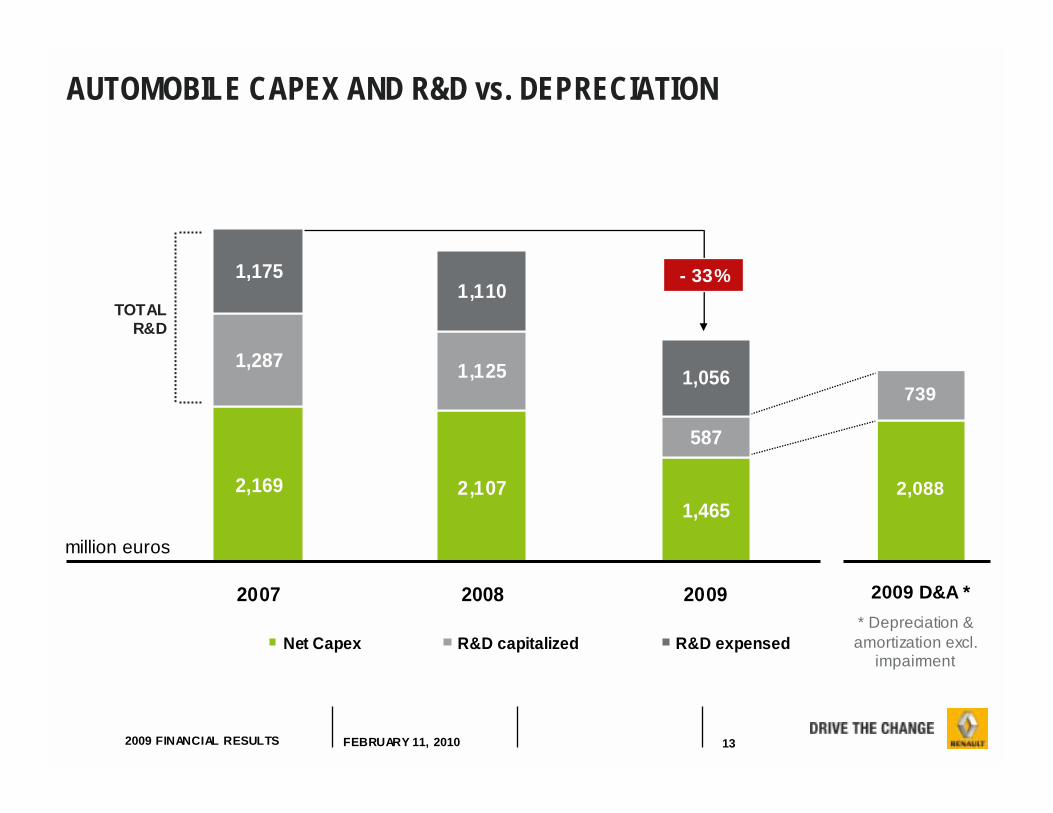
* Depreciation & amortization excl.
impairment
739
2,088
2009 D&A *
587
2,169 2,1071,465
1,287 1,125
1,1751,110
1,056
2007 2008 2009
Net Capex R&D capitalized R&D expensed
AUTOMOBILE CAPEX AND R&D vs. DEPRECIATION
- 33%
TOTALR&D
million euros
14FEBRUARY 11, 20102009 FINANCIAL RESULTS
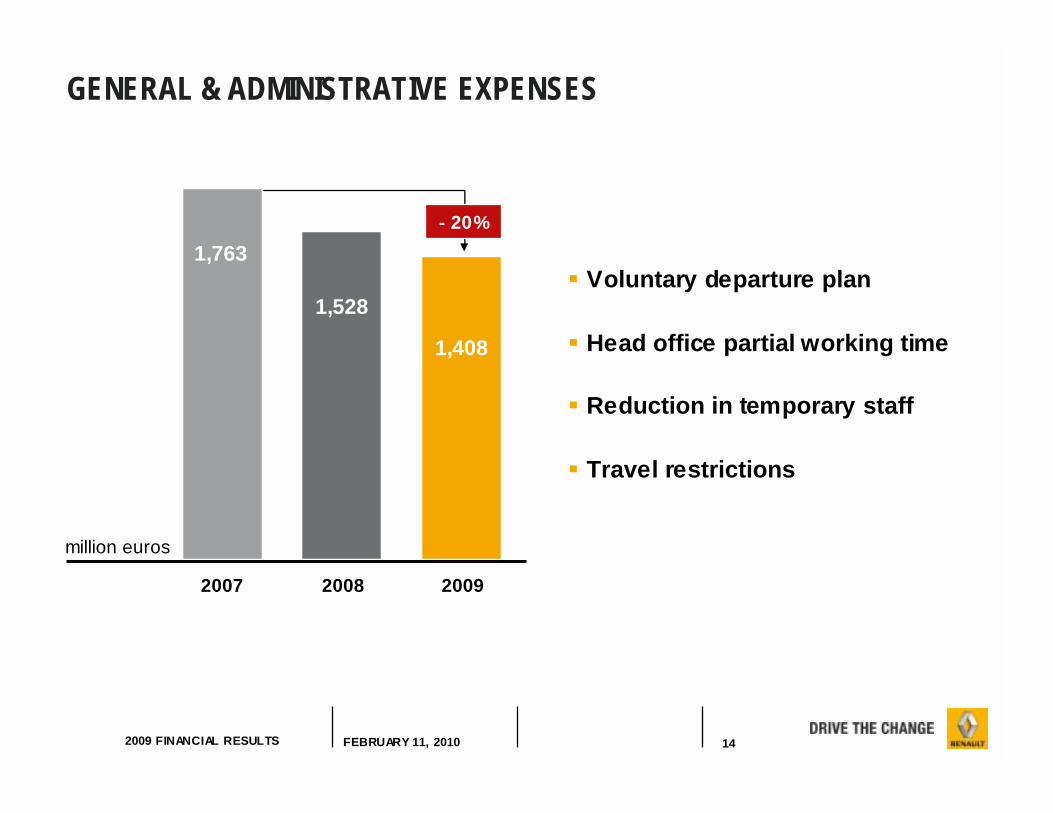
- 20%
GENERAL & ADMINISTRATIVE EXPENSES
! Voluntary departure plan
! Head office partial working time
! Reduction in temporary staff
! Travel restrictions
million euros
1,763
1,528
1,408
2007 2008 2009

15FEBRUARY 11, 20102009 FINANCIAL RESULTS
WHAT WAS BETTER / WORSE THAN EXPECTED IN 2009?
! TIV
! MANAGEMENT OF WCR
! FIXED COSTS REDUCTION
! RCI FINANCIAL PERFORMANCE
! CAR SHORTAGE IN H1 DUE TODE-STOCKING EARLIER THAN COMPETITION
! MODEL MIX IN EUROPE(UPPER SEGMENT & LCV TIV)
! MARKET TRANSACTION PRICES
16FEBRUARY 11, 20102009 FINANCIAL RESULTS
2009 FINANCIAL RESULTSTHIERRY MOULONGUET, CFO
02

17FEBRUARY 11, 20102009 FINANCIAL RESULTS
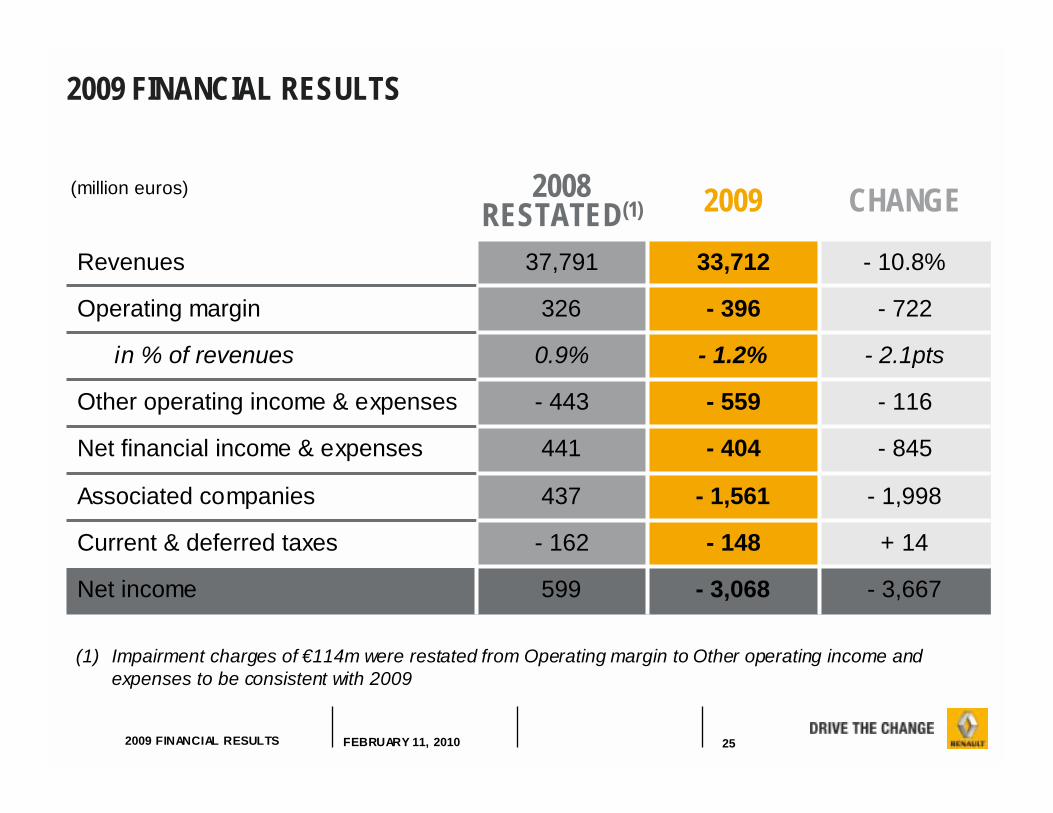
2009 FINANCIAL RESULTS
+ 14- 148- 162Current & deferred taxes
- 3,068
- 1,561
- 404
- 559
- 1.2%
- 396
33,712
2009
- 3,667
- 1,998
- 845
- 116
- 2.1pts
- 722
- 10.8%
CHANGE
599Net income
437Associated companies
441Net financial income & expenses
- 443Other operating income & expenses
0.9%in % of revenues
326Operating margin
37,791Revenues
2008RESTATED(1)
(1) Impairment charges of €114m were restated from Operating margin to Other operating income and expenses to be consistent with 2009.
million euros
18FEBRUARY 11, 20102009 FINANCIAL RESULTS
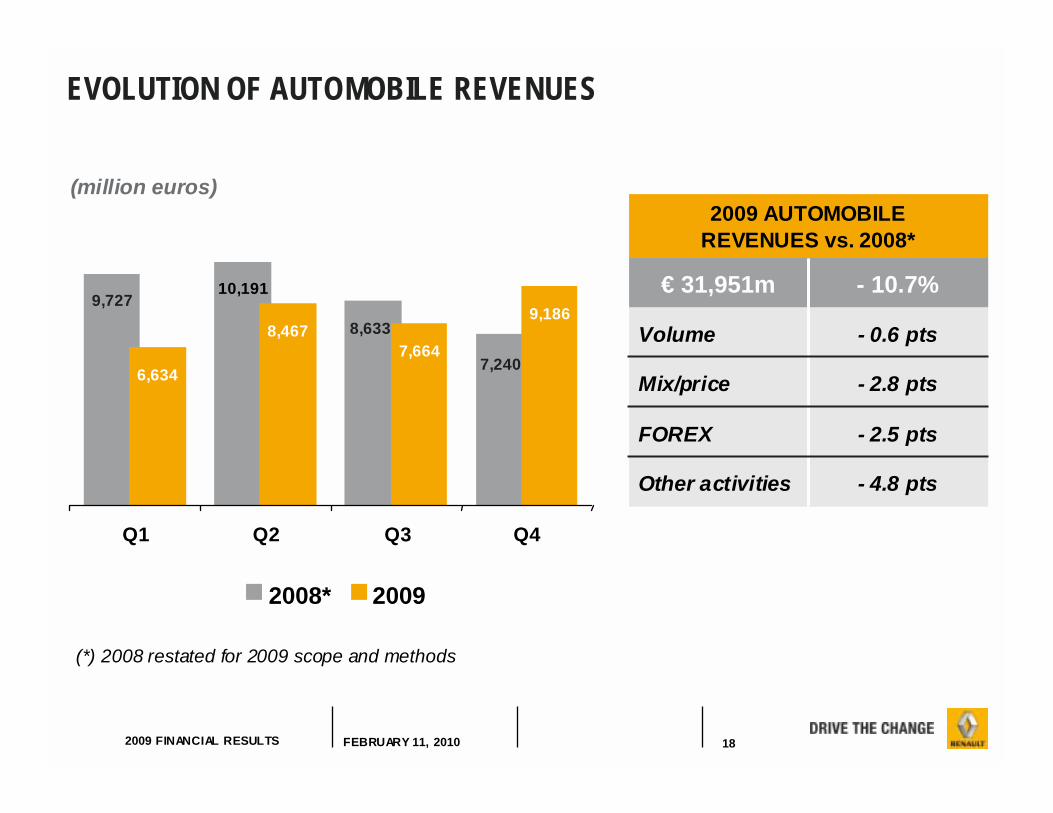
EVOLUTION OF AUTOMOBILE REVENUES
- 2.8 ptsMix/price
- 0.6 ptsVolume
- 2.5 ptsFOREX
- 4.8 pts
- 10.7%
Other activities
€ 31,951m
2009 AUTOMOBILEREVENUES vs. 2008*
(*) 2008 restated for 2009 scope and methods
(million euros)
7,240
8,633
9,7279,186
7,6648,467
6,634
Q1 Q2 Q3 Q4
2008* 2009
10,191

19FEBRUARY 11, 20102009 FINANCIAL RESULTS
326
-396-116+48 -206+105+126
+253-282
-293
-464
+80
+28
Currency
Volume
Mix / Price Enrichment
WarrantyPurchasing
Raw materials
Manufact.& Logistics
R&D
G&A
RCI
OthersIncl. licenses
CHANGE 2009 / 2008(1) : - €722m
2008(1)
2009
GROUP OPERATING MARGIN VARIANCE ANALYSIS
(million euros)
(1) Impairment charges of €114m were restated from Operating margin to Other operating income and expenses to be consistent with 2009

20FEBRUARY 11, 20102009 FINANCIAL RESULTS
A ROBUST PERFORMANCE FOR RCI BANQUE
in % of average loans outstanding
2.41%
- 1.77%
- 0.99%
5.17%
20,191
2009
2.13%Pretax income
- 1.59%Operating expenses
- 0.87%Cost of risk
4.58%Net banking income
22,701Average loans outstanding (million euros)
2008

21FEBRUARY 11, 20102009 FINANCIAL RESULTS
OTHER OPERATING INCOME & EXPENSES
(million euros)
- 2810Others
- 559
102
- 297
- 118
- 218
2009
- 443TOTAL
150Profit / loss on asset sales
- 114Impairment of capitalized assets*
Partial sale of Renault F1
- 489Restructuring charges
2008*
(*) Change in scope in 2009 for impairment of capitalized assets due to their non-recurring nature or amount. These charges were previously classed in operating margin. FY 2008 accounts have been restated accordingly (114m).

22FEBRUARY 11, 20102009 FINANCIAL RESULTS
2009 FINANCIAL RESULTS
- 361
- 404
- 559
- 1.2%
- 396
33,712
2009
- 293
- 845
- 116
- 2.1pts
- 722
- 10.8%
CHANGE
- 68excluding fair value adjustment
441Net financial income & expenses
- 443Other operating income & expenses
0.9%in % of revenues
326Operating margin
37,791Revenues
2008RESTATED(1)
(1) Impairment charges of €114m were restated from Operating margin to Other operating income and expenses to be consistent with 2009
(million euros)

23FEBRUARY 11, 20102009 FINANCIAL RESULTS
ASSOCIATED COMPANIES
(*) AvtoVaz is consolidated with a 3-month time lag.
23
7
- 188
- 105
309
H2’09
- 1,561
12
- 370
- 301
- 902
CY’09
- 1,584TOTAL
5Others
- 182AvtoVaz*
- 196Volvo
- 1,211Nissan
H1’09
Q3 Q4134 175
(million euros)

24FEBRUARY 11, 20102009 FINANCIAL RESULTS
2009 FINANCIAL RESULTS
(1) Impairment charges of €114m were restated from Operating margin to Other operating income and expenses to be consistent with 2009
+ 14- 148- 162Current & deferred taxes
- 3,068
- 1,561
- 404
- 559
- 1.2%
- 396
33,712
2009
- 3,667
- 1,998
- 845
- 116
- 2.1pts
- 722
- 10.8%
CHANGE
599Net income
437Associated companies
441Net financial income & expenses
- 443Other operating income & expenses
0.9%in % of revenues
326Operating margin
37,791Revenues
2008RESTATED(1)
(million euros)
25FEBRUARY 11, 20102009 FINANCIAL RESULTS
2009 FINANCIAL RESULTS
(1) Impairment charges of €114m were restated from Operating margin to Other operating income and expenses to be consistent with 2009
+ 14- 148- 162Current & deferred taxes
- 3,068
- 1,561
- 404
- 559
- 1.2%
- 396
33,712
2009
- 3,667
- 1,998
- 845
- 116
- 2.1pts
- 722
- 10.8%
CHANGE
599Net income
437Associated companies
441Net financial income & expenses
- 443Other operating income & expenses
0.9%in % of revenues
326Operating margin
37,791Revenues
2008RESTATED(1)
(million euros)

26FEBRUARY 11, 20102009 FINANCIAL RESULTS
2009 FINANCIAL RESULTS
- 147- 1Current & deferred taxes
- 223- 181Net financial income & expenses
- 233- 326Other operating income & expenses
- 356
23
1.3%
224
17,721
H2’09
- 2,712Net income
- 1,584Associated companies
-3.9%in % of revenues
-620Operating margin
15,991Revenues
H1’09(million euros)

27FEBRUARY 11, 20102009 FINANCIAL RESULTS
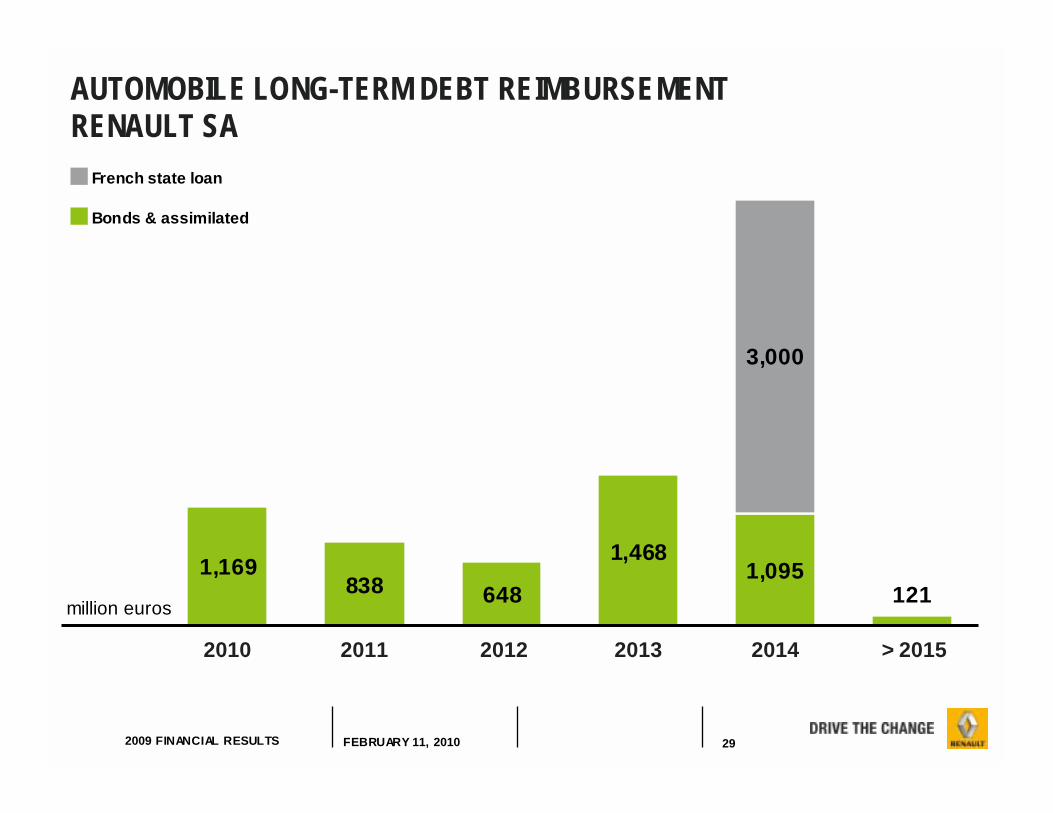
CHANGE IN AUTOMOBILE NET FINANCIAL DEBT
FREE CASH FLOW
+ 1,467Cash Flow
+ 2,923ChangeIn WCR
2,088
- 102Financial
investments
+ 37Others
- 2,302Net tangible &
intangible invest
2,023Decrease in net debt
+ 81Dividends receivedfrom associates
- 248 Leased vehicles
- 589Capitalized R&D
Dec 31st 2008: € 7,944mDec 31st 2009: € 5,921m(million euros)

28FEBRUARY 11, 20102009 FINANCIAL RESULTS
LIQUIDITY RESERVESCash = € 5.4 BnCredit lines = € 4.1 Bn(of which drawn zero)
TOTAL = € 9.5 Bn
LIQUIDITY RESERVESCash = € 1.1 BnCredit lines = € 4.2 Bn(of which drawn = € 0.5 Bn)
TOTAL = € 4.8 Bn
AUTOMOBILE DIVISION LIQUIDITY RESERVE
END 2008 END 2009
29FEBRUARY 11, 20102009 FINANCIAL RESULTS
838 648 1211,169 1,468
1,095
3,000
French state loan
Bonds & assimilated
million euros
2010 2011 2012 2013 2014 > 2015
AUTOMOBILE LONG-TERM DEBT REIMBURSEMENT RENAULT SA

30FEBRUARY 11, 20102009 FINANCIAL RESULTS
OUTLOOK 2010CARLOS GHOSN, CHAIRMAN & CEO
03

31FEBRUARY 11, 20102009 FINANCIAL RESULTS
2010 OUTLOOK: TIV EVOLUTION EVOLUTION OF TOTAL INDUSTRY VOLUMES VS. 2009
EURASIA+ 10%
EUROPE- 10%
EUROMED- 10%
AMERICASSTABLE
ASIA / AFRICASTABLE
GLOBAL(Incl. USA & Canada)
+3%

32FEBRUARY 11, 20102009 FINANCIAL RESULTS
2010 OUTLOOK: RENAULT
LEVERS:
1. Gaining market share in a declining TIV in Europe
2. Extracting additional Alliance synergies
3. Taking cost savings further
4. Sustaining a high level of WCR efficiency
POSITIVE FCF IN 2010
33FEBRUARY 11, 20102009 FINANCIAL RESULTS
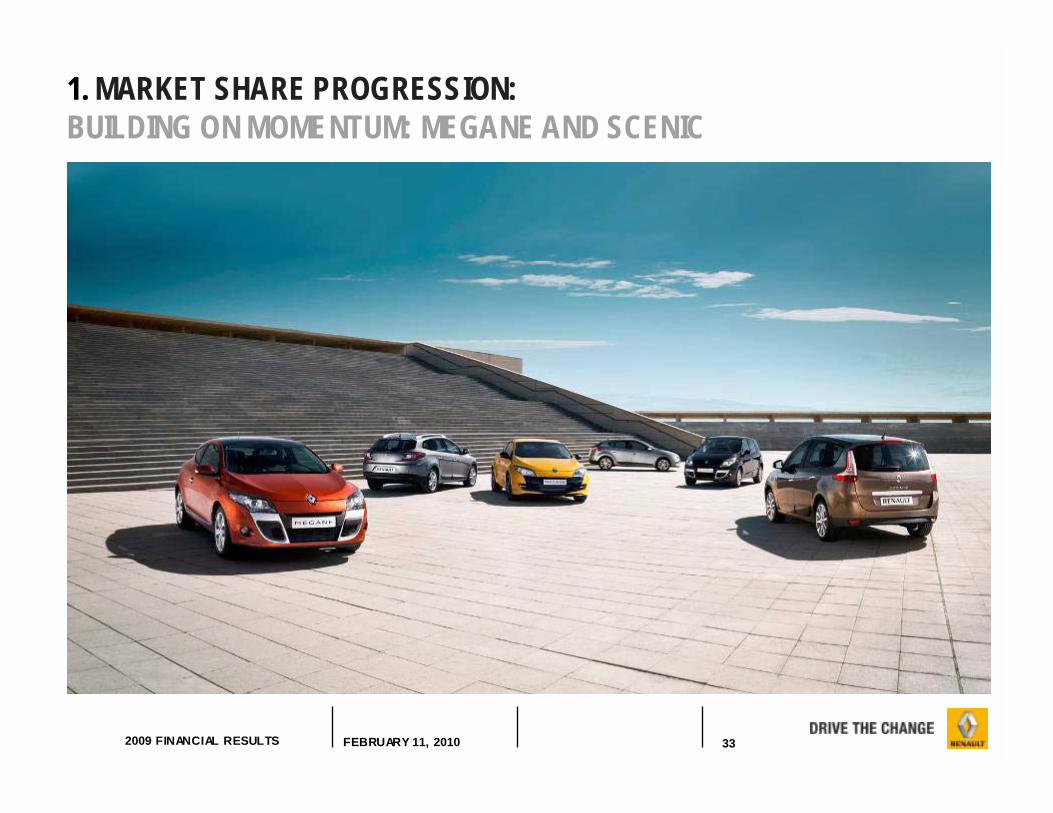
1. MARKET SHARE PROGRESSION:BUILDING ON MOMENTUM: MEGANE AND SCENIC
34FEBRUARY 11, 20102009 FINANCIAL RESULTS
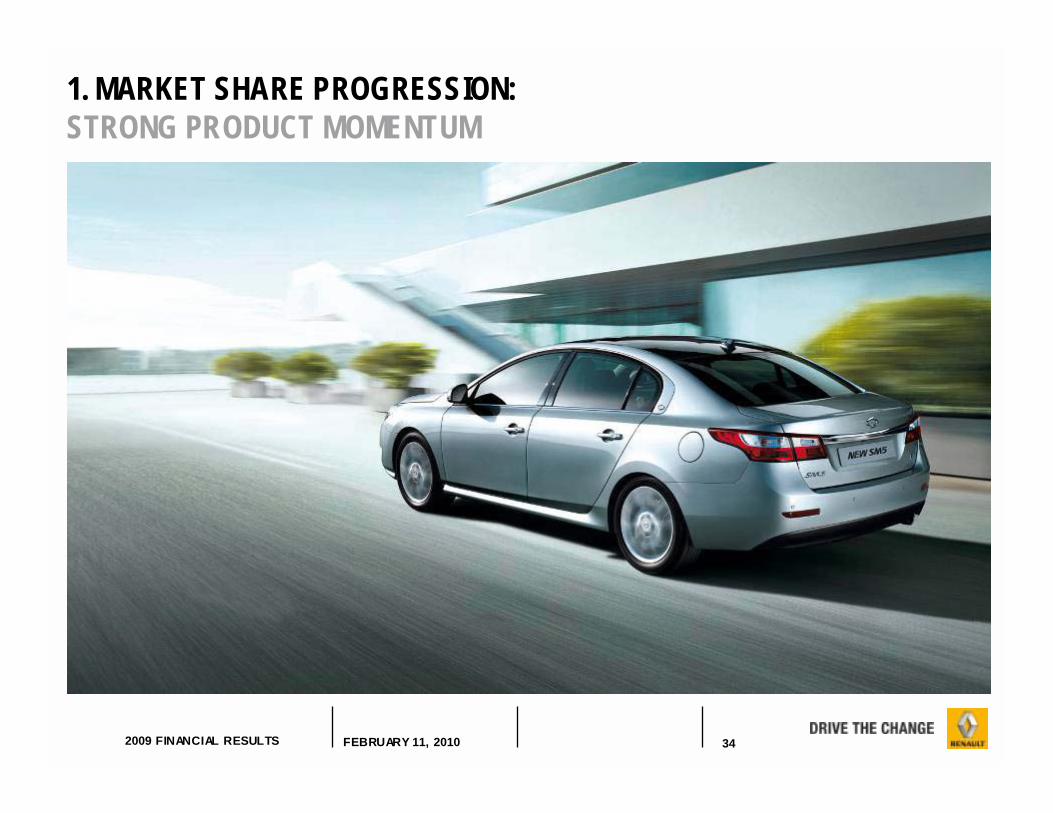
1. MARKET SHARE PROGRESSION: STRONG PRODUCT MOMENTUM
VISUEL SM5 PLEIN ECRANA VENIR

35FEBRUARY 11, 20102009 FINANCIAL RESULTS
1. MARKET SHARE PROGRESSION: STRONG PRODUCT MOMENTUM
VISUEL DUSTER PLEIN ECRANA VENIR

36FEBRUARY 11, 20102009 FINANCIAL RESULTS
1. MARKET SHARE PROGRESSION: STRONG PRODUCT MOMENTUM
37FEBRUARY 11, 20102009 FINANCIAL RESULTS
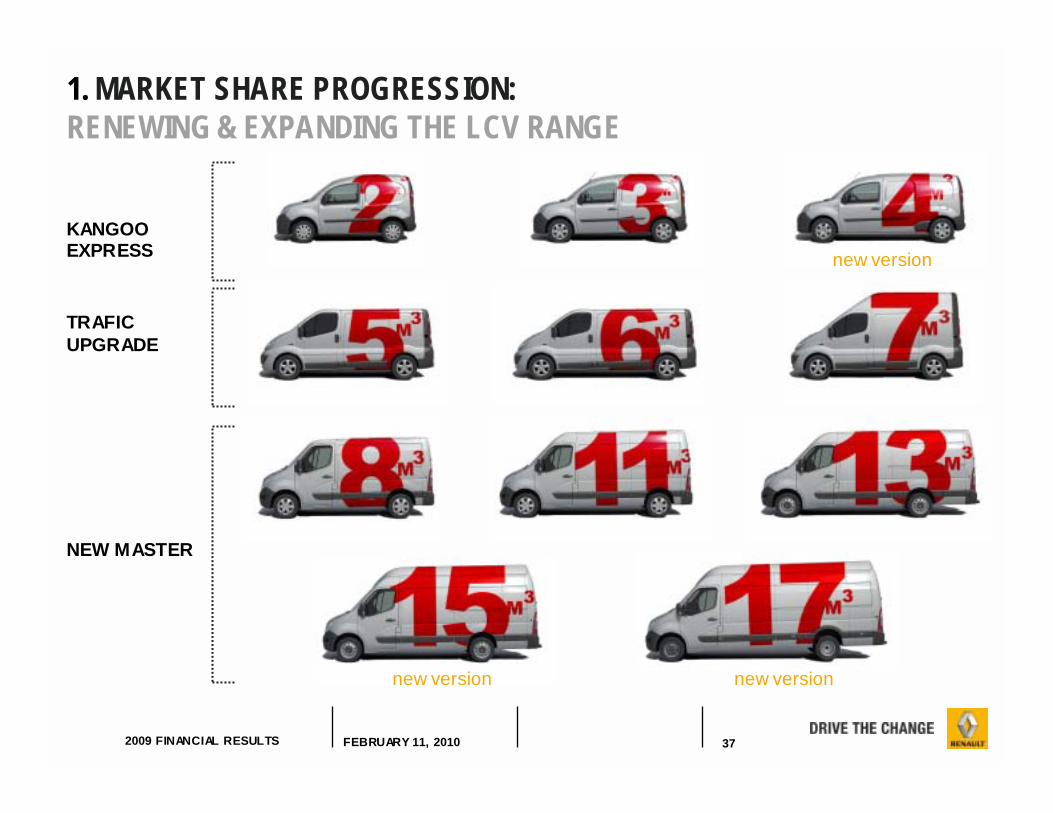
1. MARKET SHARE PROGRESSION:RENEWING & EXPANDING THE LCV RANGE
new version
TRAFICUPGRADE
NEW MASTER
new version new version
KANGOOEXPRESS
38FEBRUARY 11, 20102009 FINANCIAL RESULTS
2. ALLIANCE SYNERGIES IN 2009
! €1.5bn achieved at end-December 2009
! Still have up to end FY09 for Nissan
! Renault outperformed initial target of €678mthanks to additional new savings
! Synergies include a mix of:
! Pure cost & CAPEX savings
! Cost & CAPEX avoidance
! Joint revenue opportunities

39FEBRUARY 11, 20102009 FINANCIAL RESULTS
2. ALLIANCE SYNERGIESINTERNATIONAL EXPANSION STRATEGYALLIANCE "ENTRY PRICE MODEL" STRATEGY IN EMERGING MARKETS
12 ADDITIONAL MODELS TO BE CROSS-MANUFACTURED BY 2013
40FEBRUARY 11, 20102009 FINANCIAL RESULTS
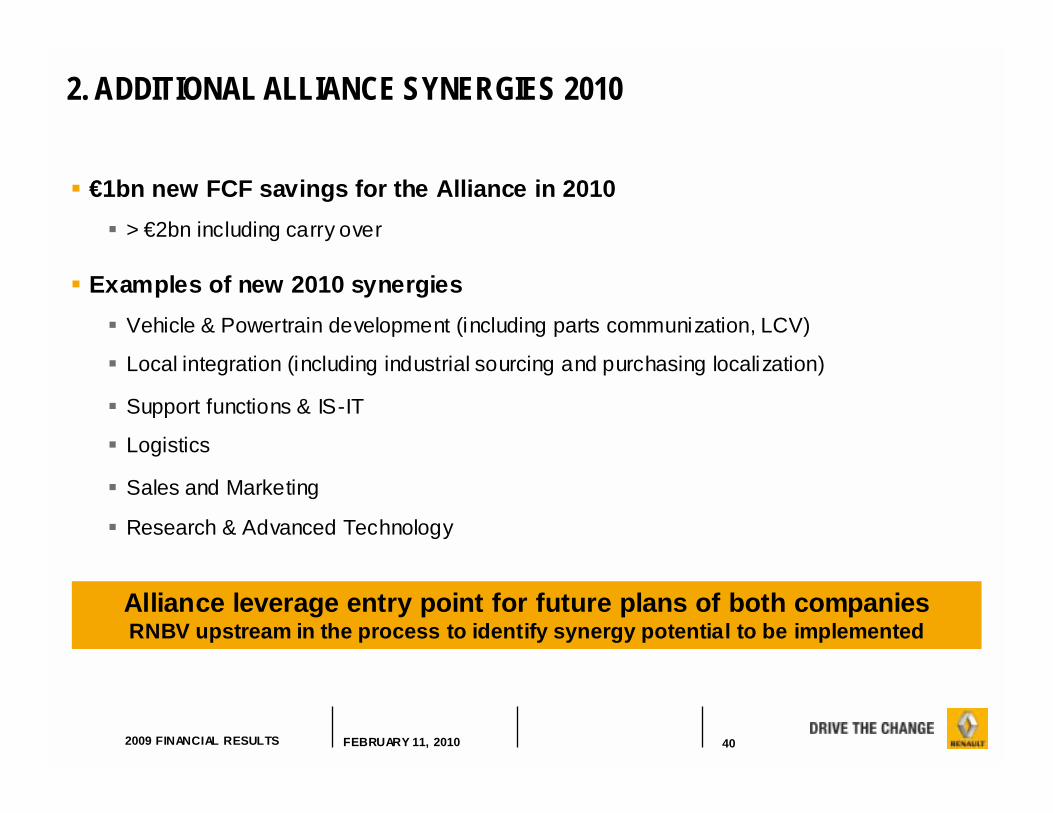
! €1bn new FCF savings for the Alliance in 2010! > €2bn including carry over
! Examples of new 2010 synergies! Vehicle & Powertrain development (including parts communization, LCV)
! Local integration (including industrial sourcing and purchasing localization)
! Support functions & IS-IT
! Logistics
! Sales and Marketing
! Research & Advanced Technology
Alliance leverage entry point for future plans of both companiesRNBV upstream in the process to identify synergy potential to be implemented
2. ADDITIONAL ALLIANCE SYNERGIES 2010
41FEBRUARY 11, 20102009 FINANCIAL RESULTS
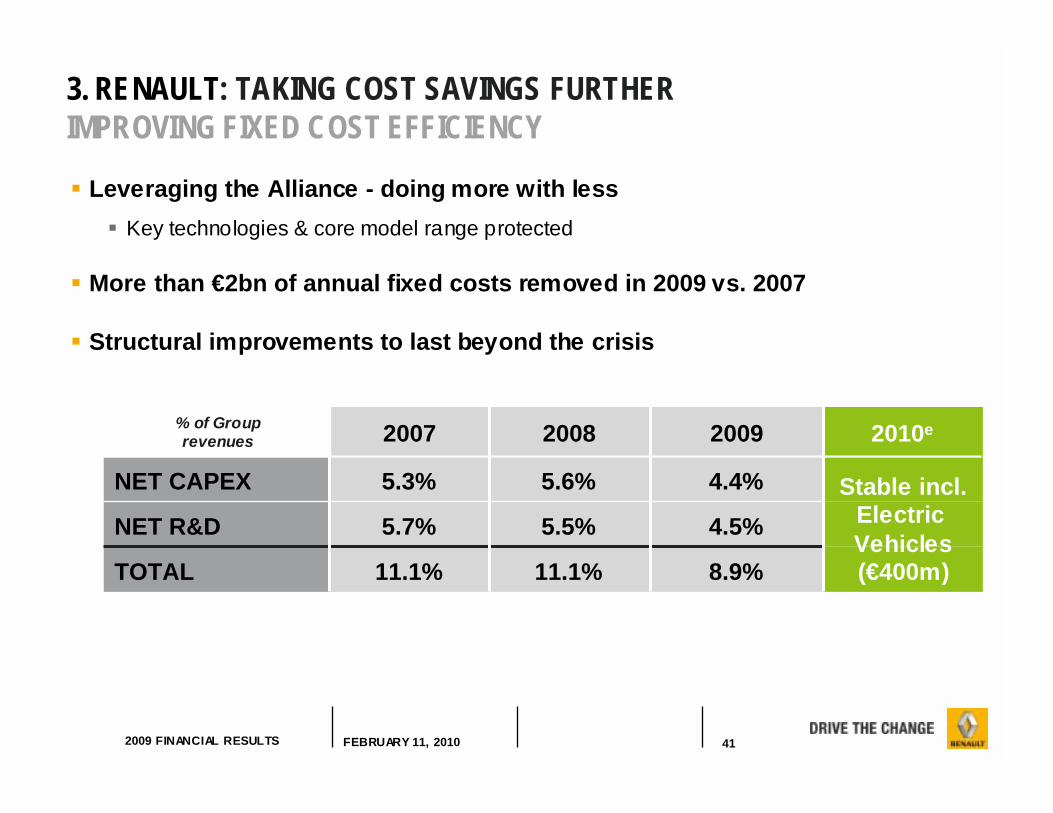
! Leveraging the Alliance - doing more with less! Key technologies & core model range protected
! More than €2bn of annual fixed costs removed in 2009 vs. 2007
! Structural improvements to last beyond the crisis
3. RENAULT: TAKING COST SAVINGS FURTHER IMPROVING FIXED COST EFFICIENCY
8.9%11.1%11.1%TOTAL
4.5%5.5%5.7%NET R&D
4.4%5.6%5.3%NET CAPEX
2010e200920082007% of Group revenues
Stable incl.Electric Vehicles(€400m)
42FEBRUARY 11, 20102009 FINANCIAL RESULTS
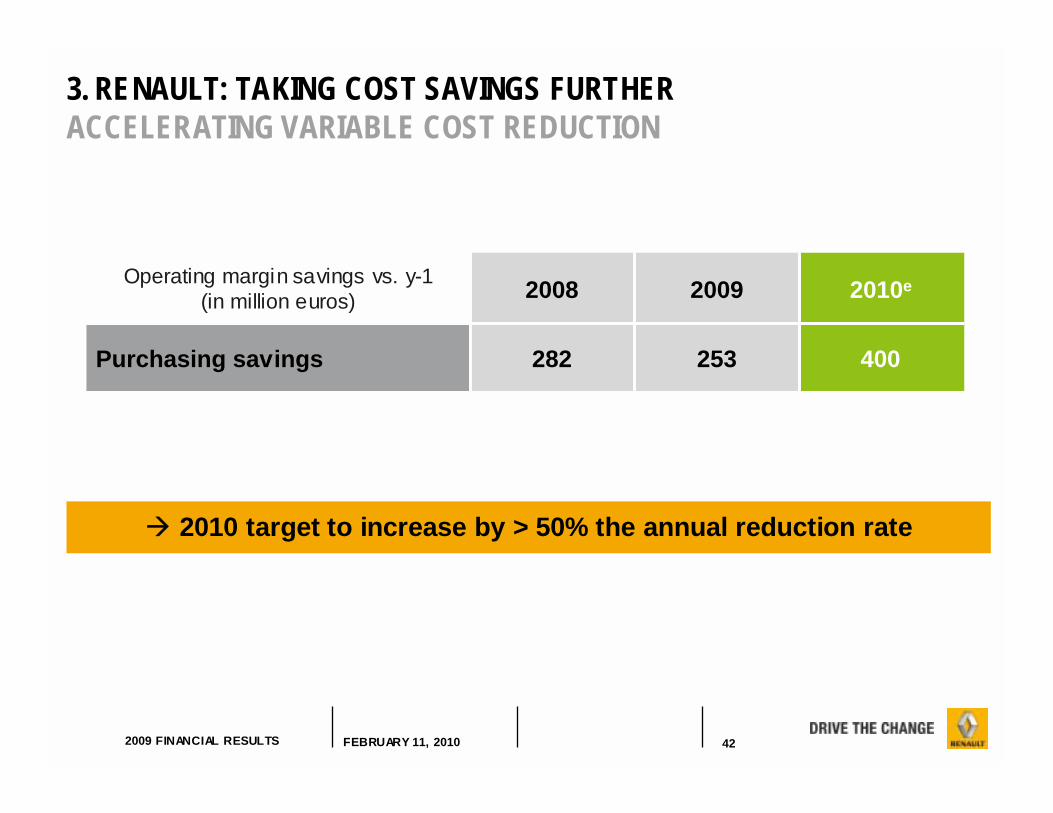
" 2010 target to increase by > 50% the annual reduction rate
400253282Purchasing savings
2010e20092008Operating margin savings vs. y-1(in million euros)
3. RENAULT: TAKING COST SAVINGS FURTHER ACCELERATING VARIABLE COST REDUCTION

43FEBRUARY 11, 20102009 FINANCIAL RESULTS
! 2009 WCR recovered to pre-crisis levels! Despite revenues -17% vs. 2007
4. RENAULT: SUSTAINING A HIGH LEVEL OF WCR EFFICIENCY
+2.9-2.7∆ WCR
20092008(in billion euros)
3.5%3.7%4.7%*5.6%Receivables
12.0%12.3%14.7%15.3%Inventory
2010e200920082007% of auto revenues
(*) Excl. License receivables of €165m
! Structural improvements to last beyond the crisis! Creating a leaner and faster asset turnover! Implementation of strict "cash culture" within the organisation
44FEBRUARY 11, 20102009 FINANCIAL RESULTS
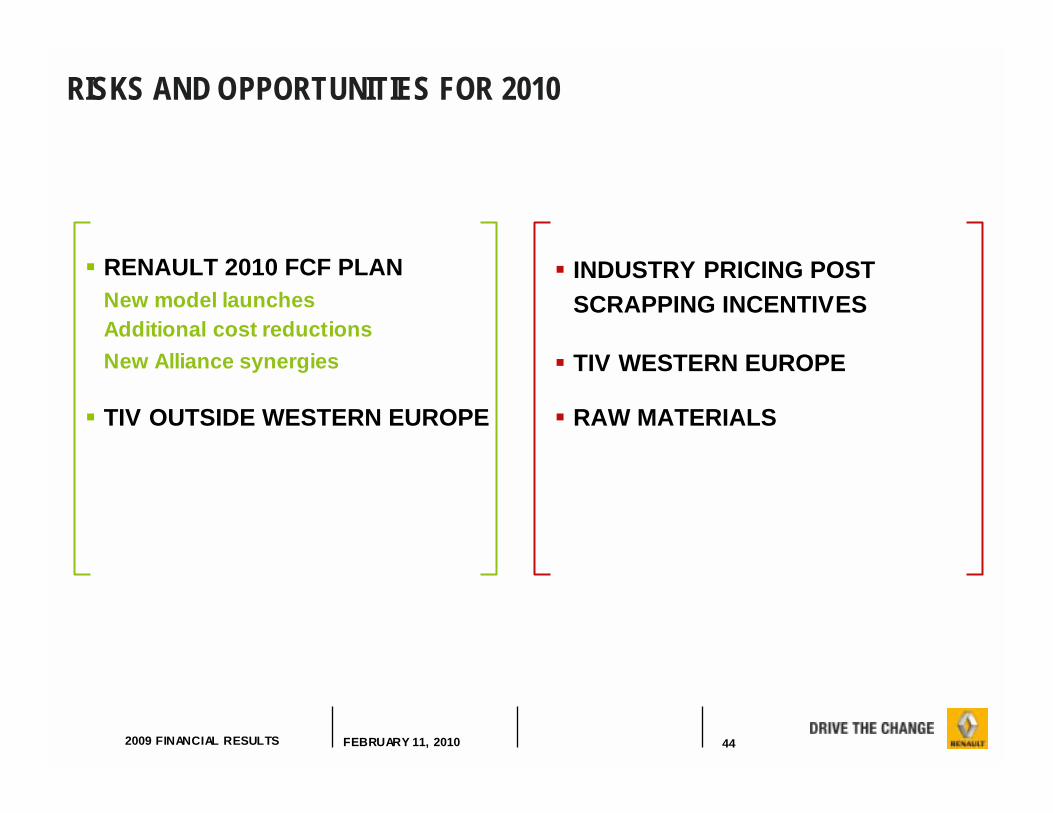
RISKS AND OPPORTUNITIES FOR 2010
! RENAULT 2010 FCF PLANNew model launches Additional cost reductionsNew Alliance synergies
! TIV OUTSIDE WESTERN EUROPE
! INDUSTRY PRICING POST SCRAPPING INCENTIVES
! TIV WESTERN EUROPE
! RAW MATERIALS

45FEBRUARY 11, 20102009 FINANCIAL RESULTS
LOOKING BEYOND THE CRISIS
! Short term - Focus on FCF & continued debt reduction
! Renault is preparing for post-crisis challenges! Launching new technological breakthroughs
New powertrainsElectric Vehicle
! Securing positions for emerging market growthBuilding on our leadership position in low-cost segmentDeveloping ultra-low cost offers
! Sustaining market share growth in EuropeAdapting our line up to the new customer expectations Investing in the development of our brands
! Strengthening the Alliance
! 2010: preparing the plan to be announced by 2011

46FEBRUARY 11, 20102009 FINANCIAL RESULTS
QUESTIONS & ANSWERSCARLOS GHOSN, PATRICK PÉLATA,THIERRY MOULONGUET
04

47FEBRUARY 11, 20102009 FINANCIAL RESULTS
DISCLAIMER
Information contained within this document may contain forward looking statements. Although the Company considers that such information and statements are based on reasonable assumptions taken on the date of this report, due to their nature, they can be risky and uncertain (as described in the Renault documentation registered within the French financial markets regulation authorities) and can lead to a difference between the exact figures and those given or deduced from said information and statements.
Renault does not undertake to provide updates or revisions, should any new statements and information be available, should any new specific events occur or for any other reason. Renault makes no representation, declaration or warranty as regards the accuracy, sufficiency, adequacy, effectiveness and genuineness of any statements and information contained in this report.
Further information on Renault can be found on Renault’s web site (www. Renault.com), in the section Finance / Regulated Information.