© 2009 dosung sohn - university of...
TRANSCRIPT

INVERTEBRATES ANALYSIS BY CAPILLARY ELECTROPHORESIS
By
DOSUNG SOHN
A DISSERTATION PRESENTED TO THE GRADUATE SCHOOL OF THE UNIVERSITY OF FLORIDA IN PARTIAL FULFILLMENT
OF THE REQUIREMENTS FOR THE DEGREE OF DOCTOR OF PHILOSOPHY
UNIVERSITY OF FLORIDA
2009
1

© 2009 Dosung Sohn
2

To my family, Youngmi, Mia, and Aiden
3

ACKNOWLEDGMENTS
I am really grateful that I had the opportunity to have Dr. Weihong Tan as my PhD advisor.
Working under his supervision has been an invaluable experience. His hard work, determination,
commitment to the advancement of science, and kindness has been very inspiring to me. I thank
him for his patience, encouragement, and clever suggestions during my five-year doctoral
research. I am also very grateful to my graduate committee members, Dr. Leonid L. Moroz, Dr.
Charles Martin, Dr. Ben Smith, and Dr. Nicole A. Horenstein for their valuable
recommendations.
I highly appreciate Dr. Moroz’s friendship and generosity. He always put me in
challenging tasks and gives me a chance to develop myself toward to a creative researcher. His
smile and kind comments filled my heart with great joy many times. I am very pleased with my
lab mates, Thomas Ha, Sami Jezzni, and Colin Medlin Their enthusiasm, happiness, good hearts,
and commitment to research provide the lab with a nice environment, where anybody would feel
welcome and prompted to work. I also thank my close friends whose names are too many to list.
Their friendship made my staying in this country, away from my family and loved ones, much
more pleasant than it would have been without them. I was also supported by my mother,
Youngja Lee, my Father, Dongwoon Sohn, and my sisters.
Finally, I am indebted to the Department of Chemistry at University of Florida in
Gainesville for giving me the opportunity to pursue a PhD degree. The financial support from
the National Institutes of Health is also gratefully acknowledged.
4

TABLE OF CONTENTS page
ACKNOWLEDGMENTS ...............................................................................................................4
LIST OF TABLES ...........................................................................................................................8
LIST OF FIGURES .........................................................................................................................9
ABSTRACT ...................................................................................................................................11
CHAPTER
1 INTRODUCTION ..................................................................................................................13
Historical Background ............................................................................................................13 Separation Technology for Metabolomics ..............................................................................14
Separation Methods .........................................................................................................14 Detection Methods ...........................................................................................................15
Capillary Electrophoresis and its Application to Metabolomics ............................................16 Capillary Electrophoresis Fundamentals .........................................................................16 Capillary Zone Electrophoresis .......................................................................................16 Micellar Electrokinetic Chromatography (MEKC) .........................................................20 Chiral Separation by CE ..................................................................................................24 Capillary Isotachophoresis (ITP) .....................................................................................27 Capillary Electrochromatography ...................................................................................28 Capillary Gel Electrophoresis ..........................................................................................29 Capillary Isoelectric Focusing .........................................................................................29
Fluorescence Detection in CE ................................................................................................29 Conductivity Detection in CE .................................................................................................32
Basic Principles ...............................................................................................................32 Contactless Conductivity Detectior (CCD) .....................................................................33
Nitric Oxide in Living Organisms ..........................................................................................35 Neurotransmission ...........................................................................................................36 Vasodilation .....................................................................................................................37 Phosphorylation ...............................................................................................................37 Immune System ...............................................................................................................38 Measurement of the Activity and Concentration of Nitric Oxide and Its Metabolites ...38
Invertebrates for Neurochemistry Analysis ............................................................................43 Cnidaria ...........................................................................................................................44 Porifera ............................................................................................................................46 Ctenophora ......................................................................................................................47 Placozoa ...........................................................................................................................47 Mollusca ..........................................................................................................................48
Dissertation Overview ............................................................................................................49
5
2 DEVELOPMENT AND EVALUATION OF CE COUPLED WITH LASER-INDUCED FLUORESCENCE (LIF) DETECTION FOR THE ASSAY OF AMINO ACIDS AND NEUROTRANSIMITTERS ............................................................................50
Introduction .............................................................................................................................50 Methods and Materials ...........................................................................................................53
Reagents ..........................................................................................................................53 CE Instrumentation ..........................................................................................................53 Data Analysis ...................................................................................................................55
Results and Discussion ...........................................................................................................56 Optimization of CE Separation Conditions .....................................................................56 Analytical Calibration .....................................................................................................59 Glu and Asp Enantiomer Separation ...............................................................................60
Conclusion ..............................................................................................................................62
3 DEVELOPMENT AND EVALUATION OF CE COUPLED WITH CONTACTLESS CONDUCTIVITY DETECTION TO IMPROVE THE ANION ASSAY .............................63
Introduction .............................................................................................................................63 Methods and Materials ...........................................................................................................65
Instrumentation ................................................................................................................65 Reagents ..........................................................................................................................65 Animals ............................................................................................................................65 Hemolymph and Ganglia .................................................................................................66 Chloride Cleanup by Solid-Phase Extraction ..................................................................66 Separation and Analysis ..................................................................................................67
Results and Discussion ...........................................................................................................68 Solid-Phase Microextraction (SPME) Cleanup ...............................................................68 Optimization of Separation ..............................................................................................69 Analytical Performance ...................................................................................................70
Conclusion ..............................................................................................................................74
4 NITRIC OXIDE (NO) SINGNALING IN TRICHOPLAX ADHAERENS ..........................75
Introduction .............................................................................................................................75 Methods and Materials ...........................................................................................................77
Chemicals and Reagents ..................................................................................................77 Animal Culture ................................................................................................................78 NOS Inhibitor Incubation ................................................................................................78 Amino Acids Microanalysis using CE with LIF .............................................................78 Nitrite/Nitrate Microanalysis using CE with Contactless Conductivity ..........................79 Behavior Tests .................................................................................................................80 Data Analysis ...................................................................................................................81
Results and Discussion ...........................................................................................................81 Amino acid analysis by CE-LIF ......................................................................................81 Nitrite and Nitrate Analysis by CE-Conductivity ...........................................................83 Locomotory phases in Trichoplax ...................................................................................85
6
NO as a modulator of locomotion ...................................................................................86 Glycine as a chemoattractant in Trichoplax ....................................................................87
Conclusion ..............................................................................................................................88
5 USING CE FOR METABOLOMIC PROFILING OF THE BASAL ANIMALS: CTENOPHORES, CNIDARIANS, PLACOZOA, AND SPONGES ....................................90
Introduction .............................................................................................................................90 Methods and Materials ...........................................................................................................91
Chemicals and Reagents ..................................................................................................91 Sample Preparation ..........................................................................................................91 Amino Acids Microanalysis using CE with LIF .............................................................92 Nitrite/Nitrate Microanalysis using CE with Contactless Conductivity ..........................93 Data Analysis ...................................................................................................................93
Results and Discussion ...........................................................................................................94 Neurotransmitters and Their Metabolites in Basal Animals ...........................................94 Glu and Asp Enantiomer Analysis in Basal Animals ......................................................96 Nitrite and Nitrate Assay in the Basal Animals ...............................................................97
Conclusion ..............................................................................................................................99
6 COMPARATIVE ANALYSIS OF MULLUSCA: SQUID, NAUTILUS, AND APLYSIA CALIFORNICA ..................................................................................................102
Introduction ...........................................................................................................................102 Methods and Materials .........................................................................................................104
Chemicals and Reagents ................................................................................................104 Sample Preparation ........................................................................................................104 Amino Acids Microanalysis using CE with LIF ...........................................................105 Nitrite/Nitrate Microanalysis using CE with Contactless Conductivity ........................106 Data Analysis .................................................................................................................106
Results and Discussion .........................................................................................................107 Squid Axoplasm Analysis ..............................................................................................107 Nautilus Analysis ...........................................................................................................109 Aplysia californica Analysis ..........................................................................................112
Conclusion ............................................................................................................................114
LIST OF REFERENCES .............................................................................................................116
BIOGRAPHICAL SKETCH .......................................................................................................133
7

LIST OF TABLES
Table page 2-1 Correlation coefficients, RSDs, and LOD .........................................................................60
2-2 Correlation coefficients, RSDs, and LOD .........................................................................62
3-1 Description of hemolymph and central nervous system ganglia of Aplysia californica ...71
5-1 Metabolite concentrations in basal animals. ....................................................................100
5-2 L- and D - Glu and Asp concentrations in basal animals ................................................101
8

LIST OF FIGURES
Figure page 1-1 A) Electric double layer created by negatively charged surface and nearby cations.
B) Predominance of cations in diffuse part of the double layer produces net electroosmotic flow toward the cathode when an external field is applied .......................17
1-2 Migration of uncharged compounds in MEKC .................................................................22
1-3 Migration schemes for cationic enantiomers in CE using cyclodextrins (CDs) as chiral selectors ...................................................................................................................26
1-4 Energy level diagram for a typical molecule .....................................................................30
1-5 Schematic diagrams of conductivity detectors ..................................................................34
1-6 Schematic of some of the physiologically relevant reactions of NO and NO-derived species in aqueous, aerobic solution ..................................................................................36
1-7 Phylogenetic tree of Metazoan relationships .....................................................................44
2-1 Schematic optical layout of the fluorescence detection system .........................................54
2-2 Electropherograms of standard amino acids (1µM) ..........................................................56
2-3 Electropherograms of standard amino acids depending on various SDS concentrations ....................................................................................................................57
2-4 Electropherograms of standard amino acids depending on different pH conditions .........58
2-5 Calibration curves of standard amino acids .......................................................................59
2-6 Electropherograms of Glu and Asp enantiomers ...............................................................61
3-1 Custom-made and factory-made chloride clean-up kit ......................................................67
3-2 Sample recovery graph ......................................................................................................69
3-3 Calibration curves of nitrite and nitrate .............................................................................70
3-4 Electropherograms of standard solutions (650nM of all anions), hemolymph, and central ganglia in Aplysia californica ................................................................................72
3-5 Nitrite and nitrate concentrations of hemolymph and central ganglia in Aplysia californica ..........................................................................................................................73
4-1 Electropherograms and concentration profiling of Trichoplax adhaerens ........................82
9

4-2 Electropherograms and Arg-to-Cit ratios of Trichoplax adhaerens upon treatment with NOS inhibitors ...........................................................................................................83
4-3 Electropherograms of controls and Trichoplax upon NOS inhibitors ...............................84
4-4 Trichoplax behavioral analysis (Control) ..........................................................................85
4-5 Trichoplax behavior analysis (NO modulators) .................................................................86
4-6 Trichoplax behavior analysis (Glycine) .............................................................................87
5-1 Electropherograms of basal animals ..................................................................................94
5-2 Electropherograms of Glu and Asp enantiomers in the basal animals ..............................97
5-3 Nitrite and nitrate electropherograms of the basal animals ...............................................98
6-1 Electropherograms and concentration profiling of Squid ................................................107
6-2 Nitrite and nitrate electropherograms and concentration profile .....................................108
6-3 Electropherograms and concentration profile of Glu and Asp enantiomers in the Squid axoplasm ................................................................................................................109
6-4 Electropherograms and concentration profiling of Nautilus ............................................110
6-5 Nitrite and nitrate electropherograms and concentration profile .....................................110
6-6 Electropherograms and concentration profile of glu and asp enantiomers in the Nautilus ............................................................................................................................111
6-7 Electropherogram and concentration profiles of Aplysia californica chemosensory cells ..................................................................................................................................113
6-8 Electropherograms and concentration profiles of embryonic cells of Aplysia californica ........................................................................................................................114
10

Abstract of Dissertation Presented to the Graduate School of the University of Florida in Partial Fulfillment of the Requirements for the Degree of Doctor of Philosophy
INVERTEBRATES ANALYSIS BY CAPILLARY ELECTROPHORESIS
By
Dosung Sohn
December 2009 Chair: Weihong Tan Major: Chemistry
Over millons of years nervous systems of biological machines have evolved. Thus,
tracking the lineages and constraints that have molded nervous systems provides an opportunity
to understand signal molecules and their metabolites in variety of marine organisms having key
positions in the evolutionary tree of life. In particular basal animals, including placozoa,
ctenophores, cnidarians, sponges relatively simple organization compared to other known
animals. While there have been extensive studies on genome, physiology, histochemistry, and
regeneration, direct microchemical data are limited on basal animals.
In order to provide direct evidence for the presence of neurotransmitters and their
metabolites, we have identified and characterized major low molecular weight potential signaling
molecules and their metabolites in marine organisms. Capillary electrophoresis (CE) techniques
with laser-induced fluorescence (LIF) and contactless conductivity detection (CCD) were used
for in-depth studies of the metabolites of the neurotransmitters and nitric oxide (NO). Since NO
is a highly reactive signaling molecule, indirect detection methods were used. For example, L-
Arginine and L-Citrulline, a precursor and co-product of NO, respectively, were analyzed with
CE-LIF. Also, nitrite and nitrate, both major oxidation products of NO, were analyzed with CE-
CCD.
11

12
The results of this study will be used in conjunction with key research questions to fill
numerous gaps in our understanding of diversity and evolution of signal molecules and the
development of integrative systems in animals.

CHAPTER 1 INTRODUCTION
Metabolomics is the systematic study of small molecules in living organisms (Xiayan &
Legido-Quigley 2008). The metabolome represents the collection of all metabolites (i.e.
intermediates and products of metabolism) in a biological system. Metabolomic profiling can
often show the physiological differences in a cell, in cases where mRNA gene expression data
and proteomic analyses provide insufficient information. One of the challenges of systems
biology and functional genomics is to combine proteomic, transcriptomic, and metabolomic
information to give a more complete understanding of living organisms. This research was
undertaken to gain metabolomic information on marine organisms by studying the signaling
molecules.
Historical Background
The development of metabolomics began in 1970, when Arthur Robinson investigated
Pauling's ideas that biological variability could be explained on the basis of far wider ranges of
nutritional requirements than what was generally recognized (Pauling et al. 1971). In analyzing
the chromatographic patterns of urine from vitamin B6-loaded subjects, it was realized that the
patterns of hundreds or thousands of chemical constituents in urine contained a considerable
amount of information, including identification of several diseases, determination of living
conditions, and physiological age. It was expected that body fluid analysis could be optimized to
create a low-cost, information-rich, medically-relevant means of measuring metabolically-driven
changes in functional state, even when the chemical constituents are all in the normal range. This
information on the functional status of a complex biological system resides in the quantitative
and qualitative pattern of metabolites in body fluids.
13

The name “metabolomics” was proposed in the 1990s (Oliver et al. 1998), and in 2004 a
society was formed to promote its study. Many of the bioanalytical methods used for
metabolomics have been adapted from existing biochemical techniques. There are two
characteristics common to metabolomic research. First, effort is made to profile metabolites with
as little bias as possible towards a specific metabolite or group of metabolites. Second, large
numbers of metabolites are profiled at the same time, instead of being analyzed individually.
The field of metabolomics exploded in the early 2000s, particularly as a result of efforts by
researchers from the Max Planck Institute for Plant Physiology, and this research set the
framework for metabolomics-scale investigations (Fiehn et al. 2000, Fernie et al. 2004). The
Human Metabolome Project, led by Dr. David Wishart, completed the first draft of the human
metabolome, consisting of a database of approximately 2500 metabolites, 1200 drugs and 3500
food components (Wishart et al. 2007). Similar projects have been underway for several plant
species, most notably Medicago truncatula and Arabidopsis thaliana for several years.
Separation Technology for Metabolomics
There are four important issues to be addressed for metabolite analysis: efficient and
unbiased extraction of metabolites from biological tissues, separation and detection of the
analytes by chromatographic or other methods, and identification and quantification.
Separation Methods
Gas chromatography (GC), especially when coupled with mass spectrometry (MS), is one
of the most widely used and powerful methods for separation and analysis (Pasikanti et al. 2008).
It offers very high chromatographic resolution, but chemical derivatization is needed to increase
the volatility of many biomolecules. Modern instruments are capable of 2D chromatography via
a short polar column after the main analytical column. Although this method provides increased
resolution, some large and polar metabolites cannot be analyzed by GC.
14
Compared to GC, high performance liquid chromatography (HPLC) has lower
chromatographic resolution, but it does have the advantage that components do not have to be
volatile, so that a much wider range of analytes can potentially be measured (Wilson et al. 2005).
Capillary electrophoresis (CE) has higher theoretical separation efficiency than HPLC, and is
suitable for use with a wider range of metabolite classes than is GC, but as with all
electrophoretic techniques, CE is most appropriate for charged analytes (Xiayan & Legido-
Quigley 2008).
Detection Methods
Mass spectrometry (MS) is an important mean to identify and quantify metabolites after
separation by GC, HPLC, or CE. GC-MS is the most common combination of the three and was
the first to be developed (Xiayan & Legido-Quigley 2008). In addition, mass spectral fingerprint
libraries exist or can be developed to allow identification of a metabolite according to its
fragmentation pattern (Zou et al. 2008). There is also a number of studies which use MS as a
stand-alone technology; the sample is infused directly into the mass spectrometer with no prior
separation, and the MS serves to both separate and to detect metabolites (Prakash et al. 2007).
Nuclear magnetic resonance (NMR) spectroscopy is the only detection technique which
does not rely on separation of the analytes, and the sample can thus be recovered for further
analyses. All kinds of small molecule metabolites can be measured simultaneously (Tukiainen et
al. 2008). Practically, however, it is much less sensitive than mass spectrometry-based
techniques, and NMR spectra can be very difficult to interpret for complex mixtures.
MS and NMR are by far the two leading technologies for analyzing metabolites. Other
methods of detection that have been used include electrochemical detection coupled to HPLC
(Parrot et al. 2007) and radiolabeling combined with thin-layer chromatography (Rogers et al.
1996).
15

Capillary Electrophoresis and its Application to Metabolomics
Capillary Electrophoresis Fundamentals
Capillary electrophoresis is a relatively new analytical separation technique that has found
extensive use in clinical chemistry (Patterson et al. 2008, Gates et al. 2007, Bakry et al. 2007).
Typical applications include analysis of peptides, proteins, drugs, drug metabolites,
carbohydrates, biological extracts and small molecules. Capillary electrophoresis can be divided
into six main groups according to the separation mode: capillary zone electrophoresis (CZE),
micellar electrokinetic chromatography (MEKC), capillary isotachophoresis (CITP), capillary
electrochromatography (CEC), capillary gel electrophoresis (CGE), and capillary isoelectric
focusing (CIEF). All these are electrically driven techniques, meaning that applied voltage rather
than pressure is the driving force for separation (Landers 1996).
Capillary Zone Electrophoresis
This is probably the most commonly used separation mode in capillary electrophoresis. In
this high resolution analytical separation technique, analytes are separated according to their
electrophoretic mobilities in an electric field applied to a separation capillary filled with a buffer
solution. CZE employs narrow bore (20-100 μm I.D.) capillaries, which can be made of Teflon,
glass or fused silica. A typical CZE experiment is carried out as follows. The separation capillary
is immersed in inlet and outlet vials, both containing a buffer solution. After the capillary is filled
with this solution by a pressure injection, the inlet vial is replaced by a sample vial. Following
electrokinetic injection of the sample, the inlet end is placed back into the buffer vial, and
voltage is then applied between the two capillary ends.
Analytes migrate along the capillary at different velocities, which are mainly determined
by their charges and charge-to size ratios. The net or apparent velocity is given by
16

νapp = νep + νeo (1.1)
where, νep is the analyte electrophoretic velocity and νeo is the velocity of the electroosmotic flow
(EOF). These two parameters can also be expressed in terms of mobility values as follows
νapp = μapp × E (1.2)
μapp = μep + μeo (1.3)
where μep and μeo represent the analyte electrophoretic mobility and the EOF mobility,
respectively. The μeo is a result of the bulk flow due to the movement of hydrated buffer ions
along the capillary in the presence of an electric field, and is primarily determined by the charge
density on the capillary surface.
Figure 1-1. A) Electric double layer created by negatively charged surface and nearby cations. B) Predominance of cations in diffuse part of the double layer produces net electroosmotic flow toward the cathode when an external field is applied
17

In the case of fused silica capillaries, this charge is a function of the pH of the buffer
solution. For example, at low pH values (2-3) the silanol (SiOH) groups are protonated, and
therefore the surface charge and μeo are negligible. As the pH of the buffer solution is raised, the
silanol groups are ionized to SiO- and H3O+, leading to an increase in negative charges on the
capillary wall. This negatively charged surface attracts buffer cations, forming two main layers
(Figure 1-1). The first layer is fixed adjacent to the wall, but the second layer (farther from the
wall) is mobile. It is the movement of this latter layer that gives rise to the EOF (Harris 2007).
The electroosmotic mobility is defined as
ηεξμ =eo
(1.4)
where ξ is the zeta potential (potential across the two layers), and ε and η are the dielectric
constant and viscosity of the buffer solution, respectively. The zeta potential is given by
επδσξ 4
= (1.5)
where δ is the thickness of the diffuse double layer and σ is the charge per unit surface area.
Unlike mechanically driven flows, the electroosmotic flow has a flat flow profile. This means
that the velocity of the fluid is constant along the radial axis of the capillary, which is the main
reason for the high separation efficiencies observed in CE. Because the electroosmotic flow has a
great impact on separation, a number of strategies have been developed to control its magnitude
and direction.
The electrophoretic mobility is an intrinsic property of the analyte and is given by
rq
ep πημ
6=
(1.6)
where q is the charge of the analyte and 6πηr is the friction coefficient ( f ).
18

The apparent mobility, μapp, of a particular species can be calculated from experimental
data using the following relationship
t
dnet
app
LV
tL
Eu
==μ (1.7)
where unet is the velocity of the species, E is the electric field, Ld is the length of column from
injection to the detector, Lt is the total length of the column from end to end, V is the voltage
applied between the two ends, and t is the time required for solute to migrate from the injection
end to the detector.
The quality of the separation is determined by a number of factors relating to the buffer,
the characteristics of the capillary, the mode of injection (hydrodynamic or electrokinetic), and
the applied voltage. The buffer identity, pH, and concentration, as well as the presence of
additives or modifiers (i.e. organic solvents, surfactants, and urea) all play key roles (Landers
1996). The capillary dimensions (internal diameter and length) and the method used to modify
the surface are also important.
High efficiencies are achieved when analyte adsorption is prevented. When using bare
fused silica capillaries, high ionic strength buffers (either acidic or basic) are typical. For coated
capillaries, the use of neutral pH buffers is possible. The inclusion of additives in the buffer
solution may alter the analyte mobilities and modify the capillary surface (Landers 1996).
As a general trend, high separation voltages and long capillaries with small internal
diameters provide high separation efficiencies. However, care must be exercised when applying
high voltages to avoid Joule heating produced by high currents. Joule heating results in
temperature gradients and bubble formation, both of which are detrimental to the separation
efficiency (Landers 1996).
19

The volume of sample injected is determined by the injection mode employed. For
hydrodynamic injection, the volume is given by
tLtpdV
ηπ
128
4Δ=
(1.8)
where Δp is the pressure difference along the length of the capillary, d is the capillary inner
diameter, t is the injection time, η is the buffer viscosity, and Lt is the total length of the capillary.
For electrokinetic injection, the moles of sample injected is given by
( )s
beoeps EtCrQ
λλμμπ +
=2
(1.9)
where, Q is the moles of sample injected, r is the radius of the capillary, Cs is the sample
concentration, λb is the conductivity of the buffer, and λs is the conductivity of the sample
(Landers 1996). With this injection mode, the analyte electrophoretic mobility impacts the moles
of sample injected. Therefore, unlike hydrodynamic injection, electrokinetic injection
discriminates according to electrophoretic mobilities. When the sample is dissolved in a low
ionic strength solution such as water, electrokinetic injection is preferred over hydrodynamic
injection, since it typically results in higher separation efficiencies as a consequence of stacking
effects by which analyte is focused into narrow bands at the start of the capillary (Harris 2007).
Injection volumes should be maintained within 0.2% of the capillary volume to prevent band-
broadening due to column overloading (Landers 1996).
Micellar Electrokinetic Chromatography (MEKC)
In MEKC, the buffer contains a surfactant in sufficient concentration to form micelles. The
separation relies on partitioning of the analytes between the buffer solution and the micelles, also
called a pseudostationary phase. Interaction of analytes with the micelles occurs via hydrophobic,
ionic, or hydrogen bonding forces. This technique has been applied to the separation of both
20
neutral and charged compounds. In the case of neutral compounds, separation is based on
partitioning solely, while for charged compounds, separation is determined by partitioning as
well as electrophoretic mobility (Landers 1996).
Micelles: Surfactants are amphiphilic molecules that contain a hydrophobic moiety and a
polar or ionic head group. They can be recognized by the charge of the head group (i.e. nonionic,
anionic, cationic, and zwitterionic surfactants) or by the variations in the nature of hydrophobic
moiety (i.e. hydrocarbon, bile salts, and fluorocarbon surfactants). Above a critical micelle
concentration (CMC), surfactants begin to form aggregates that are in dynamic equilibrium with
the monomers in the bulk aqueous solution. The number of monomer surfactants in the aggregate
and the shapes of size of micelles vary greatly between surfactants. For example, surfactants with
alkyl chains form roughly spherical micelles with diameters between 3 and 6nm and aggregation
numbers of 30 and 100.
Migration in MEKC: Figure 1-2 illustrates the typical migration scheme for uncharged
compounds in MEKC using an anionic surfactant and a cationic surfactant in an uncoated fused
silica capillary. Figure 1-2A shows an aninoic micelle in a bare silica capillary with ionized
surface (SiO-). Although anions naturally are attracted to the anode, the EOF velocity is stronger
than the electrophoretic velocity and the anionic micelles are carried toward the cathode. When
cationic micelles are used, the capillary wall is coated with the positively charged surfactants
with oftentimes leads to a reversal in the direction of the EOF (Figure 1-2B). It is therefore
necessary to reverse the polarity of the electrodes in the CE setup to ensure the elution of the
cationic micelles and consequently the uncharged solutes through the detection window.
21

Figure 1-2. Migration of uncharged compounds in MEKC using A) anionic and B) cationic pseudostationary phases. C) Schematic diagram of separation of molecules depending on S1 and S2 differential partitioning into the pseudostationary phase
Uncharged solutes: As in chromatography, the retention factor, k', in MEKC is defined as
the ratio of the number of moles of solute in the micellar pseudostationary phase, nmc, and that in
the bulk aqueous phase, naq. The retention factor is directly proportional to the micelle-water
partition coefficient, Pmw, and the phase ratio, Ф, by
22
k'=aq
mc
nn = PmwФ (1-10)
The retention factor in MEKC can be determined from migration time data using Eq 1-11.
k' =
⎟⎟⎠
⎞⎜⎜⎝
⎛−
−
mc
reo
eor
ttt
tt
1 (1-11)
where teo is the elution time of an unretained solute and tmc is the migration time of micelles. This
is very similar to the equation for the retention factor in conventional chromatography, with the
exception of the additional term (1-tr/tmc) in the denominator. This term indicates the existence of
an elution window, because the “stationary” phase in MEKC is actually mobile. If tmc approaches
infinity (i.e., stationary micelles), the extra term in the denominator is omitted and the retention
factor equation becomes the same as that in conventional chromatography.
Charged solutes: In addition to partitioning into micelles and migrating at the micellar
mobility, charged compounds possess electrophoretic mobilities of their own in the bulk aqueous
solvent. As a result, the observed retention time also includes the time that solute migrates
electrophoretically in the bulk aqueous phase, to. In calculating the retention factor, this
electromigration time should be taken into account:
k' =
⎟⎟⎠
⎞⎜⎜⎝
⎛−
−
mc
ro
or
ttt
tt
1 (1-12)
Resolution: The fundamental resolution equation for uncharged solutes in MEKC has the
same format as that for conventional chromatography, which includes three terms related to
efficiency, selectivity, and retention. In addition there is a fourth representing the existence of an
elution window:
23

R =
⎥⎥⎥⎥⎥
⎦
⎤
⎢⎢⎢⎢⎢
⎣
⎡
′⎟⎟⎠
⎞⎜⎜⎝
⎛+
⎟⎟⎠
⎞⎜⎜⎝
⎛−
⎟⎟⎠
⎞⎜⎜⎝
⎛′+
′⎟⎠⎞
⎜⎝⎛ −⎟⎟⎠
⎞⎜⎜⎝
⎛
12
2
1
1
11
4k
tttt
kkN
mc
eo
mc
eo
αα (1-13)
Again, in the case of stationary micelles (i.e., if tmc ~ ∞), the fourth term drops out and the
equation is identical to that in conventional chromatography.
Surfactant concentration: The primary role of surfactant concentration is to adjust the
retention factor to within the optimum range for better resolution. The relationship between
retention factor, k', and surfactant concentration can be described as follows:
k' = ( )( ) mw
sf
sf PCMCC
CMCC×
−−−
νν
1 (1-14)
where ν is surfactant molar volume; Csf is the total surfactant concentration; CMC is the critical
micelle concentration; and Pmw is the partition coefficient of a solute between an aqueous phase
and micelles. At low micelle concentrations, the second term in the denominator becomes
negligible and a linear relationship between the retention factor and surfactant concentration can
be described as follows:
k' = Pmwν(Csf – CMC) (1-15)
Chiral Separation by CE
In a chiral separation, a chiral selector (e.g., a cyclodextrin) is used as the pseudostationary
phase instead of micelles.
The principle of chiral separation can be explained by the following two chemical
equilibria
E1 + CS E1CS (1-16) K1
E2 + CS E2CS (1-17) K2
24

where E1 and E2 are two enantiomers in a racemic mixture; CS is a chiral selector; and K1 and K2
are the binding constants between the chiral selector and the enantiomers, respectively. The
electrophoretic mobility (μ) of an enantiomer at a given concentration of the chiral selector is
expressed as
][1][
CSKCSKcf
++
=μμ
μ (1-18)
where μf and μc are the electrophoretic mobilities at the concentrations of the chiral selector at 0
and ∞, respectively; and [CS] is the equilibrium concentration of the chiral selector.
The relationship between the mobility difference (Δμ), or separation selectivity, and the
concentration of the chiral selector can be expressed by
( )( )( )][1][1
][
21 CSKCSKCSKcf
++Δ−
=Δμμ
μ (1-19)
As can be seen from equation 1-19, Δμ is proportional to the mobility difference of the racemate
in the free (μf) and totally complexed (μc) forms, and their binding constant difference (ΔK). No
chiral separation can be achieved if there is no complexation between enantiomers and the chiral
selector. In addition, the two enantiomers should bind to the chiral selector to different extents in
order to be separated. Therefore, the choice of a chiral selector is crucial for chiral separation,
because it controls three terms: K, ΔK, and (μf – μc). The other experimental factor that
influences Δμ is the selector concentration, [CS], which should be optimized in order to achieve
the deserved separation.
The resolution equation in CZE is also valid in chiral separation as
Rs = ⎟⎟⎠
⎞⎜⎜⎝
⎛
+Δ
eoavg
Nμμ
μ4
(1-20)
25

where N is the number of theoretical plates; μavg is the average electrophoretic mobility of the
two enantiomers; and μeo is electrophoretic mobility. Chiral resolution can be improved by
enhancing the capillary efficiency ( N ), maximizing separation selectivity (Δμ), optimizing
retention (μ), and controlling the EOF. In order to maximize Δμ, several parameters such as the
type and concentration of chiral selector, as well as the pH (for ionizable solutes) must be
optimized. Other experimental conditions, such as the buffer ionic strength and temperature can
also play roles through their effects on retention separation, as suggested in Eq.1-20. Two
general migration schemes are recognized in CE: co-electroosmotic flow (co-EOF), where the
ions and EOF migrate in the same direction as the EOF, and counter electroosmotic flow
(counter-EOF), where the ions migrate in the opposite direction to the EOF.
Figure 1-3. Migration schemes for cationic enantiomers in CE using cyclodextrins (CDs) as chiral selectors A) co-EOF, B) counter-EOF. μs = electrophoretic mobility of the free form of enantiomer; μCD = electrophoretic mobility of an anionic CD
Figure 1-3 shows diagrams of these two schemes for positively charged enantiomers. In
the case of co-EOF, for example, basic racemates are positively charged at a lower pH range and
26

there is a weak EOF from the anode to the cathode. The co-EOF setup has been the most
commonly used scheme for separations of basic racemates with different types of chiral selectors.
In the counter-EOF case, however, higher resolution can be achieved as the (μavg + μeo) in the
denominator of the resolution equation becomes smaller. According to Eq. 1-20, higher
resolution is achieved if the analytes migrate in the direction opposite to the EOF. This is
achieved at the expense of longer analysis times. In certain situations, chiral separation can be
achieved by controlling the EOF even when other parameters, such as selector concentration of
pH are not at optimum values.
Capillary Isotachophoresis (ITP)
This technique uses a discontinuous buffer system. The sample is sandwiched between a
leading and a terminating electrolyte having higher and lower mobilities that the analytes,
respectively. After voltage is applied, a non-uniform electric field is established in the capillary.
Analytes and the leading and terminating electrolytes start to migrate at different velocities,
eventually forming focused zones. When equilibrium is reached, all zones move at the same
velocity. The initial concentration of the analyte determines the length of the focused zone
(Khaledi 1998).
ITP is a nonlinear electrophoretic technique used in the separation of a variety of ionic
compounds, from small molecules and metal ions (Beckers 1995) to large molecules, like
proteins (Stowers et al. 1995). Unlike linear zone electrophoresis in which the separating solute
bands continually spread by diffusion or dispersion, ITP forms self-sharpening, adjacent zones of
substantially pure solute. In ITP a multianalyte sample is usually introduced between the leading
electrolyte (LE, containing leading ion) and the terminating electrolyte (TE, containing
terminating ion). The leading ion, the terminating ion, and the sample components must have the
same charge polarity, and the sample ions must have electrophoretic mobilities smaller than the
27
leading ion but larger than the terminating ion. After application of a fixed electric current,
sample components move forward behind the leading ion and in front of the terminating ion and
form discrete, contiguous zones in order of their electrophoretic mobilities. Then, following a
brief transient period where the discrete solute zones are formed, the ITP stack assumes a fixed
concentration profile with a constant velocity moving in the direction of the leader. The method
is self-resharpening, i.e., the stacked zones can quickly recover their shape after a dispersive
event.
Kohlrausch developed the basic theory of ITP 110 years ago, but it did not receive much
attention until the development of capillary electrophoresis in the 1970's. Since then, ITP, along
with zone electrophoresis (ZE) and isoelectric focusing (IEF), have become indispensable
analytical tools, especially for high resolution and rapid analysis of biological samples.
ITP is also an extremely powerful method to concentrate samples. No matter how low the
sample concentration is, it can be concentrated to a plateau concentration which, in the ideal case,
is described by the following equation:
⎟⎟⎠
⎞⎜⎜⎝
⎛++
⎟⎟⎠
⎞⎜⎜⎝
⎛=
RA
RL
B
ALA cc
μμμμ
μμ (1-21)
where A is an analyte, R is counterion, and L is leader ion.
Capillary Electrochromatography
This technique is considered a hybrid of LC and CZE, combining the separation efficiency
of CZE and the selectivity of LC. Voltage, rather than pressure, is used as the driving force for
the mobile phase. Because of the flat solvent front, the separation efficiency is improved. Like
micellar electrokinetic chromatography, the separation mechanism for neutral compounds is due
to analyte partitioning between the mobile phase and the stationary phase, whereas for charged
28
compounds, an additional parameter (electrophoretic mobility) must be taken into account. Both
packed columns and coated columns can be used.(Landers 1996)
Capillary Gel Electrophoresis
This technique is carried out in a capillary filled with a gel, which may or may not be
covalently bound to the capillary. Analytes separate due to a sieving mechanism. This method is
widely applied to the separation of compounds having very similar charge/size ratio.(Landers
1996)
Capillary Isoelectric Focusing
In this technique, analytes separate according to their isoelectric points. A typical CIEF
experiment is performed as follows. The capillary is filled with the sample solution containing
ampholytes (compounds that can act as either acid or base) having a range of pI values. One end
of the capillary is immersed in an acidic solution, and the other in a basic solution (anode and
cathode, respectively). After voltage is applied, ampholytes start to migrate and form a pH
gradient within the capillary. Analytes migrate in this pH gradient and focus at the positions
where their pI equals the pH. Once all the analytes reach their equilibrium positions, focused
analytes are moved along the capillary and detected by applying an external hydrodynamic
force.(Landers 1996)
Fluorescence Detection in CE
Background: When a molecule absorbs ultraviolet or visible radiation, a higher electronic
state is populated. There are a number of decay processes to repopulate the ground state; if the
molecule emits light, the radiation is termed “Fluorescence” (Figure 1-4). The wavelength of the
emitted radiation is longer (or lower energy) than that of the excitation radiation and is
characteristic of the compound of interest.
29

Figure 1-4. Energy level diagram for a typical molecule
A critical parameter in fluorescence is the fluorescence quantum yield (Фf), which is defined by
Фf = a
f
II
(1-22)
where If is the number of quanta emitted and Ia is the number of quanta absorbed. At low
concentrations, the fluorescence intensity (F) from an excited compound is linearly dependent on
the concentration of the compound as described
F = kIa(Фf)εcLV (1-23)
where k is Boltzman constant, ε is the absorbance coefficient for the compound, c is the
concentration of the compound, L is the path length of the cell, and V is the illuminated volume.
Although the fluorescence signal is pathlength dependent, the S/N ratio is not strictly
pathlength dependent. Background fluorescence and solvent Raman scattering are the major
contributors to the background signal. As a smaller-diameter capillary is used, the fluorescence
signal from a particular concentration of analyte decreases but so does the spectral background.
Thus, the reported fluorescence detection limits are the 10-100fM range for a wide range of
pathlengths.
30

Benefits of fluorescence detection: There are two major advantages of fluorescence
detection for CE, namely sensitivity and selectivity. Typically a fluorescence detector can
provide a minimum limit of detection that is 2 to 3 orders of magnitude better than that of an
absorbance detector. When a fluorescence measurement is performed, the observed signal is
compared to a sample that does not fluorescence (the mobile phase), so that the background is
very close to zero. In contrast, when an absorbance detector is used, transmission of radiation of
the sample is compared to the transmission of the blank. At low concentrations, the difference
between the transmission of the sample and the transmission of the blank is small (i.e. the
background is not small, relative to the signal) and the error in the measurement can become
very significant.
When an absorbance detector is used to detect the compounds of interest in the detection
window, the measurement is based on a single wavelength, while two wavelengths are used for
fluorescence detection. If two compounds happen to co-migrate and have the same absorbance
wavelength but different emission wavelength (or does not fluoresce), a fluorescence detector
can readily provide useful analytical data.
Labeling of analytes: A large number of compounds (e.g. many aromatic compounds)
show native fluorescence, and direct quantification is very simple. If, however, a compound does
not exhibit native fluorescence, it may be very straightforward to generate a fluorophore by
reacting it with a fluorogenic reagent (Bardelmeijer et al. 1997). This technique is commonly
used in the determination of the concentration of amino acids, carboxylic acids and similar
compounds. The detection of amino acids is an especially good example of this technique. Pre-
column derivatization can provide a fluorophore for all of the common amino acids, while only
31

three (phenylalanine, tryrosine and tryptophan) exhibit native fluorescence, this fluorescence
detection of amino acids via their fluorescent derivatives is very commonly used.
Conductivity Detection in CE
Basic Principles
In conductivity detection, the solution resistance R(Ω) is calculated from its conductance
G(S), defined as G = 1/R. The value for G may also be determined from the ratio of the specific
conductance κ (S cm-1) and the cell constant kcell (cm-1) and can be given by (Guijt et al. 2004)
cellkG κ= (1-24)
In a conductometric cell, it is impossible to measure only R, since the electronic measurement
setup will effectively be network of capacitors and resistors. To correct for differences between
different measurement setups, the cell constant is used for determination of G.
There are several important aspects which characterize conductivity detection in CE.
Signal response in conductivity detection is principally related to the equivalent conductivity of a
solute. Analyte ions displace background co-ions during electrophoretic separations by
equivalent to their charge. Thus, the response arises from the difference in conductivity between
the analytes and the background electrolyte (BGE) co-ions. For optimum S/N ratio, the
conductivity difference between the analyte and the electrolyte must be as large as possible.
There are two ways to achieve the above condition. In the first, the sample ion zones
exhibit conductivities larger than the BGE. Thus, positive analytical response signals are
obtained even at equal concentrations of analyte and electrolyte co-ions, but this gain in response
gives peak asymmetry. In the second case, electrolyte systems with matching equivalent
conductivities of the sample ions and BGE co-ions are used. A higher ionic strength of the
sample zone compared to the electrolyte is, however, required to obtain a positive analytical
32

response. On the contrary, this counteracts the general principles of CE, which require the use of
electrolytes with a higher ionic strength compared to the sample zone in order to take advantage
of electrostacking effects. An efficient way to solve this contradiction is the use of amphoteric
buffers (Beckers 2003). These buffers produce electrolyte systems with low background
conductivities and can thus be used at relatively high ionic strengths. As a consequence,
electrodispersive effects are reduced, despite mismatching electrophoretic mobilities of buffer
co-ions and analytes.
Contactless Conductivity Detector (CCD)
Although several commercial instrument manufacturers intended to market CE’s with
conductivity detectors, only one supplier introduced an end-column conductivity detector
(Crystal CE from Thermo CE) (Haber et al. 1998). The instrument uses a specifically designed
detection cell (wall jet arrangement) with a fixed capillary to ensure constant detection
conditions. However, problems can arise from the direct contact of the separation electrolyte
with the measuring electrode, as contamination of the electrodes may occur from electrolyte
additives or sample components. Furthermore, the capillary set is expensive because of the
special alignment with the detection cell. Other ambitious instrumental attempts, such as
suppressed conductivity detection for CE unfortunately did not become commercially available
products (Dasgupta & Bao 1993). In order to avoid the aforementioned obstacles with contact
conductivity detectors, contactless conductivity detectors offer some remedies.
The detection signal is not obtained transversally across the capillary, but rather in the
longitudinal dimension (Figure 1-5). The major perspective of this technique is that there is
much less limitation with respect to the inner diameter of the capillary compared to the
techniques presented in the 1970s for isotachophoretic purposes. Thus, a contactless conductivity
33

detector can be used with capillaries having small inner diameters and in miniaturized
instrumentation, such as in chip-based separation systems.
Figure 1-5. Schematic diagrams of conductivity detectors. A) Contact detector based on Thermo Crystal 1000. B) CCD using two tubular electrodes. The electrode length, l, and the gap between the electrodes, d, are indicated (top) and the simplified equivalent circuitry (down)
In a capacitively coupled contactless conductivity detector, two stainless steel tubes which
act as the electrodes are placed around a fused-silica capillary in a certain distance from each
other (Figure 1-5B). By applying an oscillating frequency in the range between 20 and 900 kHz,
a capacitive transition occurs between the actuator electrode and the liquid inside the capillary.
After having passed the detection gap between the electrodes, a second capacitive transition
between the electrolyte and the pick-up electrode occurs. Thus, this scheme represents a series
combination of a capacitor, an ohmic resistor, and a second capacitor. By using suitable
amplifier electronics, conductivity changes of the electrolyte inside the capillary can be
monitored. Usually, the electrodes are placed on an insulated socket to ensure a rigid
construction with a constant electrode distance. The socket is then shielded by being placed in a
grounded metal housing. To reduce noise and capacitive leakage, especially when the electrodes
are positioned very close to each other, a grounded shielding, usually made of a thin metal sheet
or foil, can be placed between the electrodes.
34

Nitric Oxide in Living Organisms
Nitric oxide (NO) was identified in 1987 as an endothelial-derived relaxing factor (EDRF)
causing vasodilatation in smooth muscles (Ignarro et al. 1987), and it has been shown to
participate in modulation of neural functions in the brain, immune defense, and learning and
memory (Garthwaite & Boulton 1995, Nathan & Shiloh 2000, Katzoff et al. 2002).
Enzymatically produced NO is synthesized from L-arginine and oxygen, with L-citrulline as a
co-product. Nitric oxide synthase (NOS) catalyzes the reaction, and various co-factors such as
NADPH, flavin mononucleotide (FMN), flavin adenine dinucleotide (FAD), tetrahydrobiopterin
(BH4), and calcium/calmodulin (Ca2+/CaM) are involved (Murad 1999).
As depicted in Figure 1-6, the physiological chemistry of NO and NO-derived species
includes many interrelated and interdependent processes (Fukuto 2000). In oxygen-containing
aqueous solutions, nitric oxide scarcely produce nitrate; however, nitric oxide gas reacts with
oxygen to form NO2 gas, which dimerizes to N2O4, subsequently yielding both nitrite and nitrate
(Ignarro et al. 1993). The oxidation of NO by O2 to NO2- in an aqueous system is written as
follows:
4NO + O2 + 2H2O → 4NO2- + 4H+ (1-25)
The rate equation for the loss of NO from reaction (1-25) is –d[NO]/dt = 4k[NO]2[O2] with
k = 2×10⁶ M-2s-1, which means NO degradation in an aerobic, aqueous solution is not linear with
respect to the NO concentration (Lewis & Deen 1994). For example, assuming O2 concentrations
around 200μM, a 10μM solution of NO degrades to half its original concentration in about 1
minute whereas a 10nM solution takes over 70 hours. This is true for NO in pure aqueous
solutions, but in the presence of biological tissues the half-life of NO is 3~5 seconds. This
difference can be attributed to many chemical interactions in cells or tissues with oxygen,
superoxide anion, other oxygen-derived radicals, and oxyhemoproteins (Ignarro 1990). In
35
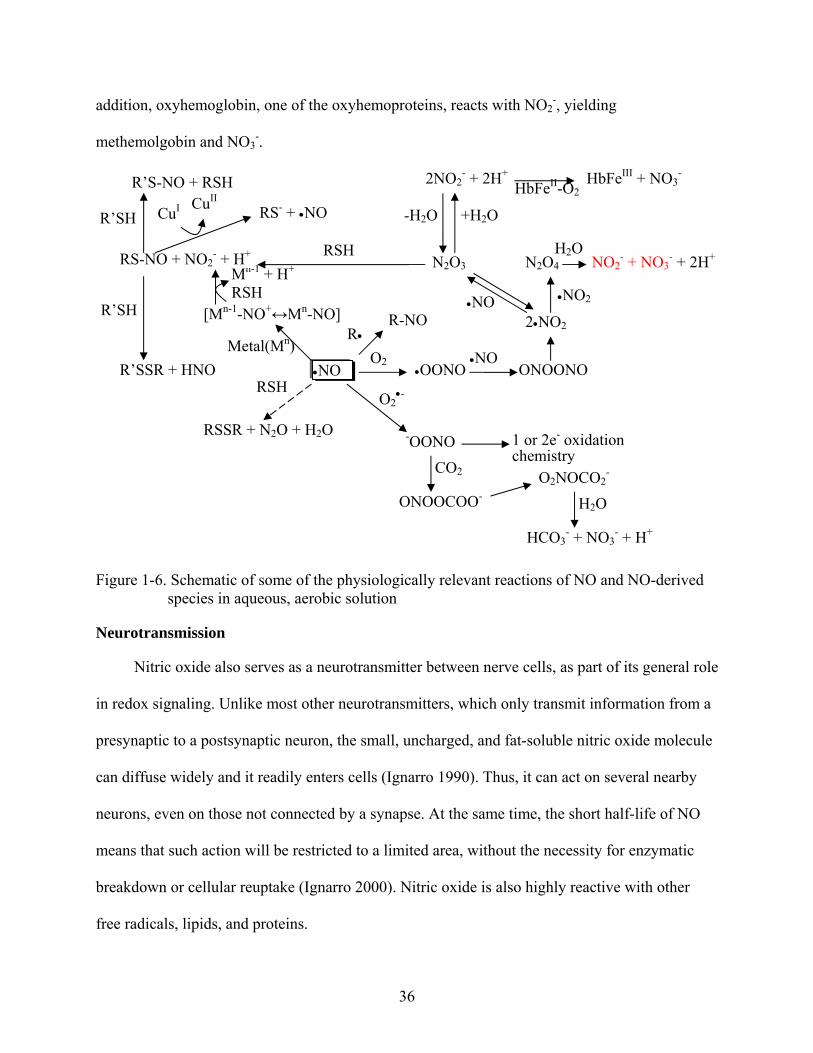
addition, oxyhemoglobin, one of the oxyhemoproteins, reacts with NO2-, yielding
methemolgobin and NO3-.
Mn + H+ -1
RSH
RSH
RSH
R’SH
CuI CuII R’SH
Metal(Mn) R•
H2O
O2•-
•NO
HbFeII-O2
•NOO2•NO •OONO ONOONO
2•NO2
N2O4 NO2- + NO3
- + 2H+N2O3
2NO2- + 2H+
R-NO
-OONO 1 or 2e- oxidation chemistry
ONOOCOO-O2NOCO2
-
HCO3- + NO3
- + H+
HbFeIII + NO3-
RS-NO + NO2- + H+
R’SSR + HNO
CO2
R’S-NO + RSH
RS- + •NO
RSSR + N2O + H2O
+H2O-H2O
[Mn-1-NO+↔Mn-NO]
H2O
•NO2
Figure 1-6. Schematic of some of the physiologically relevant reactions of NO and NO-derived species in aqueous, aerobic solution
Neurotransmission
Nitric oxide also serves as a neurotransmitter between nerve cells, as part of its general role
in redox signaling. Unlike most other neurotransmitters, which only transmit information from a
presynaptic to a postsynaptic neuron, the small, uncharged, and fat-soluble nitric oxide molecule
can diffuse widely and it readily enters cells (Ignarro 1990). Thus, it can act on several nearby
neurons, even on those not connected by a synapse. At the same time, the short half-life of NO
means that such action will be restricted to a limited area, without the necessity for enzymatic
breakdown or cellular reuptake (Ignarro 2000). Nitric oxide is also highly reactive with other
free radicals, lipids, and proteins.
36

It is conjectured that this process may be involved in memory through the maintenance of
long-term potentiation (LTP) (Katzoff et al. 2002). Nitric oxide is an important non-adrenergic,
non-cholinergic (NANC) neurotransmitter in various parts of the gastrointestinal tract, and it
causes relaxation of the gastrointestinal smooth muscle (Boeckxstaens & Pelckmans 1997).
Dietary nitrate is also an important source of nitric oxide in mammals. Green, leafy
vegetables and some root vegetables have high concentrations of nitrate. When eaten, nitrate is
concentrated in saliva (about 10 fold) and is reduced to nitrite on the surface of the tongue by a
biofilm of commensal facultative anaerobic bacteria (Lundberg et al. 2004). This nitrite is
swallowed and reacts with acid and reducing substances in the stomach (such as ascorbate) to
produce high concentrations of nitric oxide. The purpose of this NO production is thought to be
prevention of food poisoning by both sterilization of swallowed food and maintenance of gastric
mucosal blood flow. A similar mechanism is thought to protect the skin from fungal infections,
where nitrate in sweat is reduced to nitrite by skin commensal organisms and then to NO on the
slightly acidic skin surface (Lundberg et al. 2004).
Vasodilation
Nitric oxide is of critical importance as a mediator of vasodilation in blood vessels.
Release of NO is induced by several factors, and once synthesized, it results in phosphorylation
of several proteins that cause smooth muscle relaxation. The vasodilatory actions of nitric oxide
play a key role in renal control of extracellular fluid homeostasis and are essential for the
regulation of blood flow and blood pressure (Yoon et al. 2000).
Phosphorylation
Nitric oxide, a highly reactive free radical, then diffuses into the smooth muscle cells of the
blood vessel and interacts with soluble guanylate cyclase to stimulate generation of the second
messenger, cyclic GMP (3’,5’ guanosine monophosphate), from guanosine triphosphate (GTP).
37
The soluble cGMP activates cyclic nucleotide dependent protein kinase G (PKG), which
phosphorylates a number of proteins that regulate calcium concentrations, calcium sensitization,
cell hyperpolarization through potassium channels, and actin filament and myosin, dynamic
alterations to result in smooth muscle relaxation (Lincoln et al. 2006).
Immune System
Macrophages, certain cells of the immune system, produce nitric oxide in order to kill
invading bacteria. In this case, the nitric oxide synthase is inducible NOS (iNOS). Under certain
conditions, this can backfire. For example, fulminant infection (sepsis) causes the inducible
isoform of nitric oxide synthase to be expressed, resulting in excess production of nitric oxide by
macrophages, leading to vasodilatation, probably one of the main causes of hypotension in sepsis
(Victor et al. 2004).
Measurement of the Activity and Concentration of Nitric Oxide and Its Metabolites
Among the various analytical methods for detection of NO, major four approaches are
discussed: (1) separation techniques including CE coupled with various detectors; (2) optical
methods including fluorescence microscope; (3) electrochemical methods including cyclic
voltammetry, amperometric sensors, and analyte-selective exchange potentiometric sensors; and
(4) immunohistochemistry and in situ hybridization.
Separation techniques: Capillary electrophoresis coupled with laser induced fluorescence
(LIF) detection provides low detection limits, high efficiency, and ultra small sample
consumption, and thus allows single cell analysis (Lapainis et al. 2007, Miao et al. 2005). CE-
LIF has been successfully employed to measure NO directly in single neurons in Lymnaea
stagnalis by derivatizing NO with 4,5-diaminofluorescein (DAF-2) (Kim et al. 2006). In addition
to measuring NO itself, CE-LIF has been applied for measuring NOS-related metabolites in
single cells. Arginine-to-citrulline (Arg/Cit) concentration ratios have identified several neurons
38

and neuronal structures in the CNS of Lymnaea stagnalis and Aplysia californica as nitrergic, or
presumed nitrergic (Moroz et al. 2005, Floyd et al. 1998). Cit can be converted back to Arg via
the intermediate argininosuccinate (ArgSuc). ArgSuc levels in single neurons of A. californica
have been measured and compared to Arg and Cit levels (Ye et al. 2007). Furthermore, amino
acids, including L-arginine and its metabolites in human serum plasma (Causse et al. 2000) and
microdialysis samples, have been analyzed by CE-LIF (Powell & Ewing 2005).
Capillary electrophoresis coupled with conductivity has been employed to analyze the
oxidative products of NO: nitrite (NO2−) and nitrate (NO3
−). In the CNS of Pleurobranchaea
californica NO2− and NO3
− levels vary from millimolar levels in nitrergic neurons to
undetectable levels in many NOS-negative neurons (Moroz et al. 1999). In rat dorsal root ganglia,
endogenous levels of nitrate (231μM) and nitrite (24-96μM) were found (Boudko et al. 2002).
These concentrations exceeded those previously found in neuronal tissue homogenates using
different techniques.
Microchip CE with electrochemical (EC) detection has been developed to determine nitrite
by direct amperometric detection, following a reduction of nitrate to nitrite by Cu-coated Cd
granules (Kikura-Hanajiri et al. 2002). The utility of this method was demonstrated by
monitoring the amount of nitrate and nitrite produced from 3-morpholinosydnonimine (SIN-1), a
metabolite of the vasodilator molsidomine and a nitric oxide-releasing compound.
Ultraviolet absorption is the traditional way to quantify analytes, and it is the common CE
detection mode for the measurement of NO metabolites in biological samples. UV absorbance
(214nm) detection was first used with CZE to detect nitrate and nitrite simultaneously in
biological samples (Meulemans & Delsenne 1994). Also, the use of CE in the measurement of
nitrite and nitrate in human urine was demonstrated by Morcos and Wiklund, who found that
39
hydrodynamic sample injection was free from the interference of urine concentration, pH,
sodium, and chloride observed when electrokinetic injection was used (Morcos & Wiklund
2001). Recently, the high-throughput determination of nitrite and nitrate in biological fluids
using an electrophoretic lab-on-a-chip (microchip capillary electrophoresis, MCE) technique was
developed (Miyado et al. 2008). The addition of a zwitterionic additive, 2% (w/w) 2-(N-
cyclohexylamino)ethane sulfonic acid (CHES), into the running buffer reduced the adsorption of
protein onto the surface of channel and allowed complete separation of nitrite and nitrate in
human plasma within 1 min. Furthermore, nitrate levels were monitored in the rat vitreous cavity
using in vivo low-flow push-pull perfusion sampling and the results showed a significant
difference in different locations (Pritchett et al. 2008). Infusion of N(G)-nitro-L-arginine methyl
ester (L-NAME), a NOS inhibitor, with physiological saline led to a significant decrease (35%)
in the observed nitrate level.
Optical methods: Intracellular imaging of NO in biological systems has been performed
using different types of fluorescent indicators probed via fluorescence microscopy. With the high
sensitivity of fluorescent dyes, fluorescence microscopy provides the advantages of high
temporal, spatial and three-dimensional resolution (Ye et al. 2008). Since NO does not fluoresce
itself, the key to NO fluorescence imaging is the use of chemical probes with a direct, fast,
sensitive and selective response. For this purpose, many fluorescent dyes have been designed and
applied to NO measurements in biological systems. A group of probes based on o-
phenylenediamine indicators are the most widely used, for example, the diaminofluoresceins
(DAFs). The two aromatic vicinal amine groups of DAF react with NO in the presence of O2 to
form a highly fluorescent triazole product (Nagano & Yoshimura 2002), which has been used in
many NO studies including cells (Kojima et al. 1999, Saini et al. 2006, Yukawa et al. 2005), sea
40

urchin gametes (Kuo et al. 2000), and cultured cell lines (Arundine et al. 2003, Pereira-
Rodrigues et al. 2005).
There are also metal-based NO sensors that work by the mechanism of spin exchange or
selective ligand dissociation. Spin exchange utilizes the activation mechanism of guanylate
cyclase (GC) with NO. In GC, the imidazole group of the histidine residue coordinates to the
heme-iron, but NO binds to the heme-iron more tightly, thus displacing the imidazole group and
activating the enzyme (Soh et al. 2001). The probe consists of 2,2,6,6-tetramethylpiperidine-N-
oxyl (TEMPO) labeled with acridine to imitate the imidazole moiety and N-
dithiocarboxysarcosine (DTCS)-Fe(II) mimic the heme-iron complex. Acridine fluoresces itself,
but its fluorescence is quenched in the acridine-TEMPO complex. When the NO interacts with
the Fe(II) in the DTCS-Fe(II), the fluorescence from the acridine moiety is recovered. Also, the
copper fluorescein complex (CuFL) shows NO-triggered fluorescence enhancement by a
different mechanism (Lim et al. 2006). NO reduces the Cu(II) of CuFL to Cu(I), forming NO+,
which immediately turns on the fluorescence. NO produced in live neurons and macrophages
was monitored in a concentration- and time-dependent manner.
Furthermore, genetically encoded fluorescent proteins capable of reacting with NO have
been introduced (Namiki et al. 2005, Pearce et al. 2000, Sato et al. 2006). Interestingly, a
fluorescent cyclic guanosine monophosphate (cGMP) indicator protein, named CGY, was
developed. By connecting CGY to soluble guanylyl cyclase (sGC) to form chimera proteins
(NOA-1) in the cells being investigated, in nanomolar levels of NO were measured in vascular
endothelial cells (Sato et al. 2005). There was 1nM NO basal production in each endothelial cell
and a 0.5nM increase with physiological stimuli, such as vasoactive hormone, or with a shear
stress to mimic the blood stream.
41
Electrochemical methods: Several electrochemical techniques can be employed to
measure NO, but the amperometric and voltammetric methods have been the most popular.
Amperometry monitors the redox current in the picoampere range produced by NO oxidation at a
fixed potential. Fast-scan cyclic voltammetry (FSCV) is performed by holding the
microelectrode at a constant potential versus a reference electrode, followed by a rapid increase
in potential, and an immediate return back to the holding potential (Kita & Wightman 2008).
With a response time of less than a few seconds and high sensitivity, these methods provide fast,
quantitative measurement of small fluctuations in NO concentration.
Microelectrodes have been used to elucidate a number of neurobiological functions,
including neurotransmission processes and mechanisms at single cell levels. Hulvey and Martin
designed a microfluidic device that utilizes a reservoir-based approach for endothelial cell
immobilization and integrated embedded carbon ink microelectrodes for the detection of
extracellular NO release (Hulvey & Martin 2009). Also, the advantages of platinized carbon-
fiber microelectrodes for the direct and in situ electrochemical detection of NO released by
neurons in rat cerebella slices were examined (Amatore et al. 2006). Furthermore, different types
of carbon fibers (Textron, Amoco, Courtaulds) and carbon nanotubes covered with Nafion/o-
phenylenediamine (o-PD) were evaluated for NO measurement in the presence of major
interfering molecules in the brain (ascorbate, nitrite and dopamine) (Santos et al. 2008). With
continued efforts to improve the sensitivity, selectivity and reliability of the NO-sensitive
electrodes, these NO sensors will be able to monitor NO production continuously and in real-
time at the cellular level.
Immunohistochemistry: The nicotinamide adenine dinucleotide phosphate diaphorase
(NADPH-d) histochemical technique has been combined with the immunohistochemical
42

visualization of various specific components of the NO signaling pathway, such as NOS,
citrulline (Anctil et al. 2005), and cGMP. These studies have produced a wealth of data on
various signaling functions for NO in the central nervous systems and peripheral tissues of the
main bilaterian vertebrate and invertebrate animal groups (Moroz 2001). Due to the ability of
NOS to transfer electrons from the NADPH electron donor to a competitor tetrazolium salt,
NADPH-d activity can be used as a histochemical marker for NOS activity in vertebrate and
invertebrate tissue preparations. This technique, which consists of the conversion of a soluble
tetrazolium salt to an insoluble visible formazan, remains one of the most convenient procedures
for the screening of NOS-containing cells (Cristino et al. 2008).
NADPH-d labeling has been used for the study of central motoneurons in the predatory
Pleurobranchaea californica and in peripheral putative sensory cells of the herbivorous Aplysia
(Moroz & Gillette 1996). In both species NO also plays a critical role in memory formation
(Katzoff et al. 2002). Also, NADPH-d activity has also been observed in putative ectodermal
sensory cells of Aglantha tentacles. The neurites of these cells run very close to the swimming
pacemaker and probably activate slow swimming in Aglantha (Moroz et al. 2004). Although,
NADPH-d label is very useful for localizing NOS activities, it is recommended that more than
one procedure be used, because antibodies which recognize invertebrate NOS isoforms are not
yet available.
Invertebrates for Neurochemistry Analysis
Phylogeny is the fundamental product of evolution and a phylogenetic hypothesis is
essential to understand biological phenomena. Much of this research has relied upon
morphological characters, genes, and protein products contained within animal cells. The
phylogeny presented here is a relatively conservative guess based upon various published studies
(Schierwater et al. 2009b, Philippe et al. 2009, Dunn et al. 2008, Claus 2008). As shown in
43

figure 1-7, there are quite a few unresolved branches, and therefore metabolomic information on
marine organisms by studying the signaling molecules will help to know the relationship
between animals.
Figure 1-7. Phylogenetic tree of Metazoan relationships. Dashed lines indicates the controversial data analysis.
Cnidaria
Cnidaria is a phylum containing most of animals found exclusively in marine
environments and their distinguishing feature is the presence of cnidocytes, specialized cells that
they use mainly for capturing prey (Claus 2008). Their bodies of cnidaria consist of mesoglea, a
non-living jelly-like substance, sandwiched between two layers of epithelium that are mostly one
cell thick (Kozloff 1990a). They have two basic body forms: swimming medusae and sessile
polyps, both of which are radially symmetrical with mouths surrounded by tentacles that bear
cnidocytes. Both forms have a single orifice and body cavity that are used for digestion and
respiration. Many cnidarian species produce colonies that are single organisms composed of
44
medusa-like and/or polyp-like zooids. Cnidarians' activities are coordinated by a decentralized
nerve network and simple receptors. Several free-swimming Cubozoa and Scyphozoa possess
balance-sensing statocysts, and some have simple eyes. All cnidarians reproduce sexually. Many
have complex lifecycles with asexual polyp stages and sexual medusae, but some omit either the
polyp or the medusa stage.
Over the past twenty years, a number of biochemical studies have begun to document the
presence of non-peptidergic neurotransmitters in the Cnidaria (Kass-Simon & Pierobon 2007).
Among the hydrozoans, H. vulgaris was found to contain dopamine and noradrenaline;
Chlorohydra viridissima contained dopamine, norepinephrine, and 5-HT; and in Polyorchis,
dopamine was identified in nerve-rich tissue by HPLC and gas chromatography/mass
spectrometry (Chung et al. 1989).
A number of studies have now produced strong biochemical evidence for the presence of
receptors to glutamate, gamma-aminobutyric acid (GABA), and glycine in cnidarians. Receptor
binding studies on H. vulgaris have shown that glutamate binds to crude membrane fractions
(Bellis et al. 1991). These studies gave the first indication of a putative glutamate receptor in
Hydra which may mediate an action independent of the glutathione (GSH) feeding response.
GABA receptors, whose biochemical and pharmacological properties compare with those of
mammalian ionotropic GABA receptors, have also been demonstrated in H. vulgaris (Pierobon
et al. 1995). The first invertebrate receptors to glycine have been observed and characterized in
membrane preparations from H. vulgaris (Pierobon et al. 2001).
Biochemical, histochemical, and physiological data for NO as a cnidarian intercellular
messenger have begun to accumulate. Biochemical studies give evidence for nitric oxide
involvement in the GSH feeding response of H. vulgaris (Colasanti 1997). In Aglantha, a high
45

level of nitrite was detected in the tentacles but not in the gonads or other predicted NOS-
negative areas. The level of nitrite in Aglantha tentacles exceeded the levels of nitrate,
suggesting a high background level of NO formation (Moroz et al. 2004).
In all, the accumulating biochemical findings, and the still sparse molecular data, are
consistent with the idea that peptides, the classical slow and fast transmitters, and nitric oxide
may be primary neuronal messengers in the Cnidaria.
Porifera
The sponges or poriferans are animals of the phylum Porifera. Their bodies consist of an
outer thin layer of cells, called the pinacoderm, and an inner mass of cells and skeletal elements,
called the choanoderm (kozloff 1990d). Sponges do not have nervous, digestive or circulatory
systems. Instead, most of these organisms rely on maintaining a constant water flow through
their bodies to obtain food and oxygen and to remove wastes, and the shapes of their bodies are
adapted to maximize the efficiency of the water flow. All are sessile aquatic animals and,
although there are freshwater species, most are marine species.
In a recent study, the Amphimedon genome was shown to contain 36 families of genes
known to encode proteins of the post-synaptic density (Sakarya et al. 2007). So, even though it
has no neurons, this sea sponge synthesizes an almost complete set of post-synaptic density
proteins. A comparison of the DNA sequences from the 36 sea sponge genes with the
homologous sequences from humans, Drosophila melanogaster (fruit flies) and Nematostella
vectensis (a cnidarian with a simple nervous system) revealed striking similarities between the
genes in all four species. This suggests that in the sea sponge these proteins interact in exactly
the same way as they do in the human post-synaptic density. Amphimedon has nearly all the
components required to make a post-synaptic density. Only a few of the human postsynaptic
46

density genes are missing from the sea sponge’s genome, in particular those encoding ion
channel receptors for the neurotransmitter glutamate.
Ctenophora
Ctenophores have no brain or central nervous system, but instead have a nerve network
that forms a ring around the mouth and is densest near structures such as the comb rows, pharynx,
tentacles, and the sensory complex furthest from the mouth (Kozloff 1990b). The largest single
sensory feature is the aboral organ at the opposite end from the mouth. Its main component is a
statocyst, a balance sensor consisting of a statolith, a solid particle supported on four bundles of
cilia, called "balancers", that sense its orientation. The statocyst is protected by a transparent
dome made of long, immobile cilia.
In Mnemiopsis, acetlycholine and beta-adrenergic mechanisms were observed in a study of
the pharmacological activities associated with luminescence control (Anctil 1985).
Placozoa
The Placozoa are the simplest in structure of all multicellular animals (Metazoa). They
consist of the single species, Trichoplax adhaerens. A common name does not yet exist for the
taxon; the scientific name literally means flat animals. Trichoplax are very flat creatures around a
millimeter in width, which lack any organs or internal structure (Schierwater 2005). They
comprise three cellular layers. Their top and bottom epitheloid layers are identical and possess
cilia used in locomotion.
Although Trichoplax has no nervous system, it has behavioural responses to environmental
stimuli, and sensitivity to the neuropeptide (Arg-Phe-NH2) RFamide has been reported
(Schuchert 1993). In the Trichoplax genome, DOPA decarboxylase and DBH-like
monooxygenase (which are involved in dopamine, noradrenaline and adrenaline synthesis in
adrenergic cells) and putative vesicular amine transporters (which are used for neurotransmitter
47

uptake) are present as well as putative neurotransmitter and neuropeptide receptors (Srivastava et
al. 2008). There are also four putative opsin genes, which possess a crucial lysine residue in the
seventh transmembrane domain and are thought to function in light reception. Eighty-five
members of the class 3 G-protein-coupled receptor (GPCR) family (unrelated to other GPCR
families by sequence), including putative metabotropic glutamate receptors, are also found.
Transmembrane proteins important in nerve conduction (multiple candidate ionotropic glutamate
receptors) and in neurotransmitter release and uptake (for example, sodium neurotransmitter
symporter) are encoded by the genome.
Mollusca
Molluscs are highly diverse in size, anatomical structure, behavior and habitat, and
representatives of the phylum live in a wide range of environments, including marine, freshwater,
and terrestrial biotopes (Kozloff 1990c). The phylum Mollusca is typically divided into nine or
ten taxonomic classes. Cephalopod, such as squid, cuttlefish and octopus, are among the most
neurologically advanced of all invertebrates. Either the giant squid or the colossal squid is the
largest known invertebrate species. The gastropods (snails and slugs) are by far the most
numerous molluscs in terms of classified species, and they account for 80% of the total number
of classified species.
Regarding the cephalopods, NO is an integral component in the complex mechanisms
implicated in the initiation and maintenance of the symbiont infection of the light organ of the
Hawaiian bobtail squid, E. scolopes (Davidson et al. 2004). The production of NO accompanies
light organ embryogenesis, reaching highest levels in the light organ of newly hatched animals,
and NO also regulates the number of bacteria. In addition, NO acts as a major signal molecule in
the molluscan nervous system (Moroz et al. 2000). It is involved in the activation of the motor
48

49
network of feeding in Aplysia and Pleurobranchaea and plays a critical role in the formation of
multiple memory processes in Aplysia (Katzoff et al. 2002).
Dissertation Overview
Chapter 2 describes the development of a CE-LIF for the detection of nitric oxide
metabolites, such as L-arginine and L-citrulline and other neurotransmitters. The method uses a
borate buffer with a surfactant to identify and quantify neurotransmitters in marine animals. In
addition, enantiomers of amino acids are analyzed by cyclodextrin (CD).
Chapter 3 presents the design and evaluation of conductivity systems for capillary zone
electrophoresis using a dynamic capillary coating technique. Application of these systems to the
analysis of nitrite and nitrate in complex samples such as Aplysia californica is demonstrated.
Chapter 4 describes nitric oxide signaling in Trichoplax adhaerens. The previously
developed CE systems are utilized for analyzing the NO-metabolites of Trichoplax. In addition,
results of behavior tests are described, in which NO donors are used to monitor the response to
the pharmacological applications.
Chapter 5 presents the total analysis of the NO metabolites of basal animals such as
sponges, ctenophores, cnidarians, and placozoa using CE-LIF/CCD.
Chapter 6 presents the comparative analysis of the NO metabolites of cephalopods,
including squid, nautilus, and Aplysia, using CE-LIF/CCD.

CHAPTER 2 DEVELOPMENT AND EVALUATION OF CE COUPLED WITH LASER-INDUCED FLUORESCENCE (LIF) DETECTION FOR THE ASSAY OF AMINO ACIDS AND
NEUROTRANSIMITTERS
Introduction
During the last decade, amino acid neurotransmitters have been the focus of considerable
attention in biomedical research, medical diagnostics, clinical chemistry, and the pharmaceutical
industry, because they play essential roles in control and regulation of various functions in the
central and peripheral nervous system (Boulat et al. 2001, Li et al. 2008, Poinsot et al. 2008,
Sheeley et al. 2005, Trapp et al. 2004, Ummadi & Weimer 2002, Xu et al. 2009). The most
studied amino acid neurotransmitters are glutamic acid (Glu), aspartic acid (Asp), gamma-
aminobutyric acid (GABA), glycine (Gly), taurine (Tau), arginine (Arg), and citrulline (Cit). As
the major excitatory neurotransmitters in the mammalian central nervous system (CNS), Glu and
Asp are present in more than half of all CNS synapses. This underscores their important
involvement in learning, memory, sleep, movement, and feeding (Rawls et al. 2006, Antzoulatos
& Byrne 2004). GABA, Gly, and Tau are the inhibitory neurotransmitters in the CNS
(Piepponen & Skujins 2001). In fact, as many as 10-40% of nerve terminals in the hippocampus
and cerebral cortex may use GABA as a neurotransmitter to transmit closure signals (Takayama
& Inoue 2004). Another inhibitory transmitter, Gly, plays key roles in postsynaptic inhibition,
sensorimotor function, and abnormal startle responses (Kopp-Scheinpflug et al. 2008). The
inhibitory amino acid Tau is an osmoregulator and neuromodulator (Saransaari & Oja 2006). In
addition, Arg and Cit are the key amino acids in the indicators of nitric oxide (NO) activity and
are important in a urea cycle (Moroz et al. 1999). Moreover, Arg is a metabolic precursor in the
formation of creatine, polyamines, the excitatory neurotransmitter L-glutamate, the
50

neuromodulator L-proline, the putative neurotransmitter agmatine, and the putative
immunomodulator, arginine-containing tetrapeptide tuftsin (Boudko 2007).
The development of microanalytical methods for assaying complex heterogeneous systems
is an essential and key step in our understanding of neuronal chemistry and functions. While
such signal molecules and related molecular markers have been well characterized in model
organisms (Drosophila and C. elegans) (Davies 2006, Strange 2003), little information exists
about the specific signaling molecules patterning the nervous system in many marine
invertebrate species. For some lineages, such as ctenophores, sponges, placozoa and even many
bilaterian phyla, such information does not exist at all (Srivastava et al. 2008, Sakarya et al. 2007,
Claus 2008, Dunn et al. 2008). Among the many different types of intercellular signaling
molecules, the gaseous radical nitric oxide is of appreciable interest because of its critical role in
modulation of neuronal activity (Namiki et al. 2005). Endogenous nitric oxide is a coproduct
with citrulline of the oxidation of arginine by NO synthase (NOS). Thus, analysis of the potential
signaling molecules in biological samples may provide insight into the nervous systems of
marine animals.
While the primary objective of this study involved the identification and characterization
of key potential signaling molecules of low molecular weight and their metabolites, our effort
was also focused on the analysis of D-Aspartic acid (D-Asp). This amino acid derivative acts as
a specific agonist at the N-methyl-D-aspartic acid (NMDA) receptor, and therefore mimics the
action of the neurotransmitter glutamate on that receptor (D'Aniello 2007). In contrast to
glutamate, NMDA binds to and regulates this particular receptor only, but not other glutamate
receptors. As such, we are interested in the activity of both D-Asp and Glu in these basal animals.
Especially, D-Asp is found in the central nervous system in a variety of animals, including
51

mammals (Sakai et al. 1998, D'Aniello 2007) and mollusks (Miao et al. 2006, Song et al. 2006).
In addition, D-Glutamic acid (D-Glu) naturally presents in many microbes (Glavas & Tanner
2001) as well as in plants and animals (Corrigan 1969, Kera et al. 1996). Kera et al. reported that
D-Glu may play a role in Aplysia central nervous systems (Quan & Liu 2003).
CE is one of the most powerful separation techniques known to date, because it provides
high separation efficiencies, short analysis times, low operation costs, small-volume
compatibility, and applicability to a wide variety of species, including inorganic compounds,
organic acids, proteins, peptides, amino acids, and neurotransmitters (Kostal et al. 2008, Xiayan
& Legido-Quigley 2008, Guzman et al. 2008). In order to detect amino acid neurotransmitters
and their enantiomers at the levels that are present in marine animals using CE, highly sensitive
detection methods such as LIF are very important. In CE, the LIF detector with a Helium-
Cadmium (HeCd) laser emitting at 325 nm is the one most frequently used. However, most of
the excitatory or inhibitory neurotransmitters in the CNS do not fluorescence when excited at
325 nm. Thus, they must be derivatized with a chromophore or a fluorophore to improve both the
selectivity and the sensitivity for their determination. Analyte derivatization in CE has been
performed pre-, on-, and postcolumn using a variety of reagents such as fluorescamine, 3-(4-
carboxybenzoyl)-2-quinolinecarboxyaldehyde (CBQCA), fluorescein 5-isothiocyanate (FITC),
and naphthalene-2,3-dicarboxaldehyde (NDA) (Quan & Liu 2003, Chen et al. 2005, Bergquist et
al. 1996). o-Phthalaldehyde (OPA) was chosen as the derivatization reagent in this work because
it is a fluorogenic reagent and reacts with analytes within a few seconds.
The aim of this study is to develop a robust CE-LIF method for the sensitive and selective
determination of amino acid neurotransmitters and their enantiomers in the marine animals after
derivatization with OPA. In our experiments, optimization of the derivatization and separation
52

conditions was carefully investigated. The optimized separation was based on MEKC using SDS
as a surfactant and also employing β-CD as a chiral selector.
Methods and Materials
Reagents
All solutions were prepared with Milli-Q water (Milli-Q filtration system, Millipore,
Bedford, MA) to minimize the presence of impurities. Borate buffer (30mM, pH 9.5) was used
for sample preparation. All solutions were filtered using 0.2μm membrane filters to remove
particulates. The buffers were degassed by ultrasonication for 10min to minimize the chance of
bubble formation. A 75mM OPA / β-mercaptoethanol (β-ME) stock solution was prepared by
dissolving 10mg of OPA in 100μL of methanol and mixing with 1mL of 30mM borate and 10μL
of β-ME. OPA and β-ME were stored in a refrigerator, and fresh solutions were made weekly.
Stock solutions (10mM) of amino acids and neurotransmitters were prepared by dissolving each
compound in the borate buffer. L-2-aminoadipic acid (Sigma), dissolved in 30mM borate buffer
(pH 9.5), was used as internal standard and made fresh for all experiments. Unless specified, all
chemicals were obtained from Sigma (St. Louis, MO) and were reagent quality or better.
CE Instrumentation
CE coupled with a ZETALIF detector (Picometrics, France) was used for the assay of
amino acids. The Picometrics ZETALIF detector is a single excitation LIF detector, which is
modular and external to the CE instrument. This detector is based on a confocal microscope
setup, where a ball lens concentrates the laser light into the capillary, and the fluorescence is
collected by the same ball lens which has a very high numerical aperture (Figure 2-1). The
emission is then passed through a series of filters and the fluorescence is then measured by a
photomultiplier tube (PMT). The use of a ‘ball lens’ is very useful because it allows the use of a
very stable excitation beam and the collection is better than without a ball lens using a simple
53

microscope (Rodat et al. 2008). In addition, this setup can be easily used with UV lasers. In this
work a multiline helium-cadmium laser (325nm) from Melles Griot, Inc. (Omnichrome®
Series56, Carlsbad, CA) was used as the excitation source. Before the PMT, the fluorescence
was filtered. All instrumentation and high-voltage CE power supply were controlled using a DAx
7.3 software.
Figure 2-1. Schematic optical layout of the fluorescence detection system
All experiments were conducted using a 75cm length of 50μm I.D. × 360μm O.D. fused
silica capillary (Polymicro Technologies, Phoenix, AZ). The 30mM borate and 30mM sodium
dodecyl sulfate (SDS) electrolyte (adjusted to pH 10.0 with NaOH) was used for a separation
54

buffer for amino acids analysis, and 15mM borate and 10mM beta-cyclodextrin electrolyte
(adjusted to pH 10.0 with NaOH) was used for a separation buffer for chiral analysis of both Glu
and Asp.
For pre-column derivatization method, 1μL of OPA was incubated at 20oC for 6 minutes in
a 0.5mL PCR tube with 18μL sample and 1μL internal standard. For separation steps, the
capillary inner wall was successively washed with 1M NaOH for 2mins, Milli Q water for 3mins,
and the separation buffer for 2mins by applying pressure (1900mbar) to the inlet vial. Then a
sample was loaded using electrokinetic injection (8kV for 12s). The separation was performed
under a stable 20kV voltage at 20˚C.
Data Analysis
Once an electropherogram was acquired, peaks were assigned by relative electrophoretic
mobility and confirmed by spiking corresponding standards into the sample. Five-point
calibration curves (peak area vs. concentration) of analytes were constructed for quantification
using standard solutions. The 3σ method was used to determine the limit of detection (LOD):
LOD = m
blankσ×3 2-1
where m is the slope of the calibration line and σblank is the standard deviation of the blank (n=5).
The reproducibility and accuracy of the method were evaluated by calculating relative standard
deviation (RSD) for each analyte. In order to obtain the peak area, a baseline is constructed and
subtracted using the derlim algorithm of DAx software version 7.3 (Van Mierlo Software
Consultancy, the Netherlands). A statistical data analysis is performed by Sigma Plot software
(SPSS, Inc., Richmond, CA).
55

Results and Discussion
Optimization of CE Separation Conditions
At first, CZE was used to separate OPA neurotransmitter derivatives because of its
simplicity and speed in practical applications. However, as shown in figure 2-2, complete
resolution of a mixture of amino acids was difficult in CZE, because the separation is critically
dependent on the charge-to-mass ratio of analytes. While CZE allowed resolution of Arg, Glu,
and Asp, the peaks for the others overlapped.
Figure 2-2. Electropherograms of standard amino acids (1µM). Separation was conducted in 50µm I.D. and 360µm O.D. capillary with 30mM borate, pH 9.4 at 20kV
A good alternative to CZE is offered by MEKC, in which the addition of a surfactant to the
running electrolyte provides a two-phase chromatographic separation medium, an aqueous phase
and a micellar pseudophase. This makes MEKC very attractive for the differentiation of analytes
with similar physico-chemical properties, particularly the amino acids (Iadarola et al. 2008).
Therefore, MEKC was employed in this research to separate the labeled amino acid
neurotransmitters.
Effect of surfactant concentration: SDS is an anionic surfactant that has been widely
used in MEKC for amino acid analysis (Paez et al. 2000, Siri et al. 2006, Tivesten & Folestad
56

1997, Zhu et al. 2005). Moreover, the concentration of surfactant has a significant effect on the
separation selectivity by adjusting the partition of analytes between the micellar pseudophase and
the aqueous phase. Thus the effect of SDS concentration on resolution was first examined in this
work. SDS was added to the borate buffer at several different concentrations above its critical
micelle concentration, including 10, 25, 30, and 50mM (Figure 2-3). Because the Arg peak was
not observed within the 20-minute migration time window, so it was necessary to record data
with extended time. The analyte separation clearly improved with increasing concentrations of
SDS, probably due to increased micelle analyte interaction, but when the concentration of SDS
was more than 50mM, amino acids could not be distinguished from the baseline. Also,
excessively high SDS concentrations (more than 50mM) resulted in longer migration times and
larger currents without significant improvement of separation. As a result, 30mM was finally
chosen as the optimized concentration of SDS used (Figure 2-3B).
Figure 2-3. Electropherograms of standard amino acids depending on A) various SDS concentrations and B) difference between 10 and 30mM SDS. Peaks: Citrulline (Cit), Serine (Ser), 5-Hydroxytryptophan (5-HTP), γ-Aminobutyric acid (GABA), Tyrosine (Tyr), Glycine (Gly), Taurine (Tau), Phenlyalanine (Phe), Dopamine (DA), Tryptophan (Trp), 3,4-dihydroxy-L-phenylalanine (L-DOPA), Internal standard (I.S.), Glutamate (Glu), Aspartate (Asp), Arginine (Arg), Octopamine (Oct), Serotonin (5-HT)
57

Effect of buffer pH: Different pH values of the running buffer can influence the mobility
of analytes by changing the charges on the analytes and the capillary wall. The influence of pH
values of boric acid buffer in the range of 9.4-10.0 was studied. It was found that increasing the
pH can significantly improve the resolution of these derivatives, especially for labeled Tyr and
GABA (Figure 2-4A). When the pH of borate buffer was 10.0, OPA labeled Tyr and GABA
were reasonably separated, but they migrated together at pH 9.4. Nevertheless, a further increase
of buffer pH prolonged the migration time and resulted in co-migration of Phe and DA.
Considering both the resolution and the analysis time for 16 deseired analytes, pH 10.0 was
adopted for the CE separation.
Figure 2-4. Electropherograms of standard amino acids. A) Depending on different pH conditions, 9.4 and 10.0, respectively. B) Optimized CE conditions: 30mM Borate, 30mM SDS, pH 10.0, 20kV
Influence of separation voltage: Under the above optimum conditions, the influence of
separation voltage (15-20 kV) was tested. It was found that sixteen OPA-labeled amino acid
neurotransmitters were baseline separated when the voltage reached 20 kV. But a further
increase in voltage resulted in a baseline fluctuation, whereas a decrease of voltage prolonged the
58
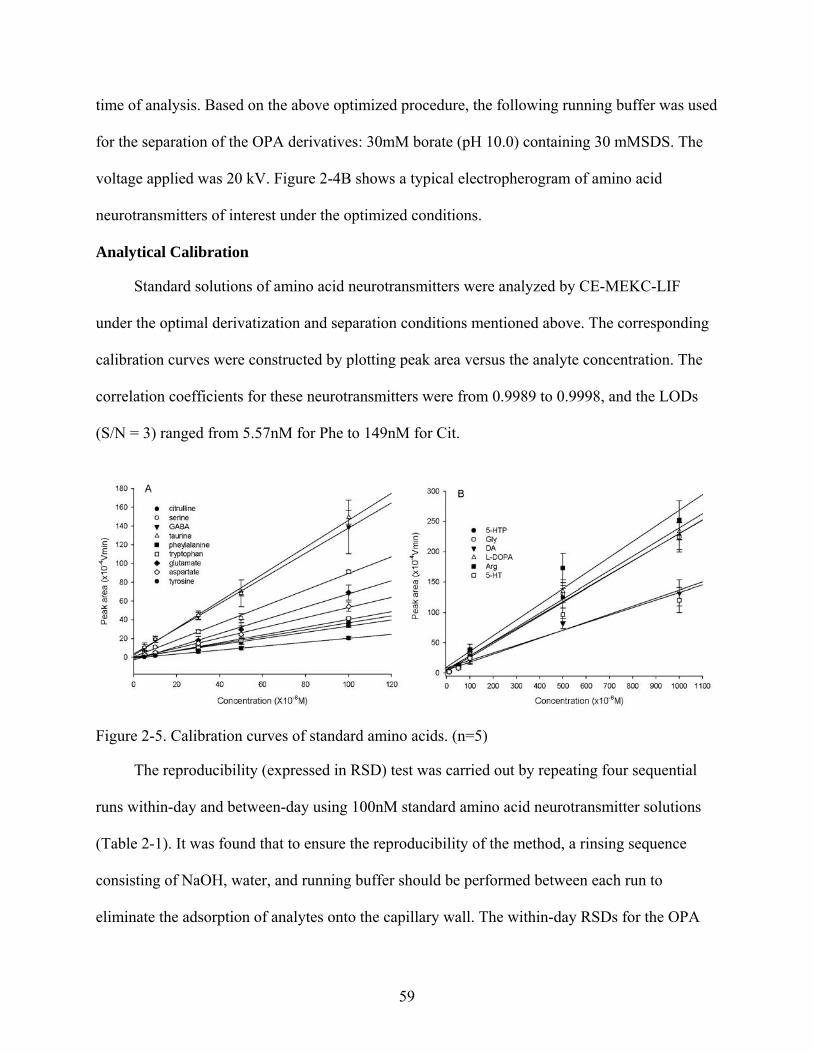
time of analysis. Based on the above optimized procedure, the following running buffer was used
for the separation of the OPA derivatives: 30mM borate (pH 10.0) containing 30 mMSDS. The
voltage applied was 20 kV. Figure 2-4B shows a typical electropherogram of amino acid
neurotransmitters of interest under the optimized conditions.
Analytical Calibration
Standard solutions of amino acid neurotransmitters were analyzed by CE-MEKC-LIF
under the optimal derivatization and separation conditions mentioned above. The corresponding
calibration curves were constructed by plotting peak area versus the analyte concentration. The
correlation coefficients for these neurotransmitters were from 0.9989 to 0.9998, and the LODs
(S/N = 3) ranged from 5.57nM for Phe to 149nM for Cit.
Figure 2-5. Calibration curves of standard amino acids. (n=5)
The reproducibility (expressed in RSD) test was carried out by repeating four sequential
runs within-day and between-day using 100nM standard amino acid neurotransmitter solutions
(Table 2-1). It was found that to ensure the reproducibility of the method, a rinsing sequence
consisting of NaOH, water, and running buffer should be performed between each run to
eliminate the adsorption of analytes onto the capillary wall. The within-day RSDs for the OPA
59

derivatives ranged from 1.2% for Arg to 2.89% for 5-HT in peak areas. The between-day RSDs
were found to be less than 4.9% for peak areas. The observation shows excellent reproducibility
of the migration times, and good reproducibility of the peak areas.
Table 2-1. Correlation coefficients, RSDs, and LOD Analyte r RSD (%, n=4) LOD (nM)
Within-day Between-day Peak area Peak area
Cit 0.9985 1.37 3.07 149 Ser 0.9963 1.64 3.55 62 5-HTP 0.9961 1.62 3.92 73 Tyr 0.9992 1.62 3.42 10.7 GABA 0.9991 2.06 3.37 76.1 Gly 0.9923 2.01 3.94 128 Tau 0.9953 1.98 3.63 95.8 Phe 0.9982 2.05 2.85 5.57 DA 0.9853 1.91 4.26 69.2 Trp 0.9959 2.17 2.91 7.14 Glu 0.9962 2.84 3.75 22.3 Asp 0.9972 2.73 3.38 16.5 Arg 0.9674 1.20 3.81 113 Oct 0.9562 1.42 4.89 48 5-HT 0.9213 2.89 3.67 85
Glu and Asp Enantiomer Separation
pH studies: Since the interactions between β-CD and OPA-derivatives are pH dependent,
various pHs were tested to optimize the separation of the Glu enantiomer. However, Asp
enantiomer showed less dependence on pH (data not shown). The L and D forms of Glu closely
migrated at pH 9.0, but they were resolved with increasing pH, and were completely separated at
pH 10.0 (Figure 2-6A). The hydroxyl groups of β-CD become negative in a basic condition, and
with a 20kV separation voltage the EOF is towards the negative electrode, while β-CDs move in
the opposite direction (Juvancz et al. 2008). Thus, the more an analyte interacts with the β-CD,
the slower the complex moves to the negative electrode. Figure 2-6B shows that the interaction
strength between β-CD and analytes are L-Asp > D-Asp > D-Glu > L-Glu.
60

Figure 2-6. Electropherograms of Glu and Asp enantiomers. A) Glu enantiomer separation depending on pH ranging from 9.0 to 10.0. B) 1μM of L-Glu and D-Asp, and 100nM of D-Glu and L-Asp at pH 10.0. C) Standard calibration curves. Samples were loaded using electrokinetic injection (8kV for 12s), and then analyzed under a stable 20kV voltage at 20oC in 50µm I.D. and 360µm O.D. capillary with 15mM borate and 10mM β-CD
Performance tests: Calibration curves with five points were constructed by injecting a
series of standard mixtures covering the tested concentration range (Figure 2-6C). Equations
were obtained by least-squares linear regression analysis of the peak area versus analyte
concentration. Table 2-2 summarizes the results of the determination of reproducibility regarding
accuracy, within-day and day-to-day precision assays and LOD. The intra-assay precision of the
method based on within-day repeatability was performed by replicate injections (n=4), where
61
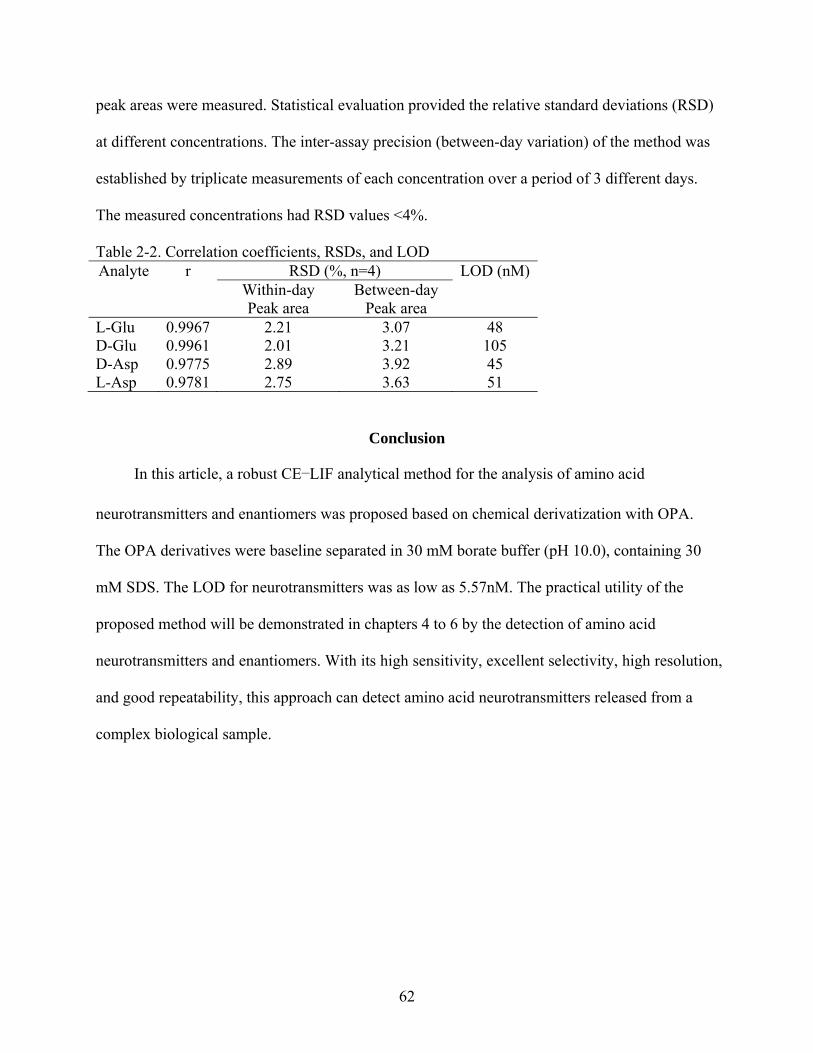
62
)
Analyte r RSD (%, n=4) LOD (nM)
peak areas were measured. Statistical evaluation provided the relative standard deviations (RSD
at different concentrations. The inter-assay precision (between-day variation) of the method was
established by triplicate measurements of each concentration over a period of 3 different days.
The measured concentrations had RSD values <4%.
Table 2-2. Correlation coefficients, RSDs, and LOD
Within-day Between-day Peak a k area
L-Glu 0.9967 48 rea Pea
2.21 3.07 D-Glu 0.9961 105 2.01 3.21 D-Asp 0.9775 2.89 3.92 45 L-Asp 0.9781 2.75 3.63 51
Conclusion
In this article, a robust CE–LIF analy for the analysis of amino acid
neuro OPA.
solution,
tical method
transmitters and enantiomers was proposed based on chemical derivatization with
The OPA derivatives were baseline separated in 30 mM borate buffer (pH 10.0), containing 30
mM SDS. The LOD for neurotransmitters was as low as 5.57nM. The practical utility of the
proposed method will be demonstrated in chapters 4 to 6 by the detection of amino acid
neurotransmitters and enantiomers. With its high sensitivity, excellent selectivity, high re
and good repeatability, this approach can detect amino acid neurotransmitters released from a
complex biological sample.

CHAPTER 3 DEVELOPMENT AND EVALUATION OF CE COUPLED WITH CONTACTLESS
CONDUCTIVITY DETECTION TO IMPROVE THE ANION ASSAY
Introduction
Nitric oxide (NO) produced by nitric oxide synthase (NOS) has been known to play an
important role in vascular homeostasis, neurotransmission, and immunological host defense
mechanisms (Ignarro 2000). Due to the extremely short physiological half life of this gaseous
free radical, alternative strategies for the detection of the reaction products of NO biochemistry
have been developed (Boudko 2007). Both detection and quantification of NO-metabolites are
crucial to understanding health and disease. The major pathway for NO metabolism is the
stepwise oxidation to nitrite (NO2-) and nitrate (NO3
-) (Ignarro et al. 1993). In plasma or other
physiological fluids or buffers NO is oxidized almost completely to nitrite, where it remains
stable for several hours (Moroz 2001), but NO and nitrite are rapidly oxidized to nitrate in whole
blood by certain oxyhemoproteins (oxyhemoglobin or oxymyoglobin) (Ignarro et al. 1993). On
the other hand, it is now found that nitrite or nitrate can be reduced to NO in various ways and
the mechanisms have been extensively reviewed (Lundberg & Weitzberg 2005). The nitrite and
nitrate determination can not only reflect NO production but may also serve as an alternative
source of NO. Therefore detection and quantification of nitrite and nitrate provides an index of
NO bioavailability or production.
In addition to the role of NO in the biological pathways, nitrite is now considered a central
homeostatic molecule in NO biology and may serve as an important signaling molecule (Bryan
et al. 2005, Bryan 2006). It was demonstrated that plasma nitrite levels progressively decrease
with increasing cardiovascular risk load (Kleinbongard et al. 2006). Furthermore, the
determination of the nitrate levels from the vitreous humor of patients having diabetic
retinopathy suggested that NO was involved with the pathology of this disease (Gao et al. 2007).
63
Therefore it is important to carefully and accurately analyze all nitrite and nitrate in biological
samples.
However, the lack of data on the spatial distribution of nitrites and nitrates in the nervous
system greatly limits our understanding of NO-mediated pathways. The major problem is the
absence of adequate analytical approaches for the microchemical analysis of nitrite and nitrate in
small samples, which would represent specific metabolic domains of neuronal tissues. Capillary
electrophoresis (CE) has been successfully used to analyze subnanoliter sample volumes in a
large number of bioanalytical applications (Boudko 2007, Tseng et al. 2007). In particular this
method is advantageous for neuronal microchemical analysis, because of the extreme cellular
and chemical heterogeneity of neuronal samples (Ye et al. 2008). Reduction of the sample
volume enhances both the spatial and temporal resolution of analytical assays (Boudko et al.
2002). At a certain level of volume reduction, sampling also becomes nondestructive to cells,
which benefits cellular physiology, biomedical research and therapeutic diagnostics (Bakry et al.
2007). Most of these applications utilize a UV-based detection technique (Gao et al. 2004),
although it is obviously not a method of preference due to its relatively low sensitivity. The
technique of choice to detect inorganic and small organic ions is conductivity detection (CD),
which provides approximately 10 times better limits of detection (LOD). Several ion assays
using ion chromatography and CE with CD have been described and a commercial CD system
suitable for CE integration has recently become available (Boudko et al. 2002).
Here we describe a high-resolution CZE technique for the sampling and evaluation of ionic
profiles in small and specific samples from Aplysia californica. Our goals were 1) to evaluate an
approach for anion analysis of biological tissue samples based on the combination of capillary
zone electrophoresis and contactless conductivity detection (CCD), 2) to optimize this technique
64

for the determination of the nitric oxide-related metabolites, nitrite and nitrate, and 3) to optimize
this technique for the automatic analysis of ultra-small samples so that it would be suitable for
the analysis of small neuronal clusters and individual neurons. The described CZE technique is
effective for the indirect monitoring of alterations in NO production from small ganglia or even
individual neurons in specific neuronal regions.
Methods and Materials
Instrumentation
A computerized GPA100 (Groton biosystems) CE with a robotic sample injector coupled
to a TraceDec® contactless conductivity detector (Innovative Sensor Technologies GmbH,
Strasshof, Austria) was used. Separation was performed using a 70 cm (50 μm I.D.×360 μm
O.D.) fused-silica capillary (Polymicro Technologies, AZ, USA). DAx 7.3 data acquisition and
analysis software (Van Mierlo Software Consultancy, Netherlands) was used to control the CE
and acquisition board, as well as for data recording and analysis.
Reagents
Analytical-grade chemicals were obtained from Sigma (St. Louis, MO, USA). The
background electrolyte was an arginine-borate buffer with added tetradecyltrimethylammonium
hydroxide (TTAOH) (25mM arginine, 81.5mM borate and 0.5mM TTAOH, pH 9.0) to modify
the electroosmotic flow (EOF). The TTAOH was prepared by converting the bromide salt
(TTAB) into the hydroxyl form using a styrene-based, anion-exchange resin cartridge (On-Guard
A, Dionex, CA, USA). The buffer was filtered through a 0.2μm membrane. Fresh electrolyte was
prepared daily and degassed with combined vacuum-ultrasonic agitation prior to use.
Animals
Aplysia californica were obtained from either the Aplysia Research Facility (Miami, FL) or
Marinus Scientific (Long Beach, CA), depending on the animal size (100-400g). After arrived,
65

they were stored in 40-400 liter aquaria with circulating fresh sea water at 15-17˚C until use.
Feeding for animals was regulated to prevent interferences from ingested food.
Hemolymph and Ganglia
Ganglia (multiple clusters of neurons) and hemolymph (a combination of the fluids blood
and lymph in invertebrates) were collected from Aplysia. In detail, all animals were pre-stored in
a cold room at 4˚C for 90 minutes to minimize the animal’s inking while obtaining hemolymph.
Afterwards, 1-2mL hemolymph was collected using a disposable syringe and passed through a
nylon-membrane (0.2-μm pore size, Millipore) syringe filter to remove debris. Next, Aplysia
californica were anesthetized via injection of isotonic MgCl2 (337mM) equal to 50~60% of their
weight, prior to removal of the central nervous system (CNS). After the CNS was removed from
the animal, it was incubated in 1% Protease IX (Sigma, P-6141) in filtered artificial sea water
(ASW: 460mM NaCl, 10mM KCl, 55mM MgCl2, 11mM CaCl2, 10mM HEPES, pH 7.6) at 37˚C
for 30 min to loosen the connective tissue of the neuronal sheath. Then, the ganglia were washed
in fresh ASW three times to remove excess protease and were pinned down on a Sylgard (Dow
Corning)-coated Petri dish containing ASW. Inner connective tissue sheaths surrounding the
ganglia were removed manually using tungsten forceps and scissors under a stereomicroscope
(WPI, Sarasota, FL, USA). The sample volume (V) was calculated from dimensions of the
neuron under an Olympus SZX12 stereomicroscope, assuming ganglia are spherical (V = 4πr3/3).
Chloride Cleanup by Solid-Phase Extraction
The native chloride peak in most biological samples is so large that it masks the nitrite and
nitrate peaks. To improve nitrite determination, chloride anions were removed by passing the
sample through a silver-form sulfonated styrene-based resin using laboratory made micro-
cartridges suitable for cleanup of 20μL samples by the spin-enforced solid-phase extraction
66
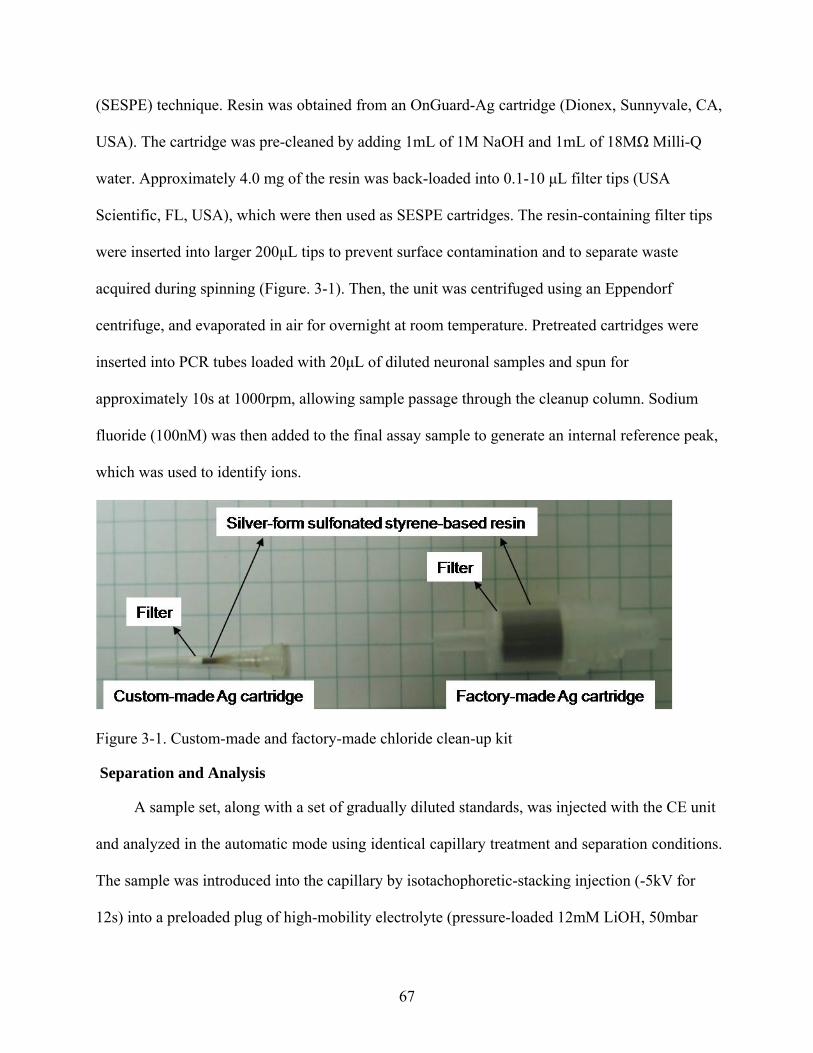
(SESPE) technique. Resin was obtained from an OnGuard-Ag cartridge (Dionex, Sunnyvale, CA,
USA). The cartridge was pre-cleaned by adding 1mL of 1M NaOH and 1mL of 18MΩ Milli-Q
water. Approximately 4.0 mg of the resin was back-loaded into 0.1-10 μL filter tips (USA
Scientific, FL, USA), which were then used as SESPE cartridges. The resin-containing filter tips
were inserted into larger 200μL tips to prevent surface contamination and to separate waste
acquired during spinning (Figure. 3-1). Then, the unit was centrifuged using an Eppendorf
centrifuge, and evaporated in air for overnight at room temperature. Pretreated cartridges were
inserted into PCR tubes loaded with 20μL of diluted neuronal samples and spun for
approximately 10s at 1000rpm, allowing sample passage through the cleanup column. Sodium
fluoride (100nM) was then added to the final assay sample to generate an internal reference peak,
which was used to identify ions.
Figure 3-1. Custom-made and factory-made chloride clean-up kit
Separation and Analysis
A sample set, along with a set of gradually diluted standards, was injected with the CE unit
and analyzed in the automatic mode using identical capillary treatment and separation conditions.
The sample was introduced into the capillary by isotachophoretic-stacking injection (-5kV for
12s) into a preloaded plug of high-mobility electrolyte (pressure-loaded 12mM LiOH, 50mbar
67

for 12s). The separation conditions were: -15kV, 20°C, running time 15min. The capillary was
precleaned with 1M NaOH (1700mbar for 2 min), washed with DW (1700mbar for 2min) and
loaded with buffer (1700mbar for 2min) prior to each run.
Anions were identified by absolute retention times relative to fluoride. Some samples were
analyzed a second time after spiking with nitrite or nitrate standards to validate the quantification
of these ionic species. The data analysis combined high-frequency cut-off filtering and baseline
reconstruction/subtraction with a five-data point moving average algorithm. This was followed
by an automatic peak identification and quantification protocol, which depended upon an
initially created standard database. Ion concentrations were determined from relative peak areas
and calibration slopes using DAx 7.3 software. Finally, electropherograms were exported into
text file format (*.txt) and assembled into representative graphs with SigmaPlot 10.0 (Systat
Software Inc. CA, USA). Data were further analyzed according to the procedures specified in
Chapter 2.
Results and Discussion
Solid-Phase Microextraction (SPME) Cleanup
A typical problem in nitrite/nitrate determinations in biological matrices with CZE and CD
is interference from the high natural concentrations of chloride anions, which mask and reduce
the injected quantity of other ions (Boudko et al. 2002). Bromide, chloride, nitrite and nitrate
slightly differ in their electrophoretic mobilities; thus, high chloride activities in marine
biological samples interfere with the electrokinetic injection and detection of nitrites and nitrates
known to be present at much lower concentrations (Stratford 1999). The commercial chloride
clean-up kit requires relatively large sample volumes to be treated for sufficient sample recovery
(Boudko 2007).
68
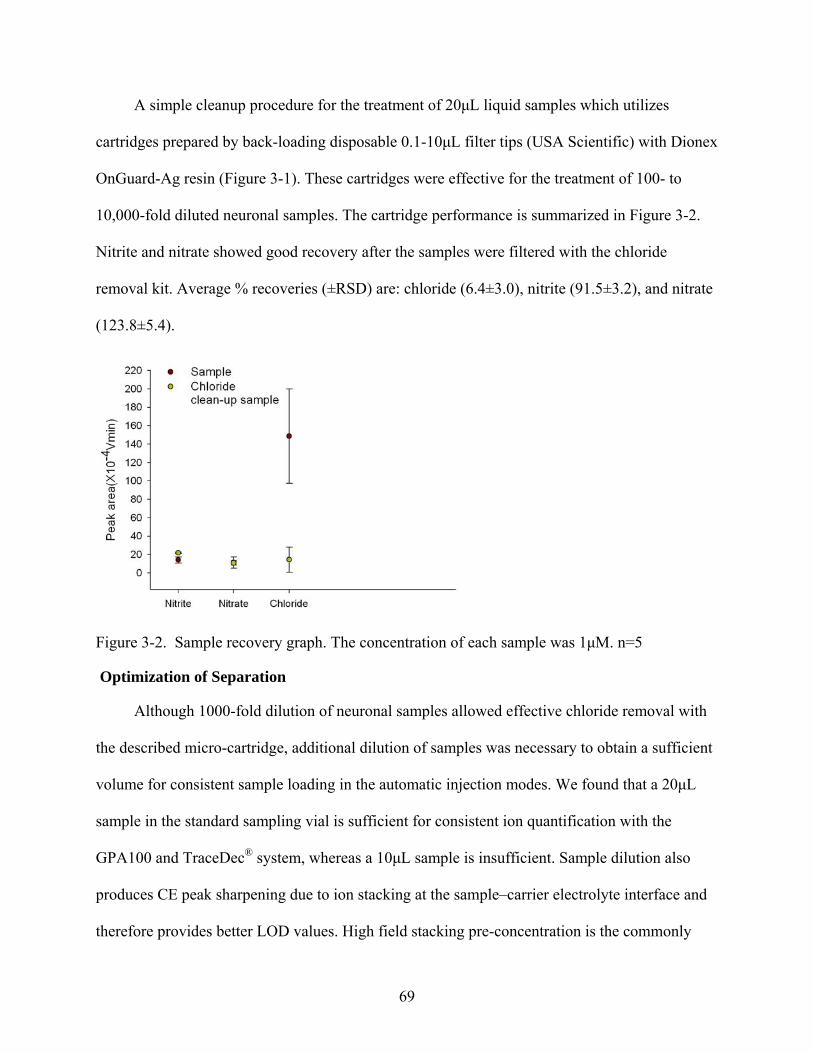
A simple cleanup procedure for the treatment of 20μL liquid samples which utilizes
cartridges prepared by back-loading disposable 0.1-10μL filter tips (USA Scientific) with Dionex
OnGuard-Ag resin (Figure 3-1). These cartridges were effective for the treatment of 100- to
10,000-fold diluted neuronal samples. The cartridge performance is summarized in Figure 3-2.
Nitrite and nitrate showed good recovery after the samples were filtered with the chloride
removal kit. Average % recoveries (±RSD) are: chloride (6.4±3.0), nitrite (91.5±3.2), and nitrate
(123.8±5.4).
Figure 3-2. Sample recovery graph. The concentration of each sample was 1μM. n=5
Optimization of Separation
Although 1000-fold dilution of neuronal samples allowed effective chloride removal with
the described micro-cartridge, additional dilution of samples was necessary to obtain a sufficient
volume for consistent sample loading in the automatic injection modes. We found that a 20μL
sample in the standard sampling vial is sufficient for consistent ion quantification with the
GPA100 and TraceDec® system, whereas a 10μL sample is insufficient. Sample dilution also
produces CE peak sharpening due to ion stacking at the sample–carrier electrolyte interface and
therefore provides better LOD values. High field stacking pre-concentration is the commonly
69

used optimization strategy for CZE analysis of diluted ion samples, leading to a 50-1000-fold
increase in sensitivity (Shihabi 2000). To increase the analytical performance for the analysis of
diluted neuronal tissue samples, the EOF-modifying additive TTAOH was used. The leading
electrolyte (12mM LiOH), a plug of high ion mobility, was also preloaded to further increase the
efficiency of ITP stacking and therefore improve the LOD value.
The calibration curves were constructed for sodium nitrite and sodium nitrate in
concentrations of 0.1-10μM in ultrapure water (Figure. 3-3). The regression lines of the peak
area versus standard concentrations were linear with correlation coefficients r = 0.9950 for nitrite
and r = 0.9928 for nitrate and limits of detection of 13.3nM for NO2- and 32.4nM for NO3
-.
Figure 3-3. Calibration curves of A) nitrite and B) nitrate. All standard solutions were prepared in ultrapure water. n=5
Analytical Performance
Hemolymph and ganglia (buccal, cerebral, Left (L)-pleural, Right (R)-pleural, L-pedal, R-
pedal, and abdominal) were sized under stereomicroscope, as shown in Table 3-1. Pedal ganglia
showed the largest size, and buccal ganglia were the smallest.
70
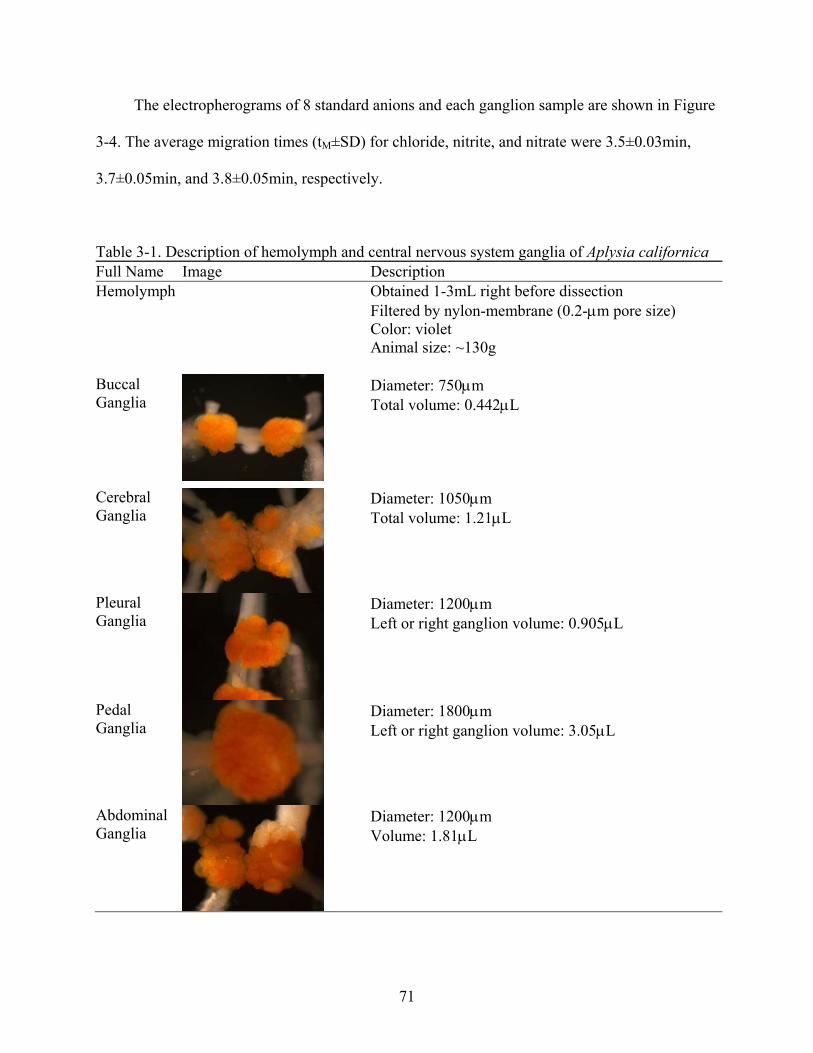
The electropherograms of 8 standard anions and each ganglion sample are shown in Figure
3-4. The average migration times (tM±SD) for chloride, nitrite, and nitrate were 3.5±0.03min,
3.7±0.05min, and 3.8±0.05min, respectively.
Table 3-1. Description of hemolymph and central nervous system ganglia of Aplysia californica Full Name Image Description Hemolymph Obtained 1-3mL right before dissection
Filtered by nylon-membrane (0.2-μm pore size) Color: violet Animal size: ~130g
Buccal Ganglia
Diameter: 750μm Total volume: 0.442μL
Cerebral Ganglia
Diameter: 1050μm Total volume: 1.21μL
Pleural Ganglia
Diameter: 1200μm Left or right ganglion volume: 0.905μL
Pedal Ganglia
Diameter: 1800μm Left or right ganglion volume: 3.05μL
Abdominal Ganglia
Diameter: 1200μm Volume: 1.81μL
71

The selectivity of the method (α) and the resolution values (Rs) were calculated as α = 1.06 and
Rs = 2.2 for nitrite/chloride, and also α = 1.03 and Rs = 1.0 for nitrate/nitrite. In hemolymph,
nitrate was detected in the absence of nitrite, because nitrite may have been rapidly oxidized by
oxyhemoproteins or present at very low concentration. In addition, HPO42¯ is present at all
electropherograms from ganglia, whereas in hemolymph it is not, indicating that this anion may
come from cell homogenates.
Figure 3-4. Electropherograms of standard solutions (650nM of all anions), hemolymph, and central ganglia in Aplysia californica. All animal samples were 10,000-fold diluted. The baseline was subtracted and reconstructed
Nitrite and nitrate concentrations were derived from standard calibration curves and they
were in mM ranges, as shown in figure 3-5. Nitrite was observed in all ganglia. In particular, in
72

buccal and cerebral ganglia NADPH-d results showed that high NOS activities were observed
(Moroz 2006), detection of nitrite and nitrate provided additional evidence that NO may play a
role in activating the feeding mechanism in Aplysia californica.
Figure 3-5. Nitrite and nitrate concentrations of hemolymph and central ganglia in Aplysia californica. (Bars are concentrations ± SD, n = 17 for hemolymph and n = 6 for each ganglia measurements)
The intracellular concentration of nitrite in ganglia was detected in the range of 0.6-2.7mM,
but it was not observed in the hemolymph. In our study, nitrate concentration in Aplysia
hemolymph was approximately 1.4mM. In contrast, it was reported that the concentration in
hemolymph of Pleurobranchaea californica and Lymnaea stagnalis were 1.83mM and 32µM,
respectively (Cruz et al. 1997). Nitric oxide in oxygen-containing, abiotic solutions barely
produces NO3¯; however, in biological systems the presence of heme proteins and other oxidants
facilitates further rapid oxidation of NO2¯ to NO3¯. The absence of nitrite in hemolymph was also
reported in vertebrate samples such as urine and plasma, due to the presence of oxyhemoglobin
(Meulemans & Delsenne 1994).
73

74
Conclusion
The data clearly demonstrates the ability to measure nitrite and nitrate from biological
samples with sensitivity sufficient for single cell analysis. In Aplysia californica, nitrate anion
accumulation was observed in hemolymph and in central ganglia, but it was widely distributed
throughout the animals’ bodies. In contrast, the nitrite anion was located in specific areas. The
next step will utilize this separation system to tackle the analysis of basal animals with CE
coupled with contactless conductivity detection. The ratio of nitrite to nitrate will be used for
evaluating NO production and will provide strong evidence for levels of actual NOS activity.

CHAPTER 4 NITRIC OXIDE (NO) SINGNALING IN TRICHOPLAX ADHAERENS
Introduction
Nitric oxide (NO) is a widespread intracellular and intercellular signaling molecule in
vertebrates and invertebrates with a variety of functions in the nervous, cardiovascular and
immune systems (Cristino et al. 2008, Garthwaite & Boulton 1995, D'Atri et al. 2009). It is
generated from L-arginine and molecular oxygen by the enzyme NO synthase (NOS), which
occurs in mammals in at least three distinct isoforms: neuronal, inducible and endothelial
(Ignarro 2000). In recent years, a growing body of evidence has implicated NO-signaling in
various organisms throughout the phylogenetic scale, notably invertebrates, where it has been
shown to play important roles in a variety of functions (Cristino et al. 2008).
Trichoplax adhaerens is an enigmatic disk-like animal consisting of only four
morphologically identifiable cell types arranged into 3 layers - surface, middle and lower
(Schierwater et al. 2009a). The animal lacks anterior-posterior polarity, but shows distinct
dorsal-ventral surfaces through its intriguing righting behavior, and it has gland cells with
digestive function in the ventral epithelium. In the absence of sufficient morphological characters,
its phylogenetic placement has long been controversial, and recent molecular data have not been
able to resolve the issue (Miller & Ball 2008). The recently released genome and transcriptome
information reveal several genes coding for transmitter synthesis enzymes and neuroendocrine-
like signaling molecules (Srivastava et al. 2008). Thus the study of placozoans may provide
insights into the early evolution of the nervous system. Specifically, three isoforms of nitric
oxide (NO) synthases were identified in Trichoplax, as well as receptor components homologous
to all major neurotransmitter systems in bilaterians, including mammals. However, there is no
direct evidence for the presence of NO-related metabolites and neurotransmitters.
75
Detection and quantification of NO are especially complex tasks, because of the small
active concentrations, high reactivity with biogenic free radicals, metal coordinating molecules,
and other biogenic-active species in vivo (Ignarro et al. 1993). These biological factors result in
a short lifetime and complex analytical signature for this molecule. Currently, there are two main
analytical methods, direct and indirect, to measure NO activity in nitrergic neurons under
biological conditions. Direct NO detection methods include the following: chemiluminescence
assay, spectrophotometry, fluorometry, electrochemical techniques, and electron paramagnetic
resonance (EPR) spectroscopy (Ye et al. 2008). However, the direct NO assay techniques suffer
from sensitivity or specificity problems in biological systems. In contrast, indirect methods
mainly use NADPH-diaphorase (NADPH-d) histochemistry, in-situ hybridization, or detection
of NO’s oxidation products (nitrite and nitrate) or its co-product (L-citrulline) (Cristino et al.
2008). It was demonstrated that neuronal concentrations of nitrite/nitrate could reflect NOS
activity in the rat brain tissue (Salter et al. 1996). Thus, indirect methods are preferred for
measuring concentrations of NOS-related metabolites, and provide good evidence for NOS
activity.
Capillary electrophoresis (CE) is an efficient, ultra-small-volume separation method
suitable for the determination of charged species in an aqueous media. It has been widely used
for the analysis of amino acids and derivatives (Zhu et al. 2005). Compared to other detection
modes, laser-induced fluorescence (LIF) detection in CE exhibits the best performance
characteristics, limits of detection, and linearity (Boudko 2007). Along with L-arginine and
citrulline, general amino-acid profiling of Trichoplax was investigated. As most analytes are not
fluorescent, they are commonly derivatized using fluorogenic reagents that either are not
fluorescent at the excitation wavelength prior to reaction or have nonfluorescent hydrolysis
76

products. o-Phthalaldehyde (OPA) was chosen as the derivatization reagent in this work because
it is a fluorogenic reagent and reacts with analytes within a few seconds.
For nitrite and nitrate detection, contactless conductivity detection (CCD) was used, due to
the excellent sensitivity to small ions. In CCD, the impedance is measured as a function of the
cell capacitance value, which depends on multiple factors, including the dielectric (conductivity)
profile of the environment and the geometry of the cell and electrodes (Zemann 2003). The
major challenge of CCD in the determination of nitrite and nitrate in biological samples is the
high concentration of Cl−. In vivo, the concentration of Cl− is 2-3 orders of magnitude higher
than NO2− or NO3
−, and its electrophoretic mobility is close to that of NO2− and NO3
− (Stratford
1999). To reduce chloride interference and improve NO2− detection, a sample cleanup procedure
was developed using a home-made solid-phase microextraction (SPME) cartridge filled with
Dionex OnGuard-Ag cationic exchange resin (Boudko et al. 2002).
To establish that NOS enzymatic activity is responsible for producing the Arg/Cit ratio and
nitrite measured in Trichoplax, the whole animal was incubated in NOS inhibitor, primarily, NG-
nitro-l-arginine methyl ester (L-NAME). In addition, another NOS inhibitor, L-N6-(1-
iminoethyl)-lysine (L-NIL), showed very effective inhibition (Bodnarova et al. 2005, Hansel et
al. 2003, Legrand et al. 2009).
Methods and Materials
Chemicals and Reagents
All chemicals for buffers were purchased from Sigma-Aldrich, and standard amino acids
were purchased from Fluka. Ultrapure Milli-Q water (Milli-Q filtration system, Millipore,
Bedford, MA) was used for all buffers, standard solutions, and sample preparations.
77

Animal Culture
Trichoplax adhaerens were cultured in glass dishes containing red sea water at room
temperature until use. The red sea water was replaced every 30 days.
NOS Inhibitor Incubation
After the animals were isolated from the culture medium, they were placed in a 0.5mL
PCR tube and incubated with certain concentrations of NOS inhibitors for 30 minutes at room
temperature, followed by washing with artificial sea water. Then, all the water was removed and
1uL of Milli Q water was dropped onto the animal, and the tube was stored at -80oC until use.
Amino Acids Microanalysis using CE with LIF
The CE coupled with the ZETALIF detector (Picometrics, France) was used for the assay
of amino acids. In this work a helium-cadmium laser (325nm) from Melles Griot, Inc.
(Omnichrome® Series56, Carlsbad, CA) was used as the excitation source. Before the
photomultiplier tube (PMT), the fluorescence was both wavelength filtered and spatially filtered
using a machined 3-mm pinhole. All instrumentation, counting, and high-voltage CE power
supply were controlled using DAx 7.3 software.
All solutions were prepared with ultrapure Milli-Q water to minimize the presence of
impurities. Borate buffer (30mM, pH 9.5) was used for sample preparation. All solutions were
filtered using 0.2-μm filters to remove particulates. The buffers were degassed by ultrasonication
for 10 min to minimize the chance of bubble formation. A 75mM OPA / β-mercaptoethanol
(ME) stock solution was prepared by dissolving 10mg of OPA in 100μL of methanol and mixing
with 1mL of 30mM borate and 10μL of β-ME. Stock solutions (10mM) of amino acids and
neurotransmitters were prepared by dissolving each compound in the borate buffer. OPA and β-
ME were stored in a refrigerator, and fresh solutions were prepared weekly.
78
All experiments were conducted using a 75cm length of 50μm I.D. × 360μm O.D. fused
silica capillary (Polymicro Technologies, AZ). A 30mM borate/ 30mM sodium dodecyl sulfate
(SDS) electrolyte (adjusted to pH 10.0 with NaOH) was used as the separation buffer for amino
acid analysis. Pre-column derivatization method was used. A 1μL of OPA was incubated in a
0.5mL PCR tube. The total volume of sample, OPA, and internal standard inside the tube was
20μL. For separation steps, the capillary inner-wall was successively washed with 1M NaOH,
Milli Q water, and the separation buffer by applying pressure (1900mbar) to the inlet vial. Then
the sample was loaded using electrokinetic injection (8kV for 12s). The separation was
performed under a stable 20kV voltage at 20˚C.
Nitrite/Nitrate Microanalysis using CE with Contactless Conductivity
Capillary electrophoresis coupled with a TraceDec contactless conductivity detector
(Strasshof, Austria) was used for the assay of nitrite and nitrate in Trichoplax. In order to reduce
Cl- in a sample, OnGuard II Ag (DIONEX Corp., Sunnyvale, CA) was purchased. Since small
sample volumes (20μL) are used, custom-built cartridges were used for sample clean-up using a
solid phase extraction technique with a minor modification of the study described in Chapter 3.
In brief, 4~5mg of the resin was back loaded in a 10μL filter- pipette tip, and the micro-cartridge
was washed with 1mL of ultrapure water using a 3mL disposable syringe. The pre-washed
cartridge was put into a 200μL pipette tip to avoid surface contamination during further
centrifugation. Extra water remaining in the cartridge was removed by centrifugation at 1000rpm
for 30 seconds. Then, the assembly was inserted into 0.5mL PCR tube and a final diluted sample
was loaded into the preconditioned cartridge followed by a centrifugation at 1000rpm for 30
seconds, causing the sample to pass through the silver resin. In order to quantitate any potential
79

sample loss, the custom-made chloride cartridge was tested for sample recovery of both nitrite
and nitrate.
All experiments were conducted using a 75cm length of 50μm I.D. × 360μm O.D. fused
silica capillary (Polymicro Technologies, AZ) with an insulated outlet conductivity cell.
Arginine/borate electrolyte was used for a separation buffer with tetradecyltrimethylammonium
hydroxide (TTAOH) added as an EOF modifier. The modifier was prepared from
tetradecyltrimethylammonium bromide (TTABr) by an OnGuard-II A cartridge (DIONEX Corp.,
CA) treated with 1M NaOH. For separation steps, the capillary inner-wall was successively
washed with 1M NaOH, ultrapure water, and the separation buffer (25mM Arg, 81mM Boric
acid, and 0.5mM TTAOH, pH 9.0) by applying pressure (1900mbar) to the inlet vial. Since
nitrite and nitrate concentrations were very low in diluted samples, capillary isotachophoresis
(CITP), a sample stacking method, was employed. The leading solution was introduced into the
capillary by pressure injection (25mbar for 12s), and then a neuronal sample was loaded using
electrokinetic injection (-5kV for 12s). The separation was performed under a stable -15kV
voltage at 20˚C.
Behavior Tests
For each pharmacological treatment we observed the behavior for 30 minutes without
adding chemicals to the seawater (pre-treatment), with chemicals (treatment), and after removing
chemicals (post-treatment).
A cube of agarogel containing glycine was made according to the following procedure. A
1% agarose solution in 10mL Milli Q water was prepared and the solution was brought boiling in
a microwave oven to dissolve the agarose. The solution was cooled to room temperature with
80
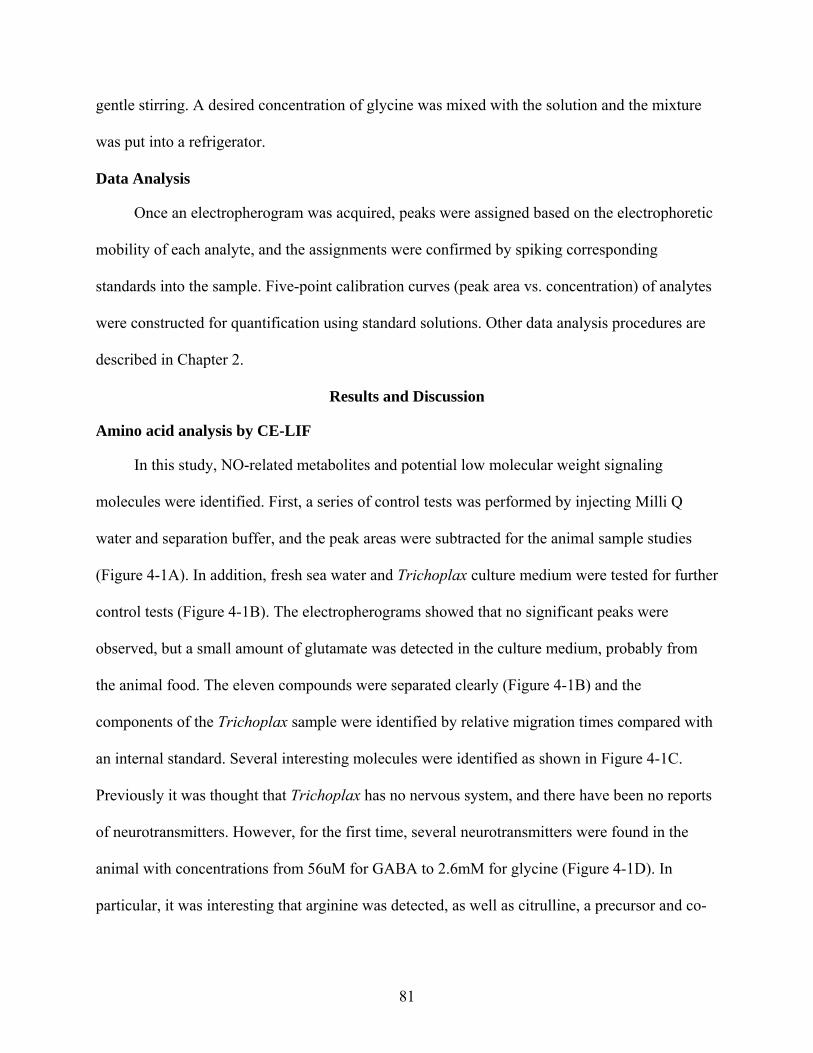
gentle stirring. A desired concentration of glycine was mixed with the solution and the mixture
was put into a refrigerator.
Data Analysis
Once an electropherogram was acquired, peaks were assigned based on the electrophoretic
mobility of each analyte, and the assignments were confirmed by spiking corresponding
standards into the sample. Five-point calibration curves (peak area vs. concentration) of analytes
were constructed for quantification using standard solutions. Other data analysis procedures are
described in Chapter 2.
Results and Discussion
Amino acid analysis by CE-LIF
In this study, NO-related metabolites and potential low molecular weight signaling
molecules were identified. First, a series of control tests was performed by injecting Milli Q
water and separation buffer, and the peak areas were subtracted for the animal sample studies
(Figure 4-1A). In addition, fresh sea water and Trichoplax culture medium were tested for further
control tests (Figure 4-1B). The electropherograms showed that no significant peaks were
observed, but a small amount of glutamate was detected in the culture medium, probably from
the animal food. The eleven compounds were separated clearly (Figure 4-1B) and the
components of the Trichoplax sample were identified by relative migration times compared with
an internal standard. Several interesting molecules were identified as shown in Figure 4-1C.
Previously it was thought that Trichoplax has no nervous system, and there have been no reports
of neurotransmitters. However, for the first time, several neurotransmitters were found in the
animal with concentrations from 56uM for GABA to 2.6mM for glycine (Figure 4-1D). In
particular, it was interesting that arginine was detected, as well as citrulline, a precursor and co-
81

product of nitric oxide, both with relatively high concentrations, 0.35mM for arginine and
0.5mM for citrulline.
Figure 4-1. Electropherograms and concentration profiling of Trichoplax adhaerens. Samples were loaded using electrokinetic injection (8kV for 12s), and then analyzed under a stable 20kV voltage at 20oC in 50µm I.D. and 360µm O.D. capillary with 30mM borate/30mM SDS, pH 10.0. A) Electropherograms of Milli Q water and separation buffer. B) Electropherograms of red sea water, Trichoplax culture medium, and standard solutions (1uM). C) Electropherograms of Trichoplax and Trichoplax spiked with standards. D) Concentration profile of Trichoplax (n=5). Peaks: Arginine (Arg), Aspartate (Asp), Citrulline (Cit), Gamma-aminobutyric acid (GABA), Glycine (Gly), Glutamate (Glu), internal standard (i.s.), Phenylalanine (Phe), Serine (Ser), Serotonin (5-HT), Taurine (Tau), and Tryptophan (Trp)
Studies of NOS inhibition were conducted with three different types of inhibitors. Nitric
oxide is synthesized from a precursor, L-arginine, with assistance of NOS enzymes, and a co-
82
product, L-citrulline, is also produced. While D-NAME was used for ineffective (no inhibition)
form, L-NAME and L-NIL served as effective inhibitors. It was expected that arginine-to-
citrulline ratio would increase after Trichoplax was incubated in either L-NAME or L-NIL, but
no change was expected for D-NAME treatment. In Figure 4-2, the arginine-to-citrulline ratio
increased by two-fold in case of L-NIL, but there was only a small increase with L-NAME,
indicating L-NIL effectively inhibited NOS enzyme, but L-NAME did not.
Figure 4-2. Electropherograms and Arg-to-Cit ratios of Trichoplax adhaerens upon treatment with NOS inhibitors. Samples were loaded using electrokinetic injection (8kV for 12s), and then analyzed under a stable 20kV voltage at 20oC in 50µm I.D. and 360µm O.D. capillary with 30mM borate/30mM SDS, pH 10.0. A) Electropherograms of Trichoplax incubated with D-NAME (500µM), L-NAME (500µM), and L-NIL (1mM) for 30min at room temperature. B) Arg-to-Cit ratio of Trichoplax after treatment with NOS inhibitors. n=5
Nitrite and Nitrate Analysis by CE-Conductivity
Trichoplax NO metabolites levels were monitored and concentrations were derived from
an in vitro calibration curve prepared from standard solutions of nitrate and nitrite at various
concentrations (10nM-500μM). With the regression equations, the LOD of nitrate was
determined to be 13.3nM for nitrite and 32.4nM for nitrate. These LODs were sufficient to
quantify nitrite and nitrate in Trichoplax.
83

Series of control tests were performed to see if there were any small molecules that might
interfere with peak identifications. Water, D-NAME, and L-NIL controls were first tested and no
nitrite was observed. However, chloride and nitrate were present, because NOS inhibitor
chemicals contain chloride, and nitrate is a common impurity in most of chemicals (Figure 4-3A).
Trichoplax by itself and Trichoplax incubated with NOS inhibitors were then analyzed. An
effective NOS inhibitor should cause the nitrite level to be lower than in the animal treated with
an ineffective inhibitor. In the control Trichoplax, nitrite was detected and it was about 1.5mM,
but after incubated with NOS inhibitors, no nitrite was observed. It was previously anticipated
that nitrite would be present after D-NAME incubation, because it is known not to inhibit NOS
activity well.
Figure 4-3. Electropherograms of controls and Trichoplax upon NOS inhibitors. Separation was conducted in 75cm length of 50µm I.D. and 360µm O.D. capillary with
84

arginine/borate buffer, pH 9.0. All samples were loaded using electrokinetic injection (-1kV for 12s), and then analyzed under a stable -15kV voltage at 20oC. A) Electropherograms of Milli Q water, D-NAME, and L-NIL. B) Electropherograms of Trichoplax only, and Trichoplax incubated with D-NAME (500uM), L-NAME (500uM), and L-NIL (1mM). C) Nitrite and nitrate concentration profiling after NOS inhibition. n=5
Locomotory phases in Trichoplax
A single Trichoplax was placed into a Petri-dish and movements were observed for one
hour with one picture obtained every 10 seconds. In Figure 4-4C red trace indicates the path that
Trichoplax took during 60 minutes of observation and the camera shows clear active changes of
surface. Trichoplax clearly indicates exploratory phases during which Trichoplax moves quickly
(red arrow) followed by phases of almost complete inactivity (Figure 4-4E).
Figure 4-4. Trichoplax behavioral analysis (Control). A) Image of Trichoplax in experimental arena. B) Subtracted image of Trichoplax in experimental arena. C) Trace analysis of
85

Trichoplax behavior. D) Analysis of surface area movement. A periodicity of these activity bursts is visible. E) Trace analysis of Trichoplax (Heyland et al. 2008)
NO as a modulator of locomotion
Addition of 8-Bromoguanosine 3′,5′-cyclic monophosphate (8-Bromo-cAMP), NO-donor,
6-(2-Hydroxy-1-methyl-2-nitrosohydrazino)-N-methyl-1-hexanamine (NOC9) and 8-Bromo-
cGMP all lead to an increase of the detectable surface area and activity (data not shown). The
NO donor NOC9 resulted in a relatively fast recovery (i.e < 30 minutes) from the treatment
while both 8-bromo-cAMP and cGMP treatment resulted in no recovery. These results are
consistent with the metabolic degradation of these compounds in vertebrates.
Figure 4-5. Trichoplax behavior analysis (NO modulators). A) 8-Bromo-cAMP. B) NO donor (NOC9). C) 8-Bromo-cGMP. Video files were analyzed and the area of each individual was measured for each frame. These values were averaged for all three individuals and plotted as a function of time (upper panel). Average activities of the entire time period were calculated for each individual and compared between pre-,
86

experiment and post- using the average activity for all three individuals (Heyland et al. 2008)
Glycine as a chemoattractant in Trichoplax
We tested the response of Trichoplax individuals in response to a local glycine source and
compared it to the control. Specifically we prepared agar doped with 1mM glycine and placed a
small block into the experimental arena. The control treatment was agar doped with seawater.
We then placed one Trichoplax in the arena and filmed its movement over 30 minutes using time
lapse photography. In all three trials, the Trichoplax moved towards the glycine source.
Figure 4-6. Trichoplax behavior analysis (Glycine). A) A representative example of the movement experiment. B) Distance data as a function of time for all three individuals tested. The path was quantified by calculating the distance between the glycine source and the individual (d1) relative to the distance between the control source and the individual (d2). Data were normalized by calculating the difference between d1 and d2. Scale bar 2mm (Heyland et al. 2008)
The extensive genome analysis of Trichoplax is progressing, and a considerable amount of
important information has been published (Srivastava et al. 2008, Schierwater et al. 2009b). In
our study, several interesting signaling molecules were found; for example, glycine was the most
abundant amino acid and iGlyRs have been shown to be highly expressed in Tricholax. DOPA
decarboxylase and DBH-like monooxygenase, which are involved in dopamine, noradrenaline
87

and adrenaline synthesis in adrenergic cells, and are present, as well as putative vesicular amine
transporters which are used for neurotransmitter uptake (Srivastava et al. 2008). However, DA
was not found in our study, but it may be observed with LOD improvement. Schuchert showed
that, although Trichoplax has no nervous system, it has behavioral responses to environmental
stimuli, and sensitivity to the neuropeptide RFamide (Schuchert 1993). In our study, the animals
were attracted to the glycine, but not to the control.
An important aspect of the current studies is the ability to perform direct whole animal
measurements of endogenous concentrations of NO-related metabolites. Trichoplax samples
have the concentrations of nitrites (0.15±0.03mM), nitrates (2.26±0.43mM), Cit (0.50±0.05mM),
and Arg (0.35±0.01mM). Such a situation is explained by functionally active NOS consuming
Arg, converting it into Cit and NO, which subsequently undergoes oxidation to nitrite and nitrate.
Biological roles of NO in marine invertebrates are related to feeding, defense, learning,
metamorphosis, and swimming (Moroz et al. 2000, Fiore et al. 2004, Katzoff et al. 2002, Leise et
al. 2004, Moroz et al. 2004). The NO/cGMP signaling pathway is considered to play an
important role in the swimming pattern of Aglantha (Moroz et al. 2004). In our study, the NO
donor NOC9 aided in a relatively fast recovery while both 8-bromo-cAMP and cGMP treatment
resulted in no recovery. This means that cAMP or cGMP may not be able to modulate
Trichoplax locomotion, but NO is needed to initiate the signaling pathway. The current work
represents the first studies of enzyme activity in Trichoplax via both Arg/Cit and nitrite/nitrate
measurements. Moreover, knowledge of the endogenous concentrations of arginine and citrulline
is important in the designing pharmacological tests using competitive NOS inhibitors.
Conclusion
The measurement of the oxidation products of NO-related metabolites using CE is a useful
method for examining small-volume animals and complements other techniques presently in use.
88

89
These findings underscore the importance of employing state-of-the-art microchemical analytical
techniques in conjunction with traditional physiological, histochemical, and molecular
techniques in order to confirm NOS activity.
CHAPTER 5 USING CE FOR METABOLOMIC PROFILING OF THE BASAL ANIMALS:
CTENOPHORES, CNIDARIANS, PLACOZOA, AND SPONGES
Introduction
While bilateria comprise a well-defined phylogenetic group, both the branching order of
the lower animal phyla, including porifera, placozoa, cnidarians and ctenophores, and their
relationships to bilateria are still controversial (Claus 2008, Philippe et al. 2009). In terms of
morphology, Trichoplax and sponges were placed into the group of simplest animals, but a large-
scale phylogenomic analysis recently put ctenophores into the basal animal group (Miller & Ball
2008). Immunohistochemical and physiological tests have been conducted in cnidarians, sponges
and ctenophores (Kass-Simon & Pierobon 2007, Cristino et al. 2008, Pang & Martindale 2008a,
Pang & Martindale 2008b, Ramoino et al. 2007), but few direct chemical analyses, for
compounds like amino acids and signaling molecules, have been performed in many marine
invertebrate species. Thus, analysis of the nitric oxide related metabolites and potential signaling
molecules in the biological samples may provide insight into the nervous systems of marine
animals.
While the primary objective of this study involved the identification and characterization
of key potential signaling molecules of low molecular weight and their metabolites, our effort
was also focused on the analysis of D-Aspartic acid (D-Asp) and D-Glutamic acid (D-Glu). In
particular, D-Asp is found in the central nervous systems of a variety of animals, including
mammals (Sakai et al. 1998, D'Aniello 2007) and mollusks (Miao et al. 2006, Song et al. 2006).
In addition, D-Glu naturally presents in many microbes (Glavas & Tanner 2001), as well as in
plants and animals (Corrigan 1969, Kera et al. 1996). Kera et al. reported that D-Glu may play a
role in Aplysia central nervous systems (Quan & Liu 2003).
90
To accomplish this goal, capillary electrophoresis (CE) was used, because of its efficient
and ultra-small-volume separation abilities for the separation and analysis of charged species. As
described in Chapter 2, CE has been widely used for the analysis of amino acids and derivatives
(Zhu et al. 2005, Boudko 2007, Poinsot et al. 2008). In addition to L-arginine and citrulline
determinations, general amino-acid profiling of the basal animals was performed. As most
analytes are not fluorescent, they are commonly derivatized using fluorogenic reagents that
either are not fluorescent prior to reaction or have nonfluorescent hydrolysis products. o-
Phthalaldehyde (OPA) was chosen as the derivatization reagent in this work, because it is a
fluorogenic reagent which reacts with analytes within a few seconds. In addition, for nitrite and
nitrate detection, contactless conductivity detection (CCD) was used, due to the excellent
sensitivity to small ions.
In this study, a number of potential signaling molecules were found, including glycine,
GABA, glutamate, and aspartate, with concentrations up to the millimolar level. In particular,
serotonin (5-HT) was detected in the tentacle area of Sarsia, one of cnidarians. Also, D-Glu was
identified in most of ctenophores, and D-Asp was quantified in Sarsia, Trichoplax, and Sycon
coactum.
Methods and Materials
Chemicals and Reagents
All chemicals for buffers were purchased from Sigma-Aldrich, and standard amino acids
were purchased from Fluka. Ultrapure Milli-Q water (Milli-Q filtration system, Millipore,
Bedford, MA) was used for all buffers, standard solutions, and sample preparations.
Sample Preparation
Samples of Trichoplax adhaerens were cultured in glass dishes containing red sea water at
room temperature by the courtesy of Jim Netherton. The red sea water was refreshed every 30
91

days. Each Trichoplax was collected from the culture dish by a glass pipette and transferred into
a 0.5mL PCR tube under a stereomicroscope. The culture medium was removed and the animal
was covered with 1μL Milli-Q water, followed by storage at -80 oC until use.
Ctenophores (Pleurobrachia, Beroe, Bolinopsis, and Mnemiopsis) and cnidarians
(Aglantha, Sarsia, Aequorea, and Phialidium) were collected at the University of Washington
Friday Harbor Laboratories (FHL), San Juan Island, WA. Specific body parts of both
ctenophores and cnidarians were dissected under a stereomicroscope using a scissor and tweezers.
The samples were stored in a PCR tube containing Milli-Q water at -80 oC until use. All the
works were performed by the scientist in the FHL.
Sponges (Sycon coactum and Aphrocallistes vastus) were collected using the manipulator
arm of the remote operated vehicle ROPOS (Remote Operated Platform for Ocean Science;
ropos.com) at San Jose Islets, Barkley Sound, Canada. The pieces were cut and stored in a
0.5mL PCR tube at -80oC until use.
Amino Acids Microanalysis using CE with LIF
The CE coupled with the ZETALIF detector (Picometrics, France) was used for the assay
of amino acids. In this work a helium−cadmium laser (325nm) from Melles Griot, Inc.
(Omnichrome® Series56, Carlsbad, CA) was used as the excitation source. Before the
photomultiplier tube (PMT), the fluorescence was the wavelength filtered. All instrumentation,
counting, and high-voltage CE power supply were controlled using DAx 7.3 software.
Borate buffer (30mM, pH 9.5) was used for sample preparation, and all solutions were
filtered using 0.2-μm filters to remove particulates. The buffers were degassed by ultrasonication
for 10 min to minimize the chance of bubble formation. A 75mM OPA / β-mercaptoethanol (β-
ME) stock solution was prepared by dissolving 10mg of OPA in 100μL of methanol and mixing
with 1mL of 30mM borate and 10μL of β-ME. Stock solutions (10mM) of amino acids and
92

neurotransmitters were prepared by dissolving each compound in the borate buffer. OPA and β-
ME were stored in a refrigerator, and fresh solutions were prepared weekly.
All experiments were conducted using a 75cm length of 50μm I.D. × 360μm O.D. fused
silica capillary (Polymicro Technologies, AZ). A 30mM borate/ 30mM sodium dodecyl sulfate
(SDS) electrolyte (adjusted to pH 10.0 with NaOH) was used as the separation buffer for amino
acid analysis. For pre-column derivatization method, 1μL of OPA was incubated at 20oC for 6
minutes in a 0.5mL PCR tube with 18μL sample and 1μL internal standard. For separation steps,
the capillary inner-wall was successively washed with 1M NaOH, Milli Q water, and the
separation buffer by applying pressure (1900mbar) to the inlet vial. Then the sample was loaded
using electrokinetic injection (8kV for 12s). The separation was performed under a stable 20kV
voltage at 20˚C.
Nitrite/Nitrate Microanalysis using CE with Contactless Conductivity
Capillary electrophoresis coupled with a TraceDec contactless conductivity detector
(Strasshof, Austria) was used for the assay of nitrite and nitrate in the basal animals. In order to
reduce Cl- in a sample, OnGuard II Ag (DIONEX Corp., Sunnyvale, CA) was purchased. Since
small sample volumes (20μL) were analyzed, custom-built cartridges were used for sample
clean-up as described in Chapter 3. In order to quantitate any potential sample loss, the custom-
made chloride cartridge was tested for sample recovery of both nitrite and nitrate.
The buffer preparation, injection procedure, and separation are described in Chapter 4.
Data Analysis
After an electropherogram was acquired, peaks were assigned based on the electrophoretic
mobility of each analyte, and the assignments were confirmed by spiking corresponding
standards into the sample. Five-point calibration curves (peak area vs. concentration) of analytes
93
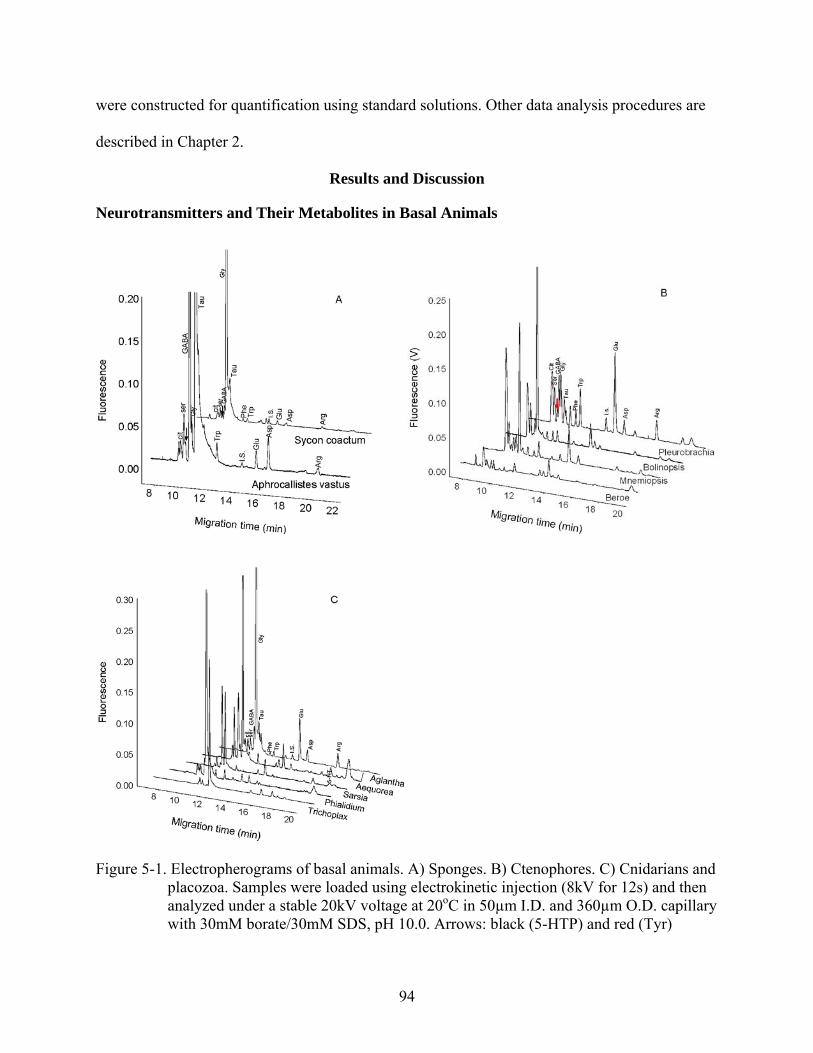
were constructed for quantification using standard solutions. Other data analysis procedures are
described in Chapter 2.
Results and Discussion
Neurotransmitters and Their Metabolites in Basal Animals
Figure 5-1. Electropherograms of basal animals. A) Sponges. B) Ctenophores. C) Cnidarians and placozoa. Samples were loaded using electrokinetic injection (8kV for 12s) and then analyzed under a stable 20kV voltage at 20oC in 50µm I.D. and 360µm O.D. capillary with 30mM borate/30mM SDS, pH 10.0. Arrows: black (5-HTP) and red (Tyr)
94
Two sponges, Aphrocallistes vastus (class Hexactinellida), called glass sponge, and Sycon
coactum (class Calcarea), were analyzed. The electropherograms in figure 5-1A of representative
samples of A. vastus show high concentrations of GABA and taurine, while high concentrations
of glycine and taurine were detected in S. coactum. Interestingly, both animals have 5-HTP,
which is a direct precursor of serotonin, but it was not detected in these analyses. Sponges have a
complex intercellular communication system, and the possible mechanisms of a coordinating
center involve internal spreading of the chemical signal in the extracellular matrix, cell motility,
and cell-cell and cell-substratum interactions (Ramoino et al. 2007, Ellwanger et al. 2007).
Neurotransmitters (e.g., epinephrine, norenephrine, and serotonin), as well as the
neurotransmitter-related enzyme monoaminoxidase, have been found in myocyte-like cells of
Sycon ciliatum (class Calcarea) (Lentz 1966). Also, cells containing a gene encoding a putative
metabotropic glutamate/GABA receptor have been observed in the sponge Geodia cydonium
(class Demospongiae), and pharmacological data supported the existence of such a receptor by
demonstrating that it can be activated by L-Glu (Perovic et al. 1999).
Four different animals were investigated, including Pleurobrachia, Mnemiopsis,
Bolinopsis, and Beroe, as well as their specific body regions (Figure 5-1B). Metabolite
concentrations are presented in Table 5-1. In most of these ctenophores, high concentrations of
taurine and citrulline were detected. This is a particularly interesting result for Pleurobrachia
since it was reported that NOS was localized near the mouth and gut areas (Claus 2008). A
bundle of axon-like processes arches over the epithelial cells in the aboral sense organ of
Pleurobrachia and Mnemiopsis for regulating swimming behavior of these animals (Tamm &
Tamm 2002). The ctenophores are recognized as an important group for understanding the early
evolution of key anatomical characters, such as body symmetries, the mesoderm, and the
95

neurosensory system (Jager et al. 2008). Recently, a large-scale phylogenomic analysis of
ctenophores placed them at the bottom of the metazoans, but a few data are available on their
metabolites (Miller & Ball 2008).
In our work, we investigated four different species: Aglantha, Sarsia, Aequorea, and
Phialidium (Figure 5-1C). Glycine was high in most of these animals, and it was interesting that
5-HT was identified in Sarsia. It has been reported that 5-HT plays an important role in an early
stage of metamorphosis in Phialidium gregarium (McCauley 1997) and in Eudendrium
racemosum (Zega et al. 2007). In Aglantha digitale, the nitric oxide/cyclic guanosine
monophosphate (NO/cGMP) signaling pathway modulates the rhythmic swimming associated
with feeding, possibly by means of putative nitrergic sensory neurons in the tentacles (Moroz et
al. 2004). A considerable amount of data has shown the accumulation of neurotransmitters, such
as acetylcholine, GABA, and glutamate, in cnidarians (Kass-Simon & Pierobon 2007), but more
animal groups still need to be analyzed.
Glu and Asp Enantiomer Analysis in Basal Animals
D-Aspartic acid (D-Asp), an endogenous amino acid present in vertebrates and
invertebrates, plays an important role in the neuroendocrine system, as well as in the
development of the nervous system (D'Aniello 2007). However, previously no direct chemical
data on the enantiomers in the basal animals have been available. Therefore, D enantiomers were
analyzed in Trichoplax, sponges, ctenophores, and cnidarians using a chiral selector, β-CD.
Although it was surprising to identify D-Glu and D-Asp in these samples, detection was,
nonetheless, confirmed by spiking with each standard (Figure 5-2). The quantification data are
presented in Table 5-2. D-Asp has been found near the brain (Song et al. 2008), endocrine
(D'Aniello et al. 2000), retina (Lee et al. 1999), and nervous tissues (Spinelli et al. 2006) in the
various animals. It is considered that D-Asp may aid in the construction of neuronal networks.
96

Figure 5-2. Electropherograms of Glu and Asp enantiomers in the basal animals. A) Placozoa. B) Sponges. C) Ctenophores. D) Cnidarians. Peaks: 1) L-Glu, 2) D-Glu, 3) D-Asp, and 4) L-Asp. Samples were loaded using electrokinetic injection (8kV for 12s) and then analyzed under a stable 20kV voltage at 20oC in 50µm I.D. and 360µm O.D. capillary with 15mM borate and 10mM β-CD, pH 10.0
Nitrite and Nitrate Assay in the Basal Animals
In sponges, the nitrite concentrations in a millimolar range were observed in Sarcia and
Beroe (Figure 5-3B,C). There was a report that significant amounts of NO were detected in the
homogenates of the mouth area from Aplysia californica, previously shown to be NO-positive,
and in individual NOS-containing buccal neurons from the freshwater snail, Lymnaea stagnalis
(Kim et al. 2006). Nitrite and nitrate are useful indicators of nitric oxide activity and have been
97

used for this purpose in various animals (Boudko 2007). The presence of Ca2+-dependent, heat-
stress-activated nitric oxide synthase (NOS) activity was demonstrated previously in dendritic
sponge cells (Giovine et al. 2001). Regulation of nitric oxide production by the NOS and control
by the natural inhibitor asymmetric dimethylarginine (ADMA) were also observed in S.
domuncula (Muller et al. 2006). Furthermore, in Aglantha, NO serves as a modulator to affect
the swimming pattern (Moroz et al. 2004). Therefore, Sarcia, aequorea, and Phialidium should
be carefully investigated to determine the role of NO in the swimming motion.
Figure 5-3. Nitrite and nitrate electropherograms of the basal animals. A) Sponges, B) Cnidarians and placozoa, C) Ctenophores, D) Concentration profiles of nitrite and nitrate (n=3). Note: whole body (WB), aboral organ (AO)
98

99
Conclusion
Four different basal animal groups, including placozoa, ctenophora, cnidaria, and porifera,
were analyzed by the CE-LIF system to identify and quantify potential signaling molecules. In
particular, nitric oxide-related metabolites (Arg, Cit, nitrite, and nitrate) were observed in the
mouth region of Sarsia and Beroe, suggesting that NO acts on modulate the feeding mechanism.
We found that D-Asp may play important roles in placozoa, porifera, and cnidaria, and that
ctenophores may use D-Glu as a signaling molecule. The current system reliably operated for a
large-scale animal analysis, although some improvements in LODs and sample preparation
methods can still be made to minimize errors.

Table 5-1. Metabolite concentrations in basal animals. Species Region Cit Ser 5-HTP Tyr GABA Gly Tau Phe Trp Glu Asp Arg 5-HT Beroe AOa 25.0±1.6 2.6±0.3 0.22±0.01 2.25±0.18 0.61±0.07 1.97±0.06 2.21±0.13 9.94±0.83 3.78±0.2 1.88±0.15 3.53±0.26
Mouth 38.7±2.1 4.46±0.45 0.43±0.04 7.47±0.90 2.49±0.21 4.88±0.38 5.29±0.37 9.45±0.49 6.74±0.58 9.93±1.37 5.31±0.31Comb 24.8±1.06 2.91±0.17 0.91±0.08 6.53±0.38 0.89±0.08 3.51±0.3 4.76±0.22 11.2±0.42 4.40±0.28 1.50±0.07 6.12±0.42
Dots 22.1±0.73 2.03±0.05 2.71±0.17 7.85±0.54 0.58±0.01 11.2±0.3 9.14±0.18 4.69±0.17 3.08±0.01 10.8±0.25 9.42±0.72Mnemiopsis AOa 136±4 23±0.8 3±0.1 24±4 83±8 2±0.4 30±6 10±4 26±1
Mouth 2040±132 205±15 261±21 89±7 715±56 360±22 149±12 320±23 346±23 163±12 126±10 Lobe 277±72 37±11 4±0.4 46±29 121±39 4±0.3 13±3 56±15 23±9 41±19 Ctenrow 81±11 43±7 7.3 447±41 76±13 187±32 7±1 113±19 62±7 30±11 78±6
Bolinopsis WBa 165±96 28±17 6±0.5 730±23 27±2 25±19 34±2 14±1 17±9 Pleurobrachia Comb 5.99±0.1 1.26±0.1 0.34±0.02 0.91±0.07 23.7±0.5 33.7±1 1.63±0.07 5.49±0.2 1.58±0.08 27.4±1.3 3.05±0.3
Bodywall 2.82±0.1 0.75±0.08 0.23±0.02 0.28±0.03 30.5±2.6 2.86± 1.50 4.17±0.2 2.30±0.07 1.58±0.1 4.06 AOa 8.81±0.3 1.23±0.1 1.48±0.1 6.84±0.7 22.8±0.5 10.9±0.04 1.73±0.04 10.4±0.7 3.49±0.01 31.4±4.2 4.70 Mouth 15.7±1.5 1.57±0.1 0.42±0.04 4.24±0.3 20.6±1.7 4.07±0.3 3.75±0.3 6.39±0.6 2.08±0.2 3.32±0.1 6.60±0.4 Stomach 44.0±3.2 4.95±0.3 2.81±0.2 15.6±1.1 64.3±4.2 12.1±0.8 17.7±0.9 25.4±1.6 7.40±0.6 13.4±1.0 38.9±3.0 Tentacle 24.5±1.9 3.16±0.2 0.77±0.08 1.38±0.07 20.4±1.6 1.40±0.1 1.94±0.2 8.20±0.4 6.66±0.6 12.0±1.4 4.55±0.2
Trichoplax WBa 1650±114 446±18 62±45 3520±239 82±4 177±31 1210±73 622±44 900±103 A. vastus WBa 60±29 57±28 72±5 421±176 156±50 1120±99 34.4 40.2±13 24±1 52±18 48±4 S. coactum WBa 49±3 18±1 20±1 13±1 2490±106 82±4 12±8 12±3 13±4 10±6 5±0.4 Phialidium WBa 27±4 11±1 8±1 1840±54 17±4 12±3 7±1 Sarsia WBa 8±0.4 9±5 10±0.8 2±0.9 381±19 47±2 2±0.2 5±0.6 18±6 4±0.8 28±1
Tentacle 18±0.7 16±1 0.57±0.04 3±0.8 508±34 83±14 16±4 4±0.2 40±5 6±1 18±2 19±2 Mouth 201±4 156±5 236±12 39±1 1700±41 522±38 56±8 102±4 164±8 55±5 50±20
Aequorea WBa 73±16 87±19 28±9 82±26 116±55 340±59 34±9 69±16 22±5 17±9 Aglantha WBa 57±2 23±9 23±9 2370±548 37±2 29±2 18±1 107±36 38±1 108±59 a. WB (whole body), AO (aboral organ) Results are in μM±SD, n=3-5
100
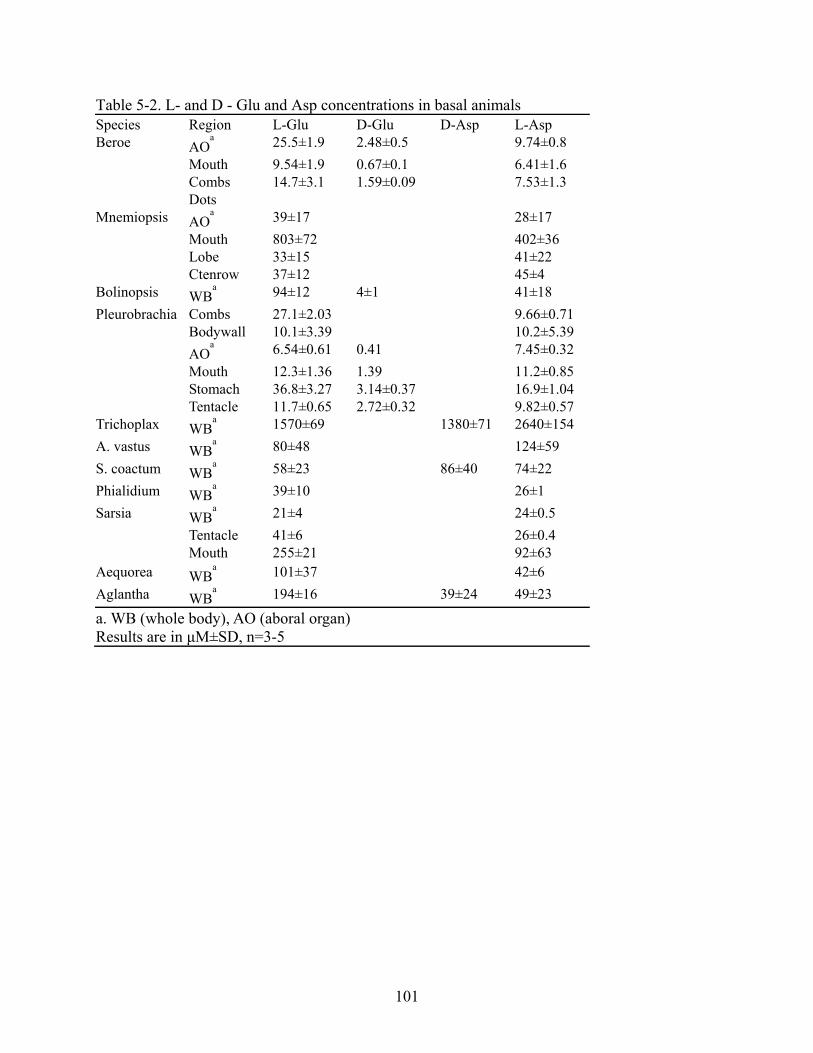
Table 5-2. L- and D - Glu and Asp concentrations in basal animals Specie s Region L-Glu D-Glu D-Asp L-AspBeroe AO
a 25.5±1.9 2.48±0.5 9.74±0.8 Mouth 9.54±1.9 0.67±0.1 6.41±1.6 Com s bDots
14.7±3.1 1.59±0.09 7.53±1.3
Mnemiopsis AOa 39±17 28±17
Mout hLobe
803±7 233±15
402±36 41±22
Ctenrow 37±12 45±4Bolinopsis WB
a 94±12 4±1 41±18Pleurobrachia Combs 27.1±2.03 9.66±0.71
Bodywall 10.1±3.39 10.2±5.39 AO
a 6.54±0.61 0.41 7.45±0.32 Mouth 12.3±1.36 1.39 11.2±0.85 Stomach Tentacle
36.8±3.27 3.14±0.37 16.9±1.04 11.7±0.6 51570±69
2.72±0.32 9.82±0.57 2640±154 Trichoplax WB
a 1380±71A. vastus WB
a 80±48 124±59S. coactum WB
a 58±23 86±40 74±22Phialidium WB
a 39±10 26±1Sarsia WB
a 21±4 24±0.5Tentacle 41±6 26±0.4Mouth 255±21 92±63
Aequorea WBa 101±37 42±6
Aglantha WBa 194±16 39±24 49±23
a. WB (whole body), AO (aboral organ) Results are in μM±SD, n=3-5
101
CHAPTER 6 COMPARATIVE ANALYSIS OF MULLUSCA: SQUID, NAUTILUS, AND APLYSIA
CALIFORNICA
Introduction
The cephalopods, comprising the squid, octopus and cuttlefish, have arguably the most
advanced nervous systems among the invertebrates and are certainly the most sophisticated
systems within the phylum Mollusca (Williamson & Chrachri 2004). In particular, cephalopod
nervous systems have served successfully for decades in efforts to understand the basic biology
of normal nerve function, from the flow of ion currents in the nerve impulse to the motor systems
of axon transport (Grant et al. 2006). In addition, Aplysia californica (Phylum: Mollusca) has
been useful for cell and molecular biological studies of behavior, learning, and memory, because
of the accessibility of individual ganglia and specific neurons within these ganglia and the ability
to identify individual nerve cells that play roles in specific behaviors (Moroz et al. 2006).
Since the structure and origin of the giant fiber system of the squid Loligo were described,
a vast literature on the physiology, behavior, and biochemistry of the giant fiber system has been
published (Grant et al. 2006, Giuditta et al. 2008). The jet propulsion locomotory behavior
depends upon the giant axons that innervate the muscles of the mantle. The diameter of the giant
axon can be up to 1mm, and its length may extend several centimeters depending on the species
and size of the animal. About 3-10μL of pure axoplasm, uncontaminated by sheath or glial cells,
can be collected from a single giant axon, depending on size, making it possible to collect up to
30-100μL of axoplasm from one squid (2 axons per squid) (Grant et al. 2006). There have been
several reports about the glutamate as a signaling molecule in Sepioteuthis sepioidea (Garcia &
Villegas 1995, Garcia 1996) and in Loligo (Lieberman & Sanzenbacher 1992).
The only other extant group within the class cephalopod is the Nautilus, which consists of
5 species. They have retained the heavy external protective shell but have relatively simple
102

nervous systems, presumably reflecting the ancestral, more primitive form (Williamson &
Chrachri 2004). Unlike other cephalopods, Nautilus is long-lived, slow growing, and largely
sedentary, scavenging for its food rather than actively hunting prey (Crook & Basil 2008). It
lives predominately in deep (>300m), cold waters surrounding the coral reefs of the Indo-Pacific,
and in minimal light penetration habitat. Nautilus relies mostly on olfaction and touch to locate
food sources (Shigeno et al. 2008). The apparent similarity between living Nautilus and ancestral
cephalopods suggests that the Nautilus may provide important insights into the evolution of
complexity in invertebrate nervous systems (Crook & Basil 2008). Catecholamines (e.g.,
noradrenaline, adrenalin and dopamine) and serotonin (5-HT) were identified by HPLC with
electrochemical detection and by immunohistochemistry, respectively, in the central
cardiovascular system of Nautilus pompilius Linne (Springer et al. 2005). The nerve fibers of the
shell-producing organs (mantle and siphuncle) in Nautilus pompilius contain the neurotransmitter
acetylcholine, catecholamines and Phe-Met-Phe-Arg-NH2 (FMFR-amide) (Westermann et al.
2002).
The importance of Aplysia californica as a reductionist model for studies in molecular
neurobiology, electrophysiology, learning, and memory has steadily increased over the past three
decades (Capo et al. 2009, Kandel 2001, Moroz et al. 2006). This marine algavore inhabits
intertidal and sublittoral zones along the Pacific coast of the United States and Mexico, where it
lays large benthic egg masses (Capo et al. 2009). Eggs hatch after 7-10 days, releasing
planktotrophic veliger larvae, which have been reported to remain in the plankton for at least 35
days, and then pass through metamorphosis, juvenile, and adult Aplysia stages (Kriegstein et al.
1974). Aplysia ganglia and individual neurons were analyzed by assaying the biosynthetic
enzyme which decarboxylates DOPA and 5-HTP to form dopamine or 5-HT, respectively
103

(Weinreich et al. 1972). Embryonic cells containing catecholamines, Phe-Met-Arg-Phe-NH2
(FMRF-amide), and 5-HT were identified by immunohistochemistry in Aplysia (Dickinson et al.
2000).
However, there have been few direct chemical analyses of signaling molecules in the giant
axon of Squid, in the specific body parts of Nautilus (e.g., neurons, muscles, retina cells, and
cerebral cord), or in the chemosensory and embryonic cells of Aplysia californica. In order to
address this issue, L-arginine and citrulline determinations, as well as general amino-acid
profiling of the basal animals were performed. Capillary electrophoresis (CE) was used because
of its efficient and ultra-small-volume capabilities for the separation and analysis of charged
species. As described in Chapter 2, CE has been widely used for the analysis of amino acids and
derivatives (Zhu et al. 2005, Boudko 2007, Poinsot et al. 2008). As most analytes are not
fluorescent, they are commonly derivatized using fluorogenic reagents that either are not
fluorescent prior to reaction or have nonfluorescent hydrolysis products. o-Phthalaldehyde
(OPA) was chosen as the derivatization reagent in this work, because it is a fluorogenic reagent
which reacts with analytes within a few seconds. In addition, for nitrite and nitrate detection,
contactless conductivity detection (CCD) was used, due to the excellent sensitivity to small ions.
Methods and Materials
Chemicals and Reagents
All chemicals for buffers were purchased from Sigma-Aldrich, and standard amino acids
were purchased from Fluka. Ultrapure Milli-Q water (Milli-Q filtration system, Millipore,
Bedford, MA) was used for all buffers, standard solutions, and sample preparations.
Sample Preparation
Freshly caught squid (Loligo pealei), were obtained at the Marine Biological Laboratory
(Woods Hole, MA, USA), and the giant axon (0.9mm in diameter and 1.5cm in length) was
104
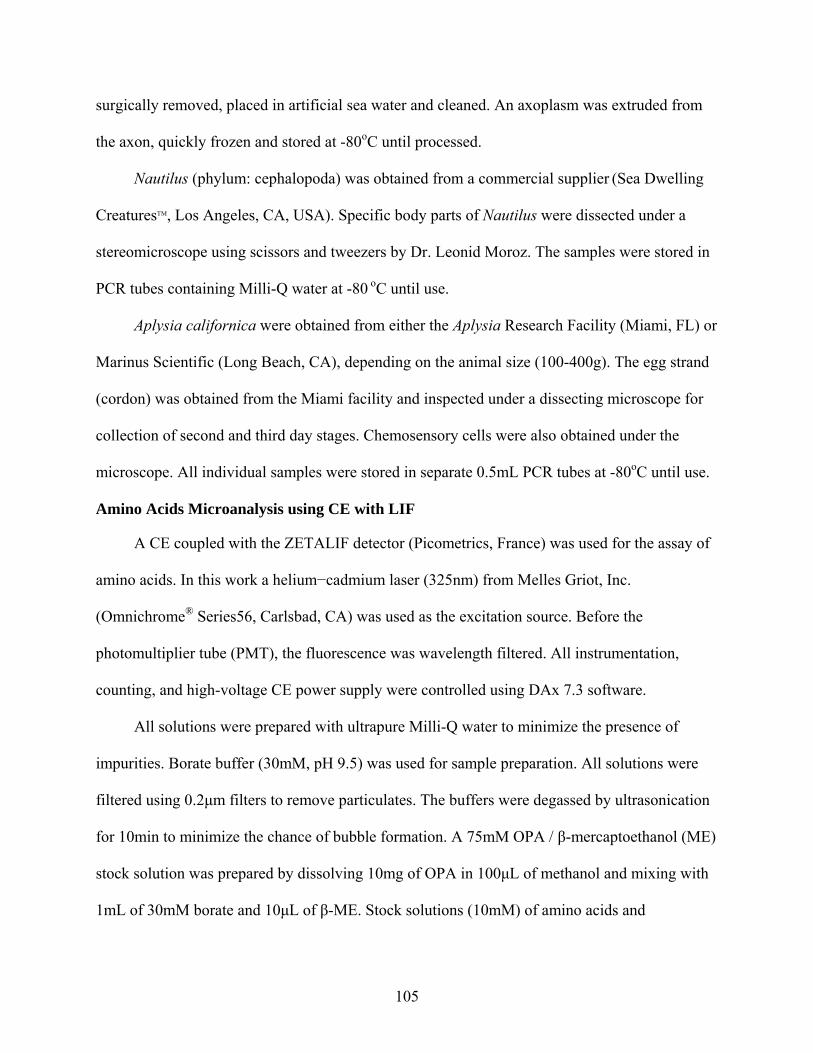
surgically removed, placed in artificial sea water and cleaned. An axoplasm was extruded from
the axon, quickly frozen and stored at -80oC until processed.
Nautilus (phylum: cephalopoda) was obtained from a commercial supplier (Sea Dwelling
CreaturesTM, Los Angeles, CA, USA). Specific body parts of Nautilus were dissected under a
stereomicroscope using scissors and tweezers by Dr. Leonid Moroz. The samples were stored in
PCR tubes containing Milli-Q water at -80 oC until use.
Aplysia californica were obtained from either the Aplysia Research Facility (Miami, FL) or
Marinus Scientific (Long Beach, CA), depending on the animal size (100-400g). The egg strand
(cordon) was obtained from the Miami facility and inspected under a dissecting microscope for
collection of second and third day stages. Chemosensory cells were also obtained under the
microscope. All individual samples were stored in separate 0.5mL PCR tubes at -80oC until use.
Amino Acids Microanalysis using CE with LIF
A CE coupled with the ZETALIF detector (Picometrics, France) was used for the assay of
amino acids. In this work a helium−cadmium laser (325nm) from Melles Griot, Inc.
(Omnichrome® Series56, Carlsbad, CA) was used as the excitation source. Before the
photomultiplier tube (PMT), the fluorescence was wavelength filtered. All instrumentation,
counting, and high-voltage CE power supply were controlled using DAx 7.3 software.
All solutions were prepared with ultrapure Milli-Q water to minimize the presence of
impurities. Borate buffer (30mM, pH 9.5) was used for sample preparation. All solutions were
filtered using 0.2μm filters to remove particulates. The buffers were degassed by ultrasonication
for 10min to minimize the chance of bubble formation. A 75mM OPA / β-mercaptoethanol (ME)
stock solution was prepared by dissolving 10mg of OPA in 100μL of methanol and mixing with
1mL of 30mM borate and 10μL of β-ME. Stock solutions (10mM) of amino acids and
105

neurotransmitters were prepared by dissolving each compound in the borate buffer. OPA and β-
ME were stored in a refrigerator, and fresh solutions were prepared weekly.
All experiments were conducted using a 75cm length of 50μm I.D. × 360μm O.D. fused
silica capillary (Polymicro Technologies, AZ). A 30mM borate/30mM sodium dodecyl sulfate
(SDS) electrolyte (adjusted to pH 10.0 with NaOH) was used as the separation buffer for amino
acid analysis. In pre-column derivatization, 1μL of OPA was incubated in a 0.5mL PCR tube
with 18µL of sample, and 1µL internal standard (total volume = 20μL). For separation steps, the
capillary inner-wall was successively washed with 1M NaOH, Milli Q water, and the separation
buffer by applying pressure (1900mbar) to the inlet vial. Then the sample was loaded using
electrokinetic injection (8kV for 12s). The separation was performed under a stable 20kV voltage
at 20˚C.
Nitrite/Nitrate Microanalysis using CE with Contactless Conductivity
Capillary electrophoresis coupled with a TraceDec contactless conductivity detector
(Strasshof, Austria) was used for the assay of nitrite and nitrate in Trichoplax. In order to
decrease the concentration of Cl- in a sample, OnGuard II Ag (DIONEX Corp., Sunnyvale, CA)
was purchased. Since small sample volumes (20μL) were involved, custom-built cartridges were
prepared as described in Chapter 3.
The buffer preparation, injection procedure, and separation are described in Chapter 4.
Data Analysis
After an electropherogram was acquired, peaks were assigned based on the electrophoretic
mobility of each analyte, and the assignments were confirmed by spiking corresponding
standards into the sample. Five-point calibration curves (peak area vs. concentration) of analytes
106
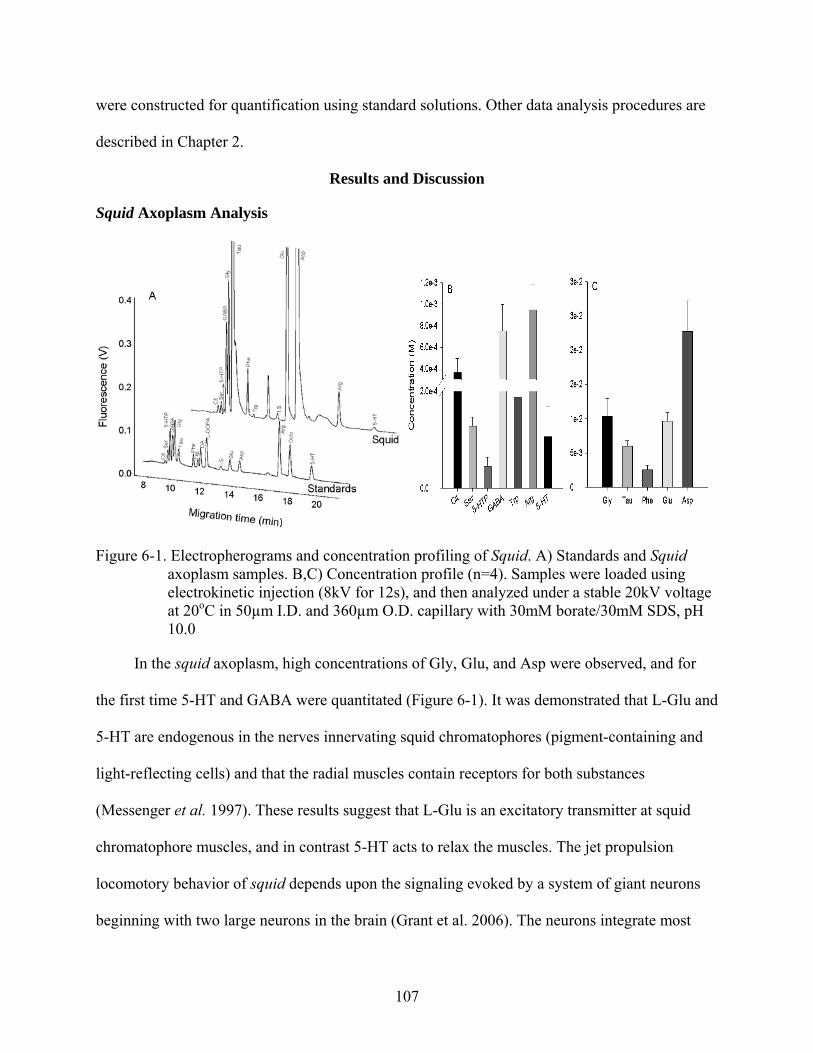
were constructed for quantification using standard solutions. Other data analysis procedures are
described in Chapter 2.
Results and Discussion
Squid Axoplasm Analysis
Figure 6-1. Electropherograms and concentration profiling of Squid. A) Standards and Squid axoplasm samples. B,C) Concentration profile (n=4). Samples were loaded using electrokinetic injection (8kV for 12s), and then analyzed under a stable 20kV voltage at 20oC in 50µm I.D. and 360µm O.D. capillary with 30mM borate/30mM SDS, pH 10.0
In the squid axoplasm, high concentrations of Gly, Glu, and Asp were observed, and for
the first time 5-HT and GABA were quantitated (Figure 6-1). It was demonstrated that L-Glu and
5-HT are endogenous in the nerves innervating squid chromatophores (pigment-containing and
light-reflecting cells) and that the radial muscles contain receptors for both substances
(Messenger et al. 1997). These results suggest that L-Glu is an excitatory transmitter at squid
chromatophore muscles, and in contrast 5-HT acts to relax the muscles. The jet propulsion
locomotory behavior of squid depends upon the signaling evoked by a system of giant neurons
beginning with two large neurons in the brain (Grant et al. 2006). The neurons integrate most
107

sensory input to transmit excitatory impulses by L-Glu to the dorsal stellate ganglia and giant
axons that innervate the muscles of the mantle.
Figure 6-2. Nitrite and nitrate electropherograms and concentration profile. A) Squid axoplasm. B) Concentration profiles of Squid axoplasm (n=3)
Furthermore, Arg and Cit were present in high concentration (Figure 6-1) as well as nitrite
and nitrate (Figure 6-2). It was demonstrated that NO is an integral part of the complex
mechanisms implicated in the initiation and maintenance of the symbiont infection of the light
organ of the Hawaiian bobtail squid, Euprymna scolopes, by symbiotic Vibrio fischeri cells
(Davidson et al. 2004). Indeed, it was shown that NO was released into the mucus secreted by
the light organ, where the symbiotic bacteria aggregated before migrating into the final sites of
colonization (Palumbo 2005). In earlier work on the Sepia officinalis ink gland cells, activation
of the NMDA glutamate receptor caused an influx of calcium (Palumbo et al. 2000). The
calcium binds to calmodulin and activates NOS to produce NO, which subsequently targets
guanylyl cyclase to produce higher levels of cGMP. The cGMP activates tyrosinase by
phosphorylation through a protein kinase G, with consequent increase of melanin formation
(Palumbo et al. 2000). cGMP also induces secretion of ink constituents from mature cells (Fiore
et al. 2004).
108

The results in figure 6-3 indicate that D-Asp was present in the Squid axoplasm. The D-
Asp may play an important role in the synaptic signaling. It was reported that neither D- nor L-
Asp was capable of gating a squid glutamate receptor (SqGluR). However when applied
alongside glutamate, both isomers slowed significant glutamate gating of the current, opening the
possibility that these substances could act as neuromodulators (Brown et al. 2007).
Figure 6-3. Electropherograms and concentration profile of Glu and Asp enantiomers in the Squid axoplasm. A) Standards and Squid. B) Enantiomer concentrations (n=3). Samples were loaded using electrokinetic injection (8kV for 12s) and then analyzed under a stable 20kV voltage at 20oC in 50µm I.D. and 360µm O.D. capillary with 15mM borate and 10mM β-CD, pH 10.0
Nautilus Analysis
The cerebral cord, retina cells, muscle, and neurons of Nautilus were investigated. As
shown in figure 6-4, the cerebral cord contains high concentrations of Arg, Cit, and GABA. In
the Nautilus heart region, endothelia nitric oxide synthase (eNOS) was identified on endothelial
cells, where the heart may be modulated (Springer et al. 2004). In the study of the nerve endings
of the mantle and the siphuncle, it was demonstrated that reactions were occurring by using
antibodies against serotonin and the tetrapeptide FMRF-amide, and observing the presence of
specific acetylcholinesterase yielded positive results (Westermann et al. 2002). Additionally, the
109

HPLC-analyses showed that in the mantle and in the siphuncle the contents of dopamine were
190ng and 160ng per gram of tissue, respectively, suggesting that dopamine may be a
neurotransmitter.
Figure 6-4. Electropherograms and concentration profiling of Nautilus. A) Specific body regions. Arrows: red (5-HTP) and black (Gly). B) Concentration profile (n=4). Samples were loaded using electrokinetic injection (8kV for 12s), and then analyzed under a stable 20kV voltage at 20oC in 50µm I.D. and 360µm O.D. capillary with 30mM borate/30mM SDS, pH 10.0
Figure 6-5. Nitrite and nitrate electropherograms and concentration profile. A) Specific body parts of Nautilus. B) Concentration profiles of Nautilus (n=3)
110

In figure 6-5B, muscle contains the relatively high concentration of nitrite and shows the
large Arg-to-Cit ratio, suggesting that nitric oxide acts as a vasodilatator or signaling molecule. It
was reported that NO donor S-nitroso-N-acetylpenicillamine (SNAP) caused relaxation from the
star fish Asterias rubens- tube feet and the apical muscle of the body wall (Melarange & Elphick
2003).
Figure 6-6. Electropherograms and concentration profile of glu and asp enantiomers in the Nautilus. A) Nautilus body parts. B) Enantiomer concentrations (n=3). Samples were loaded using electrokinetic injection (8kV for 12s) and then analyzed under a stable 20kV voltage at 20oC in 50µm I.D. and 360µm O.D. capillary with 15mM borate and 10mM β-CD, pH 10.0
Interestingly, D-Asp was present in the samples except the retina cells (Figure 6-6).
Previous work by D`Aniello et al showed that in the retina of Sepia officinalis, D-Asp occured at
relative high concentrations (2.0-3.0 μmol/g tissue) (D'Aniello et al. 2005). When the animal was
left in the dark, the concentrations of D-Asp significantly decreased in the retina; however, when
the animals were exposed to the light again, D-Asp returned to the previous levels (D'Aniello
2007). In contrast, in our result the retina cells of Nautilus D-Asp was not present possibly
because the Nautilus has been considered that the structure and visual acuity of the primitive,
111

lensless eye lends support to the hypothesis that vision is of limited use in the deep ocean (Crook
& Basil 2008).
Aplysia californica Analysis
In Aplysia chemosensory cells, relatively high concentrations of Gly, Tau, Glu, and Asp
were observed, as well as high levels of Arg and Cit (Figure 6-7A,B). Also, nitrite was present in
the millimolar concentration (Figure 6-7C,D). The distribution of putative nitric oxide synthase
(NOS)-containing cells in the mollusc Aplysia californica was studied by using NADPH-
diaphorase (NADPH-d) histochemistry, and it showed that chemosensory areas (the mouth area,
rhinophores, and tentacles) expressed the most intense staining, implying a role for NO as a
modulator of chemosensory processing (Moroz 2006). A role for the NO-cGMP pathway in
mediating chemosensory activation of feeding in the mollusc Lymnaea stagnalis was suggested
by intense NADPH diaphorase staining observed in nerve fibers that project from sensory cells
in the lips to the CNS and by the presence in the CNS of a NO-activated guanylyl cyclase
(Elphick et al. 1995). Also, behavioral experiments on the L. stagnalis showed that hemoglobin
(NO scavenger) prevented feeding and methylene blue (inhibitor of guanylyl cyclase)
significantly delayed the onset of feeding.
Mobley et al (Mobley et al. 2008) used the metabolite profiling (e.g., Arg, Glu, Asp, Gly,
Tau, and Glutathione) technique to determine whether metabolite profiles can identify cell
classes of chemosensory tissues within and across different species, including mouse, zebrafish,
lobster and squid. For example, the high arginine and low taurine content in lobster statistically
separated its olfactory receptor neuron (ORN) classes from those of other species. High glycine
content throughout the zebrafish olfactory epithelium (OE) separated most of its cell classes
from the other species. Although chemosensory systems across species share many similarities,
112
the heterogeneous environments, osmotic pressure, and toxicant exposure create differences that
are reflected in their metabolite profiles.
Figure 6-7. Electropherogram and concentration profiles of Aplysia californica chemosensory cells. A, B) Major amino acids profiling by CE-LIF. C, D) Nitrite and nitrate profiling by CE-CCD. (n=3)
The embryonic cells (2-3 days after egg-laying) were analyzed to profile amino acids and
nitrite and nitrate (Figure 6-8). Previous work by Dickinson et al (Dickinson et al. 2000) showed
that Phe-Met-Arg-Phe-NH2 (FMRFamide)-like-immunoreactive (LIR) cells first appeared during
the trochophore stage (2.5-4 days after egg-laying), that by the veliger stage (5-7 days) serotonin-
LIR cells appeared in the apical organ, and that shortly before hatching (8-10 days)
catecholamine-containing cells appeared around the mouth and in the foot in the mullusc Aplysia
113

californica (Dickinson et al. 2000). In addition, in another mollusc Phestilla sibogae cells
containing 5-HT, catecholamines, and FMRFamide-like peptides were already present by the
earliest veliger stages (5-7 days), but the trochophore stage was not explored because the
autofluorescent yolk obscured visualization in these earliest embryos (Croll 2006).
Figure 6-8. Electropherograms and concentration profiles of embryonic cells of Aplysia californica. A) Amino acid profiles. 2nd day sample (70-fold dilution) and 3rd day sample (167-fold dilution). B, C) Major amino acid concentrations in the cells. D) Nitrite and nitrate. E) Concentrations of nitrite and nitrate. (n=3)
Conclusion
The present study shows that there are distinct differences in metabolites among mulluscs,
including the axoplasm of squid, the CNS of Nautilus, and chemosensory and embryonic cells of
114

115
Aplysia californica. Serotonin-containing axoplasm was identified in the giant axon of squid. In
neuron and muscle of Nautilus, 5-HT was also present and may play a role as a neuromodulator.
Along with the NADPH-d results (Moroz 2006), nitric oxide-metabolites (Arg, Cit, nitrite, and
nitrate) provided additional evidence that chemosensory cells use NO to activate the feeding
mechanism in Aplysia californica. These results further can be used to understand the CNS in the
mollusca and even to compare with other phyla animals.

LIST OF REFERENCES
Amatore, C., Arbault, S., Bouret, Y., Cauli, B., Guille, M., Rancillac, A. and Rossier, J. (2006) Nitric oxide release during evoked neuronal activity in cerebellum slices: detection with platinized carbon-fiber microelectrodes. Chemphyschem, 7, 181-187.
Anctil, M. (1985) Cholinergic and monoaminergic mechanisms associated with control of
bioluminescence in the ctenophore Mnemiopsis Leidyi. Journal of Experimental Biology, 119, 225-238.
Anctil, M., Poulain, I. and Pelletier, C. (2005) Nitric oxide modulates peristaltic muscle activity
associated with fluid circulation in the sea pansy Renilla koellikeri. The Journal of experimental biology, 208, 2005-2017.
Antzoulatos, E. G. and Byrne, J. H. (2004) Learning insights transmitted by glutamate. Trends in
neurosciences, 27, 555-560. Arundine, M., Sanelli, T., Ping He, B. and Strong, M. J. (2003) NMDA induces NOS 1
translocation to the cell membrane in NGF-differentiated PC 12 cells. Brain research, 976, 149-158.
Bakry, R., Huck, C. W., Najam-ul-Haq, M., Rainer, M. and Bonn, G. K. (2007) Recent advances
in capillary electrophoresis for biomarker discovery. Journal of separation science, 30, 192-201.
Bardelmeijer, H. A., Waterval, J. C., Lingeman, H., van't Hof, R., Bult, A. and Underberg, W. J.
(1997) Pre-, on- and post-column derivatization in capillary electrophoresis. Electrophoresis, 18, 2214-2227.
Beckers, J. L. (1995) Steady-state models in electrophoresis: from isotachoporesis to capillary
zone electrophoresis. Electrophoresis, 16, 1987-1998. Beckers, J. L. (2003) Ampholytes as background electrolytes in capillary zone electrophoresis:
sense or nonsense? Histidine as a model ampholyte. Electrophoresis, 24, 548-556. Bellis, S. L., Grosvenor, W., Kass-Simon, G. and Rhoads, D. E. (1991) Chemoreception in
Hydra vulgaris (attenuata): initial characterization of two distinct binding sites for -glutamic acid. Biochimica et Biophysica Acta (BBA) - Biomembranes, 1061, 89-94.
Bergquist, J., Vona, M. J., Stiller, C. O., O'Connor, W. T., Falkenberg, T. and Ekman, R. (1996)
Capillary electrophoresis with laser-induced fluorescence detection: a sensitive method for monitoring extracellular concentrations of amino acids in the periaqueductal grey matter. Journal of neuroscience methods, 65, 33-42.
Bodnarova, M., Martasek, P. and Moroz, L. L. (2005) Calcium/calmodulin-dependent nitric
oxide synthase activity in the CNS of Aplysia californica: biochemical characterization and link to cGMP pathways. Journal of inorganic biochemistry, 99, 922-928.
116

Boeckxstaens, G. E. and Pelckmans, P. A. (1997) Nitric oxide and the non-adrenergic non-cholinergic neurotransmission. Comp Biochem Physiol A Physiol, 118, 925-937.
Boudko, D. Y. (2007) Bioanalytical profile of the L-arginine/nitric oxide pathway and its
evaluation by capillary electrophoresis. Journal of chromatography, 851, 186-210. Boudko, D. Y., Cooper, B. Y., Harvey, W. R. and Moroz, L. L. (2002) High-resolution
microanalysis of nitrite and nitrate in neuronal tissues by capillary electrophoresis with conductivity detection. J Chromatogr B Analyt Technol Biomed Life Sci, 774, 97-104.
Boulat, O., McLaren, D. G., Arriaga, E. A. and Chen, D. D. (2001) Separation of free amino
acids in human plasma by capillary electrophoresis with laser induced fluorescence: potential for emergency diagnosis of inborn errors of metabolism. J Chromatogr B Biomed Sci Appl, 754, 217-228.
Brown, E. R., Piscopo, S., Chun, J. T., Francone, M., Mirabile, I. and D'Aniello, A. (2007)
Modulation of an AMPA-like glutamate receptor (SqGluR) gating by L- and D-aspartic acids. Amino acids, 32, 53-57.
Bryan, N. S. (2006) Nitrite in nitric oxide biology: cause or consequence? A systems-based
review. Free radical biology & medicine, 41, 691-701. Bryan, N. S., Fernandez, B. O., Bauer, S. M. et al. (2005) Nitrite is a signaling molecule and
regulator of gene expression in mammalian tissues. Nature chemical biology, 1, 290-297. Capo, T. R., Bardales, A. T., Gillette, P. R., Lara, M. R., Schmale, M. C. and Serafy, J. E. (2009)
Larval growth, development, and survival of laboratory-reared Aplysia californica: effects of diet and veliger density. Comp Biochem Physiol C Toxicol Pharmacol, 149, 215-223.
Causse, E., Siri, N., Arnal, J. F., Bayle, C., Malatray, P., Valdiguie, P., Salvayre, R. and Couderc,
F. (2000) Determination of asymmetrical dimethylarginine by capillary electrophoresis-laser-induced fluorescence. J Chromatogr B Biomed Sci Appl, 741, 77-83.
Chen, F. G., Wang, C., Zhi, D. Y. and Xia, G. M. (2005) Analysis of amino acids in individual
wheat embryonic protoplast. Amino acids, 29, 235-239. Chung, J. M., Spencer, A. N. and Gahm, K. H. (1989) Dopamine in tissues of the hydrozoan
jellyfishPolyorchis penicillatus as revealed by HPLC and GC/MS Journal of Comparative Physiology B: Biochemical, Systemic, and Environmental Physiology, 159, 173-181.
Claus, N. (2008) Six major steps in animal evolution: are we derived sponge larvae? Evolution &
Development, 10, 241-257.
117

Colasanti, M., Venturini, G., Merante, A., Musci, G., Lauro, G.M. (1997) Nitric oxide involvement in Hydra vulgaris very primitive olfactory- like system. Journal of Neuroscience, 17, 493-499.
Corrigan, J. J. (1969) D-amino acids in animals. Science (New York, N.Y, 164, 142-149. Cristino, L., Guglielmotti, V., Cotugno, A., Musio, C. and Santillo, S. (2008) Nitric oxide
signaling pathways at neural level in invertebrates: functional implications in cnidarians. Brain research, 1225, 17-25.
Croll, R. P. (2006) Development of embryonic and larval cells containing serotonin,
catecholamines, and FMRFamide-related peptides in the gastropod mollusc Phestilla sibogae. The Biological bulletin, 211, 232-247.
Crook, R. and Basil, J. (2008) A biphasic memory curve in the chambered nautilus, Nautilus
pompilius L. (Cephalopoda: Nautiloidea). The Journal of experimental biology, 211, 1992-1998.
Cruz, L., Moroz, L. L., Gillette, R. and Sweedler, J. V. (1997) Nitrite and nitrate levels in
individual molluscan neurons: single-cell capillary electrophoresis analysis. Journal of neurochemistry, 69, 110-115.
D'Aniello, A. (2007) D-Aspartic acid: an endogenous amino acid with an important
neuroendocrine role. Brain research reviews, 53, 215-234. D'Aniello, A., Di Fiore, M. M., Fisher, G. H., Milone, A., Seleni, A., D'Aniello, S., Perna, A. F.
and Ingrosso, D. (2000) Occurrence of D-aspartic acid and N-methyl-D-aspartic acid in rat neuroendocrine tissues and their role in the modulation of luteinizing hormone and growth hormone release. Faseb J, 14, 699-714.
D'Aniello, S., Spinelli, P., Ferrandino, G., Peterson, K., Tsesarskia, M., Fisher, G. and D'Aniello,
A. (2005) Cephalopod vision involves dicarboxylic amino acids: D-aspartate, L-aspartate and L-glutamate. The Biochemical journal, 386, 331-340.
D'Atri, L. P., Malaver, E., Romaniuk, M. A., Pozner, R. G., Negrotto, S. and Schattner, M.
(2009) Nitric oxide: news from stem cells to platelets. Current medicinal chemistry, 16, 417-429.
Dasgupta, P. K. and Bao, L. (1993) Suppressed conductometric capillary electrophoresis
separation systems. Analytical chemistry, 65, 1003-1011. Davidson, S. K., Koropatnick, T. A., Kossmehl, R., Sycuro, L. and McFall-Ngai, M. J. (2004)
NO means 'yes' in the squid-vibrio symbiosis: nitric oxide (NO) during the initial stages of a beneficial association. Cellular Microbiology, 6, 1139-1151.
Davies, S. A. (2006) Signalling via cGMP: lessons from Drosophila. Cellular signalling, 18,
409-421.
118

Dickinson, A. J., Croll, R. P. and Voronezhskaya, E. E. (2000) Development of embryonic cells containing serotonin, catecholamines, and FMRFamide-related peptides in Aplysia californica. The Biological bulletin, 199, 305-315.
Dunn, C. W., Hejnol, A., Matus, D. Q. et al. (2008) Broad phylogenomic sampling improves
resolution of the animal tree of life. Nature, 452, 745-749. Ellwanger, K., Eich, A. and Nickel, M. (2007) GABA and glutamate specifically induce
contractions in the sponge Tethya wilhelma. Journal of comparative physiology, 193, 1-11.
Elphick, M. R., Kemenes, G., Staras, K. and O'Shea, M. (1995) Behavioral role for nitric oxide
in chemosensory activation of feeding in a mollusc. J Neurosci, 15, 7653-7664. Fernie, A. R., Trethewey, R. N., Krotzky, A. J. and Willmitzer, L. (2004) Metabolite profiling:
from diagnostics to systems biology. Nature reviews, 5, 763-769. Fiehn, O., Kopka, J., Dormann, P., Altmann, T., Trethewey, R. N. and Willmitzer, L. (2000)
Metabolite profiling for plant functional genomics. Nature biotechnology, 18, 1157-1161. Fiore, G., Poli, A., Di Cosmo, A., d'Ischia, M. and Palumbo, A. (2004) Dopamine in the ink
defence system of Sepia officinalis: biosynthesis, vesicular compartmentation in mature ink gland cells, nitric oxide (NO)/cGMP-induced depletion and fate in secreted ink. The Biochemical journal, 378, 785-791.
Floyd, P. D., Moroz, L. L., Gillette, R. and Sweedler, J. V. (1998) Capillary electrophoresis
analysis of nitric oxide synthase related metabolites in single identified neurons. Analytical chemistry, 70, 2243-2247.
Fukuto, J. M. C., J.Y.; Switzer, C.H (2000) The Chemical Properties of NO and Related
Nitrogen Oxides. In: Nitric Oxide Biology and Pathobiology, (L. J. Ignarro ed.), pp. 23. Academic Press.
Gao, L., Barber-Singh, J., Kottegoda, S., Wirtshafter, D. and Shippy, S. A. (2004) Determination
of nitrate and nitrite in rat brain perfusates by capillary electrophoresis. Electrophoresis, 25, 1264-1269.
Gao, L., Pulido, J. S., Hatfield, R. M., Dundervill, R. F., 3rd, McCannel, C. A. and Shippy, S. A.
(2007) Capillary electrophoretic assay for nitrate levels in the vitreous of proliferative diabetic retinopathy. J Chromatogr B Analyt Technol Biomed Life Sci, 847, 300-304.
Garcia, R. A. (1996) Glutamate uptake by squid nerve fiber sheaths. Journal of neurochemistry,
67, 787-794. Garcia, R. A. and Villegas, J. (1995) Aspartate aminotransferase and glutamate dehydrogenase
activities in the squid giant nerve. Journal of neurochemistry, 64, 437-442.
119
Garthwaite, J. and Boulton, C. L. (1995) Nitric oxide signaling in the central nervous system. Annual review of physiology, 57, 683-706.
Gates, A. T., Lowry, M., Fletcher, K. A., Murugeshu, A., Rusin, O., Robinson, J. W., Strongin, R.
M. and Warner, I. M. (2007) Capillary electrophoretic screening for the inhibition of homocysteine thiolactone-induced protein oligomerization. Analytical chemistry, 79, 8249-8256.
Giovine, M., Pozzolini, M., Favre, A. et al. (2001) Heat stress-activated, calcium-dependent
nitric oxide synthase in sponges. Nitric Oxide, 5, 427-431. Giuditta, A., Chun, J. T., Eyman, M., Cefaliello, C., Bruno, A. P. and Crispino, M. (2008) Local
gene expression in axons and nerve endings: the glia-neuron unit. Physiological reviews, 88, 515-555.
Glavas, S. and Tanner, M. E. (2001) Active site residues of glutamate racemase. Biochemistry,
40, 6199-6204. Grant, P., Zheng, Y. and Pant, H. C. (2006) Squid (Loligo pealei) giant fiber system: a model for
studying neurodegeneration and dementia? The Biological bulletin, 210, 318-333. Guijt, R. M., Evenhuis, C. J., Macka, M. and Haddad, P. R. (2004) Conductivity detection for
conventional and miniaturised capillary electrophoresis systems. Electrophoresis, 25, 4032-4057.
Guzman, N. A., Blanc, T. and Phillips, T. M. (2008) Immunoaffinity capillary electrophoresis as
a powerful strategy for the quantification of low-abundance biomarkers, drugs, and metabolites in biological matrices. Electrophoresis, 29, 3259-3278.
Haber, C., VanSaun, R. J. and Jones, W. R. (1998) Quantitative Analysis of Anions at ppb/ppt
Levels with Capillary Electrophoresis and Conductivity Detection: Enhancement of System Linearity and Precision Using an Internal Standard. Analytical chemistry, 70, 2261-2267.
Hansel, T. T., Kharitonov, S. A., Donnelly, L. E., Erin, E. M., Currie, M. G., Moore, W. M.,
Manning, P. T., Recker, D. P. and Barnes, P. J. (2003) A selective inhibitor of inducible nitric oxide synthase inhibits exhaled breath nitric oxide in healthy volunteers and asthmatics. Faseb J, 17, 1298-1300.
Harris, D. C. (2007) Principles of Capillary Electrophoresis. In: Quantitative Chemical Analysis,
pp. 603-622. W.H. Freeman and Company, New York. Heyland, A., Sohn, D., Leys, S. and Moroz, L. L. (2008) Cell biology and behavior of the
Placozoan Trichoplax adherens: Identification of transmitters and cells with neuron-like propertie. In: Society for Neuroscience. Society for Neuroscience, Washington, DC.
120
Hulvey, M. K. and Martin, R. S. (2009) A microchip-based endothelium mimic utilizing open reservoirs for cell immobilization and integrated carbon ink microelectrodes for detection. Analytical and bioanalytical chemistry, 393, 599-605.
Iadarola, P., Ferrari, F., Fumagalli, M. and Viglio, S. (2008) Determination of amino acids by
micellar EKC: recent advances in method development and novel applications to different matrices. Electrophoresis, 29, 224-236.
Ignarro, L. J. (1990) Biosynthesis and metabolism of endothelium-derived nitric oxide. Annual
review of pharmacology and toxicology, 30, 535-560. Ignarro, L. J. (2000) Nitric Oxide: Biology and Pathobiology. Academic Press. Ignarro, L. J., Buga, G. M., Wood, K. S., Byrns, R. E. and Chaudhuri, G. (1987) Endothelium-
derived relaxing factor produced and released from artery and vein is nitric oxide. Proceedings of the National Academy of Sciences of the United States of America, 84, 9265-9269.
Ignarro, L. J., Fukuto, J. M., Griscavage, J. M., Rogers, N. E. and Byrns, R. E. (1993) Oxidation
of nitric oxide in aqueous solution to nitrite but not nitrate: comparison with enzymatically formed nitric oxide from L-arginine. Proceedings of the National Academy of Sciences of the United States of America, 90, 8103-8107.
Jager, M., Queinnec, E., Chiori, R., Le Guyader, H. and Manuel, M. (2008) Insights into the
early evolution of SOX genes from expression analyses in a ctenophore. Journal of experimental zoology. Part B, 310, 650-667.
Juvancz, Z., Kendrovics, R. B., Ivanyi, R. and Szente, L. (2008) The role of cyclodextrins in
chiral capillary electrophoresis. Electrophoresis, 29, 1701-1712. Kandel, E. R. (2001) The molecular biology of memory storage: a dialogue between genes and
synapses. Science (New York, N.Y, 294, 1030-1038. Kass-Simon, G. and Pierobon, P. (2007) Cnidarian chemical neurotransmission, an updated
overview. Comparative Biochemistry and Physiology - Part A: Molecular & Integrative Physiology, 146, 9-25.
Katzoff, A., Ben-Gedalya, T. and Susswein, A. J. (2002) Nitric oxide is necessary for multiple
memory processes after learning that a food is inedible in aplysia. J Neurosci, 22, 9581-9594.
Kera, Y., Aoyama, H., Watanabe, N. and Yamada, R. H. (1996) Distribution of D-aspartate
oxidase and free D-glutamate and D-aspartate in chicken and pigeon tissues. Comparative biochemistry and physiology, 115, 121-126.
121

Khaledi, M. G. (1998) High Performance Capillary Electrophoresis: Theory, Techniques, and Applications. In: High Performance Capillary Electrophoresis: Theory, Techniques, and Applications, (J.D.Winefordner ed.), Vol. 146, pp. 791-807. John Wiley & Sons, Inc.
Kikura-Hanajiri, R., Martin, R. S. and Lunte, S. M. (2002) Indirect measurement of nitric oxide
production by monitoring nitrate and nitrite using microchip electrophoresis with electrochemical detection. Analytical chemistry, 74, 6370-6377.
Kim, W. S., Ye, X., Rubakhin, S. S. and Sweedler, J. V. (2006) Measuring nitric oxide in single
neurons by capillary electrophoresis with laser-induced fluorescence: use of ascorbate oxidase in diaminofluorescein measurements. Analytical chemistry, 78, 1859-1865.
Kita, J. M. and Wightman, R. M. (2008) Microelectrodes for studying neurobiology. Current
opinion in chemical biology, 12, 491-496. Kleinbongard, P., Dejam, A., Lauer, T. et al. (2006) Plasma nitrite concentrations reflect the
degree of endothelial dysfunction in humans. Free radical biology & medicine, 40, 295-302.
Kojima, H., Urano, Y., Kikuchi, K., Higuchi, T., Hirata, Y. and Nagano, T. (1999) Fluorescent
Indicators for Imaging Nitric Oxide Production. Angewandte Chemie (International ed, 38, 3209-3212.
Kopp-Scheinpflug, C., Dehmel, S., Tolnai, S., Dietz, B., Milenkovic, I. and Rubsamen, R. (2008)
Glycine-mediated changes of onset reliability at a mammalian central synapse. Neuroscience, 157, 432-445.
Kostal, V., Katzenmeyer, J. and Arriaga, E. A. (2008) Capillary electrophoresis in bioanalysis.
Analytical chemistry, 80, 4533-4550. Kozloff, N. E. (1990a) Phylum Cnidaria: Hydroids, jellyfishes, sea anemones, and their relatives.
In: Invertebrates, Vol. 1, pp. 93-148. Saunders College Publishing. Kozloff, N. E. (1990b) Phylum Ctenophora: Comb jellies and sea gooseberries. In: Invertebrates,
Vol. 1, pp. 151-161. Saunders College Publishing. Kozloff, N. E. (1990c) Phylum Mollusca: Snails, clams, octopuses, and their relatives. In:
Invertebrates, pp. 367-461. Saunders College Publishing. kozloff, N. E. (1990d) Phylum Porifera: Sponges. In: Invertebrates, pp. 73-91. Saunders College
Publishing. Kriegstein, A. R., Castellucci, V. and Kandel, E. R. (1974) Metamorphosis of Aplysia californica
in laboratory culture. Proceedings of the National Academy of Sciences of the United States of America, 71, 3654-3658.
122

Kuo, R. C., Baxter, G. T., Thompson, S. H., Stricker, S. A., Patton, C., Bonaventura, J. and Epel, D. (2000) NO is necessary and sufficient for egg activation at fertilization. Nature, 406, 633-636.
Landers, J. P. (1996) Handbook of Capillary Electrophoresis, Second Edition. CRC. Lapainis, T., Scanlan, C., Rubakhin, S. S. and Sweedler, J. V. (2007) A multichannel native
fluorescence detection system for capillary electrophoretic analysis of neurotransmitters in single neurons. Analytical and bioanalytical chemistry, 387, 97-105.
Lee, J. A., Homma, H., Tashiro, K., Iwatsubo, T. and Imai, K. (1999) D-aspartate localization in
the rat pituitary gland and retina. Brain research, 838, 193-199. Legrand, M., Almac, E., Mik, E. G., Johannes, T., Kandil, A., Bezemer, R., Payen, D. and Ince,
C. (2009) L-NIL prevents renal microvascular hypoxia and increase of renal oxygen consumption after ischemia-reperfusion in rats. American journal of physiology.
Leise, E. M., Kempf, S. C., Durham, N. R. and Gifondorwa, D. J. (2004) Induction of
metamorphosis in the marine gastropod Ilyanassa obsoleta: 5HT, NO and programmed cell death. Acta biologica Hungarica, 55, 293-300.
Lentz, T. L. (1966) Histochemical localization of neurohumors in a sponge. Journal of
Experimental Zoology, 162, 171-179. Lewis, R. S. and Deen, W. M. (1994) Kinetics of the reaction of nitric oxide with oxygen in
aqueous solutions. Chemical research in toxicology, 7, 568-574. Li, Z., Zharikova, A., Bastian, J., Esperon, L., Hebert, N., Mathes, C., Rowland, N. E. and Peris,
J. (2008) High temporal resolution of amino acid levels in rat nucleus accumbens during operant ethanol self-administration: involvement of elevated glycine in anticipation. Journal of neurochemistry, 106, 170-181.
Lieberman, E. M. and Sanzenbacher, E. (1992) Mechanisms of glutamate activation of axon-to-
Schwann cell signaling in the squid. Neuroscience, 47, 931-939. Lim, M. H., Wong, B. A., Pitcock, W. H., Jr., Mokshagundam, D., Baik, M. H. and Lippard, S. J.
(2006) Direct nitric oxide detection in aqueous solution by copper(II) fluorescein complexes. Journal of the American Chemical Society, 128, 14364-14373.
Lincoln, T. M., Wu, X., Sellak, H., Dey, N. and Choi, C. S. (2006) Regulation of vascular
smooth muscle cell phenotype by cyclic GMP and cyclic GMP-dependent protein kinase. Front Biosci, 11, 356-367.
Lundberg, J. O. and Weitzberg, E. (2005) NO generation from nitrite and its role in vascular
control. Arteriosclerosis, thrombosis, and vascular biology, 25, 915-922.
123

Lundberg, J. O., Weitzberg, E., Cole, J. A. and Benjamin, N. (2004) Nitrate, bacteria and human health. Nature reviews, 2, 593-602.
McCauley, D. W. (1997) Serotonin plays an early role in the metamorphosis of the hydrozoan
Phialidium gregarium. Developmental biology, 190, 229-240. Melarange, R. and Elphick, M. R. (2003) Comparative analysis of nitric oxide and SALMFamide
neuropeptides as general muscle relaxants in starfish. The Journal of experimental biology, 206, 893-899.
Messenger, J., Cornwell, C. and Reed, C. (1997) L-Glutamate and serotonin are endogenous in
squid chromatophore nerves. The Journal of experimental biology, 200 (Pt 23), 3043-3054.
Meulemans, A. and Delsenne, F. (1994) Measurement of nitrite and nitrate levels in biological
samples by capillary electrophoresis. J Chromatogr B Biomed Appl, 660, 401-404. Miao, H., Rubakhin, S. S., Scanlan, C. R., Wang, L. and Sweedler, J. V. (2006) D-Aspartate as a
putative cell-cell signaling molecule in the Aplysia californica central nervous system. Journal of neurochemistry, 97, 595-606.
Miao, H., Rubakhin, S. S. and Sweedler, J. V. (2005) Subcellular analysis of D-aspartate.
Analytical chemistry, 77, 7190-7194. Miller, D. J. and Ball, E. E. (2008) Animal evolution: Trichoplax, trees, and taxonomic turmoil.
Curr Biol, 18, R1003-1005. Miyado, T., Wakida, S., Aizawa, H., Shibutani, Y., Kanie, T., Katayama, M., Nose, K. and
Shimouchi, A. (2008) High-throughput assay of nitric oxide metabolites in human plasma without deproteinization by lab-on-a-chip electrophoresis using a zwitterionic additive. Journal of chromatography, 1206, 41-44.
Mobley, A. S., Lucero, M. T. and Michel, W. C. (2008) Cross-species comparison of metabolite
profiles in chemosensory epithelia: an indication of metabolite roles in chemosensory cells. Anat Rec (Hoboken), 291, 410-432.
Morcos, E. and Wiklund, N. P. (2001) Nitrite and nitrate measurement in human urine by
capillary electrophoresis. Electrophoresis, 22, 2763-2768. Moroz, L. L. (2001) Gaseous transmission across time and species. Am. Zool., 41, 304-320. Moroz, L. L. (2006) Localization of putative nitrergic neurons in peripheral chemosensory areas
and the central nervous system of Aplysia californica. The Journal of comparative neurology, 495, 10-20.
124
Moroz, L. L., Dahlgren, R. L., Boudko, D., Sweedler, J. V. and Lovell, P. (2005) Direct single cell determination of nitric oxide synthase related metabolites in identified nitrergic neurons. Journal of inorganic biochemistry, 99, 929-939.
Moroz, L. L., Edwards, J. R., Puthanveettil, S. V. et al. (2006) Neuronal transcriptome of
aplysia: neuronal compartments and circuitry. Cell, 127, 1453-1467. Moroz, L. L. and Gillette, R. (1996) NADPH-diaphorase localization in the CNS and peripheral
tissues of the predatory sea-slug Pleurobranchaea californica. The Journal of comparative neurology, 367, 607-622.
Moroz, L. L., Gillette, R. and Sweedler, J. V. (1999) Single-cell analyses of nitrergic neurons in
simple nervous systems. The Journal of experimental biology, 202, 333-341. Moroz, L. L., Meech, R. W., Sweedler, J. V. and Mackie, G. O. (2004) Nitric oxide regulates
swimming in the jellyfish Aglantha digitale. The Journal of comparative neurology, 471, 26-36.
Moroz, L. L., Norekian, T. P., Pirtle, T. J., Robertson, K. J. and Satterlie, R. A. (2000)
Distribution of NADPH-diaphorase reactivity and effects of nitric oxide on feeding and locomotory circuitry in the pteropod mollusc, Clione limacina. The Journal of comparative neurology, 427, 274-284.
Muller, W. E. G., Ushijima, H., Batel, R., Krasko, A., Borejko, A., Muller, I. M. and Schroder,
H.-C. (2006) Novel mechanism for the radiation-induced bystander effect: Nitric oxide and ethylene determine the response in sponge cells. Mutation Research/Fundamental and Molecular Mechanisms of Mutagenesis, 597, 62-72.
Murad, F. (1999) Discovery of some of the biological effects of nitric oxide and its role in cell
signaling. Bioscience reports, 19, 133-154. Nagano, T. and Yoshimura, T. (2002) Bioimaging of nitric oxide. Chemical reviews, 102, 1235-
1270. Namiki, S., Kakizawa, S., Hirose, K. and Iino, M. (2005) NO signalling decodes frequency of
neuronal activity and generates synapse-specific plasticity in mouse cerebellum. The Journal of physiology, 566, 849-863.
Nathan, C. and Shiloh, M. U. (2000) Reactive oxygen and nitrogen intermediates in the
relationship between mammalian hosts and microbial pathogens. Proceedings of the National Academy of Sciences of the United States of America, 97, 8841-8848.
Oliver, S. G., Winson, M. K., Kell, D. B. and Baganz, F. (1998) Systematic functional analysis
of the yeast genome. Trends in biotechnology, 16, 373-378.
125

Paez, X., Rada, P. and Hernandez, L. (2000) Neutral amino acids monitoring in phenylketonuric plasma microdialysates using micellar electrokinetic chromatography and laser-induced fluorescence detection. J Chromatogr B Biomed Sci Appl, 739, 247-254.
Palumbo, A. (2005) Nitric oxide in marine invertebrates: a comparative perspective. Comp
Biochem Physiol A Mol Integr Physiol, 142, 241-248. Palumbo, A., Poli, A., Di Cosmo, A. and d'Ischia, M. (2000) N-Methyl-D-aspartate receptor
stimulation activates tyrosinase and promotes melanin synthesis in the ink gland of the cuttlefish Sepia officinalis through the nitric Oxide/cGMP signal transduction pathway. A novel possible role for glutamate as physiologic activator of melanogenesis. The Journal of biological chemistry, 275, 16885-16890.
Pang, K. and Martindale, M. Q. (2008a) Ctenophores. Curr Biol, 18, R1119-1120. Pang, K. and Martindale, M. Q. (2008b) Developmental expression of homeobox genes in the
ctenophore Mnemiopsis leidyi. Development genes and evolution, 218, 307-319. Parrot, S., Lambas-Senas, L., Sentenac, S., Denoroy, L. and Renaud, B. (2007) Highly sensitive
assay for the measurement of serotonin in microdialysates using capillary high-performance liquid chromatography with electrochemical detection. J Chromatogr B Analyt Technol Biomed Life Sci, 850, 303-309.
Pasikanti, K. K., Ho, P. C. and Chan, E. C. Y. (2008) Gas chromatography/mass spectrometry in
metabolic profiling of biological fluids. Journal of Chromatography B, 871, 202-211. Patterson, E. E., 2nd, Piyankarage, S. C., Myasein, K. T., Pulido, J. S., Dundervill, R. F., 3rd,
Hatfield, R. M. and Shippy, S. A. (2008) A high-efficiency sample introduction system for capillary electrophoresis analysis of amino acids from dynamic samples and static dialyzed human vitreous samples. Analytical and bioanalytical chemistry, 392, 409-416.
Pauling, L., Robinson, A. B., Teranishi, R. and Cary, P. (1971) Quantitative analysis of urine
vapor and breath by gas-liquid partition chromatography. Proceedings of the National Academy of Sciences of the United States of America, 68, 2374-2376.
Pearce, L. L., Gandley, R. E., Han, W., Wasserloos, K., Stitt, M., Kanai, A. J., McLaughlin, M.
K., Pitt, B. R. and Levitan, E. S. (2000) Role of metallothionein in nitric oxide signaling as revealed by a green fluorescent fusion protein. Proceedings of the National Academy of Sciences of the United States of America, 97, 477-482.
Pereira-Rodrigues, N., Zurgil, N., Chang, S. C., Henderson, J. R., Bedioui, F., McNeil, C. J. and
Deutsch, M. (2005) Combined system for the simultaneous optical and electrochemical monitoring of intra- and extracellular NO produced by glioblastoma cells. Analytical chemistry, 77, 2733-2738.
126
Perovic, S., Krasko, A., Prokic, I., Muller, I. M. and Muller, W. E. (1999) Origin of neuronal-like receptors in Metazoa: cloning of a metabotropic glutamate/GABA-like receptor from the marine sponge Geodia cydonium. Cell and tissue research, 296, 395-404.
Philippe, H., Derelle, R., Lopez, P. et al. (2009) Phylogenomics Revives Traditional Views on
Deep Animal Relationships. Curr Biol. Piepponen, T. P. and Skujins, A. (2001) Rapid and sensitive step gradient assays of glutamate,
glycine, taurine and gamma-aminobutyric acid by high-performance liquid chromatography-fluorescence detection with o-phthalaldehyde-mercaptoethanol derivatization with an emphasis on microdialysis samples. J Chromatogr B Biomed Sci Appl, 757, 277-283.
Pierobon, P., Concas, A., Santoro, G., Marino, G., Minei, R., Pannaccione, A., Mostallino, M. C.
and Biggio, G. (1995) Biochemical and functional identification of GABA receptors in hydra vulgaris. Life Sciences, 56, 1485-1497.
Pierobon, P., Minei, R., Porcu, P., Sogliano, C., Tino, A., Marino, G., Biggio, G. and Concas, A.
(2001) Putative glycine receptors in Hydra: a biochemical and behavioural study. European Journal of Neuroscience, 14, 1659-1666.
Poinsot, V., Rodat, A., Gavard, P., Feurer, B. and Couderc, F. (2008) Recent advances in amino
acid analysis by CE. Electrophoresis, 29, 207-223. Powell, P. R. and Ewing, A. G. (2005) Recent advances in the application of capillary
electrophoresis to neuroscience. Analytical and bioanalytical chemistry, 382, 581-591. Prakash, C., Shaffer, C. L. and Nedderman, A. (2007) Analytical strategies for identifying drug
metabolites. Mass spectrometry reviews, 26, 340-369. Pritchett, J. S., Pulido, J. S. and Shippy, S. A. (2008) Measurement of region-specific nitrate
levels of the posterior chamber of the rat eye using low-flow push-pull perfusion. Analytical chemistry, 80, 5342-5349.
Quan, Z. and Liu, Y. M. (2003) Capillary electrophoretic separation of glutamate enantiomers in
neural samples. Electrophoresis, 24, 1092-1096. Ramoino, P., Gallus, L., Paluzzi, S. et al. (2007) The GABAergic-like system in the marine
demosponge Chondrilla nucula. Microscopy research and technique, 70, 944-951. Rawls, S. M., Gomez, T., Stagliano, G. W. and Raffa, R. B. (2006) Measurement of glutamate
and aspartate in Planaria. Journal of pharmacological and toxicological methods, 53, 291-295.
127

Rodat, A., Kalck, F., Poinsot, V., Feurer, B. and Couderc, F. (2008) An ellipsoidal mirror for detection of laser-induced fluorescence in capillary electrophoresis system: applications for labelled antibody analysis. Electrophoresis, 29, 740-746.
Rogers, B. E., Anderson, C. J., Connett, J. M., Guo, L. W., Edwards, W. B., Sherman, E. L. C.,
Zinn, K. R. and Welch, M. J. (1996) Comparison of Four Bifunctional Chelates for Radiolabeling Monoclonal Antibodies with Copper Radioisotopes: Biodistribution and Metabolism. Bioconjugate Chemistry, 7, 511-522.
Saini, R., Patel, S., Saluja, R., Sahasrabuddhe, A. A., Singh, M. P., Habib, S., Bajpai, V. K. and
Dikshit, M. (2006) Nitric oxide synthase localization in the rat neutrophils: immunocytochemical, molecular, and biochemical studies. Journal of leukocyte biology, 79, 519-528.
Sakai, K., Homma, H., Lee, J. A., Fukushima, T., Santa, T., Tashiro, K., Iwatsubo, T. and Imai,
K. (1998) Emergence of D-aspartic acid in the differentiating neurons of the rat central nervous system. Brain research, 808, 65-71.
Sakarya, O., Armstrong, K. A., Adamska, M., Adamski, M., Wang, I. F., Tidor, B., Degnan, B.
M., Oakley, T. H. and Kosik, K. S. (2007) A Post-Synaptic Scaffold at the Origin of the Animal Kingdom. PLoS ONE, 2, e506.
Salter, M., Duffy, C., Garthwaite, J. and Strijbos, P. J. (1996) Ex vivo measurement of brain
tissue nitrite and nitrate accurately reflects nitric oxide synthase activity in vivo. Journal of neurochemistry, 66, 1683-1690.
Santos, R. M., Lourenco, C. F., Piedade, A. P., Andrews, R., Pomerleau, F., Huettl, P., Gerhardt,
G. A., Laranjinha, J. and Barbosa, R. M. (2008) A comparative study of carbon fiber-based microelectrodes for the measurement of nitric oxide in brain tissue. Biosensors & bioelectronics, 24, 704-709.
Saransaari, P. and Oja, S. S. (2006) Characteristics of taurine release in slices from adult and
developing mouse brain stem. Amino acids, 31, 35-43. Sato, M., Hida, N. and Umezawa, Y. (2005) Imaging the nanomolar range of nitric oxide with an
amplifier-coupled fluorescent indicator in living cells. Proceedings of the National Academy of Sciences of the United States of America, 102, 14515-14520.
Sato, M., Nakajima, T., Goto, M. and Umezawa, Y. (2006) Cell-based indicator to visualize
picomolar dynamics of nitric oxide release from living cells. Analytical chemistry, 78, 8175-8182.
Schierwater, B. (2005) My favorite animal, Trichoplax adhaerens. Bioessays, 27, 1294-1302.
128
Schierwater, B., de Jong, D. and Desalle, R. (2009a) Placozoa and the evolution of Metazoa and intrasomatic cell differentiation. The international journal of biochemistry & cell biology, 41, 370-379.
Schierwater, B., Eitel, M., Jakob, W., Osigus, H. J., Hadrys, H., Dellaporta, S. L., Kolokotronis,
S. O. and Desalle, R. (2009b) Concatenated analysis sheds light on early metazoan evolution and fuels a modern "urmetazoon" hypothesis. PLoS biology, 7, e20.
Schuchert, P. (1993) Trichoplax adhaerens (phylum Placozoa) has cells that react with antibodies
against the neuropeptide RFamide. Acta Zoologica, 74, 115–117. Sheeley, S. A., Miao, H., Ewing, M. A., Rubakhin, S. S. and Sweedler, J. V. (2005) Measuring
D-amino acid-containing neuropeptides with capillary electrophoresis. The Analyst, 130, 1198-1203.
Shigeno, S., Sasaki, T., Moritaki, T., Kasugai, T., Vecchione, M. and Agata, K. (2008) Evolution
of the cephalopod head complex by assembly of multiple molluscan body parts: Evidence from Nautilus embryonic development. Journal of morphology, 269, 1-17.
Shihabi, Z. K. (2000) Stacking in capillary zone electrophoresis. Journal of chromatography,
902, 107-117. Siri, N., Lacroix, M., Garrigues, J. C., Poinsot, V. and Couderc, F. (2006) HPLC-fluorescence
detection and MEKC-LIF detection for the study of amino acids and catecholamines labelled with naphthalene-2,3-dicarboxyaldehyde. Electrophoresis, 27, 4446-4455.
Soh, N., Katayama, Y. and Maeda, M. (2001) A fluorescent probe for monitoring nitric oxide
production using a novel detection concept. The Analyst, 126, 564-566. Song, Y., Feng, Y., LeBlanc, M. H., Zhao, S. and Liu, Y. M. (2006) Assay of trace D-amino
acids in neural tissue samples by capillary liquid chromatography/tandem mass spectrometry. Analytical chemistry, 78, 8121-8128.
Song, Y., Feng, Y., Lu, X., Zhao, S., Liu, C. W. and Liu, Y. M. (2008) D-Amino acids in rat
brain measured by liquid chromatography/tandem mass spectrometry. Neuroscience letters, 445, 53-57.
Spinelli, P., Brown, E. R., Ferrandino, G. et al. (2006) D-aspartic acid in the nervous system of
Aplysia limacina: possible role in neurotransmission. Journal of cellular physiology, 206, 672-681.
Springer, J., Ruth, P., Beuerlein, K., Palus, S., Schipp, R. and Westermann, B. (2005)
Distribution and function of biogenic amines in the heart of Nautilus pompilius L. (Cephalopoda, Tetrabranchiata). Journal of molecular histology, 36, 345-353.
129

Springer, J., Ruth, P., Beuerlein, K., Westermann, B. and Schipp, R. (2004) Immunohistochemical localization of cardio-active neuropeptides in the heart of a living fossil, Nautilus pompilius L. (Cephalopoda, Tetrabranchiata). Journal of molecular histology, 35, 21-28.
Srivastava, M., Begovic, E., Chapman, J. et al. (2008) The Trichoplax genome and the nature of
placozoans. Nature, 454, 955-960. Stowers, A. W., Spring, K. J. and Saul, A. (1995) Preparative scale purification of recombinant
proteins to clinical grade by isotachophoresis. Bio/technology (Nature Publishing Company), 13, 1498-1503.
Strange, K. (2003) From genes to integrative physiology: ion channel and transporter biology in
Caenorhabditis elegans. Physiological reviews, 83, 377-415. Stratford, M. R. (1999) Measurement of nitrite and nitrate by high-performance ion
chromatography. Methods in enzymology, 301, 259-269. Takayama, C. and Inoue, Y. (2004) GABAergic signaling in the developing cerebellum.
Anatomical science international / Japanese Association of Anatomists, 79, 124-136. Tamm, S. L. and Tamm, S. (2002) Novel bridge of axon-like processes of epithelial cells in the
aboral sense organ of ctenophores. Journal of morphology, 254, 99-120. Tivesten, A. and Folestad, S. (1997) Chiral o-phthaldialdehyde reagents for fluorogenic on-
column labeling of D- and L-amino acids in micellar electrokinetic chromatography. Electrophoresis, 18, 970-977.
Trapp, G., Sydow, K., Dulay, M. T., Chou, T., Cooke, J. P. and Zare, R. N. (2004) Capillary
electrophoretic and micellar electrokinetic separations of asymmetric dimethyl-L-arginine and structurally related amino acids: quantitation in human plasma. Journal of separation science, 27, 1483-1490.
Tseng, H. M., Li, Y. and Barrett, D. A. (2007) Profiling of amine metabolites in human biofluids
by micellar electrokinetic chromatography with laser-induced fluorescence detection. Analytical and bioanalytical chemistry, 388, 433-439.
Tukiainen, T., Tynkkynen, T., Makinen, V. P. et al. (2008) A multi-metabolite analysis of serum
by 1H NMR spectroscopy: early systemic signs of Alzheimer's disease. Biochemical and biophysical research communications, 375, 356-361.
Ummadi, M. and Weimer, B. C. (2002) Use of capillary electrophoresis and laser-induced
fluorescence for attomole detection of amino acids. Journal of chromatography, 964, 243-253.
130

Victor, V. M., Rocha, M. and De la Fuente, M. (2004) Immune cells: free radicals and antioxidants in sepsis. International immunopharmacology, 4, 327-347.
Weinreich, D., Dewhurst, S. A. and McCaman, R. E. (1972) Metabolism of putative transmitters
in individual neurons of Aplysia californica: aromatic amino acid decarboxylase. Journal of neurochemistry, 19, 1125-1130.
Westermann, B., Beuerlein, K., Hempelmann, G. and Schipp, R. (2002) Localization of putative
neurotransmitters in the mantle and siphuncle of the mollusc Nautilus pompilius L. (Cephalopoda). The Histochemical journal, 34, 435-440.
Williamson, R. and Chrachri, A. (2004) Cephalopod neural networks. Neuro-Signals, 13, 87-98. Wilson, I. D., Plumb, R., Granger, J., Major, H., Williams, R. and Lenz, E. M. (2005) HPLC-
MS-based methods for the study of metabonomics. J Chromatogr B Analyt Technol Biomed Life Sci, 817, 67-76.
Wishart, D. S., Tzur, D., Knox, C. et al. (2007) HMDB: the Human Metabolome Database.
Nucleic acids research, 35, D521-526. Xiayan, L. and Legido-Quigley, C. (2008) Advances in separation science applied to
metabonomics. Electrophoresis, 29, 3724-3736. Xu, Z. R., Lan, Y., Fan, X. F. and Li, Q. (2009) Automated sampling system for the analysis of
amino acids using microfluidic capillary electrophoresis. Talanta, 78, 448-452. Ye, X., Kim, W. S., Rubakhin, S. S. and Sweedler, J. V. (2007) Ubiquitous presence of
argininosuccinate at millimolar levels in the central nervous system of Aplysia californica. Journal of neurochemistry, 101, 632-640.
Ye, X., Rubakhin, S. S. and Sweedler, J. V. (2008) Detection of nitric oxide in single cells. The
Analyst, 133, 423-433. Yoon, Y., Song, J., Hong, S. H. and Kim, J. Q. (2000) Plasma nitric oxide concentrations and
nitric oxide synthase gene polymorphisms in coronary artery disease. Clinical chemistry, 46, 1626-1630.
Yukawa, H., Shen, J., Harada, N., Cho-Tamaoka, H. and Yamashita, T. (2005) Acute effects of
glucocorticoids on ATP-induced Ca2+ mobilization and nitric oxide production in cochlear spiral ganglion neurons. Neuroscience, 130, 485-496.
Zega, G., Pennati, R., Fanzago, A. and De Bernardi, F. (2007) Serotonin involvement in the
metamorphosis of the hydroid Eudendrium racemosum. The International journal of developmental biology, 51, 307-313.
131

132
Zemann, A. J. (2003) Capacitively coupled contactless conductivity detection in capillary electrophoresis. Electrophoresis, 24, 2125-2137.
Zhu, X., Shaw, P. N., Pritchard, J., Newbury, J., Hunt, E. J. and Barrett, D. A. (2005) Amino
acid analysis by micellar electrokinetic chromatography with laser-induced fluorescence detection: application to nanolitre-volume biological samples from Arabidopsis thaliana and Myzus persicae. Electrophoresis, 26, 911-919.
Zou, Y., Tiller, P., Chen, I. W., Beverly, M. and Hochman, J. (2008) Metabolite identification of
small interfering RNA duplex by high-resolution accurate mass spectrometry. Rapid Commun Mass Spectrom, 22, 1871-1881.
BIOGRAPHICAL SKETCH
Dosung Sohn was born in Seoul, Korea in 1974. He completed his undergraduate career at
the Inha University in Incheon, Korea and received the master’s degree at the same place under
the research direction of Wan In Lee graduating in 2001. He continued his education at the
University of Florida under Weihong Tan graduating in 2009.
133