2009 climate action plan -city of portland and multnomah county
DESCRIPTION
ÂTRANSCRIPT

CITY OF PORTLAND AND MULTNOMAH COUNTY
ACTIONCLIMATE
PLAN2009
Sustainability Program Jeff Cogen, County Commissioner

2 ACKNOWLEDGEMENTS
ACKNOWLEDGEMENTS
CLIMATE ACTION PLAN STEERING COMMITTEE
(Affi liations of the Steering Committee members are provided for identifi cation purposes only and are not intended to represent the endorsement of their organizations.)
Richard Benner, Metro and Peak Oil Task ForceLesa Dixon-Gray, Oregon Department of Human Services and Peak Oil Task Force
Christine Ervin, Christine Ervin Co., and Sustainable Development Commission
Fred Hansen, TriMetEric Hesse, TriMetMike Hoglund, MetroMatt Korot, MetroSallie Schullinger-Krause, Oregon Environmental Council
Kent Snyder, Snyder and Associates, and Sustainable Development Commission
Catherine Th omasson, Physicians for Social ResponsibilitySuzanne Veaudry Casaus, Oregon Environmental Council
CITY OF PORTLAND PEAK OIL TASK FORCE
PORTLAND AND MULTNOMAH COUNTY SUSTAINABLE DEVELOPMENT COMMISSION
PORTLAND AND MULTNOMAH COUNTY FOOD POLICY COUNCIL
MAYOR’S PLANNING AND SUSTAINABILITY CABINET
CITY AND COUNTY STAFF
Susan Anderson, Portland Bureau of Planning and Sustainability
Michael Armstrong, Portland Bureau of Planning and Sustainability
Ian Bixby, Portland Bureau of Planning and SustainabilityDan Bower, Portland Bureau of TransportationMolly Chidsey, MetroDebbie Cleek, Portland Bureau of Development ServicesMichele Crim, Portland Bureau of Planning and Sustainability
Karol Collymore, Offi ce of Commissioner Jeff CogenChris Dearth, Portland Bureau of Planning and Sustainability
Linda Dobson, Bureau of Environmental ServicesStuart Farmer, Multnomah County Department of Human Services
Brendan Finn, Offi ce of Commissioner Dan SaltzmanAnne Hill, Portland Bureau of Development ServicesAndria Jacob, Portland Bureau of Planning and Sustainability
Lisa Libby, Offi ce of Mayor Sam AdamsTodd Lofgren, Portland Parks and RecreationKari Lyons, Multnomah County Environmental Health Department
David McAllister, Bureau of Parks and RecreationJeremy O’Leary, Multnomah County Green TeamKaren Schilling, Multnomah County Land Use and Transportation Program
Derek Smith, Portland Bureau of Planning and Sustainability
Paul Smith, Portland Bureau of TransportationJohn Tydlaska, Portland Development Commission Mary Wahl, Bureau of Environmental ServicesKat West, Multnomah County Sustainability ProgramKim White, Portland Bureau of Planning and Sustainability
Th e City of Portland and Multnomah County wish to thank the following community members, organizations and staff for their contributions in developing this Climate Action Plan.

3TIMELINE
Sam Adams Jeff CogenMayor County Commissioner
October 2009
Dear Friends,
Less than a decade into the 21st century, it is clear that climate change may well represent the greatest challenge to our future well-being. Residents of Portland and Multnomah County have been addressing climate change for many years now and our eff orts have achieved real results, diff erentiating us signifi cantly from the national trend. We have received accolades for our work, but it is high praise on a low standard. Perhaps the most important lesson learned from local climate protection work to date is the frank recognition that our good work to date is not nearly enough.
Our region’s leadership is built on a long tradition of excellence in planning and a heritage of conservation and stewardship of our natural environment. Th e bold decisions made decades ago have given this region a head start over other cities and regions across the country. It is in this context that we must look to the bold actions needed in the coming decades. We have reduced local carbon emissions to one percent below 1990 levels, but we know we need to reduce our emissions by eighty percent. What is required is nothing short of the transformation of both our economy and our community, while strengthening the quality of life that makes the Portland area so exceptional.
Portland area residents also have a strong tradition of unparalleled public participation and engagement – actively working to fi nd innovative solutions and taking inspiring action to improve our community. Our history prepares us well to take on the unparalleled challenge of climate change, but it will not be easy. Mounting scientifi c evidence of the increasingly rapid rate of climatic change demands that the City and County draw on our decades of experience and innovation, and act with a renewed sense of urgency.
However, the severity and magnitude of this problem are matched only by the opportunity – unprecedented in modern history – to rethink and improve upon every aspect of our community.
In the coming years, we must: ■ Build a new generation of buildings, industry infrastructure and energy systems
that both embrace and mimic nature, consuming and producing resources in a closed loop. Th ey will be as much a part of the landscape as our rivers, mountains, and forests.
■ Transform all our neighborhoods into places that provide a safe and healthy envi-ronment where all residents can meet their needs by foot, bike and public transit.
■ Develop a new economy to generate thousands of local green jobs, and bring opportunity and prosperity to every part of our community.
■ Ensure that natural systems are healthy, diverse and resilient in the face of a changing climate.
■ Help our friends and neighbors prepare to adapt to climate change – ensuring that the most vulnerable among us are equipped to cope with rising energy prices, as well as extreme weather events.
Successfully tackling this challenge will require an unwavering commitment to the eff ort over the course of decades. We look forward to what our community can accomplish together.
■■
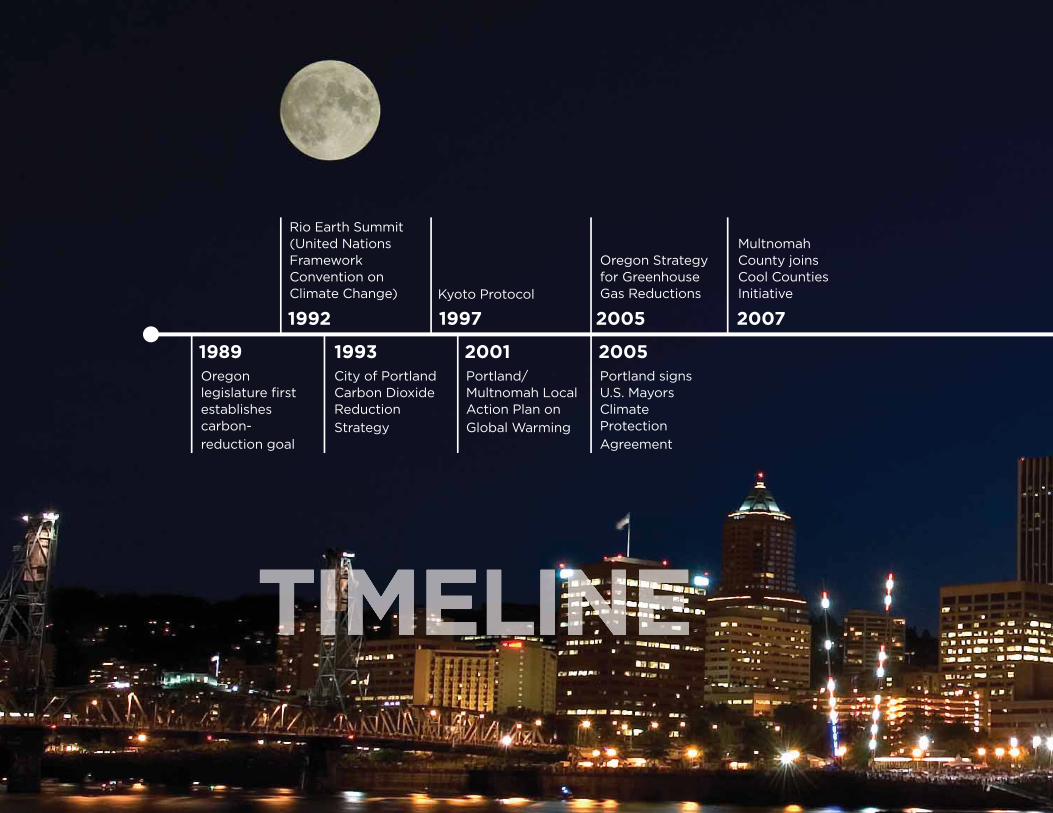
1989 2001 20051993
2007200519971992
Oregon legislature fi rst establishes carbon-
reduction goal
City of Portland Carbon Dioxide Reduction
Strategy
Portland/Multnomah Local Action Plan on
Global Warming
Portland signs U.S. Mayors Climate Protection
Agreement
Rio Earth Summit (United Nations Framework Convention on Climate Change) Kyoto Protocol
Oregon Strategy for Greenhouse Gas Reductions
Multnomah County joins Cool Counties Initiative

2010
20502009 2030
20502008
Climate Action Plan
Portland/Multnomah target: 40% below 1990 levels
State of Oregon goal: 75% below 1990 levels
Metro resolution to develop regional climate change plan
Portland /Multnomah goal: 10% below 1990 levels
Portland/Multnomah goal: 80% below 1990 levels
2008 – 2012 Kyoto Protocol compliance period (United States target: 7% below 1990 levels)
2008Carbon emissions in Multnomah County are 1% below 1990 levels
5TIMELINE

6 CONTENTS
CONTENTS
Executive Summary . . . . . . . . . . . . . . . . . . . . . . . . . . . . . 7
2030 Objectives and 2012 Actions . . . . . . . . . . . . . . . 10
Introduction . . . . . . . . . . . . . . . . . . . . . . . . . . . . . . . . . . . 15 Vision for 2050 . . . . . . . . . . . . . . . . . . . . . . . . . . . . 16
Th e Opportunity for Climate Prosperity . . . . . . . 17
Climate Action in Portland and Multnomah County . 19 Sources of Carbon Emissions . . . . . . . . . . . . . . . . . 20 Th e Framework for Local Climate Action . . . . . . 23 Climate Action Plan Development . . . . . . . . . . . . 24 Portland and Multnomah County’s
Action Plan Process . . . . . . . . . . . . . . . . . . . . . . . . . 26
Th e Plan: Objectives and Actions . . . . . . . . . . . . . . . . 27
1 Buildings and Energy . . . . . . . . . . . . . . . . . . . . .30
2 Urban Form and Mobility . . . . . . . . . . . . . . . . .38 3 Consumption and Solid Waste . . . . . . . . . . . . 47
4 Urban Forestry and Natural Systems . . . . . . . 51
5 Food and Agriculture . . . . . . . . . . . . . . . . . . . . .52 6 Community Engagement . . . . . . . . . . . . . . . . . 54 7 Climate Change Preparation . . . . . . . . . . . . . . 56 8 Local Government Operations . . . . . . . . . . . . .58
Appendix 1: Climate Change Overview . . . . . . . . . . . 60 Appendix 2: Assumptions in Calculating Expected Emissions . . . . . . . . . . . . . . . . . . . . . . . . .63
Appendix 3: Emissions Inventory Methodology . . . . 65
TAKEACTION!See Page 55

7EXECUTIVE SUMMARY
EXECUTIVE SUMMARY
C limate change is the defi ning challenge of the 21st century. Th e world’s leading scientists report that carbon emissions1 from human
activities have begun to destabilize the Earth’s climate. Billions of people will experience these changes through threats to public health, national and local economies, and supplies of food, water and power.
Th e challenge of climate change is more urgent than ever, but it is not new. Nor is our region’s response. For more than 15 years Portland has sought to reduce carbon emissions, starting with the City of Portland’s 1993 Carbon Dioxide Reduction Strategy and followed eight years later by the joint Multnomah County-City of Portland Local Action Plan on Global Warming. Th ese plans supported ambitious carbon-reduction eff orts, like public transit expansions and new green building policies, that promise to benefi t the region’s long-term economic, social and environmental prosperity.
Th ese actions helped achieve impressive results, including a reduction in local carbon emissions in 2008 to one percent below 1990 levels, despite rapid population growth. Over the same period, emissions in the United States as a whole increased 13 percent. Clearly Portland and Multnomah County are bucking the trend and heading in the right direction (see fi gure to the left).
1 Th roughout this document, the term “carbon emissions” refers to all greenhouse gas emissions.
While the early achievements of the Portland region are notable, the latest science suggests that dramatically more ambitious actions are required to mitigate the most extreme impacts of the changing climate. At the same time, eff orts to reduce emissions must be coupled with preparations for a changing climate Th e physical impacts of climate change are already in evidence and will expand and intensify in the decades ahead. Because of the long time lag between changes in emissions and global climate patterns, the future climate will fi rst refl ect the past century of emissions, while ultimately refl ecting our choices today.
Th e physical impacts of a changing climate are matched by social challenges and compounded by rising energy prices. Low-income and vulnerable citizens face disproportionate impacts of climate change — exposure to heat stroke in their homes, for example — while having fewer resources to respond to these changes. Climate change and rising energy prices have the potential to exacerbate social inequities.
In addition, the rivers, streams, wetlands, and vegetation across the Portland region’s watersheds will be aff ected by climate change. Changes in weather and moisture patterns will aff ect streamfl ow, groundwater recharge and fl ooding, and may increase risks of wildfi re, drought, and invasive plant and animal species. Evolving weather, air and water temperature, humidity and soil moisture will aff ect resident and migratory fi sh and wildlife species and their habitats, and may increase risks to their survival.
CARBON EMISSIONS TREND
Bureau of Planning and Sustainability. U.S. Energy Information Administration
8 CITY OF PORTLAND AND MULTNOMAH COUNTY
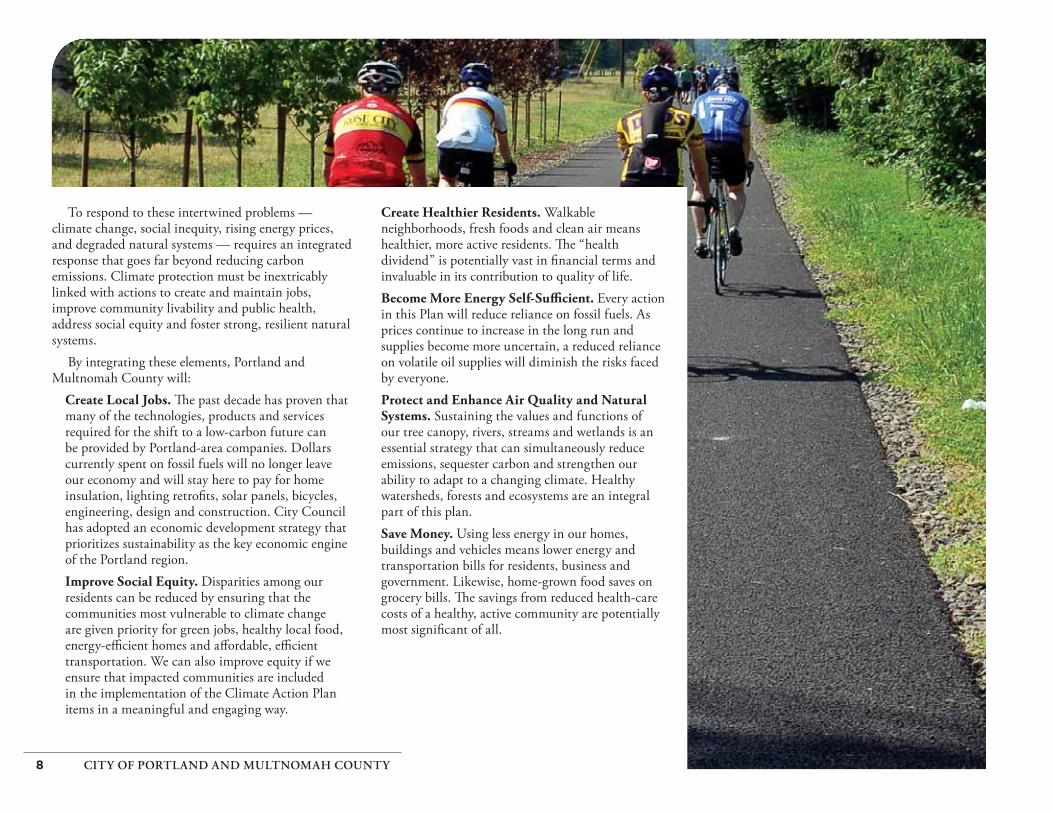
To respond to these intertwined problems — climate change, social inequity, rising energy prices, and degraded natural systems — requires an integrated response that goes far beyond reducing carbon emissions. Climate protection must be inextricably linked with actions to create and maintain jobs, improve community livability and public health, address social equity and foster strong, resilient natural systems.
By integrating these elements, Portland and Multnomah County will:
Create Local Jobs. Th e past decade has proven that many of the technologies, products and services required for the shift to a low-carbon future can be provided by Portland-area companies. Dollars currently spent on fossil fuels will no longer leave our economy and will stay here to pay for home insulation, lighting retrofi ts, solar panels, bicycles, engineering, design and construction. City Council has adopted an economic development strategy that prioritizes sustainability as the key economic engine of the Portland region.Improve Social Equity. Disparities among our residents can be reduced by ensuring that the communities most vulnerable to climate change are given priority for green jobs, healthy local food, energy-effi cient homes and aff ordable, effi cient transportation. We can also improve equity if we ensure that impacted communities are included in the implementation of the Climate Action Plan items in a meaningful and engaging way.
Create Healthier Residents. Walkable neighborhoods, fresh foods and clean air means healthier, more active residents. Th e “health dividend” is potentially vast in fi nancial terms and invaluable in its contribution to quality of life.Become More Energy Self-Suffi cient. Every action in this Plan will reduce reliance on fossil fuels. As prices continue to increase in the long run and supplies become more uncertain, a reduced reliance on volatile oil supplies will diminish the risks faced by everyone.Protect and Enhance Air Quality and Natural Systems. Sustaining the values and functions of our tree canopy, rivers, streams and wetlands is an essential strategy that can simultaneously reduce emissions, sequester carbon and strengthen our ability to adapt to a changing climate. Healthy watersheds, forests and ecosystems are an integral part of this plan.Save Money. Using less energy in our homes, buildings and vehicles means lower energy and transportation bills for residents, business and government. Likewise, home-grown food saves on grocery bills. Th e savings from reduced health-care costs of a healthy, active community are potentially most signifi cant of all.

9EXECUTIVE SUMMARY
In 2007, Portland City Council and the Multnomah County Board of Commissioners adopted resolutions directing staff to design a strategy to reduce local carbon emissions 80 percent by 2050. Th is document responds to that directive. Th e 2009 Climate Action Plan will guide future eff orts by the City and County and provide an innovative framework for the region’s transition to a more prosperous, sustainable and climate-stable future. In doing so, it will strengthen local economies, create more jobs, improve health, and maintain the high quality of life for which this region is known.
Th e broad-scale coordination and planning required to achieve the 80-percent carbon reduction goal will demand that governments, businesses, civic organizations and residents collaborate extensively and take the lead in their own activities.
Fossil fuels are a fi nite and costly resource, as disruptive swings in oil and natural gas prices make clear. A “low-carbon” society — one markedly less reliant on fossil fuels — will be more stable, prosperous and healthy.
Reducing carbon emissions dramatically is a global challenge that local governments cannot solve alone.Th e federal government must make fundamental shifts in its energy policy and align its vast research and development resources with climate protection. Th e State of Oregon has an invaluable role to play in transportation investments, strengthening building codes, regulating utilities, managing forest lands, reducing waste and guiding local land use policies.
Local governments have an indispensible role to play as well; with their important roles both in developing the fundamental shape of the community, transportation systems and buildings, and in helping individuals make informed choices about everyday business and personal choices.
Guided by this Climate Action Plan, Portland and Multnomah County will carry out policies and programs to minimize household, business and government emissions and prepare for the coming environmental and economic challenges. Th ese eff orts will help the entire community thrive now and in the future.

10 CITY OF PORTLAND AND MULTNOMAH COUNTY
BUILDINGS AND ENERGY
1. Reduce the total energy use of all buildings built before 2010 by 25 percent.2. Achieve zero net greenhouse gas emissions in all new buildings and homes.3. Produce 10 percent of the total energy used within Multnomah County from on-
site renewable sources and clean district energy systems.4. Ensure that new buildings and major remodels can adapt to the changing climate.
5. Create vibrant neighborhoods where 90 percent of Portland residents and 80 percent of Multnomah County residents can easily walk or bicycle to meet all basic daily, non-work needs and have safe pedestrian or bicycle access to transit.
6. Reduce per capita daily vehicle-miles traveled (VMT) by 30 percent from 2008 levels.
7. Improve the effi ciency of freight movement within and through the Portland metropolitan area.
8. Increase the average fuel effi ciency of passenger vehicles to 40 miles per gallon and improve performance of the road system.
9. Reduce the lifecycle green-house gas emissions of transportation fuels by 20 percent.
2030 OBJECTIVES
URBAN FORM AND MOBILITY
2030 OBJECTIVES
Th is Climate Action Plan identifi es objectives and actions in eight categories to put Portland and Multnomah County on a path to reduce carbon emissions 80 percent from 1990 levels by 2050.
Th e Climate Action Plan:• Proposes an interim goal of a 40 percent reduction in emissions by 2030.
• Establishes objectives to achieve the interim goal.
• Focuses principally on major actions to be taken in the next three years to shift Portland and Multnomah County’s emissions trajectory.
To draft this Climate Action Plan, City and County staff worked with a steering committee and working groups to identify the objectives and actions most likely to foster the long-term changes necessary to achieve such ambitious goals.
Key criteria in developing the actions were the magnitude of emissions reductions, the scale of economic and community benefi ts, and the ability of local governments to facilitate their implementation.
Portland and Multnomah County are committed to acting decisively to implement these actions and constantly evaluate progress—adapting and revising as necessary. Th e City and County will report on community carbon emissions annually, evaluate progress and identify new actions every three years, and re-examine the objectives every ten years.
Th e 2030 Objectives and corresponding Action Areas of the Climate Action Plan are outlined on the following pages. Th e detailed Actions to be undertaken in the next three years are found on pages 29 through 58 of this document.
112030 OBJECTIVES AND 2012 ACTIONS
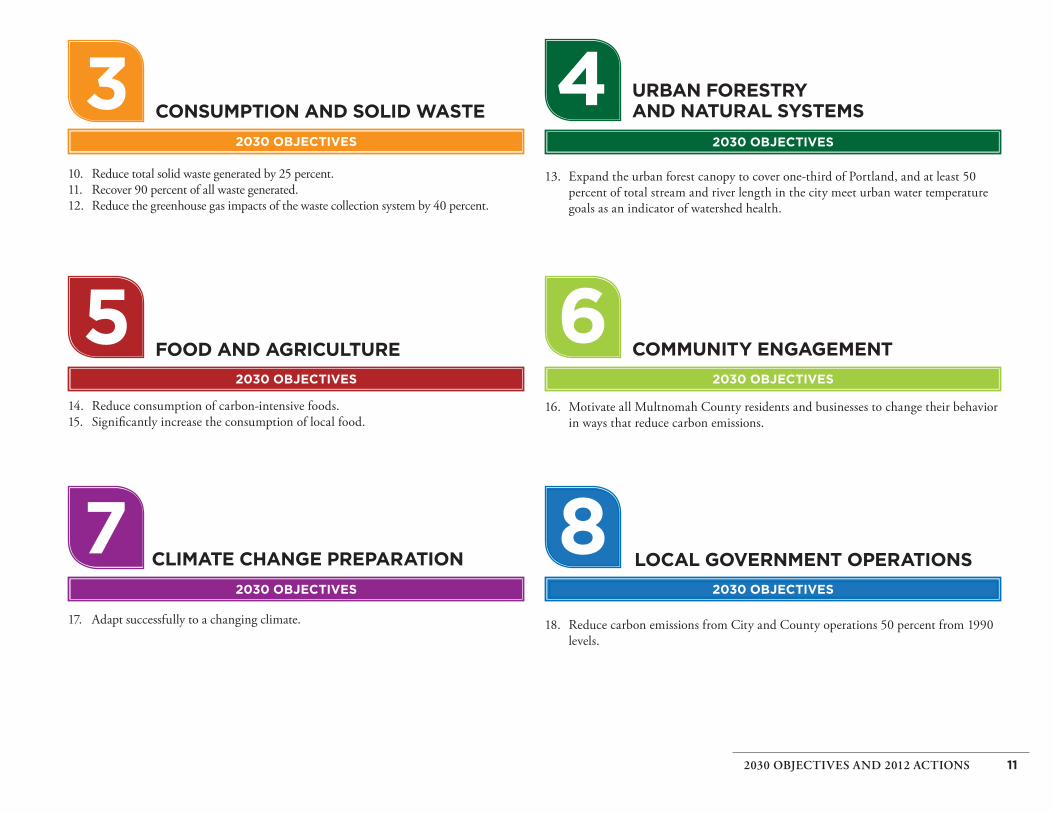
10. Reduce total solid waste generated by 25 percent.11. Recover 90 percent of all waste generated.12. Reduce the greenhouse gas impacts of the waste collection system by 40 percent.
13. Expand the urban forest canopy to cover one-third of Portland, and at least 50 percent of total stream and river length in the city meet urban water temperature goals as an indicator of watershed health.
2030 OBJECTIVES
CONSUMPTION AND SOLID WASTEURBAN FORESTRYAND NATURAL SYSTEMS
2030 OBJECTIVES
2030 OBJECTIVES
COMMUNITY ENGAGEMENTFOOD AND AGRICULTURE
2030 OBJECTIVES
14. Reduce consumption of carbon-intensive foods.15. Signifi cantly increase the consumption of local food.
16. Motivate all Multnomah County residents and businesses to change their behavior in ways that reduce carbon emissions.
LOCAL GOVERNMENT OPERATIONS
2030 OBJECTIVES
17. Adapt successfully to a changing climate. 18. Reduce carbon emissions from City and County operations 50 percent from 1990 levels.
CLIMATE CHANGE PREPARATION
2030 OBJECTIVES

12 CITY OF PORTLAND AND MULTNOMAH COUNTY
BUDGET FOR A LOW-CARBON FUTURE
1990 2008 2030
Percent change
from 2008 2050
Percent change
from 2008
Total carbon emissions (metric tons) 8,599,508 8,495,319 5,134,000 -40% 1,704,000 -80%
Population 584,000 715,000 999,000 +40% 1,355,000 +90%
Per person carbon emissions (metric tons)
14.7 11.9 5.1 -57% 1.3 -89%
Passenger miles per day per person 17.4 18.5 13.4 -28% 6.8 -63%
Electricity (kWh per person) 13,049 12,081 7,869 -35% 3,815 -68%
Natural gas (Therms per person) 391 382 302 -21% 98 -74%
PER PERSON PASSENGER MILES PER DAY
PER PERSON CARBON EMISSIONS (METRIC TONS)
PER PERSON ELECTRICITY USAGE (KWH)
Th e table and graphs show carbon emissions and
related energy use and miles driven in Multnomah
County in 1990 and 2008.
Th e 2030 column depicts a scenario that puts
Portland and Multnomah County on track to
meet the 2050 goal.
Th e 2050 column represents a scenario that
achieves the 80 percent carbon-reduction goal. For
example, residents in 2050 must be able to meet
all of their needs while using only one-third of
the electricity and driving only one-third of the
miles they drive today.
Any number of scenarios could hypothetically
achieve the 2050 goal; the one described here
refl ects the technical committees’ judgment about
a probable scenario.
Key assumptions are described in Appendix 2.

CLIMATE ACTION PLAN(APPROXIMATE CONTRIBUTION TO 2030 EMISSION-REDUCTION GOAL)

14 2030 OBJECTIVES AND 2012 ACTIONS

15INTRODUCTION
C limate change presents a challenge perhaps unparalleled in modern history. With increasing certainty and near unanimity, the world’s lead-
ing scientists report that greenhouse gas emissions from human activities have begun to destabilize the Earth’s climate. In the Pacifi c Northwest, these changes threaten food and water sources, power supplies, public safety and health, forests and local economies, all of which have a critical impact on the quality of residents’ lives.
Th e challenge of climate change is more urgent than ever, but it is not new. For more than 15 years Portland has sought to reduce greenhouse gas emis-sions, starting with the City of Portland’s 1993 Carbon Dioxide Reduction Strategy and followed, eight years later, by the joint Multnomah County–City of Portland 2001 Local Action Plan on Global Warming. Th ese plans have helped the Portland region launch ambitious carbon-reduction eff orts that promise to benefi t the region’s long-term economic, social and environmental prosperity.
Yet as the magnitude of climate change becomes clearer, so too does the need for an even more ambi-tious response. Th e world’s top scientists estimate that to avoid potentially catastrophic climate change, global greenhouse gas emissions must decline 50 to 85 percent below 2000 levels by 2050. Because the United States is responsible, on a per capita basis, for more greenhouse gas emissions than any other major country, U.S. reductions likely must be at the higher end of that range.
Th e climate is certain to change under even the most optimistic emission reduction scenarios, how-ever. Sea level will rise, patterns of precipitation will shift, extreme weather events will become more fre-quent and other unpredictable changes are likely. (Th e basic science of climate change and the greenhouse eff ect is discussed further in Appendix 1.)
Th e need to prepare for a changing climate points to a second fundamental problem: Our degraded natural systems are not as resilient as they once were. More than a century of urban development has dimin-ished the capacity of our wetlands, fl oodplains and forests to absorb and accommodate precipitation, for example, preparing us poorly for the expected increase in the frequency and intensity of severe weather events that climate change will bring to Oregon. More generally, our natural systems were already under severe strain: trees, vegetation, and streams have been replaced by pavement and culverts, degrading air and water quality, habitat and biodiversity. Th ese weakened natural systems absorb less carbon directly, and indirectly result in still more carbon emissions through the urban heat island eff ect, which raises summer temperatures in the city and increases the need for air conditioning.
Powerful social change will accompany these physical impacts. Most obviously, large numbers of people will likely move from hotter, drier regions to cooler, wet-ter ones. “Climate refugees” will almost certainly have a major eff ect on population shifts in the 21st century. Th e Pacifi c Northwest, which likely will experience
less drastic initial impacts of climate change than other regions of the country, may well experience population growth signifi cantly above current expectations.
Th e health of individual citizens will be aff ected, too. New health challenges are emerging — diseases that have previously not been prevalent in Oregon’s temper-ate climate, for example — while at the same time many actions to reduce carbon emissions are likely to have strongly benefi cial impacts on personal health. People who increase their walking and bicycling will experience direct positive benefi ts, and better air quality will benefi t everyone who lives in, works in or visits the Portland region. Preparing for these changes, both physical and social, is essential to the long-term success of the Pacifi c Northwest.
In 2007, both Portland City Council and the Multnomah County Board of Commissioners adopted resolutions directing staff to design a strat-egy to reduce greenhouse gas emissions 80 percent by 2050.1 Subsequently, the City and County assembled a steering committee with representatives from the Sustainable Development Commission,
1 Th e resolutions from both City Council and the Board of County Commissioners do not state the base year for determining emissions reductions. Because Portland and Multnomah County historically have sought to reduce emissions from 1990 levels, this Climate Action Plan uses 1990 as the base year for calculating emissions.

16 CITY OF PORTLAND AND MULTNOMAH COUNTY
the Peak Oil Task Force (see text box above) and staff from eight local government agencies. Th e steering committee met seven times between November 2007 and March 2009. Technical working groups explored possible actions to address energy use in buildings, land use and mobility, and staff reviewed recent City plan-ning eff orts around urban forestry and natural systems, waste reduction and recycling.
Th is document is the result of these eff orts. It iden-tifi es actions to put Portland and Multnomah County on a path to accomplish the 80 percent reduction goal, proposes an interim goal of 40 percent emissions reductions by 2030, establishes objectives to achieve the interim goal, and focuses primarily on actions to be taken in the next three years to shift Portland and Multnomah County’s emissions trajectory.2
2 Th e actions highlighted in this strategy are consistent with the direction of visionPDX, a major community visioning eff ort completed in 2007. Likewise, they refl ect and inform the development of the Portland Plan, currently underway, including a revision to the City of Portland Comprehensive Plan.
A VISION FOR 2050An 80 percent reduction of carbon emissions by 2050 will entail re-imagining the entire community — transitioning away from fossil fuels and strength-ening the local economy while shifting fundamental patterns of urban form, transportation, buildings and consumption. Important details remain to be sorted out, but in planning for climate protection the City and County are guided by the following vision:
■ In 2050, Portland and Multnomah County are at the heart of a vibrant region with a thriving econ-omy, rich cultural community and diverse, ecologi-cally sustainable neighborhoods.
■ Personal mobility and access to services has never been better. Every resident lives in a walkable and bikeable neighborhood that includes retail busi-nesses, schools, parks and jobs. Most people rely on walking, bicycling and transit rather than driving. Pedestrians and bicyclists are prominent in the region’s commercial centers, corridors and neighbor-hoods. Public transportation, bikeways, sidewalks and greenways connect neighborhoods. When peo-ple do need to drive, vehicles are highly effi cient and run on low-carbon electricity and renewable fuels.
■ Green jobs are a key component of the regional economy. Products and services related to clean energy, green building, sustainable food, green infrastructure, and waste reuse and recovery provid-ing living-wage jobs throughout the community, and Portland is North America’s hub for sustainable industry and clean technology.
■ Homes, offi ces and other buildings deliver superb performance. Th ey are durable and highly effi cient, healthy, comfortable and powered primarily by solar, wind and other renewable resources.
■ Th e urban forest and green roofs cover the commu-nity, reducing the urban heat island eff ect, seques-tering carbon, providing habitat, and cleaning the air and water.
■ Food and agriculture are central to the economic and cultural vitality of the community, with back-yard gardens, farmers’ markets and community gar-dens productive and thriving. A large share of food comes from farms within the region, and residents eat a healthy diet, consuming more locally grown grains, vegetables and fruits.
■ Th e benefi ts of green infrastructure, walkable and bikeable neighborhoods, quality housing, and convenient, aff ordable transportation options and public health services are shared equitably through-out the community.
■ Residents and businesses use resources extremely effi ciently, minimizing and reusing solid waste, water, stormwater and energy.
■ Th e Portland region has prepared for a changed climate, making infrastructure more resilient, devel-oping reliable supplies of water, food and energy and improving public health services. Policies, investments and programs are in place to protect the residents most vulnerable to climate change and rising energy prices.
Peak Oil In 2006 the Portland City Council established a citizen advisory group, the Peak Oil Task Force, to examine the region’s vulnerability to rising oil and natural gas prices. The task force recommended decreasing total fossil fuel consumption by 50 percent over 25 years. By accepting that task force’s report, City Council committed to considering its recommendations as part of a new climate and energy plan. For more on peak oil, see www.portlandonline.com/bps.

In a sustainable economy, people live and do business in ways that are good for the economy, the environment, and for communities. The usual tradeoffs between growth, sustainability and equity are not necessary. Businesses are more effi cient, innovative and competitive internationally. The local talent pool is deeper. Business activity reinforces our commitment to sustainability and our leadership in sustainability contributes to a thriving local economy. All Portland residents have access to quality jobs and share in the growth of the economy.
— Portland Economic Development Strategy, a Five-Year Plan for Promoting Job Creation and Economic Growth (2009)
17INTRODUCTION
THE OPPORTUNITY FOR CLIMATE PROSPERITY
Th e task of achieving this vision is complicated. It is also a tremendous opportunity. Fossil fuels are a fi nite and costly resource, as disruptive swings in oil and natural gas prices make clear. An advanced “low-carbon” society will be more stable, prosperous and healthy than those that remain dependent on fossil fuels. Th e Portland region has a history of seeking innovative solutions to community challenges, and climate change presents the opportunity to respond in ways that create local jobs, improve personal health, protect and restore ecosystems and enrich the quality of life for all residents.
Green EconomyClimate protection policies and programs, if designed
carefully, can strengthen the local economy by driving demand for locally provided products and services that reduce emissions. Because most routine daily activities generate carbon emissions, nearly every activity must be examined to identify cleaner and more sustainable alter-natives. Th is fundamental reassessment presents major economic opportunity.
Already, innovative businesses and individuals have begun to take advantage of these opportunities. Multnomah County is home to some of the nation’s leading developers, builders, architects, engineers and product manufacturers in the green building indus-try. In addition, a critical mass of clean energy fi rms,
such as wind developers, photovoltaic manufacturers, biodiesel producers and energy effi ciency consultants also call the region home. Portland is also a national leader in cutting edge bicycling products.
Th ese businesses spread economic benefi ts to the community by creating “green collar” jobs — skilled and semi-skilled, well-paying jobs that contribute directly to preserving or enhancing environmental quality. For example, Oregon’s rapidly growing clean energy sector is showing strong demand for trained workers, including solar installers and wind turbine technicians.3 Bicycle manufacturers and shops contrib-ute $90 million annually and add 850 to 1,150 jobs to the local economy.4 Th ese industries represent just a small sample of the potential depth and breadth of economic activity that climate protection will stimu-late.5 Ambitious eff orts to retrofi t every building in Multnomah County for energy performance, develop the next generation of biofuels, design new ways to package goods and meet countless other needs with more sustainable practices will create many new jobs.
Beyond job creation, a shift away from fossil fuels such as coal, petroleum and natural gas will add sub-stantial indirect economic benefi ts. Because Oregon
3 Cylvia Hayes and David Rafkind, 3EStrategies and Barbara Byrd, Oregon AFL-CIO, “Analysis of Clean Energy Workforce Needs and Programs in Oregon.” 2008.
4 “Th e Value of the Bicycle-Related Industry in Portland.” Alta Planning & Design, September 2008.
5 “Sustainability at a Glance: Th e Industry.” Portland Development Commission.
has almost no fossil fuel resources, dollars spent on these energy sources contribute little to the local econ-omy. By redirecting energy dollars to pay for effi ciency improvements and non-fossil fuel energy, businesses and residents will spend more money locally, expand-ing markets for locally produced products and services.
Land use policies already provide this kind of eco-nomic benefi t. Compact growth has enabled Portland-area residents to drive less than residents of other American cities, saving more than $1 billion each year in transportation costs.6 A substantial portion of those saved dollars are spent in the local economy where they have economic multiplier eff ects, rather than fl owing to largely non-local energy companies. Dramatically expanded emissions-reduction eff orts will reinforce and spread this positive economic eff ect.
Recognizing the economic opportunity presented by climate protection and the global shift toward sustain-ability, the fi ve-year economic development strategy adopted by Portland City Council in 2009 states the City’s unequivocal intent to make Portland “the most sustainable economy in the world” (see text box). By carefully aligning supply-side economic development strategies with demand-side carbon-reduction eff orts, the Portland region is poised to create local jobs while achieving its climate-protection goals.
6 Cortright, Joe. “Portland’s Green Dividend.” CEOs for Cities, July 2007.

18 CITY OF PORTLAND AND MULTNOMAH COUNTY
Quality of LifeBeyond its economic benefi ts, climate protection
can fundamentally improve community wellbeing. For example, land use policies limiting sprawl have made it easier for residents to get around by bicycles and on foot instead of relying on cars. In doing so they not only reduce fuel use and therefore greenhouse gas emissions, but also benefi t from the improved health that accompanies a more active lifestyle.
By protecting and restoring the city and county’s green infrastructure, adding to trails, parks and natural areas, citizens can have easy access to nature and to recreational opportunities that are distributed equitably throughout the community. Increased urban forest canopy adds to the quality of life by improving the aesthetic appeal of neighborhoods, bringing nature into urban areas, and improving air and water quality.
Similarly, by eating locally produced, fresh food, and by choosing grains, fruits, and vegetables instead of meat, individuals both lower greenhouse gas emissions associated with food production and lay the cornerstone of a healthy diet. Living and working in spaces with natural daylight and fresh air reduces the energy needed to light, heat, and cool buildings, while also improving the health and productivity of occupants.
These are just several examples of changes in mobility choices, consumption patterns and lifestyle that do far more than protect the climate — they build a more prosperous, healthy and productive community, and all communities must benefi t from these changes equitably.

CLIMATE PROTECTION IN PORTLAND AND MULTNOMAH COUNTY
AGGREGATE CARBON EMISSIONS (RELATIVE TO 1990)
19INTRODUCTION
T o protect the climate and achieve the 2050 vision of a thriving low-carbon society, carbon emissions must decline dramatically. Th is is a
global problem that local governments cannot solve alone. All sectors of society, all levels of government and individual citizens must act.
Yet cities are responsible for 75 percent of the global carbon emissions. With the concentration of the world’s population living in cities expected to increase from the current level of 50 percent to 60 percent by 2030, cities increasingly present the greatest opportu-nities to reduce global carbon emissions. Local govern-ments have an essential role to play in:
1. Delivering policies and programs that minimize business and household emissions;
2. Working with residents and businesses to help the community prepare for the environmental, social and economic challenges that are to come; and
3. Reducing emissions from their own government operations.
Portland recognized this role early on. In 1993, it became the fi rst local government in the United States to adopt a strategy to address global warming. In
2001, Multnomah County joined the City of Portland in adopting a revised plan, the Local Action Plan on Global Warming, outlining 150 short- and long-term actions to reduce community-wide carbon emissions to 10 percent below 1990 levels by 2010. For compari-son, the target for the U.S. under the never-ratifi ed Kyoto treaty is to reduce carbon emissions seven per-cent below 1990 levels by 2012.
Th e City and County have made substantial prog-ress in carrying out the 2010 goal of the Local Action Plan. As Figure 1 shows, local emissions peaked in 2000 at 15 percent over 1990 levels; by 2008, emis-sions had fallen below 1990 levels, despite rapid popu-lation and economic growth.7 On a per capita basis, local emissions have fallen by 19 percent since 1990.
7 All references to local emissions in this document refer to carbon or carbon emissions from sources that have been tracked. As explained in greater detail in the following pages and in Appendix 3, Multnomah County’s carbon emissions historically have been tracked using a methodology that measures emissions from energy consumption and waste disposal. Because no reliable method exists to track the embodied emissions associated with all goods and materials that are purchased in Multnomah County, it is not yet possible to state to what extent such emissions would have changed over time if such emissions were to be included in the emissions inventory.
20 CITY OF PORTLAND AND MULTNOMAH COUNTY
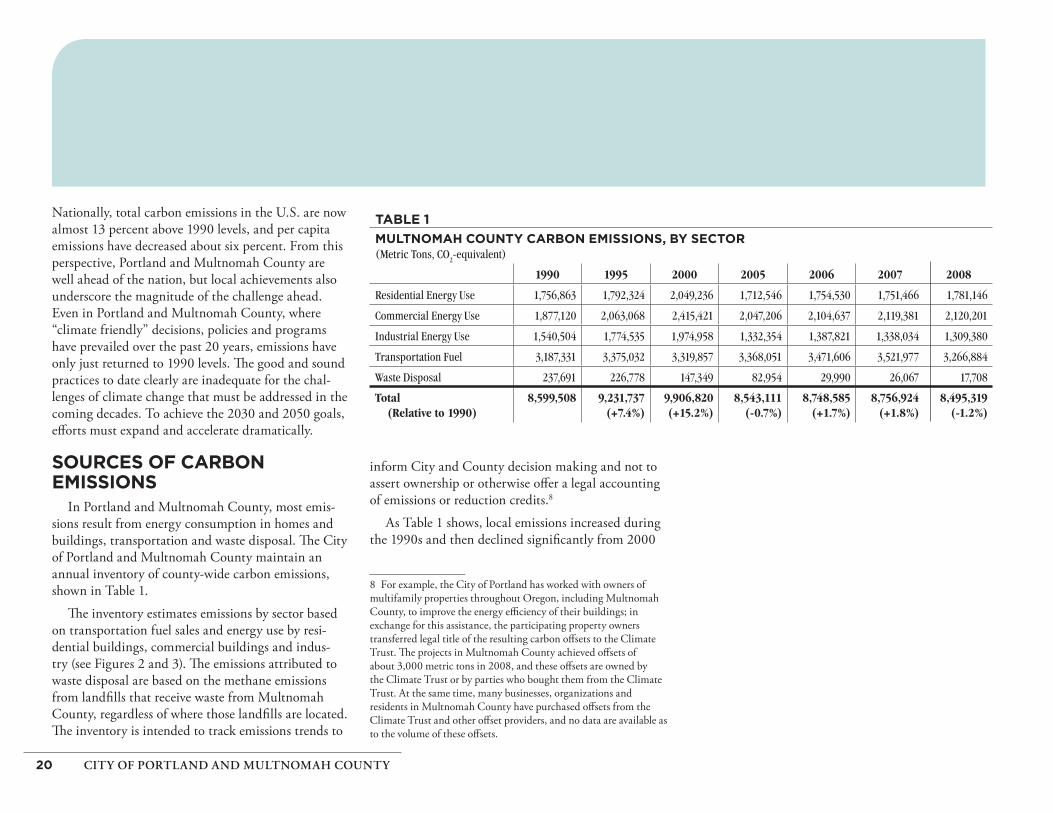
Nationally, total carbon emissions in the U.S. are now almost 13 percent above 1990 levels, and per capita emissions have decreased about six percent. From this perspective, Portland and Multnomah County are well ahead of the nation, but local achievements also underscore the magnitude of the challenge ahead. Even in Portland and Multnomah County, where “climate friendly” decisions, policies and programs have prevailed over the past 20 years, emissions have only just returned to 1990 levels. Th e good and sound practices to date clearly are inadequate for the chal-lenges of climate change that must be addressed in the coming decades. To achieve the 2030 and 2050 goals, eff orts must expand and accelerate dramatically.
SOURCES OF CARBON EMISSIONS
In Portland and Multnomah County, most emis-sions result from energy consumption in homes and buildings, transportation and waste disposal. Th e City of Portland and Multnomah County maintain an annual inventory of county-wide carbon emissions, shown in Table 1.
Th e inventory estimates emissions by sector based on transportation fuel sales and energy use by resi-dential buildings, commercial buildings and indus-try (see Figures 2 and 3). Th e emissions attributed to waste disposal are based on the methane emissions from landfi lls that receive waste from Multnomah County, regardless of where those landfi lls are located. Th e inventory is intended to track emissions trends to
inform City and County decision making and not to assert ownership or otherwise off er a legal accounting of emissions or reduction credits.8
As Table 1 shows, local emissions increased during the 1990s and then declined signifi cantly from 2000
8 For example, the City of Portland has worked with owners of multifamily properties throughout Oregon, including Multnomah County, to improve the energy effi ciency of their buildings; in exchange for this assistance, the participating property owners transferred legal title of the resulting carbon off sets to the Climate Trust. Th e projects in Multnomah County achieved off sets of about 3,000 metric tons in 2008, and these off sets are owned by the Climate Trust or by parties who bought them from the Climate Trust. At the same time, many businesses, organizations and residents in Multnomah County have purchased off sets from the Climate Trust and other off set providers, and no data are available as to the volume of these off sets.
MULTNOMAH COUNTY CARBON EMISSIONS, BY SECTOR(Metric Tons, CO
2-equivalent)
1990 1995 2000 2005 2006 2007 2008
Residential Energy Use 1,756,863 1,792,324 2,049,236 1,712,546 1,754,530 1,751,466 1,781,146
Commercial Energy Use 1,877,120 2,063,068 2,415,421 2,047,206 2,104,637 2,119,381 2,120,201
Industrial Energy Use 1,540,504 1,774,535 1,974,958 1,332,354 1,387,821 1,338,034 1,309,380
Transportation Fuel 3,187,331 3,375,032 3,319,857 3,368,051 3,471,606 3,521,977 3,266,884
Waste Disposal 237,691 226,778 147,349 82,954 29,990 26,067 17,708
Total (Relative to 1990)
8,599,508 9,231,737(+7.4%)
9,906,820(+15.2%)
8,543,111(-0.7%)
8,748,585(+1.7%)
8,756,924(+1.8%)
8,495,319(-1.2%)
City of Portland Bureau of Planning and Sustainability

FIGURE 22008 MULTNOMAH COUNTY GREENHOUSE GAS EMISSIONS BY SECTOR
1%
FIGURE 32008 MULTNOMAH COUNTY GREENHOUSE GAS EMISSIONS BY FUEL SOURCE
0%
13%
3%City of Portland Bureau of Planning and Sustainability
City of Portland Bureau of Planning and Sustainability
GreenElectricity
Diesel
Electricity
Gasoline
Natural Gas
Biodiesel, Ethanol, Heavy Fuel Oil, Light
Fuel Oil, Propane
Waste Disposal
Residential
Transportation
Commercial
Industrial
21INTRODUCTION
to 2005. Among the many factors that contribute to these trends, several stand out:
■ Long-standing land-use policies and investments in mixed-use buildings, transit-oriented develop-ment and transportation options have resulted in almost no increase in emissions from transpor-tation, despite population growth of more than 18 percent since 1990.
■ Th e local economy has shifted from heavier industry to lighter commercial activities.
■ Th e “energy crisis” of 2000-01 and resulting steep increases in electricity costs — as much as 50 percent for some customers — led to sus-tained reductions in industrial, commercial and residential energy use.
■ Th e carbon intensity of the electricity grid in the Pacifi c Northwest has declined by approximately 10 percent from 2000 to 2008 as a result of add-ing lower-carbon power plants, including wind and natural gas.
■ Emissions from waste disposal have declined sig-nifi cantly as a result of increased recycling and improved methane capture at landfi lls receiving local solid waste.
Th is inventory method allocates carbon emissions among the residential, commercial,9 industrial and
9 Due to limitations on the available data, emissions attributable to large, multi-family buildings (i.e., apartment and condominium buildings) are included in the commercial sector.
transportation sectors according to how much energy is used in each, and among waste disposal activi-ties according to methane emissions. Th is method, referred to here as the “sector method” of inventory-ing emissions, has been widely used by state and local governments throughout the United States, includ-ing Oregon and Portland. Because this approach does not explicitly capture emissions associated with the consumption of goods, the Oregon Department of Environmental Quality (DEQ) is developing a complementary method, the “systems method,” to consolidate carbon emissions from the full life cycle of a product, including manufacturing, distribution and disposal. Whereas the sector method allocates emis-sions based on the production of goods — the supply side of the economy — the systems method seeks to attribute emissions to the consumption of goods — the demand side of the economy.
Taken together, the traditional and complementary approaches to inventorying emissions off er insight into the underlying causes of — and therefore the opportunities to reduce — carbon emissions. Both approaches are needed because the businesses and industries located in Multnomah County produce dif-ferent kinds and quantities of goods than what local

FIGURE 4U.S. GREENHOUSE GAS EMISSIONS (2006): ECONOMIC SECTORS VIEW
FIGURE 5U.S. GREENHOUSE GAS EMISSIONS (2006): SYSTEMS VIEW
U.S. Environmental Protection Agency
Local PassengerTransport
Other
Passenger
Transport
U.S. Environmental Protection Agency
22 CITY OF PORTLAND AND MULTNOMAH COUNTY
residents consume.10 Examining carbon emissions through both methods therefore provides a more com-plete picture of the total emissions for which Portland and Multnomah County bear some responsibility.11
To illustrate the insights from considering both methods, Figure 4 shows how the traditional method apportions 2006 U.S. carbon emissions among the sectors that currently are tracked by Portland and Multnomah County. Th e emissions sources not tracked by Portland and Multnomah County (e.g., emissions from industrial processes and methane emissions from raising livestock) are listed as “other.” Figure 5 shows how 2006 U.S. carbon emissions might be apportioned according to the systems method.
10 With the exception of emissions from waste disposal, the traditional method measures emissions from the use of energy in Multnomah County, including the emissions related to producing goods in Multnomah County, without regard to where those goods are consumed. Th e systems method, by contrast, seeks to measure emissions attributable to end use activities by Multnomah County residents, including emissions that are produced outside of the county in connection with goods that are purchased by county residents.
11 A lack of adequate data has been the primary barrier to conducting a carbon inventory for Portland and Multnomah County using the complementary method. Th e Oregon Department of Environmental Quality (DEQ) and EPA are working to develop complementary methods to help expand this type of analysis to the state level, and Portland and Multnomah County will continue to work with DEQ and EPA to gain access to increasingly more accurate and insightful local data to guide policy.
Viewing the data from the two diff erent perspec-tives yields important insights into what causes carbon emissions. As consumers, for example, our decisions to acquire goods, including certain foods, result in nearly half of all carbon emissions. As producers, our deci-sions about the entire supply chain — extraction, pro-duction, packaging, distribution, retail and disposal — aff ect carbon emissions. Since both consumers and producers of goods generate carbon emissions, both parties have an opportunity to reduce those emis-sions.12 Th is climate action plan seeks to address both halves of this equation.
12 A report released by the United Kingdom in 2008 illustrates the importance of utilizing both perspectives. Th e report observes that although the UK’s carbon emissions under the traditional method declined fi ve percent between 1992 and 2004, the emissions under the complementary method for this same period increased 18 percent during this same period, refl ecting the importance of the embedded emissions intensity of UK imports. Development of an Embedded Carbon Emissions Indicator – Producing a Time Series of Input-Output Tables and Embedded Carbon Dioxide Emissions for the UK by Using a MRIO Data Optimisation System, Report to the UK Department for Environment, Food and Rural Aff airs, June 2008.

23INTRODUCTION
THE FRAMEWORK FOR LOCAL CLIMATE PROTECTION
Portland’s success to date in reducing carbon emis-sions rests on a foundation of sound land use and transportation planning. Since 1973, state law has required every city and county in Oregon to have a Comprehensive Plan, which controls land use decisions in that area. Metro, Portland’s regional government, together with TriMet, the provider of public transpor-tation for the Portland region, has guided investment in light-rail, mixed-use development and an integrated multi-modal transportation system. Th ese eff orts are a large part of local progress to date in reducing emis-sions and are fundamental to long-term success in achieving the 2050 goal.
In the years since Portland fi rst explicitly began to address climate change, eff orts at the regional, state and national levels have taken shape. Th ese pro-vide new opportunities — and the imperative — for coordination.
Cities and counties nationwide are connecting through venues such as the U.S. Conference of Mayors, ICLEI — Local Governments for Sustainability, and informal peer networking among cities like Portland, Austin, Chicago, Denver, New York, San Francisco and Seattle.
In Oregon, explicit climate protection eff orts date back to 1989, when the Oregon legislature fi rst adopted a carbon reduction goal. In 1997, the legislature granted the Oregon Energy Facility Siting Council authority to set carbon dioxide emissions standards for new power plants, thereby enacting the fi rst state or federal law in the U.S. explicitly designed to reduce carbon emissions. Ten years later, the legislature estab-lished a new goal to reduce emissions to 75 percent below 1990 levels by 2050.
In 2005, Governor Kulongoski issued the Greenhouse Gas Emissions Reduction Strategy, which identifi es actions for the state to reach this 75 per-cent emissions reduction target. In 2007, legislation established the Global Warming Commission to guide Oregon’s work on climate change. Th e state has
already acted on several major pieces of the governor’s strategy, including requiring large electric utilities to source 25 percent of their power from new renew-able resources by 2025, and requiring major emitters of carbon emissions to report their emissions. A key component of the plan is participation in the Western Climate Initiative, a partnership among seven states and three Canadian provinces to reduce emissions under a cap-and-trade system. Legislation and regu-latory proceedings necessary to establish this cap-and-trade system were introduced in the various state legislatures and agencies in 2009.
In the Portland metropolitan region, eight local governments have adopted resolutions committing to reduce carbon emissions. Multnomah and Clackamas Counties have joined the Cool Counties Initiative, and Portland, Beaverton, Gresham, Oregon City, Lake Oswego and Hillsboro have signed the U.S. Mayors Climate Protection Agreement. Several Oregon univer-sities have developed carbon reduction plans. In April 2008, Metro, the regional government, adopted a reso-lution committing to collaborate regionally on climate change mitigation eff orts. Th is work began in the fall of 2008 and will continue with a scan of best practices, policies, programs and goals to help frame regional opportunities. Metro plans to convene local stakehold-ers in the process of identifying regional strategies and initiatives to reduce carbon emissions.
Most recently, in early 2009 a public-private part-nership emerged to establish the Portland region as a pilot of the Climate Prosperity Project. Developed by the non-profi t Global Urban Development, this initiative seeks to establish a framework to align and coordinate economic development and climate protec-tion activities. In the Portland region, the Portland Sustainability Institute, Metro, Greenlight Greater Portland, the Portland Development Commission, Nike and the City of Portland are developing a shared agenda to create jobs, cultivate talent and deliver social benefi ts while dramatically reducing carbon emissions.

24 CITY OF PORTLAND AND MULTNOMAH COUNTY
CLIMATE ACTION PLAN DEVELOPMENT
Th is Climate Action Plan is the result of collabo-ration among members of the public, businesses, non-profi t organizations and public agencies. Th e Plan builds directly on the work of prior climate-pro-tection plans, adopted in 1993 and 2001, and on the 2007 recommendations of the Peak Oil Task Force. Beginning in late 2007, a steering committee guided the development of this plan, and technical working groups and steering committee meetings continued through 2008.
A draft plan was released for public comment in April 2009, and eight town hall meetings were held to discuss the draft plan with residents, businesses and community organizations. More than 400 people participated in the public meetings, and an additional 175 sets of comments were received through an on-line comment form, by email or in letters, totaling more than 2,600 comments and suggestions. Figures 6 and 7 summarize quantitative results of some of the on-line comments.
City and County staff and the Steering Committee reviewed the comments, which tended to be support-ive of the overall direction of the plan while suggest-ing modifi cations to nearly every action. In particular, respondents urged the City and County to be more attentive to four areas: social equity, public health, the larger regional context of the proposed actions, and adaptation, especially with respect to the role
of natural systems. Many comments pointed to the need to scrutinize the costs and benefi ts of many of the actions, as well as the costs of inaction, and urged the City and County to identify specifi c sources of funding to carry out the proposed actions. Finally, commentors also emphasized the talent, resources and commitment of neighborhoods, businesses, non-gov-ernmental organizations and residents to working with the City and County to address climate change.
Th is plan is fundamentally intended to respond to climate change, reducing emissions and preparing for rapid changes in the climate, but it will only be successful if does so in ways that create jobs, improve social equity, strengthen natural systems, and enhance quality of life. Comments overwhelmingly expressed confi dence that this is achievable.
“This Plan is ambitious but well worth the effort. . . .As Oregon’s largest utility, PGE will have an important role in helping achieve the goals outlined in the Climate Action Plan and we look forward to collaborating with the City, County, business community and local residents on many of these actions.” —Carol Dillin, Vice-President, Public Policy, Portland General Electric

FIGURE 6
WHICH STATEMENT MOST ACCURATELY REFLECTS YOUR OVERALL OPINION ABOUT THE PROPOSED ACTIONS AND OBJECTIVES OF THE CLIMATE ACTION PLAN?
“The Plan rightly acknowledges the past efforts of the City, County, and the Metro region to reduce emissions over the past 20 years. However, the Plan also provides a sobering assessment of how far this region must go to curb signifi cant climate change. The good news is that the Plan provides clear goals and a variety of choices for the citizens of Portland and Multnomah County to meet these goals.” —David Bragdon, Metro Council President
The most important innovation in our planning now should be to anticipate an increased capacity for planning itself, for fl exibility, for allowing — even enabling — rapid, adaptive and widespread change, social as well as material, in the light of changing circumstances. —Transition PDX
FIGURE 7OF ALL THE OBJECTIVES AND ACTIONS PROPOSED IN THE CLIMATE ACTION PLAN, IS THERE ONE THAT MOST APPEALS TO YOU?
Th ey are innappropriatebecause they are notambitious enough to addressclimate change suffi ciently
Th ey are innappropriatebecause climate changeis not a suffi cientlyimportant issue
Climate change is not a problemgovernmets should be addressing

26 CITY OF PORTLAND AND MULTNOMAH COUNTY
PORTLAND AND MULTNOMAH COUNTY’S CURRENT PLANNING PROCESS
With this document, the City of Portland and Multnomah County seek to identify the actions the City and County can take that have the greatest potential to reduce emissions and adapt to a changing climate.
Individual bureaus, departments and programs, including the Multnomah County Sustainability Program, the Multnomah County Health Department, the Portland Bureaus of Planning and Sustainability, Transportation, Development Services, Parks and Recreation, Environmental Services and Water and the Portland Development Commission, among many others, will lead many of the City and County’s eff orts. At the same time, the City and County will coordinate and collaborate with Metro, the State of Oregon, other local governments, busi-nesses, academia and the religious and non-profi t com-munities wherever possible.
Th e Climate Action Plan enumerated in this docu-ment is an iterative process, incorporating and build-ing on lessons learned, as follows:
Every Year: Th e Community InventoryTh e Bureau of Planning and Sustainability and
the Multnomah County Sustainability Program will report annually to the Portland City Council and the Multnomah County Board of Commissioners on local carbon emission trends, fossil fuel use and progress in implementing the actions in this Climate Action Plan. Additional data on consumption will be included in the report as it becomes available.
Every Th ree Years: New ActionsEvery three years, the Portland City Council and
the Multnomah County Board of Commissioners will revise the actions in this plan and identify new ones as necessary. During this periodic review, the City and County will determine whether actions that have not been implemented nonetheless remain eff ective ways to achieve the objectives of this plan and will develop new actions to be implemented in the subsequent three years. Th is revision process will include a review and analysis of the opportunities and challenges to achieving the 2030 objectives and goal.
2020: Revise PlanIn 2020, the City of Portland and Multnomah
County will re-examine the Climate Action Plan based on the latest science and the successes and challenges of implementing policies and programs. A new climate action plan will be developed, with a new 2040 interim goal and 2040 objectives to keep Portland and Multnomah County on a path to achieve the 80 percent reduction in carbon emissions by 2050 and to meet the challenges of preparing for a changing climate.
PORTLAND AND MULTNOMAH COUNTY’S CURRENT PLANNING PROCESS
With this document, the City of Portland and Multnomah County seek to identify the actions the City and County can take that have the greatest potential to reduce emissions and adapt to a changing climate.
Individual bureaus, departments and programs, including the Multnomah County Sustainability Program, the Multnomah County Health Department, the Portland Bureaus of Planning and Sustainability, Transportation, Development Services, Parks and Recreation, Environmental Services and Water and the Portland Development Commission, among many others, will lead many of the City and County’s eff orts. At the same time, the City and County will coordinate and collaborate with Metro, the State of Oregon, other local governments, busi-nesses, academia and the religious and non-profi t com-munities wherever possible.
Th e Climate Action Plan enumerated in this docu-ment is an iterative process, incorporating and build-ing on lessons learned, as follows:

THE PLAN: OBJECTIVES AND ACTIONS
27THE PLAN: OBJECTIVES AND ACTIONS
T o put Portland and Multnomah County on track to reach the 2050 goal of an 80 percent reduction in carbon emissions, this docu-
ment details 18 specifi c objectives and related actions intended to achieve the interim goal of a 40 percent reduction in emissions by 2030.
Th e accompanying actions — to be pursued in the next three years — are not intended to be an exhaus-tive list of every eff ort that Portland and Multnomah County will undertake to achieve the 2030 objectives; the City and County may do much more. Rather, the actions identifi ed here are the highest priority, all of which must be pursued by the end of 2012. Moreover, while the City or County will have a major, direct role in carrying out many of the following objectives and actions, successful implementation will require many diverse partners, from non-profi t organizations to business leaders to neighborhood associations to individual residents.
Th e objectives and associated actions are grouped into the following categories:
Buildings and Energy
Urban Form and Mobility
Consumption and Solid Waste
Urban Forestry and Natural Systems
Food and Agriculture
Community Engagement
Climate Change Preparation
Local Government Operations
Th e objectives and actions were given priority based on three criteria: (1) emission reductions, (2) sphere of infl uence and (3) community benefi ts.
(1) Emissions reductions. Implementing the 2012 actions and achieving the 2030 objectives must result in signifi cant progress toward the goal of an 80 per-cent emissions reduction. Th e purpose of this fi lter is to screen out measures that may lead to short- or medium-term reductions but have little chance of achieving the necessary long-term reductions. Where possible, the reductions are quantifi ed. Quantitative measures are generally available in the categories of
Terminology In this document, "plan" refers to the entire climate protection effort. The carbon emissions reductions — 80 percent by 2050 and 40 percent by 2030 — are "goals." "Objectives" are specifi c means of achieving the 2030 interim goal. "Actions" are detailed steps to be taken in the next three years. This plan thus refers to a 2050 goal, 2030 objectives and 2012 actions.

Key assumptions are described in Appendix 2.
28 CITY OF PORTLAND AND MULTNOMAH COUNTY
Buildings and Energy, Urban Form and Mobility and Consumption and Solid Waste. Th e diagram on page 13 shows the approximate contribution of the sets of actions to achieving the 2030 emissions-reduction target. Th ese numbers are based on the “systems approach” to inventorying emissions, described on page 21, and are therefore estimates, since data are not yet available to produce a precise a local “systems” inventory. Th e complexity of the fi gure makes clear that no single category of actions will achieve the 2030 goal: Aggressive action is required in all areas.
Emission reduction targets rely on a set of assump-tions about population growth, technological improve-ments and actions by governments other than the City of Portland and Multnomah County, discussed fur-ther in Appendix 2. Given these assumptions, Table 2
shows key energy and vehicle use characteristics for a scenario that achieves the 2030 and 2050 goals.
(2) Sphere of infl uence. Th e objectives and actions of this plan are those through which the City of Portland or Multnomah County can materially impact emissions. Although action must be taken at all levels of government and the private sector to address climate change, this plan focuses exclusively on actions that the City and County are positioned to carry out.
(3) Community benefi ts. Many of the actions that reduce emissions also deliver substantial commu-nity benefi ts, including creating local jobs, support-ing vibrant neighborhoods and improving personal health. Although the City and County must take some actions almost exclusively because they reduce
emissions, actions that also generate strong commu-nity benefi ts are prioritized.
While it is easier to quantify the fi rst of these three criteria — emissions reductions — than sphere of infl uence or community benefi ts, and easier to mea-sure reductions in certain categories than in others, the less quantifi able actions in the plan are every bit as necessary to achieve the 2050 goal. Many of these, such as the community engagement campaign, are diffi cult to measure precisely because they refl ect long-term, structural or cultural changes. In other words, they are the fundamental, enduring changes that will ultimately ensure success in addressing climate change.
TABLE 2
COMPOSITION OF MULTNOMAH COUNTY CARBON EMISSIONS (Thousand metric tons)
1990 2008
Percent change
from 1990 2030
Percent change
from 1990 2050
Percent change
from 1990
Building energy 5,174 5,211 + 1% 3,265 – 37% 933 – 82%
Transportation 3,187 3,267 + 2% 1,859 – 42% 766 – 76%
Waste disposal 238 18 – 93% 10 – 96% 5 – 98%
Total 8,560 8,495 – 1% 5,134 – 40% 1,704 – 80%
BUDGET FOR A LOW-CARBON FUTURE
1990 2008 2030
Percent change
from 2008 2050
Percent change
from 2008
Population 584,000 715,000 999,000 +40% 1,355,000 +90%
Per person carbon emissions (metric tons)
14.7 11.9 5.1 -57% 1.3 -89%
Passenger miles per day per person 17.4 18.5 13.4 -28% 6.8 -63%
Electricity (kWh per person) 13,049 12,081 7,869 -35% 3,815 -68%
Natural gas (Therms per person) 391 382 302 -21% 98 -74%

29THE PLAN: OBJECTIVES AND ACTIONS
2030 OBJECTIVES2012 ACTIONS
30 CITY OF PORTLAND AND MULTNOMAH COUNTY
BUILDINGS AND ENERGY
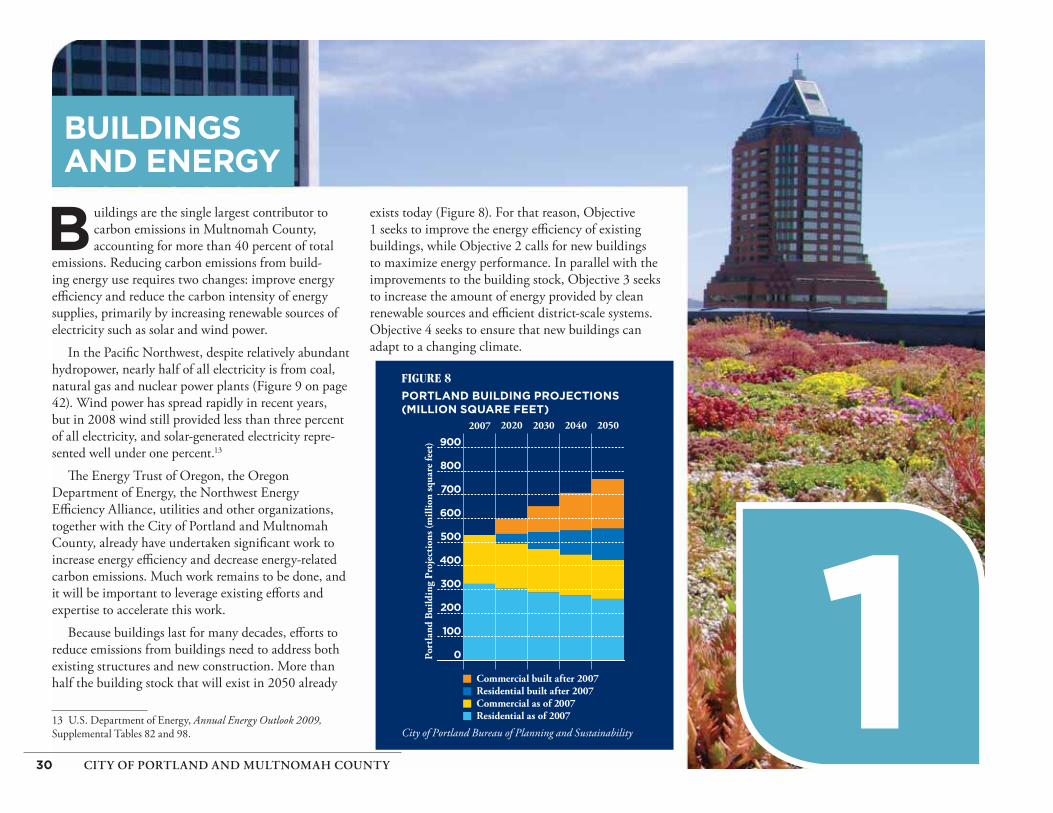
B uildings are the single largest contributor to carbon emissions in Multnomah County, accounting for more than 40 percent of total
emissions. Reducing carbon emissions from build-ing energy use requires two changes: improve energy effi ciency and reduce the carbon intensity of energy supplies, primarily by increasing renewable sources of electricity such as solar and wind power.
In the Pacifi c Northwest, despite relatively abundant hydropower, nearly half of all electricity is from coal, natural gas and nuclear power plants (Figure 9 on page 42). Wind power has spread rapidly in recent years, but in 2008 wind still provided less than three percent of all electricity, and solar-generated electricity repre-sented well under one percent.13
Th e Energy Trust of Oregon, the Oregon Department of Energy, the Northwest Energy Effi ciency Alliance, utilities and other organizations, together with the City of Portland and Multnomah County, already have undertaken signifi cant work to increase energy effi ciency and decrease energy-related carbon emissions. Much work remains to be done, and it will be important to leverage existing eff orts and expertise to accelerate this work.
Because buildings last for many decades, eff orts to reduce emissions from buildings need to address both existing structures and new construction. More than half the building stock that will exist in 2050 already
13 U.S. Department of Energy, Annual Energy Outlook 2009, Supplemental Tables 82 and 98.
exists today (Figure 8). For that reason, Objective 1 seeks to improve the energy effi ciency of existing buildings, while Objective 2 calls for new buildings to maximize energy performance. In parallel with the improvements to the building stock, Objective 3 seeks to increase the amount of energy provided by clean renewable sources and effi cient district-scale systems. Objective 4 seeks to ensure that new buildings can adapt to a changing climate.
FIGURE 8PORTLAND BUILDING PROJECTIONS (MILLION SQUARE FEET)
Po
rtla
nd
Bu
ild
ing
Pro
ject
ion
s (m
illi
on
sq
uar
e fe
et)
0
100
200
300
400
500
600
700
800
900
2007 2020 2030 2040 2050
Commercial built after 2007Residential built after 2007Commercial as of 2007Residential as of 2007
City of Portland Bureau of Planning and Sustainability

CLEAN ENERGY WORKS: PORTLANDA new program that forges strong links between saving energy, creating
jobs and improving social equity, Clean Energy Works: Portland was launched in 2009 as a partnership between the City of Portland, Multnomah County, the Energy Trust of Oregon, NW Natural, Portland General Electric and Pacifi c Power. The program provides low-interest fi nancing to homeowners who improve the energy effi ciency of their homes (See Objective 1, Action (i) on page 34). The loan is then repaid on the homeowner’s utility bill over 15 to 20 years. Low-income households pay the lowest interest rate, with higher-income households able to lower their interest rate by electing more comprehensive energy retrofi ts. A core component of the program is its commitment to creating quality jobs and advancing social equity.
GREEN JOBS GOALS
• 80% of employees are hired from local work force
• 30% of total project hours are performed by historically disadvantaged people, including people of color, women, and low-income residents
• 20% of all contractors and subs are businesses owned by historically disadvantaged people, including people of color and women
• 180% of minimum wage or better paid to all contractors and subs
• 100% of new hires come from qualifi ed training programs
• 20% of the pilot project work to contractors who demonstrate particular focus on creating pathways out of poverty and into green jobs for local residents, including through employing social enterprise models and/or partnering with nonprofi t community-based organizations
www.cleanenergyworksportland.org

32 CITY OF PORTLAND AND MULTNOMAH COUNTY
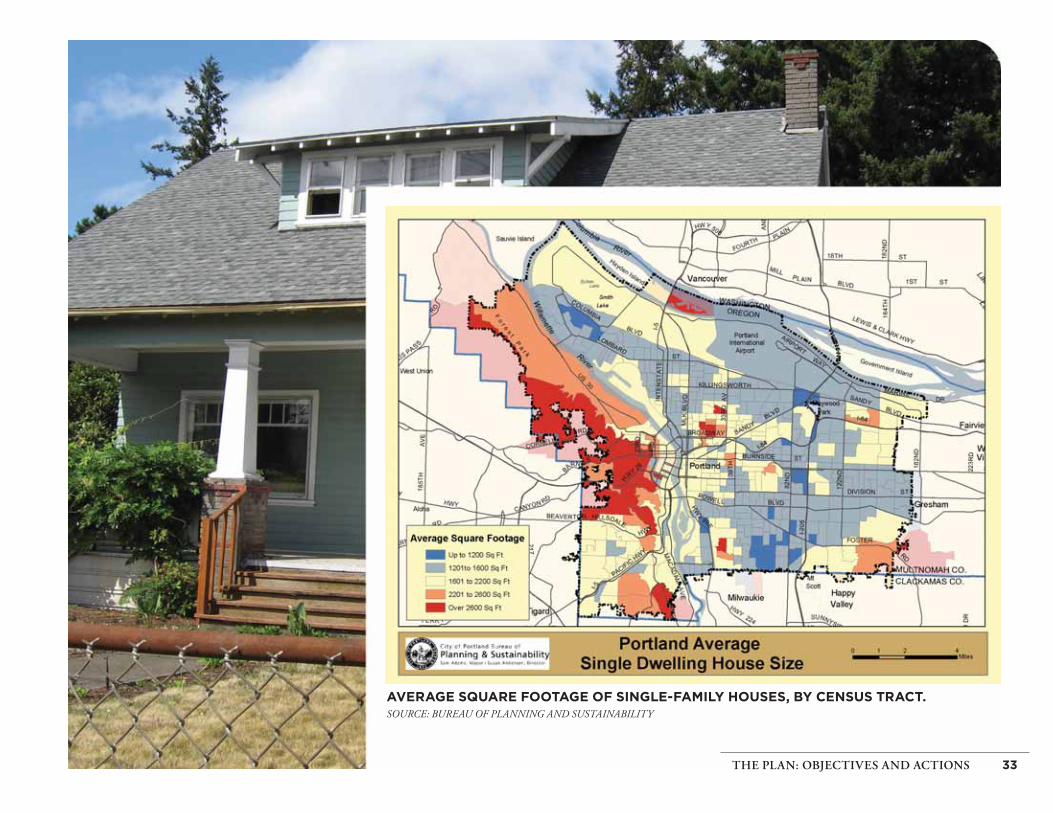
THERMS OF NATURAL GAS USED PER HOUSE IN 2008, FOR SINGLE-FAMILY HOUSES WITH GAS SPACE HEAT, BY CENSUS TRACT.SOURCE: ENERGY TRUST OF OREGON
These maps are an initial step in gathering neighborhood-level data on metrics related to climate action by enabling residents to see how their neighborhood compares to others.
Many factors infl uence household energy use, including:
• type of residence
(single family or multifamily)
• size of dwelling
• age of structure
• level of insulation
• size and type of windows
• effi ciency of lighting and appliances
• number and behavior of occupants
A simple visual comparison of the two maps suggests a rough correlation between home size and natural gas use. While this makes intuitive sense,it is also notable that the smaller homes tend to be older homes and less likely to be well insulated.
We plan to continue making comparative data available to inform and motivate neighborhood scale carbon reduction action.
33THE PLAN: OBJECTIVES AND ACTIONS
AVERAGE SQUARE FOOTAGE OF SINGLE-FAMILY HOUSES, BY CENSUS TRACT.SOURCE: BUREAU OF PLANNING AND SUSTAINABILITY

34 CITY OF PORTLAND AND MULTNOMAH COUNTY
2030 OBJECTIVE 1.Reduce the total energy use of all buildings built before 2010 by 25 percent.
To be on track to reach the 2050 emissions reduction target, all buildings must consume 25 percent less energy than today. By 2030, many new and highly effi cient buildings will have been built that will consume less than half the energy of today’s buildings. However, because over two-thirds of the buildings that will exist in 2030 are in place today, existing buildings must be retrofi t-ted with energy-saving measures to achieve the necessary aggregate building effi ciency improvements.
Actions to be completed before 2012
(i) Establish an investment fund of at least $50 million in public and private capital to pro-vide easy access to low-cost fi nancing to resi-dents and businesses for energy performance improvements.
(ii) Require energy performance ratings for all homes so that owners, tenants and prospec-tive buyers can make informed decisions.
(iii) Require energy performance benchmark-ing for all commercial and multi-family buildings.
(iv) Provide resources and incentives to residents and businesses on carbon-reduction actions in existing buildings, including energy effi -ciency, renewable energy, choice of materials and building re-use.
(v) Work with partner organizations to promote improved operation and maintenance prac-tices in all commercial buildings.
(vi) Establish a City business tax credit for install-ing solar panels and ecoroofs together.
2030 OBJECTIVE 2.Achieve zero net greenhouse gas emis-sions in all new buildings and homes.
Th e optimal time to begin addressing building effi -ciency is in the initial building design stage. Buildings that have been designed and built with performance as a primary goal are capable of signifi cantly outperforming similar, previously built buildings that have been retrofi t-ted for effi ciency. Because total emissions from buildings must be reduced by much more than can be accomplished with retrofi ts alone, it is critical that buildings built after 2030 generate more energy from clean sources than they consume, resulting in a net emissions reduction.
Actions to be completed before 2012
(i) Participate actively in the process to revise the Oregon building code to codify the per-formance targets of Architecture 2030.
(ii) Adopt incentives for high performance new construction projects that consider life-cycle carbon emissions impacts.
(iii) Accelerate existing eff orts to provide green building design assistance, education and technical resources to residents, developers, designers and builders.
FIGURE 9
2008 SOURCES OF ELECTRICITY FOR UTILITIES SUPPLYING CUSTOMERS IN MULTNOMAH COUNTY
Oregon Department of Energy for overall resource mix of each utility; Bureau of Planning and Sustainability for weighted average mix based on electricity supplied by Portland General Electric and Pacifi c Power to customers in Multnomah County
Wind
4%
Natural Gas
24%
Hydro
27%
Coal
44%
Other
1%
Coal plays a signifi cant role in providing electricity to the Northwest. Year-to-year variability in hydropower supplies changes the mix, but coal and natural gas typically supply over half of all power to the Northwest, despite the extensive hydropower system. In Multnomah County, the power mix is even more dependent on coal, since Pacifi c Power, which provides about one-fourth of all electricity used in the county, relies on coal for about 70 percent of its energy.
35THE PLAN: OBJECTIVES AND ACTIONS
Financing Energy Effi ciency Over time, energy effi ciency improvements in buildings generally save more money than they cost. These improvements have not been widely adopted, however, in part due to the “sticker shock” people experience when considering extensive effi ciency improvements. An energy investment fund helps remove this barrier by providing up-front fi nancing through programs such as Clean Energy Works Portland (see page 31). Homeowners and businesses pay back the investment over an extended period of time, with monthly energy savings matching or exceeding the monthly fi nance payments.
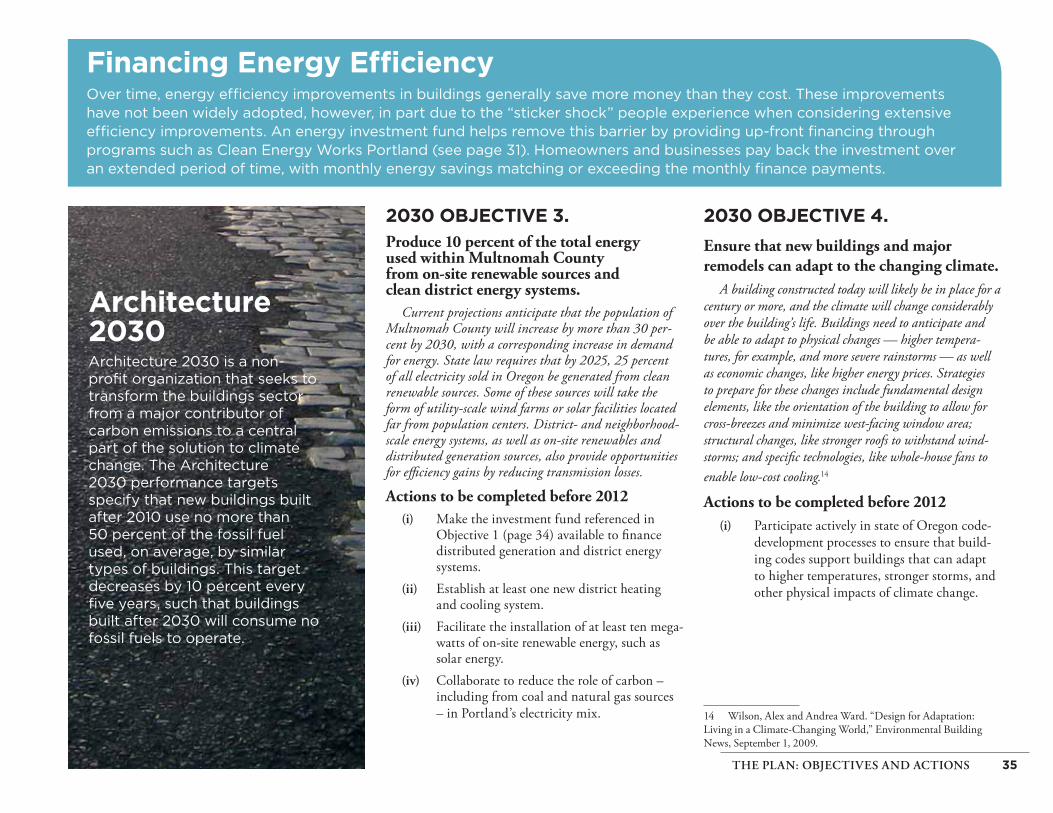
2030 OBJECTIVE 3.Produce 10 percent of the total energy used within Multnomah County from on-site renewable sources and clean district energy systems.
Current projections anticipate that the population of Multnomah County will increase by more than 30 per-cent by 2030, with a corresponding increase in demand for energy. State law requires that by 2025, 25 percent of all electricity sold in Oregon be generated from clean renewable sources. Some of these sources will take the form of utility-scale wind farms or solar facilities located far from population centers. District- and neighborhood-scale energy systems, as well as on-site renewables and distributed generation sources, also provide opportunities for effi ciency gains by reducing transmission losses.
Actions to be completed before 2012
(i) Make the investment fund referenced in Objective 1 (page 34) available to fi nance distributed generation and district energy systems.
(ii) Establish at least one new district heating and cooling system.
(iii) Facilitate the installation of at least ten mega-watts of on-site renewable energy, such as solar energy.
(iv) Collaborate to reduce the role of carbon – including from coal and natural gas sources – in Portland’s electricity mix.
2030 OBJECTIVE 4.
Ensure that new buildings and major remodels can adapt to the changing climate.
A building constructed today will likely be in place for a century or more, and the climate will change considerably over the building’s life. Buildings need to anticipate and be able to adapt to physical changes — higher tempera-tures, for example, and more severe rainstorms — as well as economic changes, like higher energy prices. Strategies to prepare for these changes include fundamental design elements, like the orientation of the building to allow for cross-breezes and minimize west-facing window area; structural changes, like stronger roofs to withstand wind-storms; and specifi c technologies, like whole-house fans to enable low-cost cooling.14
Actions to be completed before 2012
(i) Participate actively in state of Oregon code-development processes to ensure that build-ing codes support buildings that can adapt to higher temperatures, stronger storms, and other physical impacts of climate change.
14 Wilson, Alex and Andrea Ward. “Design for Adaptation: Living in a Climate-Changing World,” Environmental Building News, September 1, 2009.
Architecture 2030 Architecture 2030 is a non-profi t organization that seeks to transform the buildings sector from a major contributor of carbon emissions to a central part of the solution to climate change. The Architecture 2030 performance targets specify that new buildings built after 2010 use no more than 50 percent of the fossil fuel used, on average, by similar types of buildings. This target decreases by 10 percent every fi ve years, such that buildings built after 2030 will consume no fossil fuels to operate.
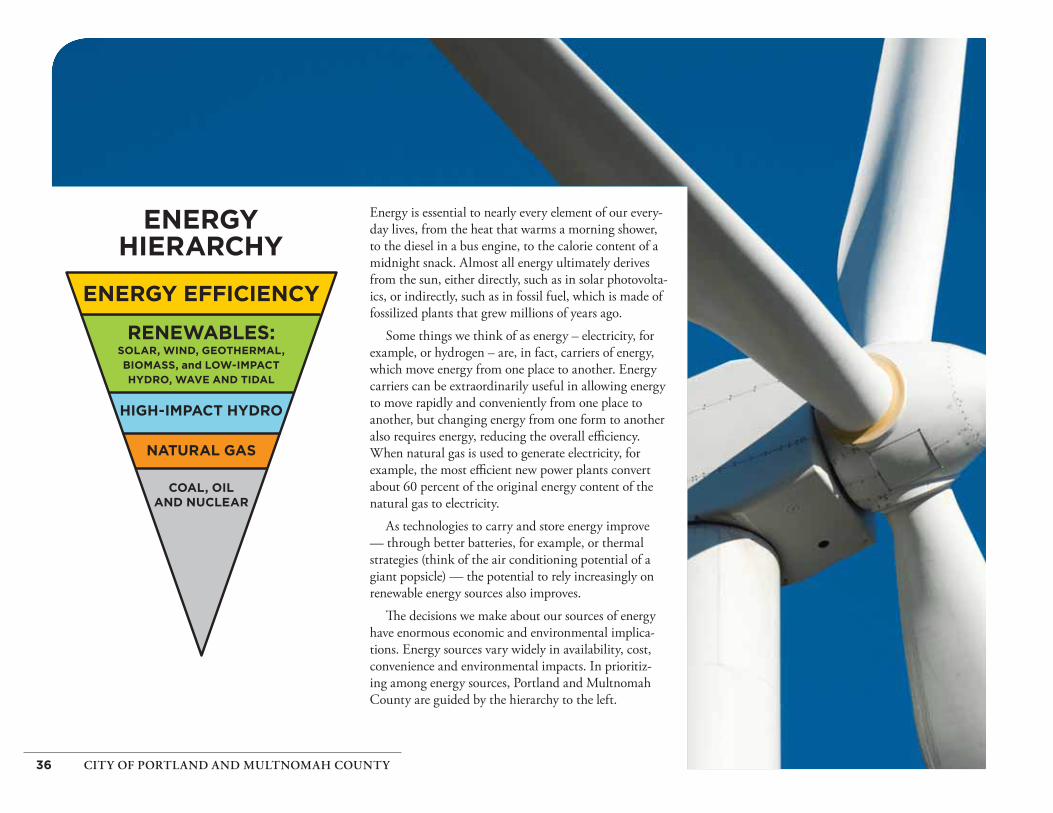
36 CITY OF PORTLAND AND MULTNOMAH COUNTY
Energy is essential to nearly every element of our every-day lives, from the heat that warms a morning shower, to the diesel in a bus engine, to the calorie content of a midnight snack. Almost all energy ultimately derives from the sun, either directly, such as in solar photovolta-ics, or indirectly, such as in fossil fuel, which is made of fossilized plants that grew millions of years ago.
Some things we think of as energy – electricity, for example, or hydrogen – are, in fact, carriers of energy, which move energy from one place to another. Energy carriers can be extraordinarily useful in allowing energy to move rapidly and conveniently from one place to another, but changing energy from one form to another also requires energy, reducing the overall effi ciency. When natural gas is used to generate electricity, for example, the most effi cient new power plants convert about 60 percent of the original energy content of the natural gas to electricity.
As technologies to carry and store energy improve — through better batteries, for example, or thermal strategies (think of the air conditioning potential of a giant popsicle) — the potential to rely increasingly on renewable energy sources also improves.
Th e decisions we make about our sources of energy have enormous economic and environmental implica-tions. Energy sources vary widely in availability, cost, convenience and environmental impacts. In prioritiz-ing among energy sources, Portland and Multnomah County are guided by the hierarchy to the left.
ENERGY EFFICIENCY
RENEWABLES:
HIGH-IMPACT HYDRO
NATURAL GAS
COAL, OILAND NUCLEAR
SOLAR, WIND, GEOTHERMAL,BIOMASS, and LOW-IMPACT HYDRO, WAVE AND TIDAL
ENERGYHIERARCHY

37THE PLAN: OBJECTIVES AND ACTIONS
District Energy District energy is a cooperative effort to provide heating, cooling and hot water for buildings in a given area. District energy systems have signifi cantly reduced consumption of fossil fuel in many countries around the world and are emerging as a key strategy for reducing greenhouse gas emissions among local governments in the U.S.
District energy offers two principal benefi ts.
First, building developers and owners do not have to determine specifi c heating and cooling equipment, nor do they need to dedicate signifi cant space within their buildings for boilers or cooling equipment. This difference can lead to big improvements in effi ciency, as individual developers and building owners often oversize their equipment and are reluctant to consider investments that have payback periods of more than three years.
Second, district energy systems are much more capable of improving on energy technology over time. For instance, a district energy system need only change equipment at the central energy plant rather than expensive retrofi ts within each building.
The City of Portland has completed a feasibility analysis of district energy in the North Pearl, and the results suggest that a district energy system could reduce carbon emissions by 10 to 70 percent, depending on fuel source.
PHOTO

38 CITY OF PORTLAND AND MULTNOMAH COUNTY
URBAN FORM AND MOBILITY
P ortland and Multnomah County have achieved considerable success in limiting emissions growth from transportation. Urban form and
mobility policies have resulted in almost no increase in emissions from transportation since 1990.
■ TriMet ridership has doubled since 1990, with increases every year. Th e regional light-rail system continues to expand; it now connects Portland to Clackamas Town Center, coinciding with the new rail loop through downtown Portland along the transit mall.
■ Portland has a higher percentage of bicycle commuters than any other major U.S. city with a bicycle commute rate that is eight times the national average. Th e number of riders crossing bridges into downtown Portland has increased by double-digit percentages in each of the past four years.
■ Th e Portland Streetcar now connects the new South Waterfront neighborhood with the central city, and ridership on the streetcar line continues to grow faster than anticipated.
■ Each new person moving into the Portland metro area uses one-fourth the amount of living space that is used by each new person moving into the Washington, D.C metro area.15
15 LandSat Research by Jeff rey Masek and Francis Lindsay, University of Maryland, 2000.
■ Portland adopted a renewable fuel standard requiring that all diesel sold in the city include at least fi ve percent biodiesel and all gasoline 10 per-cent ethanol.
■ Th e Portland region leads the nation in the num-ber of hybrid cars purchased per household.16
Reducing vehicle miles traveled by increasing active forms of transportation — walking, bicycling and tak-ing transit — produces signifi cant community health and economic benefi ts as well. Portland-area residents and businesses reap a “green dividend” of more than $1 billion annually in reduced transportation costs as a result of driving less than residents of other American cities.17 Similarly, evidence is increasingly emerging of the health benefi ts of reducing vehicle miles traveled, both in terms of improved air quality and increased levels of physical activity.18
Nevertheless, transportation of goods and people accounts for 40 percent of Multnomah County carbon emissions. Land use planning and transportation fund-ing decisions greatly infl uence transportation-related emissions. Similarly, commercial transportation is strongly infl uenced by the location and availability of inter-modal options. For that reason, transportation
16 www.hybridcars.com, Dashboard — June 2009.
17 Cortright, Joe. “Portland’s Green Dividend.” CEOs for Cities, July 2007.
18 Health Impact Assessment on Policies Reducing Vehicle Miles Traveled in Oregon Metropolitan Areas, Upstream Public Health, 2009.

39THE PLAN: OBJECTIVES AND ACTIONS
emissions reduction depends critically on coordinated land use policies and the development of infrastructure for low-carbon modes of transportation.
Along with infrastructure, individuals will make daily choices to walk, bicycle, take transit or carpool whenever these options are practical. Planning, infra-structure and technology are essential, but they are not enough.
Th is plan takes a three-pronged approach to reduc-ing transportation emissions: Objectives fi ve and six seek to reduce the number of miles that people and goods must travel using vehicles, Objective seven seeks to improve the effi cient movement of freight, and Objectives eight and nine seek to reduce the amount of emissions that are emitted when vehicles are used.
2030 OBJECTIVE 5.
Create vibrant neighborhoods where 90 percent of Portland residents and 80 per-cent of Multnomah County residents can easily walk or bicycle to meet all basic daily, non-work needs and have safe pedestrian or bicycle access to transit.
Despite thoughtful land-use planning and quality transportation options, residents of Multnomah County are more dependent on automobiles than are the residents of more compact cities on the East Coast and in much of the rest of the world. A critical and basic step to reduce automobile dependence is to ensure that residents live in
“20-minute neighborhoods,” meaning that they can com-fortably fulfi ll their daily needs within a 20-minute walk from home.
Actions to be completed before 2012
(i) Th e City and County both recognize the critical role of the Urban Growth Boundary in guiding the region’s growth while meeting economic, environmental and social needs. a. Th e City will advocate for accommodating all population and business growth within the existing Urban Growth Boundary, with the possible exception of industrial needs.
b. Th e County will advocate for accommodating substantially all population and business growth within the existing Urban Growth Boundary.
(ii) In the Metro Urban/Rural Reserves program, the City will advocate for adopting the low end of Urban Reserve Designations to refl ect the trends in demographics, climate change, energy supply and infrastructure costs.
(iii) Make 20-minute complete neighborhoods a core component of the Portland Plan.
(iv) For each type of urban neighborhood, identify the land use planning changes and infrastructure investments, including public-private partnerships, that are needed to achieve a highly walkable and bikeable neighborhood and develop an implementation action plan.
Two interim goals for reducing transportation related carbon emissions are established through this plan–a 10 percent reduction by 2015 and a 25 percent reduction by 2020.
FIGURE 10
TRANSPORTATION-RELATED CARBON EMISSIONS REDUCTION GOALS

40 CITY OF PORTLAND AND MULTNOMAH COUNTY
ibrant, active neighborhoods are the founda-tion of a sustainable city. Neighborhoods are one of the clearest physical intersections of
people, commerce and nature, bringing together the built and natural environment and strongly shaping the experience and impact of residents and businesses. Th ey also provide one of the keenest senses of belonging, shared experiences, community connections and equal stake—or lack thereof.
In Portland, residents have shown strong interest in cultivating “20-minute complete neighborhoods”—places where residents can safely walk a relatively short distance from home to most of the destinations and services they use every day. Fundamentally, the 20-minute neighborhood concept is another way to talk about or describe walkable, bikable environments and vibrant, human-scale neighborhoods—in essence, complete neighborhood communities.
Th e 20-minute complete neighborhood concept map (opposite page) represents the range of accessibility by walking in diff erent parts of the city. Th e data underlying the map take into account the following factors that typically aff ect a person’s choice to walk from home to a desired destination19:
19 Th e selection of destination types to include in the analysis is based on discussions with the public and by research conducted by experts walkable neighborhoods. See “Operational Defi nitions of Walkable Neighborhood: Th eoretical and Empirical Insights.” Journal of Physical Activity and Health 2006, 3. Suppl 1, S99-S117, by Anne Vernez Moudon, et. al.
DESTINATIONSResearch suggests that people would most likely walk to the following destinations from home.
Grocery stores
Neighborhood-oriented commercial
Restaurants, neighborhood eateries
Pubs
Drug stores
Convenient stores/ corner stores
Laundromats
Transit stops
Parks (access points)
Schools
DISTANCEProximity to destinations, not as the crow fl ies, but by actual street network.
¼-mile, ½-mile, 1-mile gradient to…
grocery stores
neighborhood-oriented commercial
parks access points
elementary schools
WALK QUALITYTh e characteristics of the physical walking environment, pedestrian-oriented network.
Sidewalks (presence or absence of)
Intersection density (a proxy for connectivity or block length)
Slope (greater than 20% were considered less likely to attract walking on a day-to-day basis)
Taking these elements together, the resulting map allows for general comparison and contrast of “walkability” in diff erent parts of the city. It is based on the proximity of destinations, the clusters of destinations, and the quality of the physical environment. Th e map shows the “hot spot” areas that tend to have more integrated qualities that would qualify it as a “20-minute neighborhood” and which parts of the city are less so. Th e 20-minute neighborhood concept map can help spur exploration of creative solutions that suit the diff erent qualities of diff erent parts of the city. Approaches to change should meet the needs of these areas on their own terms, while generally supporting more short distance travel by walking, bicycling, or transit.

20-MINUTE COMPLETE NEIGHBORHOOD CONCEPT

FIGURE 12CURRENT COMMUTE MODE SHARE FOR PORTLAND
FIGURE 132030 TARGET COMMUTE MODE SHARE FOR PORTLAND
Source: City of Portland Auditor, Service Eff orts and Accomplishments: 2007-08
25%
42 CITY OF PORTLAND AND MULTNOMAH COUNTY
(v) Require evaluations of major planning scenar-ios, Comprehensive Plan and Transportation System Plan decisions to include estimates of carbon emissions. Partner with Metro and regional jurisdictions to develop modeling tools for evaluating emissions impacts of land-use and transportation decisions and monitor-ing carbon emissions.
(vi) Develop a more balanced funding mechanism and adopt a schedule for public investments to make neighborhoods highly walkable and bikeable, including sidewalks and improved access to transit for reaching destinations beyond a reasonable walking or biking distance.
(vii) Partner with federal agencies, including Housing and Urban Development, the Environmental Protection Agency, and the Department of Transportation, on eff orts like the joint Interagency Partnership for Sustainable Communities to apply new federal priorities around sustainable development in Portland and Multnomah County.
(viii) Seek funding to accelerate remediation of brownfi elds in the city and county to accom-modate growth within the current Urban Growth Boundary.
(ix) Work with Metro and other local govern-ments to make reducing carbon emissions and
adapting to climate change impacts a fund-ing criteria for the Metro Policy Advisory Committee and the Joint Policy Advisory Committee on Transportation.
(x) Coordinate decisions about future streetcar investments with Portland Plan land use decisions.
(xi) Facilitate the aggregation of smaller land par-cels which, when aggregated, provide oppor-tunities for industrial development.
2030 OBJECTIVE 6.
Reduce per capita daily vehicle-miles trav-eled (VMT) by 30 percent from 2008 levels.
As of 2005, the per capita daily passenger vehicle-miles
traveled (VMT) in the Portland region are about eight
percent above 1990 levels. (Figure 11). To be on target
for the 2050 goals, per capita daily passenger VMT must
decline by about 30 percent from today’s by 2030. Th is
reduction must occur in addition to vehicle fuel effi ciency
improvements and the development of cleaner fuels.
Reducing per capita VMT while maintaining the mobil-
ity of, and access to services for, Portland and Multnomah
County residents will require signifi cant growth in walk-
ing, bicycling and transit (Figures 12 and 13).
Th e current Transportation System Plan projects that
drive-alone trips will decrease from 62 percent in 1994 to 57 percent in 2020 (Figure 14). To achieve the 2030
objective, VMT reductions will need to accelerate dramati-cally from the current trajectory. Th e benefi ts of this shift
will do more than protect the climate because the average Portland household spends about 20 percent of household
income on transportation, reductions in VMT can signifi -cantly increase disposable income.20
20 See, for example, “Th e Aff ordability Index: A New Tool for Measuring the True Aff ordability of a Housing Choice.” Center for Transit Oriented Development and Center for Neighborhood Technology, January 2006.
FIGURE 11PER CAPITA DAILY VMT (RELATIVE TO 1990)
90%
100%
110%
120%
130%
United StatesPortland Area
199
0
199
3
199
6
199
9
20
02
20
05
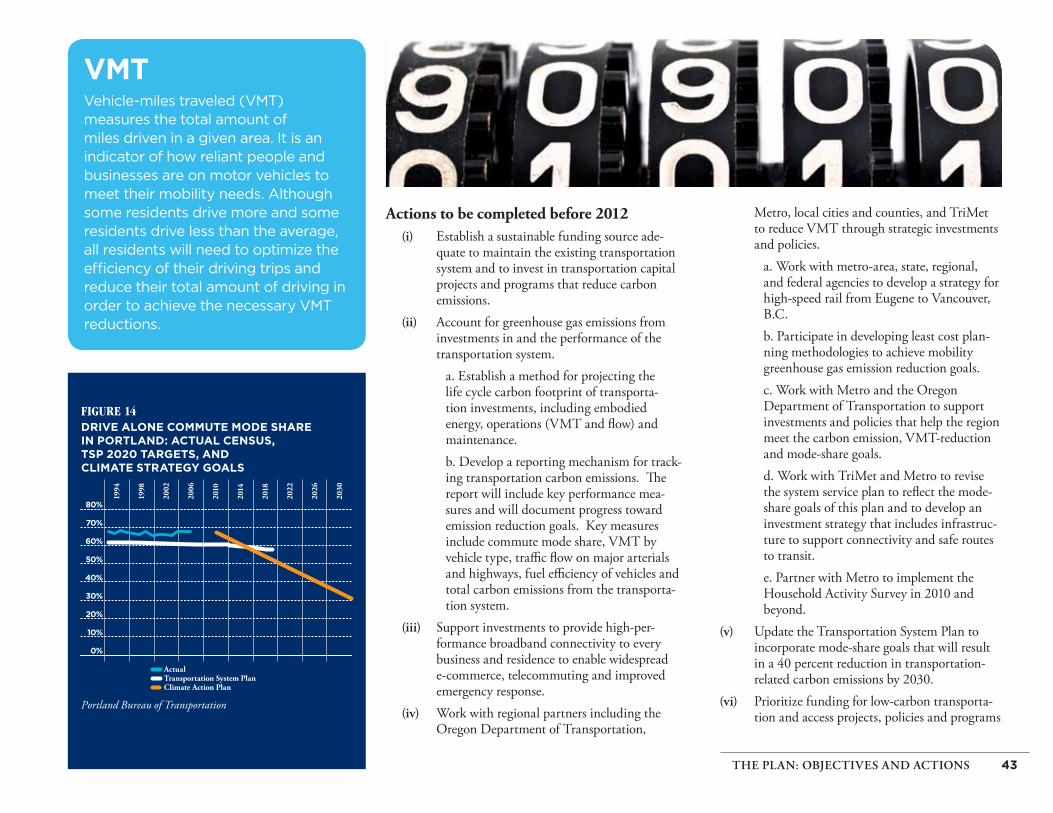
FIGURE 14
43THE PLAN: OBJECTIVES AND ACTIONS
Actions to be completed before 2012
(i) Establish a sustainable funding source ade-quate to maintain the existing transportation system and to invest in transportation capital projects and programs that reduce carbon emissions.
(ii) Account for greenhouse gas emissions from investments in and the performance of the transportation system.
a. Establish a method for projecting the life cycle carbon footprint of transporta-tion investments, including embodied energy, operations (VMT and fl ow) and maintenance. b. Develop a reporting mechanism for track-ing transportation carbon emissions. Th e report will include key performance mea-sures and will document progress toward emission reduction goals. Key measures include commute mode share, VMT by vehicle type, traffi c fl ow on major arterials and highways, fuel effi ciency of vehicles and total carbon emissions from the transporta-tion system.
(iii) Support investments to provide high-per-formance broadband connectivity to every business and residence to enable widespread e-commerce, telecommuting and improved emergency response.
(iv) Work with regional partners including the Oregon Department of Transportation,
Metro, local cities and counties, and TriMet to reduce VMT through strategic investments and policies.
a. Work with metro-area, state, regional, and federal agencies to develop a strategy for high-speed rail from Eugene to Vancouver, B.C.b. Participate in developing least cost plan-ning methodologies to achieve mobility greenhouse gas emission reduction goals.c. Work with Metro and the Oregon Department of Transportation to support investments and policies that help the region meet the carbon emission, VMT-reduction and mode-share goals. d. Work with TriMet and Metro to revise the system service plan to refl ect the mode-share goals of this plan and to develop an investment strategy that includes infrastruc-ture to support connectivity and safe routes to transit. e. Partner with Metro to implement the Household Activity Survey in 2010 and beyond.
(v) Update the Transportation System Plan to incorporate mode-share goals that will result in a 40 percent reduction in transportation-related carbon emissions by 2030.
(vi) Prioritize funding for low-carbon transporta-tion and access projects, policies and programs
VMT Vehicle-miles traveled (VMT) measures the total amount of miles driven in a given area. It is an indicator of how reliant people and businesses are on motor vehicles to meet their mobility needs. Although some residents drive more and some residents drive less than the average, all residents will need to optimize the effi ciency of their driving trips and reduce their total amount of driving in order to achieve the necessary VMT reductions.
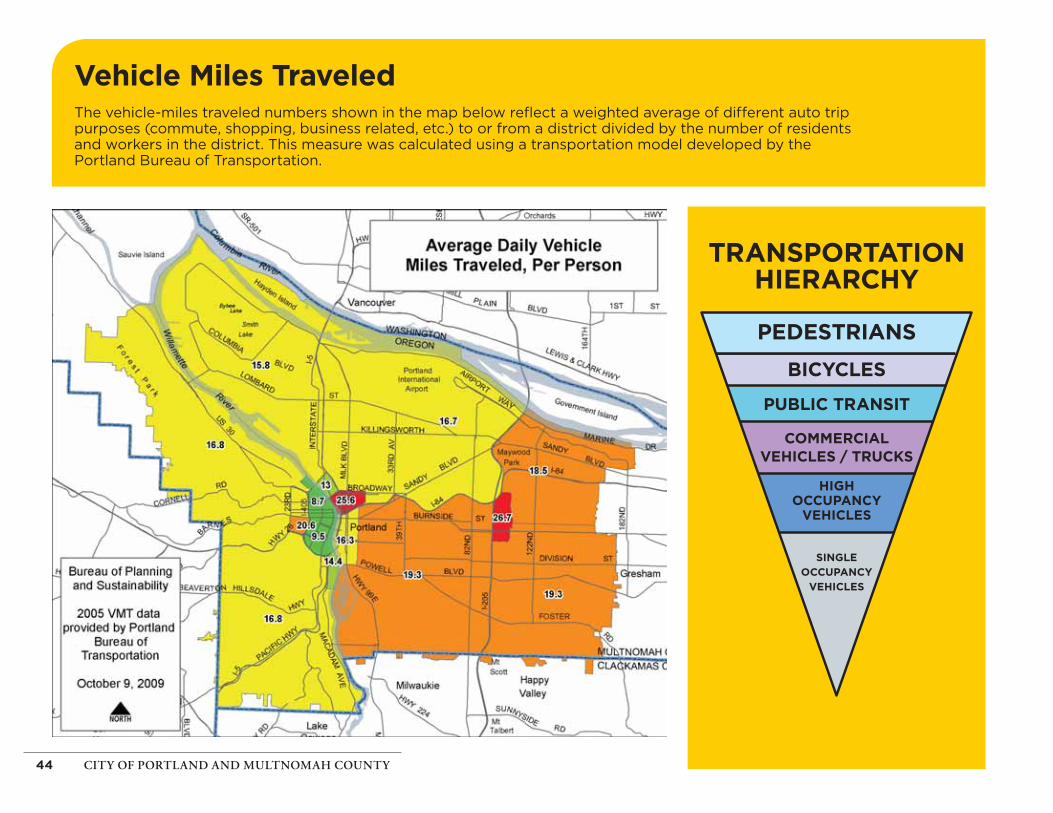
44 CITY OF PORTLAND AND MULTNOMAH COUNTY
TRANSPORTATION HIERARCHY
PEDESTRIANS
BICYCLES
PUBLIC TRANSIT
COMMERCIALVEHICLES / TRUCKS
HIGHOCCUPANCY
VEHICLES
SINGLEOCCUPANCY
VEHICLES
Vehicle Miles TraveledThe vehicle-miles traveled numbers shown in the map below refl ect a weighted average of different auto trip purposes (commute, shopping, business related, etc.) to or from a district divided by the number of residents and workers in the district. This measure was calculated using a transportation model developed by the Portland Bureau of Transportation.
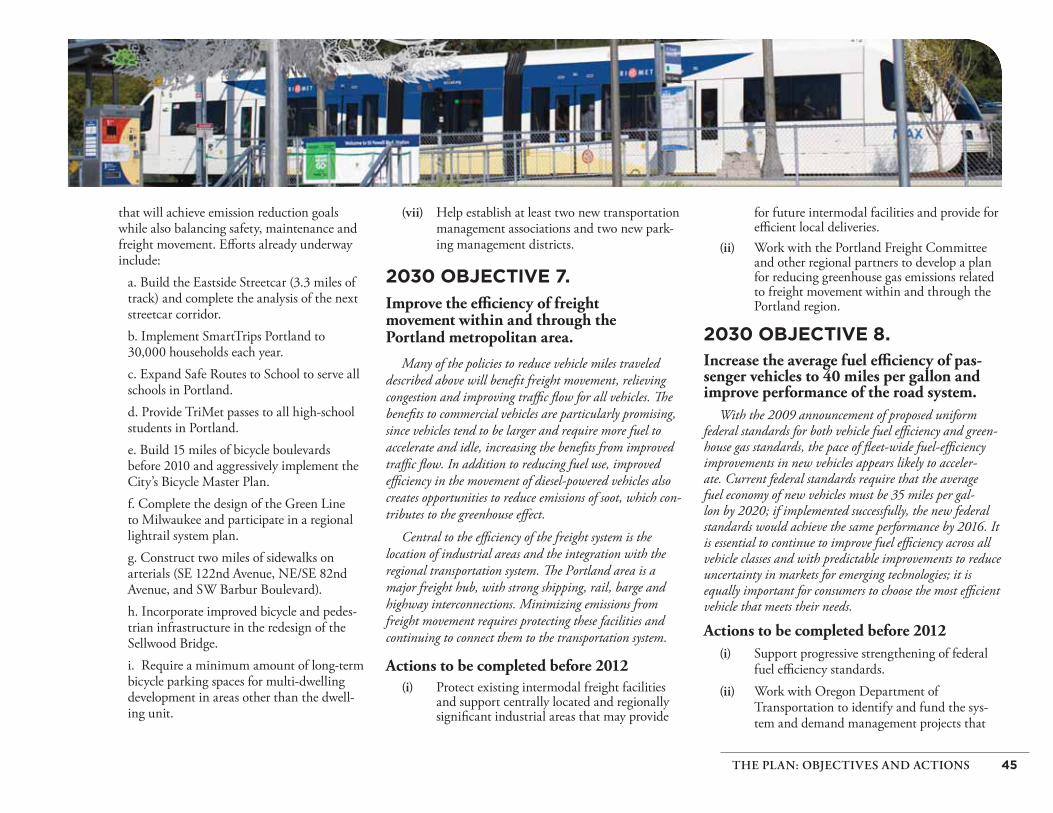
45THE PLAN: OBJECTIVES AND ACTIONS
that will achieve emission reduction goals while also balancing safety, maintenance and freight movement. Eff orts already underway include:
a. Build the Eastside Streetcar (3.3 miles of track) and complete the analysis of the next streetcar corridor.b. Implement SmartTrips Portland to 30,000 households each year.c. Expand Safe Routes to School to serve all schools in Portland.d. Provide TriMet passes to all high-school students in Portland. e. Build 15 miles of bicycle boulevards before 2010 and aggressively implement the City’s Bicycle Master Plan. f. Complete the design of the Green Line to Milwaukee and participate in a regional lightrail system plan. g. Construct two miles of sidewalks on arterials (SE 122nd Avenue, NE/SE 82nd Avenue, and SW Barbur Boulevard).h. Incorporate improved bicycle and pedes-trian infrastructure in the redesign of the Sellwood Bridge.i. Require a minimum amount of long-term bicycle parking spaces for multi-dwelling development in areas other than the dwell-ing unit.
(vii) Help establish at least two new transportation management associations and two new park-ing management districts.
2030 OBJECTIVE 7.Improve the effi ciency of freight movement within and through the Portland metropolitan area.
Many of the policies to reduce vehicle miles traveled described above will benefi t freight movement, relieving congestion and improving traffi c fl ow for all vehicles. Th e benefi ts to commercial vehicles are particularly promising, since vehicles tend to be larger and require more fuel to accelerate and idle, increasing the benefi ts from improved traffi c fl ow. In addition to reducing fuel use, improved effi ciency in the movement of diesel-powered vehicles also creates opportunities to reduce emissions of soot, which con-tributes to the greenhouse eff ect.
Central to the effi ciency of the freight system is the location of industrial areas and the integration with the regional transportation system. Th e Portland area is a major freight hub, with strong shipping, rail, barge and highway interconnections. Minimizing emissions from freight movement requires protecting these facilities and continuing to connect them to the transportation system.
Actions to be completed before 2012(i) Protect existing intermodal freight facilities
and support centrally located and regionally signifi cant industrial areas that may provide
for future intermodal facilities and provide for effi cient local deliveries.
(ii) Work with the Portland Freight Committee and other regional partners to develop a plan for reducing greenhouse gas emissions related to freight movement within and through the Portland region.
2030 OBJECTIVE 8.Increase the average fuel effi ciency of pas-senger vehicles to 40 miles per gallon and improve performance of the road system.
With the 2009 announcement of proposed uniform federal standards for both vehicle fuel effi ciency and green-house gas standards, the pace of fl eet-wide fuel-effi ciency improvements in new vehicles appears likely to acceler-ate. Current federal standards require that the average fuel economy of new vehicles must be 35 miles per gal-lon by 2020; if implemented successfully, the new federal standards would achieve the same performance by 2016. It is essential to continue to improve fuel effi ciency across all vehicle classes and with predictable improvements to reduce uncertainty in markets for emerging technologies; it is equally important for consumers to choose the most effi cient vehicle that meets their needs.
Actions to be completed before 2012(i) Support progressive strengthening of federal
fuel effi ciency standards.(ii) Work with Oregon Department of
Transportation to identify and fund the sys-tem and demand management projects that

46 CITY OF PORTLAND AND MULTNOMAH COUNTY
have the greatest potential to reduce emis-sions related to congestion, idling, and system performance.
(iii) Work with Oregon Department of Transportation and Metro to implement a con-gestion-pricing pilot program that prioritizes movement of freight and non-single-occupancy vehicles.
2030 OBJECTIVE 9.Reduce the lifecycle green-house gas emis-sions of transportation fuels by 20 percent.
Portland’s 2007 requirement that all fuel sold in the city contain minimum amounts of biofuels has already been a success. Biofuels have become widely accepted in Portland and Multnomah County, and manufacturers are begin-ning to design engines to accept higher blends of biofuels. Additional fuel-related emissions reductions will be pos-sible as a new generation of more sustainable alternative transportation fuels ( e.g., cellulosic ethanol and electric-ity) becomes commercially available. In 2009, the state of Oregon enabled the establishment of a statewide low-carbon fuel standard that will take into account lifecycle greenhouse gas emissions. By 2020, the standard will require a 10 per-cent reduction in greenhouse gas emissions from transporta-tion fuels from 2010 levels.
Actions to be completed before 2012
(i) Accelerate the transition to plug-in hybrids and electric vehicles by supporting the installation of a network of electric car charging stations.
(ii) Implement the second phase of the City’s renewable fuels standard to require that diesel fuel sold in Portland include at least 10 percent biodiesel, half of which must be made from sources that can be produced in Oregon.
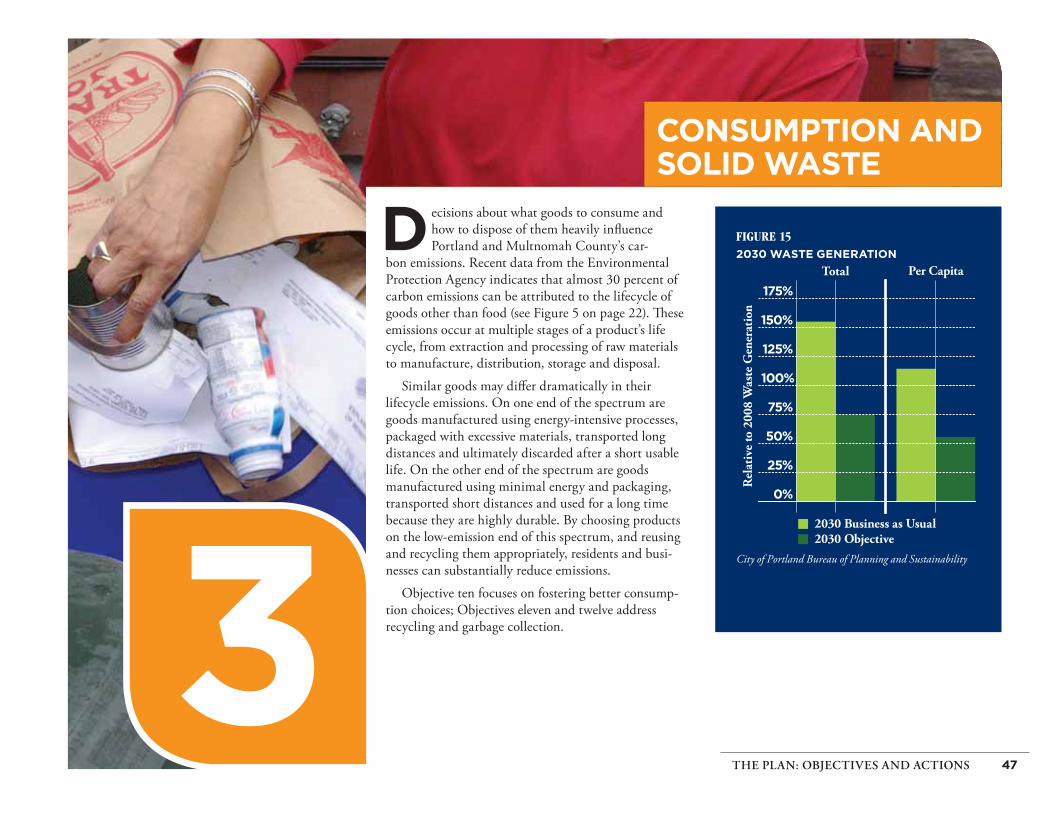
47THE PLAN: OBJECTIVES AND ACTIONS
CONSUMPTION AND SOLID WASTE
FIGURE 152030 WASTE GENERATION
Rel
ativ
e to
20
08
Was
te G
ener
atio
n
0%
25%
50%
75%
100%
125%
150%
175%
Total Per Capita
2030 Business as Usual2030 Objective
City of Portland Bureau of Planning and Sustainability
D ecisions about what goods to consume and how to dispose of them heavily infl uence Portland and Multnomah County’s car-
bon emissions. Recent data from the Environmental Protection Agency indicates that almost 30 percent of carbon emissions can be attributed to the lifecycle of goods other than food (see Figure 5 on page 22). Th ese emissions occur at multiple stages of a product’s life cycle, from extraction and processing of raw materials to manufacture, distribution, storage and disposal.
Similar goods may diff er dramatically in their lifecycle emissions. On one end of the spectrum are goods manufactured using energy-intensive processes, packaged with excessive materials, transported long distances and ultimately discarded after a short usable life. On the other end of the spectrum are goods manufactured using minimal energy and packaging, transported short distances and used for a long time because they are highly durable. By choosing products on the low-emission end of this spectrum, and reusing and recycling them appropriately, residents and busi-nesses can substantially reduce emissions.
Objective ten focuses on fostering better consump-tion choices; Objectives eleven and twelve address recycling and garbage collection.

48 CITY OF PORTLAND AND MULTNOMAH COUNTY
2030 OBJECTIVE 10.Reduce total solid waste generated by 25 percent.
Portland’s recycling rate is among the highest in the
U.S., reaching 64 percent in 2007, almost twice the
national average of 33 percent. Total solid waste gener-
ated, however, refers to both the amount of materials sent
to landfi lls and the amount of materials recovered (i.e.,
recycled, composted, converted to energy or otherwise put
to a use other than the original intended purpose). At
the current growth rate for solid waste generation, the
Portland area in 2030 will generate over one and a half
times the amount of waste it generates today (Figure 16).
Given expected population growth, a 25 percent reduc-
tion in total waste from current levels means that, on a
per capita basis, residents and businesses must generate
about half the waste in 2030 that they do today.
Th e Portland Recycles Plan, adopted by Portland City Council in 2007, establishes an objective of reducing
per capita waste generation to 2005 levels by 2015. Th is objective is consistent with the statewide goal of limiting
per capita waste generation to 2005 levels and limiting total waste generation to 2009 levels.
Actions to be completed before 2012
(i) Work with partner organizations to encour-age businesses and residents to purchase durable, repairable and reusable goods; to reduce the amount of materials that go to waste, including food; and to reduce con-
sumption of carbon-intensive consumer goods and services.
(ii) Develop a measurement and evalua-tion mechanism to track waste prevented through preservation, re-use and thoughtful consumption.
2030 OBJECTIVE 11.Recover 90 percent of all waste generated.
As noted above, in 2007, 64 percent of all waste gen-
erated in Portland was diverted from landfi ll disposal.
Given available technology, only nine percent of the total
amount of waste generated cannot readily be recycled. Th is
means more than 90 percent can be recovered. Portland
has established a city-wide objective of recovering 75 per-
cent of all waste by 2015. In 2008 it adopted a detailed
plan to help businesses comply with that requirement.
Actions to be completed before 2012
(i) Complete the implementation of manda-tory commercial food waste collection in Portland and begin collection of residential food waste.
(ii) Assist 1,000 businesses per year to improve compliance with Portland’s requirement of paper, metal and glass recycling.
(iii) Together with Metro and Department of Environmental Quality, create and periodi-cally update a regional waste management hierarchy that refl ects energy and greenhouse gas emissions as key factors in prioritizing such technologies as commercial composting,
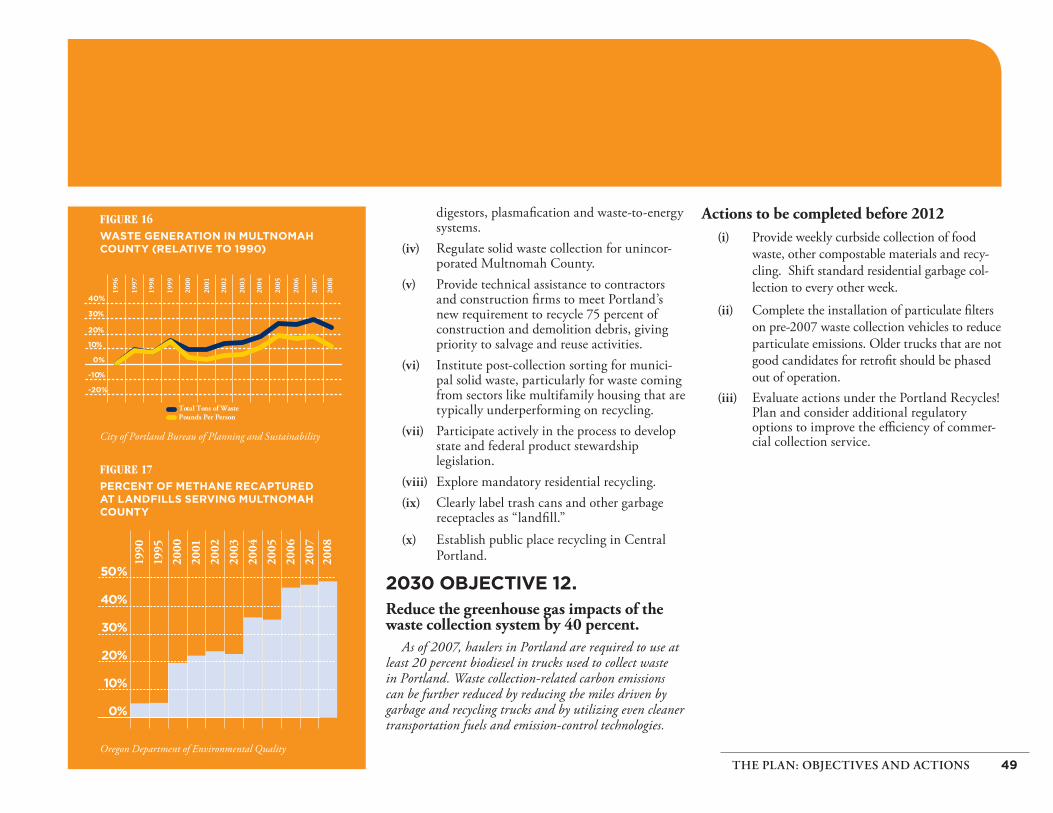
FIGURE 16WASTE GENERATION IN MULTNOMAH COUNTY (RELATIVE TO 1990)
City of Portland Bureau of Planning and Sustainability
FIGURE 17PERCENT OF METHANE RECAPTURED AT LANDFILLS SERVING MULTNOMAH COUNTY
Oregon Department of Environmental Quality
1996
1997
1998
1999
2000
2001
2002
2003
2004
2005
2006
2007
2008
40%
30%
20%
10%
0%
-10%
-20%
Total Tons of WastePounds Per Person
49THE PLAN: OBJECTIVES AND ACTIONS
digestors, plasmafi cation and waste-to-energy systems.
(iv) Regulate solid waste collection for unincor-porated Multnomah County.
(v) Provide technical assistance to contractors and construction fi rms to meet Portland’s new requirement to recycle 75 percent of construction and demolition debris, giving priority to salvage and reuse activities.
(vi) Institute post-collection sorting for munici-pal solid waste, particularly for waste coming from sectors like multifamily housing that are typically underperforming on recycling.
(vii) Participate actively in the process to develop state and federal product stewardship legislation.
(viii) Explore mandatory residential recycling.(ix) Clearly label trash cans and other garbage
receptacles as “landfi ll.”(x) Establish public place recycling in Central
Portland.
2030 OBJECTIVE 12.Reduce the greenhouse gas impacts of the waste collection system by 40 percent.
As of 2007, haulers in Portland are required to use at least 20 percent biodiesel in trucks used to collect waste in Portland. Waste collection-related carbon emissions can be further reduced by reducing the miles driven by garbage and recycling trucks and by utilizing even cleaner transportation fuels and emission-control technologies.
Actions to be completed before 2012(i) Provide weekly curbside collection of food
waste, other compostable materials and recy-cling. Shift standard residential garbage col-lection to every other week.
(ii) Complete the installation of particulate fi lters on pre-2007 waste collection vehicles to reduce particulate emissions. Older trucks that are not good candidates for retrofi t should be phased out of operation.
(iii) Evaluate actions under the Portland Recycles! Plan and consider additional regulatory options to improve the effi ciency of commer-cial collection service.

50 CITY OF PORTLAND AND MULTNOMAH COUNTY
Residential Recycling in Portland Garbage and recycling haulers in Portland serve geographic areas that do not correspond to neighborhood boundaries, and in some cases haulers serve multiple areas that are not contiguous. The percentages for each area on the map refl ect the residential curbside recycling rate for the entire service territory of each hauler.
In addition, the residential diversion rates on this map are calculated based only on materials set out at curbside and do not take into account material diverted from the landfi ll by recycling through the bottle bill, independent recyclers or other means. Thus, the diversion rates shown on this map are lower than the actual residential diversion rate calculated for the city.

51THE PLAN: OBJECTIVES AND ACTIONS
Trees off er a wide array of benefi ts: improving watershed health, habitat and air quality, pro-viding recreation, refreshment and revitaliza-
tion, enhancing the aesthetics of neighborhoods and increasing property values. Trees are just one example of the important role natural systems play in address-ing climate change — by sequestering carbon dioxide, by reducing building energy use through cooling and shading in summer and lessening heat loss in winter.
Without strong safeguards, population growth in Multnomah County will cause the amount of impervi-ous surfaces to increase, displacing vegetation and habi-tat. To maximize the benefi ts of the natural systems and protect against losses, eff orts should focus on retaining the existing canopy, planting large-species trees where appropriate and keeping trees healthy.
2030 OBJECTIVE 13.Expand the urban forest canopy to cover one-third of Portland, and at least 50 per-cent of total stream and river length in the city meet urban water temperature goals as an indicator of watershed health.
Currently, the Portland urban forest covers 26 percent of Portland and removes 88,000 metric tons of carbon dioxide from the atmosphere per year, equal to about one percent of all local carbon emissions. Should the urban for-est’s capacity to sequester carbon dioxide be compromised, Portland will have to reduce emissions beyond the 80 per-cent goal to compensate.
Resilient watersheds are a key response to a changing climate, and water temperature is a primary indicator of watershed health. Th is plan seeks to reduce urban stream temperatures so that at least 50 percent of the total stream and river length in the city has a 7-day average daily maximum less than 64 degrees F in the tributaries and 68 degrees F for the Willamette. Th e City of Portland’s “Grey
to Green” initiative is an example of the kinds of programs and actions that must be implemented to achieve this objective.
Actions to be completed before 2012(i) Expand public and private programs to
encourage planting, preserving and main-taining trees and shrubs, controlling invasive species, and reducing and cooling impervious areas, including removing regulatory obstacles and exploring incentives.
(ii) Acquire, restore and protect natural resources to promote functional watersheds and for-est ecosystems, reduce the urban heat island eff ect, improve air and water quality, connect habitats, and contribute to regional health, biodiversity, and resiliency.
(iii) Develop and implement an outreach cam-paign to provide educational resources to residents about the benefi ts of trees, watershed health, and green infrastructure.
(iv) Recognize trees, shrubs, vegetation and natural landscapes as assets of the City and County infrastructure. Advocate for simi-lar recognition by state and federal agencies. Explore the feasibility of managing street trees and other public trees as capital assets.
(v) Clarify codes and policies to maximize the preservation of the largest, longest-living trees, and ensure expansion of the urban forest over time. Encourage tree species and age diversity and increase canopy in tree-defi cient areas.
(vi) Evaluate both green and traditional grey alternatives for public infrastructure proj-ects. Develop fi nal designs that support the restoration, enhancement, and protection of Portland’s urban forest and watershed health.
URBAN FORESTRY AND NATURAL SYSTEMS

52 CITY OF PORTLAND AND MULTNOMAH COUNTY
M ore than 10 percent of total U.S. carbon emissions result from the food system. Th is fi gure may approach 30 percent when food
importation and agriculture-related deforestation and soil degradation are included.21 Th e total carbon foot-print of the food system may be larger than passenger transportation.
Residents of Multnomah County can reduce the impact of food choices on climate change — and improve personal, environmental and economic health — by choosing locally produced and “low-carbon” foods. By choosing to eat locally, residents bolster the local economy, help preserve the agricultural land base and can reduce emissions from transporting food. To do so, residents must have increased access to locally produced food, the skills to grow their own food, and the knowledge to make healthy consumption choices. Objective 15 addresses these needs, while Objective 14 seeks to reduce food-related emissions by focusing on the consumption of carbon-intensive foods like red meat or products transported long distances by air.
2030 OBJECTIVE 14.
Reduce consumption of carbon-intensive foods.From a carbon perspective, not all food is created equal. As shown in Figure 18, consumption of red meat (beef and pork), for example, results in more than twice the
21 European Commission. 2006. Environmental Impact of Products: Analysis of the Life Cycle Environmental Impacts Related to the Final Consumption of the EU-25. Technical Report EUR 22284 EN. Spain: European Comission, Joint Research Centre, Institute of Prospective Technological Studies.
carbon emissions, on a per-calorie basis, of dairy prod-ucts, almost three times that of chicken, fi sh, eggs, fruits and vegetables, and almost eight times the emissions of cereals and carbohydrates. Red meat production is signifi -cantly more carbon intensive than other foods because: (a) the digestive process of cattle produces large amounts of methane gas and (b) over 30 calories of inputs are often needed to produce one calorie of beef.22 If the average household were to shift the calories of one day’s meat and dairy consumption per week to grains and vegetables, the resulting carbon emissions reductions would be equiva-lent to driving approximately 10 percent less per year.23
Actions to be completed before 2012(i) Include food choice as a component of the
public engagement campaign (Objective 16) that inspires the community to live a climate-friendly lifestyle.
(ii) Create City and County partnerships with healthcare, schools and other organizations to promote healthy, low-carbon diets.
22 See, for example, Horrigan, Leo, Robert Lawrence and Polly Walker. “How Sustainable Agriculture Can Address the Environmental and Human Health Harms of Industrial Agriculture.” Environmental Health Perspectives, May, 2002, p. 448.
23 Weber, Christopher L. and H. Scott Matthews. “Food-Miles and the Relative Climate Impacts of Food Choices in the United States.” Environmental Science and Technology, April 16, 2008, p. 3513.
FOOD AND AGRICULTURE

53THE PLAN: OBJECTIVES AND ACTIONS
2030 OBJECTIVE 15.Signifi cantly increase the consumption
of local food.
A county-wide urban food and agriculture ini-tiative promotes a long-term vision of a city and county that can grow a signifi cant portion of its food. A community-based, local food system can reshape the community’s relationship to food and provide substantial environmental, economic, social and health benefi ts. A public-private initiative can sig-nifi cantly increase the amount of home-grown food and reduce the carbon intensity of the food chain.
Actions to be completed before 2012
(i) Integrate sustainable food system issues, and where practical, quantitative goals and metrics, into planning processes, including the City’s Portland Plan and the Multnomah Food Initiative.
(ii) Identify and implement City and County strategies to encourage local food production and distribution, including providing incen-tives and removing regulatory obstacles.
(iii) Develop policy and provide programmatic resources to signifi cantly increase the per-centage of home-grown and locally sourced food, including the support of farmers mar-kets and community supported agriculture; the use of public and private land and roof-tops for growing food; promoting fruit and nut trees as options for the 33,000 yard trees
to be planted as part of the Grey to Green initiative; and develop or facilitate 1,000 new community garden plots.
(iv) Provide educational opportunities for resi-dents to gain skills in organic gardening, fruit production, animal husbandry, food preservation and cooking, and aff ordable, healthy eating.
(v) Multnomah County to work to reestab-lish funding to the Oregon State University Extension Service.
(vi) Establish quantitative metrics for consump-tion of regionally sourced food.FIGURE 18
RELATIVE CARBON EMISSIONS PER CALORIE
0% 50% 100%
CerealsCarbohydrates
ChickenFishEggs
FruitVegetables
Dairy
Red Meat
Weber, Christopher L. and Matthews, H. Scott. “Food-Miles and the Relative Climate Impacts of Food Choices in the United States.” Environmental Science and Technology, April 16, 2008.

FIGURE 19VOLUNTARY GREEN ELECTRICITY PURCHASES (PERCENT OF TOTAL ELECTRICITY PURCHASES)
Pacifi c Power, Portland General Electric
54 CITY OF PORTLAND AND MULTNOMAH COUNTY
M ultnomah County residents and businesses are an essential part of the solution to the climate crisis. Over one-third of all carbon
emissions result directly from household energy use and personal vehicles, while non-industrial businesses account for another third. Many businesses, civic organizations, government leaders and citizens have shown a commitment to addressing climate change while maintaining high quality of life and a thriving economy. For example, the increase in green energy purchases, shown in Figure 19, is one indicator of such a commitment. To foster and build on this commit-ment, the City and County will support community-wide public engagement campaigns to educate, inspire and off er some of the most cost-eff ective, healthy and easy solutions. Th e campaign will seek to engage diverse partners and sectors of the community; cre-ate a shared community vision, goals and progress indicators of a low-carbon future; connect individuals and organizations to education, tools and resources; and celebrate positive changes and successes. A fully engaged community is the key to success in dealing with climate change.
2030 OBJECTIVE 16.Motivate all Multnomah County residents and businesses to change their behavior in ways that reduce carbon emissions.
A successful community engagement campaign must tie together existing eff orts, develop new initiatives and forge a partnership between government and the commu-nity. Reaching this objective requires cooperation among governments, neighborhoods, schools, non-profi t organi-
zations, faith communities, businesses, civic organizations and individual community members.
Actions to be completed before 2012
(i) In partnership with businesses, universities, schools, non-profi t organizations, commu-nity groups, public agencies, and existing eff orts, develop a community-wide public engagement campaign to promote carbon emission reductions.
(ii) Establish a business leadership council to catalyze the business community to create a prosperous low-carbon economy.
(iii) Establish and publicize climate action met-rics by neighborhood, including measures such as household energy use, vehicle miles traveled, walkability and bicycle commute rates.
(iv) Partner with the Portland Sustainability Institute to bring together academia, busi-nesses and government to foster policy devel-opment, best practices and collaboration to address climate change.
(v) Expand opportunities for residents and busi-ness, especially in historically underserved areas, to learn how to track and manage energy use, improve effi ciency and adapt to a changing climate.
(vi) Seek funding to support neighborhood and community groups in the implementation of carbon-reduction projects and programs.
COMMUNITY ENGAGEMENT
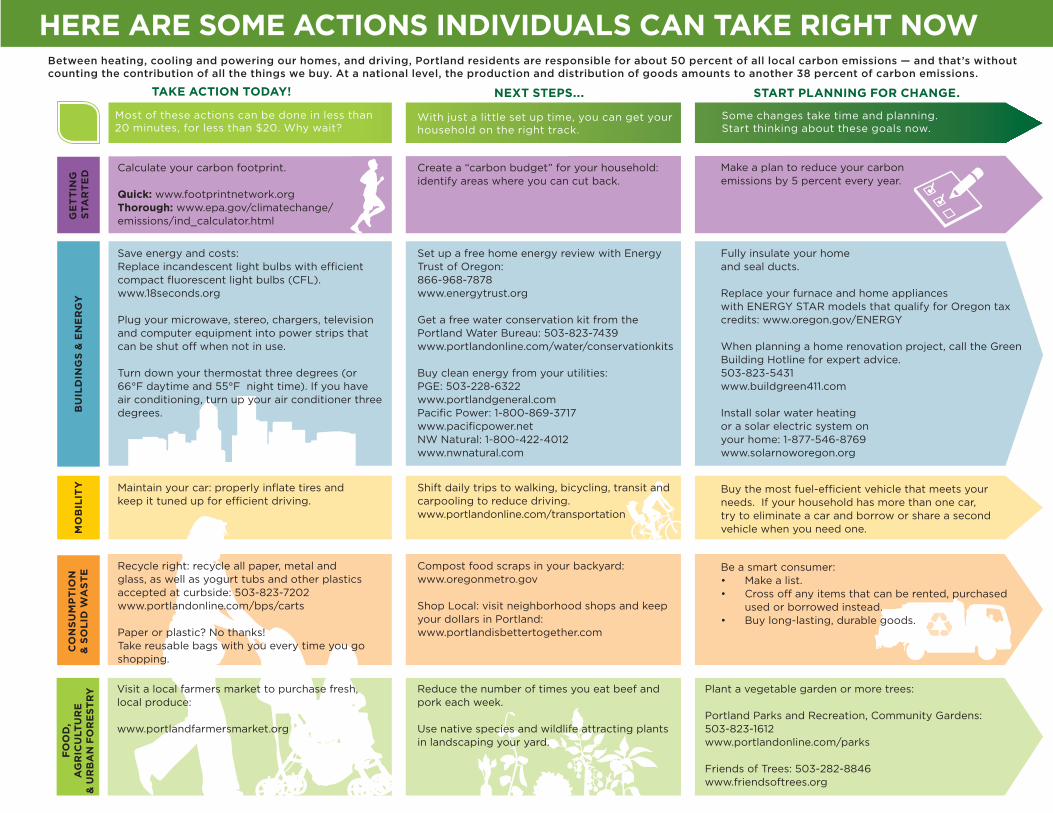
Between heating, cooling and powering our homes, and driving, Portland residents are responsible for about 50 percent of all local carbon emissions — and that’s without counting the contribution of all the things we buy. At a national level, the production and distribution of goods amounts to another 38 percent of carbon emissions.
TAKE ACTION TODAY! NEXT STEPS... START PLANNING FOR CHANGE.
Some changes take time and planning.Start thinking about these goals now.
With just a little set up time, you can get your household on the right track.
GE
TT
ING
STA
RT
ED
BU
ILD
ING
S &
EN
ER
GY
CO
NS
UM
PT
ION
& S
OL
ID W
AS
TE
FO
OD
, A
GR
ICU
LTU
RE
& U
RB
AN
FO
RE
ST
RY
MO
BIL
ITY
Calculate your carbon footprint.
Quick: www.footprintnetwork.orgThorough: www.epa.gov/climatechange/emissions/ind_calculator.html
Save energy and costs:Replace incandescent light bulbs with effi cient compact fl uorescent light bulbs (CFL). www.18seconds.org
Plug your microwave, stereo, chargers, television and computer equipment into power strips that can be shut off when not in use.
Turn down your thermostat three degrees (or 66°F daytime and 55°F night time). If you have air conditioning, turn up your air conditioner three degrees.
Maintain your car: properly infl ate tires andkeep it tuned up for effi cient driving.
Visit a local farmers market to purchase fresh, local produce:
www.portlandfarmersmarket.org
Reduce the number of times you eat beef and pork each week.
Use native species and wildlife attracting plants in landscaping your yard.
Plant a vegetable garden or more trees:
Portland Parks and Recreation, Community Gardens: 503-823-1612www.portlandonline.com/parks
Friends of Trees: 503-282-8846www.friendsoftrees.org
Recycle right: recycle all paper, metal and glass, as well as yogurt tubs and other plastics accepted at curbside: 503-823-7202www.portlandonline.com/bps/carts
Paper or plastic? No thanks!Take reusable bags with you every time you go shopping.
Shift daily trips to walking, bicycling, transit and carpooling to reduce driving.www.portlandonline.com/transportation
Compost food scraps in your backyard:www.oregonmetro.gov
Shop Local: visit neighborhood shops and keep your dollars in Portland:www.portlandisbettertogether.com
Buy the most fuel-effi cient vehicle that meets your needs. If your household has more than one car, try to eliminate a car and borrow or share a second vehicle when you need one.
Be a smart consumer:• Make a list.• Cross off any items that can be rented, purchased
used or borrowed instead.• Buy long-lasting, durable goods.
Create a “carbon budget” for your household: identify areas where you can cut back.
Set up a free home energy review with Energy Trust of Oregon: 866-968-7878www.energytrust.org
Get a free water conservation kit from the Portland Water Bureau: 503-823-7439www.portlandonline.com/water/conservationkits
Buy clean energy from your utilities:PGE: 503-228-6322www.portlandgeneral.comPacifi c Power: 1-800-869-3717www.pacifi cpower.netNW Natural: 1-800-422-4012www.nwnatural.com
Make a plan to reduce your carbon emissions by 5 percent every year.
Fully insulate your homeand seal ducts.
Replace your furnace and home applianceswith ENERGY STAR models that qualify for Oregon tax credits: www.oregon.gov/ENERGY
When planning a home renovation project, call the Green Building Hotline for expert advice.503-823-5431www.buildgreen411.com
Install solar water heatingor a solar electric system onyour home: 1-877-546-8769www.solarnoworegon.org
HERE ARE SOME ACTIONS INDIVIDUALS CAN TAKE RIGHT NOW
Most of these actions can be done in less than 20 minutes, for less than $20. Why wait?

56 CITY OF PORTLAND AND MULTNOMAH COUNTY
C limate change impacts are already evident, both globally and in Oregon. More impacts are inevitable. In Oregon, rainstorms and
snowstorms could increase in severity, but less snow would build up in the mountains; coast towns could experience more fl ooding, causing increased damage to roads, buildings, bridges, and water and sewer sys-tems; crops and livestock could face warmer tempera-tures, less water for drinking and irrigation, and drier soils; and heat waves could increase, causing a rise in heat-related illnesses and deaths.
Preparing for climate change must be understood broadly and as an integral component of Portland and Multnomah County’s Climate Action Plan. Buildings, for example, must be designed to accom-modate a changing climate — comfortable in higher temperatures, for example, and resilient to stronger storms and other physical impacts of climate change — while also highly energy effi cient. Th e public health fi eld must simultaneously help prevent climate change — for example, by encouraging walking—and prepare for it, by anticipating changing disease pat-terns and more intense heat waves, among many other changes. Natural systems have an equally integral role. Protecting wetlands, for example, both sequesters carbon emissions and prepares Portland to handle the expected increase in severe rainstorms.
Th e City and County must accelerate eff orts to protect and improve watershed health, strengthen the linkages between public health and climate change, and comprehensively evaluate the respond to
the community’s vulnerabilities to climate change. Th ese considerations add to the complexity of pre-paring for the diverse challenges and opportunities in the decades ahead—population growth, shifting demographics and changes in the regional and global economy. Th e breadth of these challenges underscores the need to plan for adaptable and resilient systems that help the City and County achieve their long-range goals of environmental and community health, economic development, equity, aff ordability and neighborhood livability.
2030 Objective 17.
Adapt successfully to a changing climate.
Climate change is already aff ecting Portland and
Multnomah County. To adapt, the region must under-
stand and prepare for change. Th is work has already
begun. In 2002, for example, the Portland Water
Bureau analyzed potential impacts of climate change
on supply and demand for potable water. At a regional
level, the Oregon Climate Change Research Institute and
University of Washington Climate Impacts Group are
leaders in advanced scientifi c research on likely climate
change impacts.
CLIMATE CHANGE PREPARATION

57THE PLAN: OBJECTIVES AND ACTIONS
A comprehensive review should be undertaken to
better understand the likely impacts of climate change.
Because of the long lead time necessary for some of the
adaptive actions that may be required, it is key that this
review and resulting recommendations take place soon,
and include:
■ Impact areas such as infrastructure, energy,
economy, transportation, water, food, stormwater
management, social and health services, public
safety, environment and biodiversity, population
migrations and emergency preparedness.
■ Planning arenas that the City or County manages
or for which they set policy.
■ Co-benefi ts of preparation eff orts.
Actions to be completed before 2012
(i) Prepare an assessment of climate-related vul-nerabilities, strengths and resiliency of local food, water and energy supplies, infrastruc-ture, transportation and freight movement, fl oodplains, watershed health, public health, public safety, social services and emergency preparedness.
(ii) Develop a climate change preparation plan that analyzes and prioritizes preparation actions to manage risks and increase overall fl exibility and resiliency, assigns responsibil-ity to appropriate bureaus or departments and ensures that disproportionate impacts on vulnerable populations are addressed.
(iii) Monitor implementation of climate change preparation actions and emerging data on risks. If necessary, revise adaptation plans more frequently than the three-year revision cycle for the overall plan.
(iv) Protect and restore wetlands, fl oodplains, wildlife habitat and corridors to strengthen the capacity of natural systems to respond to more severe weather events, streamfl ow changes, and fl ooding.
(v) Collaborate with Metro and state agencies to update and ensure continued accuracy of land hazard mapping and inventories, including landslide hazards, fl oodplains and areas subject to wildfi re risk.
(vi) Integrate climate adaptation and natural haz-ard mitigation strategies into major planning eff orts and consider the potential for substan-tial numbers of “climate refugees” in contem-plating future growth scenarios.
(vii) When planning public infrastructure invest-ments and service delivery strategies, con-sider the physical, social, environmental, economic, and regulatory impacts of miti-gating and adapting to climate change. Th is may necessitate developing and using fore-casts and models that account for potential climate changes and evaluating investment alternatives based on triple bottom line and climate change impacts over the lifespan of the infrastructure.
Green InfrastructureGreen infrastructure uses natural processes, systems or features to provide traditional infrastructure services. There are two primary types of green infrastructure:
• Natural networks of streams, rivers, and open spaces that naturally manage stormwater, provide habitat, improve air and water quality, reduce fl ooding risk, and provide areas for human recreation and respite; and
• Engineered facilities, such as green street treatments or eco-roofs, which use natural processes in an infrastructure setting.
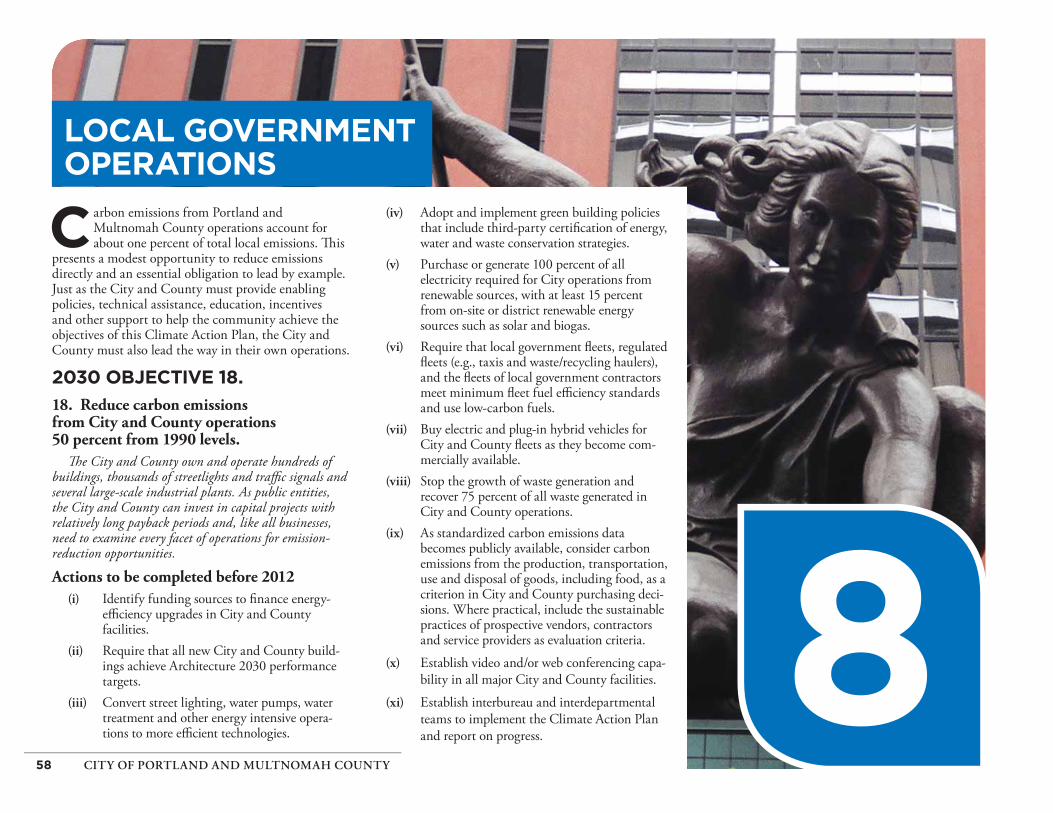
58 CITY OF PORTLAND AND MULTNOMAH COUNTY
LOCAL GOVERNMENT OPERATIONS
C arbon emissions from Portland and Multnomah County operations account for about one percent of total local emissions. Th is
presents a modest opportunity to reduce emissions directly and an essential obligation to lead by example. Just as the City and County must provide enabling policies, technical assistance, education, incentives and other support to help the community achieve the objectives of this Climate Action Plan, the City and County must also lead the way in their own operations.
2030 OBJECTIVE 18.
18. Reduce carbon emissions from City and County operations 50 percent from 1990 levels.
Th e City and County own and operate hundreds of buildings, thousands of streetlights and traffi c signals and several large-scale industrial plants. As public entities, the City and County can invest in capital projects with relatively long payback periods and, like all businesses, need to examine every facet of operations for emission-reduction opportunities.
Actions to be completed before 2012
(i) Identify funding sources to fi nance energy-effi ciency upgrades in City and County facilities.
(ii) Require that all new City and County build-ings achieve Architecture 2030 performance targets.
(iii) Convert street lighting, water pumps, water treatment and other energy intensive opera-tions to more effi cient technologies.
(iv) Adopt and implement green building policies that include third-party certifi cation of energy, water and waste conservation strategies.
(v) Purchase or generate 100 percent of all electricity required for City operations from renewable sources, with at least 15 percent from on-site or district renewable energy sources such as solar and biogas.
(vi) Require that local government fl eets, regulated fl eets (e.g., taxis and waste/recycling haulers), and the fl eets of local government contractors meet minimum fl eet fuel effi ciency standards and use low-carbon fuels.
(vii) Buy electric and plug-in hybrid vehicles for City and County fl eets as they become com-mercially available.
(viii) Stop the growth of waste generation and recover 75 percent of all waste generated in City and County operations.
(ix) As standardized carbon emissions data becomes publicly available, consider carbon emissions from the production, transportation, use and disposal of goods, including food, as a criterion in City and County purchasing deci-sions. Where practical, include the sustainable practices of prospective vendors, contractors and service providers as evaluation criteria.
(x) Establish video and/or web conferencing capa-bility in all major City and County facilities.
(xi) Establish interbureau and interdepartmental teams to implement the Climate Action Plan and report on progress.
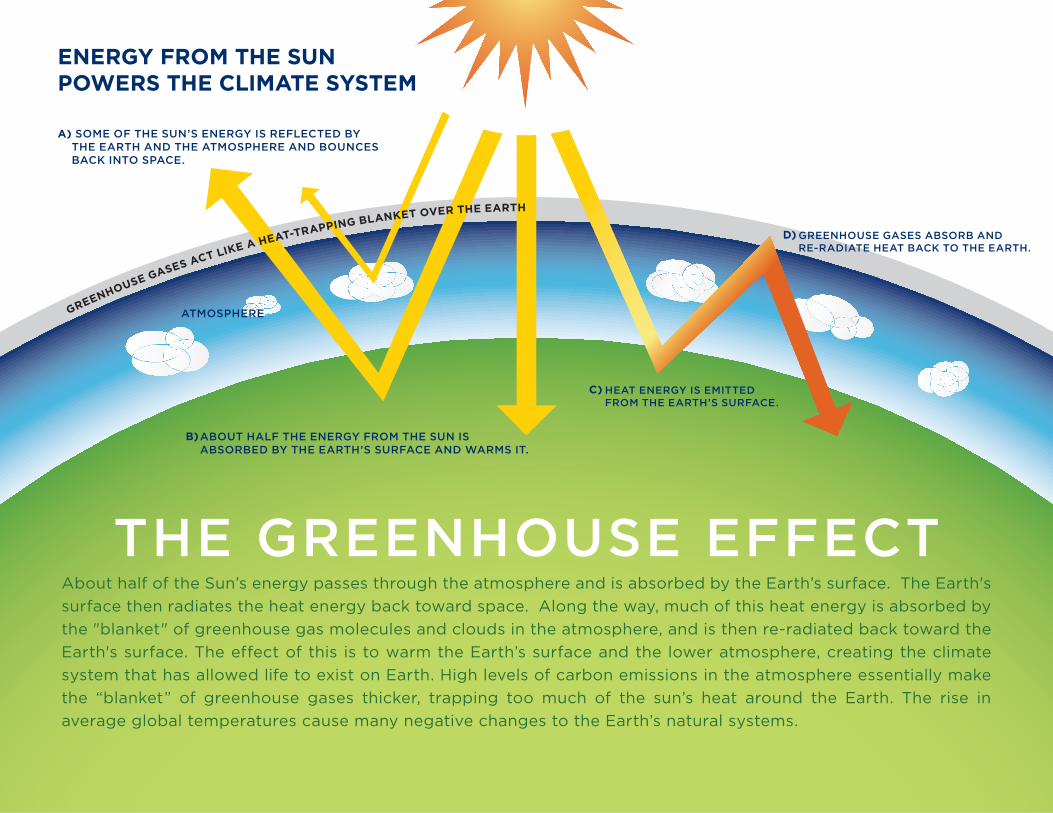
ENERGY FROM THE SUNPOWERS THE CLIMATE SYSTEM
HEAT ENERGY IS EMITTEDFROM THE EARTH’S SURFACE.
GREENHOUSE GASES ABSORB ANDRE-RADIATE HEAT BACK TO THE EARTH.
About half of the Sun’s energy passes through the atmosphere and is absorbed by the Earth’s surface. The Earth's
surface then radiates the heat energy back toward space. Along the way, much of this heat energy is absorbed by
the "blanket" of greenhouse gas molecules and clouds in the atmosphere, and is then re-radiated back toward the
Earth's surface. The effect of this is to warm the Earth’s surface and the lower atmosphere, creating the climate
system that has allowed life to exist on Earth. High levels of carbon emissions in the atmosphere essentially make
the “blanket” of greenhouse gases thicker, trapping too much of the sun’s heat around the Earth. The rise in
average global temperatures cause many negative changes to the Earth’s natural systems.
A) SOME OF THE SUN’S ENERGY IS REFLECTED BY THE EARTH AND THE ATMOSPHERE AND BOUNCES BACK INTO SPACE.
ABOUT HALF THE ENERGY FROM THE SUN ISABSORBED BY THE EARTH’S SURFACE AND WARMS IT.
ATMOSPHERE
B)
C)
D)
GREENHOUSE GASES ACT LIKE A HEAT-TRAPPING BLANKET OVER THE EARTH

60 CITY OF PORTLAND AND MULTNOMAH COUNTY
CLIMATE CHANGE OVERVIEW
APPENDIX 1
THE GREENHOUSE EFFECT
C limate change is driven by the greenhouse eff ect, a natural phenomenon essential to life as we know it. Without the greenhouse eff ect, the Earth would be permanently icy and inhospitable. Water vapor, carbon dioxide
and other gases in the Earth’s atmosphere act like a blanket over the Earth, absorb-ing some of the heat from the sunlight-warmed surface of the Earth instead of allowing it to escape into space (see graphic on page 48). Increasing the amount of these gases, called carbon emissions, in the atmosphere essentially makes the blan-ket thicker — and warmer. Th is warming is accompanied by changes in precipita-tion patterns, increased frequency and intensity of storms, wildfi res, droughts and fl oods, rising sea level, changes in water quality and substantial changes in habitats, including the range of pests and diseases.
CARBON DIOXIDE AND OTHER CARBON EMISSIONS
Fossil fuels such as coal, gasoline, diesel, fuel oil and natural gas are made of carbon that has been stored underground for millions of years. Burning fossil fuels to generate electricity, manufacture goods, grow food, heat our homes and power our vehicles transforms this stored carbon into the gas carbon dioxide, which is then released into the atmosphere. Changing patterns of land use and land cover, primarily the burning and destroying of forests and the conversion of wildlands to farmland or housing, also release carbon dioxide from carbon stored in plant matter and soil. Further, by reducing the number of trees and plants that otherwise would remove carbon dioxide from the atmosphere through photosynthesis, such land use changes reduce the planet’s capacity to absorb carbon dioxide. As a result of these activities, global atmospheric concentrations of carbon dioxide have increased by more than 30 percent over the past 150 years.
Carbon dioxide comprises almost 85 percent of U.S. carbon emissions, but it is not the only greenhouse gas of concern. Methane, nitrous oxide and halocarbons are also increasing in the atmosphere as a direct result of human activities. Methane

61APPENDIX 1: CLIMATE CHANGE OVERVIEW
emissions, which account for eight percent of U.S. emissions, result primarily from raising livestock and waste disposal in landfi lls, where putrescible — rotting — waste generates methane. Soil management practices and application of fertilizers are the principal cause of nitrous oxide emissions, which represents fi ve percent of U.S. emissions. Halocarbons, which include chlorofl uorocarbons, hydrochlorofl uo-rocarbons and perfl uorocarbons, are synthetic gases produced during industrial processes such as cement manufacturing and aluminum smelting. Th ese carbon emissions, though a smaller percentage of total emissions, all exert a more power-ful greenhouse eff ect than carbon dioxide. (See “Units of Measurement for Carbon Emissions” in Appendix 3 for more information.) Reducing emissions of these gases is thus a critical component of climate protection.
SCIENTIFIC AUTHORITYTh e United Nations Environment Programme and the World Meteorological
Organization established the Intergovernmental Panel on Climate Change (IPCC) in 1988. Th e IPCC remains the primary authority on global climate change, receiv-ing the 2007 Nobel Peace Prize for its work in the fi eld.
Th e latest IPCC report, released in 2007, concludes that:1
■ Human activity has increased atmospheric concentrations of carbon dioxide, methane and nitrous oxide to levels not seen in the past 650,000 years.
■ Th ere is over 90 percent certainty that most of the warming of the climate is due to human activity.
■ Humans have set in motion a warming of the climate and rising of sea levels that will continue for centuries, but the amount of warming and sea level rise will be determined by human activity in the coming years.
■ To minimize the extent of climate change, global carbon emissions must peak no later than 2015 and decline 50 to 85 percent from 2000 levels by 2050.
In January of 2008, the IPCC Chair, Rajendra Pachauri, suggested that the world had just seven years to stabilize carbon emissions.2
1 Intergovernmental Panel on Climate Change, Climate Change 2007: Synthesis Report.
2 Pachauri, Rajendra K. “How Would Climate Change Infl uence Society in the 21st Century?” Lecture delivered at Massachusetts Institute of Technology, January 29, 2008.
IMPACTSPortland, Multnomah County and the entire Pacifi c Northwest will feel the
impacts of global climate broadly and deeply. Since 1900, the average tempera-ture in the Pacifi c Northwest has increased by 1.5 degrees Fahrenheit. In the next century, the warming is expected to accelerate and increase at least three times as quickly.3 In the last century, glaciers on Mt. Hood shrank by more than one-third.4 Melting ice on this iconic mountain, while one of the more visible impacts of cli-mate change, will not impact Portlander’s daily lives in the way that will other, less immediately apparent changes.
Th e Pacifi c Northwest will experience more warming in summer, and nights will cool off less than they do today. Increased urbanization and population growth, with their related roads and rooftops, will exacerbate the urban heat island eff ect, increasing local temperatures even more. Winters will likely be wetter and summers drier. As shown in Figure 19, these changes, coupled with higher temperatures, will likely mean higher river fl ows in the spring, when water is already abundant, and lower fl ows in the summer, when surface water is badly needed for drinking, irriga-tion, hydropower and salmon.
Th e region’s landscapes are at risk. Forests, a cornerstone of the economy and environment, are particularly vulnerable. Drought, fi re, pests and disease are likely to increase. Oregon’s beaches are threatened by rising sea levels, stronger storms and increased coastal fl ooding and erosion.
3 University of Washington Climate Impacts Group, http://cses.washington.edu/cig/pnwc/cc.shtml.
4 Jackson, K. M. and A. G. Fountain. “Spatial and morphological change on Eliot Glacier, Mount Hood, Oregon , USA.” Annals of Glaciology, 46, 222-226.

FIGURE 20PACIFIC NORTHWEST RIVER FLOWS
30–50% less
water in summer
1000
cub
ic fe
et p
er se
cond
Oct
ober
Nov
embe
r
Dec
embe
r
Janu
ary
Febr
uary
Mar
ch
Apr
il
May
June
July
Aug
ust
Sept
embe
r
University of Washington Climate Impacts Group
62 CITY OF PORTLAND AND MULTNOMAH COUNTY
Climate change also poses a signifi cant challenge to public health. Rising tem-peratures may be accompanied by increased incidents of diseases such as cholera and weather-related mortalities. Rising temperatures are a specifi c concern for seniors, who are particularly vulnerable to heat stroke — especially in this region, where most homes do not have air conditioning. Additionally, mental health problems such as anxiety and post-traumatic stress syndrome may increase to the extent that people migrate from increasingly inhospitable climates to the temperate Northwest.
Th is summary is by no means an exhaustive survey of potential climate impacts. Additional information can be found at the following:
■ Intergovernmental Panel on Climate change (IPCC) — www.ipcc.ch ■ U.S. Climate Change Science Program — www.climatescience.gov ■ Oregon Climate Change Research Institute —
oregonstate.edu/groups/geco/pages/OCCRI.html ■ University of Oregon Climate Leadership Initiative — climlead.uoregon.edu ■ State of Oregon Climate Change Portal —
www.oregon.gov/ENERGY/GBLWRM/Portal.shtml ■ University of Washington Climate Impacts Group — cses.washington.edu/cig

ASSUMPTIONS IN CALCULATING EXPECTED EMISSIONS
APPENDIX 2
63APPENDIX 2: ASSUMPTIONS IN CALCULATING EXPECTED EMISSIONS
T he objectives in this plan that can be measured quantitatively rely on a set of assumptions about population growth, technological improvements and actions by governments other than the City of Portland and Multnomah
County. To the extent actual population growth, technology advances or state and federal policies diff er from the assumptions underlying this analysis, Portland and Multnomah County may need to pursue objectives that are more or less aggressive than those contained in this plan.
Th e interplay of assumptions can be complex. For example, the State of Oregon has adopted a strong renewable energy standard (RES) for electricity, requiring that 25 percent of all electricity sold in Oregon after 2025 be generated by new renew-able resources. However, the RES alone will not result in a 25 percent reduction in carbon emissions because Multnomah County’s population is projected to grow by 30 percent from current numbers by 2025. As a result, if each person consumes the same amount of electricity in 2025 as he or she does today, Multnomah County will consume 30 percent more electricity. Total carbon emissions from electricity will therefore remain virtually unchanged from current levels. Th us the RES, by itself, will help slow growth in electricity emissions but will not achieve the needed emissions reductions.
Similar analyses of policies addressing building energy use and transportation fuels make clear that an 80 percent emissions reduction will not result merely from the currently anticipated technology advances and federal and state regulations.
Th e City of Portland and Multnomah County must therefore act — building on and exceeding national, regional or state eff orts — to achieve the 2050 goal. In planning for local climate protection, however, this plan assumes that certain actions will take place at the national, regional and state levels, and that these actions will help Portland and Multnomah County achieve the 2050 goal. Th ese assumptions focus on the categories of Land Use and Mobility and Buildings and Energy.

64 CITY OF PORTLAND AND MULTNOMAH COUNTY
Key assumptions related to Urban Form and Mobility:
■ Automakers will meet the federal requirement that the corporate average fuel effi ciency (CAFE) achieve 35 miles per gallon by 2016.
■ Th e federal government will raise CAFE standards to 55 miles per gallon before 2050.
■ As a result of the commercial availability of advanced, low-carbon fuels, by 2030 transportation fuels will generate 10 percent fewer lifecycle carbon emissions than today’s fuels. By 2050, they will generate 25 percent fewer emissions.
■ Electric vehicles will account for 10 percent of all miles driven by 2030 and 25 percent of all miles driven by 2050.
Key assumptions related to Buildings and Energy include: ■ Electric utilities will meet Oregon’s requirement to acquire 25 percent of their
electricity from new renewable sources by 2025. ■ By 2050, technological advances will reduce the amount of electricity lost
during transmission by one-fourth. ■ Coal-fi red power plants serving the Pacifi c Northwest do not employ carbon
capture and sequestration technologies.
Finally, assumptions about population growth do not account for the possibility of “climate refugees.” A climate refugee is a person displaced from his or her home as a result of an environmental event that has been brought on by climate change. Although some believe that many climate refugees will settle in the relatively water-rich and temperate climate of Pacifi c Northwest, it is diffi cult to estimate the extent to which this will change population growth in Multnomah County.
Quantifying Carbon Reductions The 2030 Objectives related to Buildings and Energy and Urban Form and Mobility were developed by quantitatively modeling the interactive effects of each objective. This analysis highlights the importance of pursuing a broad portfolio of actions and objectives. Examining the fi rst objective, retrofi tting existing buildings to reduce their energy consumption, illustrates these interactive effects. Carbon emissions from building energy use are a function of two factors: how much energy the building uses and the quantity of emissions generated per unit of energy consumed.
The fi rst factor, energy use, is diffi cult to estimate because building improvements are only one component of energy use; the behavior of the building occupants also is a signifi cant determinant. The second factor, emissions intensity of energy generation, depends critically on the extent to which the increase in energy generation from renewable sources displaces high-carbon coal, medium-carbon natural gas, or carbon-free hydropower or nuclear. Thus, as a result of variables such as occupant behavior and unpredictable shifts in the carbon-intensity of the electricity grid, it is diffi cult to isolate and attribute a specifi c amount of reductions to a particular action such as retrofi tting buildings for effi ciency. Reductions that can be achieved by the other objectives in this plan require similar sets of assumptions, because they involve multiple variables fl uctuating independently from one another and from the plan objectives.

65APPENDIX 3: EMISSIONS INVENTORY METHODOLOGY
EMISSIONS INVENTORY METHODOLOGY
P ortland and Multnomah County gather data on carbon emissions to inform policy and programmatic decisions and to monitor overall progress toward emission goals. In general, the methodology follows guidelines developed
by ICLEI — Local Governments for Sustainability and uses the Clean Air and Climate Protection software developed jointly by ICLEI and STAPPA/ALAPCO. Th e inventory presented here is not intended to account for or assert ownership of emissions or emissions reductions, but rather to serve as an aggregate indicator of emissions trends. As best practices for community emissions inventories evolve, Portland and Multnomah County expect to participate in these discussions and strive to apply the most credible methodology possible given the available data.
WHAT’S INTh e Multnomah County inventory includes emissions associated with:
■ Electricity ■ Natural gas ■ Fuel oil (distillate and residual) ■ Propane ■ Gasoline ■ Diesel ■ Solid waste disposal
Th ese sources are discussed in further detail below.
WHAT’S OUTSignifi cant categories of emissions not included in the inventory are:
■ Industrial processes other than energy use. Examples of this type of emis-sion include perfl uorocarbons emitted from aluminum smelting and during the semiconductor manufacturing process. Currently, available information does not permit accurate measurement of emissions from industrial processes,
APPENDIX 3
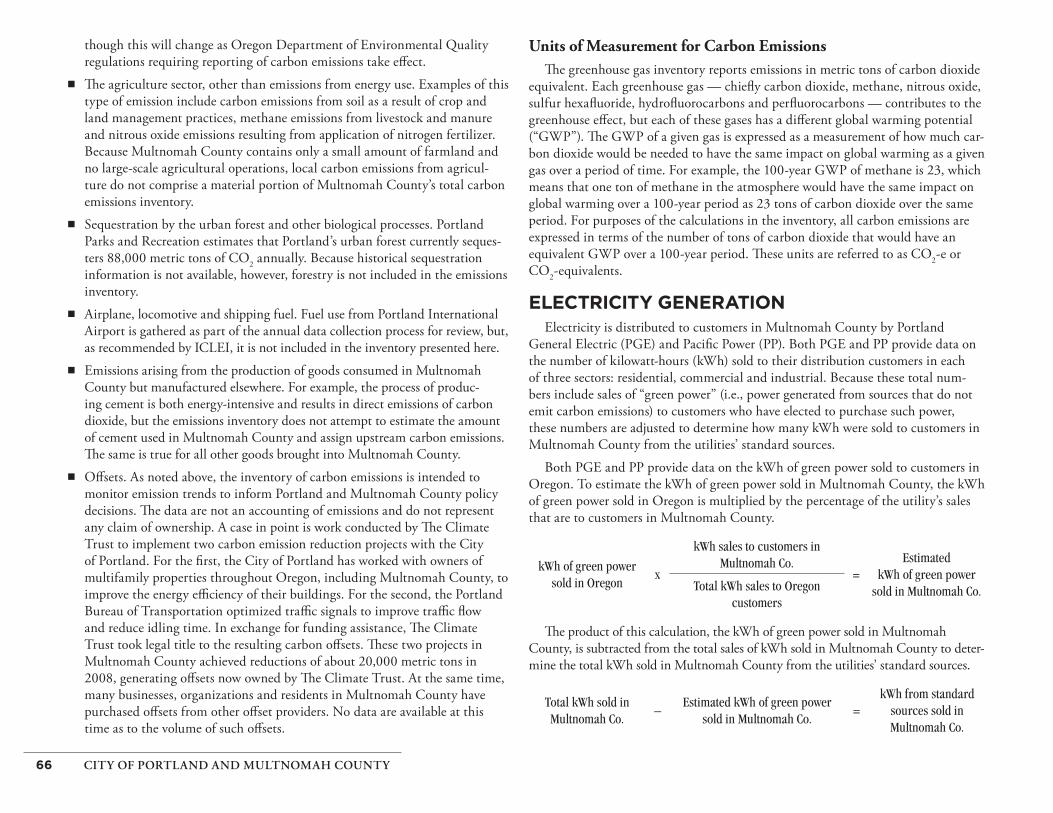
66 CITY OF PORTLAND AND MULTNOMAH COUNTY
though this will change as Oregon Department of Environmental Quality regulations requiring reporting of carbon emissions take eff ect.
■ Th e agriculture sector, other than emissions from energy use. Examples of this type of emission include carbon emissions from soil as a result of crop and land management practices, methane emissions from livestock and manure and nitrous oxide emissions resulting from application of nitrogen fertilizer. Because Multnomah County contains only a small amount of farmland and no large-scale agricultural operations, local carbon emissions from agricul-ture do not comprise a material portion of Multnomah County’s total carbon emissions inventory.
■ Sequestration by the urban forest and other biological processes. Portland Parks and Recreation estimates that Portland’s urban forest currently seques-ters 88,000 metric tons of CO2 annually. Because historical sequestration information is not available, however, forestry is not included in the emissions inventory.
■ Airplane, locomotive and shipping fuel. Fuel use from Portland International Airport is gathered as part of the annual data collection process for review, but, as recommended by ICLEI, it is not included in the inventory presented here.
■ Emissions arising from the production of goods consumed in Multnomah County but manufactured elsewhere. For example, the process of produc-ing cement is both energy-intensive and results in direct emissions of carbon dioxide, but the emissions inventory does not attempt to estimate the amount of cement used in Multnomah County and assign upstream carbon emissions. Th e same is true for all other goods brought into Multnomah County.
■ Off sets. As noted above, the inventory of carbon emissions is intended to monitor emission trends to inform Portland and Multnomah County policy decisions. Th e data are not an accounting of emissions and do not represent any claim of ownership. A case in point is work conducted by Th e Climate Trust to implement two carbon emission reduction projects with the City of Portland. For the fi rst, the City of Portland has worked with owners of multifamily properties throughout Oregon, including Multnomah County, to improve the energy effi ciency of their buildings. For the second, the Portland Bureau of Transportation optimized traffi c signals to improve traffi c fl ow and reduce idling time. In exchange for funding assistance, Th e Climate Trust took legal title to the resulting carbon off sets. Th ese two projects in Multnomah County achieved reductions of about 20,000 metric tons in 2008, generating off sets now owned by Th e Climate Trust. At the same time, many businesses, organizations and residents in Multnomah County have purchased off sets from other off set providers. No data are available at this time as to the volume of such off sets.
Units of Measurement for Carbon EmissionsTh e greenhouse gas inventory reports emissions in metric tons of carbon dioxide
equivalent. Each greenhouse gas — chiefl y carbon dioxide, methane, nitrous oxide, sulfur hexafl uoride, hydrofl uorocarbons and perfl uorocarbons — contributes to the greenhouse eff ect, but each of these gases has a diff erent global warming potential (“GWP”). Th e GWP of a given gas is expressed as a measurement of how much car-bon dioxide would be needed to have the same impact on global warming as a given gas over a period of time. For example, the 100-year GWP of methane is 23, which means that one ton of methane in the atmosphere would have the same impact on global warming over a 100-year period as 23 tons of carbon dioxide over the same period. For purposes of the calculations in the inventory, all carbon emissions are expressed in terms of the number of tons of carbon dioxide that would have an equivalent GWP over a 100-year period. Th ese units are referred to as CO2-e or CO2-equivalents.
ELECTRICITY GENERATIONElectricity is distributed to customers in Multnomah County by Portland
General Electric (PGE) and Pacifi c Power (PP). Both PGE and PP provide data on the number of kilowatt-hours (kWh) sold to their distribution customers in each of three sectors: residential, commercial and industrial. Because these total num-bers include sales of “green power” (i.e., power generated from sources that do not emit carbon emissions) to customers who have elected to purchase such power, these numbers are adjusted to determine how many kWh were sold to customers in Multnomah County from the utilities’ standard sources.
Both PGE and PP provide data on the kWh of green power sold to customers in Oregon. To estimate the kWh of green power sold in Multnomah County, the kWh of green power sold in Oregon is multiplied by the percentage of the utility’s sales that are to customers in Multnomah County.
kWh of green power sold in Oregon
x
kWh sales to customers in Multnomah Co.
=Estimated
kWh of green power sold in Multnomah Co.Total kWh sales to Oregon
customers
Th e product of this calculation, the kWh of green power sold in Multnomah County, is subtracted from the total sales of kWh sold in Multnomah County to deter-mine the total kWh sold in Multnomah County from the utilities’ standard sources.
Total kWh sold in Multnomah Co.
–Estimated kWh of green power
sold in Multnomah Co.=
kWh from standard sources sold in Multnomah Co.

To calculate the carbon emissions from grid power (i.e., everything except the green power purchased voluntarily by customers), the inventory uses emission factors provided by ICLEI for the Northwest Power Pool of the Western Electricity Coor-dinating Council.
Natural Gas
NW Natural, the sole natural gas utility for Multnomah County, provides data on the total therms used in the county by the residential, commercial and industrial sectors. Th e carbon emissions attributable to natural gas usage are calculated by multiplying the total number of therms by the conversion factor provided by ICLEI for converting therms to CO2-e. In 2008 NW Natural began off ering customers the ability to obtain carbon-neutral natural gas through the purchase of off sets, eventually in connection with the use of digesters to capture methane from decom-posing cow manure. In the future, the data on total therms will be adjusted to take into account the carbon-neutral nature of some sales, as is done with electricity generation.
Fuel Oil, Propane and Kerosene
Fuel oil data are taken from the U.S. Energy Information Administration’s “Annual Fuel Oil and Kerosene Sales Report” contained in the Petroleum Supply Annual (EIA Report), which publishes data on the sales in Oregon of heating oil, propane and kerosene. Figures are broken down in the three residential, commercial and industrial customer classes. In the absence of more specifi c information about usage in Multnomah County, the inventory assigns the county a share based on the percent of Oregon’s population living in Multnomah County.
Gallons of oil sold to customers in Oregon
xPopulation of Multnomah Co.
=Estimated gallons of oil sold to customers
in Multnomah Co.Population of Oregon
ICLEI provides conversion factors for carbon emissions associated with each of these heating fuels. Th e carbon emissions from these fuels attributable to Multnomah County are calculated by multiplying the total amount of each fuel by the applicable conversion factor.
RESIDENTIAL AND COMMERCIAL BUILDING ENERGY CONSUMPTION
Total Electricity (kWh)
Green Electricity
(% of Total)Natural Gas (Therms)
Total Energy* (MMBTU)
RESIDENTIAL
1990 2,648,501,220 0.0% 70,186,733 18,338,1581995 2,656,288,808 0.0% 80,271,983 19,054,7072000 2,787,706,505 0.0% 100,653,199 21,402,0342001 2,706,881,610 0.1% 100,301,898 21,171,8032002 2,667,299,058 0.9% 100,208,767 20,968,8662003 2,654,243,780 2.5% 95,373,320 20,392,0892004 2,706,910,320 3.5% 95,772,992 20,030,1762005 2,700,637,203 4.6% 95,492,494 20,095,6442006 2,805,336,350 5.6% 99,318,246 20,713,7732007 2,836,542,171 8.1% 103,687,027 21,112,7962008 2,886,406,428 9.5% 108,402,645 21,770,650
COMMERCIAL
1990 2,968,831,041 0.0% 70,781,264 19,091,6051995 3,398,180,636 0.0% 74,707,710 20,553,5202000 3,834,588,942 0.0% 80,756,988 22,526,6162001 3,748,552,802 0.0% 79,310,694 22,352,3962002 3,644,283,201 0.2% 76,871,980 21,549,6022003 3,684,594,873 0.4% 72,230,103 20,615,6702004 3,768,353,073 0.6% 74,621,018 21,130,4922005 3,766,481,231 0.8% 74,824,308 21,116,5982006 3,872,932,825 1.0% 79,275,728 21,826,7542007 3,902,256,393 1.6% 82,156,842 22,168,7972008 3,880,015,005 1.8% 84,383,842 22,320,222
INDUSTRIAL
1990 2,001,811,581 87,315,289 17,549,0321995 2,396,895,913 99,871,589 19,980,7512000 2,735,383,151 91,260,620 20,301,5732001 2,571,484,196 82,047,847 18,752,2432002 2,214,752,762 78,007,041 17,142,9712003 2,035,540,602 77,590,865 15,794,6902004 1,917,708,393 82,116,292 16,040,2332005 1,915,076,497 81,965,777 15,621,1162006 1,953,864,313 85,624,278 16,353,6572007 1,895,563,159 82,986,391 15,755,3642008 1,866,384,990 79,982,277 15,328,720
*Total Energy (electricity, fuel oil, natural gas, propane)
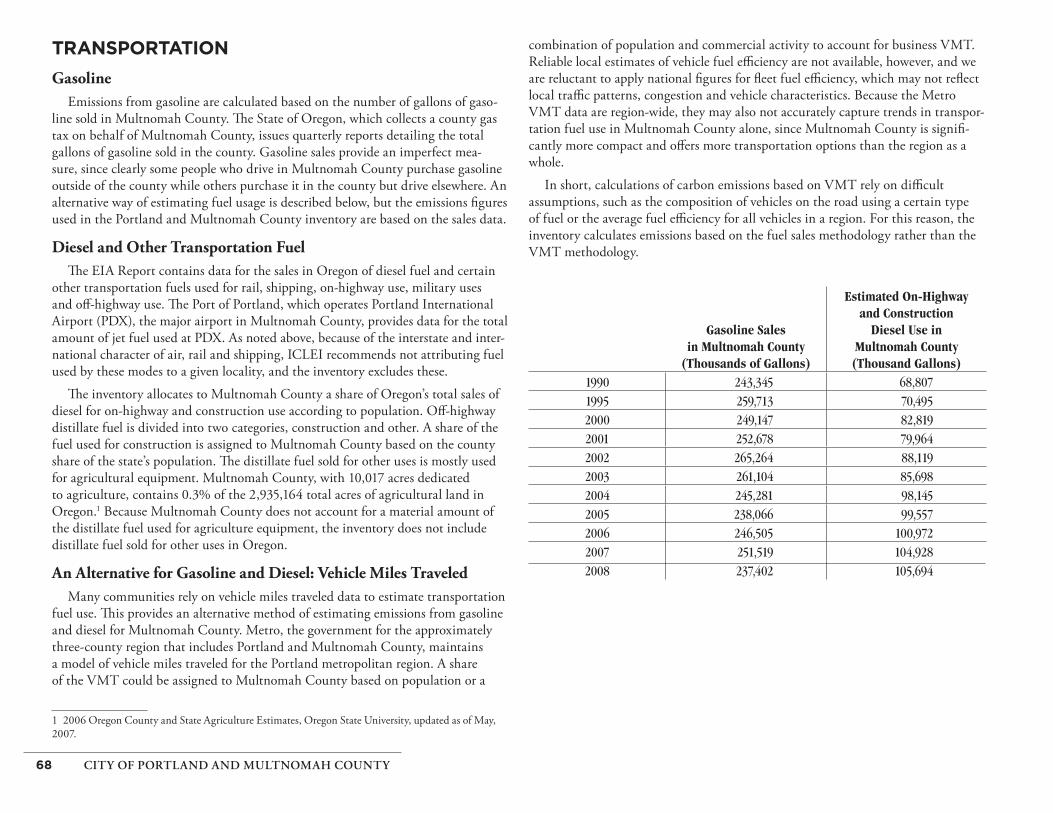
68 CITY OF PORTLAND AND MULTNOMAH COUNTY
TRANSPORTATION
Gasoline
Emissions from gasoline are calculated based on the number of gallons of gaso-line sold in Multnomah County. Th e State of Oregon, which collects a county gas tax on behalf of Multnomah County, issues quarterly reports detailing the total gallons of gasoline sold in the county. Gasoline sales provide an imperfect mea-sure, since clearly some people who drive in Multnomah County purchase gasoline outside of the county while others purchase it in the county but drive elsewhere. An alternative way of estimating fuel usage is described below, but the emissions fi gures used in the Portland and Multnomah County inventory are based on the sales data.
Diesel and Other Transportation Fuel
Th e EIA Report contains data for the sales in Oregon of diesel fuel and certain other transportation fuels used for rail, shipping, on-highway use, military uses and off -highway use. Th e Port of Portland, which operates Portland International Airport (PDX), the major airport in Multnomah County, provides data for the total amount of jet fuel used at PDX. As noted above, because of the interstate and inter-national character of air, rail and shipping, ICLEI recommends not attributing fuel used by these modes to a given locality, and the inventory excludes these.
Th e inventory allocates to Multnomah County a share of Oregon’s total sales of diesel for on-highway and construction use according to population. Off -highway distillate fuel is divided into two categories, construction and other. A share of the fuel used for construction is assigned to Multnomah County based on the county share of the state’s population. Th e distillate fuel sold for other uses is mostly used for agricultural equipment. Multnomah County, with 10,017 acres dedicated to agriculture, contains 0.3% of the 2,935,164 total acres of agricultural land in Oregon.1 Because Multnomah County does not account for a material amount of the distillate fuel used for agriculture equipment, the inventory does not include distillate fuel sold for other uses in Oregon.
An Alternative for Gasoline and Diesel: Vehicle Miles Traveled
Many communities rely on vehicle miles traveled data to estimate transportation fuel use. Th is provides an alternative method of estimating emissions from gasoline and diesel for Multnomah County. Metro, the government for the approximately three-county region that includes Portland and Multnomah County, maintains a model of vehicle miles traveled for the Portland metropolitan region. A share of the VMT could be assigned to Multnomah County based on population or a
1 2006 Oregon County and State Agriculture Estimates, Oregon State University, updated as of May, 2007.
combination of population and commercial activity to account for business VMT. Reliable local estimates of vehicle fuel effi ciency are not available, however, and we are reluctant to apply national fi gures for fl eet fuel effi ciency, which may not refl ect local traffi c patterns, congestion and vehicle characteristics. Because the Metro VMT data are region-wide, they may also not accurately capture trends in transpor-tation fuel use in Multnomah County alone, since Multnomah County is signifi -cantly more compact and off ers more transportation options than the region as a whole.
In short, calculations of carbon emissions based on VMT rely on diffi cult assumptions, such as the composition of vehicles on the road using a certain type of fuel or the average fuel effi ciency for all vehicles in a region. For this reason, the inventory calculates emissions based on the fuel sales methodology rather than the VMT methodology.
Gasoline Sales in Multnomah County
(Thousands of Gallons)
Estimated On-Highwayand Construction
Diesel Use inMultnomah County (Thousand Gallons)
1990 243,345 68,8071995 259,713 70,4952000 249,147 82,8192001 252,678 79,9642002 265,264 88,1192003 261,104 85,6982004 245,281 98,1452005 238,066 99,5572006 246,505 100,9722007 251,519 104,9282008 237,402 105,694
Source: Oregon Department of Revenue (gasoline); U.S. Energy Information Administration (diesel)

69APPENDIX 3: EMISSIONS INVENTORY METHODOLOGY
SOLID WASTE DISPOSALMetro operates the solid waste transfer stations serving Multnomah County and
provides data on the total tonnage of materials landfi lled each year from the Metro region. Th e inventory assigns a share of the total tonnage to Multnomah County based on the percent of Metro population that is in Multnomah County. Th e Oregon Department of Environmental Quality (DEQ) conducts studies to deter-mine the composition of waste in Oregon landfi lls. Th us, it is possible to estimate the composition of waste buried in landfi lls that are attributable to Multnomah County.
Total tonnage sent to Metro landfi lls
xPopulation of Multnomah Co.
=Total landfi ll tonnage
Attributable to Multnomah Co.Population of Metro
Total landfi ll tonnage attributable to Multnomah Co.
x% of waste in Oregon landfi lls
that is attributable to a certain type of material
=
Tonnage of certain material in landfi lls
attributable to Multnomah Co.
As materials in landfi lls decompose, they produce methane. Some landfi lls capture methane gas and fl are it, converting it to carbon dioxide and water vapor. For each landfi ll that receives waste from Metro, DEQ provides an estimate of the percentage of methane captured. Using ICLEI’s Clean Air and Climate Protection software, and based on the Metro tonnage data, DEQ waste composition studies and estimates of methane recapture rates, the inventory estimates the total amount of methane generated at landfi lls that is released into the atmosphere.
Methane emissions from landfi lls, as tracked in this inventory, diff er from the carbon emissions from energy consumption in a signifi cant respect. All emis-sions from energy use occur at the same time as the energy is consumed. Methane emissions from landfi lled solid waste, on the other hand, can occur over a period of many years because conditions (e.g., heat, presence of oxygen, moisture, etc.) among landfi lls diff er, as do the conditions in diff erent parts of a single landfi ll, and because diff erent materials decompose, and thus emit methane, at diff erent rates. As a result, the methane emissions from a landfi ll in a given year result from waste disposed at that landfi ll over a number of prior years. Similarly, landfi ll emissions refl ected in the inventory for a given year will not occur over that year but instead will take place over the course of the subsequent years. Landfi ll emissions included in the inventory refl ect the cumulative future methane emissions that can be expected from waste disposed in a given year. Th ey are not intended to represent the amount of actual methane emissions from landfi lls in that year.

ACTIONCLIMATE
PLAN2009
CITY OF PORTLAND AND MULTNOMAH COUNTYWWW.PORTLANDONLINE.COM/BPS/CLIMATE
Printed on 100% post-consumer recycled paper.