2009 12 18 sag workbook v2 2 example
DESCRIPTION
w-2.2TRANSCRIPT
CARE+ Energy Efficiency Self Audit Guide IEE/07/827
document.xls; COVER Page 1 of 43
CARE+ "Training Chemical SMEs in Responsible Use of Energy"
ENERGY EFFICIENCY SELF AUDIT GUIDE FOR CHEMICAL SMEs
Version 2.2 WORKED EXAMPLEDate 12/18/2009 12/18/2009
Contact Simon Minett, Challoch Energy, [email protected] +32 2 688 32 32
Project Leader Andrea Weigel, [email protected] +32 2 676 73 67
Developed under Contract No. IEE/07/827/SI.499212Project part-funded by the European Agency for Competitiveness and InnovationWebsite to download the excel file and further information
WORKBOOK FOR QUALITATIVE AND QUANTITATIVE ASSESSMENT OF YOUR ENERGY PERFORMANCE
www.cefic.be/careplus
The sole responsibility for the content of this publication lies with the authors. It does not necessarily reflect the opinion of the European Communities. The European Commission is not responsible for any use that may be made of the information contained therein.
CARE+ Energy Efficiency Self Audit Guide IEE/07/827
document.xls; INTRODUCTION Page 2 of 43
CARE+ ENERGY EFFICIENCY SELF AUDIT GUIDE FOR CHEMICAL SMEs
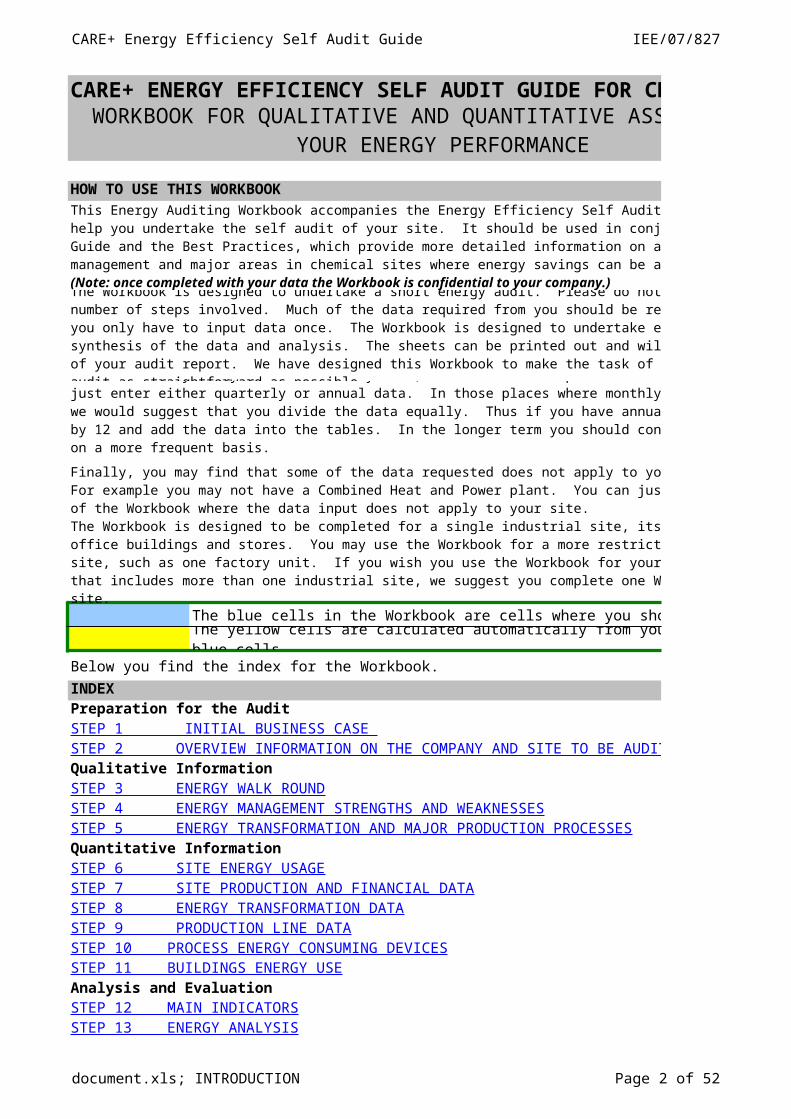
HOW TO USE THIS WORKBOOK
The blue cells in the Workbook are cells where you should add data.
The yellow cells are calculated automatically from your inputs into the blue cells.
Below you find the index for the Workbook.
INDEXPreparation for the Audit
Qualitative Information
Quantitative Information
Analysis and Evaluation
WORKBOOK FOR QUALITATIVE AND QUANTITATIVE ASSESSMENT OF YOUR ENERGY PERFORMANCE
This Energy Auditing Workbook accompanies the Energy Efficiency Self Audit Guide. It will help you undertake the self audit of your site. It should be used in conjunction with the Guide and the Best Practices, which provide more detailed information on auditing, energy management and major areas in chemical sites where energy savings can be achieved. (Note: once completed with your data the Workbook is confidential to your company.)
The Workbook is designed to undertake a short energy audit. Please do not be put off by the number of steps involved. Much of the data required from you should be readily available and you only have to input data once. The Workbook is designed to undertake energy conversions, synthesis of the data and analysis. The sheets can be printed out and will form a large part of your audit report. We have designed this Workbook to make the task of undertaking the audit as straightforward as possible.
In some cases you may not have monthly data, or data for each process. Do not worry, you can just enter either quarterly or annual data. In those places where monthly data is requested, we would suggest that you divide the data equally. Thus if you have annual data, divide it by 12 and add the data into the tables. In the longer term you should consider collect data on a more frequent basis.
Finally, you may find that some of the data requested does not apply to your circumstances. For example you may not have a Combined Heat and Power plant. You can just ignore that part of the Workbook where the data input does not apply to your site.
The Workbook is designed to be completed for a single industrial site, its process areas, office buildings and stores. You may use the Workbook for a more restricted part of the site, such as one factory unit. If you wish you use the Workbook for your whole business that includes more than one industrial site, we suggest you complete one Workbook for each site.
STEP 1 INITIAL BUSINESS CASE STEP 2 OVERVIEW INFORMATION ON THE COMPANY AND SITE TO BE AUDITED
STEP 3 ENERGY WALK ROUNDSTEP 4 ENERGY MANAGEMENT STRENGTHS AND WEAKNESSESSTEP 5 ENERGY TRANSFORMATION AND MAJOR PRODUCTION PROCESSES
STEP 6 SITE ENERGY USAGESTEP 7 SITE PRODUCTION AND FINANCIAL DATASTEP 8 ENERGY TRANSFORMATION DATASTEP 9 PRODUCTION LINE DATASTEP 10 PROCESS ENERGY CONSUMING DEVICESSTEP 11 BUILDINGS ENERGY USE
STEP 12 MAIN INDICATORSSTEP 13 ENERGY ANALYSIS
CARE+ Energy Efficiency Self Audit Guide IEE/07/827
document.xls; INTRODUCTION Page 3 of 43
STEP 14 ENERGY SAVINGS OPTIONSSTEP 15 RECOMMENDATIONS FOR IMPLEMENTATION
CARE+ Energy Efficiency Self Audit Guide IEE/07/827
document.xls; STEP 1 Page 4 of 43
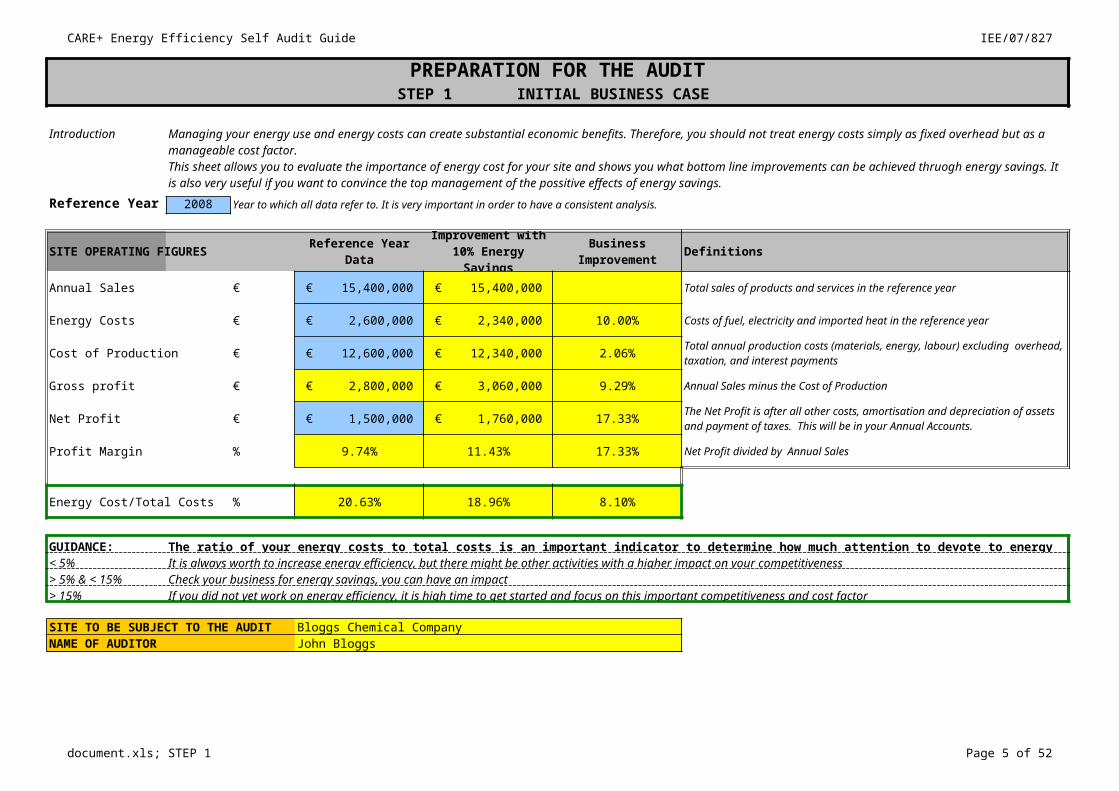
PREPARATION FOR THE AUDITSTEP 1 INITIAL BUSINESS CASE
Introduction
Reference Year 2008 Year to which all data refer to. It is very important in order to have a consistent analysis.
SITE OPERATING FIGURES Reference Year Data Definitions
Annual Sales € € 15,400,000 € 15,400,000 Total sales of products and services in the reference year
Energy Costs € € 2,600,000 € 2,340,000 10.00% Costs of fuel, electricity and imported heat in the reference year
Cost of Production € € 12,600,000 € 12,340,000 2.06%
Gross profit € € 2,800,000 € 3,060,000 9.29% Annual Sales minus the Cost of Production
Net Profit € € 1,500,000 € 1,760,000 17.33%
Profit Margin % 9.74% 11.43% 17.33% Net Profit divided by Annual Sales
Energy Cost/Total Costs % 20.63% 18.96% 8.10%
GUIDANCE: The ratio of your energy costs to total costs is an important indicator to determine how much attention to devote to energy efficiency< 5% It is always worth to increase energy efficiency, but there might be other activities with a higher impact on your competitiveness> 5% & < 15% Check your business for energy savings, you can have an impact > 15% If you did not yet work on energy efficiency, it is high time to get started and focus on this important competitiveness and cost factor
SITE TO BE SUBJECT TO THE AUDIT Bloggs Chemical CompanyNAME OF AUDITOR John Bloggs
Managing your energy use and energy costs can create substantial economic benefits. Therefore, you should not treat energy costs simply as fixed overhead but as a manageable cost factor.This sheet allows you to evaluate the importance of energy cost for your site and shows you what bottom line improvements can be achieved thruogh energy savings. It is also very useful if you want to convince the top management of the possitive effects of energy savings.
Improvement with 10% Energy Savings
Business Improvement
Total annual production costs (materials, energy, labour) excluding overhead, taxation, and interest payments
The Net Profit is after all other costs, amortisation and depreciation of assets and payment of taxes. This will be in your Annual Accounts.
CARE+ Energy Efficiency Self Audit Guide IEE/07/827
document.xls; STEP 2 Page 5 of 43
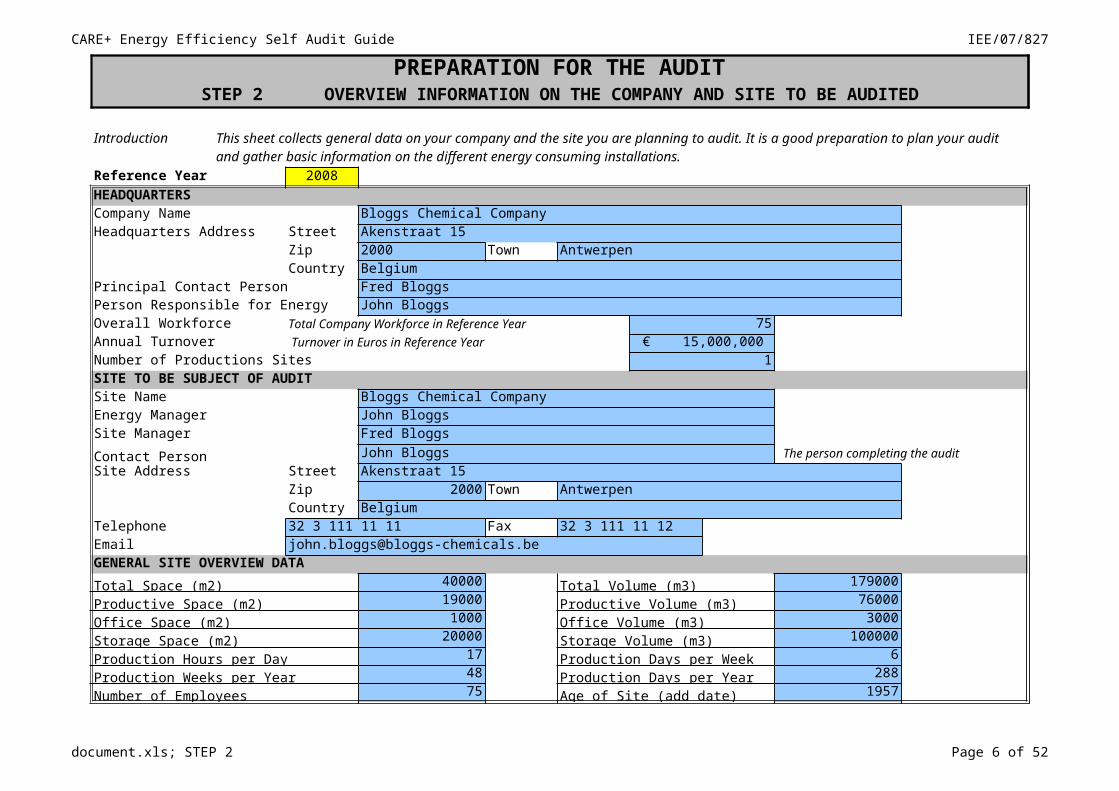
PREPARATION FOR THE AUDITSTEP 2 OVERVIEW INFORMATION ON THE COMPANY AND SITE TO BE AUDITED
Introduction
Reference Year 2008HEADQUARTERSCompany Name Bloggs Chemical CompanyHeadquarters Address Street Akenstraat 15
Zip 2000 Town AntwerpenCountry Belgium
Principal Contact Person Fred BloggsPerson Responsible for Energy John BloggsOverall Workforce Total Company Workforce in Reference Year 75Annual Turnover Turnover in Euros in Reference Year € 15,000,000 Number of Productions Sites 1SITE TO BE SUBJECT OF AUDITSite Name Bloggs Chemical CompanyEnergy Manager John BloggsSite Manager Fred BloggsContact Person John Bloggs The person completing the auditSite Address Street Akenstraat 15
Zip 2000 Town AntwerpenCountry Belgium
Telephone 32 3 111 11 11 Fax 32 3 111 11 12Email [email protected] SITE OVERVIEW DATATotal Space (m2) 40000 Total Volume (m3) 179000Productive Space (m2) 19000 Productive Volume (m3) 76000Office Space (m2) 1000 Office Volume (m3) 3000Storage Space (m2) 20000 Storage Volume (m3) 100000Production Hours per Day 17 Production Days per Week 6Production Weeks per Year 48 Production Days per Year 288Number of Employees 75 Age of Site (add date) 1957
This sheet collects general data on your company and the site you are planning to audit. It is a good preparation to plan your audit and gather basic information on the different energy consuming installations.
CARE+ Energy Efficiency Self Audit Guide IEE/07/827
document.xls; STEP 2 Page 6 of 43
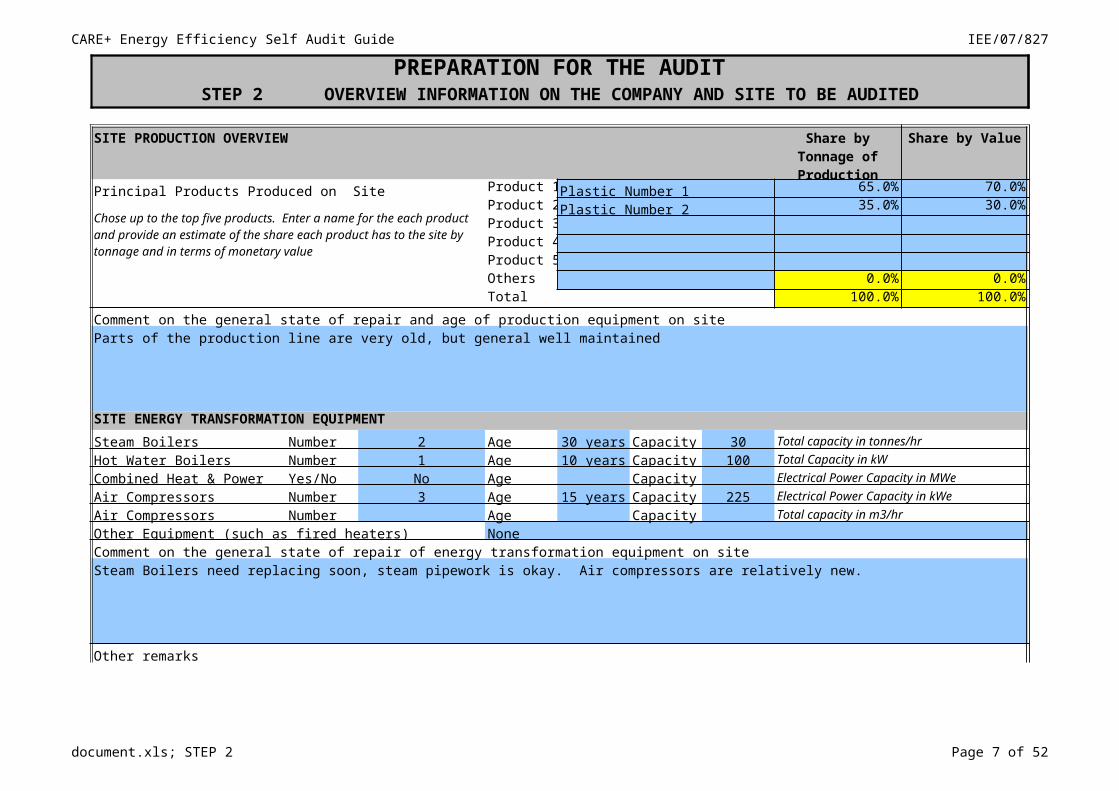
PREPARATION FOR THE AUDITSTEP 2 OVERVIEW INFORMATION ON THE COMPANY AND SITE TO BE AUDITED
SITE PRODUCTION OVERVIEW Share by Value
Principal Products Produced on Site Product 1 Plastic Number 1 65.0% 70.0%Product 2 Plastic Number 2 35.0% 30.0%Product 3Product 4Product 5Others 0.0% 0.0%Total 100.0% 100.0%
Comment on the general state of repair and age of production equipment on siteParts of the production line are very old, but general well maintained
SITE ENERGY TRANSFORMATION EQUIPMENTSteam Boilers Number 2 Age 30 years Capacity 30 Total capacity in tonnes/hr
Hot Water Boilers Number 1 Age 10 years Capacity 100 Total Capacity in kW
Combined Heat & Power Yes/No No Age Capacity Electrical Power Capacity in MWe
Air Compressors Number 3 Age 15 years Capacity 225 Electrical Power Capacity in kWe
Air Compressors Number Age Capacity Total capacity in m3/hr
Other Equipment (such as fired heaters) NoneComment on the general state of repair of energy transformation equipment on siteSteam Boilers need replacing soon, steam pipework is okay. Air compressors are relatively new.
Other remarks
Share by Tonnage of Production
Chose up to the top five products. Enter a name for the each product and provide an estimate of the share each product has to the site by tonnage and in terms of monetary value
CARE+ Energy Efficiency Self Audit Guide IEE/07/827
document.xls; STEP 2 Page 7 of 43
PREPARATION FOR THE AUDITSTEP 2 OVERVIEW INFORMATION ON THE COMPANY AND SITE TO BE AUDITED
Energy has not been a priority for this company to date and expect to see plenty of opportunities for savings.
CARE+ Energy Efficiency Self Audit Guide IEE/07/827
document.xls; STEP 3 Page 8 of 43
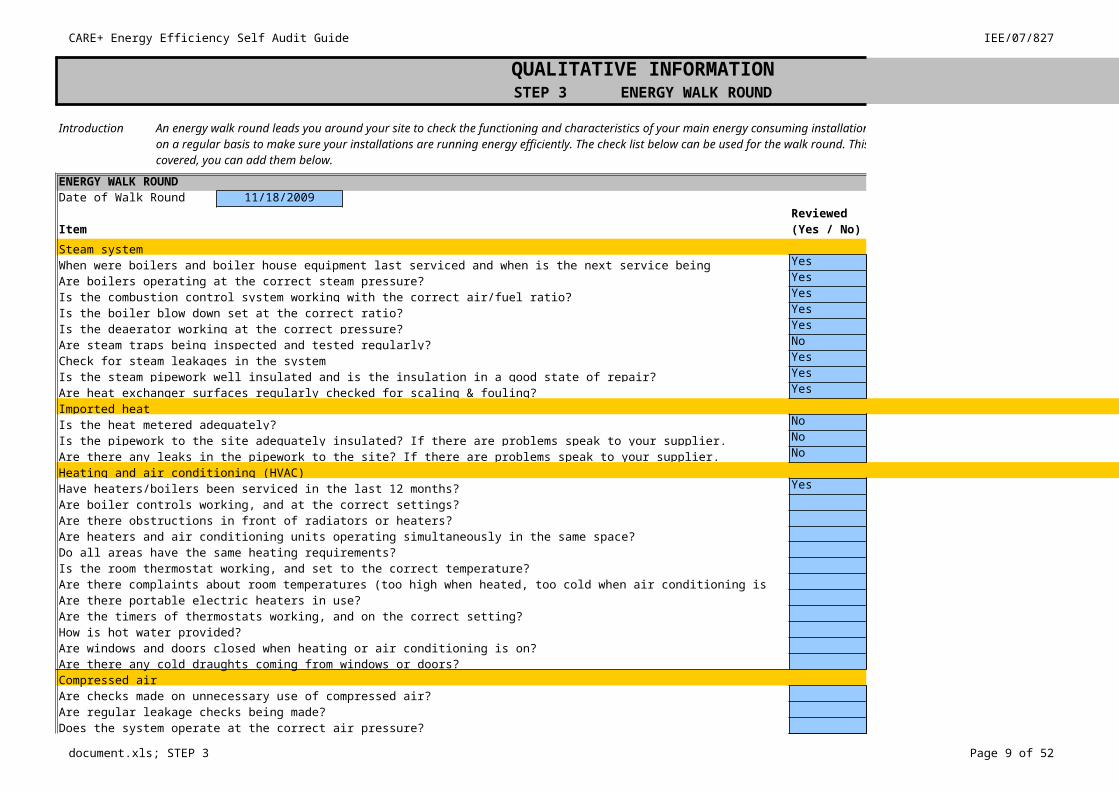
QUALITATIVE INFORMATIONSTEP 3 ENERGY WALK ROUND
Introduction
ENERGY WALK ROUNDDate of Walk Round 11/18/2009
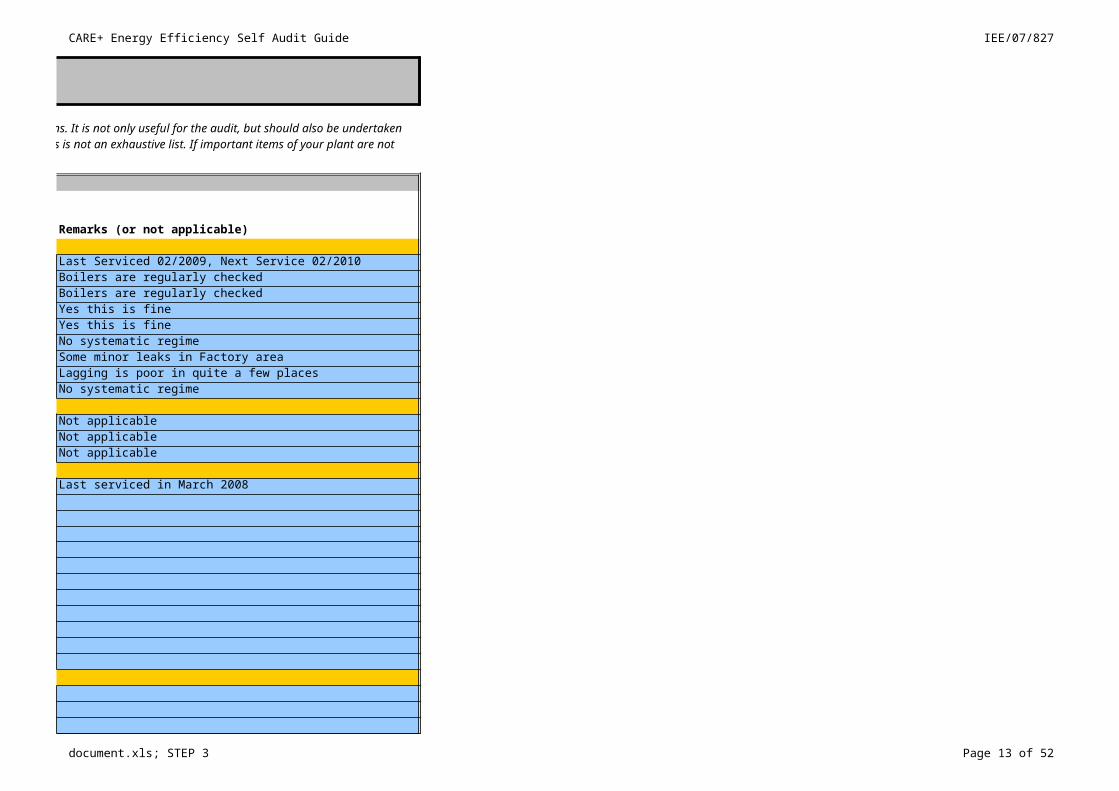
Item Remarks (or not applicable)Steam systemWhen were boilers and boiler house equipment last serviced and when is the next service being scheduled? Yes Last Serviced 02/2009, Next Service 02/2010Are boilers operating at the correct steam pressure? Yes Boilers are regularly checkedIs the combustion control system working with the correct air/fuel ratio? Yes Boilers are regularly checkedIs the boiler blow down set at the correct ratio? Yes Yes this is fineIs the deaerator working at the correct pressure? Yes Yes this is fineAre steam traps being inspected and tested regularly? No No systematic regimeCheck for steam leakages in the system Yes Some minor leaks in Factory areaIs the steam pipework well insulated and is the insulation in a good state of repair? Yes Lagging is poor in quite a few placesAre heat exchanger surfaces regularly checked for scaling & fouling? Yes No systematic regimeImported heatIs the heat metered adequately? No Not applicableIs the pipework to the site adequately insulated? If there are problems speak to your supplier. No Not applicableAre there any leaks in the pipework to the site? If there are problems speak to your supplier. No Not applicableHeating and air conditioning (HVAC)Have heaters/boilers been serviced in the last 12 months? Yes Last serviced in March 2008Are boiler controls working, and at the correct settings?Are there obstructions in front of radiators or heaters?Are heaters and air conditioning units operating simultaneously in the same space?Do all areas have the same heating requirements?Is the room thermostat working, and set to the correct temperature?Are there complaints about room temperatures (too high when heated, too cold when air conditioning is on)?Are there portable electric heaters in use?Are the timers of thermostats working, and on the correct setting?How is hot water provided?Are windows and doors closed when heating or air conditioning is on?Are there any cold draughts coming from windows or doors?Compressed airAre checks made on unnecessary use of compressed air?Are regular leakage checks being made?Does the system operate at the correct air pressure?
An energy walk round leads you around your site to check the functioning and characteristics of your main energy consuming installations. It is not only useful for the audit, but should also be undertaken on a regular basis to make sure your installations are running energy efficiently. The check list below can be used for the walk round. This is not an exhaustive list. If important items of your plant are not covered, you can add them below.
Reviewed (Yes / No)
CARE+ Energy Efficiency Self Audit Guide IEE/07/827
document.xls; STEP 3 Page 9 of 43
QUALITATIVE INFORMATIONSTEP 3 ENERGY WALK ROUND
Are air using equipment and tools serviced regularly?
CARE+ Energy Efficiency Self Audit Guide IEE/07/827
document.xls; STEP 3 Page 10 of 43
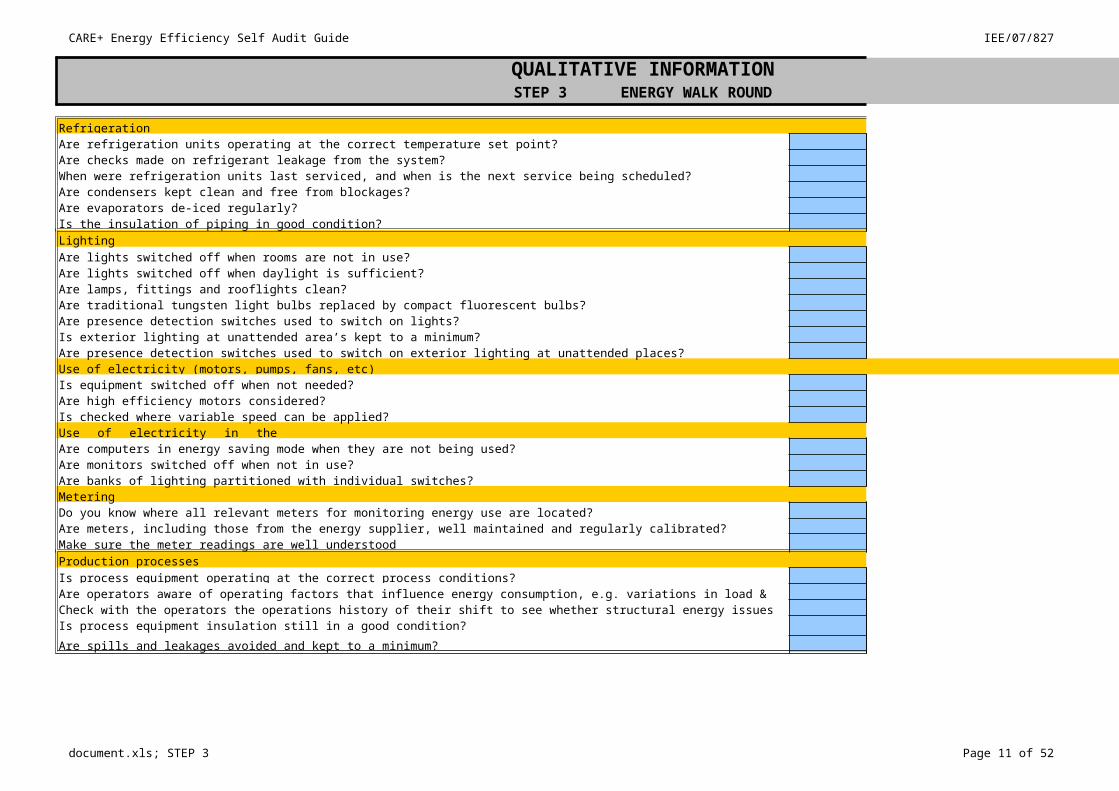
QUALITATIVE INFORMATIONSTEP 3 ENERGY WALK ROUND
RefrigerationAre refrigeration units operating at the correct temperature set point?Are checks made on refrigerant leakage from the system?When were refrigeration units last serviced, and when is the next service being scheduled?Are condensers kept clean and free from blockages?Are evaporators de-iced regularly?Is the insulation of piping in good condition?LightingAre lights switched off when rooms are not in use?Are lights switched off when daylight is sufficient?Are lamps, fittings and rooflights clean?Are traditional tungsten light bulbs replaced by compact fluorescent bulbs? Are presence detection switches used to switch on lights?Is exterior lighting at unattended area’s kept to a minimum?Are presence detection switches used to switch on exterior lighting at unattended places?Use of electricity (motors, pumps, fans, etc)Is equipment switched off when not needed?Are high efficiency motors considered?Is checked where variable speed can be applied?Use of electricity in the officeAre computers in energy saving mode when they are not being used?Are monitors switched off when not in use?Are banks of lighting partitioned with individual switches?MeteringDo you know where all relevant meters for monitoring energy use are located?Are meters, including those from the energy supplier, well maintained and regularly calibrated?Make sure the meter readings are well understoodProduction processesIs process equipment operating at the correct process conditions?Are operators aware of operating factors that influence energy consumption, e.g. variations in load & peak loads?Check with the operators the operations history of their shift to see whether structural energy issues are presentIs process equipment insulation still in a good condition?
Are spills and leakages avoided and kept to a minimum?
CARE+ Energy Efficiency Self Audit Guide IEE/07/827
document.xls; STEP 3 Page 11 of 43
QUALITATIVE INFORMATIONSTEP 3 ENERGY WALK ROUND
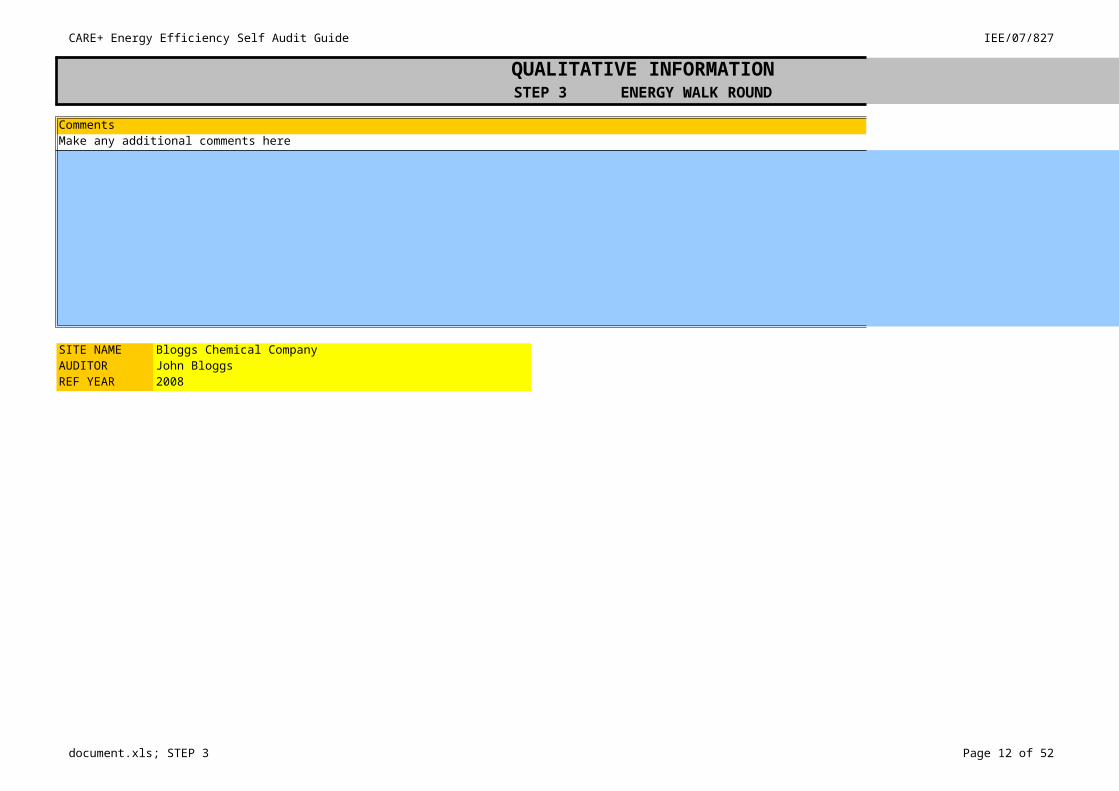
CommentsMake any additional comments here
SITE NAME Bloggs Chemical CompanyAUDITOR John BloggsREF YEAR 2008
CARE+ Energy Efficiency Self Audit Guide IEE/07/827
document.xls; STEP 4 Page 12 of 43
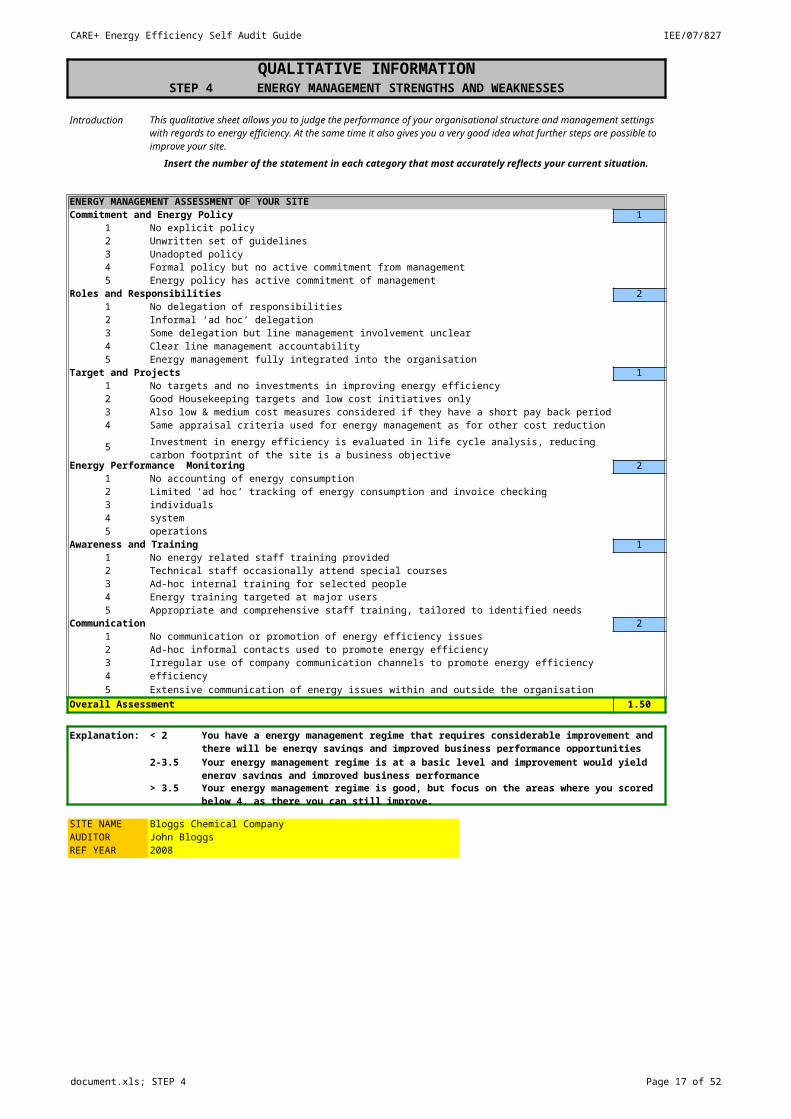
QUALITATIVE INFORMATIONSTEP 4 ENERGY MANAGEMENT STRENGTHS AND WEAKNESSES
Introduction
Insert the number of the statement in each category that most accurately reflects your current situation.
ENERGY MANAGEMENT ASSESSMENT OF YOUR SITECommitment and Energy Policy 1
1 No explicit policy2 Unwritten set of guidelines3 Unadopted policy4 Formal policy but no active commitment from management5 Energy policy has active commitment of management
Roles and Responsibilities 21 No delegation of responsibilities2 Informal ‘ad hoc’ delegation3 Some delegation but line management involvement unclear4 Clear line management accountability5 Energy management fully integrated into the organisation
Target and Projects 11 No targets and no investments in improving energy efficiency2 Good Housekeeping targets and low cost initiatives only3 Also low & medium cost measures considered if they have a short pay back period4 Same appraisal criteria used for energy management as for other cost reduction projects
5
Energy Performance Monitoring 21 No accounting of energy consumption2 Limited ‘ad hoc’ tracking of energy consumption and invoice checking3 Individual monthly monitoring with limited sub meters, costs reporting by individuals4 Monthly monitoring and accounting based on sub meters, no tie-in to company’s system5 Comprehensive Energy Performance Monitoring, fully integrated with the daily operations
Awareness and Training 11 No energy related staff training provided2 Technical staff occasionally attend special courses3 Ad-hoc internal training for selected people4 Energy training targeted at major users5 Appropriate and comprehensive staff training, tailored to identified needs
Communication 21 No communication or promotion of energy efficiency issues2 Ad-hoc informal contacts used to promote energy efficiency3 Irregular use of company communication channels to promote energy efficiency4 Regular staff briefing, energy performance reporting and promotion of energy efficiency5 Extensive communication of energy issues within and outside the organisation
Overall Assessment 1.50
Explanation: < 2
2-3.5
> 3.5
SITE NAME Bloggs Chemical CompanyAUDITOR John BloggsREF YEAR 2008
This qualitative sheet allows you to judge the performance of your organisational structure and management settings with regards to energy efficiency. At the same time it also gives you a very good idea what further steps are possible to improve your site.
Investment in energy efficiency is evaluated in life cycle analysis, reducing carbon footprint of the site is a business objective
You have a energy management regime that requires considerable improvement and there will be energy savings and improved business performance opportunities
Your energy management regime is at a basic level and improvement would yield energy savings and improved business performance
Your energy management regime is good, but focus on the areas where you scored below 4, as there you can still improve.
CARE+ Energy Efficiency Self Audit Guide IEE/07/827
document.xls; STEP 5 Page 13 of 43
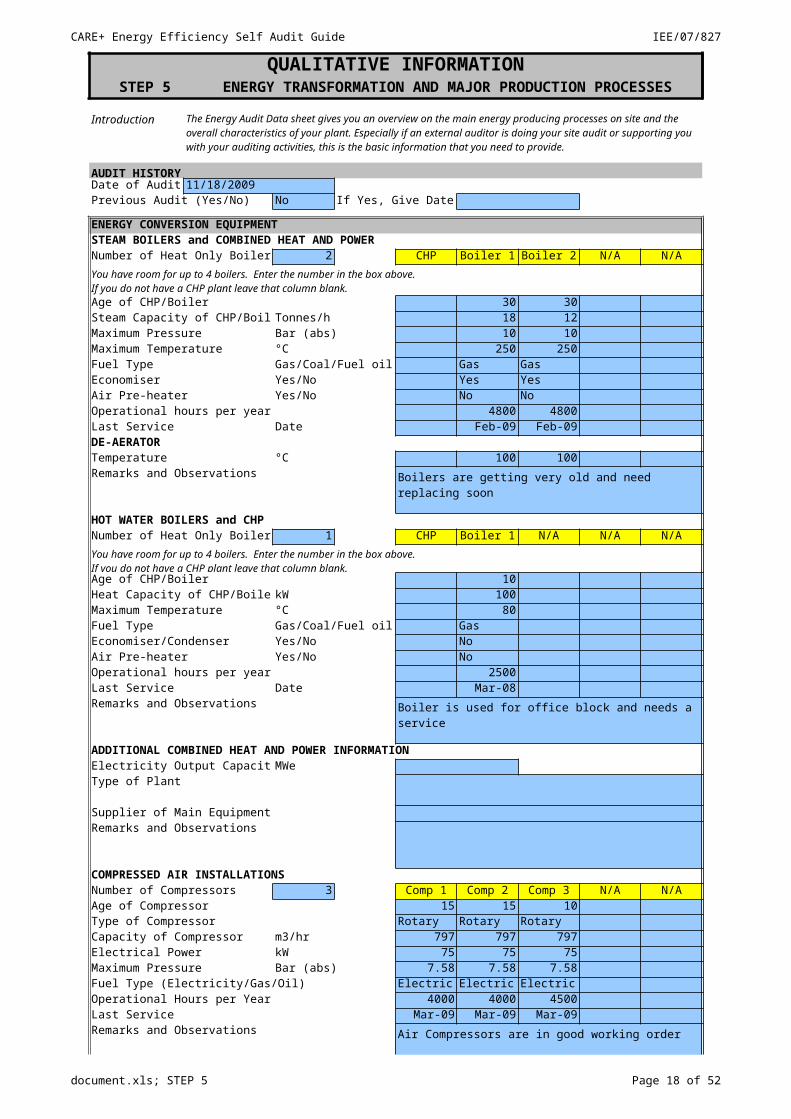
QUALITATIVE INFORMATIONSTEP 5 ENERGY TRANSFORMATION AND MAJOR PRODUCTION PROCESSES
Introduction
AUDIT HISTORYDate of Audit 11/18/2009Previous Audit (Yes/No) No If Yes, Give Date
ENERGY CONVERSION EQUIPMENTSTEAM BOILERS and COMBINED HEAT AND POWERNumber of Heat Only Boilers 2 CHP Boiler 1 Boiler 2 N/A N/A
Age of CHP/Boiler 30 30 ###Steam Capacity of CHP/Boiler Tonnes/h 18 12 ###Maximum Pressure Bar (abs) 10 10 ###Maximum Temperature °C 250 250 ###Fuel Type Gas/Coal/Fuel oil Gas GasEconomiser Yes/No Yes YesAir Pre-heater Yes/No No NoOperational hours per year 4800 4800Last Service Date Feb-09 Feb-09DE-AERATORTemperature °C 100 100Remarks and Observations Boilers are getting very old and need replacing soon
HOT WATER BOILERS and CHPNumber of Heat Only Boilers 1 CHP Boiler 1 N/A N/A N/A
Age of CHP/Boiler 10Heat Capacity of CHP/Boiler kW 100Maximum Temperature °C 80Fuel Type Gas/Coal/Fuel oil GasEconomiser/Condenser Yes/No NoAir Pre-heater Yes/No NoOperational hours per year 2500Last Service Date Mar-08Remarks and Observations Boiler is used for office block and needs a service
ADDITIONAL COMBINED HEAT AND POWER INFORMATIONElectricity Output Capacity MWeType of Plant
Supplier of Main EquipmentRemarks and Observations
COMPRESSED AIR INSTALLATIONSNumber of Compressors 3 Comp 1 Comp 2 Comp 3 N/A N/AAge of Compressor 15 15 10 ###Type of Compressor Rotary Rotary Rotary ###Capacity of Compressor m3/hr 797 797 797 ###Electrical Power kW 75 75 75 ###Maximum Pressure Bar (abs) 7.58 7.58 7.58Fuel Type (Electricity/Gas/Oil) Electric Electric ElectricOperational Hours per Year 4000 4000 4500Last Service Mar-09 Mar-09 Mar-09Remarks and Observations Air Compressors are in good working order
The Energy Audit Data sheet gives you an overview on the main energy producing processes on site and the overall characteristics of your plant. Especially if an external auditor is doing your site audit or supporting you with your auditing activities, this is the basic information that you need to provide.
You have room for up to 4 boilers. Enter the number in the box above.If you do not have a CHP plant leave that column blank.
You have room for up to 4 boilers. Enter the number in the box above.If you do not have a CHP plant leave that column blank.
CARE+ Energy Efficiency Self Audit Guide IEE/07/827
document.xls; STEP 5 Page 14 of 43
QUALITATIVE INFORMATIONSTEP 5 ENERGY TRANSFORMATION AND MAJOR PRODUCTION PROCESSESAir Compressors are in good working order
CARE+ Energy Efficiency Self Audit Guide IEE/07/827
document.xls; STEP 5 Page 15 of 43
QUALITATIVE INFORMATIONSTEP 5 ENERGY TRANSFORMATION AND MAJOR PRODUCTION PROCESSES
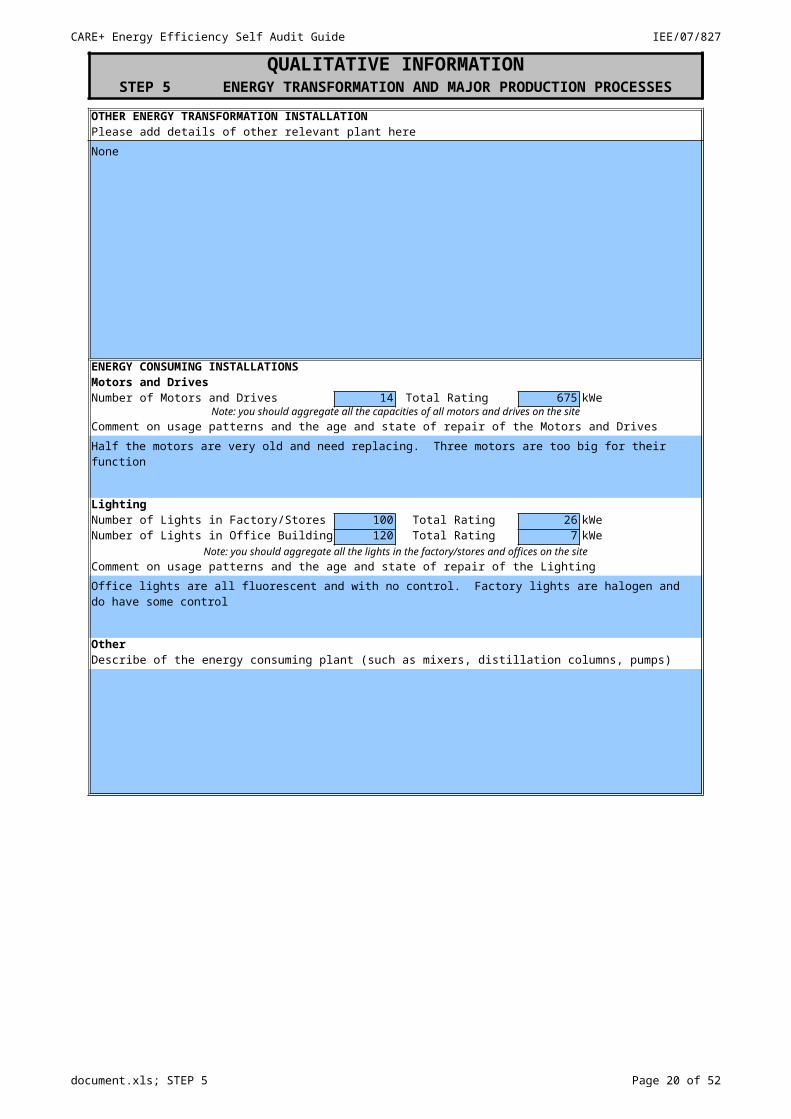
OTHER ENERGY TRANSFORMATION INSTALLATIONPlease add details of other relevant plant hereNone
ENERGY CONSUMING INSTALLATIONSMotors and DrivesNumber of Motors and Drives 14 Total Rating 675 kWe
Note: you should aggregate all the capacities of all motors and drives on the siteComment on usage patterns and the age and state of repair of the Motors and DrivesHalf the motors are very old and need replacing. Three motors are too big for their function
LightingNumber of Lights in Factory/Stores 100 Total Rating 26 kWeNumber of Lights in Office Buildings 120 Total Rating 7 kWe
Note: you should aggregate all the lights in the factory/stores and offices on the siteComment on usage patterns and the age and state of repair of the LightingOffice lights are all fluorescent and with no control. Factory lights are halogen and do have some control
OtherDescribe of the energy consuming plant (such as mixers, distillation columns, pumps)
CARE+ Energy Efficiency Self Audit Guide IEE/07/827
document.xls; STEP 5 Page 16 of 43
QUALITATIVE INFORMATIONSTEP 5 ENERGY TRANSFORMATION AND MAJOR PRODUCTION PROCESSES
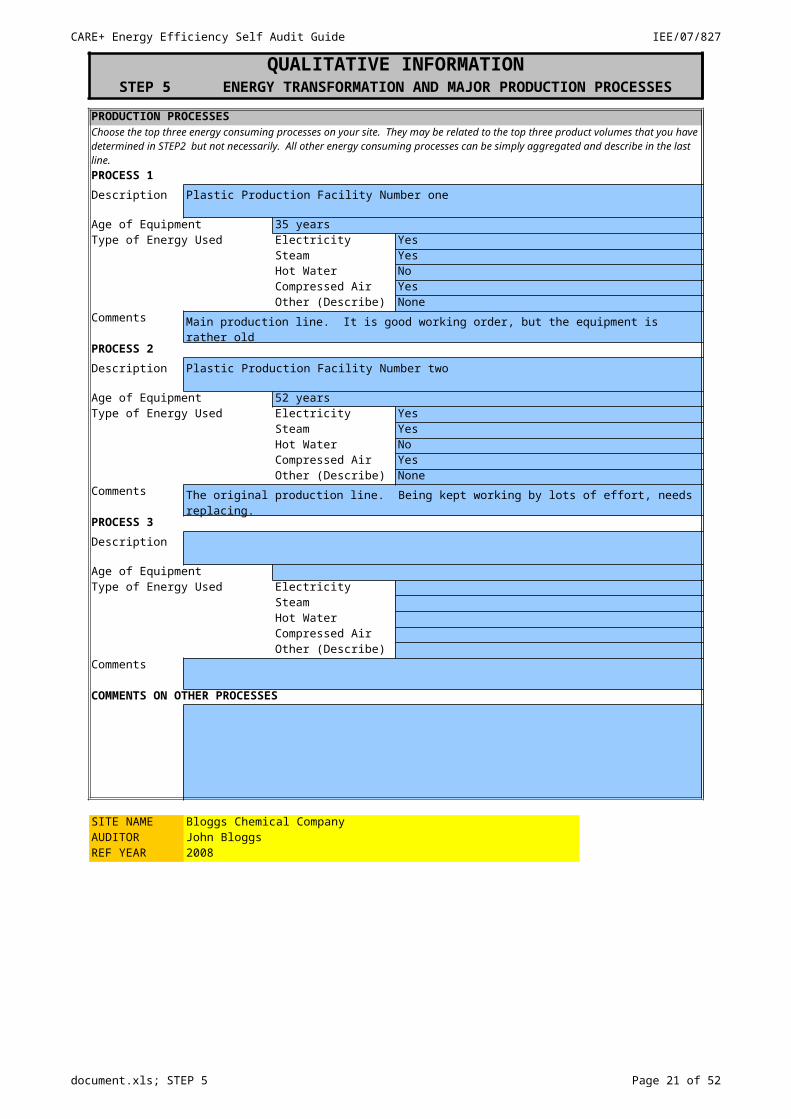
PRODUCTION PROCESSES
PROCESS 1Description Plastic Production Facility Number one
Age of Equipment 35 yearsType of Energy Used Electricity Yes
Steam YesHot Water NoCompressed Air YesOther (Describe) None
Comments Main production line. It is good working order, but the equipment is rather old
PROCESS 2Description Plastic Production Facility Number two
Age of Equipment 52 yearsType of Energy Used Electricity Yes
Steam YesHot Water NoCompressed Air YesOther (Describe) None
Comments The original production line. Being kept working by lots of effort, needs replacing.
PROCESS 3Description
Age of EquipmentType of Energy Used Electricity
SteamHot WaterCompressed AirOther (Describe)
Comments
COMMENTS ON OTHER PROCESSES
SITE NAME Bloggs Chemical CompanyAUDITOR John BloggsREF YEAR 2008
Choose the top three energy consuming processes on your site. They may be related to the top three product volumes that you have determined in STEP2 but not necessarily. All other energy consuming processes can be simply aggregated and describe in the last line.
CARE+ Energy Efficiency Self Audit Guide IEE/07/827
document.xls; STEP 6 Page 17 of 43
QUANTITATIVE INFORMATIONSTEP 6 SITE ENERGY USAGE
Introduction
CONVERSION FACTORSThis allows all your data to be in the same units to help with analysis.
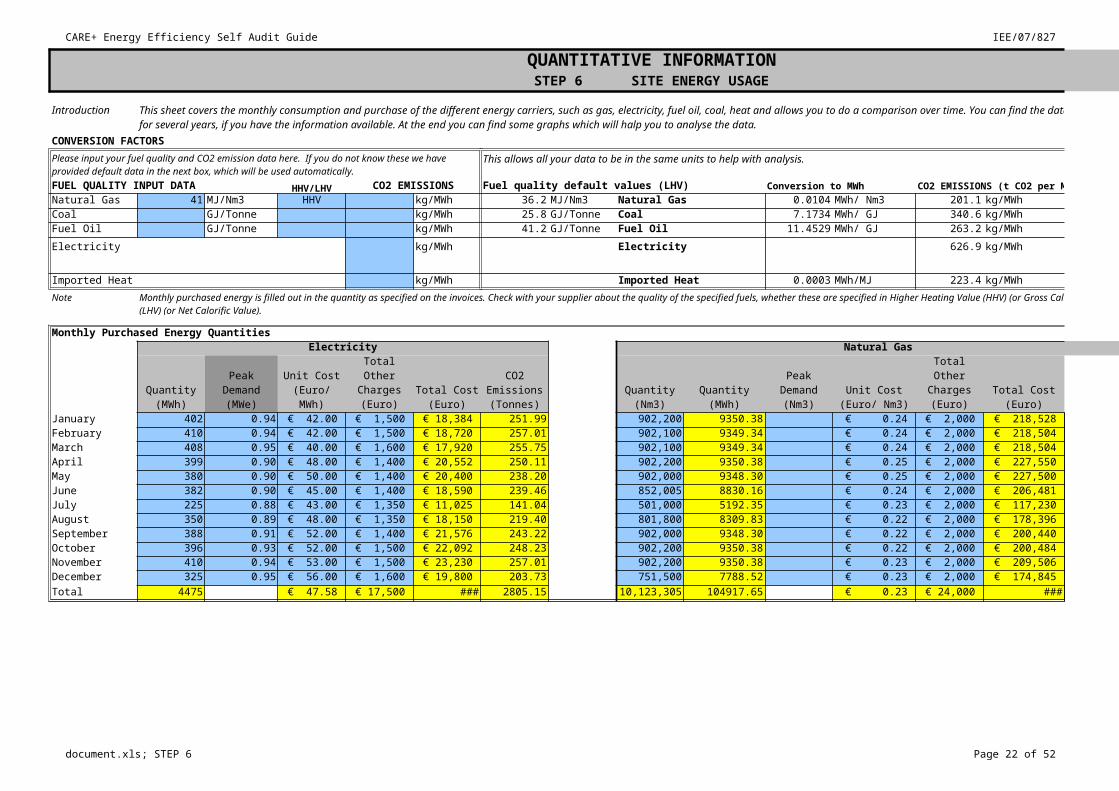
FUEL QUALITY INPUT DATA HHV/LHV CO2 EMISSIONS Fuel quality default values (LHV) Conversion to MWh CO2 EMISSIONS (t CO2 per MWh)Natural Gas 41 MJ/Nm3 HHV kg/MWh 36.2 MJ/Nm3 Natural Gas 0.0104 MWh/ Nm3 201.1 kg/MWhCoal GJ/Tonne kg/MWh 25.8 GJ/Tonne Coal 7.1734 MWh/ GJ 340.6 kg/MWhFuel Oil GJ/Tonne kg/MWh 41.2 GJ/Tonne Fuel Oil 11.4529 MWh/ GJ 263.2 kg/MWhElectricity kg/MWh Electricity 626.9 kg/MWh
Imported Heat kg/MWh Imported Heat 0.0003 MWh/MJ 223.4 kg/MWh Assumes natural gas fuel is usedNote
Monthly Purchased Energy QuantitiesElectricity Natural Gas
January 402 0.94 € 42.00 € 1,500 € 18,384 251.99 902,200 9350.38 € 0.24 € 2,000 € 218,528 1880.36February 410 0.94 € 42.00 € 1,500 € 18,720 257.01 902,100 9349.34 € 0.24 € 2,000 € 218,504 1880.15March 408 0.95 € 40.00 € 1,600 € 17,920 255.75 902,100 9349.34 € 0.24 € 2,000 € 218,504 1880.15April 399 0.90 € 48.00 € 1,400 € 20,552 250.11 902,200 9350.38 € 0.25 € 2,000 € 227,550 1880.36May 380 0.90 € 50.00 € 1,400 € 20,400 238.20 902,000 9348.30 € 0.25 € 2,000 € 227,500 1879.94June 382 0.90 € 45.00 € 1,400 € 18,590 239.46 852,005 8830.16 € 0.24 € 2,000 € 206,481 1775.74July 225 0.88 € 43.00 € 1,350 € 11,025 141.04 501,000 5192.35 € 0.23 € 2,000 € 117,230 1044.18August 350 0.89 € 48.00 € 1,350 € 18,150 219.40 801,800 8309.83 € 0.22 € 2,000 € 178,396 1671.11September 388 0.91 € 52.00 € 1,400 € 21,576 243.22 902,000 9348.30 € 0.22 € 2,000 € 200,440 1879.94October 396 0.93 € 52.00 € 1,500 € 22,092 248.23 902,200 9350.38 € 0.22 € 2,000 € 200,484 1880.36November 410 0.94 € 53.00 € 1,500 € 23,230 257.01 902,200 9350.38 € 0.23 € 2,000 € 209,506 1880.36December 325 0.95 € 56.00 € 1,600 € 19,800 203.73 751,500 7788.52 € 0.23 € 2,000 € 174,845 1566.27Total 4475 € 47.58 € 17,500 € 230,439 2805.15 10,123,305 104917.65 € 0.23 € 24,000 € 2,397,968 21098.94
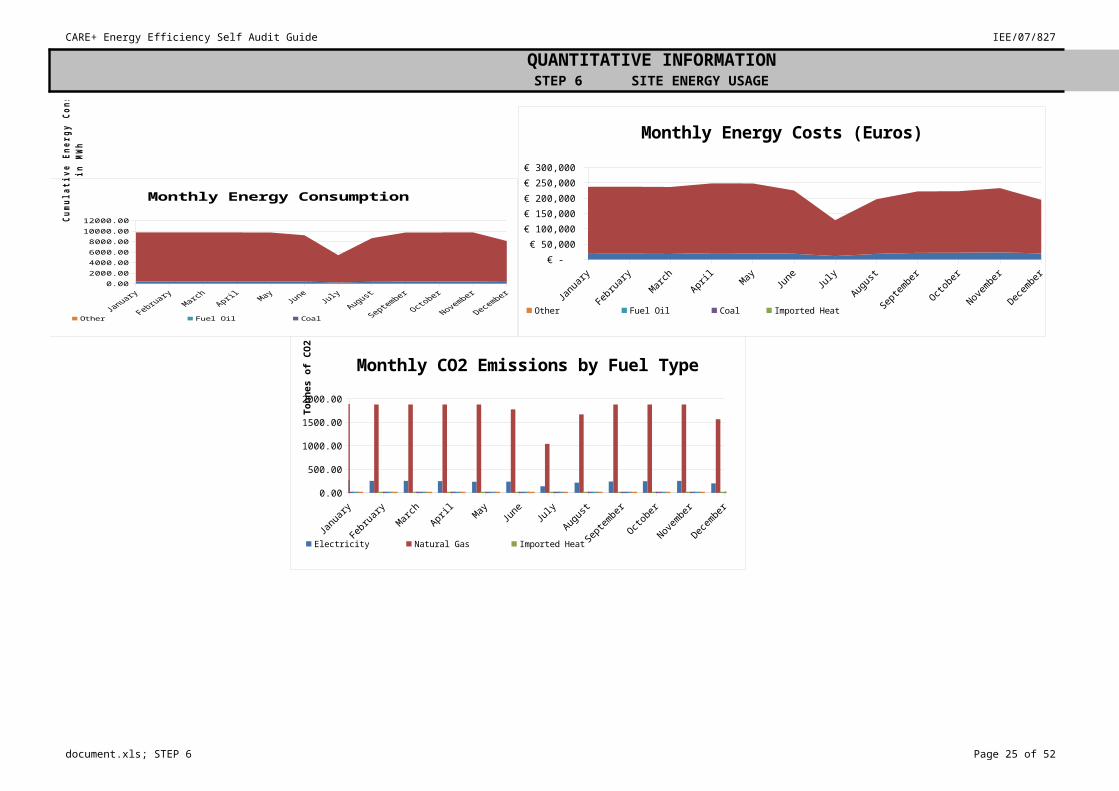
This sheet covers the monthly consumption and purchase of the different energy carriers, such as gas, electricity, fuel oil, coal, heat and allows you to do a comparison over time. You can find the data on your energy bill. Reuse the sheet for several years, if you have the information available. At the end you can find some graphs which will halp you to analyse the data.
Please input your fuel quality and CO2 emission data here. If you do not know these we have provided default data in the next box, which will be used automatically.
Assumes 50% Natural Gas Fuel in the Power Sector with 50% efficiency and 50% Coal with 40% efficiency
Monthly purchased energy is filled out in the quantity as specified on the invoices. Check with your supplier about the quality of the specified fuels, whether these are specified in Higher Heating Value (HHV) (or Gross Calorific Value) or in Lower Heating Value (LHV) (or Net Calorific Value).
Quantity (MWh)
Peak Demand (MWe)
Unit Cost (Euro/ MWh)
Total Other Charges (Euro)
Total Cost (Euro)
CO2 Emissions (Tonnes)
Quantity (Nm3)
Quantity (MWh)
Peak Demand
(Nm3)Unit Cost
(Euro/ Nm3)
Total Other Charges (Euro)
Total Cost (Euro)
CO2 Emissions (Tonnes)
CARE+ Energy Efficiency Self Audit Guide IEE/07/827
document.xls; STEP 6 Page 18 of 43
QUANTITATIVE INFORMATIONSTEP 6 SITE ENERGY USAGE
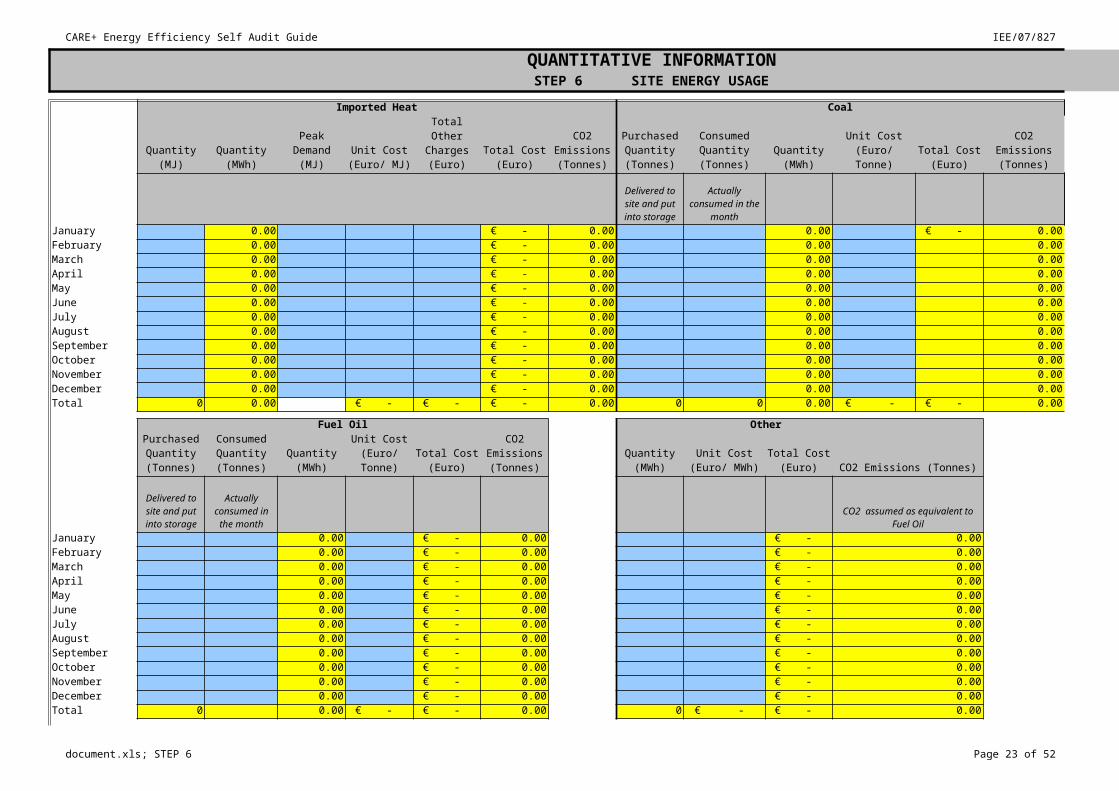
Imported Heat Coal
January 0.00 € - 0.00 0.00 € - 0.00February 0.00 € - 0.00 0.00 0.00March 0.00 € - 0.00 0.00 0.00April 0.00 € - 0.00 0.00 0.00May 0.00 € - 0.00 0.00 0.00June 0.00 € - 0.00 0.00 0.00July 0.00 € - 0.00 0.00 0.00August 0.00 € - 0.00 0.00 0.00September 0.00 € - 0.00 0.00 0.00October 0.00 € - 0.00 0.00 0.00November 0.00 € - 0.00 0.00 0.00December 0.00 € - 0.00 0.00 0.00Total 0 0.00 € - € - € - 0.00 0 0 0.00 € - € - 0.00
Fuel Oil Other
CO2 Emissions (Tonnes)
January 0.00 € - 0.00 € - 0.00February 0.00 € - 0.00 € - 0.00March 0.00 € - 0.00 € - 0.00April 0.00 € - 0.00 € - 0.00May 0.00 € - 0.00 € - 0.00June 0.00 € - 0.00 € - 0.00July 0.00 € - 0.00 € - 0.00August 0.00 € - 0.00 € - 0.00September 0.00 € - 0.00 € - 0.00October 0.00 € - 0.00 € - 0.00November 0.00 € - 0.00 € - 0.00December 0.00 € - 0.00 € - 0.00Total 0 0.00 € - € - 0.00 0 € - € - 0.00
Quantity (MJ)
Quantity (MWh)
Peak Demand
(MJ)Unit Cost
(Euro/ MJ)
Total Other Charges (Euro)
Total Cost (Euro)
CO2 Emissions (Tonnes)
Purchased Quantity (Tonnes)
Consumed Quantity (Tonnes)
Quantity (MWh)
Unit Cost (Euro/ Tonne)
Total Cost (Euro)
CO2 Emissions (Tonnes)
Delivered to site and put into storage
Actually consumed in the
month
Purchased Quantity (Tonnes)
Consumed Quantity (Tonnes)
Quantity (MWh)
Unit Cost (Euro/ Tonne)
Total Cost (Euro)
CO2 Emissions (Tonnes)
Quantity (MWh)
Unit Cost (Euro/ MWh)
Total Cost (Euro)
Delivered to site and put into storage
Actually consumed in the month
CO2 assumed as equivalent to Fuel Oil

CARE+ Energy Efficiency Self Audit Guide IEE/07/827
document.xls; STEP 6 Page 19 of 43
QUANTITATIVE INFORMATIONSTEP 6 SITE ENERGY USAGE
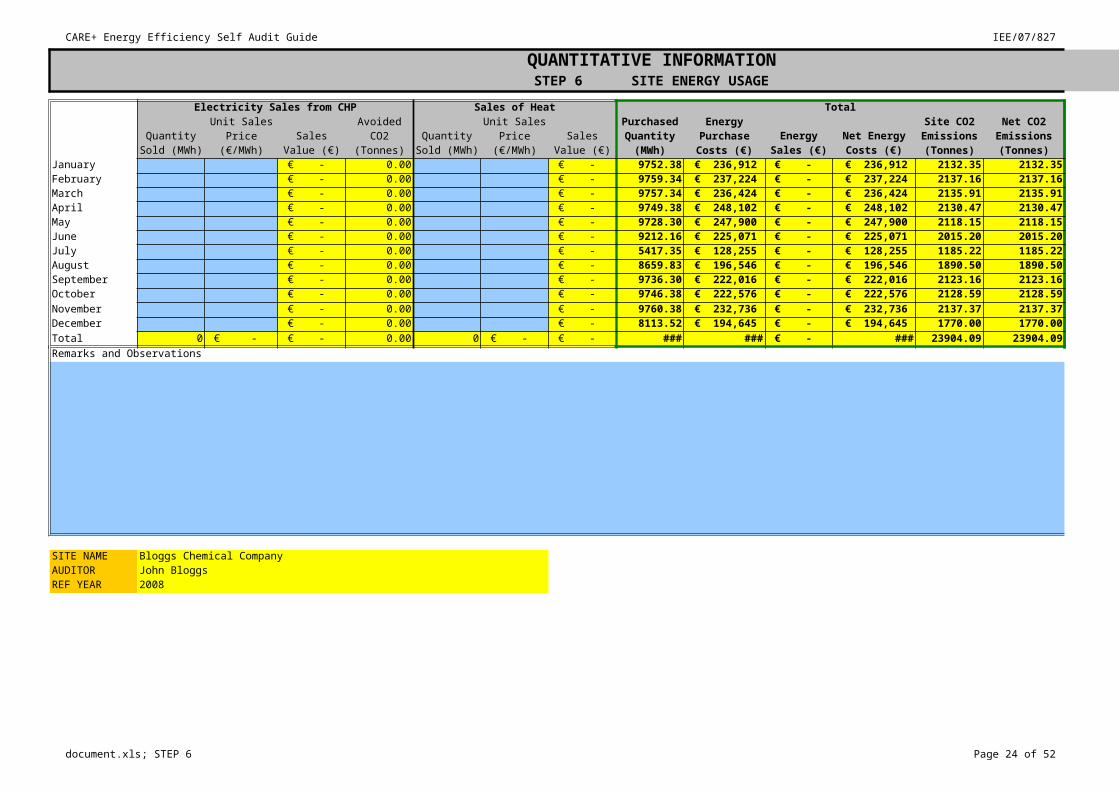
Electricity Sales from CHP Sales of Heat Total
January € - 0.00 € - 9752.38 € 236,912 € - € 236,912 2132.35 2132.35February € - 0.00 € - 9759.34 € 237,224 € - € 237,224 2137.16 2137.16March € - 0.00 € - 9757.34 € 236,424 € - € 236,424 2135.91 2135.91April € - 0.00 € - 9749.38 € 248,102 € - € 248,102 2130.47 2130.47May € - 0.00 € - 9728.30 € 247,900 € - € 247,900 2118.15 2118.15June € - 0.00 € - 9212.16 € 225,071 € - € 225,071 2015.20 2015.20July € - 0.00 € - 5417.35 € 128,255 € - € 128,255 1185.22 1185.22August € - 0.00 € - 8659.83 € 196,546 € - € 196,546 1890.50 1890.50September € - 0.00 € - 9736.30 € 222,016 € - € 222,016 2123.16 2123.16October € - 0.00 € - 9746.38 € 222,576 € - € 222,576 2128.59 2128.59November € - 0.00 € - 9760.38 € 232,736 € - € 232,736 2137.37 2137.37December € - 0.00 € - 8113.52 € 194,645 € - € 194,645 1770.00 1770.00Total 0 € - € - 0.00 0 € - € - € 109,393 € 2,628,407 € - € 2,628,407 23904.09 23904.09Remarks and Observations
SITE NAME Bloggs Chemical CompanyAUDITOR John BloggsREF YEAR 2008
Quantity Sold (MWh)
Unit Sales Price
(€/MWh)Sales Value
(€)
Avoided CO2
(Tonnes)Quantity
Sold (MWh)
Unit Sales Price
(€/MWh)Sales Value
(€)
Purchased Quantity (MWh)
Energy Purchase Costs (€)
Energy Sales (€)
Net Energy Costs (€)
Site CO2 Emissions (Tonnes)
Net CO2 Emissions (Tonnes)
CARE+ Energy Efficiency Self Audit Guide IEE/07/827
document.xls; STEP 6 Page 20 of 43
QUANTITATIVE INFORMATIONSTEP 6 SITE ENERGY USAGE
0.00
2000.00
4000.00
6000.00
8000.00
10000.00
12000.00
Monthly Energy Consumption
Other Fuel Oil Coal Imported Heat Natural Gas Electricity
Cu
mu
lati
ve
En
erg
y C
on
sum
pti
on
in
MW
h
January
Febru
aryMarc
hApril
MayJune
July
August
Septem
ber
October
November
December
€ -
€ 50,000
€ 100,000
€ 150,000
€ 200,000
€ 250,000
€ 300,000
Monthly Energy Costs (Euros)
Other Fuel Oil Coal Imported Heat Natural Gas Electricity
January
Febru
aryMarc
hApril
MayJune
July
August
Septem
ber
October
November
December
0.00200.00400.00600.00800.00
1000.001200.001400.001600.001800.002000.00
Monthly CO2 Emissions by Fuel Type
Electricity Natural Gas Imported Heat Coal Fuel Oil Other
Tonn
es o
f CO
2
CARE+ Energy Efficiency Self Audit Guide IEE/07/827
document.xls; STEP 7 Page 21 of 43
QUANTITATIVE INFORMATIONSTEP 7 SITE PRODUCTION AND FINANCIAL DATA
Introduction
Monthly Financial Data
Total Production Energy Costs Sales Revenues Gross Profit Return on Sales
Tonnes € € € € % % €January 27,000 € 236,912 € 1,160,000 € 1,000,000 -€ 160,000 -16.0% 20.4% € 8.77 February 28,000 € 237,224 € 1,130,000 € 1,750,000 € 620,000 35.4% 21.0% € 8.47 March 28,000 € 236,424 € 1,140,000 € 1,500,000 € 360,000 24.0% 20.7% € 8.44 April 28,000 € 248,102 € 1,190,000 € 1,500,000 € 310,000 20.7% 20.8% € 8.86 May 27,000 € 247,900 € 1,090,000 € 1,000,000 -€ 90,000 -9.0% 22.7% € 9.18 June 25,000 € 225,071 € 1,000,000 € 1,000,000 € - 0.0% 22.5% € 9.00 July 12,000 € 128,255 € 750,000 € 900,000 € 150,000 16.7% 17.1% € 10.69 August 20,000 € 196,546 € 1,000,000 € 1,500,000 € 500,000 33.3% 19.7% € 9.83 September 25,000 € 222,016 € 1,100,000 € 2,000,000 € 900,000 45.0% 20.2% € 8.88 October 26,000 € 222,576 € 1,050,000 € 1,500,000 € 450,000 30.0% 21.2% € 8.56 November 27,000 € 232,736 € 1,150,000 € 1,000,000 -€ 150,000 -15.0% 20.2% € 8.62 December 20,000 € 194,645 € 900,000 € 750,000 -€ 150,000 -20.0% 21.6% € 9.73 Total 293,000 € 2,628,407 € 12,660,000 € 15,400,000 € 2,740,000 17.8% 20.8% € 8.97
Net Profit of Company in Reference Year € 1,500,000 A 10% Saving in Your Energy Costs will Improve Your Net Profit to € 1,762,841 Remarks and Observations which is a Business Improvement of 17.52%
SITE NAME Bloggs Chemical CompanyAUDITOR John BloggsREF YEAR 2008
Energy management can improve your business performance. To relate the two issues, it is indispensable to use the main financial indicators or your site's business, such as sales; cost; profit and relate it with your energy cost. If you want to work out a business case, what influence energy savings can have on your overall performance, this is the data you need to look at. For this STEP you need the aggregated data for your site.
Total Production Costs
Energy Cost / Total Costs
Energy Costs / Tonne of Production
Total annual production costs (materials, energy,
labour) excluding overhead, taxation, and
interest payments
Monthly sales of goods and services
Annual Sales minus the Cost of Production
Gross margin divided by total production costs
CARE+ Energy Efficiency Self Audit Guide IEE/07/827
document.xls ;STEP 8 Page 22 of 43
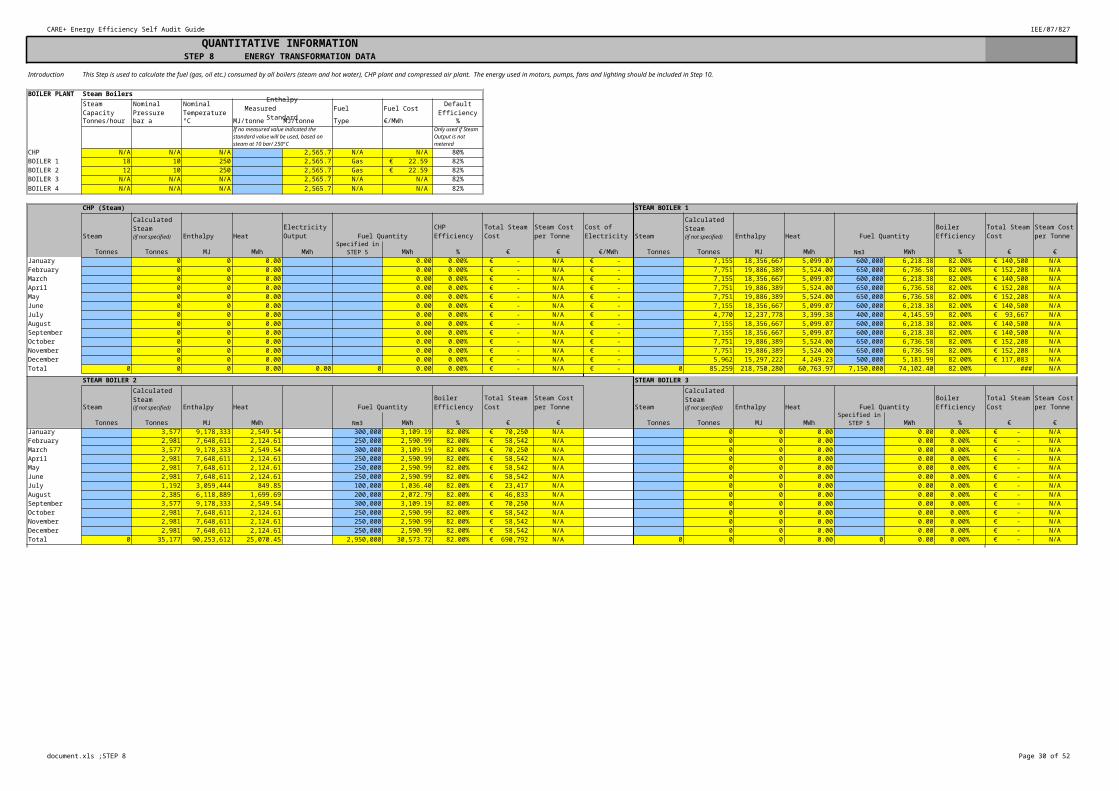
QUANTITATIVE INFORMATIONSTEP 8 ENERGY TRANSFORMATION DATA
Introduction This Step is used to calculate the fuel (gas, oil etc.) consumed by all boilers (steam and hot water), CHP plant and compressed air plant. The energy used in motors, pumps, fans and lighting should be included in Step 10.
BOILER PLANT Steam Boilers
Fuel Fuel Cost
Tonnes/hour bar a °C MJ/tonne MJ/tonne Type €/MWh %
CHP N/A N/A N/A 2,565.7 N/A N/A 80%BOILER 1 18 10 250 2,565.7 Gas € 22.59 82%BOILER 2 12 10 250 2,565.7 Gas € 22.59 82%BOILER 3 N/A N/A N/A 2,565.7 N/A N/A 82%BOILER 4 N/A N/A N/A 2,565.7 N/A N/A 82%
CHP (Steam) STEAM BOILER 1
Steam Enthalpy Heat Fuel Quantity CHP Efficiency Steam Enthalpy Heat Fuel Quantity
Tonnes Tonnes MJ MWh MWh MWh % € € €/MWh Tonnes Tonnes MJ MWh Nm3 MWh % € €January 0 0 0.00 0.00 0.00% € - N/A € - 7,155 18,356,667 5,099.07 600,000 6,218.38 82.00% € 140,500 N/A February 0 0 0.00 0.00 0.00% € - N/A € - 7,751 19,886,389 5,524.00 650,000 6,736.58 82.00% € 152,208 N/A March 0 0 0.00 0.00 0.00% € - N/A € - 7,155 18,356,667 5,099.07 600,000 6,218.38 82.00% € 140,500 N/A April 0 0 0.00 0.00 0.00% € - N/A € - 7,751 19,886,389 5,524.00 650,000 6,736.58 82.00% € 152,208 N/A May 0 0 0.00 0.00 0.00% € - N/A € - 7,751 19,886,389 5,524.00 650,000 6,736.58 82.00% € 152,208 N/A June 0 0 0.00 0.00 0.00% € - N/A € - 7,155 18,356,667 5,099.07 600,000 6,218.38 82.00% € 140,500 N/A July 0 0 0.00 0.00 0.00% € - N/A € - 4,770 12,237,778 3,399.38 400,000 4,145.59 82.00% € 93,667 N/A August 0 0 0.00 0.00 0.00% € - N/A € - 7,155 18,356,667 5,099.07 600,000 6,218.38 82.00% € 140,500 N/A September 0 0 0.00 0.00 0.00% € - N/A € - 7,155 18,356,667 5,099.07 600,000 6,218.38 82.00% € 140,500 N/A October 0 0 0.00 0.00 0.00% € - N/A € - 7,751 19,886,389 5,524.00 650,000 6,736.58 82.00% € 152,208 N/A November 0 0 0.00 0.00 0.00% € - N/A € - 7,751 19,886,389 5,524.00 650,000 6,736.58 82.00% € 152,208 N/A December 0 0 0.00 0.00 0.00% € - N/A € - 5,962 15,297,222 4,249.23 500,000 5,181.99 82.00% € 117,083 N/A Total 0 0 0 0.00 0.00 0 0.00 0.00% € - N/A € - 0 85,259 218,750,280 60,763.97 7,150,000 74,102.40 82.00% € 1,674,292 N/A
STEAM BOILER 2 STEAM BOILER 3
Steam Enthalpy Heat Fuel Quantity Steam Enthalpy Heat Fuel Quantity
Tonnes Tonnes MJ MWh Nm3 MWh % € € Tonnes Tonnes MJ MWh MWh % € €January 3,577 9,178,333 2,549.54 300,000 3,109.19 82.00% € 70,250 N/A 0 0 0.00 0.00 0.00% € - N/A February 2,981 7,648,611 2,124.61 250,000 2,590.99 82.00% € 58,542 N/A 0 0 0.00 0.00 0.00% € - N/A March 3,577 9,178,333 2,549.54 300,000 3,109.19 82.00% € 70,250 N/A 0 0 0.00 0.00 0.00% € - N/A April 2,981 7,648,611 2,124.61 250,000 2,590.99 82.00% € 58,542 N/A 0 0 0.00 0.00 0.00% € - N/A May 2,981 7,648,611 2,124.61 250,000 2,590.99 82.00% € 58,542 N/A 0 0 0.00 0.00 0.00% € - N/A June 2,981 7,648,611 2,124.61 250,000 2,590.99 82.00% € 58,542 N/A 0 0 0.00 0.00 0.00% € - N/A July 1,192 3,059,444 849.85 100,000 1,036.40 82.00% € 23,417 N/A 0 0 0.00 0.00 0.00% € - N/A August 2,385 6,118,889 1,699.69 200,000 2,072.79 82.00% € 46,833 N/A 0 0 0.00 0.00 0.00% € - N/A September 3,577 9,178,333 2,549.54 300,000 3,109.19 82.00% € 70,250 N/A 0 0 0.00 0.00 0.00% € - N/A October 2,981 7,648,611 2,124.61 250,000 2,590.99 82.00% € 58,542 N/A 0 0 0.00 0.00 0.00% € - N/A November 2,981 7,648,611 2,124.61 250,000 2,590.99 82.00% € 58,542 N/A 0 0 0.00 0.00 0.00% € - N/A December 2,981 7,648,611 2,124.61 250,000 2,590.99 82.00% € 58,542 N/A 0 0 0.00 0.00 0.00% € - N/A Total 0 35,177 90,253,612 25,070.45 2,950,000 30,573.72 82.00% € 690,792 N/A 0 0 0 0.00 0 0.00 0.00% € - N/A
Steam Capacity
Nominal Pressure
Nominal Temperature
EnthalpyMeasured Standard
Default Efficiency
If no measured value indicated the standard value will be used, based on steam at 10 bar/ 250°C
Only used if Steam Output is not metered
Calculated Steam (if not specified)
Electricity Output
Total Steam Cost
Steam Cost per Tonne
Cost of Electricity
Calculated Steam (if not specified)
Boiler Efficiency
Total Steam Cost
Steam Cost per Tonne
Units Specified in STEP 5
Calculated Steam (if not specified)
Boiler Efficiency
Total Steam Cost
Steam Cost per Tonne
Calculated Steam (if not specified)
Boiler Efficiency
Total Steam Cost
Steam Cost per Tonne
Units Specified in STEP 5
CARE+ Energy Efficiency Self Audit Guide IEE/07/827
document.xls ;STEP 8 Page 23 of 43
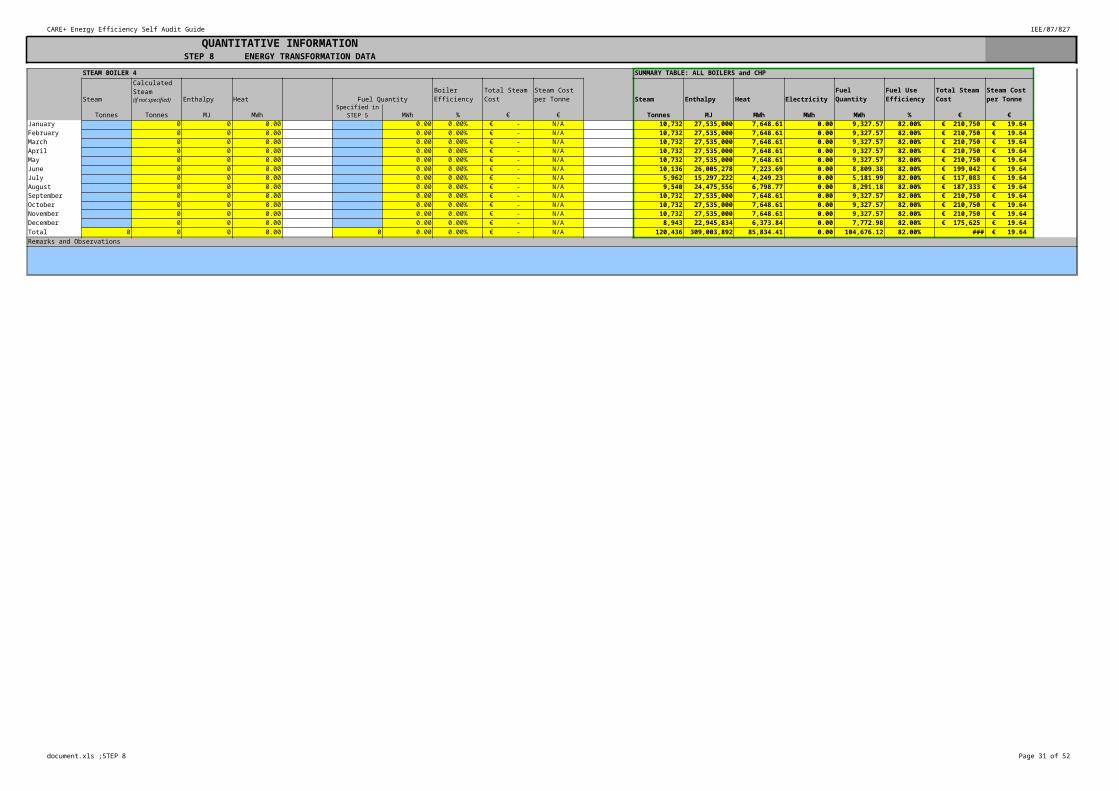
QUANTITATIVE INFORMATIONSTEP 8 ENERGY TRANSFORMATION DATA
STEAM BOILER 4 SUMMARY TABLE: ALL BOILERS and CHP
Steam Enthalpy Heat Fuel Quantity Steam Enthalpy Heat Electricity Fuel Quantity
Tonnes Tonnes MJ MWh MWh % € € Tonnes MJ MWh MWh MWh % € €January 0 0 0.00 0.00 0.00% € - N/A 10,732 27,535,000 7,648.61 0.00 9,327.57 82.00% € 210,750 € 19.64 February 0 0 0.00 0.00 0.00% € - N/A 10,732 27,535,000 7,648.61 0.00 9,327.57 82.00% € 210,750 € 19.64 March 0 0 0.00 0.00 0.00% € - N/A 10,732 27,535,000 7,648.61 0.00 9,327.57 82.00% € 210,750 € 19.64 April 0 0 0.00 0.00 0.00% € - N/A 10,732 27,535,000 7,648.61 0.00 9,327.57 82.00% € 210,750 € 19.64 May 0 0 0.00 0.00 0.00% € - N/A 10,732 27,535,000 7,648.61 0.00 9,327.57 82.00% € 210,750 € 19.64 June 0 0 0.00 0.00 0.00% € - N/A 10,136 26,005,278 7,223.69 0.00 8,809.38 82.00% € 199,042 € 19.64 July 0 0 0.00 0.00 0.00% € - N/A 5,962 15,297,222 4,249.23 0.00 5,181.99 82.00% € 117,083 € 19.64 August 0 0 0.00 0.00 0.00% € - N/A 9,540 24,475,556 6,798.77 0.00 8,291.18 82.00% € 187,333 € 19.64 September 0 0 0.00 0.00 0.00% € - N/A 10,732 27,535,000 7,648.61 0.00 9,327.57 82.00% € 210,750 € 19.64 October 0 0 0.00 0.00 0.00% € - N/A 10,732 27,535,000 7,648.61 0.00 9,327.57 82.00% € 210,750 € 19.64 November 0 0 0.00 0.00 0.00% € - N/A 10,732 27,535,000 7,648.61 0.00 9,327.57 82.00% € 210,750 € 19.64 December 0 0 0.00 0.00 0.00% € - N/A 8,943 22,945,834 6,373.84 0.00 7,772.98 82.00% € 175,625 € 19.64 Total 0 0 0 0.00 0 0.00 0.00% € - N/A 120,436 309,003,892 85,834.41 0.00 104,676.12 82.00% € 2,365,083 € 19.64 Remarks and Observations
Calculated Steam (if not specified)
Boiler Efficiency
Total Steam Cost
Steam Cost per Tonne
Fuel Use Efficiency
Total Steam Cost
Steam Cost per Tonne
Units Specified in STEP 5
CARE+ Energy Efficiency Self Audit Guide IEE/07/827
document.xls ;STEP 8 Page 24 of 43
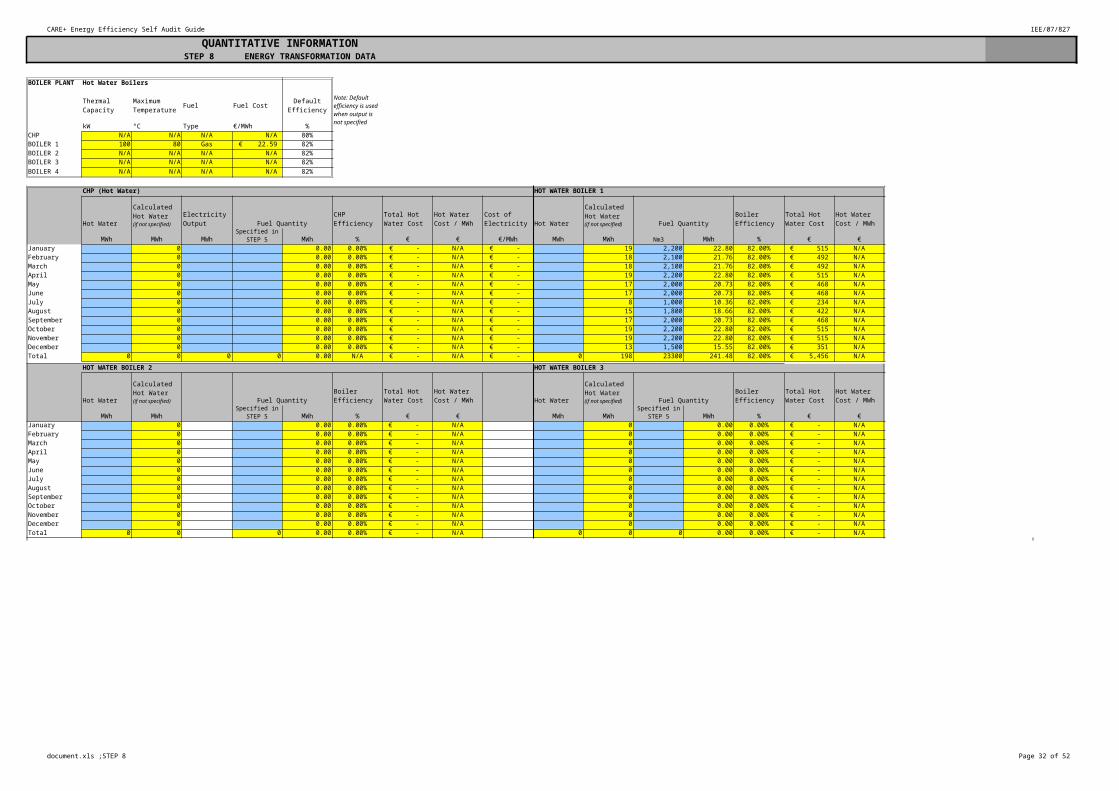
QUANTITATIVE INFORMATIONSTEP 8 ENERGY TRANSFORMATION DATA
BOILER PLANT Hot Water Boilers
Fuel Fuel Cost
kW °C Type €/MWh %CHP N/A N/A N/A N/A 80%BOILER 1 100 80 Gas € 22.59 82%BOILER 2 N/A N/A N/A N/A 82%BOILER 3 N/A N/A N/A N/A 82%BOILER 4 N/A N/A N/A N/A 82%
CHP (Hot Water) HOT WATER BOILER 1
Hot Water Fuel Quantity CHP Efficiency Hot Water Fuel Quantity
MWh MWh MWh MWh % € € €/MWh MWh MWh Nm3 MWh % € €January 0 0.00 0.00% € - N/A € - 19 2,200 22.80 82.00% € 515 N/A February 0 0.00 0.00% € - N/A € - 18 2,100 21.76 82.00% € 492 N/A March 0 0.00 0.00% € - N/A € - 18 2,100 21.76 82.00% € 492 N/A April 0 0.00 0.00% € - N/A € - 19 2,200 22.80 82.00% € 515 N/A May 0 0.00 0.00% € - N/A € - 17 2,000 20.73 82.00% € 468 N/A June 0 0.00 0.00% € - N/A € - 17 2,000 20.73 82.00% € 468 N/A July 0 0.00 0.00% € - N/A € - 8 1,000 10.36 82.00% € 234 N/A August 0 0.00 0.00% € - N/A € - 15 1,800 18.66 82.00% € 422 N/A September 0 0.00 0.00% € - N/A € - 17 2,000 20.73 82.00% € 468 N/A October 0 0.00 0.00% € - N/A € - 19 2,200 22.80 82.00% € 515 N/A November 0 0.00 0.00% € - N/A € - 19 2,200 22.80 82.00% € 515 N/A December 0 0.00 0.00% € - N/A € - 13 1,500 15.55 82.00% € 351 N/A Total 0 0 0 0 0.00 N/A € - N/A € - 0 198 23300 241.48 82.00% € 5,456 N/A
HOT WATER BOILER 2 HOT WATER BOILER 3
Hot Water Fuel Quantity Hot Water Fuel Quantity
MWh MWh MWh % € € MWh MWh MWh % € €January 0 0.00 0.00% € - N/A 0 0.00 0.00% € - N/A February 0 0.00 0.00% € - N/A 0 0.00 0.00% € - N/A March 0 0.00 0.00% € - N/A 0 0.00 0.00% € - N/A April 0 0.00 0.00% € - N/A 0 0.00 0.00% € - N/A May 0 0.00 0.00% € - N/A 0 0.00 0.00% € - N/A June 0 0.00 0.00% € - N/A 0 0.00 0.00% € - N/A July 0 0.00 0.00% € - N/A 0 0.00 0.00% € - N/A August 0 0.00 0.00% € - N/A 0 0.00 0.00% € - N/A September 0 0.00 0.00% € - N/A 0 0.00 0.00% € - N/A October 0 0.00 0.00% € - N/A 0 0.00 0.00% € - N/A November 0 0.00 0.00% € - N/A 0 0.00 0.00% € - N/A December 0 0.00 0.00% € - N/A 0 0.00 0.00% € - N/A Total 0 0 0 0.00 0.00% € - N/A 0 0 0 0.00 0.00% € - N/A
Thermal Capacity
Maximum Temperature
Default Efficiency
Note: Default efficiency is used when output is not specified
Calculated Hot Water (if not specified)
Electricity Output
Total Hot Water Cost
Hot Water Cost / MWh
Cost of Electricity
Calculated Hot Water (if not specified)
Boiler Efficiency
Total Hot Water Cost
Hot Water Cost / MWh
Units Specified in STEP 5
Calculated Hot Water (if not specified)
Boiler Efficiency
Total Hot Water Cost
Hot Water Cost / MWh
Calculated Hot Water (if not specified)
Boiler Efficiency
Total Hot Water Cost
Hot Water Cost / MWh
Units Specified in STEP 5
Units Specified in STEP 5
CARE+ Energy Efficiency Self Audit Guide IEE/07/827
document.xls ;STEP 8 Page 25 of 43
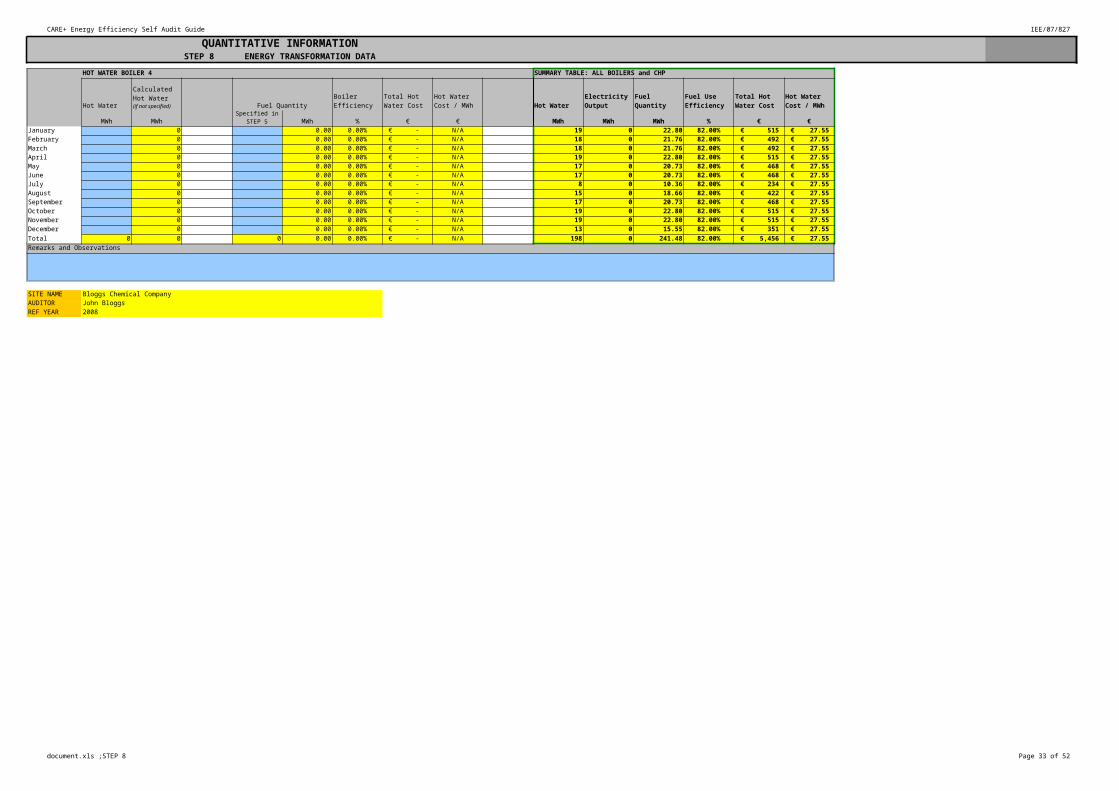
QUANTITATIVE INFORMATIONSTEP 8 ENERGY TRANSFORMATION DATA
HOT WATER BOILER 4 SUMMARY TABLE: ALL BOILERS and CHP
Hot Water Fuel Quantity Hot Water Fuel Quantity
MWh MWh MWh % € € MWh MWh MWh % € €January 0 0.00 0.00% € - N/A 19 0 22.80 82.00% € 515 € 27.55 February 0 0.00 0.00% € - N/A 18 0 21.76 82.00% € 492 € 27.55 March 0 0.00 0.00% € - N/A 18 0 21.76 82.00% € 492 € 27.55 April 0 0.00 0.00% € - N/A 19 0 22.80 82.00% € 515 € 27.55 May 0 0.00 0.00% € - N/A 17 0 20.73 82.00% € 468 € 27.55 June 0 0.00 0.00% € - N/A 17 0 20.73 82.00% € 468 € 27.55 July 0 0.00 0.00% € - N/A 8 0 10.36 82.00% € 234 € 27.55 August 0 0.00 0.00% € - N/A 15 0 18.66 82.00% € 422 € 27.55 September 0 0.00 0.00% € - N/A 17 0 20.73 82.00% € 468 € 27.55 October 0 0.00 0.00% € - N/A 19 0 22.80 82.00% € 515 € 27.55 November 0 0.00 0.00% € - N/A 19 0 22.80 82.00% € 515 € 27.55 December 0 0.00 0.00% € - N/A 13 0 15.55 82.00% € 351 € 27.55 Total 0 0 0 0.00 0.00% € - N/A 198 0 241.48 82.00% € 5,456 € 27.55 Remarks and Observations
SITE NAME Bloggs Chemical CompanyAUDITOR John BloggsREF YEAR 2008
Calculated Hot Water (if not specified)
Boiler Efficiency
Total Hot Water Cost
Hot Water Cost / MWh
Electricity Output
Fuel Use Efficiency
Total Hot Water Cost
Hot Water Cost / MWh
Units Specified in STEP 5

CARE+ Energy Efficiency Self Audit Guide IEE/07/827
document.xls; STEP 9 Page 26 of 43
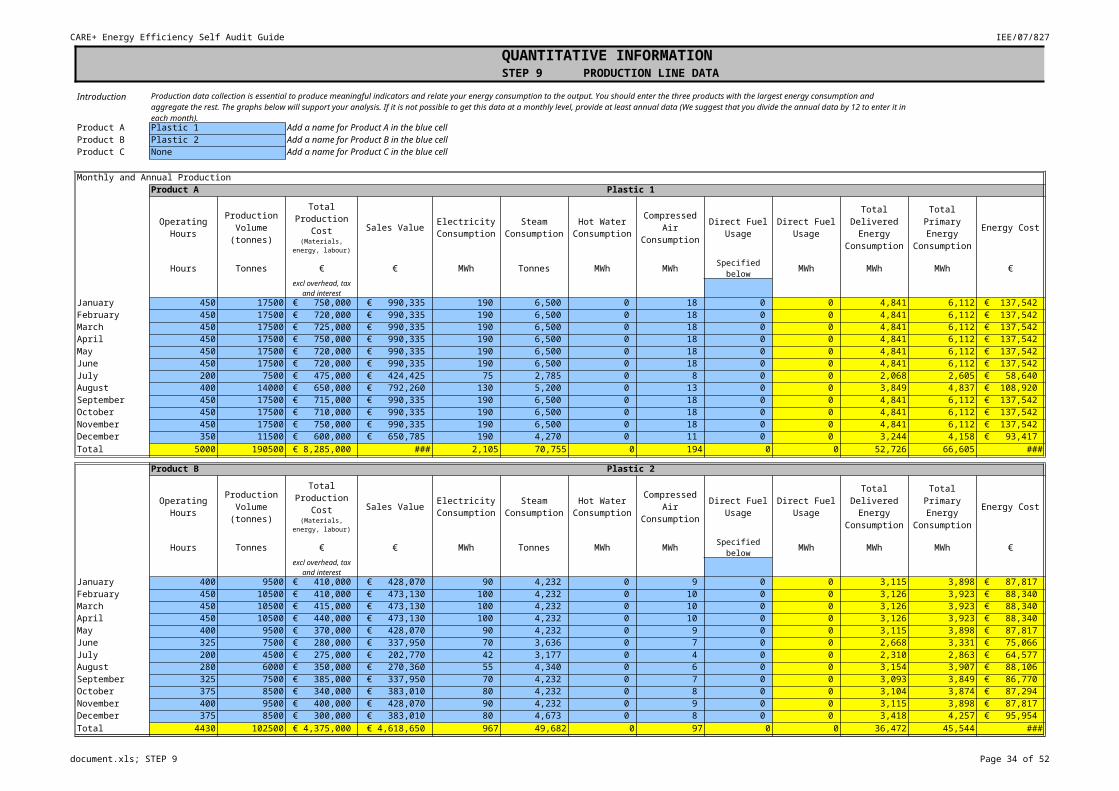
QUANTITATIVE INFORMATIONSTEP 9 PRODUCTION LINE DATA
Introduction
Product A Plastic 1 Add a name for Product A in the blue cellProduct B Plastic 2 Add a name for Product B in the blue cellProduct C None Add a name for Product C in the blue cell
Monthly and Annual ProductionProduct A Plastic 1
Sales Value Energy Cost
Hours Tonnes € € MWh Tonnes MWh MWh Specified below MWh MWh MWh €
January 450 17500 € 750,000 € 990,335 190 6,500 0 18 0 0 4,841 6,112 € 137,542 February 450 17500 € 720,000 € 990,335 190 6,500 0 18 0 0 4,841 6,112 € 137,542 March 450 17500 € 725,000 € 990,335 190 6,500 0 18 0 0 4,841 6,112 € 137,542 April 450 17500 € 750,000 € 990,335 190 6,500 0 18 0 0 4,841 6,112 € 137,542 May 450 17500 € 720,000 € 990,335 190 6,500 0 18 0 0 4,841 6,112 € 137,542 June 450 17500 € 720,000 € 990,335 190 6,500 0 18 0 0 4,841 6,112 € 137,542 July 200 7500 € 475,000 € 424,425 75 2,785 0 8 0 0 2,068 2,605 € 58,640 August 400 14000 € 650,000 € 792,260 130 5,200 0 13 0 0 3,849 4,837 € 108,920 September 450 17500 € 715,000 € 990,335 190 6,500 0 18 0 0 4,841 6,112 € 137,542 October 450 17500 € 710,000 € 990,335 190 6,500 0 18 0 0 4,841 6,112 € 137,542 November 450 17500 € 750,000 € 990,335 190 6,500 0 18 0 0 4,841 6,112 € 137,542 December 350 11500 € 600,000 € 650,785 190 4,270 0 11 0 0 3,244 4,158 € 93,417 Total 5000 190500 € 8,285,000 € 10,780,485 2,105 70,755 0 194 0 0 52,726 66,605 € 1,498,852
Product B Plastic 2
Sales Value Energy Cost
Hours Tonnes € € MWh Tonnes MWh MWh Specified below MWh MWh MWh €
January 400 9500 € 410,000 € 428,070 90 4,232 0 9 0 0 3,115 3,898 € 87,817 February 450 10500 € 410,000 € 473,130 100 4,232 0 10 0 0 3,126 3,923 € 88,340 March 450 10500 € 415,000 € 473,130 100 4,232 0 10 0 0 3,126 3,923 € 88,340 April 450 10500 € 440,000 € 473,130 100 4,232 0 10 0 0 3,126 3,923 € 88,340 May 400 9500 € 370,000 € 428,070 90 4,232 0 9 0 0 3,115 3,898 € 87,817 June 325 7500 € 280,000 € 337,950 70 3,636 0 7 0 0 2,668 3,331 € 75,066 July 200 4500 € 275,000 € 202,770 42 3,177 0 4 0 0 2,310 2,863 € 64,577 August 280 6000 € 350,000 € 270,360 55 4,340 0 6 0 0 3,154 3,907 € 88,106 September 325 7500 € 385,000 € 337,950 70 4,232 0 7 0 0 3,093 3,849 € 86,770 October 375 8500 € 340,000 € 383,010 80 4,232 0 8 0 0 3,104 3,874 € 87,294 November 400 9500 € 400,000 € 428,070 90 4,232 0 9 0 0 3,115 3,898 € 87,817 December 375 8500 € 300,000 € 383,010 80 4,673 0 8 0 0 3,418 4,257 € 95,954 Total 4430 102500 € 4,375,000 € 4,618,650 967 49,682 0 97 0 0 36,472 45,544 € 1,026,240
Production data collection is essential to produce meaningful indicators and relate your energy consumption to the output. You should enter the three products with the largest energy consumption and aggregate the rest. The graphs below will support your analysis. If it is not possible to get this data at a monthly level, provide at least annual data (We suggest that you divide the annual data by 12 to enter it in each month).
Operating Hours
Production Volume (tonnes)
Total Production
Cost (Materials, energy, labour)
Electricity Consumption
Steam Consumption
Hot Water Consumption
Compressed Air
ConsumptionDirect Fuel
UsageDirect Fuel
Usage
Total Delivered
Energy Consumption
Total Primary Energy
Consumption
excl overhead, tax and interest

CARE+ Energy Efficiency Self Audit Guide IEE/07/827
document.xls; STEP 9 Page 27 of 43
QUANTITATIVE INFORMATIONSTEP 9 PRODUCTION LINE DATA
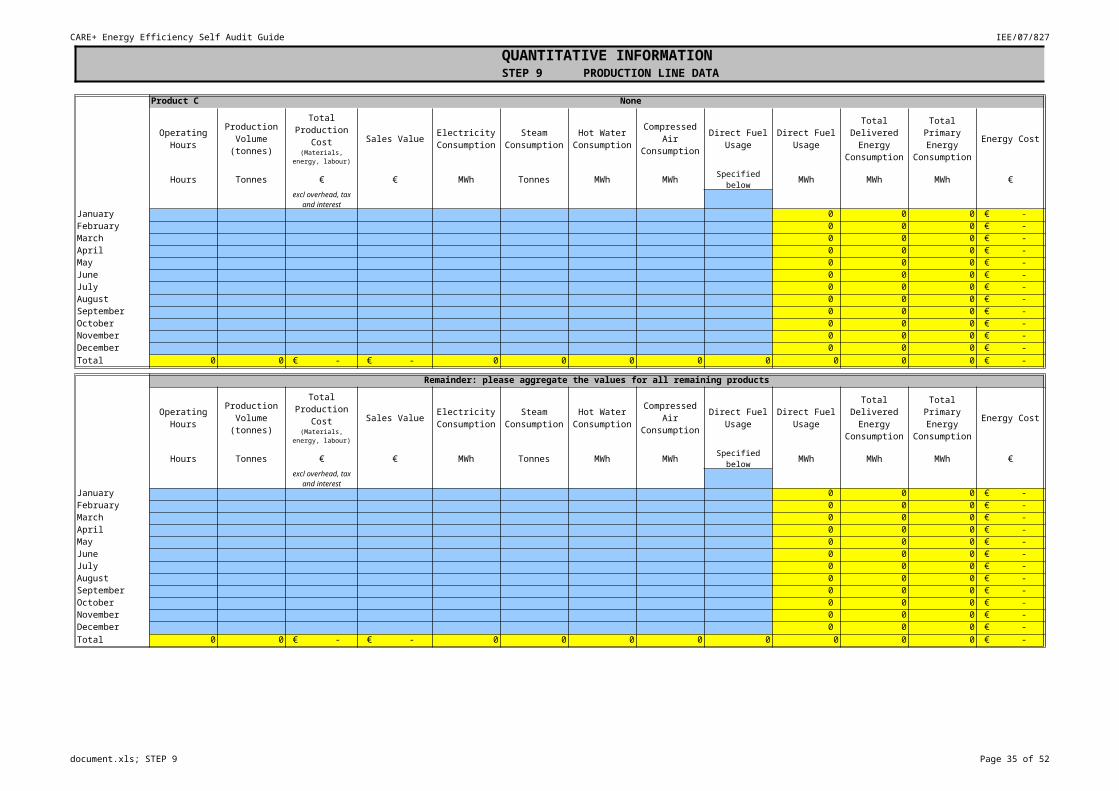
Product C None
Sales Value Energy Cost
Hours Tonnes € € MWh Tonnes MWh MWh Specified below MWh MWh MWh €
January 0 0 0 € - February 0 0 0 € - March 0 0 0 € - April 0 0 0 € - May 0 0 0 € - June 0 0 0 € - July 0 0 0 € - August 0 0 0 € - September 0 0 0 € - October 0 0 0 € - November 0 0 0 € - December 0 0 0 € - Total 0 0 € - € - 0 0 0 0 0 0 0 0 € -
Remainder: please aggregate the values for all remaining products
Sales Value Energy Cost
Hours Tonnes € € MWh Tonnes MWh MWh Specified below MWh MWh MWh €
January 0 0 0 € - February 0 0 0 € - March 0 0 0 € - April 0 0 0 € - May 0 0 0 € - June 0 0 0 € - July 0 0 0 € - August 0 0 0 € - September 0 0 0 € - October 0 0 0 € - November 0 0 0 € - December 0 0 0 € - Total 0 0 € - € - 0 0 0 0 0 0 0 0 € -
Operating Hours
Production Volume (tonnes)
Total Production
Cost (Materials, energy, labour)
Electricity Consumption
Steam Consumption
Hot Water Consumption
Compressed Air
ConsumptionDirect Fuel
UsageDirect Fuel
Usage
Total Delivered
Energy Consumption
Total Primary Energy
Consumption
excl overhead, tax and interest

CARE+ Energy Efficiency Self Audit Guide IEE/07/827
document.xls; STEP 9 Page 28 of 43
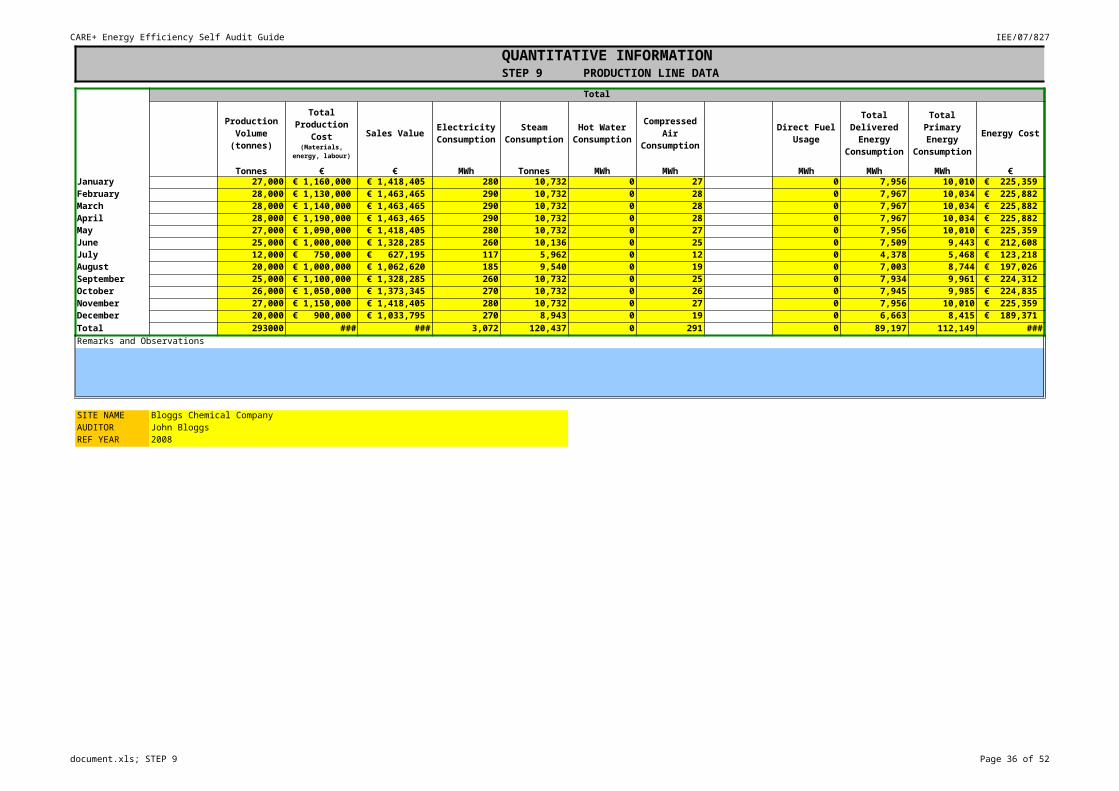
QUANTITATIVE INFORMATIONSTEP 9 PRODUCTION LINE DATA
Total
Sales Value Energy Cost
Tonnes € € MWh Tonnes MWh MWh MWh MWh MWh €January 27,000 € 1,160,000 € 1,418,405 280 10,732 0 27 0 7,956 10,010 € 225,359 February 28,000 € 1,130,000 € 1,463,465 290 10,732 0 28 0 7,967 10,034 € 225,882 March 28,000 € 1,140,000 € 1,463,465 290 10,732 0 28 0 7,967 10,034 € 225,882 April 28,000 € 1,190,000 € 1,463,465 290 10,732 0 28 0 7,967 10,034 € 225,882 May 27,000 € 1,090,000 € 1,418,405 280 10,732 0 27 0 7,956 10,010 € 225,359 June 25,000 € 1,000,000 € 1,328,285 260 10,136 0 25 0 7,509 9,443 € 212,608 July 12,000 € 750,000 € 627,195 117 5,962 0 12 0 4,378 5,468 € 123,218 August 20,000 € 1,000,000 € 1,062,620 185 9,540 0 19 0 7,003 8,744 € 197,026 September 25,000 € 1,100,000 € 1,328,285 260 10,732 0 25 0 7,934 9,961 € 224,312 October 26,000 € 1,050,000 € 1,373,345 270 10,732 0 26 0 7,945 9,985 € 224,835 November 27,000 € 1,150,000 € 1,418,405 280 10,732 0 27 0 7,956 10,010 € 225,359 December 20,000 € 900,000 € 1,033,795 270 8,943 0 19 0 6,663 8,415 € 189,371 Total 293000 € 12,660,000 € 15,399,135 3,072 120,437 0 291 0 89,197 112,149 € 2,525,092 Remarks and Observations
SITE NAME Bloggs Chemical CompanyAUDITOR John BloggsREF YEAR 2008
Production Volume (tonnes)
Total Production
Cost (Materials, energy, labour)
Electricity Consumption
Steam Consumption
Hot Water Consumption
Compressed Air
ConsumptionDirect Fuel
Usage
Total Delivered
Energy Consumption
Total Primary Energy
Consumption

CARE+ Energy Efficiency Self Audit Guide IEE/07/827
document.xls; STEP 9 Page 29 of 43
QUANTITATIVE INFORMATIONSTEP 9 PRODUCTION LINE DATA
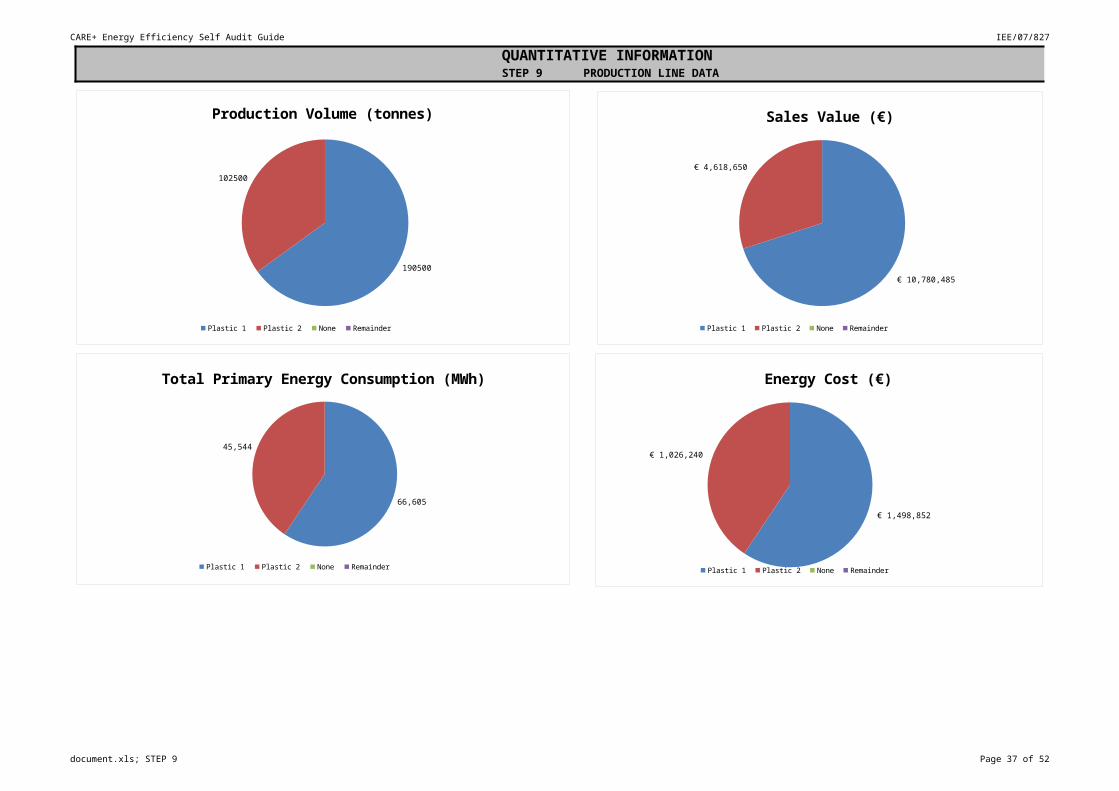
190500
102500
Production Volume (tonnes)
Plastic 1 Plastic 2 None Remainder
€ 10,780,485
€ 4,618,650
Sales Value (€)
Plastic 1 Plastic 2 None Remainder
66,605
45,544
Total Primary Energy Consumption (MWh)
Plastic 1 Plastic 2 None Remainder
€ 1,498,852
€ 1,026,240
Energy Cost (€)
Plastic 1 Plastic 2 None Remainder
CARE+ Energy Efficiency Self Audit Guide IEE/07/827
document.xls; STEP 10 Page 30 of 43
QUANTITATIVE INFORMATIONSTEP 10 PROCESS ENERGY CONSUMING DEVICES
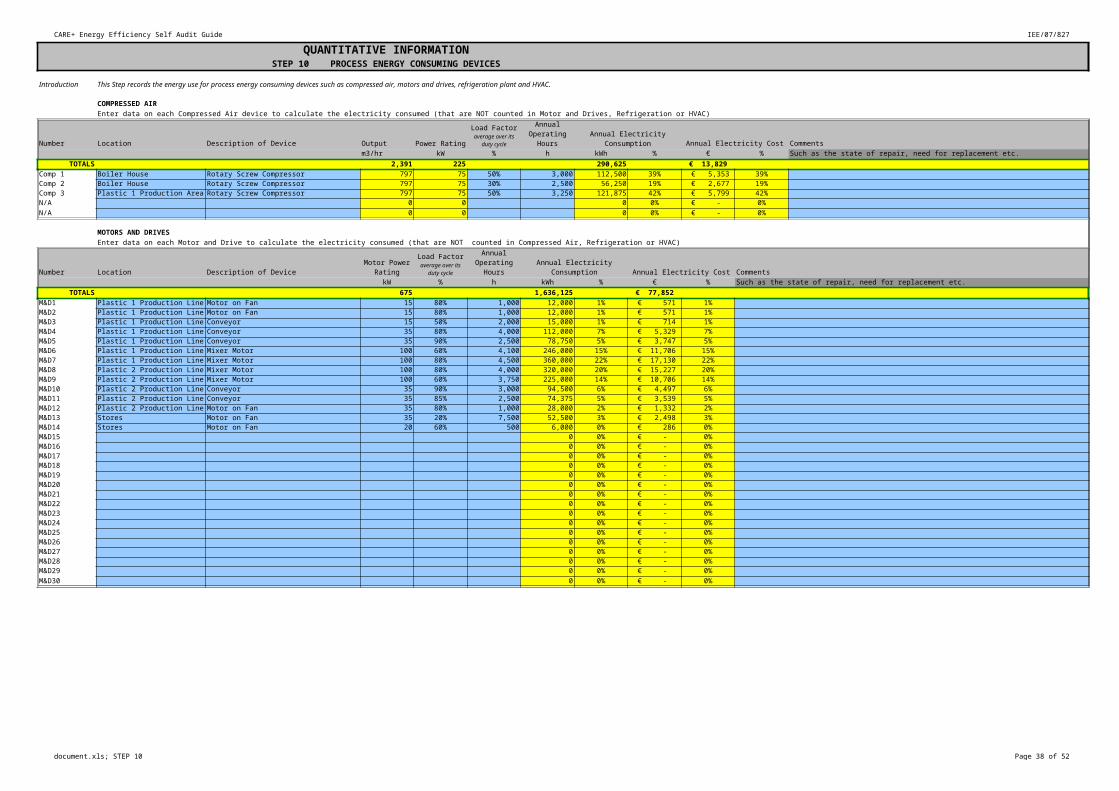
Introduction This Step records the energy use for process energy consuming devices such as compressed air, motors and drives, refrigeration plant and HVAC.
COMPRESSED AIREnter data on each Compressed Air device to calculate the electricity consumed (that are NOT counted in Motor and Drives, Refrigeration or HVAC)
Number Location Description of Device Output Power Rating Annual Electricity Cost Commentsm3/hr kW % h kWh % € % Such as the state of repair, need for replacement etc.
TOTALS 2,391 225 290,625 € 13,829 Comp 1 Boiler House Rotary Screw Compressor 797 75 50% 3,000 112,500 39% € 5,353 39%Comp 2 Boiler House Rotary Screw Compressor 797 75 30% 2,500 56,250 19% € 2,677 19%Comp 3 Plastic 1 Production Area Rotary Screw Compressor 797 75 50% 3,250 121,875 42% € 5,799 42%N/A 0 0 0 0% € - 0%N/A 0 0 0 0% € - 0%
MOTORS AND DRIVESEnter data on each Motor and Drive to calculate the electricity consumed (that are NOT counted in Compressed Air, Refrigeration or HVAC)
Number Location Description of Device Annual Electricity Cost CommentskW % h kWh % € % Such as the state of repair, need for replacement etc.
TOTALS 675 1,636,125 € 77,852 M&D1 Plastic 1 Production Line Motor on Fan 15 80% 1,000 12,000 1% € 571 1%M&D2 Plastic 1 Production Line Motor on Fan 15 80% 1,000 12,000 1% € 571 1%M&D3 Plastic 1 Production Line Conveyor 15 50% 2,000 15,000 1% € 714 1%M&D4 Plastic 1 Production Line Conveyor 35 80% 4,000 112,000 7% € 5,329 7%M&D5 Plastic 1 Production Line Conveyor 35 90% 2,500 78,750 5% € 3,747 5%M&D6 Plastic 1 Production Line Mixer Motor 100 60% 4,100 246,000 15% € 11,706 15%M&D7 Plastic 1 Production Line Mixer Motor 100 80% 4,500 360,000 22% € 17,130 22%M&D8 Plastic 2 Production Line Mixer Motor 100 80% 4,000 320,000 20% € 15,227 20%M&D9 Plastic 2 Production Line Mixer Motor 100 60% 3,750 225,000 14% € 10,706 14%M&D10 Plastic 2 Production Line Conveyor 35 90% 3,000 94,500 6% € 4,497 6%M&D11 Plastic 2 Production Line Conveyor 35 85% 2,500 74,375 5% € 3,539 5%M&D12 Plastic 2 Production Line Motor on Fan 35 80% 1,000 28,000 2% € 1,332 2%M&D13 Stores Motor on Fan 35 20% 7,500 52,500 3% € 2,498 3%M&D14 Stores Motor on Fan 20 60% 500 6,000 0% € 286 0%M&D15 0 0% € - 0%M&D16 0 0% € - 0%M&D17 0 0% € - 0%M&D18 0 0% € - 0%M&D19 0 0% € - 0%M&D20 0 0% € - 0%M&D21 0 0% € - 0%M&D22 0 0% € - 0%M&D23 0 0% € - 0%M&D24 0 0% € - 0%M&D25 0 0% € - 0%M&D26 0 0% € - 0%M&D27 0 0% € - 0%M&D28 0 0% € - 0%M&D29 0 0% € - 0%M&D30 0 0% € - 0%
Load Factoraverage over its
duty cycle
Annual Operating
HoursAnnual Electricity
Consumption
Motor Power Rating
Load Factoraverage over its
duty cycle
Annual Operating
HoursAnnual Electricity
Consumption
CARE+ Energy Efficiency Self Audit Guide IEE/07/827
document.xls; STEP 10 Page 31 of 43
QUANTITATIVE INFORMATIONSTEP 10 PROCESS ENERGY CONSUMING DEVICES
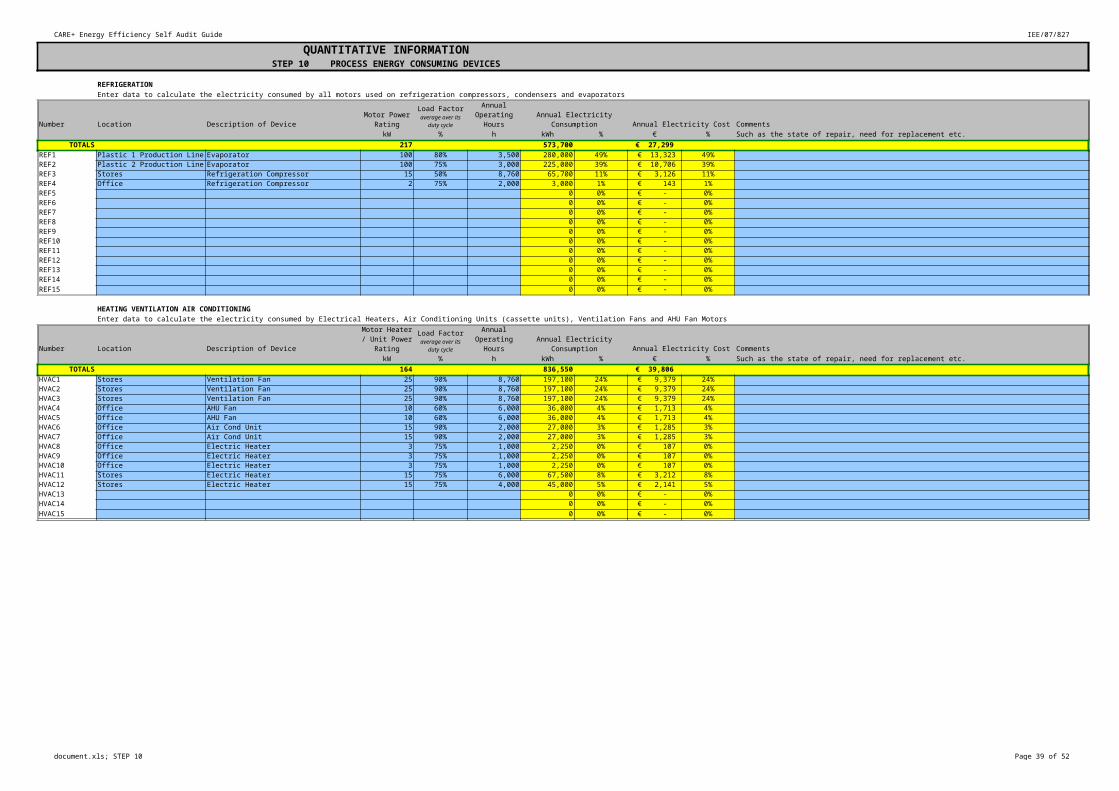
REFRIGERATIONEnter data to calculate the electricity consumed by all motors used on refrigeration compressors, condensers and evaporators
Number Location Description of Device Annual Electricity Cost CommentskW % h kWh % € % Such as the state of repair, need for replacement etc.
TOTALS 217 573,700 € 27,299 REF1 Plastic 1 Production Line Evaporator 100 80% 3,500 280,000 49% € 13,323 49%REF2 Plastic 2 Production Line Evaporator 100 75% 3,000 225,000 39% € 10,706 39%REF3 Stores Refrigeration Compressor 15 50% 8,760 65,700 11% € 3,126 11%REF4 Office Refrigeration Compressor 2 75% 2,000 3,000 1% € 143 1%REF5 0 0% € - 0%REF6 0 0% € - 0%REF7 0 0% € - 0%REF8 0 0% € - 0%REF9 0 0% € - 0%REF10 0 0% € - 0%REF11 0 0% € - 0%REF12 0 0% € - 0%REF13 0 0% € - 0%REF14 0 0% € - 0%REF15 0 0% € - 0%
HEATING VENTILATION AIR CONDITIONINGEnter data to calculate the electricity consumed by Electrical Heaters, Air Conditioning Units (cassette units), Ventilation Fans and AHU Fan Motors
Number Location Description of Device Annual Electricity Cost CommentskW % h kWh % € % Such as the state of repair, need for replacement etc.
TOTALS 164 836,550 € 39,806 HVAC1 Stores Ventilation Fan 25 90% 8,760 197,100 24% € 9,379 24%HVAC2 Stores Ventilation Fan 25 90% 8,760 197,100 24% € 9,379 24%HVAC3 Stores Ventilation Fan 25 90% 8,760 197,100 24% € 9,379 24%HVAC4 Office AHU Fan 10 60% 6,000 36,000 4% € 1,713 4%HVAC5 Office AHU Fan 10 60% 6,000 36,000 4% € 1,713 4%HVAC6 Office Air Cond Unit 15 90% 2,000 27,000 3% € 1,285 3%HVAC7 Office Air Cond Unit 15 90% 2,000 27,000 3% € 1,285 3%HVAC8 Office Electric Heater 3 75% 1,000 2,250 0% € 107 0%HVAC9 Office Electric Heater 3 75% 1,000 2,250 0% € 107 0%HVAC10 Office Electric Heater 3 75% 1,000 2,250 0% € 107 0%HVAC11 Stores Electric Heater 15 75% 6,000 67,500 8% € 3,212 8%HVAC12 Stores Electric Heater 15 75% 4,000 45,000 5% € 2,141 5%HVAC13 0 0% € - 0%HVAC14 0 0% € - 0%HVAC15 0 0% € - 0%
Motor Power Rating
Load Factoraverage over its
duty cycle
Annual Operating
HoursAnnual Electricity
Consumption
Motor Heater / Unit Power Rating
Load Factoraverage over its
duty cycle
Annual Operating
HoursAnnual Electricity
Consumption
CARE+ Energy Efficiency Self Audit Guide IEE/07/827
document.xls; STEP 10 Page 32 of 43
QUANTITATIVE INFORMATIONSTEP 10 PROCESS ENERGY CONSUMING DEVICES
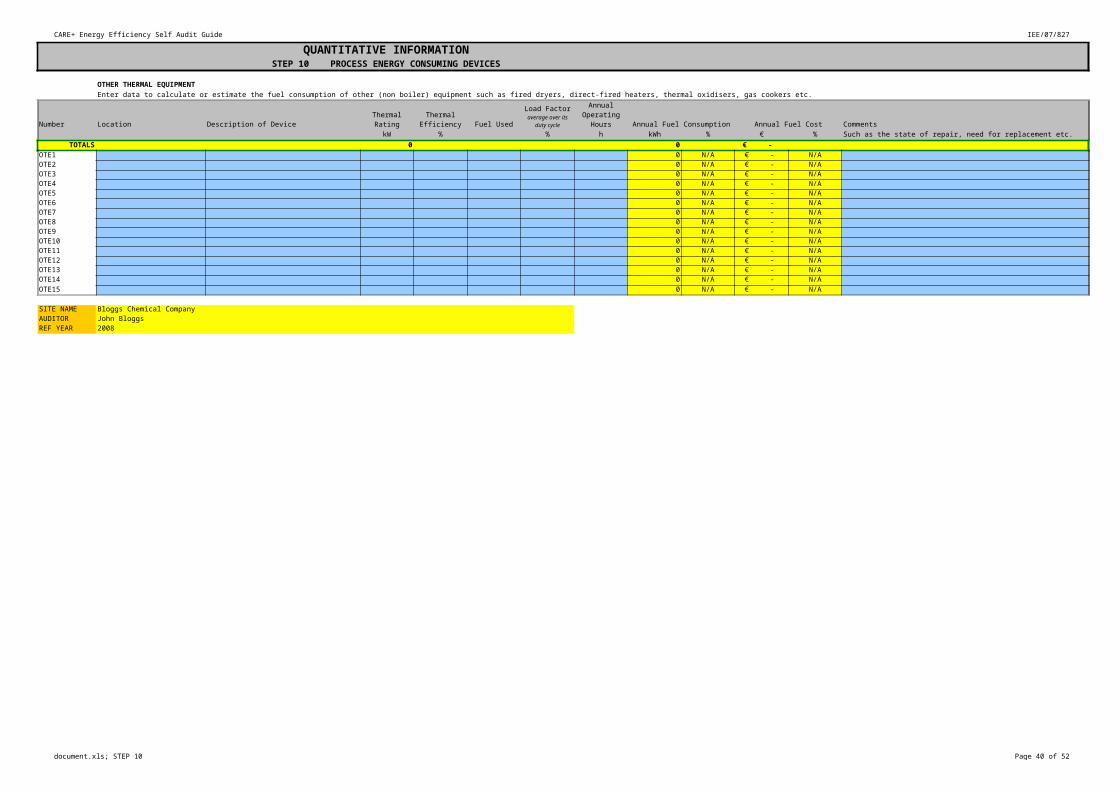
OTHER THERMAL EQUIPMENTEnter data to calculate or estimate the fuel consumption of other (non boiler) equipment such as fired dryers, direct-fired heaters, thermal oxidisers, gas cookers etc.
Number Location Description of Device Fuel Used Annual Fuel Consumption Annual Fuel Cost CommentskW % % h kWh % € % Such as the state of repair, need for replacement etc.
TOTALS 0 0 € - OTE1 0 N/A € - N/AOTE2 0 N/A € - N/AOTE3 0 N/A € - N/AOTE4 0 N/A € - N/AOTE5 0 N/A € - N/AOTE6 0 N/A € - N/AOTE7 0 N/A € - N/AOTE8 0 N/A € - N/AOTE9 0 N/A € - N/AOTE10 0 N/A € - N/AOTE11 0 N/A € - N/AOTE12 0 N/A € - N/AOTE13 0 N/A € - N/AOTE14 0 N/A € - N/AOTE15 0 N/A € - N/A
SITE NAME Bloggs Chemical CompanyAUDITOR John BloggsREF YEAR 2008
Thermal Rating
Thermal Efficiency
Load Factoraverage over its
duty cycle
Annual Operating
Hours
CARE+ Energy Efficiency Self Audit Guide IEE/07/827
document.xls; STEP 11 Page 33 of 43
QUANTITATIVE INFORMATIONSTEP 11 BUILDINGS ENERGY USE
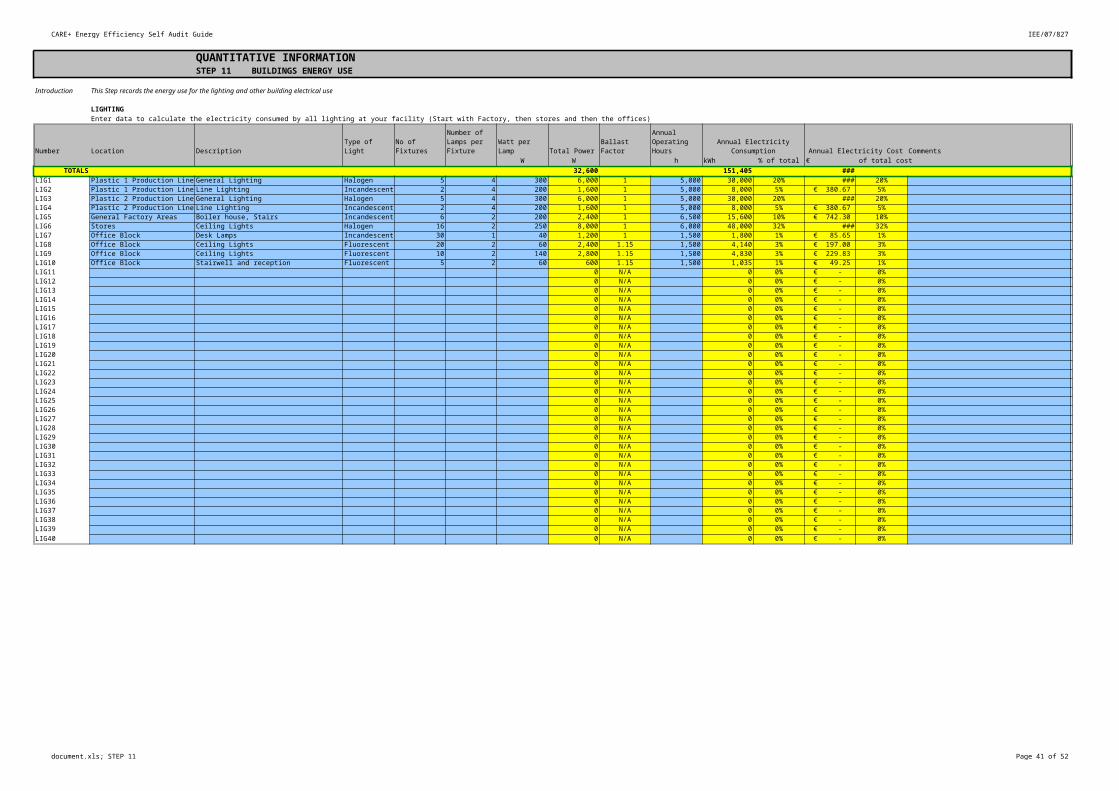
Introduction This Step records the energy use for the lighting and other building electrical use
LIGHTINGEnter data to calculate the electricity consumed by all lighting at your facility (Start with Factory, then stores and then the offices)
Number Location Description Type of Light No of Fixtures Watt per Lamp Total Power Ballast Factor Annual Electricity Cost CommentsW W h kWh % of total € % of total cost
TOTALS 32,600 151,405 € 7,204.35 LIG1 Plastic 1 Production Line General Lighting Halogen 5 4 300 6,000 1 5,000 30,000 20% € 1,427.50 20%LIG2 Plastic 1 Production Line Line Lighting Incandescent 2 4 200 1,600 1 5,000 8,000 5% € 380.67 5%LIG3 Plastic 2 Production Line General Lighting Halogen 5 4 300 6,000 1 5,000 30,000 20% € 1,427.50 20%LIG4 Plastic 2 Production Line Line Lighting Incandescent 2 4 200 1,600 1 5,000 8,000 5% € 380.67 5%LIG5 General Factory Areas Boiler house, Stairs Incandescent 6 2 200 2,400 1 6,500 15,600 10% € 742.30 10%LIG6 Stores Ceiling Lights Halogen 16 2 250 8,000 1 6,000 48,000 32% € 2,284.00 32%LIG7 Office Block Desk Lamps Incandescent 30 1 40 1,200 1 1,500 1,800 1% € 85.65 1%LIG8 Office Block Ceiling Lights Fluorescent 20 2 60 2,400 1.15 1,500 4,140 3% € 197.00 3%LIG9 Office Block Ceiling Lights Fluorescent 10 2 140 2,800 1.15 1,500 4,830 3% € 229.83 3%LIG10 Office Block Stairwell and reception Fluorescent 5 2 60 600 1.15 1,500 1,035 1% € 49.25 1%LIG11 0 N/A 0 0% € - 0%LIG12 0 N/A 0 0% € - 0%LIG13 0 N/A 0 0% € - 0%LIG14 0 N/A 0 0% € - 0%LIG15 0 N/A 0 0% € - 0%LIG16 0 N/A 0 0% € - 0%LIG17 0 N/A 0 0% € - 0%LIG18 0 N/A 0 0% € - 0%LIG19 0 N/A 0 0% € - 0%LIG20 0 N/A 0 0% € - 0%LIG21 0 N/A 0 0% € - 0%LIG22 0 N/A 0 0% € - 0%LIG23 0 N/A 0 0% € - 0%LIG24 0 N/A 0 0% € - 0%LIG25 0 N/A 0 0% € - 0%LIG26 0 N/A 0 0% € - 0%LIG27 0 N/A 0 0% € - 0%LIG28 0 N/A 0 0% € - 0%LIG29 0 N/A 0 0% € - 0%LIG30 0 N/A 0 0% € - 0%LIG31 0 N/A 0 0% € - 0%LIG32 0 N/A 0 0% € - 0%LIG33 0 N/A 0 0% € - 0%LIG34 0 N/A 0 0% € - 0%LIG35 0 N/A 0 0% € - 0%LIG36 0 N/A 0 0% € - 0%LIG37 0 N/A 0 0% € - 0%LIG38 0 N/A 0 0% € - 0%LIG39 0 N/A 0 0% € - 0%LIG40 0 N/A 0 0% € - 0%
Number of Lamps per Fixture
Annual Operating Hours
Annual Electricity Consumption
CARE+ Energy Efficiency Self Audit Guide IEE/07/827
document.xls; STEP 11 Page 34 of 43
QUANTITATIVE INFORMATIONSTEP 11 BUILDINGS ENERGY USE
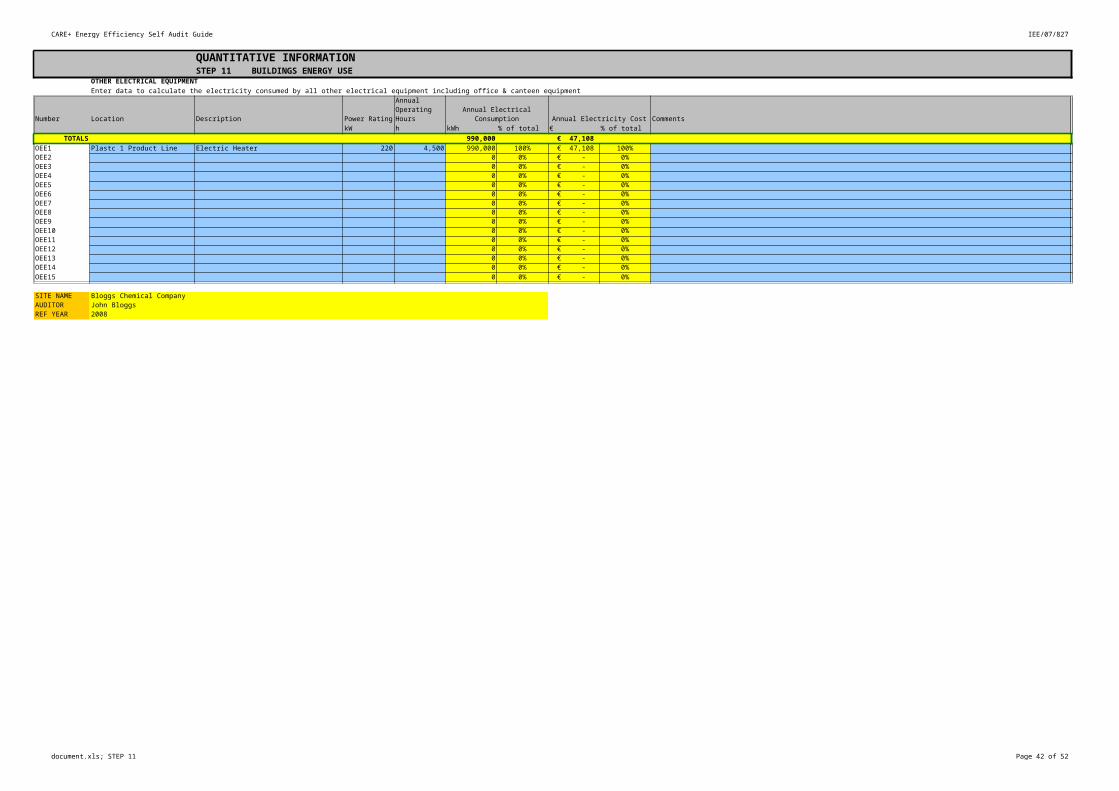
OTHER ELECTRICAL EQUIPMENTEnter data to calculate the electricity consumed by all other electrical equipment including office & canteen equipment
Number Location Description Power Rating Annual Electrical Consumption Annual Electricity Cost CommentskW h kWh % of total € % of total
TOTALS 990,000 € 47,108 OEE1 Plastc 1 Product Line Electric Heater 220 4,500 990,000 100% € 47,108 100%OEE2 0 0% € - 0%OEE3 0 0% € - 0%OEE4 0 0% € - 0%OEE5 0 0% € - 0%OEE6 0 0% € - 0%OEE7 0 0% € - 0%OEE8 0 0% € - 0%OEE9 0 0% € - 0%OEE10 0 0% € - 0%OEE11 0 0% € - 0%OEE12 0 0% € - 0%OEE13 0 0% € - 0%OEE14 0 0% € - 0%OEE15 0 0% € - 0%
SITE NAME Bloggs Chemical CompanyAUDITOR John BloggsREF YEAR 2008
Annual Operating Hours
CARE+ Energy Efficiency Self Audit Guide IEE/07/827
document.xls; STEP 12 Page 35 of 43
ANALYSIS AND EVALUATIONSTEP 12 MAIN INDICATORS
Introduction
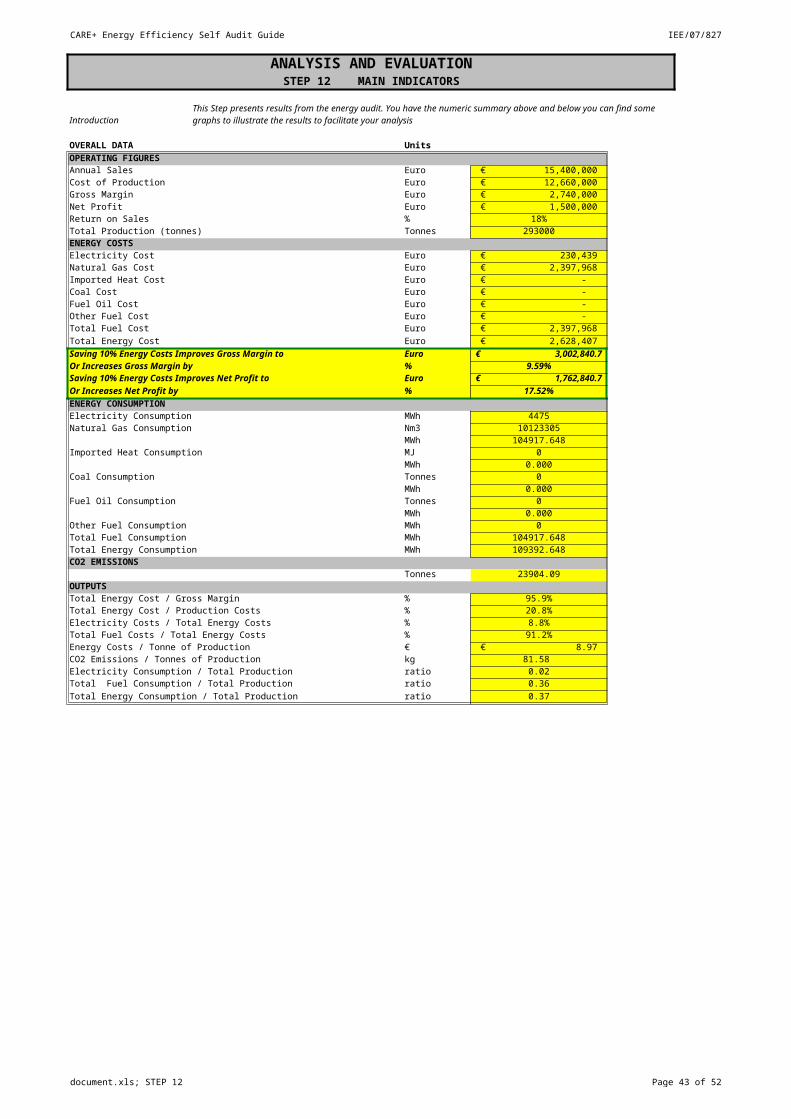
OVERALL DATA UnitsOPERATING FIGURESAnnual Sales Euro € 15,400,000 Cost of Production Euro € 12,660,000 Gross Margin Euro € 2,740,000 Net Profit Euro € 1,500,000 Return on Sales % 18%Total Production (tonnes) Tonnes 293000ENERGY COSTSElectricity Cost Euro € 230,439 Natural Gas Cost Euro € 2,397,968 Imported Heat Cost Euro € - Coal Cost Euro € - Fuel Oil Cost Euro € - Other Fuel Cost Euro € - Total Fuel Cost Euro € 2,397,968 Total Energy Cost Euro € 2,628,407 Saving 10% Energy Costs Improves Gross Margin to Euro € 3,002,840.7 Or Increases Gross Margin by % 9.59%Saving 10% Energy Costs Improves Net Profit to Euro € 1,762,840.7 Or Increases Net Profit by % 17.52%ENERGY CONSUMPTIONElectricity Consumption MWh 4475Natural Gas Consumption Nm3 10123305
MWh 104917.648Imported Heat Consumption MJ 0
MWh 0.000Coal Consumption Tonnes 0
MWh 0.000Fuel Oil Consumption Tonnes 0
MWh 0.000Other Fuel Consumption MWh 0Total Fuel Consumption MWh 104917.648Total Energy Consumption MWh 109392.648CO2 EMISSIONS
Tonnes 23904.09OUTPUTSTotal Energy Cost / Gross Margin % 95.9%Total Energy Cost / Production Costs % 20.8%Electricity Costs / Total Energy Costs % 8.8%Total Fuel Costs / Total Energy Costs % 91.2%Energy Costs / Tonne of Production € € 8.97 CO2 Emissions / Tonnes of Production kg 81.58 Electricity Consumption / Total Production ratio 0.02Total Fuel Consumption / Total Production ratio 0.36Total Energy Consumption / Total Production ratio 0.37
This Step presents results from the energy audit. You have the numeric summary above and below you can find some graphs to illustrate the results to facilitate your analysis
CARE+ Energy Efficiency Self Audit Guide IEE/07/827
document.xls; STEP 12 Page 36 of 43
ANALYSIS AND EVALUATIONSTEP 12 MAIN INDICATORS
PROCESS DATAPRODUCT Units Plastic 1 Plastic 2 None Remainder TotalProduction Volume Tonnes 190,500 102,500 0 0 293,000Total Production Cost € € 8,285,000 € 4,375,000 € - € - € 12,660,000 Sales Value € € 10,780,485 € 4,618,650 € - € - € 15,399,135 Primary Energy Consumption MWh 66,605 45,544 0 0 112,149Energy Cost € € 1,498,852 € 1,026,240 € - € - € 2,525,092 OUTPUTSEnergy Consumption/Tonne of Production MWh/t 0.35 0.44 0.00 0.00 0.38Energy Cost/Tonne of Production €/t € 7.87 € 10.01 € - € - € 8.62 Energy Cost/Total Production Cost % 18.09% 23.46% 0.00% 0.00% 19.95%Energy Cost/Sales Value % 13.90% 22.22% 0.00% 0.00% 16.40%
% 1.39% 2.22% 0.00% 0.00% 1.64%
€/t € 7.1 € 9.0 € - € - € 7.8
ENERGY CONSUMPTION DATAENERGY CONSUMING TECHNOLOGY
Primary Energy Consumption Energy Costs
MWh MWh % of Total € % of TotalSteam CHP and Boilers 104,676.12 104,676.12 91.13% € 2,365,083 91.54%Hot Water CHP and Boilers 241.48 241.48 0.21% € 5,456 0.21%Air Compressors 290.63 645.83 0.56% € 13,829 0.54%Motors and Drives 1,636.13 3635.83 3.17% € 77,852 3.01%Refrigeration 573.70 1274.89 1.11% € 27,299 1.06%Heating Ventilation and Air Conditioning 836.55 1859.00 1.62% € 39,806 1.54%Other Thermal Equipment 0.00 0.00 0.00% € - 0.00%Lighting 151.41 336.46 0.29% € 7,204 0.28%Other Electrical Equipment 990.00 2200.00 1.92% € 47,108 1.82%Total 109,396.00 114,869.61 100.00% € 2,583,637 100.00%
SITE NAME Bloggs Chemical CompanyAUDITOR John BloggsREF YEAR 2008
10% Improvement in Energy Cost Increases Sales Value
10% Improvement in Energy Cost Decrease Energy Cost/Tonnes of Production to
Delivered Energy
Consumption
CARE+ Energy Efficiency Self Audit Guide IEE/07/827
document.xls; STEP 12 Page 37 of 43
ANALYSIS AND EVALUATIONSTEP 12 MAIN INDICATORS
91.13%
0.21%0.56%3.17%
1.11%1.62%0.29%1.92%
Overview of Energy Consumption by Technology
Steam CHP and Boilers Hot Water CHP and Boilers Air Compressors Motors and Drives Refrigeration
Heating Ventilation and Air Conditioning Other Thermal Equipment Lighting Other Electrical Equipment
91.54%
0.21%0.54%
3.01%1.06% 1.54% 0.28% 1.82%
Overview of Energy Costs by Technology
Steam CHP and Boilers Hot Water CHP and Boilers Air Compressors Motors and Drives
Refrigeration Heating Ventilation and Air Conditioning Other Thermal Equipment Lighting
Other Electrical Equipment
CARE+ Energy Efficiency Self Audit Guide IEE/07/827
document.xls; STEP 13 Page 38 of 43
ANALYSIS AND EVALUATIONSTEP 13 ENERGY ANALYSIS
Introduction
ORGANISATIONStrengths Site is well run
Weaknesses No organisation on energy issues
Set up and energy management programme
GENERAL SITEStrengths Tidy site, good basic maintenance
Weaknesses
Installed heat meters, controls on lights and heaters
SPECIFIC PRODUCTION LINESStrengths Plastic 1 line is in very good condition
Weaknesses Plastic 2 line needs investment, energy per tonne of product is too high
Upgrade Plastic 2 production line
ENERGY TRANSFORMATION PROCESSESStrengths Good maintainance
Weaknesses Old Boilers
Replace the two steam boilers
SITE NAME Bloggs Chemical CompanyAUDITOR John BloggsREF YEAR 2008
This Step allows you to do a first brainstorming on the results of the energy audit , identifying strengths and weaknesses, areas for improvement and already think of possible energy efficiency measures. You will build on this excercise in the next Steps.
Suggestions For Improvement
No control of energy, lights and heaters left on when not needed, no monitoring/measurement of steam flows
Suggestions For Improvement
Suggestions For Improvement
Suggestions For Improvement
CARE+ Energy Efficiency Self Audit Guide IEE/07/827
document.xls; STEP 14 Page 39 of 43
ANALYSIS AND EVALUATIONSTEP 14 ENERGY SAVINGS OPTIONS
Priority Level 1 = Payback periods of less than 2 years or for business improvement (such as improved product quality) with paybacks up to 5 years = must do with current year
Priority Level 2 = Longer paybacks or larger investments = must do in next three years
Priority Level 3
Number Measure Brief Description Area of Site Technical Requirements
TotalsSAG 1 Light sensors in Storage area Install activity sensors StoresSAG 2 Meters on Steam Production Boiler output meters and main consumers metering FactorySAG 3 Improved maintenance of steam traps Factory None just trainingSAG 4 Upgrade insulation on steam pipes Replace bad areas of insulation FactorySAG 5 Replace Boilers New gas boilers Factory Large investmentSAG 6SAG 7SAG 8SAG 9SAG 10SAG 11SAG 12SAG 13SAG 14SAG 15SAG 16SAG 17SAG 18SAG 19SAG 20SAG 21SAG 22SAG 23SAG 24SAG 25SAG 26SAG 27SAG 28SAG 29SAG 30
SITE NAME Bloggs Chemical Company
Introduction
Please fill as many rows as you need
This Step lists all the energy saving opportunities found during the audit. It should include no cost measures as well as those with investment needs. The auditor should use the Best Practices for inspiration, as well as the analysis of strengthes and weakneses in the prior Step 13.
You should indicate which measures are a prioirity to implement and these then need to be transferred to Step 15. It is suggested to transfer all Priority Level 1 measures to Step 15. You can prioritise according to payback period, improvement in the product quality:reduction of wastage, technical feasibility or a combination of these topics. It is up to you to chose the prioritisation that fits best your needs. Below you can find a proposal for a prioritisation approach.You may use other financial appraisal methods such as rate of return and net present value, please refer to the Best Practices.
= Longer paybacks, large investments and long term business change issues = longer term measure
CARE+ Energy Efficiency Self Audit Guide IEE/07/827
document.xls; STEP 14 Page 40 of 43
ANALYSIS AND EVALUATIONSTEP 14 ENERGY SAVINGS OPTIONS
AUDITOR John BloggsREF YEAR 2008
CARE+ Energy Efficiency Self Audit Guide IEE/07/827
document.xls; STEP 14 Page 41 of 43
Priority Level 1
Priority Level 2
Priority Level 3
Number
SAG 1SAG 2SAG 3SAG 4SAG 5SAG 6SAG 7SAG 8SAG 9SAG 10SAG 11SAG 12SAG 13SAG 14SAG 15SAG 16SAG 17SAG 18SAG 19SAG 20SAG 21SAG 22SAG 23SAG 24SAG 25SAG 26SAG 27SAG 28SAG 29SAG 30
SITE NAME
Introduction
Please fill as many rows as you need
ANALYSIS AND EVALUATIONSTEP 14 ENERGY SAVINGS OPTIONS
10 1750000 0 0 0 0 18146.95 3653.61 € 410,268 € 55,000 € 1,035,550 1.19 15.61%10 10.00 6.27 € 476 € 550 1.16 0.02% 1
250000 2590.99 521.05 € 58,542 € 5,000 € 20,000 0.31 2.23% 1500000 5181.99 1042.10 € 117,083 € - 0.00 4.45% 1100000 1036.40 208.42 € 23,417 € 15,000 0.64 0.89% 1900000 9327.57 1875.78 € 210,750 € 50,000 € 1,000,000 3.84 8.02% 2
0.00 0.00 € - N/A 0.00%0.00 0.00 € - N/A 0.00%0.00 0.00 € - N/A 0.00%0.00 0.00 € - N/A 0.00%0.00 0.00 € - N/A 0.00%0.00 0.00 € - N/A 0.00%0.00 0.00 € - N/A 0.00%0.00 0.00 € - N/A 0.00%0.00 0.00 € - N/A 0.00%0.00 0.00 € - N/A 0.00%0.00 0.00 € - N/A 0.00%0.00 0.00 € - N/A 0.00%0.00 0.00 € - N/A 0.00%0.00 0.00 € - N/A 0.00%0.00 0.00 € - N/A 0.00%0.00 0.00 € - N/A 0.00%0.00 0.00 € - N/A 0.00%0.00 0.00 € - N/A 0.00%0.00 0.00 € - N/A 0.00%0.00 0.00 € - N/A 0.00%0.00 0.00 € - N/A 0.00%0.00 0.00 € - N/A 0.00%0.00 0.00 € - N/A 0.00%0.00 0.00 € - N/A 0.00%0.00 0.00 € - N/A 0.00%
Bloggs Chemical Company
Electricity Savings (MWh)
Natural Gas Savings (Nm3)
Imported Heat Savings (MJ)
Coal Savings (Tonnes)
Fuel Oil Savings (Tonnes)
Other Fuel Savings (MWh)
Total Energy Savings (MWh)
Total CO2 Savings (Tonnes)
Energy Cost Savings (€)
Other Costs Savings (€)
Investment Cost (€)
Payback Period (years)
Impact on Site Energy Costs (%)
Priority Level (1, 2, 3)
CARE+ Energy Efficiency Self Audit Guide IEE/07/827
document.xls; STEP 14 Page 42 of 43
AUDITORREF YEAR
ANALYSIS AND EVALUATIONSTEP 14 ENERGY SAVINGS OPTIONS
John Bloggs2008
CARE+ Energy Efficiency Self Audit Guide IEE/07/827
document.xls; STEP 15 Page 43 of 43
ANALYSIS AND EVALUATIONSTEP 15 RECOMMENDATIONS FOR IMPLEMENTATION
Introduction 13.63%
Number Measure
Totals 8,819.38 1,777.83 € 199,518 € 5,000 € 35,550 0.53 7.59% 7.46%SAG 1 Light sensors in Storage area 10.00 6.27 € 476 € 550 1.16 0.02% 0.02%SAG 2 Meters on Steam Production 2,590.99 521.05 € 58,542 € 5,000 € 20,000 0.31 2.23% 2.32%SAG 3 Improved maintenance of steam traps 5,181.99 1,042.10 € 117,083 € - 0.00 4.45% 4.27%SAG 4 Upgrade insulation on steam pipes 1,036.40 208.42 € 23,417 € 15,000 0.64 0.89% 0.85%
N/A 0.00% 0.00%N/A 0.00% 0.00%N/A 0.00% 0.00%N/A 0.00% 0.00%N/A 0.00% 0.00%N/A 0.00% 0.00%N/A 0.00% 0.00%N/A 0.00% 0.00%N/A 0.00% 0.00%N/A 0.00% 0.00%N/A 0.00% 0.00%N/A 0.00% 0.00%N/A 0.00% 0.00%N/A 0.00% 0.00%N/A 0.00% 0.00%N/A 0.00% 0.00%N/A 0.00% 0.00%N/A 0.00% 0.00%
SITE NAME Bloggs Chemical CompanyAUDITOR John BloggsREF YEAR 2008
You should transfer all the measures with Priority Level 1 in Step 14 to this Step. This then becomes your recommendations to your senior management for implementation of energy savings measures as a result of this energy audit. The sheet also gives you the overall results of all your measures on your bottom line on the top right of your sheet.
Impact of Recommended Measures on Net Profit
Congratulations, you have succesfully completed the analyticl part of your Energy Efficiency Self Audit, you only need to prepare an short report and start implementing!
Energy Savings (MWh)
CO2 Savings (Tonnes)
Energy Cost Savings (€)
Other Cost Savings (€)
Investment Cost (€)
Payback Period (years)
Impact of Measure on Energy Costs (%)
Impact of Measure on Gross Margin (%)