2009-10 dairy situation and outlook - aaea · 2009-10 dairy situation and outlook ... argentina +6%...
TRANSCRIPT
2009-10 Dairy Situation and OutlookChristopher WolfMichigan State University
July 28, 2009
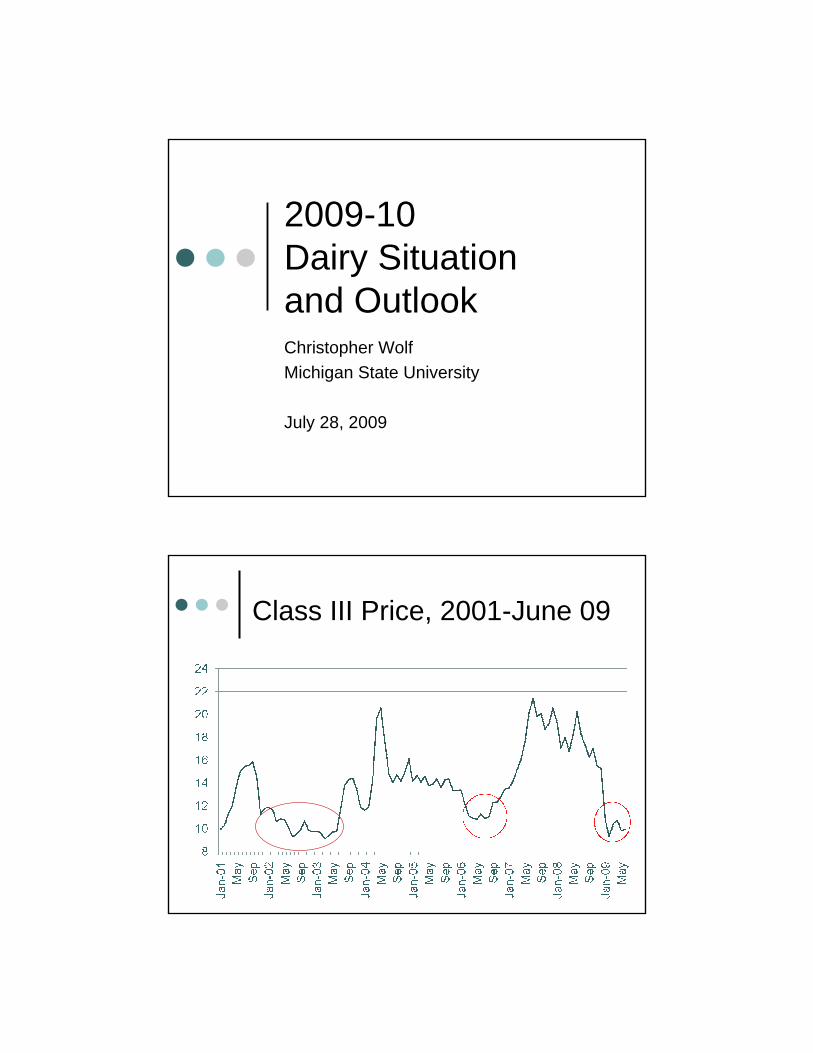
Class III Price, 2001-June 09

Michigan 2001-2008Year 2001 2002 2003 2004 2005 2006 2007 2008
ROA(percent)
7.6 3.2 4.3 7.7 6.3 5.5 11.3 6.2
Milk Price($/cwt)
15.23 12.47 12.59 16.42 15.70 13.44 20.21 19.43
PurchasedFeed ($/cwt)
3.95 3.45 3.56 4.36 4.06 3.74 5.32 5.62
Total FeedCost ($/cwt)
6.75 7.01 7.18 7.47 8.14 8.29 9.55 12.74
IOFC $/cwt) 8.48 5.46 5.41 8.95 7.56 5.15 10.66 6.69
US Milk-to-Feed Price Ratio

Source:www.future.aae.wisc.edu
Source:www.future.aae.wisc.edu

Global Production
EU higher than expected
New Zealand +2%; Australia flat
Argentina +6%
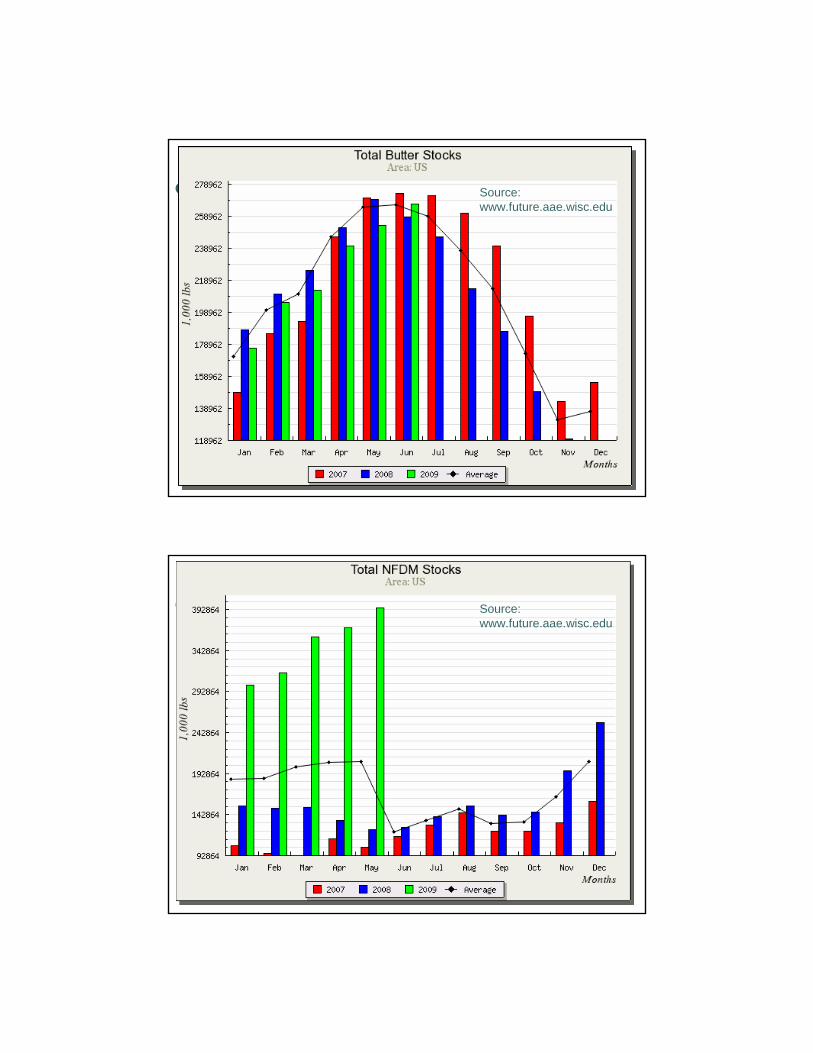
Source:www.future.aae.wisc.edu

Precipitous Export DeclineJanuary-May 09 vs 08
Cheese: -30% (39 mil lbs)
NDM: -53% (220 mil lbs)
Butter: -82% (100 mil lbs)
Source:www.future.aae.wisc.edu
Source:www.future.aae.wisc.edu
Source:www.future.aae.wisc.edu

US Milk Production
Ratio of heifers/milk cows

How many cows to get to break-even?
Beginning of 2009 consensus was 250,000-400,000 cows
US herd down 99,000 cows thru June
CWT 2009 Retirement 1: 101,000 cows ; 1.96 billion lbs
CWT 2009 Retirement 2: Bidding ended July 24
Milk Cow Price

Herd Size and CWT Herd Buyouts
8,800
8,900
9,000
9,100
9,200
9,300
9,400Ja
n-01 Ju
l
Jan-
02 Jul
Jan-
03 Jul
Jan-
04 Jul
Jan-
05 Jul
Jan-
06 Jul
Jan-
07 Jul
Jan-
08 Jul
Jan-
09How many herds on the edge?
Many herds losing $4-6/cwt
Small herds helped more by MILC
Herds purchasing feed very stressed
A great deal of financial stress in West

Michigan 2001-2008Year 2001 2002 2003 2004 2005 2006 2007 2008
ROA(percent)
7.6 3.2 4.3 7.7 6.3 5.5 11.3 6.2
Milk Price($/cwt)
15.23 12.47 12.59 16.42 15.70 13.44 20.21 19.43
PurchasedFeed ($/cwt)
3.95 3.45 3.56 4.36 4.06 3.74 5.32 5.62
Total FeedCost ($/cwt)
6.75 7.01 7.18 7.47 8.14 8.29 9.55 12.74
IOFC $/cwt) 8.48 5.46 5.41 8.95 7.56 5.15 10.66 6.69
MI income items, 2002-082002 2003 2004 2005 2006 2007 2008 Avg.
Income Item $/cwt
Milk 12.50 12.59 16.42 15.70 13.44 20.21 19.43 15.76 Culls+Calves 0.75 0.88 1.01 0.89 0.80 1.98 0.86 1.02 Dairy Steers 0.16 0.42 0.42 0.41 0.51 0.40 0.55 0.41 Dairy Heifers 0.14 0.13 0.15 0.25 0.16 0.53 0.24 0.23 Gov’t. Pay 1.34 1.51 0.71 1.22 0.93 0.46 0.41 0.94 Pat. Dividend 0.16 0.08 0.11 0.15 0.15 0.25 0.15 Crop sales 1.64 0.95 1.19 1.56 2.23 2.85 1.74 Other Income 0.31 0.55 1.07 0.68 0.55 0.71 0.40 0.61
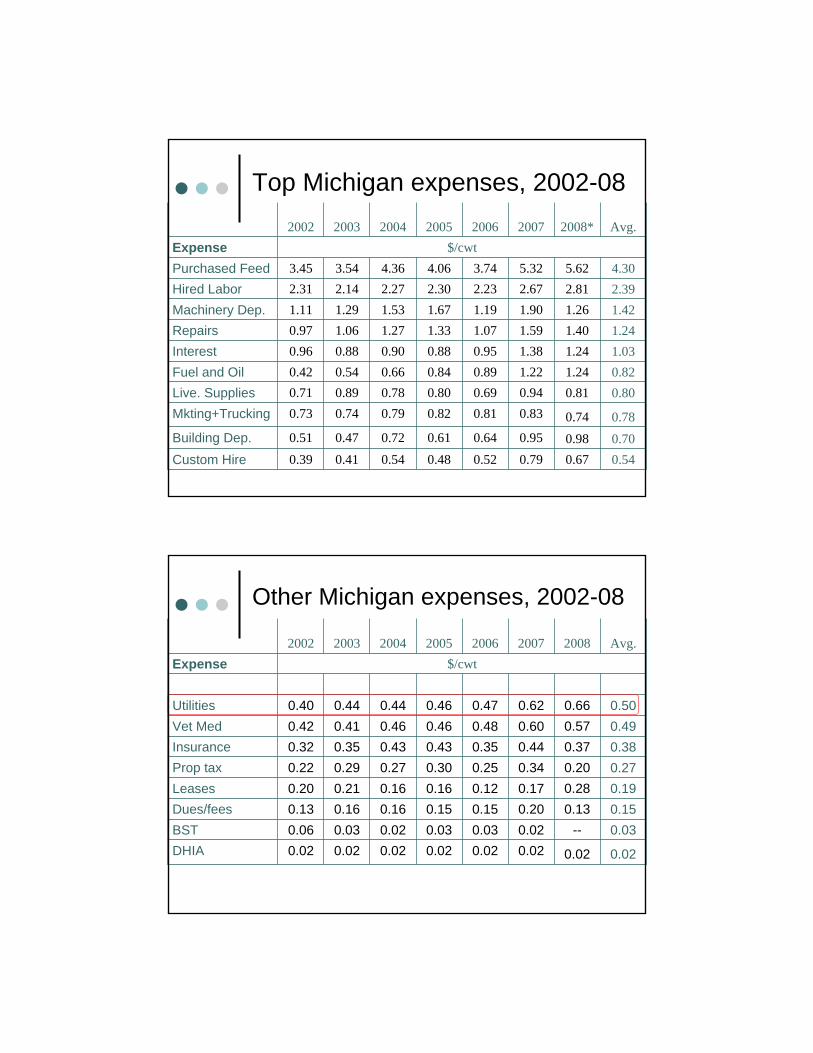
Top Michigan expenses, 2002-082002 2003 2004 2005 2006 2007 2008* Avg.
Expense $/cwtPurchased Feed 3.45 3.54 4.36 4.06 3.74 5.32 5.62 4.30 Hired Labor 2.31 2.14 2.27 2.30 2.23 2.67 2.81 2.39 Machinery Dep. 1.11 1.29 1.53 1.67 1.19 1.90 1.26 1.42 Repairs 0.97 1.06 1.27 1.33 1.07 1.59 1.40 1.24 Interest 0.96 0.88 0.90 0.88 0.95 1.38 1.24 1.03 Fuel and Oil 0.42 0.54 0.66 0.84 0.89 1.22 1.24 0.82 Live. Supplies 0.71 0.89 0.78 0.80 0.69 0.94 0.81 0.80 Mkting+Trucking 0.73 0.74 0.79 0.82 0.81 0.83 0.74 0.78 Building Dep. 0.51 0.47 0.72 0.61 0.64 0.95 0.98 0.70 Custom Hire 0.39 0.41 0.54 0.48 0.52 0.79 0.67 0.54
Other Michigan expenses, 2002-08
2002 2003 2004 2005 2006 2007 2008 Avg.Expense $/cwt
Utilities 0.40 0.44 0.44 0.46 0.47 0.62 0.66 0.50Vet Med 0.42 0.41 0.46 0.46 0.48 0.60 0.57 0.49Insurance 0.32 0.35 0.43 0.43 0.35 0.44 0.37 0.38Prop tax 0.22 0.29 0.27 0.30 0.25 0.34 0.20 0.27Leases 0.20 0.21 0.16 0.16 0.12 0.17 0.28 0.19Dues/fees 0.13 0.16 0.16 0.15 0.15 0.20 0.13 0.15BST 0.06 0.03 0.02 0.03 0.03 0.02 -- 0.03DHIA 0.02 0.02 0.02 0.02 0.02 0.02 0.02 0.02

MILC Payments
FY 2009 2010
Feb 1.51
Mar 2.01
Apr 1.59
May 1.47
Jun 1.62*
Jul 1.54*
Aug 1.64*
MILC payments
3.5-4.0 percent of dairy revenue for 200 cow herd in 2002 and 2003
2.985 million pounds ~ 150 cows
1,000 cow dairy uses up payment in less than 2 months
FAPRI estimates herds >300 cows lose while smaller herds win

Size distribution
Outlook
BullishCWT herd buyoutUpcoming holiday ordersCA production down
BearishLarge cheese inventoryCool summerExports unlikely to pick up with weak global economy
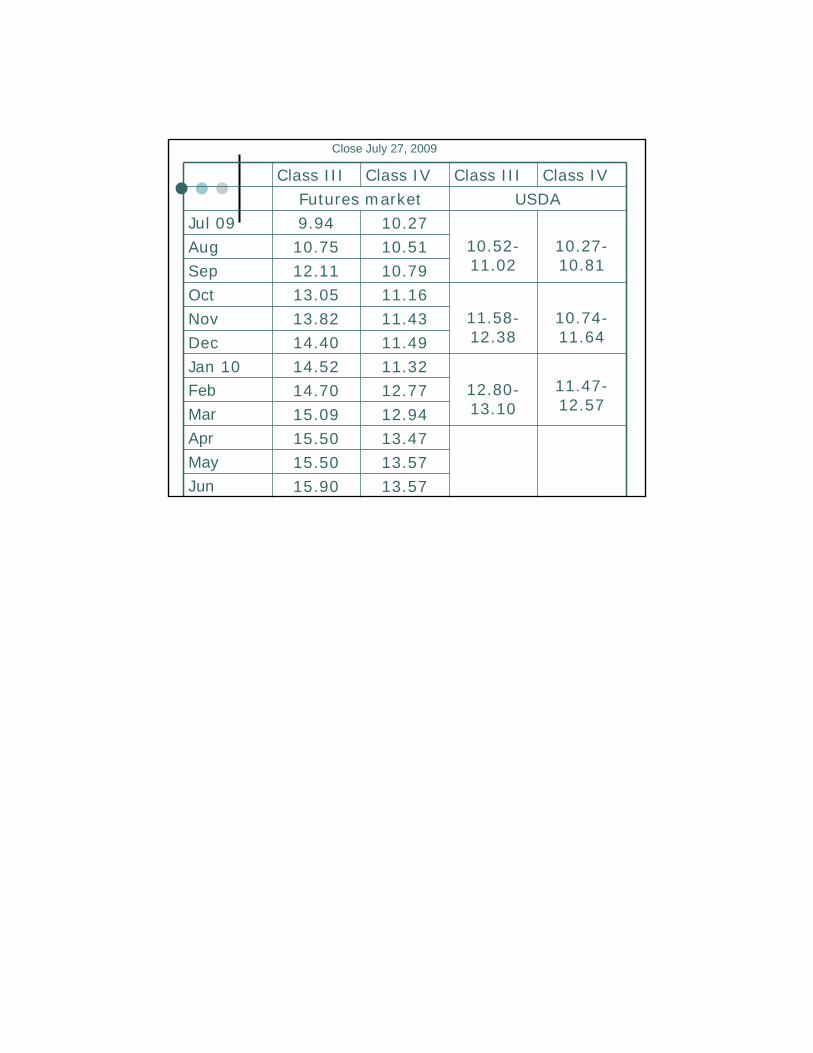
Class III Class IV Class III Class IVFutures market USDA
Jul 09 9.94 10.2710.52-11.02
10.27-10.81
Aug 10.75 10.51Sep 12.11 10.79Oct 13.05 11.16
11.58-12.38
10.74-11.64
Nov 13.82 11.43Dec 14.40 11.49Jan 10 14.52 11.32
12.80-13.10
11.47-12.57
Feb 14.70 12.77Mar 15.09 12.94Apr 15.50 13.47May 15.50 13.57Jun 15.90 13.57
Close July 27, 2009