2008 seminar for the appointed actuary colloque pour l’actuaire désigné 2008 2008 seminar for...
TRANSCRIPT

2008
Sem
inar
for
the
App
oint
ed A
ctua
ry
Col
loqu
e po
ur l’
actu
aire
dés
igné
200
8
2008
Sem
inar
for
the
App
oint
ed A
ctua
ry
Col
loqu
e po
ur l’
actu
aire
dés
igné
200
8
Speaker: Christopher J. Townsend
PD-10 (P&C) IFRS: Solvency

2008/09/26 PD-10 (P&C) IFRS:SolvencyPage 2
AgendaAgenda
• Highlights from PD-09 2007 AA Seminar
• Developments in last year• Canadian P&C Response• Future Plans
• Highlights from PD-09 2007 AA Seminar
• Developments in last year• Canadian P&C Response• Future Plans

2008/09/26 PD-10 (P&C) IFRS:SolvencyPage 3
Highlights from 2007Canadian Life Insurer Context
• Basel II, Solvency II • directly affects insurers’ competitors
• MCCSR Advisory Committee (MAC)– formed in 2006• OSFI, IGIF, CLHIA, CIA, individual companies
• CIA Solvency Framework Sub-Committee– of Risk Management and Capital Requirements
• Key Documents on OSFI and IGIF websites– Draft technical papers on CIA website

2008/09/26 PD-10 (P&C) IFRS:SolvencyPage 4
Initial CIA P&C Preparation
• Formed P&C Subcommittee of Risk Management and Capital Requirements Committee
• Mandate - To further the development of actuarial techniques in the area of risk management for property and casualty insurance and to provide guidance and standards to the actuarial profession with respect to work in this area. To develop appropriate measurement bases for risk and capital, and work with regulators and other stakeholders in the development of capital requirements. The sub-committee will liaise with the P&C Financial Reporting Committee to ensure alignment of philosophy and approach.
– Current Members - Grant Kelly(IBC), Eric Keen, Michel Dionne (chair), Nathalie Ouellet, Linda Goss, Bernard Dupont, Sylvain St. Georges, Ron Miller, Pierre Laurin, Ernest Segal

2008/09/26 PD-10 (P&C) IFRS:SolvencyPage 5
P&C Internal Economic Capital Survey
• Only six respondents have an approach in place
• Eight of remaining 32 are using stochastic modeling
• Five of the six existing models use an approach developed by parent/affiliate
• Stochastic Modeling is used for:
• Pricing/ratemaking, including large accounts
• Reinsurance and catastrophe modelling
• Economic capital is used for the above plus:
• Capital Management• Investment Strategy/Market
Risk Management

2008/09/26 PD-10 (P&C) IFRS:SolvencyPage 6
Two Companies then provided overviews of their models
• Type of Risks
1) Credit risk
2) Market risk
3) Business risk
4) Operational risk
5) Life risk (Non-applicable to P&C)
6) P&C risk
7) Morbidity risk (Non-applicable to P&C)
• Key Issues
1) Calibration1) Time horizon
2) Probability
3) Market values
4) VAR or TVAR
2) Aggregation – how to put the various risks together
3) Diversification – within risks, and between risks
4) Fungibility

2008/09/26 PD-10 (P&C) IFRS:SolvencyPage 7
Progress since September 2007
• IAIS papers, including “Guidance … on use of internal models for risk and capital …”
• Life MAC has made progress on– Interest rate risk– Report – Risk Assessment Models - 208061e
• IBC and OSFI exchanged formal letters
• P&C MCT Advisory Committee formed– First meeting July 9, 2008

2008/09/26 PD-10 (P&C) IFRS:SolvencyPage 8
P&C MCT Advisory Committee- OSFI Members
Michael Bean Director, Capital Division
Allan Brender Senior Director, Capital Division
Bernard Dupont Director, Capital Division (co-chair)
David Oakden Managing Director, Actuarial Division
Judith Roberge Senior Analyst, Capital Division
Mark WhiteSenior Director, Capital, Accounting and
Research Division

2008/09/26 PD-10 (P&C) IFRS:SolvencyPage 9
P&C MCT Advisory Committee- Industry Members
Claude Boivin Finance Investments Axa Canada
Michel Dionne VP and actuary, corporate ING Canada Inc.
James HarveyVice President, CFO & Corporate Secretary
Allstate Insurance Companies of Canada
Doug HoganSenior Vice President and CFO
Dominion of Canada General Insurance Company
Sharon Ludlow Senior VP & CFOSwiss Reinsurance Company Canada
Steve McManus Vice President, Finance Lombard Canada Ltd.
Andy Taylor Director of Finance Gore Mutual Insurance Company
Chris TownsendVP & Corporate Actuary (co-chair)
Aviva Canada Inc.
Chris WaltonAssistant Vice President (co-chair)
General Reinsurance Corporation

2008/09/26 PD-10 (P&C) IFRS:SolvencyPage 10
P&C MCT Advisory Committee- Other Members
Grant KellyDirector, Policy Development and Senior Economist
Insurance Bureau of Canada
Darrell Leadbetter Manager (Research) PACICC
Douglas McLeanDirector, Provincial Operations
Financial Institutions Commission
SylvainSt-
Georges
Analyste en normalisation actuarielle des institutions financières
Autorité des marchés financiers
2008/09/26 PD-10 (P&C) IFRS:SolvencyPage 11
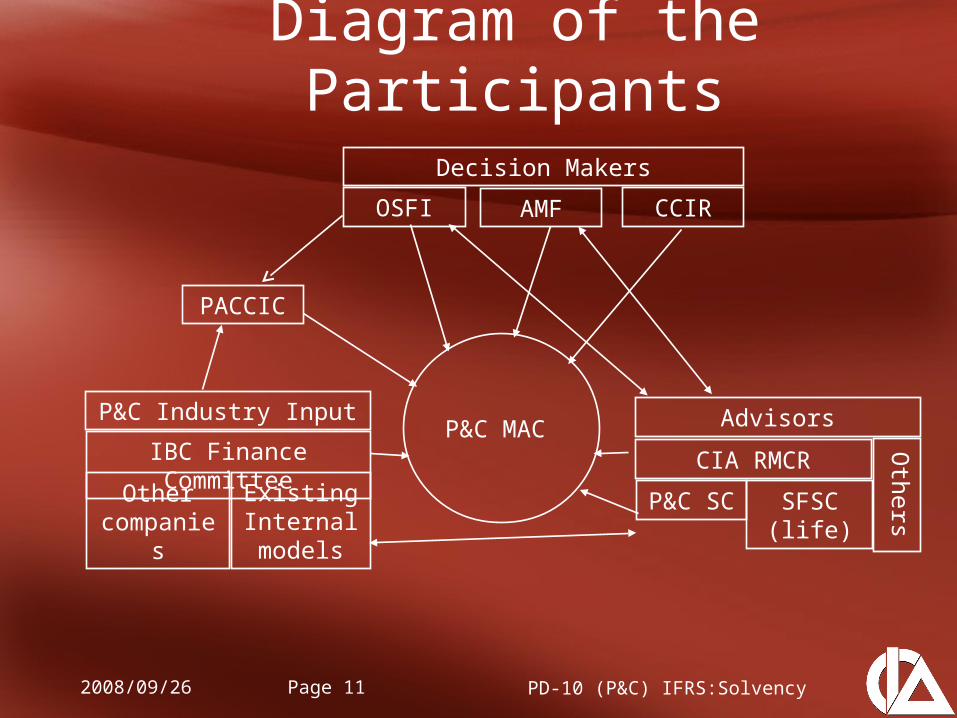
Diagram of the Participants
Decision Makers
OSFI AMF CCIR
P&C Industry Input
IBC Finance Committee
Other companies
Existing Internal models
PACCIC
Advisors
CIA RMCR
SFSC(life)
OthersP&C SC
P&C MAC

2008/09/26 PD-10 (P&C) IFRS:SolvencyPage 12
2nd P&C MCT Advisory Committee Meeting - Agenda
I. Minutes of last meetingII. Presentation on techniques for calculation of
insurance risk capital (Michel Dionne & Chris Townsend)
III. Revised mandate of P&C MCT Advisory CommitteeIV. Communication to the industryV. Draft project planVI. Key principlesVII. Solvency frameworkVIII. Other businessIX. Next meetings

2008/09/26 PD-10 (P&C) IFRS:SolvencyPage 13
2nd P&C MCT Advisory Committee Meeting - Content
• Handouts at Session• If agreed by P&C MAC
– Mandate– Project Plan– Key Principles– Solvency framework
• Presentation on Techniques (extracts)
• Appendix– Incurred Log
• Michel Dionne
– Bootstrap• Chris Townsend

2008
Sem
inar
for
the
App
oint
ed A
ctua
ry
Col
loqu
e po
ur l’
actu
aire
dés
igné
200
8
2008
Sem
inar
for
the
App
oint
ed A
ctua
ry
Col
loqu
e po
ur l’
actu
aire
dés
igné
200
8 Appendix 1Incurred log Method
With apologies and thanks to Michel Dionne

2008/09/26 PD-10 (P&C) IFRS:SolvencyPage 15
Overview of Hertig Method• Method do not use simulation
– Easily & rapidly implemented– Not computer intensive
• We obtain a distribution of results rather than a point (mean) estimate
• We still need to make assumptions on:– LOB correlation when aggregating reserves– Accident Year Correlation

2008/09/26 PD-10 (P&C) IFRS:SolvencyPage 16
Step 1: take a 10-by-10 triangle from past experience
INCURRED LOSS & ALAE12 24 36 48 60 72 84 96 108 120
1998 761,590 1,089,510 1,142,800 1,159,080 1,167,480 1,179,380 1,188,450 1,198,590 1,200,600 1,200,680 1999 784,590 1,093,740 1,157,860 1,192,850 1,219,390 1,249,710 1,255,350 1,255,670 1,255,960 2000 1,077,950 1,409,930 1,463,090 1,507,110 1,530,280 1,545,700 1,554,690 1,560,470 2001 1,065,310 1,436,220 1,488,880 1,536,200 1,563,200 1,575,900 1,575,100 2002 1,055,040 1,427,060 1,489,310 1,540,620 1,559,330 1,576,300 2003 1,654,920 2,068,020 2,127,940 2,184,890 2,222,940 2004 1,326,870 1,767,210 1,896,280 1,955,140 2005 1,875,230 2,340,640 2,436,930 2006 1,572,510 1,992,460 2007 1,902,050
last incurred 1,902,050 1,992,460 2,436,930 1,955,140 2,222,940 1,576,300 1,575,100 1,560,470 1,255,960 1,200,680

2008/09/26 PD-10 (P&C) IFRS:SolvencyPage 17
Step 2: compute the LDF
Sample Calculation:1.4306 = 1,089,510/761,590
LOSS DEVELOPMENT FACTORS12-24 24-36 36-48 48-60 60-72 72-84 84-96 96-108 108-120
1998 1.4306 1.0489 1.0142 1.0072 1.0102 1.0077 1.0085 1.0017 1.0001
1999 1.3940 1.0586 1.0302 1.0222 1.0249 1.0045 1.0003 1.00022000 1.3080 1.0377 1.0301 1.0154 1.0101 1.0058 1.00372001 1.3482 1.0367 1.0318 1.0176 1.0081 0.99952002 1.3526 1.0436 1.0345 1.0121 1.01092003 1.2496 1.0290 1.0268 1.01742004 1.3319 1.0730 1.03102005 1.2482 1.04112006 1.26712007

2008/09/26 PD-10 (P&C) IFRS:SolvencyPage 18
Step 3: compute LN(LDF)
Sample Calculation:0.3581 = ln(1.4306)
natural logarithm (LDF)12-24 24-36 36-48 48-60 60-72 72-84 84-96 96-108 108-120
1998 0.3581 0.0478 0.0141 0.0072 0.0101 0.0077 0.0085 0.0017 0.0001
1999 0.3322 0.0570 0.0298 0.0220 0.0246 0.0045 0.0003 0.00022000 0.2685 0.0370 0.0296 0.0153 0.0100 0.0058 0.00372001 0.2987 0.0360 0.0313 0.0174 0.0081 -0.00052002 0.3020 0.0427 0.0339 0.0121 0.01082003 0.2228 0.0286 0.0264 0.01732004 0.2866 0.0705 0.03062005 0.2217 0.04032006 0.23672007

2008/09/26 PD-10 (P&C) IFRS:SolvencyPage 19
Step 4: compute the means and variances for each development period (assume Normal
distribution) and to ultimate
Sample Calculation:0.00415 = (0.0085 + 0.0003 + 0.0037)/30.00517 = = (0.00102 + 0.00415)0.00018 = Variance {0.0478, 0.0570, ..., 0.0403}0.00037 = 2 = 0.00018 x ((nb + 1)/nb) + 0.00017, nb = 8
12-24 24-36 36-48 48-60 60-72 72-84 84-96 96-108 108-120
mean 0.28082 0.04498 0.02796 0.01521 0.01273 0.00436 0.00415 0.00095 0.00007cumulative mean () 0.39122 0.11041 0.06543 0.03747 0.02227 0.00954 0.00517 0.00102 0.00007
variance 0.00230 0.00018 0.00004 0.00003 0.00004 0.00001 0.00002 0.00000cumulative variance (^2) 0.00292 0.00037 0.00017 0.00012 0.00009 0.00004 0.00002 0.00000 0.00000

2008/09/26 PD-10 (P&C) IFRS:SolvencyPage 20
Step 5: compute the distributional means and variances (assume
Lognormal)
Sample Calculation:1.11694 = exp(0.11041 + 0.00037/2) i.e. Dist. Mean = 0.00046 = 1.11694^2 x (exp(0.00037)-1)i.e. Dist. Var. =
12-24 24-36 36-48 48-60 60-72 72-84 84-96 96-108 108-120
dist mean 1.48095 1.11694 1.06771 1.03825 1.02256 1.00960 1.00520 1.00102 1.00007dist variance 0.00642 0.00046 0.00020 0.00013 0.00010 0.00004 0.00002 0.00000 0.00000
2
2
e
1.22 eMeanDist

2008/09/26 PD-10 (P&C) IFRS:SolvencyPage 21
Step 6: project the ultimate incurred
Sample Calculation:1.0676 = exp(0.0654)2,601,712 = 2,436,930 x 1.0676164,782 = 2,601,712 – 2,436,930
AY last incurred proj. factor ult losses req reserve1998 1,200,680 1.0000 1,200,680 - 1999 1,255,960 1.0001 1,256,044 84 2000 1,560,470 1.0010 1,562,062 1,592 2001 1,575,100 1.0052 1,583,270 8,170 2002 1,576,300 1.0096 1,591,406 15,106 2003 2,222,940 1.0225 2,272,992 50,052 2004 1,955,140 1.0382 2,029,796 74,656 2005 2,436,930 1.0676 2,601,712 164,782
2006 1,992,460 1.1167 2,225,044 232,584 this is the mean estimate2007 1,902,050 1.4788 2,812,729 910,679 = 50th percentile
Total 1,457,706

2008/09/26 PD-10 (P&C) IFRS:SolvencyPage 22
Step 7: Compute PfAD at various percentile using inverse std normal
Sample Calculation:70,541 = 1,992,460 x 1.645 x (0.00046)^0.5i.e. 272,181 = sqrt{(250,665)^2 +…+ (3,215)^2} (assume independence in AY)Total reserve @ 95th = 1,729,887 = 1,457,706 + 272,181
Z PfAD 12-24 24-36 36-48 48-60 60-72 72-84 84-96 96-108 total reserve0.50 (0) 0 0 0 0 0 0 0 0 1,457,706 0.51 4,148 3,820 1,075 854 566 551 251 196 49 1,461,854 0.66 68,252 62,857 17,689 14,057 9,306 9,062 4,135 3,226 806 1,525,958 0.75 111,611 102,788 28,926 22,987 15,217 14,819 6,762 5,275 1,318 1,569,317 0.95 272,181 250,665 70,541 56,059 37,109 36,140 16,490 12,864 3,215 1,729,887 0.99 384,951 354,521 99,768 79,285 52,485 51,113 23,323 18,194 4,546 1,842,657
..1.).( VarDistZincurredlastPfAD percentileperdev

2008/09/26 PD-10 (P&C) IFRS:SolvencyPage 23
Step 8: Summarize the resultsOutstanding Issues:
•Accident Year Correlation
•Correlation between multiple lines of business
Mean 1,457,706 Standard Deviation 159,713 Percentile1 1,072,754 5 1,185,524 10 1,245,641 20 1,318,439 30 1,370,931 40 1,415,783 50 1,457,706 60 1,499,628 70 1,544,481 80 1,596,973 90 1,669,770 95 1,729,887 99 1,842,657

2008/09/26 PD-10 (P&C) IFRS:SolvencyPage 24
Step 8: Summarize the resultstotal reserve
1,000,0001,100,0001,200,0001,300,0001,400,0001,500,0001,600,0001,700,0001,800,0001,900,0002,000,000
0.00 0.20 0.40 0.60 0.80 1.00
Percentile
Res
erve
Est
imat
e

2008/09/26 PD-10 (P&C) IFRS:SolvencyPage 25
•References : Hertig, Joakim, Statistical Approach to IBNR-Reserves Marine Reinsurance; A (1985)http://www.casact.org/library/astin/vol15no2/171.pdf

2008
Sem
inar
for
the
App
oint
ed A
ctua
ry
Col
loqu
e po
ur l’
actu
aire
dés
igné
200
8
2008
Sem
inar
for
the
App
oint
ed A
ctua
ry
Col
loqu
e po
ur l’
actu
aire
dés
igné
200
8 Appendix IIBOOTSTRAP PROCESS
by Emily Huang
for
Chris Townsend
August 28, 2008

2008/09/26 PD-10 (P&C) IFRS:SolvencyPage 27
Table of Contents
• 4x4 triangle example
• Appendix 2.1: A 10-year example
• Reference

2008/09/26 PD-10 (P&C) IFRS:SolvencyPage 28
Overview of Bootstrap Process
• A stochastic resampling process
• Structured, mathematically rigorous
• Less judgment used
• Generates a range of data, more informative
• A consistent and repeatable process
• Computer-intensive

2008/09/26 PD-10 (P&C) IFRS:SolvencyPage 29
Step1: take a 4-by-4 triangle from past experience
1 2 3 41 761,590 1,089,510 1,142,800 1,159,080 2 784,590 1,093,740 1,157,860 3 1,077,950 1,409,930 4 1,065,310

2008/09/26 PD-10 (P&C) IFRS:SolvencyPage 30
Step 2:cumulative chain ladder method
Sample Calculation:1.0538 = (1,142,800+1,157,860)/(1,089,510+1,093,740)
1 2 3 4N/A 1.3693 1.0538 1.0142

2008/09/26 PD-10 (P&C) IFRS:SolvencyPage 31
Step 3: fitted triangle with development factors
Sample Calculation:802,442 = 1,157,860/ (1.3693*1.0538)
1 2 3 41 792,004 1,084,479 1,142,800 1,159,080 2 802,442 1,098,771 1,157,860 3 1,029,684 1,409,930 4 1,065,310

2008/09/26 PD-10 (P&C) IFRS:SolvencyPage 32
Step 4: unscaled Pearson residuals
Note: calculations are carried out on incremental values
Sample Calculation:47.57 = (1,077,950 – 1,029,684) /sqrt(1,029,684)i.e.: (Actual Payment – Fitted Payment)/sqrt (Fitted Payment)
1 2 3 41 -34.18 65.54 -20.83 0.002 -19.93 23.55 20.703 47.57 -78.274 0.00

2008/09/26 PD-10 (P&C) IFRS:SolvencyPage 33
Step 5: adjust for degrees of freedom
Sample Calculation:86.84 = 47.57*sqrt (n/(n-p))
n = number of data pointsp = number of parameters being estimated
1 2 3 41 -62.40 119.66 -38.03 0.002 -36.38 43.00 37.783 86.84 -142.914 0.00

2008/09/26 PD-10 (P&C) IFRS:SolvencyPage 34
Step 6: randomly select adjusted Pearson residuals
Note: We are excluding the top right and bottom left cells, as they are always zero.
1 2 3 41 -36.38 43.00 119.66 -36.382 -38.03 43.00 119.663 -38.03 -36.384 119.66

2008/09/26 PD-10 (P&C) IFRS:SolvencyPage 35
Step 7: calculate a false history
Sample Calculation:991,091 = -38.03*sqrt(1,029,684) + 1,029,684
False History = Random Residual*sqrt(Fitted Payment) + Fitted Payment
1 2 3 41 759,625 315,730 87,218 11,638 2 768,372 319,737 88,177 3 991,091 357,810 4 1,188,817

2008/09/26 PD-10 (P&C) IFRS:SolvencyPage 36
Step 7A: cumulative false history
1 2 3 41 759,625 1,075,354 1,162,573 1,174,211 2 768,372 1,088,109 1,176,286 3 991,091 1,348,901 4 1,188,817
Sample Calculation:
1,176,286 = 768,372 + 319,737 + 88,177

2008/09/26 PD-10 (P&C) IFRS:SolvencyPage 37
Step 8:recalculate development factors
Note: Calculated by the cumulative chain ladder method.
1 2 3 4N/A 1.394 1.081 1.010
2008/09/26 PD-10 (P&C) IFRS:SolvencyPage 38
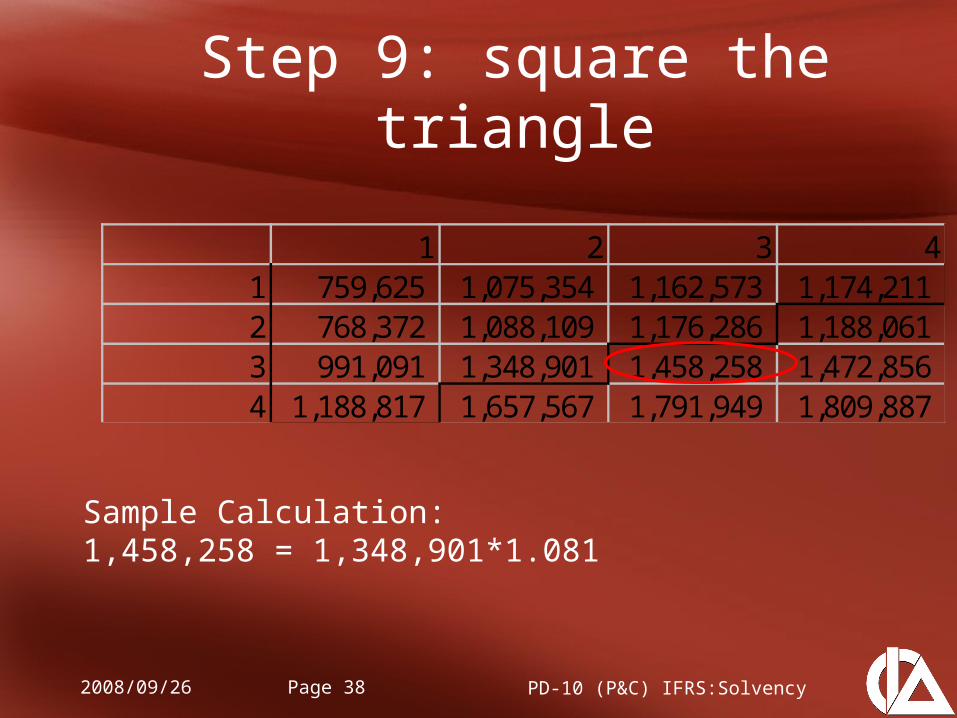
Step 9: square the triangle
Sample Calculation:1,458,258 = 1,348,901*1.081
1 2 3 41 759,625 1,075,354 1,162,573 1,174,211 2 768,372 1,088,109 1,176,286 1,188,061 3 991,091 1,348,901 1,458,258 1,472,856 4 1,188,817 1,657,567 1,791,949 1,809,887
2008/09/26 PD-10 (P&C) IFRS:SolvencyPage 39
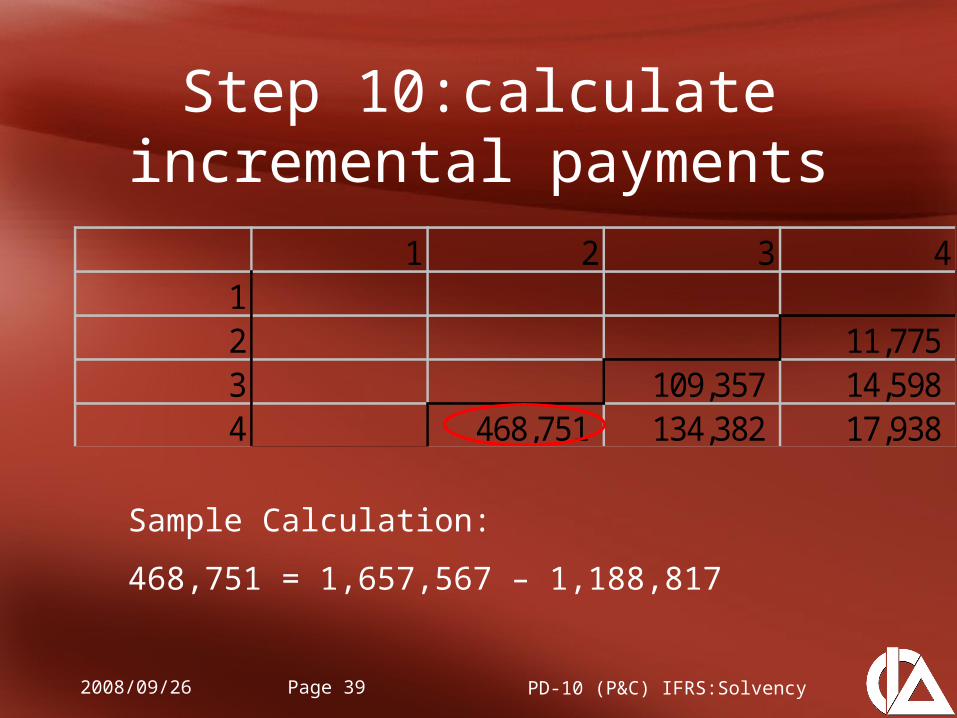
Step 10:calculate incremental payments
Sample Calculation:
468,751 = 1,657,567 – 1,188,817
1 2 3 412 11,775 3 109,357 14,598 4 468,751 134,382 17,938

2008/09/26 PD-10 (P&C) IFRS:SolvencyPage 40
Step 11: calculate the scale parameter
Scale parameter
= Pearson chi-squared statistic
Number of degrees of freedom
= 15,667/ (10 – 7)
= 5,222

2008/09/26 PD-10 (P&C) IFRS:SolvencyPage 41
Step 12: random draw from a gamma distribution
Note: mean = absolute value of the incremental payment from step 10Variance = mean * scale parameter from step 11
1 2 3 412 6,205 3 104,836 21,251 4 614,734 138,404 12,931

2008/09/26 PD-10 (P&C) IFRS:SolvencyPage 42
Step 13: final reserve estimate
Final reserve estimate
= sum of all entries under the dark line
= 614,734 + 104,836 + 138,404 + 6,205 + 21,251 + 12,931
= 898,362

2008/09/26 PD-10 (P&C) IFRS:SolvencyPage 43
• N% tail variance
= variance of the largest K*(100-N)% data points
• Possible estimates of capital required at 95th percentile– 95th percentile = 814,190 – 620,424 = 193,766– 90th tail variance = average(largest 0.1K data
points) – 620,424 = 240,667– Normal Approximation = 1.96*107,969 = 211,619
Step 14: Repeat step 6 to 13 K times
2008/09/26 PD-10 (P&C) IFRS:SolvencyPage 44
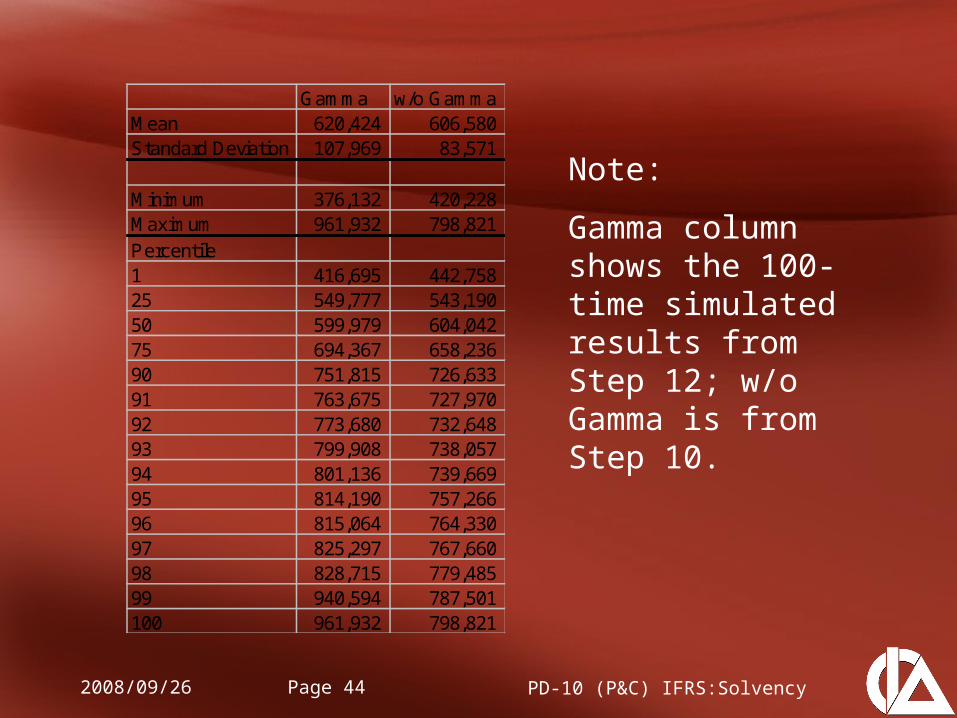
Gamma w/o GammaMean 620,424 606,580 Standard Deviation 107,969 83,571
Minimum 376,132 420,228 Maximum 961,932 798,821 Percentile1 416,695 442,758 25 549,777 543,190 50 599,979 604,042 75 694,367 658,236 90 751,815 726,633 91 763,675 727,970 92 773,680 732,648 93 799,908 738,057 94 801,136 739,669 95 814,190 757,266 96 815,064 764,330 97 825,297 767,660 98 828,715 779,485 99 940,594 787,501 100 961,932 798,821
Note:
Gamma column shows the 100-time simulated results from Step 12; w/o Gamma is from Step 10.

2008/09/26 PD-10 (P&C) IFRS:SolvencyPage 45
Summary
• Gamma distribution provides a wider reserve range
• A consistent and repeatable process
• 100+ simulations, computer-intensive

2008/09/26 PD-10 (P&C) IFRS:SolvencyPage 46
Appendix 2.1: A 10-year example
1 2 3 4 5 6 7 8 9 101 761,590 1,089,510 1,142,800 1,159,080 1,167,480 1,179,380 1,188,450 1,198,590 1,200,600 1,200,680 2 784,590 1,093,740 1,157,860 1,192,850 1,219,390 1,249,710 1,255,350 1,255,670 1,255,960 3 1,077,950 1,409,930 1,463,090 1,507,110 1,530,280 1,545,700 1,554,690 1,560,470 4 1,065,310 1,436,220 1,488,880 1,536,200 1,563,200 1,575,900 1,575,100 5 1,055,040 1,427,060 1,489,310 1,540,620 1,559,330 1,576,300 6 1,654,920 2,068,020 2,127,940 2,184,890 2,222,940 7 1,326,870 1,767,210 1,896,280 1,955,140 8 1,875,230 2,340,640 2,436,930 9 1,572,510 1,992,460
10 1,902,050
Data

2008/09/26 PD-10 (P&C) IFRS:SolvencyPage 47
Incremental triangle
1 2 3 4 5 6 7 8 9 1012 681 3 2,986 983 4 8,876 2,848 938 5 3,626 9,676 3,104 1,022 6 21,091 4,452 11,881 3,811 1,255 7 27,318 20,250 4,275 11,407 3,659 1,205 8 70,053 35,247 26,128 5,515 14,718 4,722 1,555 9 85,634 56,919 28,639 21,230 4,481 11,959 3,836 1,264
10 621,007 117,035 77,790 39,140 29,014 6,125 16,344 5,243 1,727

2008/09/26 PD-10 (P&C) IFRS:SolvencyPage 48
ResultsMean 1,432,931 Standard Deviation 89,411
Minimum 1,070,159 Maximum 1,760,397 Percentile1 1,226,010 25 1,374,384 50 1,430,229 75 1,491,594 90 1,550,455 91 1,555,620 92 1,561,642 93 1,567,717 94 1,574,326 95 1,583,350 96 1,592,764 97 1,601,613 98 1,618,546 99 1,644,080 100 1,760,397

2008/09/26 PD-10 (P&C) IFRS:SolvencyPage 49
Reference
• Kirschner, Gerald S., Colin Kerley, and Belinda Isaacs. "Two Approaches to Calculating Correlated Reserve Indications Across Multiple Lines of Business." Variance 02 (2008): 32-38.