2008 cccu financial aid survey cccu financial aid administrators conference january 8-10, 2009 –...
TRANSCRIPT

2008 CCCU Financial Aid Survey
CCCU Financial Aid Administrators Conference
January 8-10, 2009 – San Diego, California
Dan Nelson: Vice President of Admissions, Financial Aid and Retention, Bethel University
Jeff Olson: Director of Financial Aid, Bethel University

Presentation Overview
• 1. Financial Aid Office Staff – Internal operations
• 2. Students/Families
• 3. Our Institutions – Financial Health
• 4. Government – Compliance

Part 1. Financial Aid Office Staff(Internal Operations)
• Demographic Data• Technology• Software• Reporting Relationships• Consultants• Endowed Scholarship• Student Employment

2008 CCCU Financial Aid Survey – Dan Nelson, Jeff Olson – Jan. 9, 2009
67 Participants – Dec ‘08

2008 CCCU Financial Aid Survey – Dan Nelson, Jeff Olson – Jan. 9, 2009
Profile of Responding Schools (see p. 5)
• 67 Schools in Cohort• CCCU Members
– Yes 92% (62/67)
– No 8% (5/67)
• NASFAA Members– Yes 92% (62/67)
– No 8% (5/67)
• 37 Schools have participated in the 5 most recent CCCU Fin Aid surveys
• 19 Schools have participated in all 10 CCCU Fin Aid surveys!

Thanks for Your Participation!10 year Club
• Anderson University, IN• Bethel University, MN • Bluffton University, OH • Bryan College, TN • Calvin College, MI • Cedarville University, Oh • Colorado Christian University,
CO • George Fox University, OR • Houghton College, NY
• Huntington University, IN • John Brown University, AR • Judson University, IL • Messiah College, PA • Northwestern College, MN • Roberts Wesleyan College, NY • Tabor College, KS • Taylor University, IN • Westmont College, CA • Wheaton College, IL
2007 CCCU Financial Aid Survey – Dan Nelson, Jeff Olson – Jan. 11, 2008

2008 CCCU Financial Aid Survey – Dan Nelson, Jeff Olson – Jan. 9, 2009
2008 Profile - Regional Distribution (see p. 5)

Highest Degree Offered (see p. 5)
2008 CCCU Financial Aid Survey – Dan Nelson, Jeff Olson – Jan. 9, 2009

Financial Aid Software: # Schools, Fall ‘08
2008 CCCU Financial Aid Survey – Dan Nelson, Jeff Olson – Jan. 9, 2009

Financial Aid Software Top 6 Vendors (77%), Dec ‘08 (see p. 5)
2008 CCCU Financial Aid Survey – Dan Nelson, Jeff Olson – Jan. 9, 2009

Financial Aid Software Satisfaction – 3 year Comparison (see p. 6)
2008 CCCU Financial Aid Survey – Dan Nelson, Jeff Olson – Jan. 9, 2009

Switching Software Vendors in next 1-3 Years
2008 CCCU Financial Aid Survey – Dan Nelson, Jeff Olson – Jan. 9, 2009

Electronic Communications (currently using) see pp. 6-9
2008 CCCU Financial Aid Survey – Dan Nelson, Jeff Olson – Jan. 9, 2009

Electronic Communications (currently using) see pp. 6-9
2008 CCCU Financial Aid Survey – Dan Nelson, Jeff Olson – Jan. 9, 2009

Financial Aid Reporting Relationships (see p. 16)
Where do financial aid offices reside in the school’s organizational structure (67 schools reporting)?
• Enrollment Mgmt: 48 (71%) • Business Affairs: 13 (19%) • Academic Affairs: 2 (2%) • Student Affairs: (0) • Advancement: 1 (1%) • Enrollment & Marketing: 1 (1%) • Student Financial Services: 1
(1%) • University Relations: 1 (1%)
2008 CCCU Financial Aid Survey – Dan Nelson, Jeff Olson – Jan. 9, 2009

Consultant or Leveraging Product (see p. 80)
2008 CCCU Financial Aid Survey – Dan Nelson, Jeff Olson – Jan. 9, 2009

Endowed Scholarship Processes (see p. 76)
2008 CCCU Financial Aid Survey – Dan Nelson, Jeff Olson – Jan. 9, 2009

Student Employment Processes Continued (see p. 81)
2008 CCCU Financial Aid Survey – Dan Nelson, Jeff Olson – Jan. 9, 2009

Student Employment Processes (see p. 81)
2008 CCCU Financial Aid Survey – Dan Nelson, Jeff Olson – Jan. 9, 2009

Part 2. Students & Families
• Pricing & Budgets
• Aid by Category– Gift aid– Loans– Work
• Scholarships– Targeted– Academic– Athletic
• International Student Aid• Need• Loans (borrowing and
debt)

’08-’09 Dependent Budgets(see pp. 18-19)
• Average dependent student budget is $30,671 (range: $21,000 to $47,786).
• This is an increase of 5.6% from ’07-’08 (same increase as last year).
2008 CCCU Financial Aid Survey – Dan Nelson, Jeff Olson – Jan. 9, 2009

Tuition & Fee Changes2007-08 to 2008-09 (see p. 19)
• Tuition and Fees at 67 reporting schools increased from an average of $19,851 to $20,916 (5.4%).
• Five institutions reported increases of 9% or greater
• 19 of 67 (28%) institutions reported increases between 5% and 5.99%
• 17 of 67 (25%) institutions reported increases between 6% and 6.99%
2008 CCCU Financial Aid Survey – Dan Nelson, Jeff Olson – Jan. 9, 2009

’08-’09 Indirect Budget Items(see p. 20)
• Dependent budget estimates for books, supplies, personal and transportation ranged from $2,190 to $6,718.– Average was $3,600– This is 7.5% greater than
’07-’08
2008 CCCU Financial Aid Survey – Dan Nelson, Jeff Olson – Jan. 9, 2009

’07-’08 Total Financial Aid(see p. 21)
• Students at 67 reporting institutions received nearly $1.69 billion of financial aid in 2007-08.– $909 million in gift aid– $579 million in student loans– $151 million in PLUS loans– $51 million in employment
2008 CCCU Financial Aid Survey – Dan Nelson, Jeff Olson – Jan. 9, 2009

’07-’08 Average Financial Aid(see pp. 22-25)
Lowest average
Average of 67 schools
Highest average
Gift Aid $3,888 $8,505 $13,404
Loans (w/o PLUS)
$2,509 $5,718 $16,814 (?)
Work $59 $476 $1,686
2008 CCCU Financial Aid Survey – Dan Nelson, Jeff Olson – Jan. 9, 2009

’07-’08 Institutional Gift Aid Per Enrolled Student (see pp. 26-31)
Lowest average
Average of 66 schools
Highest average
Unrestricted $1,231 $5,106 $8,641
Endowed $0 $304 $1,567
Restricted $0 $128 $1,516
Tuition Remission
$0 $500 $1,057
2008 CCCU Financial Aid Survey – Dan Nelson, Jeff Olson – Jan. 9, 2009

Targeted Scholarships (see pp. 66-69)
Scholarship OfferSmallest Maximum
Average Maximum
Largest Maximum
2nd in Family 23/66=35% $500 $1,291 $3,078
Legacy 45/67=67% $100 $1,567 $9,440
Athletic 45/67=67% $7,000 $20,348 $34,544
Child of Christian Service Worker
25/67=37% $1,000 $3,037 $13,000
Child of Minister or Missionary
52/67=78% $500 $3,320 $13,100
Denominational Affiliation
27/67=40% $500 $3,340 $18.588
2008 CCCU Financial Aid Survey – Dan Nelson, Jeff Olson – Jan. 9, 2009

Targeted Scholarships Continued (see pp. 66-69)
Scholarship Offer Minimum Average Maximum
First Generation 6/66=9% $1,000 $4,650 $14,750
Home Schooled 9/66=14% $500 $1,517 $4,000
International Student
51/67=76% $1,000 $9,278 $36,552
Church Match 45/67=67% $500 $836 $2,000
Student of Color 23/66=35% $500 $8,509 $33,118
Hybrid 10/60=17% $1,000 $5,105 $16,000
2008 CCCU Financial Aid Survey – Dan Nelson, Jeff Olson – Jan. 9, 2009

National Merit Scholarship Program Participants (see p. 70)
• Asbury• Bethel U.• Calvin• Cedarville• Columbia Intl.• Geneva• George Fox• Gordon• Grace (IN)
• ORU• Roberts
Wesleyan• SPU• SE U of FL• Taylor• Union• Westmont• Wheaton
2008 CCCU Financial Aid Survey – Dan Nelson, Jeff Olson – Jan. 9, 2009
• Greenville• Houghton• Huntington• Indiana
Wesleyan• LeTourneau• Messiah• Nyack• OK Christian

National Merit Scholarship Program Continued (p. 70)
• 25 of 67 responding schools participate (37%)
• Of these 25 schools, 18 offer additional ICGA to Merit Scholars above the normal package (72%)
• Average extra ICGA from these schools to Merit Scholars is $8,261 (range $750 to $21,000)
2008 CCCU Financial Aid Survey – Dan Nelson, Jeff Olson – Jan. 9, 2009

Academic Scholarship Criteria (see pp.72-73)
2008 CCCU Financial Aid Survey – Dan Nelson, Jeff Olson – Jan. 9, 2009

Academic Scholarships for Entering New Students - Fall ’08 (see p.74)
2008 CCCU Financial Aid Survey – Dan Nelson, Jeff Olson – Jan. 9, 2009
Percent Receiving Academic
Scholarship
Maximum Scholarship as a %
of Tuition & Fees
Minimum 19% 4%
1st Quartile 50% 44%
2nd Quartile (Median)
62% 59%
3rd Quartile 75% 97%
4th Quartile (Maximum)
100% 141%

Academic Scholarships for Entering New Students (see p.75)
2008 CCCU Financial Aid Survey – Dan Nelson, Jeff Olson – Jan. 9, 2009

Academic Scholarships for Entering New Students - Fall ’08 (see p.74)
Minimum Award
Average Award
Maximum Award
Lowest $300 $1,000 $1,000
Median $2,000 $5,185 $12,000
Highest $10,000 $14,389 $32,150
2008 CCCU Financial Aid Survey – Dan Nelson, Jeff Olson – Jan. 9, 2009

Athletic Divisions (see p. 89)
2008 CCCU Financial Aid Survey – Dan Nelson, Jeff Olson – Jan. 9, 2009
Athletic Scholarships (see pp.90-91,93)
• School specific data is included on your CD• NAIA-1 Summary by sport information is found on
handout page 90• NAIA-2 Summary by sport information is found on
handout page 91• No schools reported NCAA-1 scholarship data• 2 schools reported NCAA-2 scholarship data (data
sent directly to these 2 schools)• See comments on page 93 regarding impact of
athletic recruitment on non-athletic recruitment
2008 CCCU Financial Aid Survey – Dan Nelson, Jeff Olson – Jan. 9, 2009
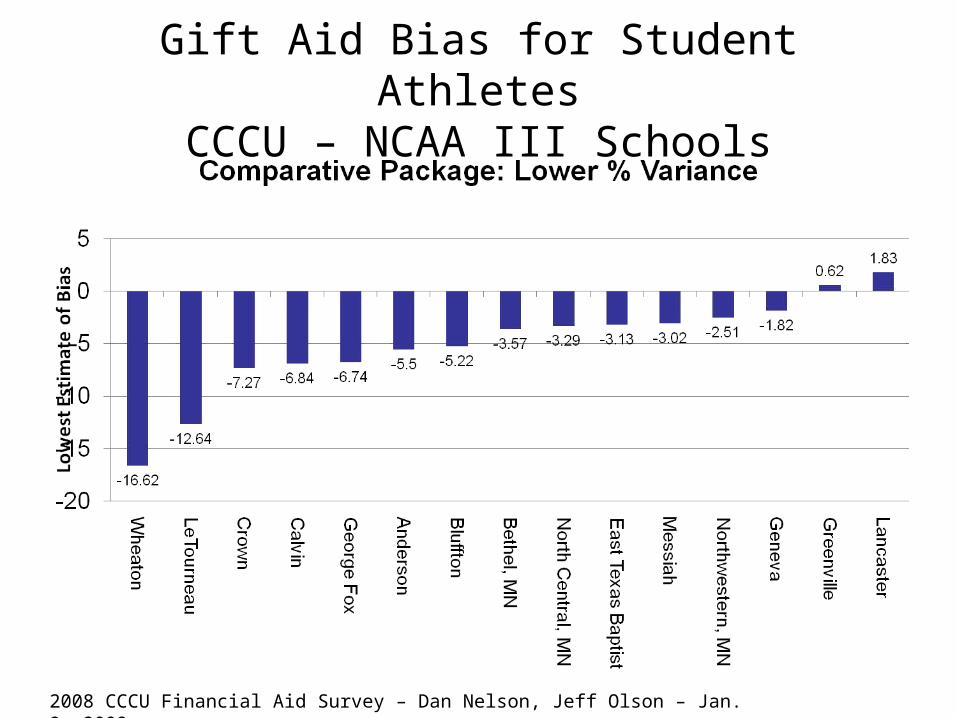
Gift Aid Bias for Student AthletesCCCU – NCAA III Schools
2008 CCCU Financial Aid Survey – Dan Nelson, Jeff Olson – Jan. 9, 2009

Gift Aid Bias for Student AthletesCCCU – NCAA III Schools
2008 CCCU Financial Aid Survey – Dan Nelson, Jeff Olson – Jan. 9, 2009

International Student Aid (see p. 79)
• 58 of 67 reporting schools give ICGA to international students (87%)
• 8 schools report over 5% of their enrollment is international students
• Institutional spending for international students ranges from $4,000 to $2.96 million
• Average ICGA ranges from $1,932 to $38,561 (median award equals $9,258)
2008 CCCU Financial Aid Survey – Dan Nelson, Jeff Olson – Jan. 9, 2009

International Student Aid (see p.79)
2008 CCCU Financial Aid Survey – Dan Nelson, Jeff Olson – Jan. 9, 2009

’07-’08 Needy/Not Needy(see pp. 50-51)
• 68% percent of students at 54 responding schools were needy (range: 89% to 42%).– Total gift aid to needy
students = $595 million
– Average gift aid per needy student = $10,921
2008 CCCU Financial Aid Survey – Dan Nelson, Jeff Olson – Jan. 9, 2009

’07-’08 Needy Students(see p. 51)
• The average needy student at responding schools had demonstrated need of $20,651 in 2007-08 (range: $13,163 to $29,754)*
• On average, responding schools meet 53.1% of need with gift aid (range: 34% to 83%)
• 32/51 (63%) of responding schools meet between 44% and 64% of need with gift aid
* Handout has erroneous data from TIU
2008 CCCU Financial Aid Survey – Dan Nelson, Jeff Olson – Jan. 9, 2009

Loans ’07-’08 (see pp. 41-43)
• 66 survey respondents reported $723 million in total borrowing
• Of this $151 million was PLUS loans– Total PLUS borrowing exceeded $5 million at
7 schools– Average PLUS per enrolled student was
$1,324
• Average amount borrowed per enrolled student was $7,043
2008 CCCU Financial Aid Survey – Dan Nelson, Jeff Olson – Jan. 9, 2009

Loans as Percent of Tuition & Fee Revenue (see p. 44)
• Recorded loans (including PLUS) exceed 50% of tuition and fee revenue at 15 of 66 reporting schools (23%)
• Loans are less than 30% of tuition and fee revenue at 12 of 66 schools (18%)
• The median percentage is 39.6%
2008 CCCU Financial Aid Survey – Dan Nelson, Jeff Olson – Jan. 9, 2009

Average Student Loan Debt (see pp. 45-47)
• On average 76% of Spring ’08 graduates at 62 responding schools borrowed student loans (range: 31% to 98%).
• Their average debt was $24,530 (range: $14,153 to $42,375).– 45 of 62 (73%) of responding schools had average
debts ranging from $19,000 to $30,000
• Average debt equaled 131% of 2007-08 tuition and fees at each student’s school (range: 75% to 259%).
2008 CCCU Financial Aid Survey – Dan Nelson, Jeff Olson – Jan. 9, 2009

2007 CCCU Financial Aid Survey – Dan Nelson, Jeff Olson – Jan. 11, 2008
Part 3. Our Institutions(Financial Health)
• Enrollment• Tuition & Fee Revenue• Percent IGA funded• Discount Rates• Wealth Index• Awarding Philosophy• Preferential Packaging• Response to Demographics

2007-08 Enrollment (see p. 4)
• Of the 67 respondents:– 51 (76%) report non-traditional undergrads– 59 (88%) report graduate students
• Total F'07 undergraduate enrollment in traditional programs was over 99,000 (for the 67 reporting schools).
• Total year grad and undergrad enrollment was 201,377 (as reported on FISAP)
2008 CCCU Financial Aid Survey – Dan Nelson, Jeff Olson – Jan. 9, 2009

Tuition and Fee Revenue (see p. 17)
• The 66 responding schools reported ’07-’08 tuition & fee revenue of $2.344 Billion– Extrapolating to the entire CCCU membership, tuition
revenue at CCCU schools exceeds $3 Billion annually• 9.2% of tuition comes from non-traditional
undergrads (8.5% in ’06-’07; 9.2% in ‘05-’06)• 11.2% of tuition is from graduate students
(10.5% in ‘06-07; 9.5% in ’05-’06)• The percent of tuition from traditional
undergrads decreased from 81.3% in ’05-’06; to 81.0% in ’06-’07; to 79.6% in ‘07-’08
2008 CCCU Financial Aid Survey – Dan Nelson, Jeff Olson – Jan. 9, 2009

Percentage of Institutional Gift Aid (IGA) that is
“funded” (see p. 32)
• The typical (median) school reports that 5.3% of institutional gift aid (not including tuition remission) has a specific funding source (endowed or restricted).– 5 schools report that over 20% of IGA is funded.– 8 schools report between 10-20% of IGA is funded– 16 schools report that less than 3% of IGA is funded
2008 CCCU Financial Aid Survey – Dan Nelson, Jeff Olson – Jan. 9, 2009

Discount Rate Calculation
• Unfunded– "Unrestricted Institutional gift aid" divided by "tuition
and fee revenue"
• NACUBO– (Unrestricted institutional gift aid + endowed +
restricted) divided by "tuition and fee revenue"
• Neither calculation includes employee tuition remissions
2008 CCCU Financial Aid Survey – Dan Nelson, Jeff Olson – Jan. 9, 2009

’07-’08 Discount Rates(see p. 48)
• 66 schools reported unfunded discount rates from 9.6% to 55.1% (median 29.3%)– 67% of reporting schools had unfunded
discount rates between 23% and 37%
• The NACUBO discount rate for the same schools ranged from 10.2% to 60.2% (median 32.7%)
2008 CCCU Financial Aid Survey – Dan Nelson, Jeff Olson – Jan. 9, 2009

Estimated ’08-’09 Discount Rates (see p. 49)
• 65 Schools reported estimated unfunded discount rates from 11.6% to 47.2% (median 31.5%) in ’08-’09.– 67% of reporting schools had unfunded
discount rates between 24.7% and 37.6%
• The NACUBO discount rate ranged from 16.5% to 48.2% (median 34.6%) in ‘08-’09.
2008 CCCU Financial Aid Survey – Dan Nelson, Jeff Olson – Jan. 9, 2009

Sticker Price vs. Avg. Revenue(see p. 52)
• The median school reported average T&F revenue of 87% of their tuition “sticker price” (this represents the effect of less than full-time and less than full-year students).
• The range was from 59% to 111%
• 5 schools reported more than 100% or higher (possible sign of data error).
2008 CCCU Financial Aid Survey – Dan Nelson, Jeff Olson – Jan. 9, 2009

Price compared with Family Wealth (see pp. 53-55)
• The "wealth index" is an approximate measurement of expected parent contribution from non-independent student families (whether or not they show need).
• A positive variance means that, compared to the group, families are wealthier than the norm.
2008 CCCU Financial Aid Survey – Dan Nelson, Jeff Olson – Jan. 9, 2009

2008 CCCU Financial Aid Survey – Dan Nelson, Jeff Olson – Jan. 9, 2009

2008 CCCU Financial Aid Survey – Dan Nelson, Jeff Olson – Jan. 9, 2009

Awarding PhilosophyICGA awarding philosophy (see p. 56)
2008 CCCU Financial Aid Survey – Dan Nelson, Jeff Olson – Jan. 9, 2009

Awarding PhilosophySINK! (p. 57)
• 24 schools (38%) reduce (sink) need-based ICGA when awarding non-need-based ICGA.
• The percentage of “sink” ranges from 50% to 100%
• Many schools award ICGA using a matrix or leveraging formula
2008 CCCU Financial Aid Survey – Dan Nelson, Jeff Olson – Jan. 9, 2009
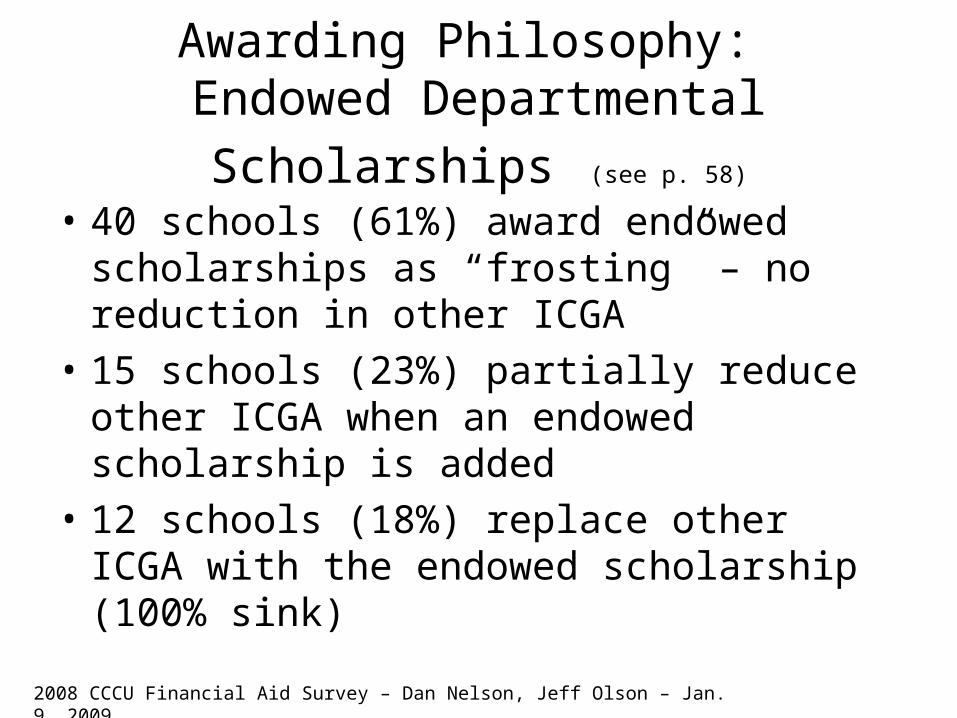
Awarding Philosophy:
Endowed Departmental Scholarships (see p. 58)
• 40 schools (61%) award endowed scholarships as “frosting” – no reduction in other ICGA
• 15 schools (23%) partially reduce other ICGA when an endowed scholarship is added
• 12 schools (18%) replace other ICGA with the endowed scholarship (100% sink)
2008 CCCU Financial Aid Survey – Dan Nelson, Jeff Olson – Jan. 9, 2009

Awarding Philosophy: Continuing Students (see p.59)
• Response to normal increases in need (e.g. tuition went up):– 18 schools (27%)
increase need-based ICGA
– 42 schools (63%) would not change need-based ICGA
• Do you recalculate non-need (merit) ICGA every year?– Yes: 19 schools
(29%)– No: 45 schools
(69%)
2008 CCCU Financial Aid Survey – Dan Nelson, Jeff Olson – Jan. 9, 2009

Awarding Philosophy: Dramatic Changes in Need (see pp. 60-61)
• Need increases dramatically:– 41 schools (68%)
increase ICGA– 10 schools (17%) do
not adjust ICGA– 3 schools (5%)
respond to appeals– 6 schools (10%) case-
by-case review
• Need decreases dramatically:– 38 schools (66%)
decrease ICGA– 16 schools (28%) do
not adjust ICGA– 4 schools (7%) case-
by-case review
2008 CCCU Financial Aid Survey – Dan Nelson, Jeff Olson – Jan. 9, 2009

Awarding Philosophy: Merit Aid in Excess of Need (see p. 62)
• Only 8 of 65 schools (12%) reported knowing how much of their merit aid actually met need.
• For these schools, most merit aid actually is within need (64% to 88%)
• Comment: distinguishing merit aid used to meet need is a prerequisite for the Common Data Set.
2008 CCCU Financial Aid Survey – Dan Nelson, Jeff Olson – Jan. 9, 2009

Preferential Packaging: Non-Academic Factors (p.63)
2008 CCCU Financial Aid Survey – Dan Nelson, Jeff Olson – Jan. 9, 2009

Preferential PackagingMaximum Institutionally Controlled Gift Aid (see p. 64)
2008 CCCU Financial Aid Survey – Dan Nelson, Jeff Olson – Jan. 9, 2009

Preferential PackagingImpact of Co-Application (see p. 65)
• Do you sweeten your initial package when prospective freshmen are co-applying to competing schools? 13 (19.4%) Yes 52 (77.6%) No 2 (3.0%) Sometimes
• Of the 13 who answered “yes,” how much? 3 = $1,000 or less 5 = $1,000-2,000 1 = over $2,000 2 = try to match 2 = no answer
2008 CCCU Financial Aid Survey – Dan Nelson, Jeff Olson – Jan. 9, 2009

Response to Demographic Changes (see p. 86)
• Impact of shifting demographics?– 37% not sure– 27% fluctuating
student pool– 25% declining pool– 10% increasing pool
• Finaid Involved?– 66% yes– 33% no
• Remedies for decline– 64% Expand Marketing– 51% Increase ICGA– 33% New Courses– 30% Limit Price Increase– 27% New Delivery
Systems– 6% Let Enrollment
Shrink
2008 CCCU Financial Aid Survey – Dan Nelson, Jeff Olson – Jan. 9, 2009

2007 CCCU Financial Aid Survey – Dan Nelson, Jeff Olson – Jan. 11, 2008
Part 4. Government Programs(Compliance)
• Federal Loan Programs
• Federal Gift Aid• Recent loan
turmoil• Codes of Conduct• “Red Flag” Rules• 09-10 Need
Analysis

Federal Loan Programs – 2008 (see pp. 13-15)
Direct Loan (DL) or FFELP? Number PercentRunning
Total
Participating in DL prior to Fall ’07 4 6.1% 6.1%
Switched from FFELP to DL for Fall ’07
1 1.5% 7.6%
Switched from FFELP to DL for Fall ’08
5 7.6% 15.2%
Plan to switch from FFELP to DL for Fall ’09
3 4.5% 19.7%
May switch from FFELP to DL for Fall ‘09
6 9.1% 28.8%
May switch from FFELP to DL for Fall ‘10 or beyond
9 13.6% 42.4%
Will remain in FFELP 38 57.6% 100.0%
2008 CCCU Financial Aid Survey – Dan Nelson, Jeff Olson – Jan. 9, 2009

’07-’08 Federal Gift Aid(see pp. 33-35)
• Average Pell grant (per enrolled student) ranges from $279 to $1,452.
• SEOG total funding represents anywhere from 5% to 61% of total Pell funding.
2008 CCCU Financial Aid Survey – Dan Nelson, Jeff Olson – Jan. 9, 2009

Average Federal Grants Per enrolled Student 2007-’08 (see p. 34)
Low Average High
SEOG $53 $145 $311
ACG $10 $46 $91
SMART $0 $18 $92
Pell $279 $791 $1,452
2008 CCCU Financial Aid Survey – Dan Nelson, Jeff Olson – Jan. 9, 2009

Pell Grant (all undergrads)Pell as % of Total Enrollment (see pp. 36-39)
• More than 35% of undergraduates receive Pell at 7 of 62 schools (11%)
• Less than 20% of undergraduates receive Pell at 17 of 62 schools (27%)
• Average percent receiving Pell = 26.4%• Percent receiving Pell ranges from 13.0 % to
45.6%
2008 CCCU Financial Aid Survey – Dan Nelson, Jeff Olson – Jan. 9, 2009

Change in # of Pell Grant Recipients (62 schools, see pp. 37-39)
2008 CCCU Financial Aid Survey – Dan Nelson, Jeff Olson – Jan. 9, 2009

Change in # of Pell Grant Recipients: 06-07 to 08-09
(62 schools, see pp. 37-39)
• 18 schools increased the # of Pell Grant recipients by 10% or more
• 13 schools increased by <10%
• 4 school stayed even
• 14 schools decreased by <10%
• 13 schools decreased by 10% or more
2008 CCCU Financial Aid Survey – Dan Nelson, Jeff Olson – Jan. 9, 2009
11/26/18 – 1/1/09
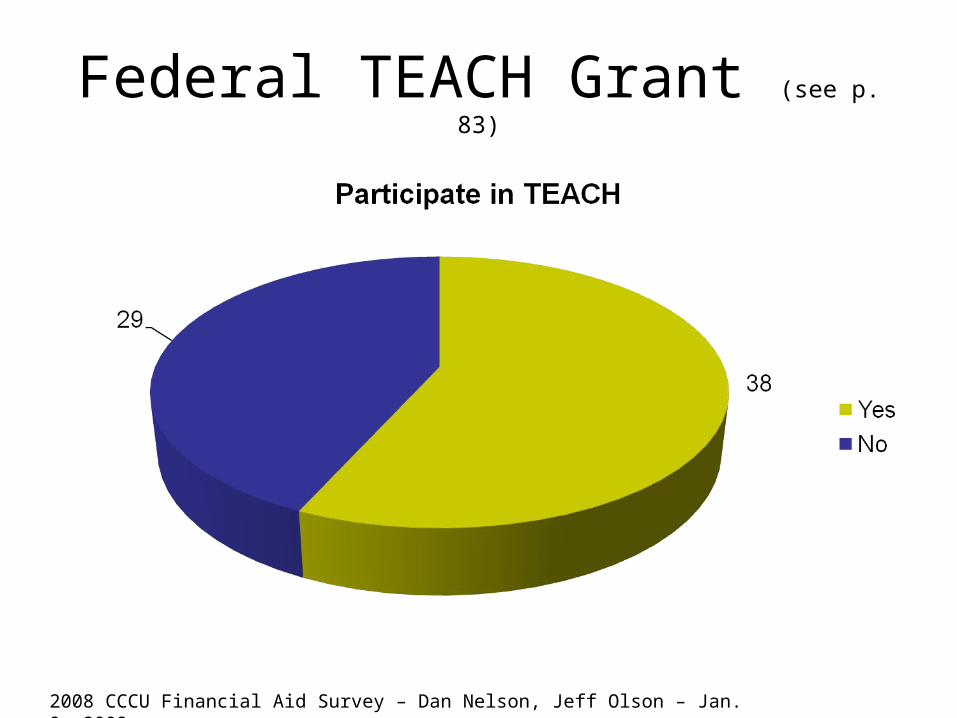
Federal TEACH Grant (see p. 83)
2008 CCCU Financial Aid Survey – Dan Nelson, Jeff Olson – Jan. 9, 2009

Recent Loan Turmoil (see p. 84)
2008 CCCU Financial Aid Survey – Dan Nelson, Jeff Olson – Jan. 9, 2009

Codes of Conduct (see p. 85)
2008 CCCU Financial Aid Survey – Dan Nelson, Jeff Olson – Jan. 9, 2009

FTC “Red Flag” Rules (see p. 87)
2008 CCCU Financial Aid Survey – Dan Nelson, Jeff Olson – Jan. 9, 2009

2009-2010 Need Analysis Changes (see p. 88)
2008 CCCU Financial Aid Survey – Dan Nelson, Jeff Olson – Jan. 9, 2009

Questions?
• Survey Participants receive a CD containing– Excel spreadsheet
with processed data and reports
– Slide show/handouts– Survey questions– Sample Codes of
Conduct
2008 CCCU Financial Aid Survey – Dan Nelson, Jeff Olson – Jan. 9, 2009