2008 – 2012 report on wdna indicators (draft) · 3 c:\users\injf2\objcache\objects\indicator...
TRANSCRIPT

1 c:\users\injf2\objcache\objects\indicator report 1 wdna 2008 -2012 updated nov 13 (a1069927).doc
√ ~ x
Scotland’s Wild Deer: A National Approach Draft Report on Deer Indicators for
2008 – 2012 UPDATED NOVEMBER 2013
Introduction: This is an updated1 version of the first report on the deer indicators for Scotland’s Wild Deer: A National Approach (WDNA). There are 11 indicators, developed by the WDNA Action Group. The purpose of the indicators is to assess the impact of the actions delivered through the WDNA Action Plans. This assessment will help demonstrate and measure progress towards achieving the WDNA vision. They are vital to understanding whether we are doing the right things in the right way at the right time. The indicators will give us an insight into the affect that the WDNA is having on nature, people and the economy. This insight will allow us to work out what else we need to do, what we need to stop doing and what we need to do differently. The indicators will not and cannot tell us the whole story. They tell us about trends. They tell us whether something is improving or increasing or declining or decreasing or staying the same. Existing data sets have been used to reduce costs and to enable access to regular data. The coloured dots in the key below are designed to give a very quick sense of where we are with each indicator. To understand the complexities and caveats the associated text in each box below should be read. Key:
Trend is positive Trend is uncertain Trend is negative
Assessing the indicators: There are 11 indicators divided under the WDNA Action Plan themes. Each has been assessed as positive, negative or uncertain. In some instances we are presenting baseline data. A trend is assessed as positive when the data indicates the situation has improved or stayed the same. A trend is negative when there has been deterioration of at least 3% from the baseline. This 3% rule of thumb has been used since 2005 for sustainable development indicators. A trend is uncertain when data shows deterioration within 1% to 3% and/or there is insufficient data to assess the trend as negative. A watching brief should be kept on those with an uncertain status. None of the indicators relate to specific targets. Their purpose is to indicate progress towards achieving the WDNA strategic objectives and vision. These indicators are still being refined and developed and we anticipate there will be future changes.
1 Some indicators have had 2012 data inserted. There have also been some changes to text as suggested at the WDNA Action Group meeting on 27.02.13

2 c:\users\injf2\objcache\objects\indicator report 1 wdna 2008 -2012 updated nov 13 (a1069927).doc
x
Summary: Below is a table summarising the status of each of the wild deer indicators. Further details and interpretations are included in the body of the report:
INDICATOR DATA SOURCE LAST ASSESSED VALUE (NUMBER or PERCENTAGE)
REPORTING INTERVAL
STATUS
Number of Upland Deer Management Groups with effective Deer Management Plans
ADMG 2011
12
1 Year Baseline Data
Number of reported wild deer welfare incidents (excluding Deer Vehicle Collisions & poaching which are reported under different indicators)
SSPCA 2010 2011 2012
500 518 726
1 Year
Number of reported deer poaching incidents
ACPOS Scottish Wildlife Tasking & Co-ordination Group Tactical Assessment
Dec 09 – Nov 10 Dec10 – Nov 11
92 75
1 Year
Number of FTE in employment in the deer sector
Issues with collating data
Value of Venison to the Scottish Economy
Issues with collating data
Value of deer stalking to the Scottish Economy
Issues with collating data
Designated features where the herbivore targets included in Site Condition Monitoring are being met
SNH Remedies Database
Jan 13 84% 1 Year Baseline data
Number and distribution of deer species present in Scotland
SNH (number) British Deer Society (distribution)
2008 2009 2010 2011
4 4 4 4
1 Year (for numbers) 4 Years (for
√
√
x

3 c:\users\injf2\objcache\objects\indicator report 1 wdna 2008 -2012 updated nov 13 (a1069927).doc
2012 2011 (distribution – presence - maps)
4 See Maps at Annex 1
distribution – presence - maps)
Number of people achieving a deer related qualification (National Certificates – Gamekeeping)
Colleges (North Highland, Elmwood & Borders)
2009 2010 2011
65 65 66
1 Year
Number of people achieving a deer related qualification (Higher National Certificate – Gamekeeping)
Colleges (North Highland & Borders)
2009 2010 2011
26 25 25
1 Year
Number of people achieving a deer related qualification (Deer Stalking Certificate 1)
Deer Management Qualifications (this includes those awarded through colleges)
2008 2009 2010 2011 2012
226 252 248 244 293
1 Year
Number of deer related road traffic accidents (SSPCA call outs to assist with live deer road casualties)
UK DVC Project 2008 2011 2012
319 422 664
1 Year
Number of deer related road traffic accidents (Transport for Scotland Trunk road agent deer carcass uplift request)
UK DVC Project 2008 2011 2012
485 600 739
1 Year
Public Perception of Wild Deer (association of deer with Scotland)
Scottish Nature Omnibus
2009/10 2010/11 2011/12 2012/13
73% 72% 70% 69%
1 Year
Public Perception of Wild Deer (Concern over deer)
Scottish Nature Omnibus
2009/10 2010/11 2011/12 2012/13
31% 33% 31% 30% (to date)
1 Year
√
√
√
x
√
x
x
4 c:\users\injf2\objcache\objects\indicator report 1 wdna 2008 -2012 updated nov 13 (a1069927).doc
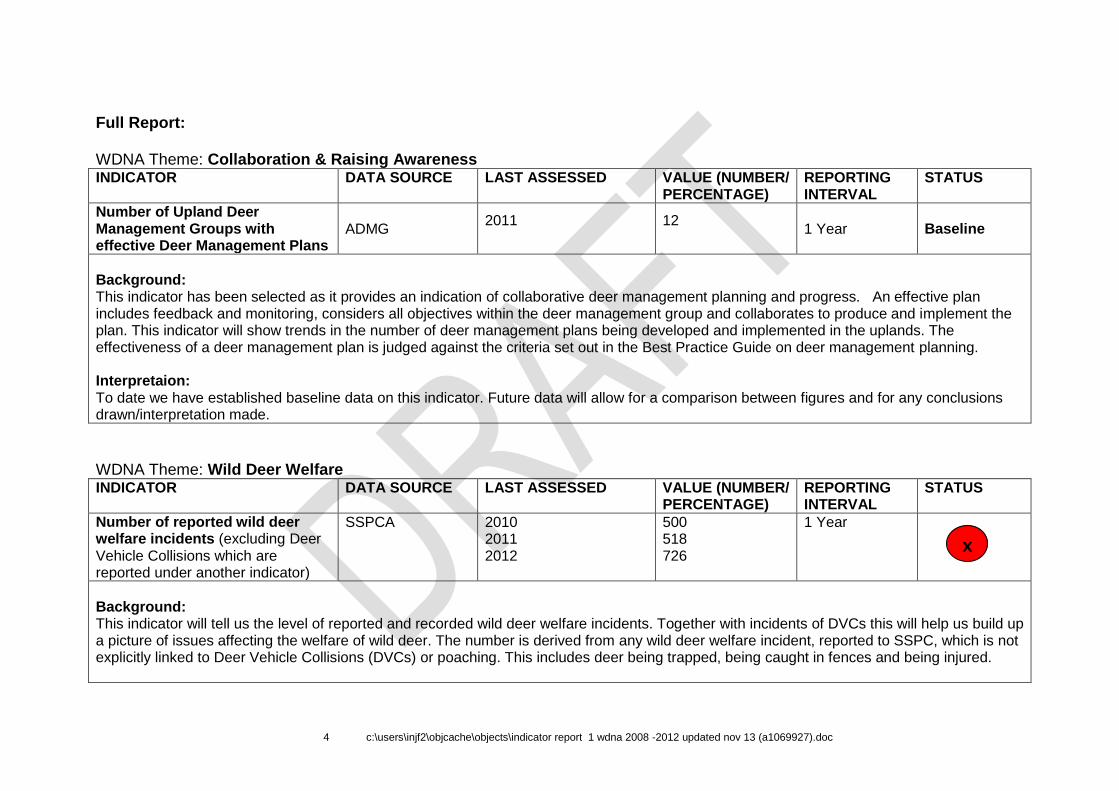
Full Report: WDNA Theme: Collaboration & Raising Awareness INDICATOR DATA SOURCE LAST ASSESSED VALUE (NUMBER/
PERCENTAGE) REPORTING INTERVAL
STATUS
Number of Upland Deer Management Groups with effective Deer Management Plans
ADMG 2011
12
1 Year Baseline
Background: This indicator has been selected as it provides an indication of collaborative deer management planning and progress. An effective plan includes feedback and monitoring, considers all objectives within the deer management group and collaborates to produce and implement the plan. This indicator will show trends in the number of deer management plans being developed and implemented in the uplands. The effectiveness of a deer management plan is judged against the criteria set out in the Best Practice Guide on deer management planning. Interpretaion: To date we have established baseline data on this indicator. Future data will allow for a comparison between figures and for any conclusions drawn/interpretation made.
WDNA Theme: Wild Deer Welfare INDICATOR DATA SOURCE LAST ASSESSED VALUE (NUMBER/
PERCENTAGE) REPORTING INTERVAL
STATUS
Number of reported wild deer welfare incidents (excluding Deer Vehicle Collisions which are reported under another indicator)
SSPCA 2010 2011 2012
500 518 726
1 Year
Background: This indicator will tell us the level of reported and recorded wild deer welfare incidents. Together with incidents of DVCs this will help us build up a picture of issues affecting the welfare of wild deer. The number is derived from any wild deer welfare incident, reported to SSPC, which is not explicitly linked to Deer Vehicle Collisions (DVCs) or poaching. This includes deer being trapped, being caught in fences and being injured.
x

5 c:\users\injf2\objcache\objects\indicator report 1 wdna 2008 -2012 updated nov 13 (a1069927).doc
Interpretation: The number of incidents has risen by approximately 45%. More work needs to be done to determine why there has been such an increase. However in general there have been a higher volume of calls to SSPCA in 2012 than in preceding years (a 22% increase in calls), this could be in part because of a greater awareness of SSPCA. It should also be noted that reporting of incidents is based on individual perceptions. The majority of the issues reported are in urban areas. We will continue to explore whether we can develop additional indicators to give us a fuller picture of issues affecting all species of wild deer welfare in rural as well as urban areas.
WDNA Theme: Sustainable Economic Development INDICATOR DATA SOURCE LAST ASSESSED VALUE
(NUMBER/ PERCENTAGE)
REPORTING INTERVAL
STATUS
Number of reported deer poaching incidents
ACPOS Scottish Wildlife Tasking & Co-ordination Group Tactical Assessment
Dec 09 – Nov 10 Dec10 – Nov 11
92 75
1 Year
Background: This indicator has been selected to track the number of deer poaching incidents. It will allow us to see trends over time in deer poaching incidents. This information is valuable both in terms of estimating the potential scale of deer poaching and economic loss, and can back up anecdotal evidence of concerns. We will include poaching incidents which are reported through the police. We will not include suspected cases. Interpretation: The number of reported deer poaching incidents has declined by approximately 18% from Dec 09 to Nov 11. However it is not possible to deduce anything meaningful from a comparison of two figures. Further data will need to be assessed to determine any emerging trends.
Number of FTE in employment in the deer sector
Background: The PACEC report (The Contribution of Deer Management to the Scottish Economy, PACEC 2006) estimated deer sector employment in Scotland at just over 2,500 full time equivalent jobs in 2005. Tracking deer sector employment is an important measure of sustainable economic development, particularly in times when all sectors of the economy are under pressure in the economic downturn.
Issues with collating data
√

6 c:\users\injf2\objcache\objects\indicator report 1 wdna 2008 -2012 updated nov 13 (a1069927).doc
Issues to Resolve: The deer sector is not recognised as a stand alone sector by conventional employment surveys. This presents us with a problem in collating data. Initiating a new survey would obviously be costly and timely. To avoid this we are exploring whether we can use
membership surveys or statistics on numbers of people going from gamekeeper studies
to full time employment.
Value of Venison to the Scottish Economy
Background: The PACEC report estimated the value of deer management to the economy to be over £100 million in 2005. Venison represents an important economic contribution from the deer sector. As with deer sector employment, it will be important to track this value over time to understand the contribution of the deer sector to Scotland’s sustainable economic development. Issues to Resolve: Gathering date on the value of venison is complex. To address the complexities we are exploring whether we can use an index based on the price gained per kilo of venison. We are also exploring whether we can extract any data from the venison returns from SNH Deer Line.
Issues with collating data
Value of deer stalking to the Scottish Economy
Background: This indicator will provide data on the direct income derived from deer stalking. It will tell us the value of deer stalking to the Scottish economy. As with deer sector employment, it will be important to track this value over time to understand the contribution of the deer sector to Scotland’s sustainable economic development. Issues to Resolve: As with deer sector employment the value of deer stalking is not captured in consumer surveys and profiles. We therefore need to collate new data. We are exploring the possibility of using an index based on a cross section of 100 estates (representing different deer species and habitats). This indicator won’t assess additional income gained through associated spend e.g. local shops, accommodation providers etc. Whilst this may be desirable it is unlikely that we will have sufficient resources to collate data at this level of detail.
Issues with collating data
7 c:\users\injf2\objcache\objects\indicator report 1 wdna 2008 -2012 updated nov 13 (a1069927).doc
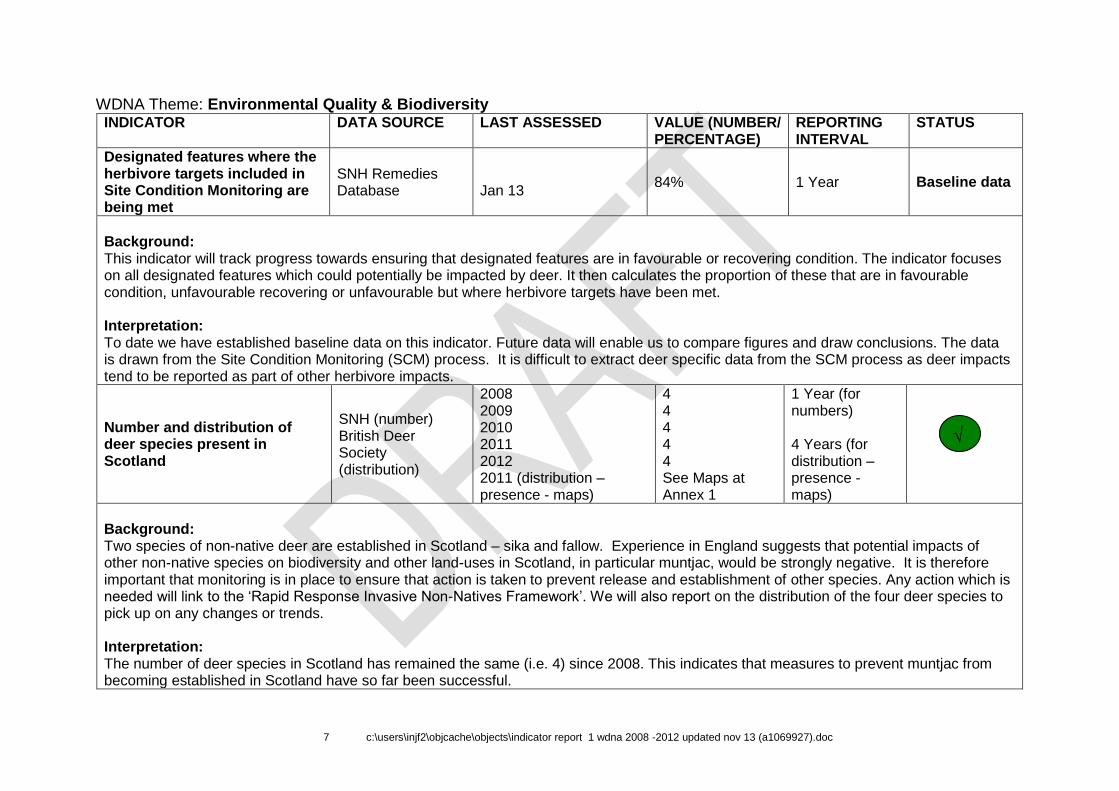
WDNA Theme: Environmental Quality & Biodiversity INDICATOR DATA SOURCE LAST ASSESSED VALUE (NUMBER/
PERCENTAGE) REPORTING INTERVAL
STATUS
Designated features where the herbivore targets included in Site Condition Monitoring are being met
SNH Remedies Database
Jan 13
84% 1 Year Baseline data
Background: This indicator will track progress towards ensuring that designated features are in favourable or recovering condition. The indicator focuses on all designated features which could potentially be impacted by deer. It then calculates the proportion of these that are in favourable condition, unfavourable recovering or unfavourable but where herbivore targets have been met. Interpretation: To date we have established baseline data on this indicator. Future data will enable us to compare figures and draw conclusions. The data is drawn from the Site Condition Monitoring (SCM) process. It is difficult to extract deer specific data from the SCM process as deer impacts tend to be reported as part of other herbivore impacts.
Number and distribution of deer species present in Scotland
SNH (number) British Deer Society (distribution)
2008 2009 2010 2011 2012 2011 (distribution – presence - maps)
4 4 4 4 4 See Maps at Annex 1
1 Year (for numbers) 4 Years (for distribution – presence - maps)
Background: Two species of non-native deer are established in Scotland – sika and fallow. Experience in England suggests that potential impacts of other non-native species on biodiversity and other land-uses in Scotland, in particular muntjac, would be strongly negative. It is therefore important that monitoring is in place to ensure that action is taken to prevent release and establishment of other species. Any action which is needed will link to the ‘Rapid Response Invasive Non-Natives Framework’. We will also report on the distribution of the four deer species to pick up on any changes or trends. Interpretation: The number of deer species in Scotland has remained the same (i.e. 4) since 2008. This indicates that measures to prevent muntjac from becoming established in Scotland have so far been successful.
√
8 c:\users\injf2\objcache\objects\indicator report 1 wdna 2008 -2012 updated nov 13 (a1069927).doc
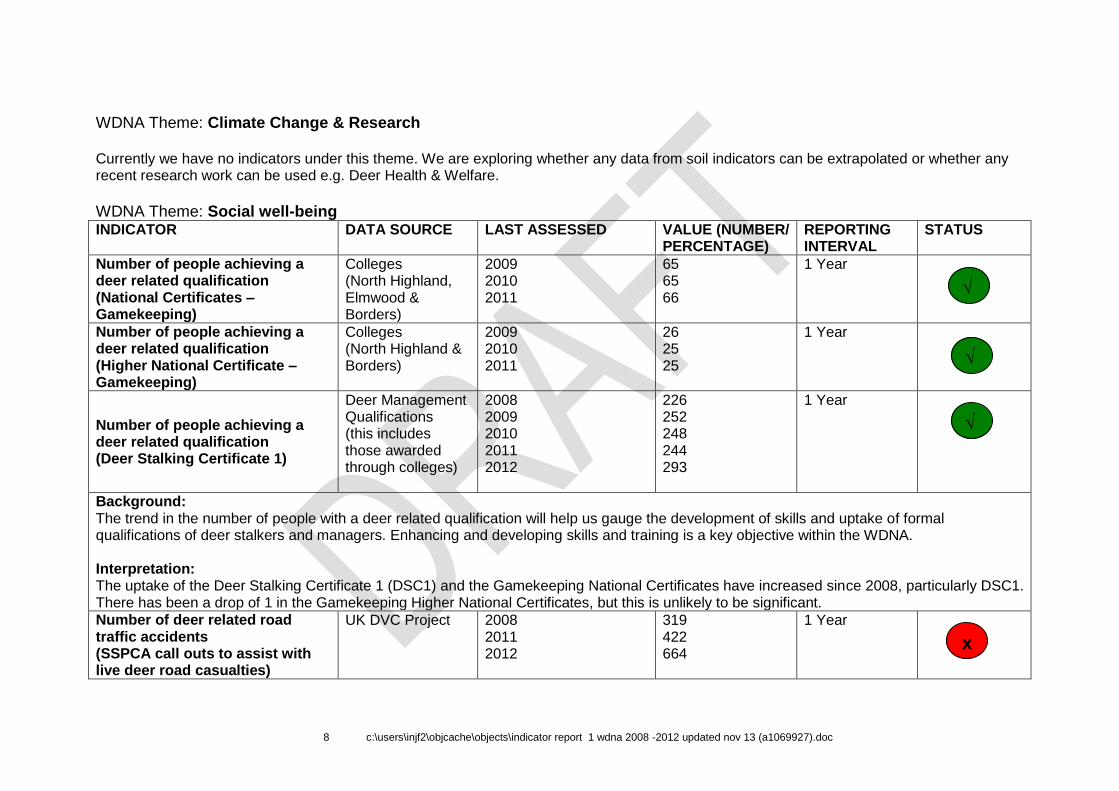
WDNA Theme: Climate Change & Research Currently we have no indicators under this theme. We are exploring whether any data from soil indicators can be extrapolated or whether any recent research work can be used e.g. Deer Health & Welfare.
WDNA Theme: Social well-being INDICATOR DATA SOURCE LAST ASSESSED VALUE (NUMBER/
PERCENTAGE) REPORTING INTERVAL
STATUS
Number of people achieving a deer related qualification (National Certificates – Gamekeeping)
Colleges (North Highland, Elmwood & Borders)
2009 2010 2011
65 65 66
1 Year
Number of people achieving a deer related qualification (Higher National Certificate – Gamekeeping)
Colleges (North Highland & Borders)
2009 2010 2011
26 25 25
1 Year
Number of people achieving a deer related qualification (Deer Stalking Certificate 1)
Deer Management Qualifications (this includes those awarded through colleges)
2008 2009 2010 2011 2012
226 252 248 244 293
1 Year
Background: The trend in the number of people with a deer related qualification will help us gauge the development of skills and uptake of formal qualifications of deer stalkers and managers. Enhancing and developing skills and training is a key objective within the WDNA. Interpretation: The uptake of the Deer Stalking Certificate 1 (DSC1) and the Gamekeeping National Certificates have increased since 2008, particularly DSC1. There has been a drop of 1 in the Gamekeeping Higher National Certificates, but this is unlikely to be significant.
Number of deer related road traffic accidents (SSPCA call outs to assist with live deer road casualties)
UK DVC Project 2008 2011 2012
319 422 664
1 Year
√
√
√
x
9 c:\users\injf2\objcache\objects\indicator report 1 wdna 2008 -2012 updated nov 13 (a1069927).doc
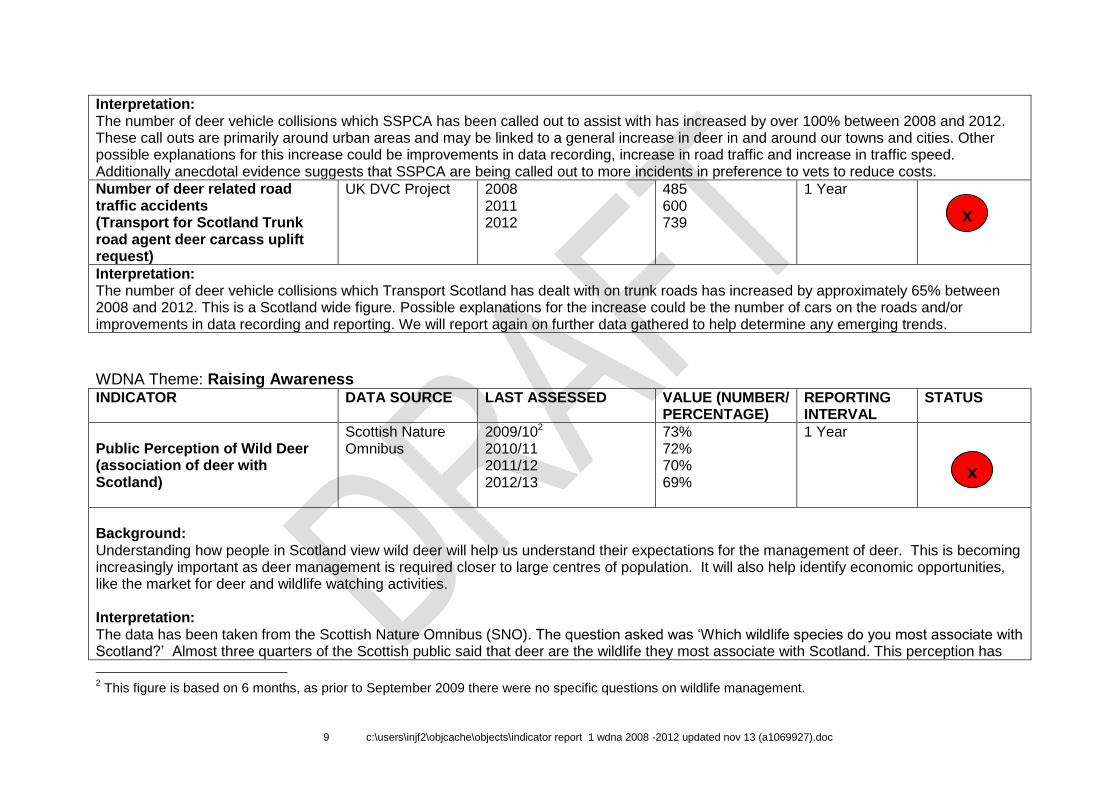
Interpretation: The number of deer vehicle collisions which SSPCA has been called out to assist with has increased by over 100% between 2008 and 2012. These call outs are primarily around urban areas and may be linked to a general increase in deer in and around our towns and cities. Other possible explanations for this increase could be improvements in data recording, increase in road traffic and increase in traffic speed. Additionally anecdotal evidence suggests that SSPCA are being called out to more incidents in preference to vets to reduce costs.
Number of deer related road traffic accidents (Transport for Scotland Trunk road agent deer carcass uplift request)
UK DVC Project 2008 2011 2012
485 600 739
1 Year
Interpretation: The number of deer vehicle collisions which Transport Scotland has dealt with on trunk roads has increased by approximately 65% between 2008 and 2012. This is a Scotland wide figure. Possible explanations for the increase could be the number of cars on the roads and/or improvements in data recording and reporting. We will report again on further data gathered to help determine any emerging trends.
WDNA Theme: Raising Awareness INDICATOR DATA SOURCE LAST ASSESSED VALUE (NUMBER/
PERCENTAGE) REPORTING INTERVAL
STATUS
Public Perception of Wild Deer (association of deer with Scotland)
Scottish Nature Omnibus
2009/102 2010/11 2011/12 2012/13
73% 72% 70% 69%
1 Year
Background: Understanding how people in Scotland view wild deer will help us understand their expectations for the management of deer. This is becoming increasingly important as deer management is required closer to large centres of population. It will also help identify economic opportunities, like the market for deer and wildlife watching activities. Interpretation: The data has been taken from the Scottish Nature Omnibus (SNO). The question asked was ‘Which wildlife species do you most associate with Scotland?’ Almost three quarters of the Scottish public said that deer are the wildlife they most associate with Scotland. This perception has
2 This figure is based on 6 months, as prior to September 2009 there were no specific questions on wildlife management.
x
x

10 c:\users\injf2\objcache\objects\indicator report 1 wdna 2008 -2012 updated nov 13 (a1069927).doc
declined by 16% since 2009. However this may not be a cause for concern. The change may be because the Scottish public have widened their understanding and appreciation of other wildlife species. We will review this indicator to check that it is still fit for purpose.
Public Perception of Wild Deer (Concern over deer)
Scottish Nature Omnibus
2009/103 2010/11 2011/12 2012/13
31% 24% 33% 30% (to date)
1 Year
Interpretation: Not all of those surveyed had concerns about wildlife. The figures above relate to the proportion that did. These people are asked to name which species they had most concerns about. The results from the SNO show that just over a quarter of people surveyed, who had concerns, focused on deer. Golden eagle and wild cat elicited a similar level of concern. The most concerns were expressed about the red squirrel (37% in September 2011). Those in urban populations tended to have the highest concerns about deer. To fully understand the implications of these figures more work would need to be carried out. Severe winters and media focus on deer can affect the results e.g. December 2009 to March 2010 figure was 39%. This was explained in the SNO as being down to ‘Levels of concern for deer rose in March compared with December. Although we cannot be certain, this may be connected with the harsh winter and press coverage of the problems being faced by large animals’. In summary although the trend appears to be positive we still need to keep an eye on future data to see if there are any changes to this.
3 This figure is based on 6 months as prior to September 2009 there were no specific questions on wildlife management
√

11 c:\users\injf2\objcache\objects\indicator report 1 wdna 2008 -2012 updated nov 13 (a1069927).doc
Annex 1: Wild Deer Distribution Maps

12 c:\users\injf2\objcache\objects\indicator report 1 wdna 2008 -2012 updated nov 13 (a1069927).doc

13 c:\users\injf2\objcache\objects\indicator report 1 wdna 2008 -2012 updated nov 13 (a1069927).doc