eurocontrol€¦ · · 2008-09-15this document describes a eurocontrol airspace model simulation...
TRANSCRIPT

EUROPEAN ORGANISATIONFOR THE SAFETY OF AIR NAVIGATION
EUROCONTROL EXPERIMENTAL CENTRE
AIRSPACE MODEL SIMULATION OF THE SCOTTISH FIR/UIR IN PREPARATION FORTHE NEW SCOTTISH AIR TRAFFIC CONTROL CENTRE (NSC)
EEC Note No. 25/97
EEC Task F08EATCHIP Task ISS
Issued: November 1997
The information contained in this document is the property of the EUROCONTROL Agency and no part should be reproduced in anyform without the Agency’s permission.
The views expressed herein do not necessarily reflect the official views or policy of the Agency.
EUROCONTROL
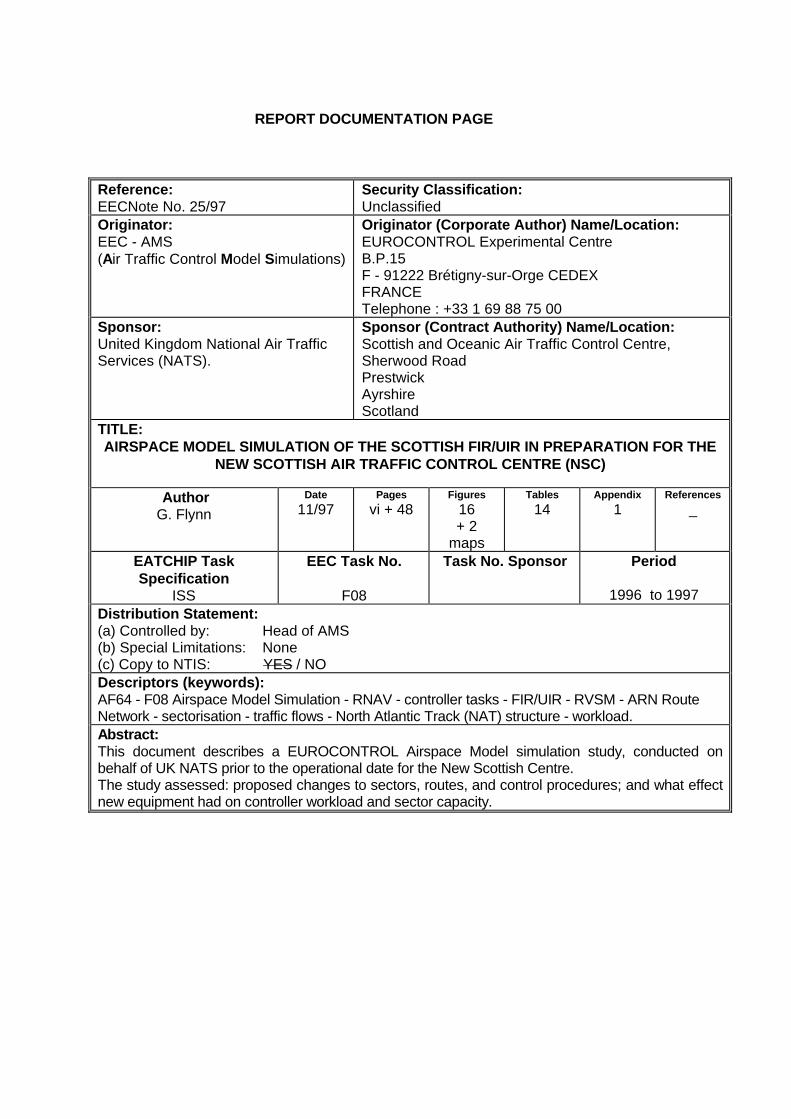
REPORT DOCUMENTATION PAGE
Reference:EECNote No. 25/97
Security Classification:Unclassified
Originator:EEC - AMS(Air Traffic Control Model Simulations)
Originator (Corporate Author) Name/Location:EUROCONTROL Experimental CentreB.P.15F - 91222 Brétigny-sur-Orge CEDEXFRANCETelephone : +33 1 69 88 75 00
Sponsor:United Kingdom National Air TrafficServices (NATS).
Sponsor (Contract Authority) Name/Location:Scottish and Oceanic Air Traffic Control Centre,Sherwood RoadPrestwickAyrshireScotland
TITLE:AIRSPACE MODEL SIMULATION OF THE SCOTTISH FIR/UIR IN PREPARATION FOR THE
NEW SCOTTISH AIR TRAFFIC CONTROL CENTRE (NSC)
AuthorG. Flynn
Date
11/97Pages
vi + 48Figures
16+ 2
maps
Tables
14Appendix
1References
_
EATCHIP TaskSpecification
ISS
EEC Task No.
F08
Task No. Sponsor Period
1996 to 1997Distribution Statement:(a) Controlled by: Head of AMS(b) Special Limitations: None(c) Copy to NTIS: YES / NODescriptors (keywords):AF64 - F08 Airspace Model Simulation - RNAV - controller tasks - FIR/UIR - RVSM - ARN RouteNetwork - sectorisation - traffic flows - North Atlantic Track (NAT) structure - workload.Abstract:This document describes a EUROCONTROL Airspace Model simulation study, conducted onbehalf of UK NATS prior to the operational date for the New Scottish Centre.The study assessed: proposed changes to sectors, routes, and control procedures; and what effectnew equipment had on controller workload and sector capacity.

This document has been collated by mechanical means. Should there be missing pages, pleasereport to:
EUROCONTROL Experimental CentrePublications Office
B.P. 1591222 - BRETIGNY-SUR-ORGE CEDEX
France

AMS Centre of Expertise
EUROCONTROL Experimental Centre
AMS study F08 New Scottish Area Control Centre NSC
Page ii
EUROCONTROL
Contents
Contents ii - iii
List of tables iv
List of abbreviations v - vi
Chapter One Introduction 1
1 Section contents 1
1.1 The purpose and objectives of the study 1
1.2 The civil traffic samples used 2
1.3 Description of the organisations simulated. 3
1.4 Air traffic control tasks 6
1.5 Aircraft performance data 8
1.6 The reference organisation 9
1.7 Capacity assessment 9
1.8 Simulation maps 9
1.9 Composition of results 10
1.10 Document structure 10

AMS Centre of Expertise
EUROCONTROL Experimental Centre
AMS study F08 Simulation of New Scottish Area Control Centre (NSC)
Page iii
EUROCONTROL
Chapter 2 Results summary specific to objectives 12
2.1 Traffic distribution. 12
2.2 Workload figures 17
2.3 Capacity assessment 21
2.4 Other route and sector modifications 29
Chapter 3 Other noteworthy results 34
3.1 Use of RVSM levels in the airspace 34
3.2 Traffic density in the TMA 35
3.3 Busiest periods in sectors 39
Conclusions and recommendations 43
Annexe EAM simulation maps 46

AMS Centre of Expertise
EUROCONTROL Experimental Centre
AMS study F08 Simulation of New Scottish Area Control Centre (NSC)
Page iv
EUROCONTROL
List of tables
1.2.1 Table 1 Traffic flows in samples. 2
1.2.2 Table 2 Sample names 3
1.3.1 Table 3 Sectors in reference organisation. 3
1.3.2 Table 4 Sectors in proposed organisation. 4
2.2.2 Table 5 Workload figures per sector 20
2.3.1 Table 6 Limiting factors on capacity 30
2.4.3 Table 7 Conflicts in Antrim sector 28
3.2.1 Table 8 Main traffic flows 36
3.3.1. Table 9 Sample one - busiest hour per sector 39
3.3.2 Table 10 Sample two - busiest hour per sector 40
3.3.3 Table 11 Sample three - busiest hour per sector 40
3.3.4 Table 12 Sample four - busiest hour per sector 41
3.3.5 Table 13 Sample five - busiest hour per sector 41
3.3.6 Table 14 Sample six - busiest hour per sector 42
AMS Centre of Expertise
EUROCONTROL Experimental Centre
AMS study F08 Simulation of New Scottish Area Control Centre (NSC)
Page v
EUROCONTROL
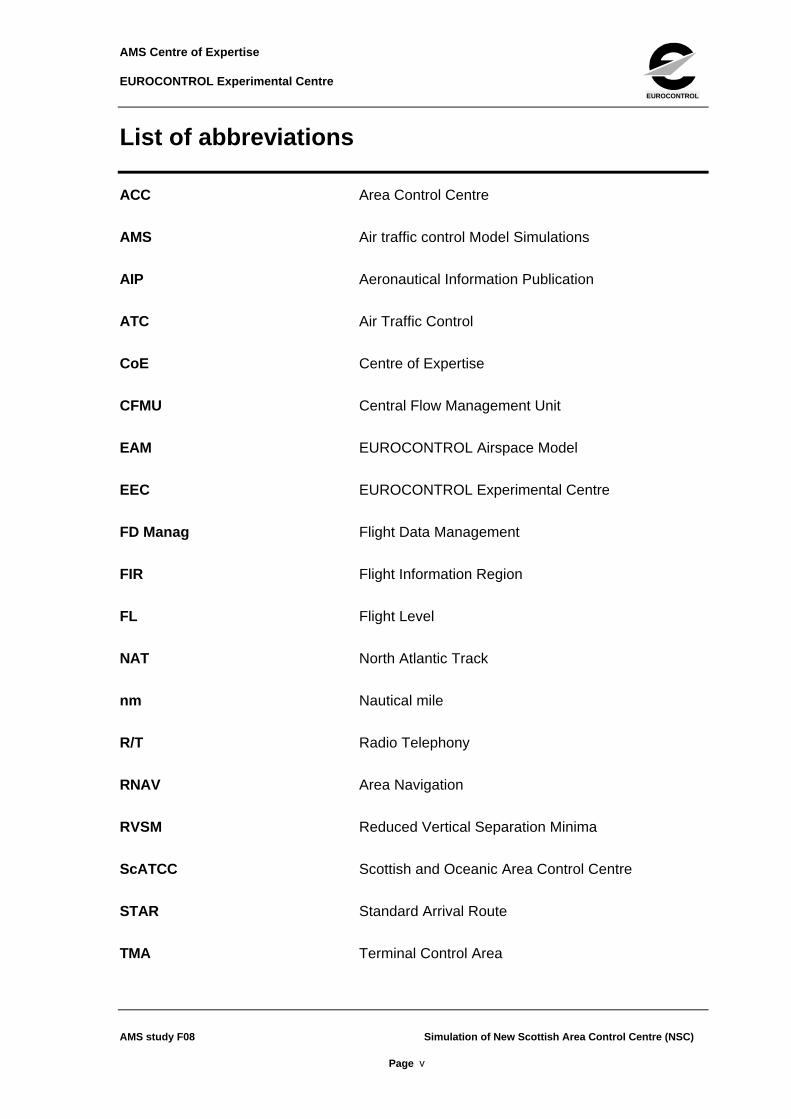
List of abbreviations
ACC Area Control Centre
AMS Air traffic control Model Simulations
AIP Aeronautical Information Publication
ATC Air Traffic Control
CoE Centre of Expertise
CFMU Central Flow Management Unit
EAM EUROCONTROL Airspace Model
EEC EUROCONTROL Experimental Centre
FD Manag Flight Data Management
FIR Flight Information Region
FL Flight Level
NAT North Atlantic Track
nm Nautical mile
R/T Radio Telephony
RNAV Area Navigation
RVSM Reduced Vertical Separation Minima
ScATCC Scottish and Oceanic Area Control Centre
STAR Standard Arrival Route
TMA Terminal Control Area

AMS Centre of Expertise
EUROCONTROL Experimental Centre
AMS study F08 Simulation of New Scottish Area Control Centre (NSC)
Page vi
EUROCONTROL
UIR Upper Flight Information Region
EXEC Executive controller
PLN Planner

AMS Centre of Expertise
EUROCONTROL Experimental Centre
AMS study F08 New Scottish Area Control Centre NSC
Page 1
EUROCONTROL
Chapter One Introduction
1 Section contents
This section describes:
• the purpose and objectives of the study
• details of the traffic samples
• description of the organisations simulated
• EAM air traffic controller tasks
• EAM aircraft performance data
• reference organisation
• EAM simulation maps
• results produced by the model
• document structure
1.1 The purpose and objectives of the study
The UK National Air Traffic Services (UK NATS) requested a fast time simulation study of
the Scottish FIR/UIR as part of strategic planning for a new Air traffic Control Centre (ACC)
in Prestwick, Scotland. The overall objectives of the study were:
a) to assess the impact of new equipment which will be installed in the new centre,
upon proposed sectorisation, route structure and control procedures foreseen to
be in use from 1997 to 2001;
b) to identify any potential increases in sector capacity as a result of a reduction in
controller workload following the automation of certain control tasks;
c) to evaluate the effect of proposed sectors changes and RNAV routes;
d) to identify areas requiring further design.
AMS Centre of Expertise
EUROCONTROL Experimental Centre
AMS Centre of Expertise Study AF64/F08 Simulation of New Scottish Area Control Centre (NSC)
Page 2
EUROCONTROL
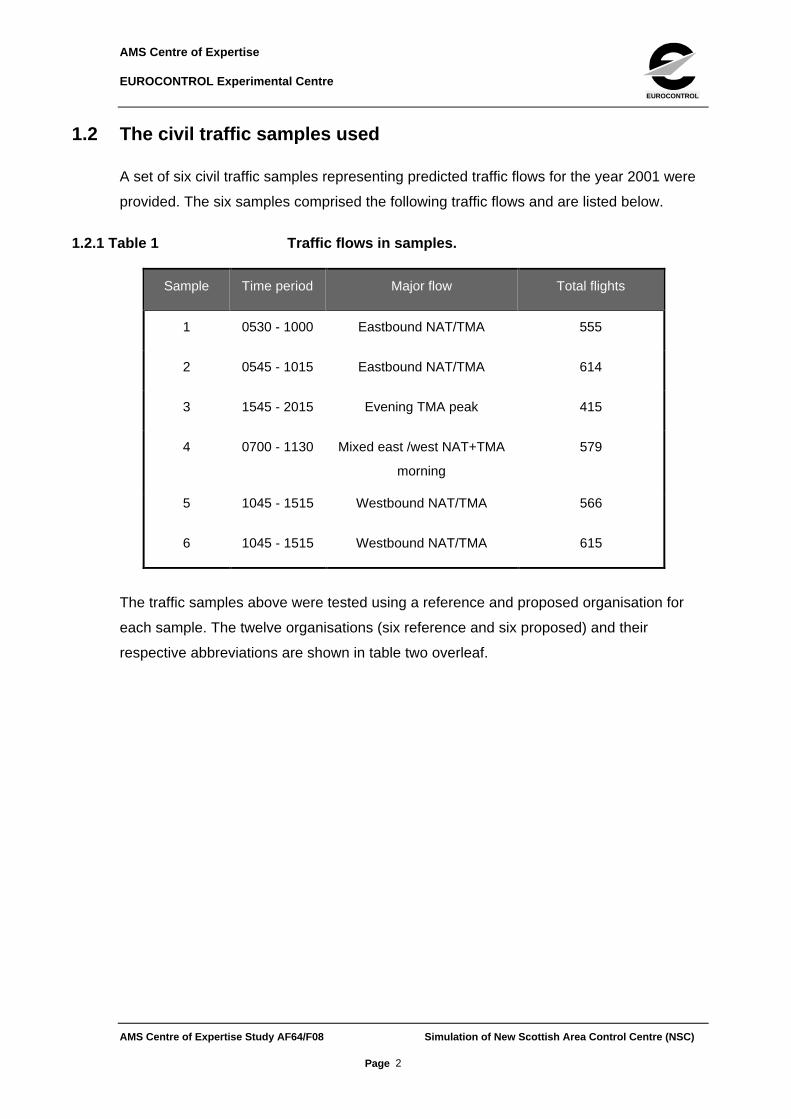
1.2 The civil traffic samples used
A set of six civil traffic samples representing predicted traffic flows for the year 2001 were
provided. The six samples comprised the following traffic flows and are listed below.
1.2.1 Table 1 Traffic flows in samples.
Sample Time period Major flow Total flights
1 0530 - 1000 Eastbound NAT/TMA 555
2 0545 - 1015 Eastbound NAT/TMA 614
3 1545 - 2015 Evening TMA peak 415
4 0700 - 1130 Mixed east /west NAT+TMA
morning
579
5 1045 - 1515 Westbound NAT/TMA 566
6 1045 - 1515 Westbound NAT/TMA 615
The traffic samples above were tested using a reference and proposed organisation for
each sample. The twelve organisations (six reference and six proposed) and their
respective abbreviations are shown in table two overleaf.

AMS Centre of Expertise
EUROCONTROL Experimental Centre
AMS Centre of Expertise Study AF64/F08 Simulation of New Scottish Area Control Centre (NSC)
Page 3
EUROCONTROL
1.2.2 Table 2 Sample names
Sample number Reference organisation Proposed organisation
1 REF1 PRO1
2 REF2 PRO2
3 REF3 PRO3
4 REF4 PRO4
5 REF5 PRO5
6 REF6 PRO6
1.3 Description of the organisations simulated.
Table 3 shows the sectors and abbreviations used in the reference organisation and table
4 shows those for the proposed organisation. The principle traffic flows contained in each
sample are also shown.
1.3.1 Table 3 Sectors in reference organisation.
Note: Vs = overflights, ↑ and ↓ represent climbing and descending flights respectively
Sector name Abbreviation Vertical limits* Principle flows
TMA out TMOUT 6000' - FL255 TMA departures + Vs
TMA in TMAIN 6000' - FL255 TMA arrivals + Vs
Dean Cross DCS FL255 - FL600 NAT traffic + TMA ↑ ↓
Forth Low FORLO 6000' - FL245 low level domestic
Forth Upper FORUP FL245 - FL600 domestic + NAT
Antrim ANTRM 6000' - FL245/265 Belfast TMA + domestic
West Coast WCOAS 6000' - FL245 domestic
South West SWEST FL245 - FL600 NAT
Moray MORAY 6000' - FL600 domestic + NAT
Hebrides HEBRI 6000' - FL600 domestic + NAT
Central CENTR FL245 - FL600 NAT

AMS Centre of Expertise
EUROCONTROL Experimental Centre
AMS Centre of Expertise Study AF64/F08 Simulation of New Scottish Area Control Centre (NSC)
Page 4
EUROCONTROL
1.3.2 Table 4 Sectors in proposed organisation.
Sector name Abbreviation Vertical limits Principle flows
TMA out TMOUT 6000' - FL255 TMA departures + Vs
TMA in TMAIN 6000' - FL255 TMA arrivals + Vs
Dean Cross DCS FL255 - FL600 NAT traffic + TMA ↑ ↓
Fife FIFE 6000' - FL255 * low level domestic
Brent BRENT FL000 - FL600 * domestic + NAT
Antrim ANTRM 6000' - FL245/265 Belfast TMA + domestic
West Coast WCOAS 6000' - FL255 * domestic
South West SWEST FL255 - FL600 NAT
Moray MORAY 6000' - FL600 domestic + NAT
Hebrides HEBRI 6000' - FL600 domestic + NAT
Central CENTR FL245 - FL600 NAT
1.3.3 New routes included in the reference organisation.
• DET-TLA for overflights at FL300 or above from departure points outside the UK.
• BHD-TRN for TMA arrivals from Spain, Portugal and the Canaries.
• TOPPA-STN-59°n 10°n, for traffic previously routeing via SILVA-FAMBO-59°n10°w.
• TOPPA-STN-60°n10°w for traffic previously routeing via LONAM-SKATE-60°n10°w.
• TOPPA-ADN-61°n10°w for traffic previously routeing via LONAM-SKATE-61°n10°w.
• Arrivals to Edinburgh from Heathrow and Gatwick re-routed to new STAR DET-TLA.
1.3.4 The RVSM transition area.
Airspace encompassing Hebrides, Dean Cross and South West sectors was defined as
the RVSM transition area where standard semi-circular and RVSM flight levels were

AMS Centre of Expertise
EUROCONTROL Experimental Centre
AMS Centre of Expertise Study AF64/F08 Simulation of New Scottish Area Control Centre (NSC)
Page 5
EUROCONTROL
permitted. However, to avoid overloading the Dean Cross sector, pilot or controller
requests for a reclearance to a RVSM flight level were not permitted in that sector.
1.3.5 New routes included in the proposed organisation.
The route structure in the proposed included all routes in the reference organisation
plus the following RNAV and other routes listed below.
RNAV routes:
• RONAK 6100°n 00630°w;
• VES 5700°n 01000°w;
• VES 5800°n 01000°w;
• VES 5900°n 01000°w;
• VES 6000°n 01000°w;
• AAL 5900°n 01000°w;
• AAL 6000°n 01000°w;
• AAL 6200°n 01000°w;
• AAL 6100°n 01000°w.
Other routes:
• POL-55°n10°w;
• POL-56°n10°w;
• POL-57°n10°w;
• WAL-55°n10°w;
• WAL-56°n10°w;

AMS Centre of Expertise
EUROCONTROL Experimental Centre
AMS Centre of Expertise Study AF64/F08 Simulation of New Scottish Area Control Centre (NSC)
Page 6
EUROCONTROL
• WAL-57°n10°w;
• northerly extension of route TELBA-WHI-BARRO to GOW for TMA departures
landing EGKK and for overflights via MID;
• routes from oceanic entry points 61°n - 57°n 10°w to WHI for Gatwick arrivals and
MID overflights;
• TRN-WAL;
• NGY-WAL.
1.3.6 Sector changes in proposed organisation
The changes to sectors in the proposed organisation altered the geographical
dimensions of the FORLO and FORUP sectors to create FIFE and BRENT sectors. The
FORLO sector was reduced in geographical size but the revised eastern boundary
encompassed airspace between ADN, NEW and TALLA.
The Brent sector overlay the Fife sector and assumed control of the lower airspace in
the eastern North Sea area previously under the control of the Forth Low sector
(FORLO). See maps in the Annexe.
In the Antrim sector, airway B3 was widened from 10nm to 15nm and fillets of airspace
between IOM and MAGEE and IOM and MULLA were introduced.
1.4 Air traffic control tasks
The airspace model analyses the progress of each flight as it transits the simulation
area to detect the necessary ATC actions to process the flight. Controller tasks are
grouped into five categories and are assigned to the appropriate controller (executive or
planning) and sector.
The five groups are:
• Flight data management (FD Manag);
• Coordination (encompasses internal and external coordinations);
AMS Centre of Expertise
EUROCONTROL Experimental Centre
AMS Centre of Expertise Study AF64/F08 Simulation of New Scottish Area Control Centre (NSC)
Page 7
EUROCONTROL
• Conflict search tasks to determine ATC clearances;
• Routine R/T communications;
• Radar tasks.
Controllers in the Working Group defined the current task descriptions and their
respective execution times. Any alterations, additional tasks or changes to the
execution times as a result of the automated system, were also defined by the ScATCC
controllers in the Working Group.
In general, the new tasks and changes to task execution times had the greatest impact
upon flight data management and controller coordination tasks.
For modelling purposes, the new tasks were allocated in blocks relating to generic
traffic flows. These flows were: flights departing from an airfield in the simulated
airspace; traffic landing in the simulated area; en-route overflights entering from and
exiting to adjacent ATC units.
Each flow was assigned a set of tasks that were triggered by the flight category and
recorded by the model.
1.4.1 Radar Tasks
Radar tasks are divided into two categories: radar supervisions and radar interventions.
A radar supervision is the close monitoring of a potential conflict between two aircraft
where a tactical intervention is deemed unnecessary. An instruction such as "maintain
heading" may be issued.
A radar intervention is the tactical alteration of an aircraft's heading, level or speed to
maintain standard radar separation in accordance with the requirements of a controlling
agency.
There are nine types of radar conflicts recorded by the model. These are grouped into
three classes relating to the lateral separation between flights: i.e. same track, crossing
track or opposite track. These classes are sub-divided in relation to the vertical
displacement between the aircraft concerned: same level, both aircraft in cruise, one

AMS Centre of Expertise
EUROCONTROL Experimental Centre
AMS Centre of Expertise Study AF64/F08 Simulation of New Scottish Area Control Centre (NSC)
Page 8
EUROCONTROL
aircraft in cruise and the other in climb or descent, and both aircraft in climb or descent.
The conflict types are numbered 1-9 as listed below and apply to both radar
interventions and radar supervisions.
,Type 1 Same track - same level - both aircraft in cruise
,Type 2 Same track - one in cruise - one in climb or descent
,Type 3 Same track - both in climb or descent
,Type 4 Crossing tracks - same level - both aircraft in cruise
,Type 5 Crossing tracks - one in cruise - one in climb or descent
,Type 6 Crossing tracks - both in climb or descent
,Type 7 Opposite tracks - same level - both aircraft in cruise
,Type 8 Opposite tracks - one in cruise - one in climb or descent
,Type 9 Opposite tracks - both in climb or descent
1.5 Aircraft performance data
The airspace model recognises more than 250 different aircraft types. These aircraft
types are grouped into 60 categories of performance.
Detailed data on speed of the flight on cruise, climb, descent and rate of climb and
descent are available for each aircraft. Minimum and maximum performance figures in
each category are available.
These data are used by the model to construct the requested and final flight profile of
each aircraft in the simulated airspace. Detailed information on the figures applied may
be obtained from the EUROCONTROL Experimental Centre, CoE AMS.
AMS Centre of Expertise
EUROCONTROL Experimental Centre
AMS Centre of Expertise Study AF64/F08 Simulation of New Scottish Area Control Centre (NSC)
Page 9
EUROCONTROL
1.6 The reference organisation
All EAM simulations use a reference against which changes to the airspace, control
procedures or routes are measured. Generally this reference is a "current"
representation of the routes, traffic levels, airspace and procedures in use at the air
traffic unit being simulated. This reference exercise is then validated by the Working
Group and altered where required to accurately reflect the procedures, aircraft
performances and special requirements of the unit. This validation process ratifies the
simulation results and provides a benchmark against which changes are measured.
However, in this simulation, the "reference" exercises incorporated planned
future sectors, routes, procedures, separation standards and forecast traffic
levels. Therefore, they were not representative of current traffic levels and
procedures.
This use of a future scenario, routes and procedures as a reference made any direct
comparison between the current status and a "next step" impossible. Therefore, a
measurement of a maximum work threshold was not applied.
1.7 Capacity assessment
The method used to identify any capacity benefit was as follows: In each reference
exercise run on the six samples, the highest total workload figure attributed to the
busiest controller (executive or planner) was extracted. This figure was deemed to be
the overall "limiting factor" in the simulation area and to the ATC system for that
particular traffic sample.
The same process was applied to the proposed organisation. If the overall limiting
factor was less than that recorded in the reference organisation, the difference between
the two represented a potential capacity increase for the area based on the traffic flows
in that sample.
1.8 Simulation maps
The simulation maps shown in the Annexe are a definition of the airspace in
accordance with the requirements of the EUROCONTROL Airspace Model (EAM).

AMS Centre of Expertise
EUROCONTROL Experimental Centre
AMS Centre of Expertise Study AF64/F08 Simulation of New Scottish Area Control Centre (NSC)
Page 10
EUROCONTROL
They do not correspond to official AIP publications as they show only the routes route
points contained in the traffic samples. They also contain adjustments required by the
EAM to adequately detect and resolve conflicts. This means that in cases where routes
in reality are close together, converging or not separated, the maps depict this as a
single line. This single line or route does not contain all the points in an official route
structure. Additional numerical points appearing on the maps are created by the model
to assist in the calculation of flight profiles.
1.9 Composition of results
The model generates a large amount of data that includes the following statistics:
• numbers of traffic recorded in each simulated sector;
• controller working times for each task category and position;
• flight level usage in level bands;
• conflicts recorded during the simulation;
• loading on the simulated control positions;
• numbers of flights over geographical points in the airspace;
• average flight time in each sector;
• delays recorded in minutes;
• point and sector loading statistics;
• list of events for each simulated flight.
1.10 Document structure
As shown above, the EAM produces a vast amount of statistics and results. This
document summarises extracts of the statistics and results from the model which were
directly concerned with the simulation objectives listed on page 1. All other tabular lists
AMS Centre of Expertise
EUROCONTROL Experimental Centre
AMS Centre of Expertise Study AF64/F08 Simulation of New Scottish Area Control Centre (NSC)
Page 11
EUROCONTROL
of results and bar charts are available on request from the Airspace Model Simulation
(AMS) CoE at the EUROCONTROL Experimental Centre.
Chapter 2 Summarises overall results in relation to simulation objectives.
Chapter 3 Other noteworthy results or trends identified.
Chapter 4 Conclusions and recommendations.
Annexe EAM simulation sector maps.

AMS Centre of Expertise
EUROCONTROL Experimental Centre
AMS Centre of Expertise Study AF64/F08 Simulation of New Scottish Area Control Centre (NSC)
Page 12
EUROCONTROL
Chapter 2 Results summary specific to objectives
2.1 Traffic distribution
Traffic distribution and sector penetrations are directly related to the traffic flows
contained in the traffic sample and the performance characteristics of different aircraft
types. The numbers of recorded sector penetrations are affected by changes to the
route structure and geographical or vertical dimensions of sectors.
Although not a critical statistic in a simulation study, the numbers of flights entering a
sector will trigger standard or routine controller tasks in a simulated environment - as
they do in reality. For example; the frequency of certain routine or standard tasks, such
as the numbers of R/T tasks recorded for first and last radio transmission to a flight, will
increase in a linear manner relative to the increase in the numbers of flights entering
the sector. This, in turn, affects controller workload recordings for those tasks.
In this simulation, the proposed route structure had the same basic route structure as
the reference structure plus the routes listed on pages 5 and 6. The majority of new
routes affected westbound oceanic traffic flows. Therefore, there was no significant
difference in traffic figures recorded between the reference and proposed organisations
in samples 1, 2 and 3.
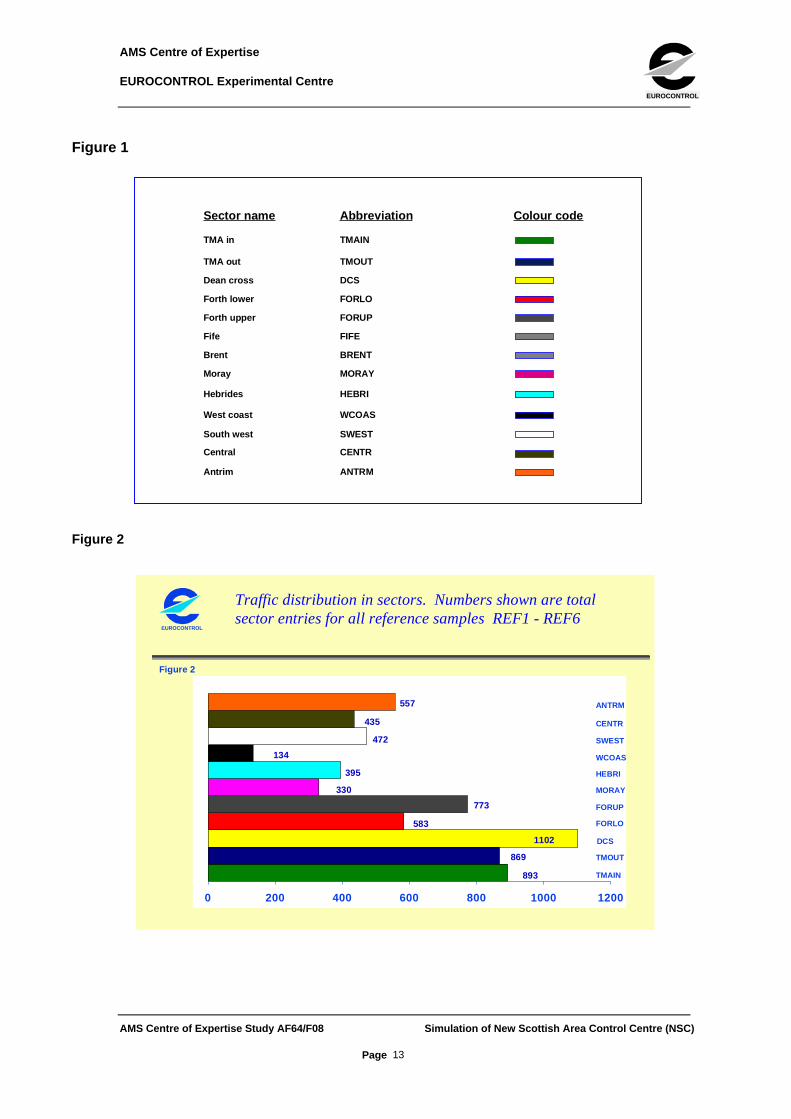
Figures 2 and 3 show the total sector penetrations recorded for each sector in all
reference and proposed organisation samples respectively.
Note: All the bar charts in this document were colour coded to represent individual
sectors with a specific colour. The sector names and their respective colours are shown
in figure 1, page 13.
AMS Centre of Expertise
EUROCONTROL Experimental Centre
AMS Centre of Expertise Study AF64/F08 Simulation of New Scottish Area Control Centre (NSC)
Page 13
EUROCONTROL
Figure 1
Figure 2
Sector name Abbreviation Colour code
Antrim ANTRM
TMA in
TMA out
Dean cross
Forth lower
Forth upper
Moray
Hebrides
West coast
South west
Central
Fife
Brent
CENTR
SWEST
WCOAS
HEBRI
MORAY
BRENT
FIFE
FORLO
FORUP
DCS
TMAIN
TMOUT
2
2
EUROCONTROL
2
2
Traffic distribution in sectors. Numbers shown are totalsector entries for all reference samples REF1 - REF6
0 200 400 600 800 1000 1200
TMAIN
TMOUT
DCS
FORLO
FORUP
MORAY
HEBRI
WCOAS
SWEST
CENTR
ANTRM
Figure 2
557
435
472
134
395
330
773
583
1102
869
893
AMS Centre of Expertise
EUROCONTROL Experimental Centre
AMS Centre of Expertise Study AF64/F08 Simulation of New Scottish Area Control Centre (NSC)
Page 14
EUROCONTROL
Figure 3
3
3
EUROCONTROL
3
3
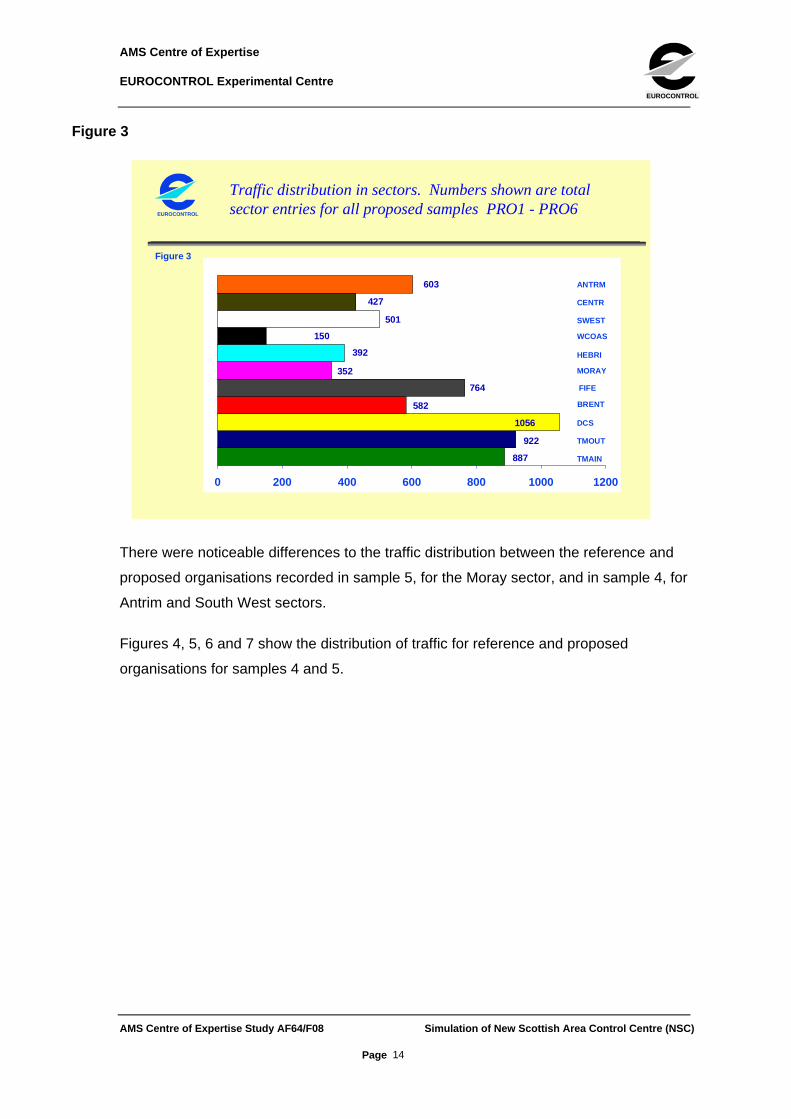
Traffic distribution in sectors. Numbers shown are totalsector entries for all proposed samples PRO1 - PRO6
0 200 400 600 800 1000 1200
TMAIN
TMOUT
DCS
BRENT
MORAY
HEBRI
WCOAS
SWEST
CENTR
ANTRM
FIFE
Figure 3
603
427
501
150
392
352
764
582
1056
922
887
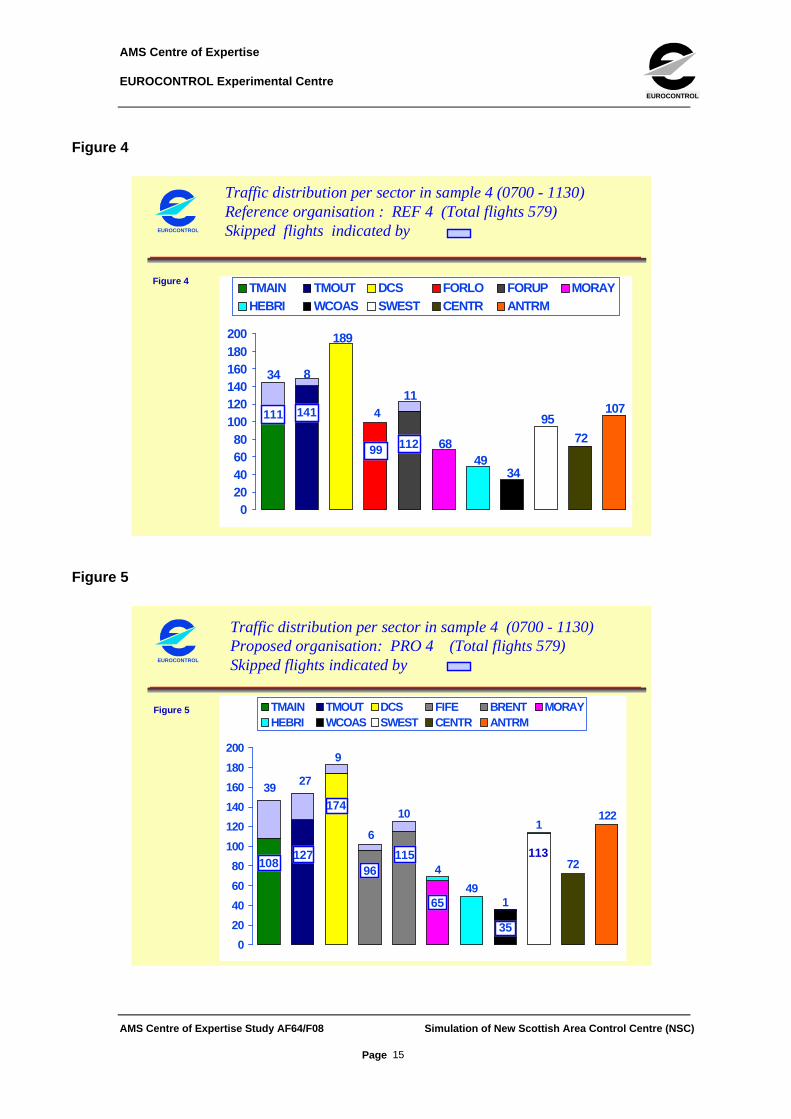
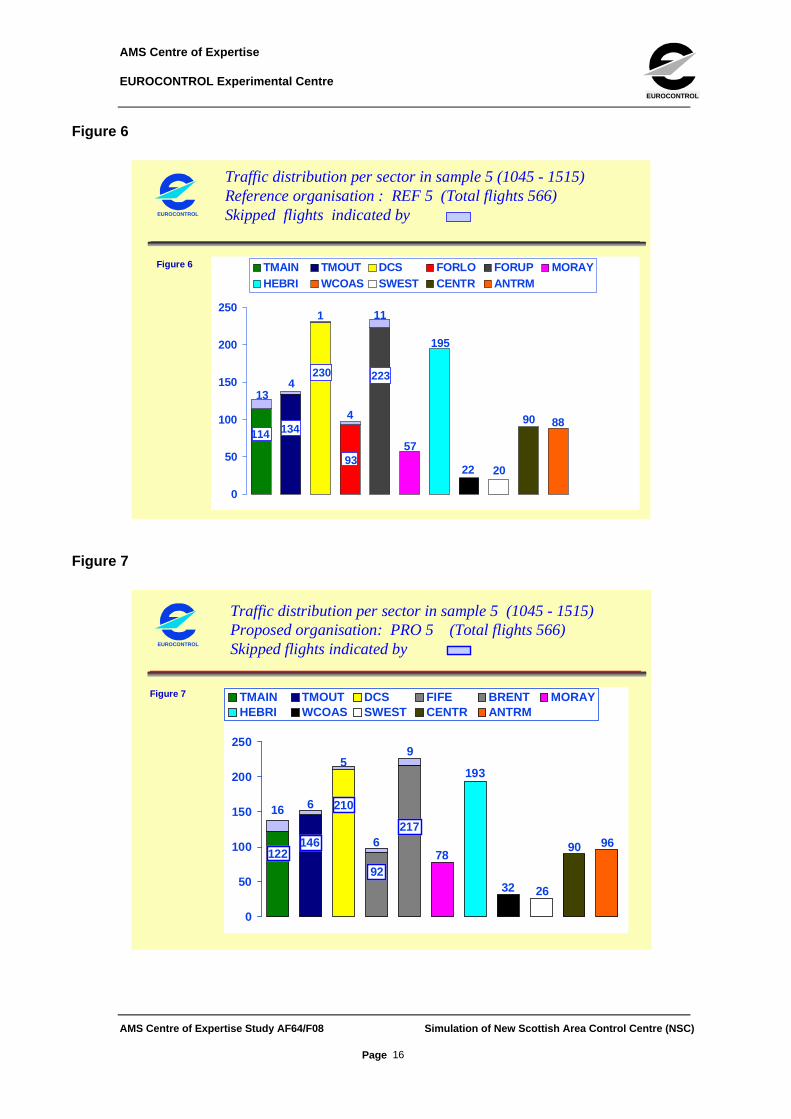
There were noticeable differences to the traffic distribution between the reference and
proposed organisations recorded in sample 5, for the Moray sector, and in sample 4, for
Antrim and South West sectors.
Figures 4, 5, 6 and 7 show the distribution of traffic for reference and proposed
organisations for samples 4 and 5.
AMS Centre of Expertise
EUROCONTROL Experimental Centre
AMS Centre of Expertise Study AF64/F08 Simulation of New Scottish Area Control Centre (NSC)
Page 15
EUROCONTROL
Figure 4
10
10
EUROCONTROL
10
10
Traffic distribution per sector in sample 4 (0700 - 1130)Reference organisation : REF 4 (Total flights 579)Skipped flights indicated by
34 8
189
11
6849
34
95
72
107
020406080
100120140160180200
TMAIN TMOUT DCS FORLO FORUP MORAYHEBRI WCOAS SWEST CENTR ANTRM
111 141
99 112
4
Figure 4
Figure 5
16
16
EUROCONTROL
16
16
Traffic distribution per sector in sample 4 (0700 - 1130)Proposed organisation: PRO 4 (Total flights 579)Skipped flights indicated by
39 27
9
6
10
4
491
1
72
122
0
20
40
60
80
100
120
140
160
180
200
TMAIN TMOUT DCS FIFE BRENT MORAYHEBRI WCOAS SWEST CENTR ANTRM
108127
174
96115
65
35
113
Figure 5
AMS Centre of Expertise
EUROCONTROL Experimental Centre
AMS Centre of Expertise Study AF64/F08 Simulation of New Scottish Area Control Centre (NSC)
Page 16
EUROCONTROL
Figure 6
1
1
EUROCONTROL
1
1
Traffic distribution per sector in sample 5 (1045 - 1515)Reference organisation : REF 5 (Total flights 566)Skipped flights indicated by
114 134
134
1
4
11
57
195
22 20
90 88
0
50
100
150
200
250
TMAIN TMOUT DCS FORLO FORUP MORAYHEBRI WCOAS SWEST CENTR ANTRM
230
93
223
114 134
Figure 6
Figure 7
17
17
EUROCONTROL
17
17
Traffic distribution per sector in sample 5 (1045 - 1515)Proposed organisation: PRO 5 (Total flights 566)Skipped flights indicated by
16 6
5
6
9
193
32 26
90 96
0
50
100
150
200
250
TMAIN TMOUT DCS FIFE BRENT MORAYHEBRI WCOAS SWEST CENTR ANTRM
122146
210
92
217
78
Figure 7

AMS Centre of Expertise
EUROCONTROL Experimental Centre
AMS Centre of Expertise Study AF64/F08 Simulation of New Scottish Area Control Centre (NSC)
Page 17
EUROCONTROL
The effect of the increased numbers of flights entering Moray, Antrim or South West
sector as a result of route changes is shown in chapter 2, paragraphs 2.4 - 2.5.
The overall controller workload figures recorded for the proposed organisation were
markedly less as a result of the new equipment and the new tasks or execution times.
(See below)
2.2 Workload figures
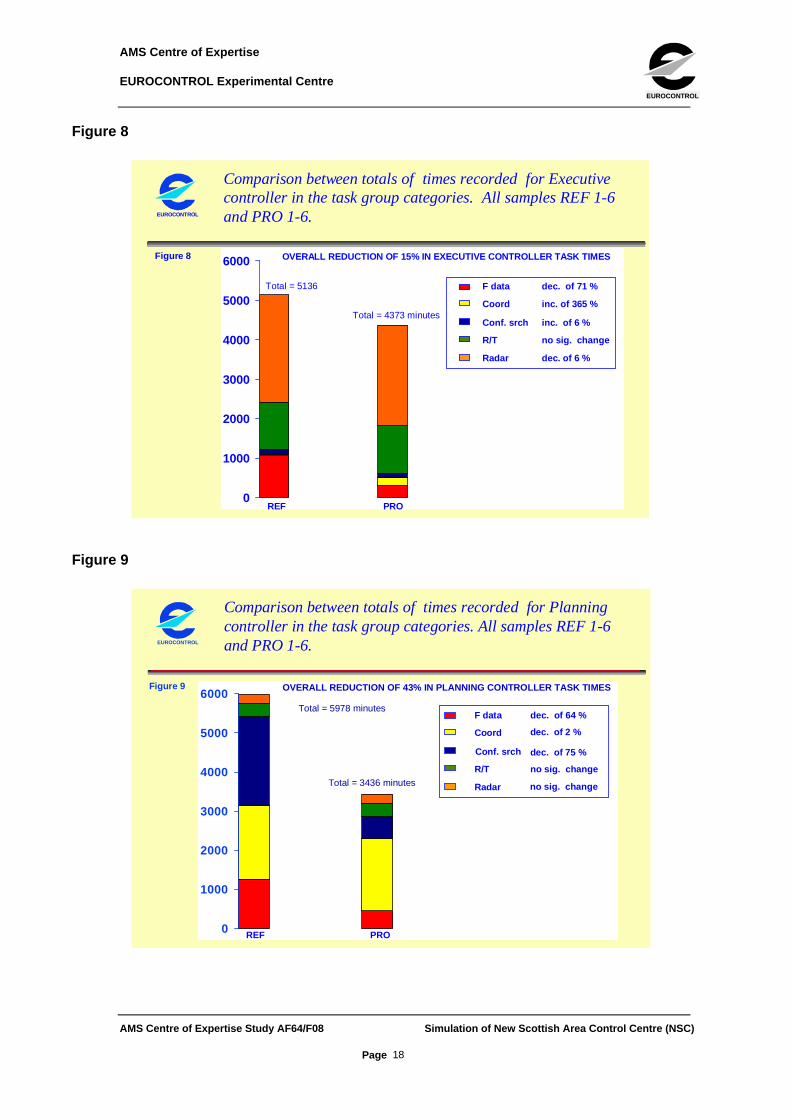
The reduction in controller workload recorded as a consequence of the new equipment
was the most significant result of this study.
The effect of the new equipment upon flight data management tasks achieved the
greatest benefit in task reduction time. As shown in figures 8 and 9, the average
percentage reductions in executive controller workload between the reference and
proposed organisations were:
• 15% for the executive controller task times
• • 41% for the planning controller task times
These recorded workload reductions were substantial and indicate a potential to
improve capacity throughout the airspace. This was an extremely important and
encouraging result.
It should be noted, however, that although the total task times for the executive and
planning controllers were reduced overall, the task times recorded for the executive
controller in certain co-ordination tasks were increased in each proposed organisation.
This rise in executive controller coordination tasks was due to the reclearance of
eastbound oceanic flights from RVSM levels to standard semi-circular levels. This
task was allocated to the executive controller when this event occurred.
AMS Centre of Expertise
EUROCONTROL Experimental Centre
AMS Centre of Expertise Study AF64/F08 Simulation of New Scottish Area Control Centre (NSC)
Page 18
EUROCONTROL
Figure 8
8
8
EUROCONTROL
8
8
Comparison between totals of times recorded for Executivecontroller in the task group categories. All samples REF 1-6and PRO 1-6.
0
1000
2000
3000
4000
5000
6000
REF PRO
Coord
F data dec. of 71 %
inc. of 365 %
Conf. srch inc. of 6 %
R/T no sig. change
Radar dec. of 6 %
Total = 5136
Total = 4373 minutes
OVERALL REDUCTION OF 15% IN EXECUTIVE CONTROLLER TASK TIMESFigure 8
Figure 9
9
9
EUROCONTROL
9
9
Comparison between totals of times recorded for Planningcontroller in the task group categories. All samples REF 1-6and PRO 1-6.
0
1000
2000
3000
4000
5000
6000
REF PRO
Total = 5978 minutes
Total = 3436 minutes
OVERALL REDUCTION OF 43% IN PLANNING CONTROLLER TASK TIMES
Coord
F data dec. of 64 %
Conf. srch dec. of 75 %
R/T no sig. change
Radar
dec. of 2 %
no sig. change
Figure 9

AMS Centre of Expertise
EUROCONTROL Experimental Centre
AMS Centre of Expertise Study AF64/F08 Simulation of New Scottish Area Control Centre (NSC)
Page 19
EUROCONTROL
2.2.1 Breakdown of workload reduction by sector
Table 4 is a formatted example of workload data extracted from the model. As shown in
figures 8 and 9, the average total reductions in workload recorded for all proposed
samples were 15% for the executive controller and 43% for the planning controller.
Table 5 shows the breakdown of these figures by sector and organisation for the
executive (Exec) and Planning (Pln) controllers using traffic sample one. Sample one
reference and proposed organisations were randomly selected as an example as the
results recorded for the other samples which compared the reference and proposed
organisations displayed similar trends.

AMS Centre of Expertise
EUROCONTROL Experimental Centre
AMS Centre of Expertise Study AF64/F08 Simulation of New Scottish Area Control Centre (NSC)
Page 20
EUROCONTROL
2.2.2 Table 5 Workload figures per sector
Sec Exec Ref 1 Exec Pro 1 Reduction Pln Ref 1 Pln Pro 1 Reduction
TMAIN 195.1 180 - 8% 113.4 68.3 - 40%
TMOUT 108.2 96.7 -11% 104.8 68.7 - 34%
DCS 54.1 43.1 - 20% 95.2 60.9 - 36%
F/F 80.7 68.9 - 15% 91.5 56.5 - 38%
F/B 33.9 27.8 - 18% 66 33.6 - 49%
MORAY 37.9 32.6 - 14% 53.8 30.3 - 44%
HEBRI 16.2 13.5 - 20 % 28.7 13.6 - 53%
WCOAS 8.2 7.6 - 7% 11.6 8.8 - 26%
SWEST 82.1 73.5 -10% 137 72.1 - 47%
CENTR 17.2 14.5 - 16% 28.1 14 - 50%
ANTRM 116 72 - 38% 103.8 64.2 - 38%
TOTAL 750 630 - 16% 834 491 - 41%

AMS Centre of Expertise
EUROCONTROL Experimental Centre
AMS Centre of Expertise Study AF64/F08 Simulation of New Scottish Area Control Centre (NSC)
Page 21
EUROCONTROL
2.3 Capacity assessment
THE CAPACITY FIGURES REFERRED TO IN THIS DOCUMENT ARE NOT BASED
ON DECLARED SECTOR OR CENTRE FIGURES OR CFMU DATA.
The capacity assessment in this simulation was problematic because no reference
organisation representing current procedures, sectorisation and "actual" traffic levels
was tested as a benchmark.
There was no method to evaluate the step between today's situation and current
controller workload (which would have provided an indication of current capacity) to the
predicted scenario in the "Reference" samples.
For this reason no current sector capacity figures were considered. It was assumed that
there will be spare sector and controller capacity at Scottish between now and the year
2001, to accommodate greater levels of traffic such as those in the samples.
The method used to establish a capacity baseline was to note the overall limiting factor
(control position) in each scenario. This sector was set as the reference system limit for
that traffic sample and compared to the figure recorded as the limiting factor in the
proposed organisation. Any reduction was regarded as a potential increase in overall
system capacity.
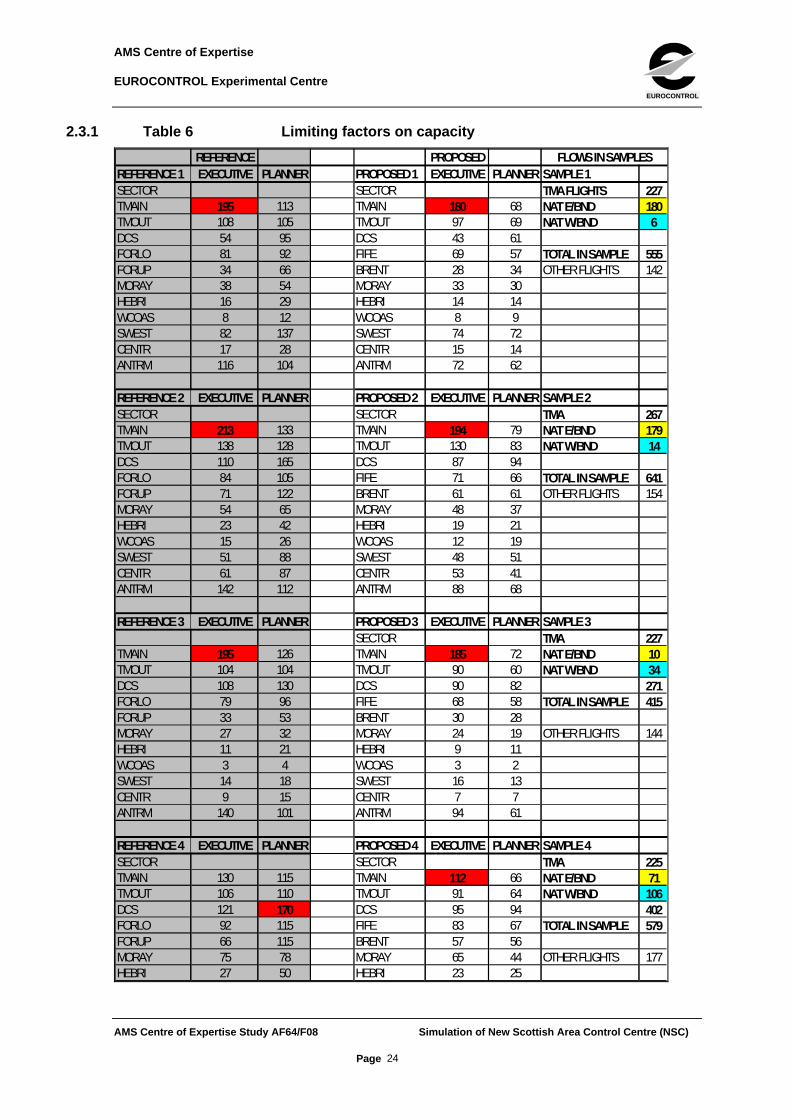
A list of the limiting factors recorded for each sample is shown on the Excel sheet table
6 on page 24 which also shows the traffic flows in each sample.
In samples 1 2 and 3, the system limiting factor was recorded at the TMAIN executive
control position in both the reference and proposed organisations. This was because
the major traffic flow in samples 1, 2 and 3 was generated by the TMA. The TMA flights
represented 41% of all flights contained in samples 1 and 2, and 54% of all flights in
sample three. The total average difference between the reference and proposed
organisations for these samples indicated an average capacity increase of 6% for the
system. See figure 10.
AMS Centre of Expertise
EUROCONTROL Experimental Centre
AMS Centre of Expertise Study AF64/F08 Simulation of New Scottish Area Control Centre (NSC)
Page 22
EUROCONTROL
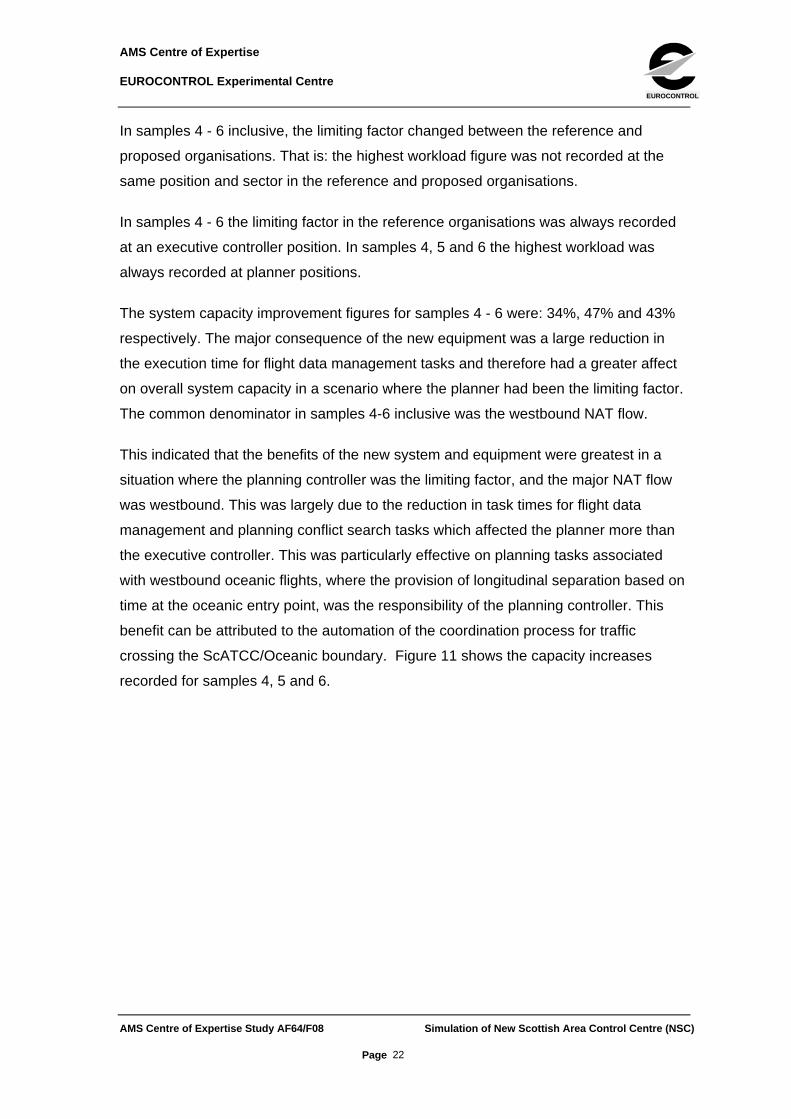
In samples 4 - 6 inclusive, the limiting factor changed between the reference and
proposed organisations. That is: the highest workload figure was not recorded at the
same position and sector in the reference and proposed organisations.
In samples 4 - 6 the limiting factor in the reference organisations was always recorded
at an executive controller position. In samples 4, 5 and 6 the highest workload was
always recorded at planner positions.
The system capacity improvement figures for samples 4 - 6 were: 34%, 47% and 43%
respectively. The major consequence of the new equipment was a large reduction in
the execution time for flight data management tasks and therefore had a greater affect
on overall system capacity in a scenario where the planner had been the limiting factor.
The common denominator in samples 4-6 inclusive was the westbound NAT flow.
This indicated that the benefits of the new system and equipment were greatest in a
situation where the planning controller was the limiting factor, and the major NAT flow
was westbound. This was largely due to the reduction in task times for flight data
management and planning conflict search tasks which affected the planner more than
the executive controller. This was particularly effective on planning tasks associated
with westbound oceanic flights, where the provision of longitudinal separation based on
time at the oceanic entry point, was the responsibility of the planning controller. This
benefit can be attributed to the automation of the coordination process for traffic
crossing the ScATCC/Oceanic boundary. Figure 11 shows the capacity increases
recorded for samples 4, 5 and 6.

AMS Centre of Expertise
EUROCONTROL Experimental Centre
AMS Centre of Expertise Study AF64/F08 Simulation of New Scottish Area Control Centre (NSC)
Page 23
EUROCONTROL
Figure 10
10
10
EUROCONTROL
10
10
Potential overall system capacity increase wherelimiting factor was executive controller. Major flowswere TMA and/or eastbound NAT. (Samples 1-3)
100
150
200
250 TMAINEXEC
TMAFLIGHTS
NATEAST
5% reduction
9% reduction 5% reduction
ONE TWO THREE
REF
PRO
REF
PRO REFPRO
AVERAGE CAPACITY INCREASE = 6%Figure 10
Figure 11
11
11
EUROCONTROL
11
11
Potential overall system capacity increase whenlimiting factor was planner and major flows wereTMA and/or westbound NAT. (Samples 4-6)
50
100
150
200
250DCS PLN
FORUPPLNTMAINEXECTMOUTEXECTMAFLIGHTSNATWEST
34% reduction
47% reduction 43% reduction
ONE TWO THREE
REF
PRO
REF
PRO
REF
PRO
AVERAGE CAPACITY INCREASE = 41%Figure 11
AMS Centre of Expertise
EUROCONTROL Experimental Centre
AMS Centre of Expertise Study AF64/F08 Simulation of New Scottish Area Control Centre (NSC)
Page 24
EUROCONTROL
2.3.1 Table 6 Limiting factors on capacity
REFERENCE PROPOSED FLOWS IN SAMPLESREFERENCE 1 EXECUTIVE PLANNER PROPOSED 1 EXECUTIVE PLANNER SAMPLE 1SECTOR SECTOR TMA FLIGHTS 227TMAIN 195 113 TMAIN 180 68 NAT E/BND 180TMOUT 108 105 TMOUT 97 69 NAT W/BND 6DCS 54 95 DCS 43 61FORLO 81 92 FIFE 69 57 TOTAL IN SAMPLE 555FORUP 34 66 BRENT 28 34 OTHER FLIGHTS 142MORAY 38 54 MORAY 33 30HEBRI 16 29 HEBRI 14 14WCOAS 8 12 WCOAS 8 9SWEST 82 137 SWEST 74 72CENTR 17 28 CENTR 15 14ANTRM 116 104 ANTRM 72 62
REFERENCE 2 EXECUTIVE PLANNER PROPOSED 2 EXECUTIVE PLANNER SAMPLE 2SECTOR SECTOR TMA 267TMAIN 213 133 TMAIN 194 79 NAT E/BND 179TMOUT 138 128 TMOUT 130 83 NAT W/BND 14DCS 110 165 DCS 87 94FORLO 84 105 FIFE 71 66 TOTAL IN SAMPLE 641FORUP 71 122 BRENT 61 61 OTHER FLIGHTS 154MORAY 54 65 MORAY 48 37HEBRI 23 42 HEBRI 19 21WCOAS 15 26 WCOAS 12 19SWEST 51 88 SWEST 48 51CENTR 61 87 CENTR 53 41ANTRM 142 112 ANTRM 88 68
REFERENCE 3 EXECUTIVE PLANNER PROPOSED 3 EXECUTIVE PLANNER SAMPLE 3SECTOR TMA 227
TMAIN 195 126 TMAIN 185 72 NAT E/BND 10TMOUT 104 104 TMOUT 90 60 NAT W/BND 34DCS 108 130 DCS 90 82 271FORLO 79 96 FIFE 68 58 TOTAL IN SAMPLE 415FORUP 33 53 BRENT 30 28MORAY 27 32 MORAY 24 19 OTHER FLIGHTS 144HEBRI 11 21 HEBRI 9 11WCOAS 3 4 WCOAS 3 2SWEST 14 18 SWEST 16 13CENTR 9 15 CENTR 7 7ANTRM 140 101 ANTRM 94 61
REFERENCE 4 EXECUTIVE PLANNER PROPOSED 4 EXECUTIVE PLANNER SAMPLE 4SECTOR SECTOR TMA 225TMAIN 130 115 TMAIN 112 66 NAT E/BND 71TMOUT 106 110 TMOUT 91 64 NAT W/BND 106DCS 121 170 DCS 95 94 402FORLO 92 115 FIFE 83 67 TOTAL IN SAMPLE 579FORUP 66 115 BRENT 57 56MORAY 75 78 MORAY 65 44 OTHER FLIGHTS 177HEBRI 27 50 HEBRI 23 25

AMS Centre of Expertise
EUROCONTROL Experimental Centre
AMS Centre of Expertise Study AF64/F08 Simulation of New Scottish Area Control Centre (NSC)
Page 25
EUROCONTROL
2.4 Summary of results concerning airspace modifications
2.4.1 Modifications concerning FORLO, FIFE and FORUP BRENT sectors.
The changes applied to sectors FORLO/FORUP which created FIFE/BRENT, did not
greatly affect the traffic distribution figures, controller workload or numbers of
conflicts recorded between the reference and proposed organisations.
Although Forth Low and Fife, in particular, were geographically and vertically
different, the traffic flows which entered the physical airspace were similar in each
organisation; thus sector penetration changes were insignificant.
Despite the geographical reduction in dimensions of the Forth Low sector to those of
the Fife sector, the average flight time for aircraft in the sector was reduced by only 1
minute. This indicated that the majority of traffic (in the samples provided) for the
Forth Low sector, was contained within the smaller sector dimensions of the Fife
sector. This, in turn, suggested that the current dimensions of the Forth Low sector
are greater than necessary and deliver no identifiable benefit.
If other flows were applied to test the sector configuration, then any benefit or
drawbacks could be quantified.
It is suggested that assessment of the dimensions of the Forth Low/Fife/Brent
sector changes would benefit from subjective controller analysis in a real time
environment. This will provide cognitive analysis relating to the displayed radar
range and required scan rate required for the sector size.
The inclusion of the NEW ADN towards TALLA track in the FIFE sector was
absorbed into the sector with no punitive effects.
2.4.2 Modifications concerning ANTRIM sector.
The modifications concerning the Antrim sector had a profound effect on the
recorded number of conflicts and the level of controller workload.

AMS Centre of Expertise
EUROCONTROL Experimental Centre
AMS Centre of Expertise Study AF64/F08 Simulation of New Scottish Area Control Centre (NSC)
Page 26
EUROCONTROL
The widening of the airway and the additional airspace fillets were both designed to
allow discrete arrival and departure tracks for flights to and from the Belfast TMA.
These airspace modifications had the following effects:
• • the recorded number of opposite direction conflicts between the arrivals
and departures was, on average, reduced by 37%;
• • conflict resolution workload of the executive controller was reduced by 39%
on average;
Figure 12 shows the total conflicts recorded for the Antrim sector; and what
percentage of these were opposite direction conflicts for all reference samples (REF1
- REF6 inclusive).
Figure 13 shows the same details recorded for the proposed samples (PRO1 - PRO6
inclusive).
Figure 12
12
12
EUROCONTROL
12
12
Conflicts recorded in the Antrim sector in referencesamples 1-6. (REF1 - REF6)
REF1 REF2 REF3 REF4 REF5 REF60
10
20
30
40
50
60
70
80
REF1 REF2 REF3 REF4 REF5 REF6
47%36%
40%
49%
60%52%52%
Figure 12
Opposite direction conflicts
Others

AMS Centre of Expertise
EUROCONTROL Experimental Centre
AMS Centre of Expertise Study AF64/F08 Simulation of New Scottish Area Control Centre (NSC)
Page 27
EUROCONTROL
Figure 13
13
13
EUROCONTROL
13
13
Conflicts recorded in the Antrim sector in proposed samples1-6. (PRO1- PRO6)
PRO1 PRO2 PRO3 PRO4 PRO5 PRO605
1015202530354045
PRO1 PRO2 PRO3 PRO4 PRO5 PRO6
9%
15%8%
14%
21%
Figure 13 Opposite direction conflicts
Others

AMS Centre of Expertise
EUROCONTROL Experimental Centre
AMS Centre of Expertise Study AF64/F08 Simulation of New Scottish Area Control Centre (NSC)
Page 28
EUROCONTROL
Table 7 below shows the same information in figures 12 and 13 and shows the
numbers of conflicts recorded. These figures are not percentages.
2.4.3 Table 7 Conflicts in Antrim sector
Exercise
name
Total conflicts opp. direction
no.
Total flights in
Antrim
REF1 59 28 89
PRO1 32 3 91
REF2 64 39 98
PRO2 33 5 99
REF3 64 33 85
PRO3 39 3 86
REF4 59 21 107
PRO4 38 0 122
REF5 72 29 88
PRO5 42 6 94
REF6 45 22 90
PRO6 29 6 105

AMS Centre of Expertise
EUROCONTROL Experimental Centre
AMS Centre of Expertise Study AF64/F08 Simulation of New Scottish Area Control Centre (NSC)
Page 29
EUROCONTROL
This was an excellent proposal which successfully reduced the opposite
direction conflicts in the Antrim sector in all the proposed samples and the
corresponding workload associated with their resolution.
2.5 Other route and sector modifications
Some of the new westbound NAT RNAV routes included in the proposed
organisation listed on pages 5 and 6 had an effect on the direction and general
orientation of certain traffic flows.
The flights which were transferred to the revised routes listed below were specified
by the Working Group.
2.5.1 Routes with new entry points via AAL or VES.
Reference organisation Proposed organisation
FROM ENTRY POINT TO NEW ENTRY POINT
• • ASPIT - 59°n10°w to VESTA - 59°n10°w;
2 flights in sample 5 and 1 in sample 6;
• BATSU - 58°N10°W to VESTA - 58°n10°w;
4 flights in sample 5 and 1 in sample 6
• • TOPPA - 60°N10°W to AAL - 60°N10°W;
21 flights in sample 5 and 1 in sample 6
• ASPIT - 60°N10°W to VES - 60°N10°W;
0 flights in sample 5 and 1 in sample 6

AMS Centre of Expertise
EUROCONTROL Experimental Centre
AMS Centre of Expertise Study AF64/F08 Simulation of New Scottish Area Control Centre (NSC)
Page 30
EUROCONTROL
• 61°°N00°°W - 61°N10°W to AAL - 61°N10°W;
1 flight in sample 5 and 0 in sample 6
• • ORVIK - 59°N10°W to AAL - 59°N10°W;
2 flights in sample 5 and 1 in sample 6
• ORVIK - 58°N10°W to VES - 58°N10°W;
1 flight in sample 5 and 1 in sample 6
• • TOPPA - 61°N10°W to AAL - 61°N10°W;
1 flight sample 5 and 4 in sample 6
• ORVIK - 60°N10°W to AAL - 60°N10°W;
2 flights sample 5 and 0 in sample 6
• • ORVIK - 61°N10°W to AAL - 61°N10°W;
1 flight in sample 5 and 1 in sample 6
• GORDO - 57°N10°W to VES - 57°N10°W;
0 flights in sample 5 and 5 in sample 6
• • LONAM - 6104A to AAL - 61°N10°W;
0 flights in sample 5 and 2 in sample 6
• • LONAM - 58°N10°W to VES - 58°N10°W;
0 flights in sample 5 and 1 in sample 6
• TOPPA - 61°N10°W to AAL - 61°N10°W;
0 flights in sample 5 and 4 in sample 6

AMS Centre of Expertise
EUROCONTROL Experimental Centre
AMS Centre of Expertise Study AF64/F08 Simulation of New Scottish Area Control Centre (NSC)
Page 31
EUROCONTROL
• • ASPIT - 58°N10°W to VES - 58°N10°W;
0 flights in sample 5 and 1 in sample 6
The route entry point changes from:
ORVIK to AAL; ASPIT to VESTA; GORDO to VESTA; BATSU to VESTA and
TOPPA to VESTA,
did not significantly affect the general direction of the flow of traffic, the sectors
penetrated, or the overall length of each route. Their use, therefore, did not affect the
traffic distribution numbers for the sectors, or the controller workload results recorded
in the reference organisations.
The routes with the entry point changes from: LONAM, ASPIT or TOPPA to AAL,
were, in general, shorter and the flights on these routes entered the simulation
airspace in the MORAY sector. In the reference organisation they entered the
simulation area in the FORUP sector. (BRENT in the proposed organisation.)
The total number of flights on the routes which entered via AAL was 25 in sample 5,
and 8 in sample 6. The effect of this change is difficult to quantify due to the relatively
small number of flights involved. However, these route changes did not cause an
increase in conflicts in the Moray sector.
2.5.2 Routes POL, WAL to 10 °°w oceanic entry point.
Routes POL/WAL - 55°n10°w and POL/WAL - 56°n10°w, changed their orientation
slightly when they were re-defined as new RNAV routes.
This made no major difference to the sector penetrations or workload in any of the
samples.
However, flights transferred to the RNAV route between POL - 57°n10°w avoided the
Dean Cross sector in the proposed organisation. They were rerouted in a more
westerly direction and first entered the simulation area in the SWEST sector on a
direct track towards 57°n 10°w from POL.

AMS Centre of Expertise
EUROCONTROL Experimental Centre
AMS Centre of Expertise Study AF64/F08 Simulation of New Scottish Area Control Centre (NSC)
Page 32
EUROCONTROL
This route in combination with the GOW - WHI route and the traffic to and from NGY
- WAL led to a reduction in traffic entering the DCS sector. Sample six contained the
highest number of flights transferred to this route (30 flights) and the effect was to
reduce the executive controller radar workload in the DCS sector. The executive
controller in DCS sector had a total radar task workload of 59 minutes in the
reference organisation and this was reduced to 44 minutes in the proposed
organisation. This equates to a reduction of 25% in radar tasks for DCS. It should be
noted that there was an increase of 22% in the radar tasks for the SWEST sector.
This route strategy would be beneficial to the overall system when the TMA
sectors and the DCS were operating at peak traffic levels.
2.5.3 Routes exiting the airspace via WHI, and NGY - WAL and TRN - WAL
Traffic which was planned to land at Gatwick, or which routed via position MID was
transferred to routes that terminated at WHI. This traffic previously routed via the
DCS sector and the position DCS, but the new track passed to the west of DCS by
about 20 - 25 nm. The total number of flights rerouted via WHI was 49. This includes
TMA departures.
One adverse effect of the GOW - WHI and NGY - WAL routes was an increase in the
workload recorded for TMOUT sector. The traffic rerouted to the GOW - WHI route
previously exited the airspace via DCS, and was transferred to the DCS sector under
the terms of a standing agreement prior to final transfer to London Pole Hill sector.
These new routes left the airspace to the west of DCS in London Irish Sea sector
which required coordination with London, and the Antrim sector, which in turn
increased workload. In exceptional cases, some flights physically penetrated the
SWEST sector incurring additional coordination workload.
Other routes terminating at WHI were from positions 61°n, 60°n, 59°n, 58°n, and
57°n 10w. Again, in the reference organisations, these exited via DCS, but in the
proposed organisation they passed approximately 20 25 nm to the west of DCS.

AMS Centre of Expertise
EUROCONTROL Experimental Centre
AMS Centre of Expertise Study AF64/F08 Simulation of New Scottish Area Control Centre (NSC)
Page 33
EUROCONTROL
This caused an increase in the number of sector penetrations recorded for sector
South West, but was not problematic due to the small numbers of flights transferred
to these routes.
These routes were beneficial to the DCS sector but caused additional workload for
the TMOUT and SWEST/ANTRM sectors. This additional workload would not be
desirable during peak TMA departure hours or during a heavy southeast/eastbound
NAT flow.
It is recommended that these routes are tested further with higher traffic usage
following definition of new procedures to facilitate internal and external
transfer.
Notwithstanding the above comment, the general use of the RNAV and the
other routes did not adversely affect the overall workload of the simulated
sectors and were of benefit to the overall system.
AMS Centre of Expertise
EUROCONTROL Experimental Centre
AMS Centre of Expertise Study AF64/F08 Simulation of New Scottish Area Control Centre (NSC)
Page 34
EUROCONTROL
Chapter 3 Other noteworthy results
The results that follow were not requested in direct relation to the simulation
objectives, but show certain aspects and trends identified in the simulation.
They are;
• the use of RVSM levels in the airspace
• traffic density in the TMA
• busiest periods per sector
3.1 Use of RVSM levels in the airspace
The traffic samples contained examples of flights at RVSM levels. The use of these
levels was permitted within the area defined as the RVSM transition area. Flights
subject to transfer to and from LATCC were required to maintain standard semi-
circular levels and standard separation.
In the eastbound traffic samples, the predominant tracks were 57°n, 56°n and 55°n
10°w. The level changes caused additional workload, although this was not
excessive in the Scottish sectors. but, the peripheral sectors in the London FIR/UIR
recorded large numbers of conflicts and extremely high workload. This was due to
the traffic flows form 10°w to WAL and POL intersecting and the reduction of
available levels.
This situation was worst when the routes originating at 10°w crossed with departures
from EGPF to WHI because the intersection occurred east of the IOM close to the
POL sector boundary.
But, the DUB/ERNAN area in the Shannon UIR, it was agreed by the Working group
that flights at RVSM levels were acceptable in either direction. This was beneficial to
the Scottish sectors and to the results recorded for the Shannon sectors.
(Recordings for "external" agencies are not validated and provide an indication only.)

AMS Centre of Expertise
EUROCONTROL Experimental Centre
AMS Centre of Expertise Study AF64/F08 Simulation of New Scottish Area Control Centre (NSC)
Page 35
EUROCONTROL
This policy could be of benefit when RVSM is introduced for the following
reasons: firstly, the flying time from 55 °°n and 56 °°n 10w to the exit point Ernan
is relatively short; and secondly there is limited airspace available for
manoeuvring if aircraft are to be re-cleared vertically to standard semi-circular
levels or vectored to provide radar separation.
A more desirable situation would be to allow flights to remain at RVSM levels in
all domestic airspace thereby increasing capacity by reducing the workload
involved to re-establish standard separation.
3.2 Traffic density in the TMA
The conflicts recorded for the TMA sectors and, in particular, for TMAIN were
extremely high in samples 1, 2 and 3.
This is explained by the composition of the traffic samples. Table 5 shows the main
traffic flows in samples 1, 2 and 3.
AMS Centre of Expertise
EUROCONTROL Experimental Centre
AMS Centre of Expertise Study AF64/F08 Simulation of New Scottish Area Control Centre (NSC)
Page 36
EUROCONTROL
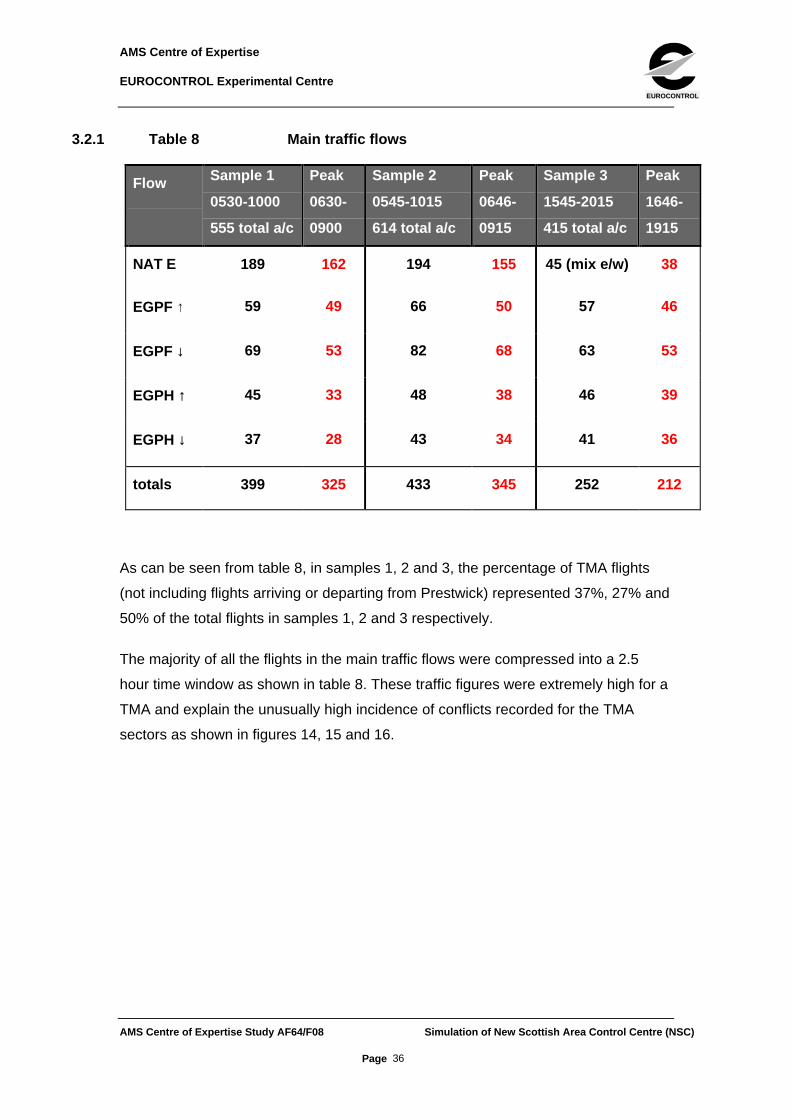
3.2.1 Table 8 Main traffic flows
Flow Sample 1
0530-1000
555 total a/c
Peak
0630-
0900
Sample 2
0545-1015
614 total a/c
Peak
0646-
0915
Sample 3
1545-2015
415 total a/c
Peak
1646-
1915
NAT E 189 162 194 155 45 (mix e/w) 38
EGPF ↑↑ 59 49 66 50 57 46
EGPF ↓↓ 69 53 82 68 63 53
EGPH ↑↑ 45 33 48 38 46 39
EGPH ↓↓ 37 28 43 34 41 36
totals 399 325 433 345 252 212
As can be seen from table 8, in samples 1, 2 and 3, the percentage of TMA flights
(not including flights arriving or departing from Prestwick) represented 37%, 27% and
50% of the total flights in samples 1, 2 and 3 respectively.
The majority of all the flights in the main traffic flows were compressed into a 2.5
hour time window as shown in table 8. These traffic figures were extremely high for a
TMA and explain the unusually high incidence of conflicts recorded for the TMA
sectors as shown in figures 14, 15 and 16.

AMS Centre of Expertise
EUROCONTROL Experimental Centre
AMS Centre of Expertise Study AF64/F08 Simulation of New Scottish Area Control Centre (NSC)
Page 37
EUROCONTROL
Figure 14
1
1
EUROCONTROL
1
1
Sectors in which 10 or more conflicts were recorded. Trafficsample 1 - Reference and Proposed organisation.REF 1 and PRO 1. (0530 - 1030)
110
48
26
10
58
117
47
24
10
32
0
20
40
60
80
100
120
TMAIN TMOUT FORLO MORAY ANTRM FIFE
REF 1 PRO 1
Figure 14

AMS Centre of Expertise
EUROCONTROL Experimental Centre
AMS Centre of Expertise Study AF64/F08 Simulation of New Scottish Area Control Centre (NSC)
Page 38
EUROCONTROL
Figure 15
1
1
EUROCONTROL
1
1
Sectors in which 10 or more conflicts were recorded. Trafficsample 2 - Reference and Proposed organisation.REF 2 and PRO 2. (0545 - 1015)
129
55
29 25
10 14 10
64
127
63
25 20 1610
33
0
20
40
60
80
100
120
140
TMAIN TMOUT DCS FORLO FORUP MORAYCENTR ANTRM FIFE
REF 2 PRO 2
Figure 15
Figure 16
1
1
EUROCONTROL
1
1
Sectors in which 10 or more conflicts were recorded. Trafficsample 3 - Reference and Proposed organisation.REF 3 and PRO 3. (1545 - 2015)
140
453430
64
137
4534
2839
0
20
40
60
80
100
120
140
TMAIN TMOUT DCS FORLO ANTRM FIFE
REF 3 PRO 3
Figure 16
AMS Centre of Expertise
EUROCONTROL Experimental Centre
AMS Centre of Expertise Study AF64/F08 Simulation of New Scottish Area Control Centre (NSC)
Page 39
EUROCONTROL
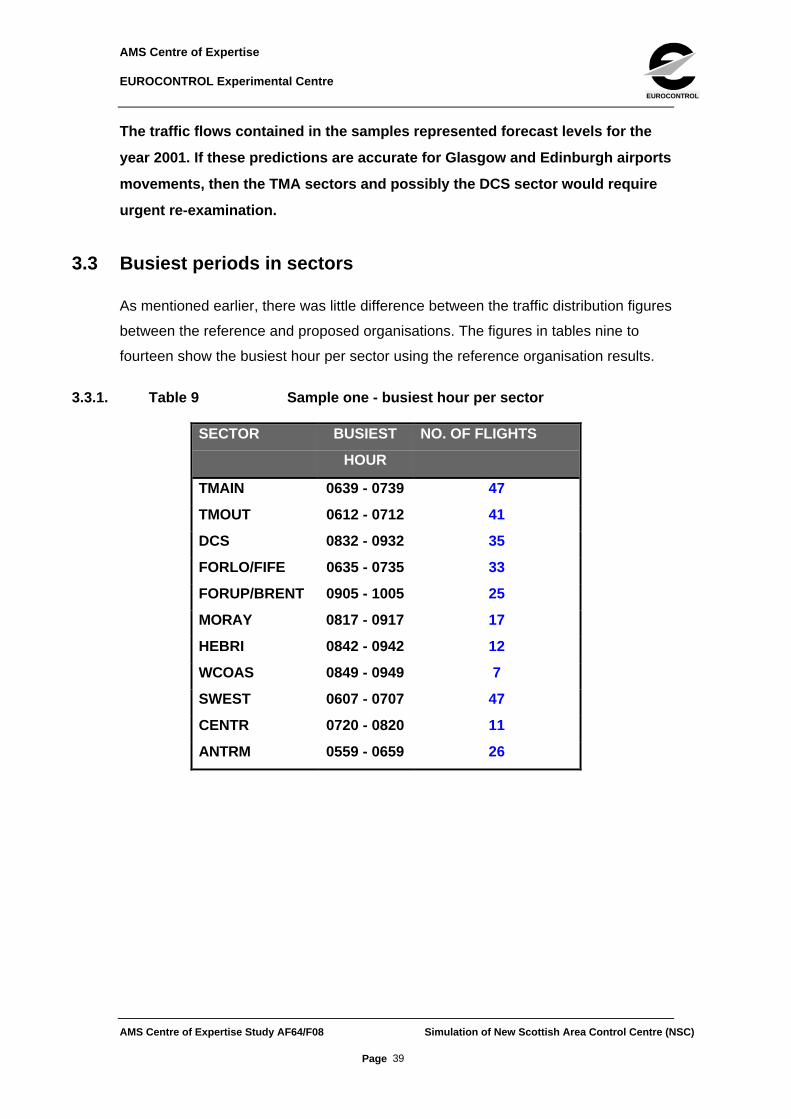
The traffic flows contained in the samples represented forecast levels for the
year 2001. If these predictions are accurate for Glasgow and Edinburgh airports
movements, then the TMA sectors and possibly the DCS sector would require
urgent re-examination.
3.3 Busiest periods in sectors
As mentioned earlier, there was little difference between the traffic distribution figures
between the reference and proposed organisations. The figures in tables nine to
fourteen show the busiest hour per sector using the reference organisation results.
3.3.1. Table 9 Sample one - busiest hour per sector
SECTOR BUSIEST
HOUR
NO. OF FLIGHTS
TMAIN 0639 - 0739 47
TMOUT 0612 - 0712 41
DCS 0832 - 0932 35
FORLO/FIFE 0635 - 0735 33
FORUP/BRENT 0905 - 1005 25
MORAY 0817 - 0917 17
HEBRI 0842 - 0942 12
WCOAS 0849 - 0949 7
SWEST 0607 - 0707 47
CENTR 0720 - 0820 11
ANTRM 0559 - 0659 26
AMS Centre of Expertise
EUROCONTROL Experimental Centre
AMS Centre of Expertise Study AF64/F08 Simulation of New Scottish Area Control Centre (NSC)
Page 40
EUROCONTROL
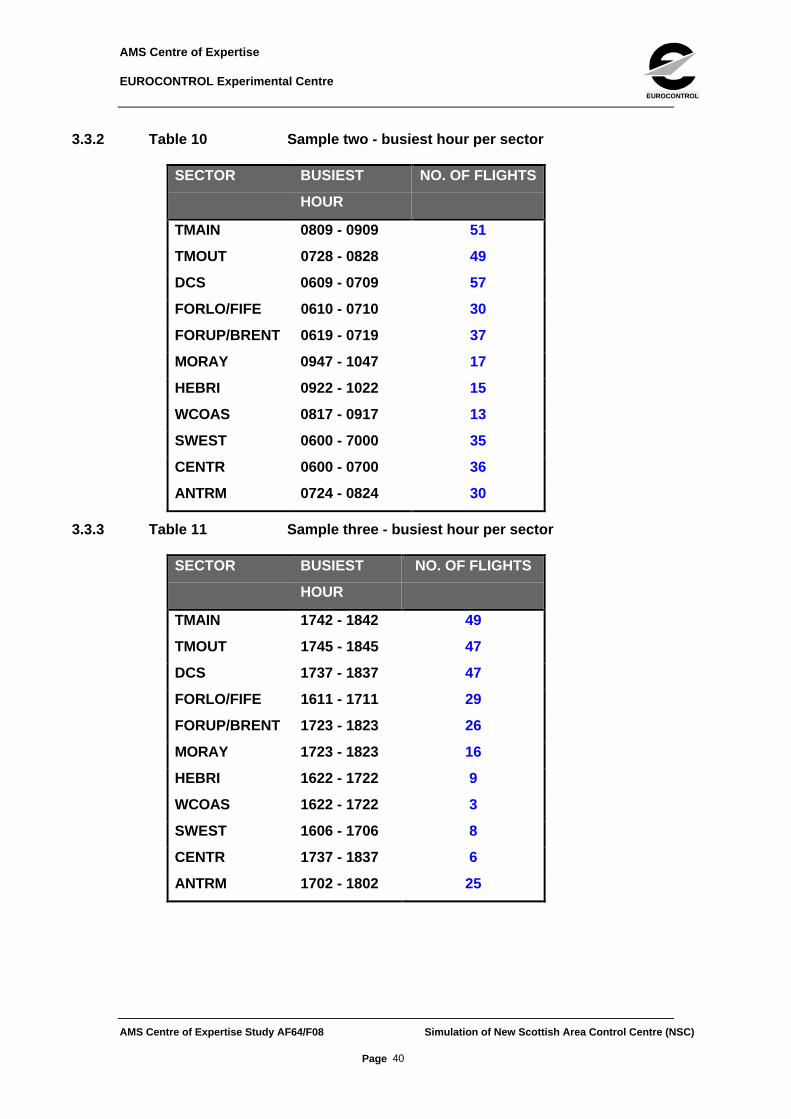
3.3.2 Table 10 Sample two - busiest hour per sector
SECTOR BUSIEST
HOUR
NO. OF FLIGHTS
TMAIN 0809 - 0909 51
TMOUT 0728 - 0828 49
DCS 0609 - 0709 57
FORLO/FIFE 0610 - 0710 30
FORUP/BRENT 0619 - 0719 37
MORAY 0947 - 1047 17
HEBRI 0922 - 1022 15
WCOAS 0817 - 0917 13
SWEST 0600 - 7000 35
CENTR 0600 - 0700 36
ANTRM 0724 - 0824 30
3.3.3 Table 11 Sample three - busiest hour per sector
SECTOR BUSIEST
HOUR
NO. OF FLIGHTS
TMAIN 1742 - 1842 49
TMOUT 1745 - 1845 47
DCS 1737 - 1837 47
FORLO/FIFE 1611 - 1711 29
FORUP/BRENT 1723 - 1823 26
MORAY 1723 - 1823 16
HEBRI 1622 - 1722 9
WCOAS 1622 - 1722 3
SWEST 1606 - 1706 8
CENTR 1737 - 1837 6
ANTRM 1702 - 1802 25
AMS Centre of Expertise
EUROCONTROL Experimental Centre
AMS Centre of Expertise Study AF64/F08 Simulation of New Scottish Area Control Centre (NSC)
Page 41
EUROCONTROL
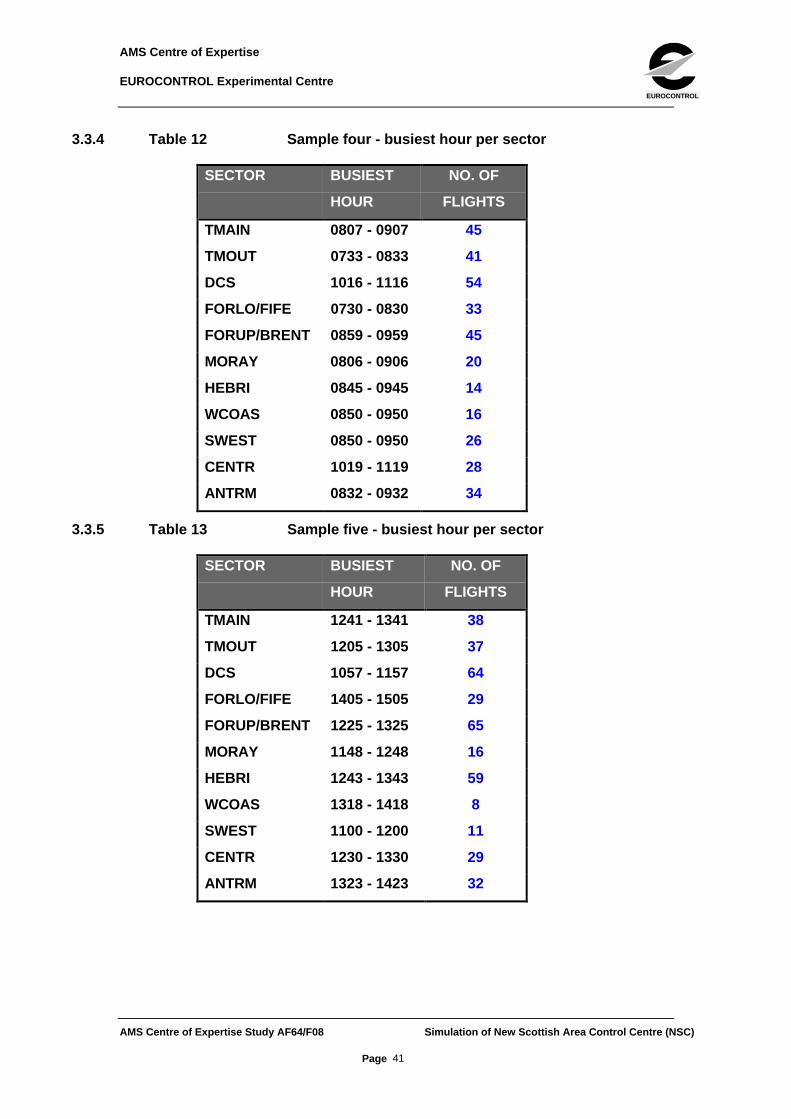
3.3.4 Table 12 Sample four - busiest hour per sector
SECTOR BUSIEST
HOUR
NO. OF
FLIGHTS
TMAIN 0807 - 0907 45
TMOUT 0733 - 0833 41
DCS 1016 - 1116 54
FORLO/FIFE 0730 - 0830 33
FORUP/BRENT 0859 - 0959 45
MORAY 0806 - 0906 20
HEBRI 0845 - 0945 14
WCOAS 0850 - 0950 16
SWEST 0850 - 0950 26
CENTR 1019 - 1119 28
ANTRM 0832 - 0932 34
3.3.5 Table 13 Sample five - busiest hour per sector
SECTOR BUSIEST
HOUR
NO. OF
FLIGHTS
TMAIN 1241 - 1341 38
TMOUT 1205 - 1305 37
DCS 1057 - 1157 64
FORLO/FIFE 1405 - 1505 29
FORUP/BRENT 1225 - 1325 65
MORAY 1148 - 1248 16
HEBRI 1243 - 1343 59
WCOAS 1318 - 1418 8
SWEST 1100 - 1200 11
CENTR 1230 - 1330 29
ANTRM 1323 - 1423 32

AMS Centre of Expertise
EUROCONTROL Experimental Centre
AMS Centre of Expertise Study AF64/F08 Simulation of New Scottish Area Control Centre (NSC)
Page 42
EUROCONTROL
3.3.6 Table 14 Sample six - busiest hour per sector
SECTOR BUSIEST
HOUR
NO. OF
FLIGHTS
TMAIN 1327 - 1427 40
TMOUT 1328 - 1428 47
DCS 1239 - 1339 60
FORLO/FIFE 1317 - 1417 35
FORUP/BRENT 1134 - 1234 47
MORAY 1204 - 1304 28
HEBRI 1331 - 1431 17
WCOAS 1242 - 1342 10
SWEST 1301 - 1401 34
CENTR 1250 - 1350 35
ANTRM 1331 - 1431 26
These tables were included for additional information and to provide an indication of
peak sector times. This could assist in further sectorisation plans, if required, or in
sector manning configuration proposals.

AMS Centre of Expertise
EUROCONTROL Experimental Centre
AMS Centre of Expertise Study AF64/F08 Simulation of New Scottish Area Control Centre (NSC)
Page 43
EUROCONTROL
Conclusions and recommendations
4.1 Impact of new equipment on controller workload.
Conclusion
The simulation results showed that the new equipment significantly reduced the
recorded task times by an average 41% for the planning controller and by an average
of 15% for the executive controller. The greatest reduction applied to flight data
management tasks.
4.2 Potential capacity increase
Conclusion
As there was no simulated reference scenario or traffic sample used as a baseline to
define the current situation, workload or sector capacity, qualification of the effect of
airspace/route changes on capacity was problematic. An assumption was made that
ScOATCC domestic sectors have sufficient spare capacity to handle traffic between
now and the year 2001. Therefore, any potential capacity increase was considered to
be equitable to a reduction in recorded controller workload. The highest reduction in
workload was recorded for the flight data management tasks which were mainly
associated with the planning controller and were pre-tactical. This reduction was
clearly demonstrated in samples containing a high proportion of westbound NAT
traffic. The main factors contributing to this reduction were: the automation of
coordination and planning tasks associated with the ScATCC/OCA boundary; and
the general reduction in execution time for planning coordinations throughout the
airspace.
It is a general belief that the tactical controller workload is the limiting factor in ECAC
airspace. Therefore, when quantifying potential capacity gains related to reduced
workload, it is prudent to base such assessments on the workload reduction figure
associated with the executive controller. This figure was between 6 - 15%.
4.3 Sector modifications concerning Forth Low/Up, Fife and Brent sectors.

AMS Centre of Expertise
EUROCONTROL Experimental Centre
AMS Centre of Expertise Study AF64/F08 Simulation of New Scottish Area Control Centre (NSC)
Page 44
EUROCONTROL
Conclusion
The sector modifications did not greatly affect traffic distribution or controller
workload figures recorded. This was due to similar traffic flows entering the sectors
concerned in both the current and proposed scenarios. The inclusion of the ADN-
NEW track within the FIFE sector presented no identifiable problem. However, the
Forth Low and Forth Upper sectors were geographically extremely large. The majority
of the traffic was contained within the dimensions of the Fife sector. This indicated
that the Fife sector boundaries were an improvement on the Forth Low and Upper
sector scenarios.
Recommendation
Further assessment of the dimensions of the Forth Low/Fife/Brent sector changes
would benefit from subjective controller analysis in a real time environment. In
particular, this would provide information relating to additional radar workload factors
such as a higher controller scan rate of the radar display of a geographically large
sector.
4.4 Modifications concerning the Antrim sector
Conclusion
The airspace changes concerning the Antrim sector had the following effects. The
recorded number of opposite direction conflicts between the arrivals and departures
was, on average, reduced by 37%; and the conflict resolution workload of the
executive controller was reduced by 39% on average.
Recommendation
The simulated airspace modifications should be implemented at the earliest possible
opportunity.
AMS Centre of Expertise
EUROCONTROL Experimental Centre
AMS Centre of Expertise Study AF64/F08 Simulation of New Scottish Area Control Centre (NSC)
Page 45
EUROCONTROL
4.5 Route modifications simulated in both current and proposed scenarios
Conclusion
In general, the route structures in the reference and the proposed organisations were
compatible with the simulated sectors and the established route framework. The
routes which had the greatest impact were POL - 57°n 10°w, GOW - WHI, and NGY -
GOW. These routes diverted traffic from the Dean Cross sector and consequently
reduced the workload of the executive controller in that sector. However, one
disadvantage for routes which exited the airspace on track to WHI and southbound
NGY/TRN WAL, was an increase in coordination workload recorded for the TMOUT
executive. The coordination tasks occurred because there were no standard transfer
procedures specified for this traffic and individual coordination tasks were recorded
by the model.
The route DET - TLA was effective in separating traffic flows into and overflying the
TMA but by terminating at Talla, the previously separated flows were brought
together.
Recommendation
It is recommend that the routes are re-tested using greater numbers of flights and
that new coordination procedures are defined to facilitate internal and external
transfer.
In addition, an alternative to position Talla for the DET TLA route would maintain
separation between traffic flows originating from POL.

AMS Centre of Expertise
EUROCONTROL Experimental Centre
AMS Centre of Expertise Study AF64/F08 Simulation of New Scottish Area Control Centre (NSC)
Page 46
EUROCONTROL
Annexe EAM simulation maps
Map 1 Reference sectorisation
Map 2 Proposed sectorisation

09 08 07 06 05 04 03 02 01 00 01 02
HEBRI MORAY
SWEST
CENTR
ANTRM
FORLO
FORUP
12 11 10 03 04 05 06 07
12 11 10 09 08 07 06 05 04 03 02 01 00 01 02 03 04 05 06 07
51
52
53
54
55
56
57
58
59
60
61
62
51
52
53
54
55
56
57
58
59
60
61
62
Reference sectorisationDCS
TMA
ANTRM
12 11 10 03 04 05 06 07
12 11 10 09 08 07 06 05 04 03 02 01 00 01 02 03 04 05 06 07
51
52
53
54
55
56
57
58
59
60
61
62
51
52
53
54
55
56
57
58
59
60
61
62
Annexe page 1

09 08 07 06 05 04 03 02 01 00 01 02
HEBRI MORAY
SWEST
CENTR
ANTRM
12 11 10 03 04 05 06 07
12 11 10 09 08 07 06 05 04 03 02 01 00 01 02 03 04 05 06 07
51
52
53
54
55
56
57
58
59
60
61
62
51
52
53
54
55
56
57
58
59
60
61
62
Proposed sectorisationDCS
TMA
ANTRM
12 11 10 03 04 05 06 07
12 11 10 09 08 07 06 05 04 03 02 01 00 01 02 03 04 05 06 07
51
52
53
54
55
56
57
58
59
60
61
62
51
52
53
54
55
56
57
58
59
60
61
62
Annexe page 2
FIFE
FIFE BRENT
BRENT