2007d_4_service_live_design_(adv.pdf
TRANSCRIPT

Performance Based Durability Design and Performance Based Durability Design and Assessment for Concrete BridgesAssessment for Concrete Bridges
Ha-Won Song
Concrete Materials, Mechanics and EngineeringSchool of Civil and Environmental Engineering
Yonsei Univ., Seoul 120-749, KOREA
2007. 11. 21. Yonsei University
Seoul, KOREA
International Joint Seminar between Yonsei University and Tokyo Institute of Technologyon Recent Progress on Bridges and Concrete Technology
Concrete Materials, Mechanics & Engineering Lab., Yonsei Univ.
Outline
- Introduction
- Probability-Based Durability Design
- Utilization of PBD for Assessment
- Refined model for design and assessment
- Discussion
- Conclusion

Concrete Materials, Mechanics & Engineering Lab., Yonsei Univ.
Old/Current Codes: ACI, AASHTO, EC2,BS• Simple deemed-to-satisfy
rules (deterministic)• Experience based rules of
thumb• Poor environmental classification
Result No relation between performance and service life (implicit 50 years)
Performance-based design codes (a partial factor method, full probabilistic method)• Degradation models • Material parameters • Detailing of environmental actions• Statistical quantification (mean, standard deviation, distribution) • Choice of service life
Result Documented service life design, failure probability
Old/Current Codes: ACI, AASHTO, EC2,BSOld/Current Codes: ACI, AASHTO, EC2,BS•• Simple deemedSimple deemed--toto--satisfysatisfy
rulesrules (deterministic)(deterministic)•• Experience based rules ofExperience based rules of
thumbthumb•• Poor environmental classificationPoor environmental classification
Result Result No relation between performance and No relation between performance and sserviceervice life (implicit 50 years) life (implicit 50 years)
PerformancePerformance--based based design codes (a partial factor method, full probabilistic methoddesign codes (a partial factor method, full probabilistic method))•• Degradation models Degradation models •• Material parameters Material parameters •• Detailing of environmental actionsDetailing of environmental actions•• Statistical quantification (mean, standard deviation, distributiStatistical quantification (mean, standard deviation, distribution) on) •• Choice of service lifeChoice of service life
Result Result Documented service life design, failure probability Documented service life design, failure probability
Comparison of durability design codes

Concrete Materials, Mechanics & Engineering Lab., Yonsei Univ.
ISO 2394 on general principles on reliability of structures
-ISO/WD 13823 on general principles on the design of structures for durability
(TC98 SC2/WG10)
-Fib MC SLD – Model code for service life design
->ISO TC71 SC3 TF and WG
-ISO 13822 on assessment of existing structures (TC98 SC2/WG10)
->ISO TC71 SC7 WG2
*ISO/TC98: Bases for Design of Structures
Durability design and assessment for concrete structuresDurability design and assessment for concrete structures

Concrete Materials, Mechanics & Engineering Lab., Yonsei Univ.
Marine environment of Korea for Concrete structures-> chloride induced corrosion

Concrete Materials, Mechanics & Engineering Lab., Yonsei Univ.
SALTSALT
VoidsVoids
BarBarIndentationIndentation
Corrosion initiationCorrosion initiation
Concrete Materials, Mechanics & Engineering Lab., Yonsei Univ.
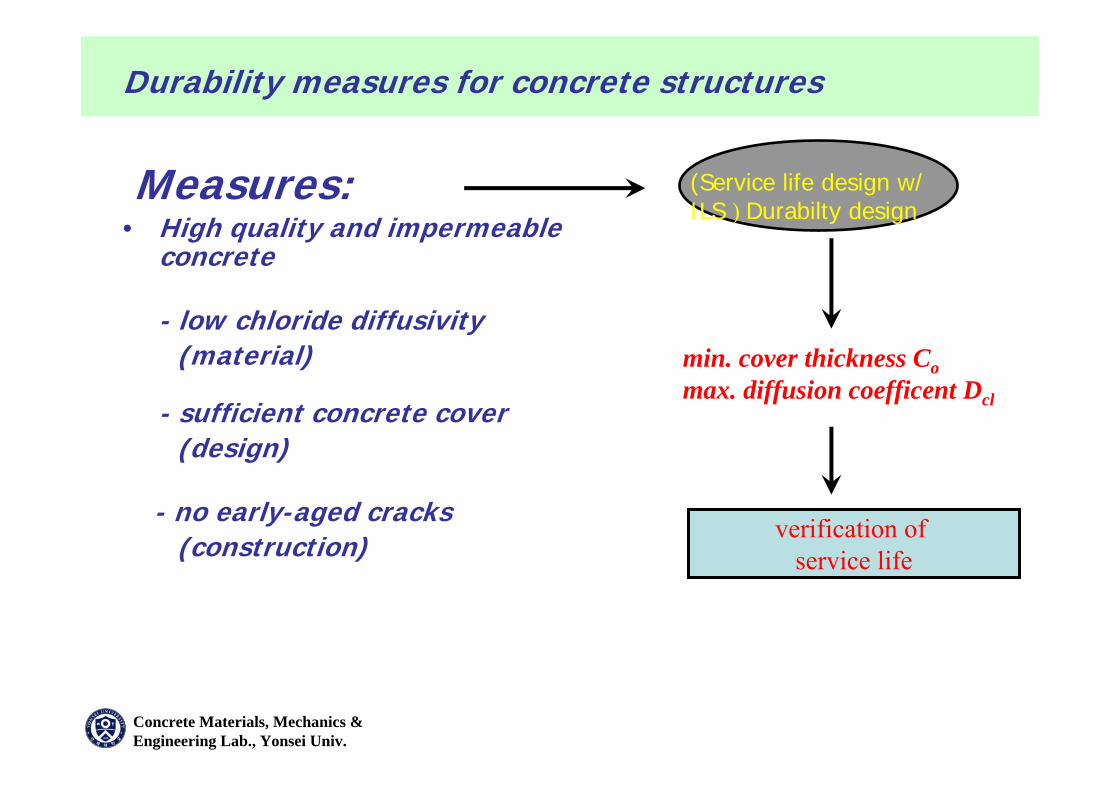
Measures:• High quality and impermeable
concrete
- low chloride diffusivity(material)
- sufficient concrete cover(design)
- no early-aged cracks(construction)
(Service life design w/ ILS ) Durabilty design
verification of service life
min. cover thickness Comax. diffusion coefficent Dcl
Durability measures for concrete structures

Concrete Materials, Mechanics & Engineering Lab., Yonsei Univ.
Durability degradation due to chloride induced corrosion-initiation limit state
Free Cl-High pH
coverprotection
corrosioninitiation
physicaldamage
damagelimit
Det
erio
ratio
n
t0=service life
Chloride ContaminationCarbonation
t1
loss of steel insideconcrete
Time
Chloride Threshold LevelHigh pH buffering
Local chloride build upand local pH reduction

Concrete Materials, Mechanics & Engineering Lab., Yonsei Univ.
Time
Transfer mechanism
Resistancemechanism (R)
Environmental Action
Damage ordisfigurement
mechanism (Slim)
Action effects (damage, Reduced resistance, etc)
ULS : R ≥ S? SLS : S ≤ Slim?
collapse malfunction
Durable Structure
Initiation limit state
Service lifets ≥ tD
Yes
texposure
tstart
ts
Mass transport analysis
Structure Environment(combination of
rain, de-icing salts etc)Boundary conditions
Corrosion of reinforcementConcrete crackDeterioration of concrete
Structural analysis
tS = tstart + texposure
Performance based concept for service life design( ISO/WD 13823 of TC98/SC2)

Concrete Materials, Mechanics & Engineering Lab., Yonsei Univ.
Service life design and evaluation of Busan Geoje Fixed Link Bridge (2006-2010) in Korea:
LOT 2
LOT 3
US$1.5 billion project!-Marine environment
(Chloride induced corrosion)-1st Seabed structure
(Performance based durability design, 100 years)
LOT 1Cable Stayed Bridge Cable Stayed Bridge
Submergedtunnel

Concrete Materials, Mechanics & Engineering Lab., Yonsei Univ.
65.320.0670-Tunnel inside
65.315.3-0.19Atmospheric
82.615.3-0.51Splash
10015.3-0.51Submerged
Relative humidity (%)
Temperature (℃ )
CO2 concentration (ppm)
Chloride concentration
(mol/ℓ)Type of zones
Environmental conditions
Marine environmental condition of bridges and submerged tunnel in Busan-Geoje Fixed Link
Alkali aggregate reaction,Chemical decomposition of hydrated cement
Freeze-thaw damageTemperature gradientsHumidity gradients
Abrasion and Chemical Attack
Reinforcing steel corrosion
Con
cret
eR
ein
forc
ing
stee
l
Submergedzone
Concrete at atmospheric zone
Concrete atsplash and tidal zone
Low tide
High tide

Concrete Materials, Mechanics & Engineering Lab., Yonsei Univ.
Steps1. Selection of limit state Chloride Threshold Level (CTL)
CTL ;=the content of chloride ions at the depth of the embedded steel in concrete when chloride-induced corrosion starts
2. Selection of degradation model e.g. Fick’s law3. Quantification of stochastic variables and analysis
Selection of cement type, binder (SCM) typew/b-ratio, concrete mix
– Determination of diffusion coefficient
– Selection of relevant values ofother model parameters
4. Repeated probabilistic analysis until acceptable failure probability
Performance based SLD method-a probabilistic method

Concrete Materials, Mechanics & Engineering Lab., Yonsei Univ.
Corrosion initiates when,Corrosion initiates when,
( ) crCtcC ≥,Where,
c: concrete cover, t: timeCcr: Critical chloride concentration
(Chloride Threshold Level: CTL)
Where,c: concrete cover, t: timeCcr: Critical chloride concentration
(Chloride Threshold Level: CTL)
environment
low corrosionrisk electro-lytic process impeded
not carbonated concrete
carbonated concrete
high corrosionrisk
low corrosionrisk lack ofoxygen
~0.6 %
100 % r.hconstant
50 % r.hconstant
85 % r.hchanging
good quality
bad quality Crit. Cl-/Cement
Selection of limit state: CTL

Concrete Materials, Mechanics & Engineering Lab., Yonsei Univ.
00
a Dc
ke
kt
tD
n
⎟⎠⎞
⎜⎝⎛
= 00
a Dc
ke
kt
tD
n
⎟⎠⎞
⎜⎝⎛
=(( ))||||||
⎠⎠
⎞⎞
⎜⎜⎜⎜⎜⎜
⎝⎝
⎛⎛
⎥⎥⎥⎥
⎦⎦
⎤⎤
⎢⎢⎢⎢
⎣⎣
⎡⎡−−==
aaDDtt22xxerferf11ssCCttx,x,CC
Design target and quantification of stochastic variables
– Design life: 100 years.
– Nominal end of service life: corrosion initiation
– Level of Reliability: 90% (β = 1.3)
Bridge at splash zoneBridge at splash zone
ParameterParameter DimensionDimension Distr.Distr.--TypeTypexxcc Concrete coverConcrete cover mmmm 7575 88 Log normalLog normalDD00 Chloride migration Chloride migration coefcoef.. 1010--12 12 mm22/s/s 6.56.5 1.31.3
NormalNormal
DeterministicDeterministic
NormalNormalNormalNormal
Log normalLog normal
GammaGamma
0.600.60
0.40.4
0.920.92
1.01.0
4.04.0
0.07670.0767yearsyears
0.060.06
0.080.08
0.150.15
0.30.3
1.21.2
--
wt.wt.--%/binder%/binder
--
--
--
wt.wt.--%/binder%/binder
CCcrcr Critical chloride contentCritical chloride content
n Time factorn Time factor
kkee Factor, environmentFactor, environment
kkcc Factor, executionFactor, execution
CCss Chloride content at surfaceChloride content at surface
ttoo Reference timeReference time
μμ σσ
GammaGamma

Concrete Materials, Mechanics & Engineering Lab., Yonsei Univ.
0
1
2
3
4
5
0 20 40 60 80 100
Time [years]
Rel
iabi
lity
inde
x
Dcl=3.5x10⁻¹² m2/sInterrelation chloride diffusion coefficient Dcl-- age factor - reliability
2.31.91.14 x10-12
2.52.11.33.5 x10-12
2.72.31.53 x10-12
3.33.02.22 x10-1275
(m2/s)(mm)
= 0.6
= 0.5
= 0.4
Max. DCl-Cover
Designed value for bridges at splash zone

Concrete Materials, Mechanics & Engineering Lab., Yonsei Univ.
Bridge
Below-3.5
Above-3.5
Level
756.5x10⁻¹²Submerged
75Splash
503.5x10⁻¹²
Atmospheric
cover
(mm)
Max. Dcl-
(m2/s)
Exposure zone
Sub-merged(outside)
756.0x10⁻¹²
Atmos-pheric(inside)
cover
(mm)
Max. Dcl-
(m2/s)
Exposure zone
Tunnel
durability designed parameters

Concrete Materials, Mechanics & Engineering Lab., Yonsei Univ.
6.0×10-127565.320.0670-CarbonatedImmersedTunnel inside
6.5×10-125065.315.3-0.19Atmospheric
3.5×10-127582.615.3-0.51Splash
3.5×10-127510015.3-0.51SubmergedCableStayedbridge
Dcl(m2/s)
Cover Depth(mm)
R.H(%)
Temp(℃)
CO2Concentraion
(ppm)
Surface chloride concentration
(mol/l)Zone
Service life designEnvironmental conditions
Structures
Specific gravity- coarse aggregate : 2.64 - sand : 2.58- cement : 3.16 - slag : 2.89- fly ash : 2.19 - silica fume : 2.21Air content : 4.0 %
102076576-1521521420.375t4
102077838-1701701420.375t3
102075180-1601601400.350t2
102076440-1801801400.350t1Immersed
Tunnel(t)
102078272-1431431430.375b4
102076576-1521521420.375b3
1020797-11.41841841420.375b2
SP : 0.65~2.0%AE : 0.014~0.023%
102075180-1601601400.350b1Bridge
Structures(b)
FASFSLAGOPCAdmixtureG
(kg/m3)S
(kg/m3)Binder (kg/ m3)W
(kg/m3)W/BArea
Mix proportions of concrete
Concrete Materials, Mechanics & Engineering Lab., Yonsei Univ.
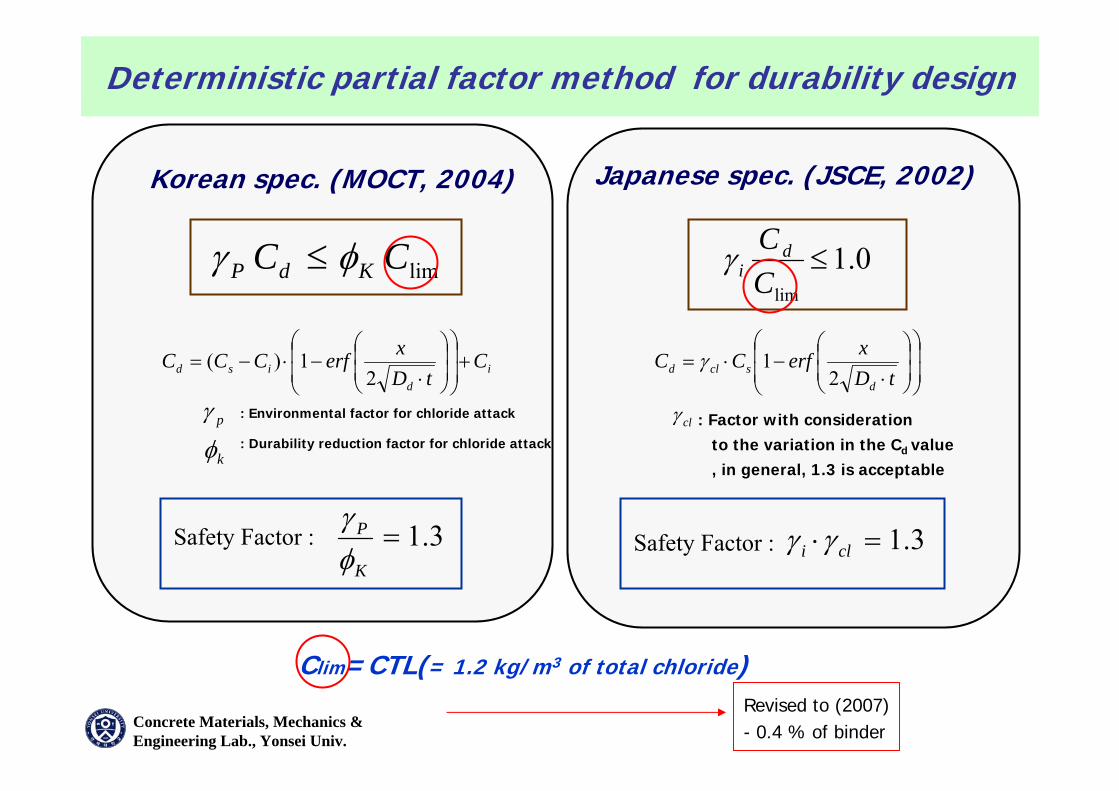
Japanese spec. (JSCE, 2002)Korean spec. (MOCT, 2004)
Deterministic partial factor method for durability design
id
isd CtD
xerfCCC +⎟⎟
⎠
⎞
⎜⎜
⎝
⎛⎟⎟⎠
⎞⎜⎜⎝
⎛
⋅−⋅−=
21)(
⎟⎟
⎠
⎞
⎜⎜
⎝
⎛⎟⎟⎠
⎞⎜⎜⎝
⎛
⋅−⋅=
tDxerfCC
dscld 2
1γ
0.1lim
≤CC d
iγlimCC KdP φγ ≤
Safety Factor : 3.1=K
P
φγ
Safety Factor : 3.1=⋅ cli γγ
clγ : Factor with consideration to the variation in the Cd value, in general, 1.3 is acceptable
Clim=CTL(= 1.2 kg/m3 of total chloride)
pγ
kφ: Environmental factor for chloride attack
: Durability reduction factor for chloride attack
Revised to (2007)- 0.4 % of binder

Concrete Materials, Mechanics & Engineering Lab., Yonsei Univ.
Durability evaluation
⎟⎠
⎞⎜⎝
⎛ −⋅=Dt
xerfCtxC cS 2
1),(
Clim=1.2 kg/m3Chloride threshold level
Concrete Standard Specification on Durability (2004)
Constant D, Cs
Chloride transport equation
0
30
60
90
120
150
0 50 100 150 200 250 300
Cover depth (mm)
Cor
rosio
n in
itiat
ion
time
(yea
rs)
Demanded cover depth260mm unrealistic coverfor 100 years service life
Need to revised for Clim, D, Cs, etc.
Required cover depth for 100 service life for the bridge
Clim : 1.2kg/m3 0.4% binder weight

Concrete Materials, Mechanics & Engineering Lab., Yonsei Univ.
A modification by considering time dependent characteristics of chloride transport
Sea waterSea water
t = 1 year
t = 10 year
t = 30 year
t = 30 yeart = 10 year
t = 1 year
increase of CSwith time
decrease of Dwith time
chlo
ride
con
cent
ratio
n
depth
CS
diff
usio
n co
effic
ient
time
D
RC Structure
Considering time dependency of CS and D
durability evaluation assessment

Concrete Materials, Mechanics & Engineering Lab., Yonsei Univ.
Conventional chloride transport model
Chloride transport mechanisms :
- diffusion due to a concentration gradient- absorption due to a capillary action- migration in an electrical field- a pressure-induced flow- wick action
the primary mechanism
2
2
xCD
tC
∂∂
=∂∂
C(x,0) = 0 at t = 0, C(0,t) {= Cs (constant at x=0 )}=Co
⎟⎠
⎞⎜⎝
⎛ −=Dt
xerfCtxC2
1),( 0
∵ no applied electric field andstableness of the moisture condition
Fick’s diffusion law :
boundary conditions :
this model can not consider time dependency of CS and D
Conventional model
D = const.

Concrete Materials, Mechanics & Engineering Lab., Yonsei Univ.
Solutions with time dependent CS
Kassir & Ghosn2002Cs(t)= C0[1 - e-γt]
Cs(t)=k2t1/2
Uji et al. 1990Amey et al. 1998
Cs(t)=k1t
Crank 1983Cs=constant
ReferencesSolutionsCS functions
⎟⎟⎠
⎞⎜⎜⎝
⎛−=
DtxerfCtxC S 2
1),(
⎥⎦
⎤⎢⎣
⎡⎟⎠
⎞⎜⎝
⎛−⎟
⎠
⎞⎜⎝
⎛⎟⎟⎠
⎞⎜⎜⎝
⎛+= − Dtxe
Dtx
Dtxerfc
DtxtktxC 4/
2
1
2
2221),(
⎥⎥⎦
⎤
⎢⎢⎣
⎡
⎪⎭
⎪⎬⎫
⎪⎩
⎪⎨⎧
⎟⎠
⎞⎜⎝
⎛⎟⎟⎠
⎞⎜⎜⎝
⎛−= −
Dtxerfc
DtxetktxC Dtx
22),( 4/
2
2 π
⎟⎟⎠
⎞⎜⎜⎝
⎛−−−= − )]([
21),(
2
2
40 izerfcdeRe
DtxerfCtxC zDt
x
Solving the Fick’s 2nd law
2
2
xCD
tC
∂∂
=∂∂

Concrete Materials, Mechanics & Engineering Lab., Yonsei Univ.
A general solution to Fick’s 2nd law for time-varying CS
∫ ⎟⎟
⎠
⎞
⎜⎜
⎝
⎛⋅
−= −
−ttD
xS de
ttC
DxtxC
0
)(42/3
2
)()(
2),( υ
υπυ
)(2 υω
−=
tDx
∫∞
−⋅⎟⎟⎠
⎞⎜⎜⎝
⎛−=
Dtx
S deDxtCtxC
2
2
22
42),( ω
ωπω
2
2
xCD
tC
∂∂
=∂∂
A heat conduction solution in Solids by Carslaw and Jaeger (1959)
Fick’s diffusion law :
The solution can be used for any type of CS functions
A general solution for CS (t) :
D = const.
It is possible to consider any time dependent CS
assumption :
Concrete Materials, Mechanics & Engineering Lab., Yonsei Univ.
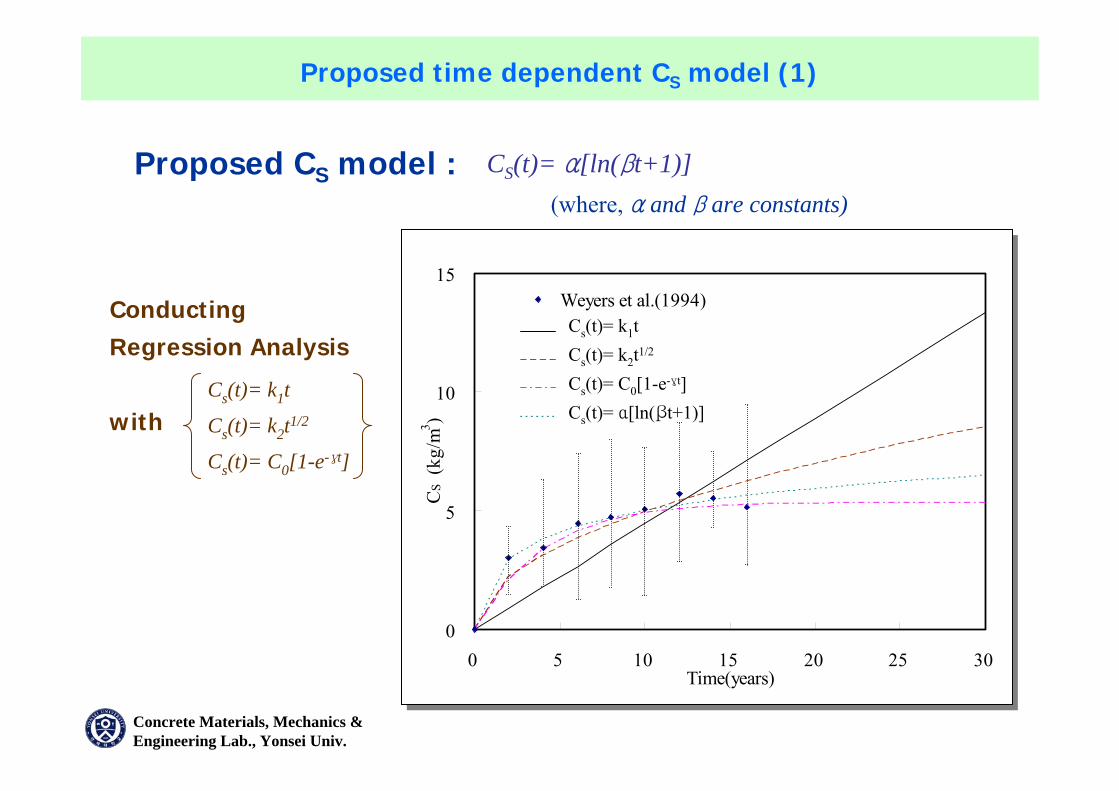
Proposed time dependent CS model (1)
CS(t)= α[ln(βt+1)]Proposed CS model :
0
5
10
15
0 5 10 15 20 25 30Time(years)
CS
(kg/
m3 )
Weyers et al.(1994)
0
5
10
15
0 5 10 15 20 25 30Time(years)
CS
(kg/
m3 )
Weyers et al.(1994)
계열2계열3계열4계열5
Cs(t)= k1tCs(t)= k2t1/2
Cs(t)= C0[1-e-γt]Cs(t)= α[ln(βt+1)]
ConductingRegression Analysis
withCs(t)= k1t
Cs(t)= k2t1/2
Cs(t)= C0[1-e-γt]
(where, α and β are constants)

Concrete Materials, Mechanics & Engineering Lab., Yonsei Univ.
Proposed time dependent CS model (2)
CS (t) = α [ln(β t+1)]
Shape factor β
CS values(at t=100 years)
Song et al (2006)0.99α= 1.37, β = 3.77Cs(t)= α[ln(βt+1)]
Kassir & Ghosn 20020.98C0= 5.34, γ= 0.25Cs(t)= C0[1-e-γt]
0.90k2= 1.56Cs(t)= k2t1/2Uji et al. 1990
0.35k1=0.44Cs(t)= k1t
Referencesregressionfactors (=R2)
Constants for modelsCS functions
3.77β
0.250.340.510.761.52αthisstudy
1.52.03.04.59.0CS (kg/m3)MOCTJSCE
10005002501000
distance from the sea (m)parameters
Results of regression analysis
Constants for time dependent CS model
Calculating α
Proposed CS model :
Very accurate model

Concrete Materials, Mechanics & Engineering Lab., Yonsei Univ.
Proposed time dependent D model
time, t
chlo
ride
diff
usio
n co
effic
ient
diffusion coefficient at time t, D(t)
∫ ⋅=t
m dDt
tD0
)(1)( ττ
S(tS(t))
the mean value of the chloride diffusion coefficient
∫ ⋅=t
dDtS0
)()( ττ
t0
the area under the curve D(t)
mR
R ttDtD ⎟⎠⎞
⎜⎝⎛=)(
m
RR t
tDtD ⎟⎟⎠
⎞⎜⎜⎝
⎛=
lim
)(
(t ≤ 30 years)
(t > 30 years)
mR
m tt
mDtD ⎟
⎠⎞
⎜⎝⎛
−= lim
1)(
m
RRm t
tt
tmmm
DtD ⎟⎟⎠
⎞⎜⎜⎝
⎛⎥⎦⎤
⎢⎣⎡ +−
−=
lim
lim)1(1
)(
(t ≤ 30 years)
(t > 30 years)
Time dependent D model :
∫ ⋅=⋅=t
m dDt
tSt
tD0
)(1)(1)( ττ

Concrete Materials, Mechanics & Engineering Lab., Yonsei Univ.
Chloride threshold level (Clim)
Chloride threshold level (Clim) can be presented :
a ratio of chlorides to hydroxyl ionsfree chloride content (% by weight of cement or kg/m3)total chloride content (% by weight of cement or kg/m3)
takes into account the inhibiting effect of cement.represents the total aggressive potential of chloride ions.
0.3~0.6 kg/m3 in the acceleration test for a concrete specimen1.2~2.4 kg/m3 in exposure experiment under the actual environment
the lowest limit value for concrete structures(corresponds to 0.4 % by weight of cement
for the concrete containing a cement content of 300 kg/m3)
∴ 0.4 % by weight of cement as a Clim is more reasonable
JSCE(2002) and MOCT (2004) specified the Clim value :

Concrete Materials, Mechanics & Engineering Lab., Yonsei Univ.
Refined model considering time dependency
∫∞
−⋅⎟⎟⎠
⎞⎜⎜⎝
⎛−=
Dtx
S deDxtCtxC
2
2
22
42),( ω
ωπω
Time dependent D model :
A general solution to the Fick’s 2nd law :
mRR
m tt
mDtD ⎟
⎠⎞
⎜⎝⎛
−=
1)(
m
RRm t
tt
tmmm
DtD ⎟⎟⎠
⎞⎜⎜⎝
⎛⎥⎦⎤
⎢⎣⎡ +−
−=
lim
lim)1(1
)(
(t ≤ 30 years)
(t > 30 years)
CS(t)= α[ln(βt+1)]Time dependent CS model :
Clim : 0.4 % by weight of cement

Concrete Materials, Mechanics & Engineering Lab., Yonsei Univ.
)()0)(()0)(( lim, t
dtF N
tCCnNtgnP β−Φ=
<−=
<=
Limit state function )()()()( lim tCCtStRtg d−=−=
Time
S(t)
Pf
Distribution of R(t)R,S
Distribution of S(t)
R(t)
Service life density
Mean service life
Target Probabilityof Failure Pf
Probability of failure
Fully probabilistic assessment of existing structures (1)

Concrete Materials, Mechanics & Engineering Lab., Yonsei Univ.
Fully probabilistic assessment of existing structures (2)
Sampling from properties of variables
SAMPLES(N: the number of simulation)
VARIABLE
m(N)DR(N)Clim(N)Xc(N)Cs(N)
m(2)DR(2)Clim(2)Xc(2)Cs(2)
m(1)DR(1)Clim(1)Xc(1)Cs(1)
:::::
:::::
mDRClimXcCs
-DR : (u,σ)
m : (u,σ)Clim : (u,σ)
xc : (u,σ)Cs : (u,σ)Property(u: Meanσ: Standard dev.)
Estimating statistical properties of input parameter

Concrete Materials, Mechanics & Engineering Lab., Yonsei Univ.
SAMPLES(N: the number of simulation)
VARIABLE
m(N)DR(N)Clim(N)xc(N)Cs(N)
m(2)DR(2)Clim(2)xc(2)Cs(2)
m(1)DR(1)Clim(1)xc(1)Cs(1)
::::::::::
mDRClimxcCs
Fully probabilistic assessment of existing structures (3)
durability failure at t !!0),(lim <− txCC c
⎥⎥⎦
⎤
⎢⎢⎣
⎡⎟⎟⎠
⎞⎜⎜⎝
⎛
⋅−=
tDxerfCtxC c
s 21),(
m
R ttDtD ⎟⎠⎞
⎜⎝⎛= 0)(previous
model

Concrete Materials, Mechanics & Engineering Lab., Yonsei Univ.
SAMPLES(N: the number of simulation)
VARIABLE
m(N)DR(N)Clim(N)xc(N)Cs(N)
m(2)DR(2)Clim(2)xc(2)Cs(2)
m(1)DR(1)Clim(1)xc(1)Cs(1)
::::::::::
mDRClimxcCs
∫∞
−⋅⎟⎟⎠
⎞⎜⎜⎝
⎛−=
Dtx
S deDxtCtxC
2
2
22
42),( ω
ωπω
mRR
m tt
mDtD ⎟
⎠⎞
⎜⎝⎛
−=
1)(
Fully probabilistic assessment of existing structures (4)
durability failure at t !!0),(lim <− txCC c

Concrete Materials, Mechanics & Engineering Lab., Yonsei Univ.
0
5
10
15
20
25
1.5 2.0 2.5 3.0 3.5 4.0 4.5 5.0 5.5
Diffusion coefficient (m2/s × 10-12)
Num
ber o
f Tes
ts
0
2
4
6
8
10
95 100 105 110 115 120 125 130cover depth (mm)
Num
ber o
f Tes
ts
Histogram of cover depth measured Histogram of diffusion coefficients
Inspection for exiting structures- measured values of D and cover thickness of the immersed tunnels
unit: [m2/s ×10-12] unit: [mm]
N(3.77, 0.92) N(110.7, 9.5)

Concrete Materials, Mechanics & Engineering Lab., Yonsei Univ.
0
20
40
60
80
100
3.0 3.5 4.0 4.5 5.0 5.5 6.0 6.5 7.0 7.5 8.0 8.5 9.0
Diffusion coefficient (m2/s ×10-12)N
umbe
r of T
ests
0
5
10
15
20
25
30
1.5 2.0 2.5 3.0 3.5 4.0Diffusion coefficient (m2/s ×10-12)
Num
ber o
f Tes
ts
Histogram of diffusion coefficient measured in atmospheric and submerged zone
Histogram of diffusion coefficients in splash zone
- Measured values of diffusion coefficient for the pier and pylon
unit: [m2/s ×10-12] unit: [m2/s ×10-12]
N(2.84, 0.53) N(5.16, 0.86)

Concrete Materials, Mechanics & Engineering Lab., Yonsei Univ.
a=N(0.36, 0.11)b=N(3.77, 0.38)N(3.0, 0.9)N(3.0, 0.9)N(3.0, 0.9)% of binder
Piers & PylonsPiers & PylonsImmersed tunnelPiers & Pylons
N(0.4, 0.04)
N(0.36, 0.07)
N(5.16, 0.86)
N(75.0, 7.5)
CS=const.
Submerged zone
N(0.4, 0.04)
N(0.54, 0.11)
N(3.77, 0.92)
N(110.7, 9.5)
CS=const.
N(0.4, 0.04)
N(0.36, 0.07)
N(2.84, 0.53)
N(75.0, 7.5)
CS=const.
Splash zone
chloride threshold
level
aging factor
diffusion coefficient
cover depth
surface chloride
concentration
Atmospheric zone
N(0.4, 0.04)% of binderClim
N(0.36, 0.07)-m
N(5.16, 0.86)m2/s ×10-12D
N(75.0, 7.5)mmxc
CS(t)=a[ln(bt+1)]CS types
CS
UnitsVariables
Input parameters to assess the service life of the structure

Concrete Materials, Mechanics & Engineering Lab., Yonsei Univ.
0
20
40
60
80
100
100 200 300 400 500
Time (years)
Prob
abili
ty o
f Fai
lure
(%)
-4
-2
0
2
4
Rel
iabi
lity
Inde
x
PFβ
submerged zoneimmersed tunnel
Assessment results by standard specification- the immersed tunnel in submerged zone
Targetprobability of failure
10 %
Targetreliability index
1.3

Concrete Materials, Mechanics & Engineering Lab., Yonsei Univ.
- the bridge structure
0
20
40
60
80
100
0 20 40 60 80 100
Time (years)
Prob
abili
ty o
f Fai
lure
(%)
-5
-3
-1
1
3
5
Rel
iabi
lity
Inde
x
PFβ submerged zone
0
20
40
60
80
100
0 20 40 60 80 100
Time (years)
Prob
abili
ty o
f Fai
lure
(%)
-5
-3
-1
1
3
5
Rel
iabi
lity
Inde
x
PFβ splash zone
0
20
40
60
80
100
0 20 40 60 80 100
Time (years)
Prob
abili
ty o
f Fai
lure
(%)
-5
-3
-1
1
3
5
Rel
iabi
lity
Inde
x
PFβ atmospheric zone The bridge structures designed for 100 years
of service life in marine environment, which are under construction,does not satisfy target service life (=100 years)
(one reason is that Clim value used in spec.e.g. In a design stage
submerged zone : 1.8 %splash zone : 0.6 %atmospheric zone : 0.8 % )
Concrete Materials, Mechanics & Engineering Lab., Yonsei Univ.
0
10
20
30
40
0 100 200 300 400Time (years)
Prob
abili
ty o
f Fai
lure
(%)
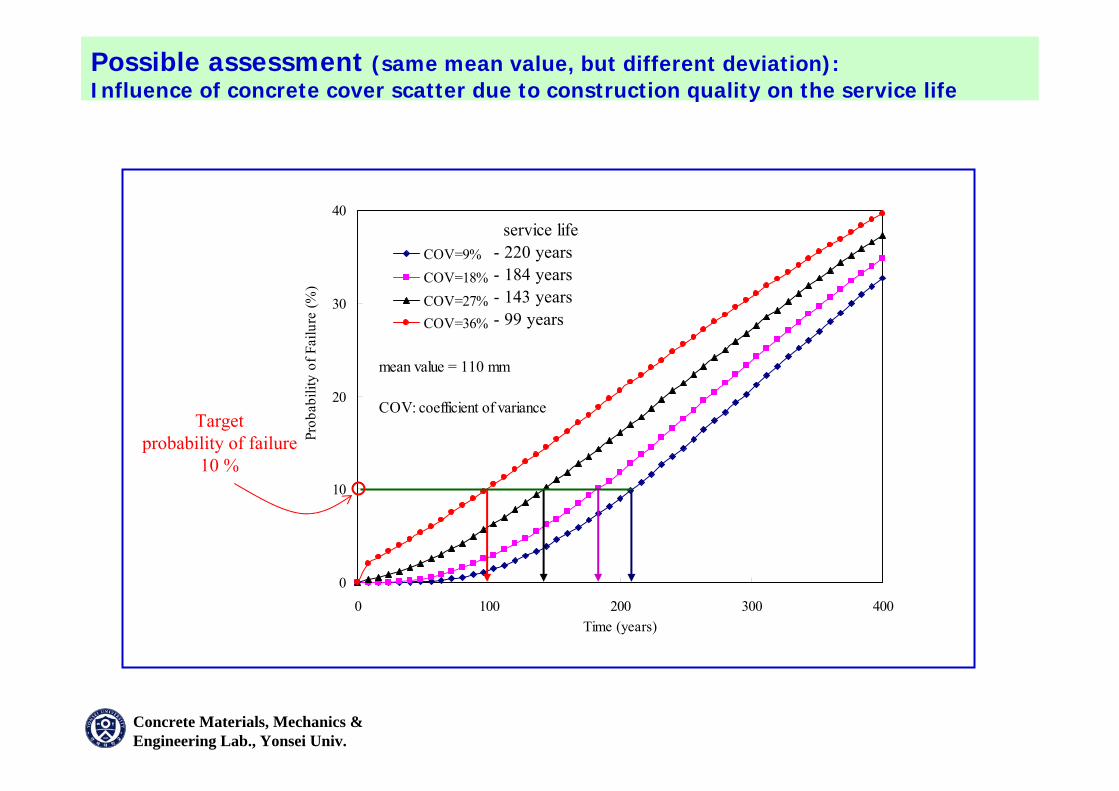
COV=9%COV=18%COV=27%COV=36%
mean value = 110 mm
COV: coefficient of variance
service life- 220 years- 184 years- 143 years- 99 years
Possible assessment (same mean value, but different deviation):Influence of concrete cover scatter due to construction quality on the service life
Targetprobability of failure
10 %

Concrete Materials, Mechanics & Engineering Lab., Yonsei Univ.
Comparison of assessment method
considerationN/AconsiderationAge factor
0.4 (%, binder)1.2 (kg/m3)0.4 (%, binder)Clim
time dep.time indep.time dep.D
time dep.(in atmospheric zone)
time indep.time dep.
(in atmospheric zone)CS
time dep. of CStime indep. of CS and Dtime dep. of CSFick’s law
deterministic modeldeterministic modelprobabilistic modelanalysis
Revised Spec.Standard spec.Probability analysis

Concrete Materials, Mechanics & Engineering Lab., Yonsei Univ.
a=N(0.36, 0.11)b=N(3.77, 0.38)N(3.0, 0.9)N(3.0, 0.9)N(3.0, 0.9)% of binder
Piers & PylonsPiers & PylonsImmersed tunnelPiers & Pylons
N(0.4, 0.04)
N(0.36, 0.07)
N(5.16, 0.86)
N(75.0, 7.5)
CS=const.
Submerged zone
N(0.4, 0.04)
N(0.54, 0.11)
N(3.77, 0.92)
N(110.7, 9.5)
CS=const.
N(0.4, 0.04)
N(0.36, 0.07)
N(2.84, 0.53)
N(75.0, 7.5)
CS=const.
Splash zone
chloride threshold
level
aging factor
diffusion coefficient
cover depth
surface chloride
concentration
Atmospheric zone
N(0.4, 0.04)% of binderClim
N(0.36, 0.07)-m
N(5.16, 0.86)m2/s ×10-12D
N(75.0, 7.5)mmxc
CS(t)=a[ln(bt+1)]CS types
CS
UnitsVariables
Recall of Input parameters of existing structure

Concrete Materials, Mechanics & Engineering Lab., Yonsei Univ.
Assessment by probability analysis
0
20
40
60
80
100
0 20 40 60 80 100
Time (years)
Prob
abili
ty o
f Fai
lure
(%)
-5
-3
-1
1
3
5
Rel
iabi
lity
Inde
x
PFβ
splash zonepiers and pylons
0
20
40
60
80
100
0 20 40 60 80 100
Time (years)
Prob
abili
ty o
f Fai
lure
(%)
-5
-3
-1
1
3
5
Rel
iabi
lity
Inde
x
PFβ
atmospheric zonepiers and pylons
0
20
40
60
80
100
100 200 300 400 500
Time (years)
Prob
abili
ty o
f Fai
lure
(%)
-4
-2
0
2
4
Rel
iabi
lity
Inde
x
PFβ
submerged zoneimmersed tunnel
submerged zoneimmersed tunnel
220 years0
20
40
60
80
100
0 20 40 60 80 100
Time (years)
Prob
abili
ty o
f Fai
lure
(%)
-5
-3
-1
1
3
5
Rel
iabi
lity
Inde
x
PFβ
submerged zonepiers and pylons
22 years
48 years50 years

Concrete Materials, Mechanics & Engineering Lab., Yonsei Univ.
0.0
0.5
1.0
1.5
2.0
0 10 20 30 40 50
Time (years)
Chl
orid
e co
nten
ts (%
, bin
der
0.0
0.5
1.0
1.5
2.0
0 10 20 30 40 50
Time (years)
Chl
orid
e co
nten
ts (%
, bin
der
0.0
0.5
1.0
1.5
2.0
0 10 20 30 40 50
Time (years)
Chl
orid
e co
nten
ts (%
, bin
der
0.0
0.5
1.0
1.5
2.0
0 10 20 30 40 50
Time (years)
Chl
orid
e co
nten
ts (%
, bin
der
Assessment by Standard specification (2004)
splash zonepiers and pylons
atmospheric zonepiers and pylons
submerged zoneimmersed tunnel
16 years
submerged zonepiers and pylons
5 years
6 years9 years

Concrete Materials, Mechanics & Engineering Lab., Yonsei Univ.
0.0
0.2
0.4
0.6
0.8
1.0
0 20 40 60 80 100
Time (years)
Chl
orid
e co
nten
ts (%
, bin
der
0.0
0.2
0.4
0.6
0.8
1.0
0 100 200 300 400 500
Time (years)
Chl
orid
e co
nten
ts (%
, bin
der
0.0
0.2
0.4
0.6
0.8
1.0
0 20 40 60 80 100
Time (years)
Chl
orid
e co
nten
ts (%
, bin
der
0.0
0.2
0.4
0.6
0.8
1.0
0 20 40 60 80 100
Time (years)
Chl
orid
e co
nten
ts (%
, bin
der
Assessment by revised spec.
splash zonepiers and pylons
atmospheric zonepiers and pylons
submerged zoneimmersed tunnel
450 years
submerged zonepiers and pylons
38 years
71 years84 years

Concrete Materials, Mechanics & Engineering Lab., Yonsei Univ.
Comparison of results by different assessment method
54 years66 years371 years29 years
Refinedmodel
(Clim=1.2kg/m3)(SF=1.3)
6 years9 years16 years5 yearsStandard
specification(2004)
Piers & PylonsPiers & PylonsImmersed tunnelPiers & Pylons
38 years
22 years
Submerged zone
450 years
220 years
84 years
50 years
Splash zone Atmospheric zone
71 years
Refinedmodel
(Clim=0.4%)(SF=1.3)
48 yearsProbability analysis
(Pf=10%)
Current spec. << probability analysis (Pf=10%) < refined model <refined model (0.4%C)

Concrete Materials, Mechanics & Engineering Lab., Yonsei Univ.
Use of different Pf- Predicted service life by different probability of failure (1)
0
20
40
60
80
100
0 20 40 60 80 100
Time (years)
Prob
abili
ty o
f Fai
lure
(%)
-5
-3
-1
1
3
5
Rel
iabi
lity
Inde
x
PFβ
submerged zonepiers and pylons
Service lifePF
52 years50%
44 years40%
36 years30%
29 years20%
22 years10%

Concrete Materials, Mechanics & Engineering Lab., Yonsei Univ.
0
20
40
60
80
100
100 200 300 400 500
Time (years)
Prob
abili
ty o
f Fai
lure
(%)
-4
-2
0
2
4
Rel
iabi
lity
Inde
x
PFβ
submerged zoneimmersed tunnel
submerged zoneimmersed tunnel
Service lifePF
556 years50%
468 years40%
380 years30%
300 years20%
220 years10%
- Predicted service life for different probability of failure (2)
Concrete Materials, Mechanics & Engineering Lab., Yonsei Univ.
0
20
40
60
80
100
0 20 40 60 80 100
Time (years)
Prob
abili
ty o
f Fai
lure
(%)
-5
-3
-1
1
3
5
Rel
iabi
lity
Inde
x
PFβ splash zone
piers and pylons
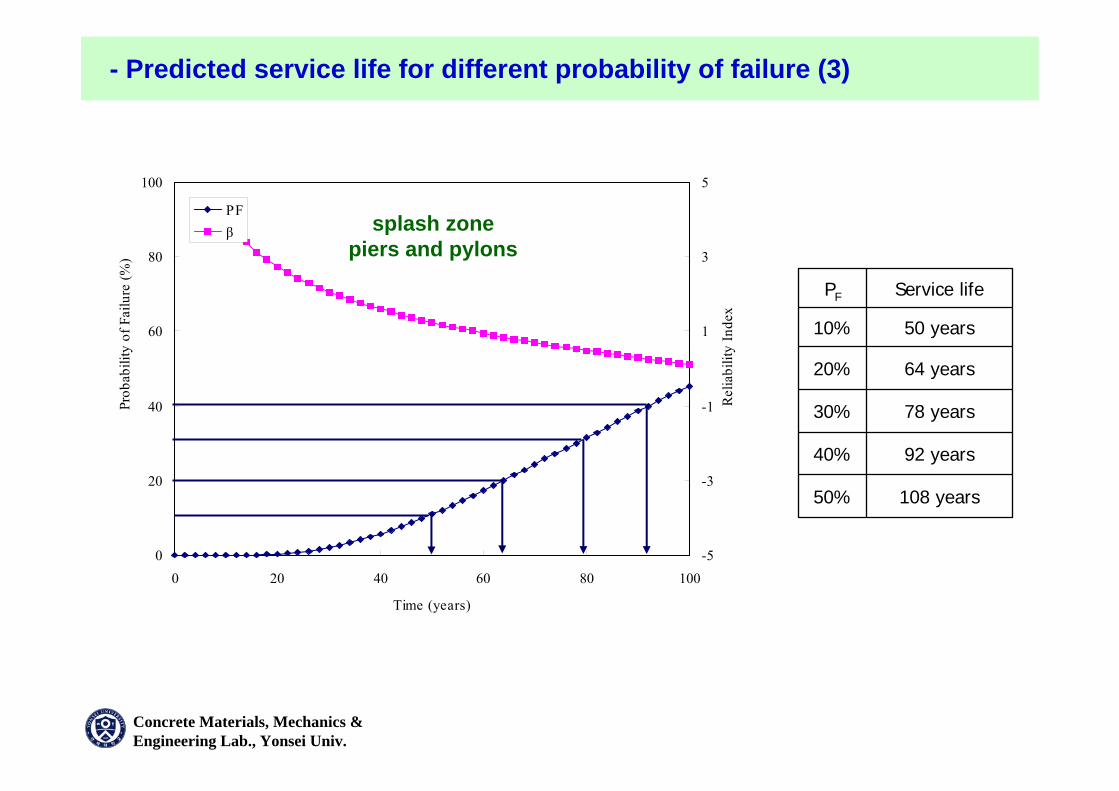
Service lifePF
108 years50%
92 years40%
78 years30%
64 years20%
50 years10%
- Predicted service life for different probability of failure (3)
Concrete Materials, Mechanics & Engineering Lab., Yonsei Univ.
0
20
40
60
80
100
0 20 40 60 80 100
Time (years)
Prob
abili
ty o
f Fai
lure
(%)
-5
-3
-1
1
3
5
Rel
iabi
lity
Inde
x
PFβ
atmospheric zonepiers and pylons
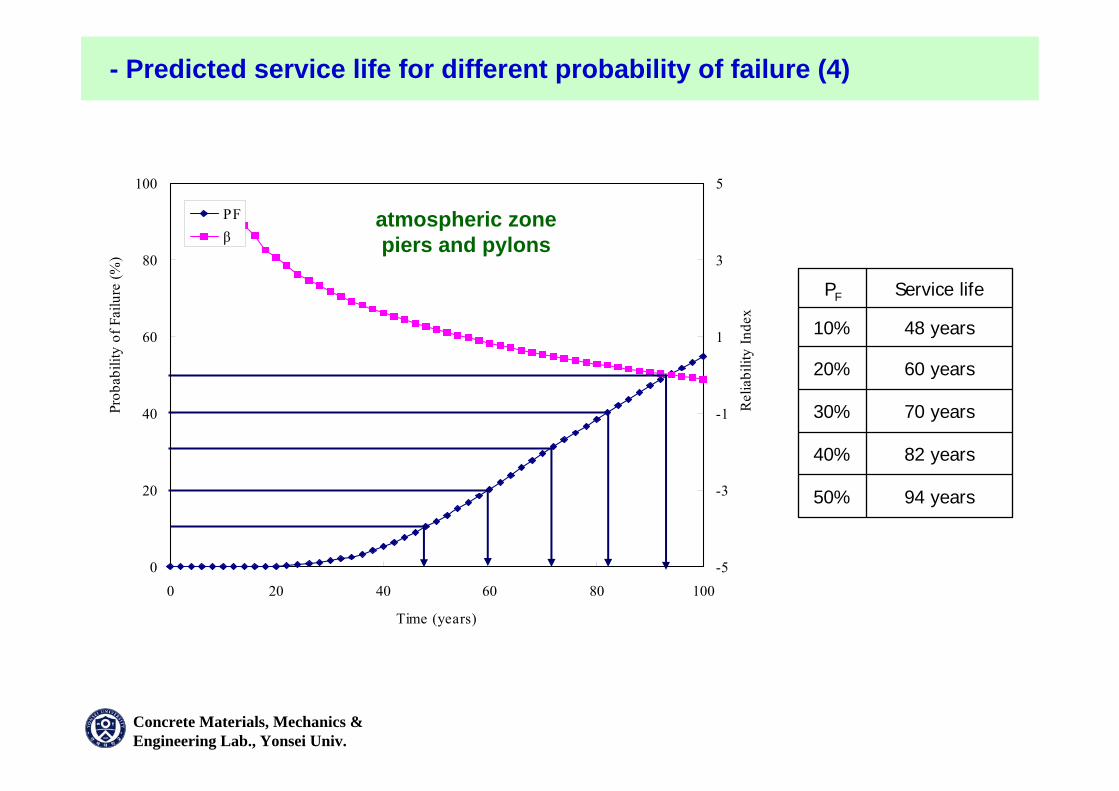
Service lifePF
94 years50%
82 years40%
70 years30%
60 years20%
48 years10%
- Predicted service life for different probability of failure (4)

Concrete Materials, Mechanics & Engineering Lab., Yonsei Univ.
Different service life by different probability failure!same for SF ?
PF
0.5
0.4
0.3
0.2
0.1
70 years78 years380 years36 years
82 years92 years468 years44 years
94 years108 years556 years52 years
60 years64 years300 years29 years
Piers & PylonsPiers & PylonsImmersed tunnelPiers & Pylons
22 years
Submerged zone
220 years 50 years
Splash zone Atmospheric zone
48 years

Concrete Materials, Mechanics & Engineering Lab., Yonsei Univ.
Yes, then how to select the safety factor for the spec.?- Probability of failure (reliability index) vs. safety factor
Probabilistic Analysis(Probabilistic assessment)
Deterministic Analysis(Standard specification)
Service Lifeof the target structure
Probability of failure(PF)
Safety factor(SF)
relationship between PF and SF
PF=function of time
SF=function of time

Concrete Materials, Mechanics & Engineering Lab., Yonsei Univ.
Predicted service life for different Safety Factors using Refined Spec.
Clim=1.2kg/m3
1.5 49 years61 years343 years26 years
SafetyFactor
1.4
1.3
1.2
1.1
1.0
58 years70 years388 years31 years
54 years66 years371 years29 years
52 years63 years356 years27 years
62 years74 years408 years33 years
Piers & PylonsPiers & PylonsImmersed tunnelPiers & Pylons
36 years
Submerged zone
433 years 79 years
Splash zone Atmospheric zone
66 years

Concrete Materials, Mechanics & Engineering Lab., Yonsei Univ.
Predicted service life for different Safety Factors using Refined Spec.
Clim=0.4% of binder
1.5 63 years76 years411 years34 years
SafetyFactor
1.4
1.3
1.2
1.1
1.0
76 years89 years474 years41 years
71 years84 years450 years38 years
67 years79 years429 years36 years
81 years95 years503 years44 years
Piers & PylonsPiers & PylonsImmersed tunnelPiers & Pylons
48 years
Submerged zone
539 years 102 years
Splash zone Atmospheric zone
88 years

Concrete Materials, Mechanics & Engineering Lab., Yonsei Univ.
Analysis Results of both Probabilistic and Deterministic methods
DeterministicMethod(Refined Spec.)
1.5 496134326
SafetyFactor
1.4
1.3
1.2
1.1
1.0
587038831
546637129
526335627
627440833
Piers & PylonsPiers & PylonsImmersed tunnelPiers & Pylons
36
Submerged zone
433 79
Splash zone Atmospheric zone
66
ProbabilisticMethod
Prob.Failure
0.5
0.4
0.3
0.2
0.1
707838036
829246844
9410855652
606430029
Piers & PylonsPiers & PylonsImmersed tunnelPiers & Pylons
22
Submerged zone
220 50
Splash zone Atmospheric zone
48
Clim=1.2kg/m3

Concrete Materials, Mechanics & Engineering Lab., Yonsei Univ.
Analysis Results of both Probabilistic and Deterministic methods
DeterministicMethod(Refined Spec.)
1.5 637641134
SafetyFactor
1.4
1.3
1.2
1.1
1.0
768947441
718445038
677942936
819550344
Piers & PylonsPiers & PylonsImmersed tunnelPiers & Pylons
48
Submerged zone
539 102
Splash zone Atmospheric zone
88
ProbabilisticMethod
Prob.Failure
0.5
0.4
0.3
0.2
0.1
707838036
829246844
9410855652
606430029
Piers & PylonsPiers & PylonsImmersed tunnelPiers & Pylons
22
Submerged zone
220 50
Splash zone Atmospheric zone
48
Clim=0.4% of binder

Concrete Materials, Mechanics & Engineering Lab., Yonsei Univ.
0
0.1
0.2
0.3
0.4
0.5
0 10 20 30 40 50 60Time (years)
Prob
abili
ty fa
ilure
1.0
1.1
1.2
1.3
1.4
1.5
Safe
ty fa
ctor
Probability failureSafety factor
0
0.1
0.2
0.3
0.4
0.5
0 100 200 300 400 500 600Time (years)
Prob
abili
ty fa
ilure
1.0
1.1
1.2
1.3
1.4
1.5
Safe
ty fa
ctor
Probability failureSafety factor
0
0.1
0.2
0.3
0.4
0.5
0 20 40 60 80 100 120Time (years)
Prob
abili
ty fa
ilure
1.0
1.1
1.2
1.3
1.4
1.5
Safe
ty fa
ctor
Probability failureSafety factor
0
0.1
0.2
0.3
0.4
0.5
0 20 40 60 80 100Time (years)
Prob
abili
ty fa
ilure
1.0
1.1
1.2
1.3
1.4
1.5
Safe
ty fa
ctor
Probability failureSafety factor
Predicted service life for Probability of failure and Safety factor(Clim=1.2kg/m3)
splash zonepiers and pylons
atmospheric zonepiers and pylons
submerged zoneimmersed tunnel
submerged zonepiers and pylons

Concrete Materials, Mechanics & Engineering Lab., Yonsei Univ.
Predicted service life for Probability of failure and Safety factor(Clim=0.4% of binder)
0
0.1
0.2
0.3
0.4
0.5
0 10 20 30 40 50 60Time (years)
Prob
abili
ty fa
ilure
1.0
1.1
1.2
1.3
1.4
1.5
Safe
ty fa
ctor
Probability failureSafety factor
0
0.1
0.2
0.3
0.4
0.5
0 100 200 300 400 500 600Time (years)
Prob
abili
ty fa
ilure
1.0
1.1
1.2
1.3
1.4
1.5
Safe
ty fa
ctor
Probability failureSafety factor
0
0.1
0.2
0.3
0.4
0.5
0 20 40 60 80 100Time (years)
Prob
abili
ty fa
ilure
1.0
1.1
1.2
1.3
1.4
1.5
Safe
ty fa
ctor
Probability failureSafety factor
0
0.1
0.2
0.3
0.4
0.5
0 20 40 60 80 100 120Time (years)
Prob
abili
ty fa
ilure
1.0
1.1
1.2
1.3
1.4
1.5
Safe
ty fa
ctor
Probability failureSafety factor
splash zonepiers and pylons
atmospheric zonepiers and pylons
submerged zoneimmersed tunnel
submerged zonepiers and pylons

Concrete Materials, Mechanics & Engineering Lab., Yonsei Univ.
0.4% of binder
1.2kg/m3
Clim
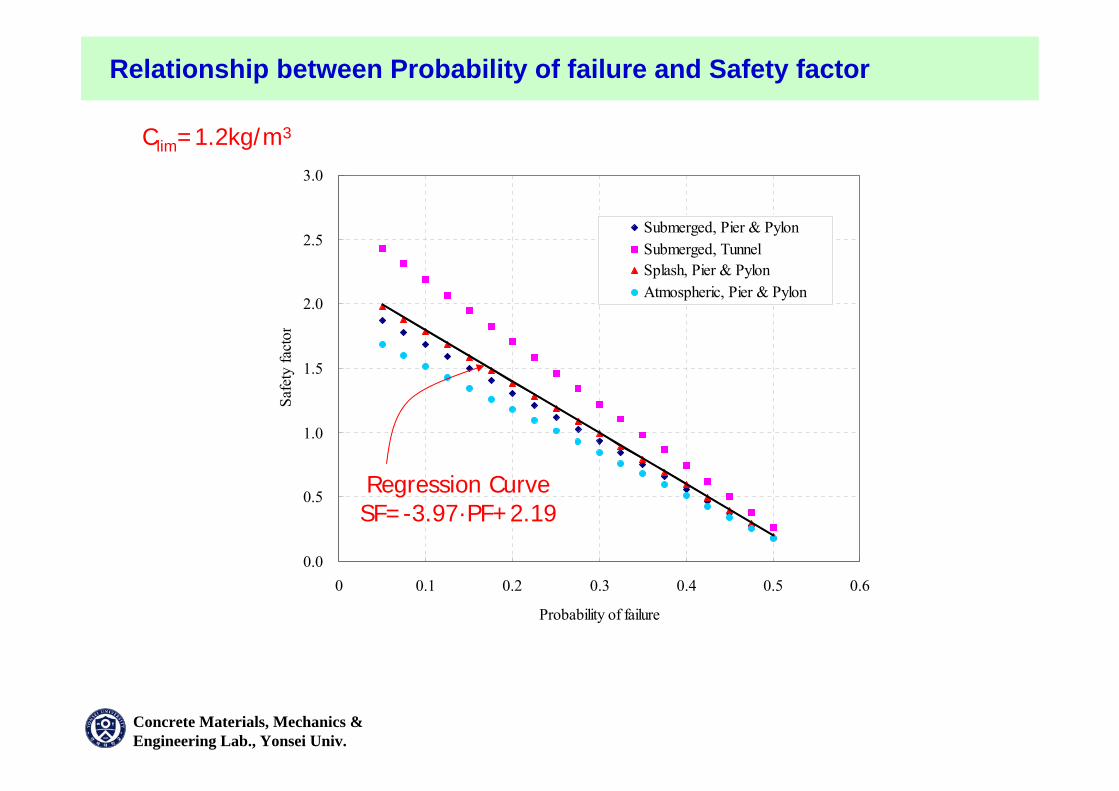
SF=-3.35PF+1.85Pier & PylonAtmospheric zone
SF=-3.97PF+2.18Pier & PylonSplash zone
SF=-4.82PF+2.67Tunnel
SF=-3.75PF+2.06Pier & PylonSubmerged zone
Relationship equationsStructuresZone
SF=-2.32PF+2.02Pier & PylonAtmospheric zone
SF: Safety factor, PF: Probability of Failure
SF=-2.75PF+2.25Pier & PylonSplash zone
SF=-3.39PF+2.58Tunnel
SF=-2.71PF+2.19Pier & PylonSubmerged zone
Relationship between Probability of failure and Safety factor
Concrete Materials, Mechanics & Engineering Lab., Yonsei Univ.
0.0
0.5
1.0
1.5
2.0
2.5
3.0
0 0.1 0.2 0.3 0.4 0.5 0.6
Probability of failure
Safe
ty fa
ctor
Submerged, Pier & PylonSubmerged, TunnelSplash, Pier & PylonAtmospheric, Pier & Pylon
Relationship between Probability of failure and Safety factor
Regression CurveSF=-3.97·PF+2.19
Clim=1.2kg/m3

Concrete Materials, Mechanics & Engineering Lab., Yonsei Univ.
0.0
0.5
1.0
1.5
2.0
2.5
3.0
0.0 0.5 1.0 1.5 2.0
Reliabiilty index
Safe
ty fa
ctor
Submerged, Pier & PylonSubmerged, TunnelSplash, Pier & PylonAtmospheric, Pier & Pylon
Relationship between Reliability index and Safety factor
Regression CurveSF=-0.07β3-0.24β2+1.67β+0.19
Clim=1.2kg/m3

Concrete Materials, Mechanics & Engineering Lab., Yonsei Univ.
0.0
0.5
1.0
1.5
2.0
2.5
3.0
0 0.1 0.2 0.3 0.4 0.5 0.6
Probability of failure
Safe
ty fa
ctor
Submerged, Pier & PylonSubmerged, TunnelSplash, Pier & PylonAtmospheric, Pier & Pylon
Relationship between Probability of failure and Safety factor
Regression CurveSF=-2.79·PF+2.26
Clim=0.4% of binder

Concrete Materials, Mechanics & Engineering Lab., Yonsei Univ.
0.0
0.5
1.0
1.5
2.0
2.5
3.0
0.0 0.5 1.0 1.5 2.0
Reliabiilty index
Safe
ty fa
ctor
Submerged, Pier & PylonSubmerged, TunnelSplash, Pier & PylonAtmospheric, Pier & Pylon
Relationship between Reliability index and Safety factor
Regression CurveSF=-0.05β3-0.17β2+1.18β+0.86
Clim=0.4% of binder

Concrete Materials, Mechanics & Engineering Lab., Yonsei Univ.
Correlation among Safety factor, Probability of failure and Reliability index
0.400.45
Deterministic analysis
Probabilistic analysis
0.200.50
0.600.40
0.800.35
1.000.30
1.200.25
1.400.20
1.590.15
1.790.10
1.990.05
SFPF
1.971.6
Deterministic analysis
Probabilistic analysis
2.021.8
1.871.4
1.741.2
1.561.0
1.340.8
1.100.6
0.820.4
0.520.2
0.200
SFβ
Clim=1.2kg/m3

Concrete Materials, Mechanics & Engineering Lab., Yonsei Univ.
Correlation among Safety factor, Probability of failure and Reliability index
1.000.45
Deterministic analysis
Probabilistic analysis
0.860.50
1.140.40
1.300.35
1.420.30
1.560.25
1.700.20
1.840.15
1.980.10
2.120.05
SFPF
2.111.6
Deterministic analysis
Probabilistic analysis
2.141.8
2.041.4
1.941.2
1.821.0
1.670.8
1.490.6
1.300.4
1.090.2
0.860
SFβ
Clim=0.4% of binder
The safety factor of 1.3 corresponds to a probability of failure of 35%

Concrete Materials, Mechanics & Engineering Lab., Yonsei Univ.
Conclusion
1. It was found that the standard specification, which does not take the time dependency into account, underestimates service life ofconcrete structures exposed to the marine environment. It can beimproved by use of time dependent chloride transport model, the so-called refined model.
2. Fully probabilistic analysis was used to assess remaining service life of a concrete structure considering time dependent characteristics using an informative data on the cover depth and diffusion coefficient of existing structures. It was also found that service life of marine structures is significantly affected by the variation in cover depth, i.e., quality of construction.
3. Safety factor for a partial factor method for durability design can be well related to reliability index or probability of failure of structures of fully probabilistic design. Choice of reliability index should be consistent with selection of the safety factor in the specification, vice versa.

Concrete Materials, Mechanics & Engineering Lab., Yonsei Univ.
Thank you for kind attention !
“Deemed-to-satisfy” and “ Avoidance of deterioration” method will be applicable for engineering practice.
“ Full probabilistic method” will rarely be applied on new projects. “ Full probabilistic method” can be used when assessing existing structures.
Assessment of existing RC structures
“ Partial factor method” will be applicable when calibrated.
Durability design of new RC structures
Concluding remark