2007:7 y 4 july 2007 - amazon web services€¦ · 2007:7 y 4 july 2007 short term indicators in...
TRANSCRIPT
2007:7 4 July 2007
Short term indicators in July 2007
Qarterly national accounts, 1 st quarter 2007
In real terms the GDP in the 1st quarter of 2007 remained almost unchanged from the same quarter of the previous year. Total domestic expenditure decreased by almost 10% in real terms in the 1st quarter of 2007 compared with the same quarter of 2006. During the period there was a decrease in household final consumption by just over 1% and fixed capital formation by 28%. Government final consumption increased by 2%. Exports increased by 17% while imports decreased by 12%. Seasonally adjusted series showed a 0.9% downturn in GDP in the 1st quarter of 2007 compared with an almost unchanged GDP from the same quarter of 2006. Despite a negative growth of the household final consumption, most components showed an increase with the exception of purchases of vehicles which decreased by approximately 40% from the same quarter of previous year. According to seasonally adjusted figures, there was a 0.4% growth in private consumption in the 1st quarter and a 5.1% increase in total exports and a 2.8% downturn in total imports.
Prices
The CPI in July 2007 rose by 0.52% from the preceding month (CPI less housing cost rose by 0.20%). Over the last 12 months the CPI rose by 4.0% (CPI less housing cost rose by 1.7%) while the change over the last 3 months is equivalent to an annual inflation of 8.2% (5.0% less housing cost). In Iceland, the HICP rose by 0.9% in May. Over the 12 months to May the HICP in Iceland rose by 4.0% and by 2.1% in the EEA. The building cost index in June rose by 0.19% from the preceding month and rose by 10.5% on June 2006.
Wages
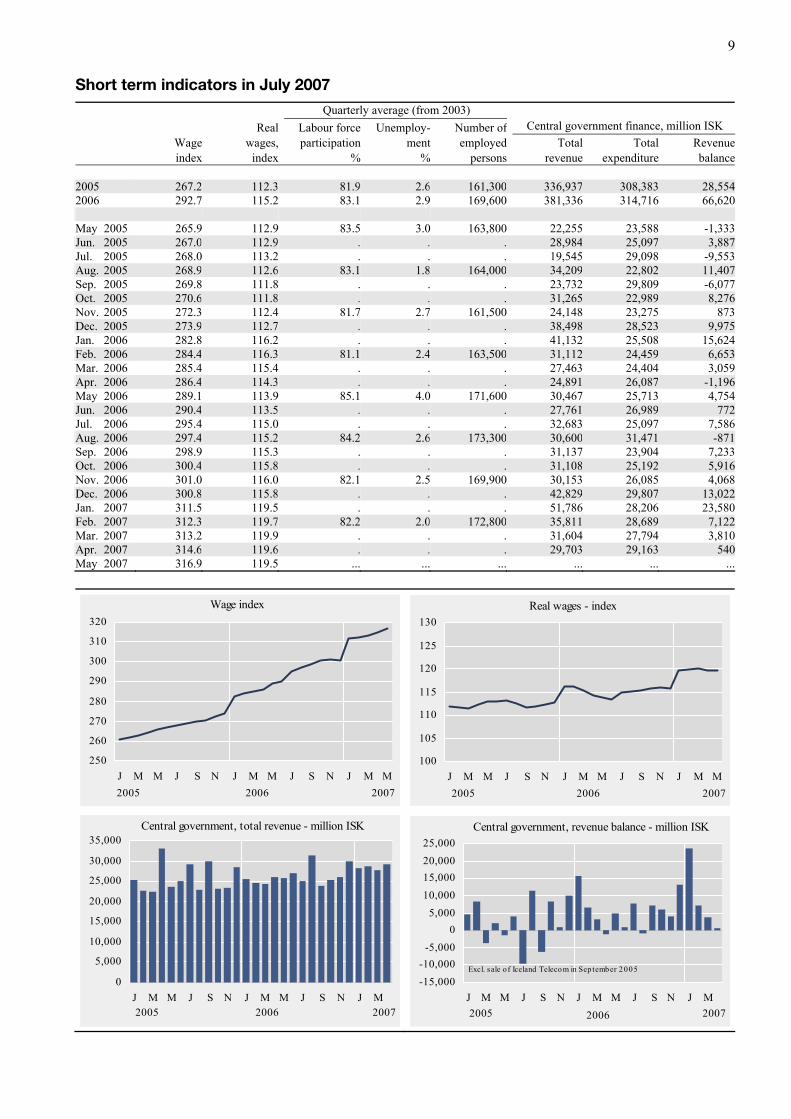
The wage index for the whole economy rose by 0.7% in May 2007 and had then risen by 9.6% over the last 12 months. The corresponding rise in the CPI was 4,3%. Deflated by the CPI, real wages rose by 5.0% over the 12 months to May 2007. The average purchasing power January–May this year is 3.9% over January–May last year.
Domestic demand
Credit card turnover of private households was up by 17.8% in January–May 2007 from 2006. Debit card turnover decreased by 3.5% in January–May 2007. Alto-gether domestic debit and credit card turnover by households increased by 6.6% in recent 12 months compared with the previous 12 months. Credit card expenditure by Icelanders abroad increased by 14.2% in January–May 2007 from 2006. Total
Zero growth og GDP in 1st quarter 2007
The CPI rose by 4.0% in the 12 months to July
The wage index rose by 9.6% in the 12 months to May
Domestic demand on the increase

2
credit and debit card turnover of foreign cards in Iceland increased by 20.6% in January–May 2007 compared with same months in 2006. New car registrations in January–June 2007 were 10,051, i.e. decreased by 19.7% from 2006 while in last twelve months, to end of June, the decrease was 24.7%.
Fish catch volume and export prices
The total value of the fish catch in January–May 2007, measured at constant prices, was 3.0% less than the year before. The price of catch in Icelandic krónur was up by 36.1% in January–April 2007 from January–April 2006. Export prices of marine products, measured in Icelandic krónur, were up by 14.3% in January–May 2007 over January–May the year before. The price of foreign exchange increased by 8.1% (krónur depreciated) between the periods.
External trade in May and preliminary figures in June
The balance of trade of goods in May showed a deficit of 10.7 billion as compared with a deficit of 12.6 billion in May 2006. The value of exports was 20.5 billion and the value of imports was 31.2 billion. The value of exports January–May was 119.9 billion and the value of imports was 150.5 billion. Exports rose by 21.4% in this period and imports fell by 4.8% at fixed exchange rate. The preliminary value of exports of goods in June 2007 is 20.1 billion ISK fob while the value of imports is 29.7 billion ISK fob. Therefore preliminary figures show a trade deficit in June 2007 of 9.6 billion ISK compared with 15.4 billion in June 2006.
Arrivals at Keflavik International Airport
411 thousand passengers arrived from abroad at Keflavik International Airport in January–June 2007 compared with 374 thousand in January–June 2006. This is a growth of 9.8%. The growth in recent twelve months is 11.9%.
19.3% decrease in new car registrations in June
Decrease in fish catch
Deficit in external trade in May
Deficit in external trade in June
9.8% growth in arrivals at Keflavik International Airport
in January–June

3
Short term indicators in July 2007
Annual Quarterly Consumer Harmonised GPD growth GPD pice index of Harmonised Fish from same growth Consumer index less consumer index of Building catch, Aluminium quarter of from prev. index housing prices, consumer cost volume poduction prev. year quarter s.a. price cost Iceland prices, EEA index index tonnes 2005 7.2 . 244.1 229.6 100.0 100.0 314.4 96.4 274,6962006 2.6 . 260.6 240.7 104.6 102.2 341.3 91.9 326,090 Jul. 2005 . . 242.7 227.9 99.4 100.0 312.9 72.3 23,320Aug. 2005 9.9 0.6 243.2 227.5 99.2 100.3 315.1 78.1 23,627Sep. 2005 . . 246.9 231.4 100.8 100.7 316.3 76.5 22,751Oct. 2005 . . 248.4 232.5 101.3 101.0 316.6 87.3 23,531Nov. 2005 5.2 -0.2 248.0 231.5 100.9 100.8 316.6 99.2 22,219Dec. 2005 . . 248.9 232.0 101.1 101.0 316.7 76.2 22,993Jan. 2006 . . 249.7 231.5 101.0 100.6 325.2 62.7 23,146Feb. 2006 5.1 1.5 249.5 230.9 100.8 100.9 325.3 120.5 20,628Mar. 2006 . . 252.3 233.6 101.9 101.4 325.9 123.3 25,010Apr. 2006 . . 255.2 236.1 102.7 102.1 329.4 87.5 26,790May 2006 2.6 0.5 258.9 239.6 103.9 102.4 334.9 121.4 28,975Jun. 2006 . . 261.9 242.0 105.3 102.5 335.8 85.7 26,928Jul. 2006 . . 263.1 243.0 105.7 102.4 349.7 81.2 24,004Aug. 2006 0.5 -0.7 264.0 243.7 106.2 102.5 351.4 80.0 26,046Sep. 2006 . . 265.6 245.2 107.0 102.6 352.3 84.4 29,804Oct. 2006 . . 266.2 245.6 107.1 102.8 354.4 86.9 32,531Nov. 2006 2.5 1.2 266.1 245.0 107.1 102.8 355.2 90.6 30,439Dec. 2006 . . 266.2 245.0 107.1 103.2 356.3 78.4 31,789Jan. 2007 . . 266.9 245.3 107.4 102.8 364.5 69.0 32,591Feb. 2007 -0.1 -0.9 268.0 245.3 107.5 103.1 368.2 114.2 29,898Mar. 2007 . . 267.1 243.2 106.8 103.7 369.0 112.6 35,031Apr. 2007 . . 268.7 243.7 107.1 104.3 370.3 96.3 33,631May 2007 ... ... 271.0 245.7 108.1 104.6 370.2 108.0 36,562Jun. 2007 . . 272.4 246.2 ... ... 370.9 ... ...
-2
1
4
7
10
13
16
J M M J S N J M M J S N J M
From same quarter of prev. yearQuarterly growth seasonally adjusted
2005 2006
GDP growth rate, %
0
20
40
60
80
100
120
140
J M M J S N J M M J S N J M M
Fish catch - volume index
2005 2006 2007
90
95
100
105
110
J M M J S N J M M J S N J M M
Iceland EEA
Harmonised index of consumer prices
2005 2006 2007
210
220
230
240
250
260
270
280
J M M J S N J M M J S N J M M
Total Less housing cost
Consumer price index
2006 20072005

4
Short term indicators in July 2007
Milk production and sales in thousand litres Sale of meat in tonnes Electricity cons. Gwh Milk Milk Milk processing Power received sales converted by intensive General by dairies from dairies protein content Lamb Beef Pork Poultry industry use 2005 109,446 41,974 69,805 7,358 3,574 5,300 6,009 5,191.2 3,159.62006 116,389 42,153 70,613 6,984 3,164 5,772 6,581 6,265.3 3,390.9 May 2005 10,449 3,502 6,206 610 319 476 524 438.3 249.6Jun. 2005 9,902 3,455 6,095 541 291 426 555 428.9 221.5Jul. 2005 8,957 3,453 6,021 643 244 443 454 440.9 208.0Aug. 2005 8,894 3,571 6,290 542 289 506 524 438.3 221.5Sep. 2005 7,849 3,674 5,788 445 344 435 551 426.3 243.6Oct. 2005 7,849 3,435 5,435 1,053 330 428 514 445.5 281.8Nov. 2005 8,225 3,527 5,843 776 328 481 536 413.4 298.7Dec. 2005 8,977 3,498 5,496 603 233 455 423 432.9 325.5Jan. 2006 9,617 3,521 5,689 773 220 445 522 443.8 314.9Feb. 2006 9,081 3,241 5,508 509 211 431 459 409.4 289.0Mar. 2006 10,297 3,741 6,148 556 262 432 584 510.5 321.5Apr. 2006 9,786 3,256 5,248 551 233 400 478 506.7 272.4May 2006 11,369 3,654 6,445 533 261 539 601 553.0 272.4Jun. 2006 9,717 3,553 6,116 509 292 477 500 493.8 238.1Jul. 2006 9,874 3,336 5,833 534 224 487 494 475.2 234.0Aug. 2006 9,819 3,631 6,596 537 277 527 568 545.9 240.2Sep. 2006 8,778 3,620 5,666 643 270 494 569 567.5 254.5Oct. 2006 9,159 3,638 6,118 731 316 550 579 592.3 292.7Nov. 2006 9,050 3,562 6,031 583 380 495 649 571.4 321.5Dec. 2006 9,842 3,400 5,216 524 217 495 579 595.9 339.4Jan. 2007 10,490 3,672 5,955 481 304 536 612 602.6 345.1Feb. 2007 9,839 3,266 5,358 791 284 477 550 555.2 313.9Mar. 2007 11,082 3,713 6,319 491 254 497 694 620.4 329.8Apr. 2007 10,891 3,382 5,507 635 256 445 593 ... ...May 2007 11,751 3,614 6,601 643 286 504 683 ... ...
3,000
4,000
5,000
6,000
7,000
J M M J S N J M M J S N J M M
Milk Processed milk
Milk sales - thousand litres
2006 20072005
0
100
200
300
400
500
600
700
J M M J S N J M M J S N J M
Power intensive industry General use
Electricity consumption - Gwh
2005 2006 2007
100
300
500
700
900
1,100
J M M J S N J M M J S N J M M
Lamb meat Beef meat
Sale of lamb and beef meat - tonnes
2005 2006 2007
100
300
500
700
900
J M M J S N J M M J S N J M M
Pork meat Poultry meat
Sale of pork and poultry meat - tonnes
2005 2006 2007

5
Short term indicators in July 2007
Import of fuel in tonnes Market prices of housing - index Public Cement housing Multi-flat Single-flat All types, All types, sales fund loans, houses, houses, outside whole Petrol Gas oils Fuel oils Jet fuel index number cap. region cap. region cap. region country 2005 163,308 418,195 62,897 139,357 236.3 2,041 189.1 210.6 156.5 183.82006 165,290 385,994 71,658 166,525 281.6 1,284 218.2 252.3 185.9 214.7 Jun. 2005 13,183 37,080 0 12,001 283.7 180 191.1 213.7 154.8 185.0Jul. 2005 10,556 64,366 1 13,457 263.1 199 196.0 220.8 153.0 188.5Aug. 2005 12,466 31,446 6,426 752 262.4 152 200.3 225.0 157.7 192.9Sep. 2005 25,114 65,783 11,763 30,387 307.0 166 202.3 229.1 161.0 195.5Oct. 2005 5,631 0 0 11,550 270.1 164 204.1 234.0 165.6 198.4Nov. 2005 20,740 66,903 8,874 11,791 239.8 176 205.3 234.5 171.2 200.6Dec. 2005 2,301 1,383 1 0 208.5 113 206.4 238.8 172.2 202.1Jan. 2006 19,498 38,930 4,679 15,434 213.1 84 210.6 238.3 177.2 205.9Feb. 2006 7,013 3,849 1 0 229.9 106 212.8 241.4 174.9 207.1Mar. 2006 25,624 56,581 16,185 24,681 257.0 141 214.2 242.4 179.4 209.2Apr. 2006 0 0 2,056 0 203.5 85 216.3 249.6 181.1 212.2May 2006 7,484 23,562 10,350 5,610 321.9 144 217.6 254.6 188.1 215.3Jun. 2006 20,383 47,333 10,072 19,692 340.0 145 219.2 255.5 189.9 216.7Jul. 2006 23,507 51,253 1,997 29,009 350.9 124 220.5 261.1 192.1 219.0Aug. 2006 5,434 17,225 4,783 3,318 347.3 89 220.5 258.6 189.7 217.9Sep. 2006 24,657 60,056 8,519 28,941 334.6 61 220.3 258.0 191.0 218.0Oct. 2006 2,236 18,556 2,897 2,969 321.8 112 222.5 257.8 186.4 218.2Nov. 2006 26,010 52,511 10,120 30,300 272.8 113 221.9 258.0 189.6 218.5Dec. 2006 3,444 16,138 0 6,570 186.3 80 222.3 252.6 190.2 217.9Jan. 2007 17,990 36,673 14,044 19,726 178.9 98 219.9 251.7 190.3 216.3Feb. 2007 5,455 17,019 1 2,358 216.6 90 222.1 255.7 196.6 219.8Mar. 2007 18,926 44,665 15,048 12,597 298.0 139 224.7 257.6 197.8 222.0Apr. 2007 5,736 10,319 2,052 21,173 263.6 100 228.9 263.0 205.9 227.2May 2007 18,568 38,595 15,227 0 360.3 118 231.6 265.4 206.2 229.2Jun. 2007 ... ... ... ... ... ... 235.9 271.4 208.5 233.3
0
5,000
10,000
15,000
20,000
25,000
30,000
J M M J S N J M M J S N J M M
Import of petrol - tonnes
2005 2006 2007
04080
120160200240280320360400
J M M J S N J M M J S N J M M
Cement sales - volume index
2005 2006 2007
100120140160180200220240260280
J M M J S N J M M J S N J M M
Multi-flat houses Single-flat houses
Market prices of housing in the capital region - index
2005 2006 2007
100
120
140
160
180
200
220
240
J M M J S N J M M J S N J M M
Outside capital region Whole country
Market prices of housing - index
2005 2006 2007

6
Short term indicators in July 2007
Credit and debit card usage in million ISK Number of Number of Domestic Credit card Debit card Foreign credit Number Import of passengers overnight credit card usage usage card usage of new cars, cif, to Keflavík stays in usage abroad in retail in Iceland regist. cars million ISK airport hotels 2005 144,358 27,375 191,148 14,800 25,935 39,206 756,193 1,035,0852006 179,071 36,956 202,121 17,639 23,120 40,903 868,042 1,168,864 Jun. 2005 12,939 2,692 16,732 1,628 3,394 4,621 91,252 123,921Jul. 2005 11,824 2,425 16,230 2,385 2,519 3,385 111,749 158,012Aug. 2005 11,963 2,592 18,126 2,793 1,936 3,040 100,134 154,146Sep. 2005 13,213 2,019 16,016 1,727 2,006 3,117 65,180 93,929Oct. 2005 11,603 2,668 15,601 942 1,824 2,816 62,199 86,643Nov. 2005 11,556 2,714 15,394 767 1,983 3,073 50,738 57,449Dec. 2005 12,025 2,506 20,439 655 1,792 3,075 44,063 42,299Jan. 2006 17,361 1,862 14,991 718 2,027 3,084 38,258 40,382Feb. 2006 14,278 2,445 14,908 662 2,237 3,648 41,022 55,885Mar. 2006 12,908 2,583 17,459 814 2,879 5,075 53,592 73,678Apr. 2006 13,014 3,131 14,501 888 1,752 3,279 67,376 80,067May 2006 15,044 3,113 18,271 1,354 2,369 3,719 69,676 101,453Jun. 2006 15,708 3,613 17,963 1,935 3,220 5,720 104,267 132,790Jul. 2006 14,693 3,352 17,026 3,014 1,793 3,060 123,982 177,833Aug. 2006 14,938 3,289 18,111 3,273 1,498 2,553 115,085 163,795Sep. 2006 16,209 3,192 15,989 1,942 1,528 2,655 72,650 116,116Oct. 2006 14,407 3,307 16,735 1,261 1,390 2,340 72,202 97,900Nov. 2006 14,998 3,669 15,949 959 1,395 3,130 59,823 72,432Dec. 2006 15,512 3,401 20,216 820 1,032 2,641 50,109 53,622Jan. 2007 19,987 2,391 16,198 920 1,310 2,380 44,161 50,806Feb. 2007 17,050 2,920 15,060 1,097 1,326 2,699 46,151 64,926Mar. 2007 15,345 2,970 16,168 934 1,619 3,161 59,144 87,534Apr. 2007 16,398 3,504 16,376 1,094 1,532 2,911 72,512 89,890May 2007 16,742 3,209 13,490 1,303 2,544 4,385 78,369 ...Jun. 2007 ... ... ... ... 3,030 ... 110,588 ...
7,000
11,000
15,000
19,000
J M M J S N J M M J S N J M M
Domestic credit card usage - million ISK
2005 2006 2007
7,000
11,000
15,000
19,000
J M M J S N J M M J S N J M M
Domestic debit card usage - million ISK
2005 2006 2007
0500
1,0001,5002,0002,5003,0003,5004,000
J M M J S N J M M J S N J M M
Number of new registered cars
2006 20072005
0
20,000
40,000
60,000
80,000
100,000
120,000
140,000
J M M J S N J M M J S N J M M
Number of passengers to Keflavík airport
2005 2006 2007

7
Short term indicators in July 2007
Turnover by industry, based on VAT records, in million ISK Retail trade and Hotels and Communi- Other services Manufacturing Construction motor vehicles restaurants Transport cation NACE 71-74 NACE 15-37 NACE 45 NACE 50 & 52 NACE 55 NACE 60-63 NACE 64 & 90-93 2005 387,865 153,408 310,866 36,586 139,495 30,873 152,7582006 446,445 222,755 347,320 43,463 139,486 34,540 190,738 Jan–Feb 2003 45,845 9,828 33,279 3,186 14,221 3,704 14,538Mar–Apr 2003 52,886 12,010 36,534 3,949 14,449 3,990 16,359May–Jun 2003 54,052 16,601 41,519 5,386 20,704 4,436 17,378Jul–Aug 2003 50,299 17,088 43,441 7,209 19,440 4,380 16,632Sep–Oct 2003 55,009 19,141 40,355 4,815 17,869 4,358 17,183Nov–Dec 2003 54,373 18,249 45,664 4,438 15,305 4,644 21,234Jan–Feb 2004 46,553 12,738 36,250 3,599 15,087 4,210 16,701Mar–Apr 2004 60,094 15,164 41,574 4,419 18,301 4,454 19,370May–Jun 2004 60,382 19,829 46,990 5,886 21,260 4,966 20,048Jul–Aug 2004 54,031 21,012 46,898 8,073 26,058 4,652 19,664Sep–Oct 2004 59,743 21,672 45,188 5,356 22,794 4,709 21,746Nov–Dec 2004 61,914 25,993 53,782 4,883 19,766 4,939 27,866Jan–Feb 2005 49,519 15,891 41,484 3,944 17,338 4,496 19,739Mar–Apr 2005 60,630 21,324 47,240 4,993 20,765 5,195 24,028May–Jun 2005 64,966 25,706 55,608 6,760 25,390 5,316 26,268Jul–Aug 2005 62,332 26,846 53,387 8,951 28,122 5,060 25,374Sep–Oct 2005 69,493 29,520 52,256 6,144 25,494 5,477 26,504Nov-Des 2005 80,925 34,121 60,891 5,794 22,386 5,329 30,845Jan–Feb 2006 53,161 22,875 47,624 4,670 19,040 5,382 24,158Mar–Apr 2006 74,127 30,302 55,051 6,083 23,242 5,663 27,802May–Jun 2006 83,106 40,105 63,090 8,069 26,687 6,032 30,402Jul–Aug 2006 84,989 39,984 59,507 10,391 26,391 5,614 32,364Sep–Oct 2006 74,783 45,259 56,430 7,467 23,109 5,781 36,722Nov–Dec 2006 76,330 43,631 65,602 6,783 21,017 6,068 39,297Jan–Feb 2007 68,274 30,033 50,469 5,269 17,783 5,725 30,920
0
10,000
20,000
30,000
40,000
50,000
J-F M-J S-O J-F M-J S-O J-F
Turnover - construction NACE 45
2005 2006 2007
0
10,000
20,000
30,000
40,000
50,000
60,000
70,000
J-F M-J S-O J-F M-J S-O J-F
Turnover - retail tr. & sale of motor veh. NACE 50 & 52
2005 2006 2007
0
1,000
2,000
3,000
4,000
5,000
6,000
7,000
J-F M-J S-O J-F M-J S-O J-F
Turnover - communication NACE 64
2005 2006 2007
05,000
10,00015,00020,00025,00030,00035,00040,00045,000
J-F M-J S-O J-F M-J S-O J-F
Turnover - other services NACE 71-74 & 90-93
2005 2006 2007

8
Short term indicators in July 2007
External trade, fob, in million ISK Price index Prices of Export Import Import of Import of of marine aluminium Oil price Balance of goods of goods consumer industrial products (LME) (UK Brent 38) of trade total total durables supplies ISK USD/tonnes USD/barrel 2005 -94,540 194,355 288,895 13,586 107,901 138.6 1,896.1 54.62006 -148,610 242,740 391,350 16,019 146,372 166.7 2,594.3 65.0 Jul. 2005 -10,013 13,915 23,927 982 10,309 138.0 1,778.0 57.7Aug. 2005 -12,973 14,395 27,368 1,052 9,426 140.1 1,889.0 64.3Sep. 2005 -10,362 16,911 27,273 1,152 12,460 140.5 1,854.0 62.7Oct. 2005 -5,544 16,041 21,585 1,184 6,803 136.9 1,932.0 58.3Nov. 2005 -11,007 16,747 27,754 1,441 11,727 137.7 2,038.0 55.0Dec. 2005 -9,381 13,690 23,070 1,337 6,922 141.1 2,236.0 56.6Jan. 2006 -8,401 17,051 25,452 854 10,739 140.9 2,391.0 62.9Feb. 2006 -7,766 14,661 22,427 1,106 7,644 142.0 2,481.0 59.7Mar. 2006 -16,137 19,915 36,052 1,529 13,300 152.3 2,458.0 61.6Apr. 2006 -10,801 19,081 29,882 1,195 9,847 164.0 2,643.0 70.8May 2006 -13,740 23,938 37,678 1,607 13,957 164.4 2,881.0 69.4Jun. 2006 -15,358 26,439 41,797 1,386 14,533 173.8 2,520.0 68.2Jul. 2006 -18,616 19,378 37,994 1,278 14,679 177.9 2,556.0 73.5Aug. 2006 -14,430 16,596 31,025 1,315 11,455 173.7 2,508.0 73.2Sept. 2006 -7,388 25,358 32,746 1,254 14,914 176.8 2,518.0 61.2Oct. 2006 -9,105 19,998 29,104 1,296 9,993 174.0 2,662.0 57.3Nov. 2006 -15,856 20,189 36,045 1,658 14,217 179.6 2,714.0 58.4Dec. 2006 -20,863 20,136 41,000 1,540 11,093 180.5 2,799.0 63.4Jan. 2007 446 25,860 25,414 1,267 10,308 181.2 2,721.0 53.8Feb. 2007 -5,007 23,930 28,937 1,322 13,185 174.8 2,759.0 57.6Mar. 2007 -4,503 29,482 33,984 1,554 13,978 174.3 2,758.0 62.5Apr. 2007 -11,310 18,956 30,266 1,427 12,631 175.0 2,844.0 67.7May 2007 -10,665 20,503 31,169 1,596 12,432 167.6 2,825.0 67.5Jul. 2007 -9,6001 20,1001 29,7001 ... ... … 2,700.0 71.7¹ Preliminary figures.
-20,000
-16,000
-12,000
-8,000
-4,000
0
J M M J S N J M M J S N J M M
Balance of trade - million ISK
2005 2006 2007
0200400600800
1,0001,2001,4001,6001,800
J M M J S N J M M J S N J M M
Import - consumer durables, fob, million ISK
2005 2006 2007
100
120
140
160
180
200
J M M J S N J M M J S N J M M
Price index of marine products - ISK
2005 2006 2007
1,000
1,400
1,800
2,200
2,600
3,000
J M M J S N J M M J S N J M M
Prices of aluminium (LME) - USD/tonnes
2006 20072005
9
Short term indicators in July 2007
Quarterly average (from 2003) Real Labour force Unemploy- Number of Central government finance, million ISK
Wage wages, participation ment employed Total Total Revenueindex index % % persons revenue expenditure balance
2005 267.2 112.3 81.9 2.6 161,300 336,937 308,383 28,5542006 292.7 115.2 83.1 2.9 169,600 381,336 314,716 66,620 May 2005 265.9 112.9 83.5 3.0 163,800 22,255 23,588 -1,333Jun. 2005 267.0 112.9 . . . 28,984 25,097 3,887Jul. 2005 268.0 113.2 . . . 19,545 29,098 -9,553Aug. 2005 268.9 112.6 83.1 1.8 164,000 34,209 22,802 11,407Sep. 2005 269.8 111.8 . . . 23,732 29,809 -6,077Oct. 2005 270.6 111.8 . . . 31,265 22,989 8,276Nov. 2005 272.3 112.4 81.7 2.7 161,500 24,148 23,275 873Dec. 2005 273.9 112.7 . . . 38,498 28,523 9,975Jan. 2006 282.8 116.2 . . . 41,132 25,508 15,624Feb. 2006 284.4 116.3 81.1 2.4 163,500 31,112 24,459 6,653Mar. 2006 285.4 115.4 . . . 27,463 24,404 3,059Apr. 2006 286.4 114.3 . . . 24,891 26,087 -1,196May 2006 289.1 113.9 85.1 4.0 171,600 30,467 25,713 4,754Jun. 2006 290.4 113.5 . . . 27,761 26,989 772Jul. 2006 295.4 115.0 . . . 32,683 25,097 7,586Aug. 2006 297.4 115.2 84.2 2.6 173,300 30,600 31,471 -871Sep. 2006 298.9 115.3 . . . 31,137 23,904 7,233Oct. 2006 300.4 115.8 . . . 31,108 25,192 5,916Nov. 2006 301.0 116.0 82.1 2.5 169,900 30,153 26,085 4,068Dec. 2006 300.8 115.8 . . . 42,829 29,807 13,022Jan. 2007 311.5 119.5 . . . 51,786 28,206 23,580Feb. 2007 312.3 119.7 82.2 2.0 172,800 35,811 28,689 7,122Mar. 2007 313.2 119.9 . . . 31,604 27,794 3,810Apr. 2007 314.6 119.6 . . . 29,703 29,163 540May 2007 316.9 119.5 ... ... ... ... ... ...
250
260
270
280
290
300
310
320
J M M J S N J M M J S N J M M
Wage index
2005 2006 2007
100
105
110
115
120
125
130
J M M J S N J M M J S N J M M
Real wages - index
2005 2006 2007
0
5,000
10,000
15,000
20,000
25,000
30,000
35,000
J M M J S N J M M J S N J M
Central government, total revenue - million ISK
2005 2006 2007
-15,000-10,000
-5,0000
5,00010,00015,00020,00025,000
J M M J S N J M M J S N J M
Central government, revenue balance - million ISK
2005
Excl. sale of Iceland Telecom in Sep tember 2005
2006 2007

10
Explanatory notes and references
References are quoted for data originating outside Statistics Iceland. GDP growth rate, %. Change in the volume of gross domestic product each quarter as compared with the same quarter of the previous year. Seasonally adjusted growth rate is also presented, showing quarterly growth on previous quarter. Consumer price index and Consumer price index less housing cost. May 1988=100. Compiled at the beginning of each month. Yearly averages are converted by middle month indices. Harmonized index of consumer prices. 2005=100. The harmonized index of consumer prices (HICP) is compiled for all EEA-member states. It differs in scope from the Icelandic CPI. The main difference is that imputed rent for owner occupied housing is included in the Icelandic CPI but not in the HICP. On the other hand, expenditure of foreign visitors in Iceland and expenditure of people living in hospitals and similar institutions are included in the HICP but not in the Icelandic CPI. Building cost index. June 1987=100. The index is compiled at the middle of each month. Fish catch, volume index. The volume index is an annual chain-linked index, having the monthly average of 2004 as a reference period. The base year each time is T-2. Aluminium production, tonnes. Source: Producers. Milk received by dairies. Thousand litres. Milk from farmers received by dairies. Source: Icelandic Dairy Association. Milk sales from dairies. Thousand litres. Sale of milk, cream, skimmed milk and other liquid milk products. Source: Icelandic Dairy Association. Milk processing converted by protein content. Processed milk products other than milk, cream, skimmed milk and other liquid milk products converted into thousand litres on the basis of protein content. Source: Icelandic Dairy Association. Sale of meat in tonnes. Lamb, beef, pork, poultry. Includes sales of domestic produce but not imported meat nor game. Source: Association of Icelandic farmers. Electricity consumption. Gigawatt-hours. Divided into consumption by power-intensive industry which is defined as aluminium and ferrosilicon production. All other consumption is considered general use. Source: National Energy Authority. Import of fuel in tonnes. Petrol, gas oils, fuel oils and jet fuel derived from the external trade statistics. Cement sales. Index 1990=100. Sale of domestic and imported cement. Source: Producers and importers. Public housing fund loans. Number of loans to individuals for new construction, loans to entrepreneurs are excluded. Source: Housing Loan Fund. Market prices of housing. Indices, March 2000=100. The indices are sub items from the CPI based on housing sales contracts collected by the Land Registry of Iceland. Credit and debit card usage. Million Icelandic krónur (ISK). The figures show total household expenditure by credit and debit cards. Withdrawals at ATM´s and payments made in banks are not included. Sources: VISA Iceland and MasterCard. Number of new car registrations. Includes both new and used cars. Source: The Icelandic Federation for Motor Trades and Repairs.

11
Import of cars. Cif-value, million ISK. Number of passengers to Keflavík Airport. The total number of visitors, Icelandic and foreign, arriving by air at Keflavík international airport. Transit passengers are not included in these figures. Source: Civil Aviation Administration, Keflavík Airport. Number of overnight stays in hotels. Covers hotels that are operated throughout the year. Turnover by industry. Million ISK. The figures show total turnover according to VAT returns for every two VAT-accounting months. The turnover excludes VAT. Break-down by industry is based on the Statistics Iceland activity code, ÍSAT 95 which corresponds to NACE rev. 1. External trade. Fob-value in ISK. Price index of marine products. Based on unit prices of the main products according to data from producers, weighted by production or sales in the previous year. 1990=100. Prices of aluminium (LME). Average montly price of aluminium on the London Metal Exchange. Source: The National Power Company. Oil price (UK Brent 38). Average monthly price of a barrel of North-Sea oil. Source: Olíufélagið hf. Wage index. December 1988=100. Refers to average wages each month. Real wages. Index 2000=100. Refers to the change in the wage index deflated by the CPI converted to mid-month figures. Labour force participation, unemployment and number of employed persons. The figures show results from the labour force sample survey (LFS) of Statistics Iceland. From 2003 onwards, the LFS is continuous and renders quarterly results. Sample size is 4,000 persons each quarter. In the period 1991-2002 the LFS was carried out twice each year, in April and in November. Labour force participation: The total labour force (employed and unemployed) as a proportion of the total population 16-74 years of age. Unemployment: The number of unemployed as a proportion of the labour force. Number of employed persons: Total number of persons engaged in any kind of work for payment, including self-employed. Central government finance. Total revenue, total expenditure and revenue balance. Million ISK. Cash basis. Source: Government Accounting Office.

12
Hagtíðindi Short term indicators Statistical Series www.statice.is/series [email protected]
Vol. 92, No. 47 2007:7
ISSN 0019-1078 ISSN 1670-4819 (paper) ISSN 1670-4827 (pdf)
Price EUR 7 Subscription EUR 67
Supervision Vilhjálmur Bjarnason [email protected]
Telephone +(354) 528 1000 © Statistics Iceland Borgartúni 21a 150 Reykjavík Iceland
Fax +(354) 528 1099 Please quote the source.