20070910388 - defense technical information center engineering and management 21n, ... master of...
TRANSCRIPT
XIAI)ESI(N-BUILD VS DESIGN-BID-BUILD:A PROCUREMENT METHODSELECTION FRAMEWORK
By
Griffin K. StaufferLT, CEC. USN
DISTR~IBUTION STATEMENT AApproved far Public Release
Distribution Unlimited
AX(t jIJSI* 2006
200709103880N T UI * 0
& Purdue UniversityDivision of Construction
A Engineering and Management21N, ýSchool of Civil Engineering
West Lafayette, Indiana 47907-2051
DESIGN-BUILD VS DESIGN-BID-BUILD:A PROCUREMENT METHOD SELECTION FRAMEWORK
An Independent Research StudySubmitted to the Faculty
of
Purdue University
by
Griffin K. StaufferLT, CEC, USN
In Partial Fulfillment of the
Requirements for the Degree
of
Master of Science in Civil Engineering
August 2006
Approved:
Professor Luh-Mann Chang
!Pr-ofessor Thons Seager
Profe'ssor Phillip Dunston

ACKNOWLEDGEMENTS
I would like to thank those individuals who helped make this study successful.
Specifically, I would like to thank Professor Chang, whose previous work and insight
into this field lent significant guidance that proved invaluable, the U.S. Navy and Civil
Engineer Corps for giving me the opportunity to attend Purdue University, and LT Dude
Underwood for his insight, friendship, and camaraderie that made the experience
memorable. Finally, I would like to extend the most sincere thanks to my wife, Jessica,
whose patience, love, and support throughout my career has been unfailing, and to my
two year old daughter Sophia, whose hugs and words of "Daddy, you're going to school.
Ok, I love you, goodbye." brought a smile to my face every time.

iii
Table of Contents
PageLIST OF TABLES .......................................................................................................... vLIST OF FIGURES ....................................................................................................... viA B ST R A C T ...................................................................................................................... viiCHAPTER 1. INTRODUCTION ....................................................................................... I
1.1. Problem Statement .................................................................................................... 11.2. Objectives ............................................................................................................ 11.3. Organization .......................................................................................................... 31.4. Research Summary .............................................................................................. 3
CHAPTER 2. RESEARCH METHODOLOGY .......................................................... 42.1. Methodology ........................................................................................................ 42.2. Research Process ...................................................................................................... 5
CHAPTER 3. PROCUREMENT SELECTION PARAMETERS ................................ 93.1. Literature Review ................................................................................................ 93.2. Procurement Method Characteristics ................................................................. 123.3. Procurement M ethod Selection Research ........................................................... 13
CHAPTER 4. DATA COLLECTION ........................................................................... 164.1. Procurement Selection Criteria List Formulation ............................................... 164.2. Project Scoring and Expert Evaluation ................................................................ 18
CHAPTER 5. DATA ANALYSIS ............................................................................... 205.1. Criteria List Analysis .......................................................................................... 205.2. Utility Function Generation ................................................................................ 225.3. Project and Total Utility Value Generation ........................................................ 235.4. Purpose and Use of Threshold Value .................................................................. 255.5. Framework Recommendation and Actual Procurement Comparison ................ 265.6. Confounding Factors ......................................................................................... 28
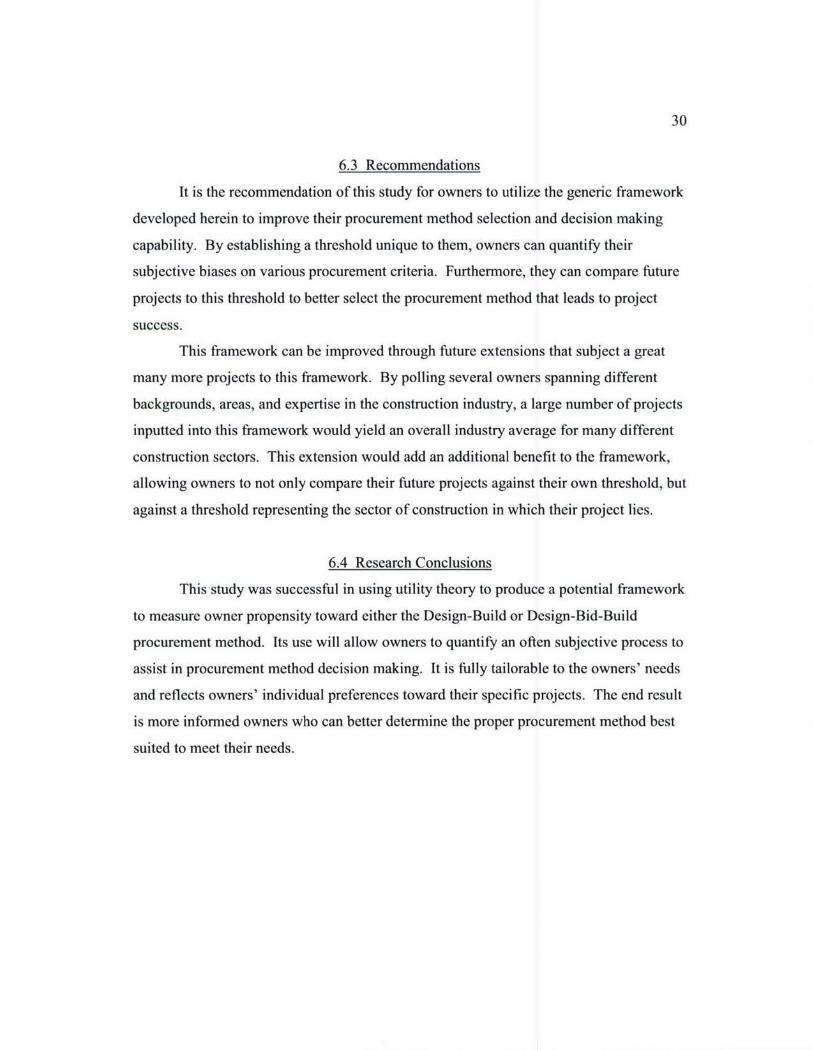
CHAPTER 6. RECOMMENDATIONS AND CONCLUSIONS ................................. 296.1. Results and Findings .......................................................................................... 296.2. Research Limitations ......................................................................................... 296.3. Recommendations .............................................................................................. 306.4. Research Conclusions .......................................................................................... 30
LIST OF REFERENCES .............................................................................................. 31Appendices
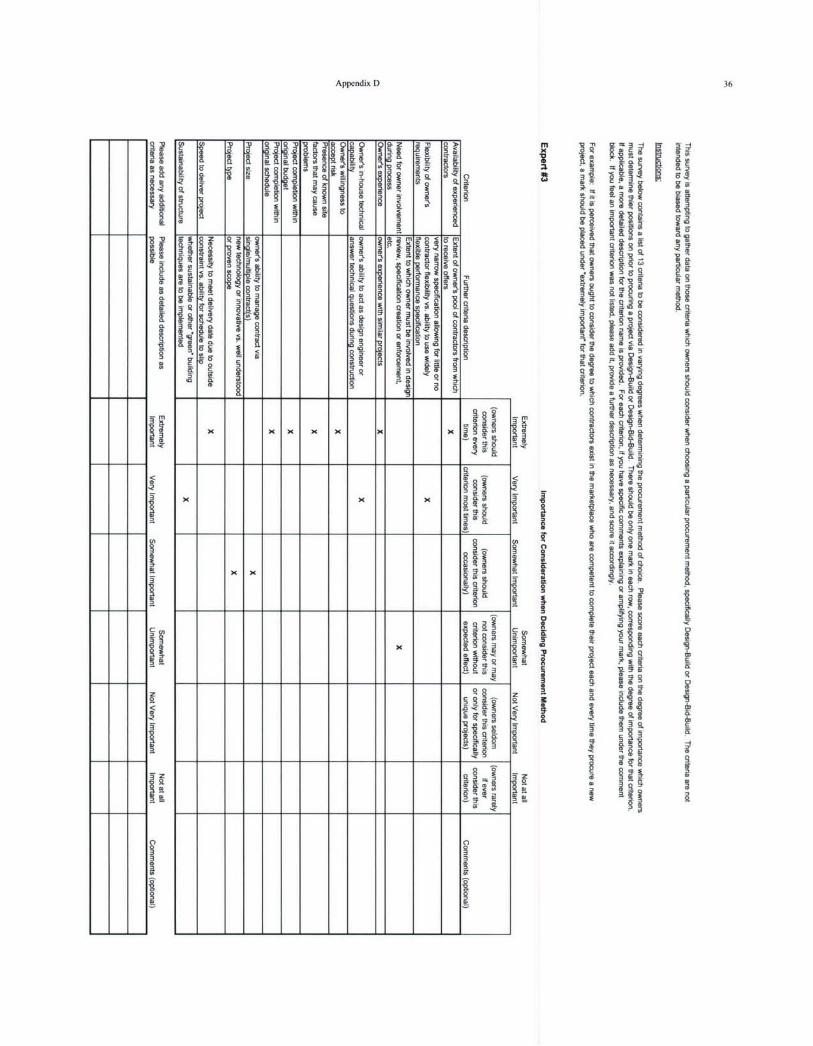
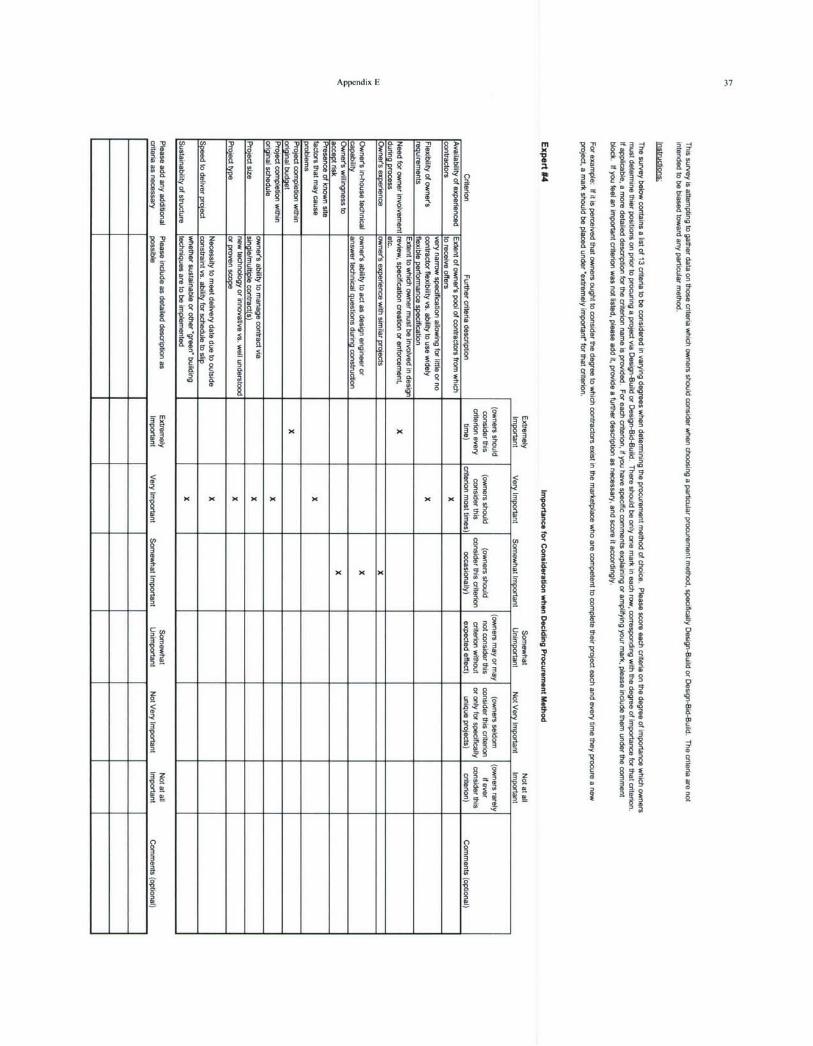
Appendix A: NAVFAC Organizational Breakdown ............................................... 33Appendix B: Expert #1 Criteria List Survey Results .............................................. 34Appendix C: Expert #2 Criteria List Survey Results .............................................. 35Appendix D: Expert #3 Criteria List Survey Results ............................................... 36Appendix E: Expert #4 Criteria List Survey Results ............................................... 37Appendix F: Expert #5 Criteria List Survey Results ............................................... 38

iv
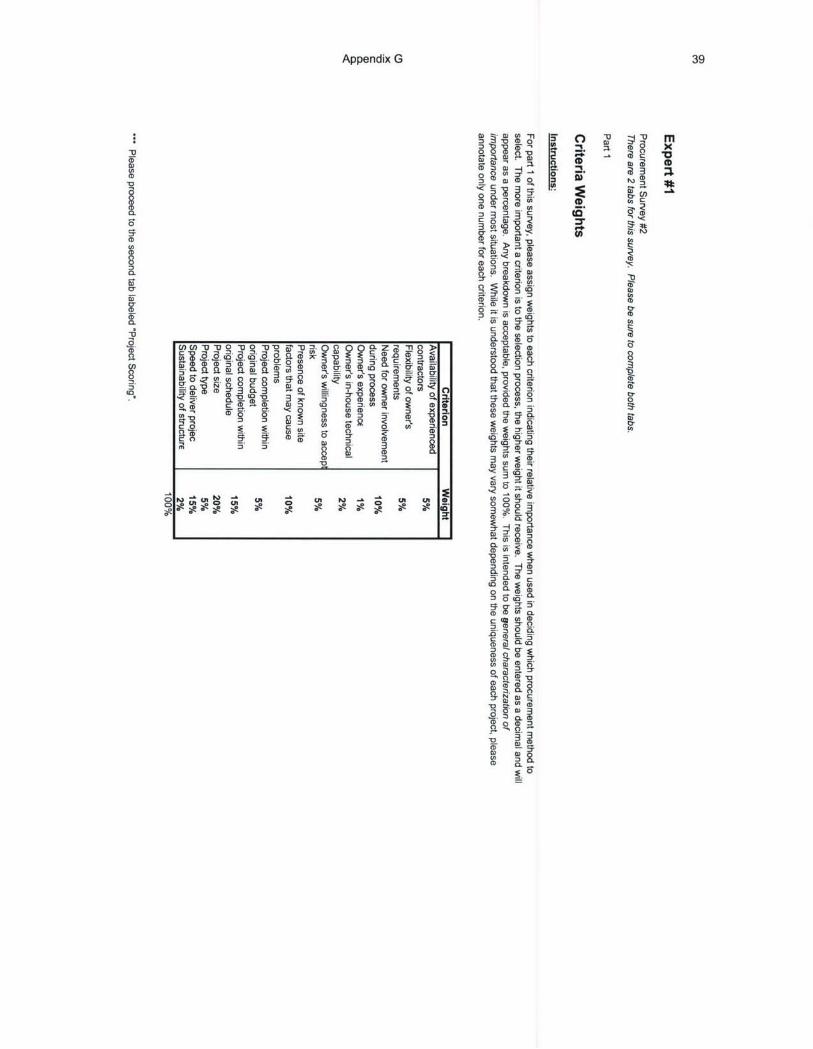
Appendix G: Expert #1 Criteria Weighting and Project Scoring Survey ................. 39Appendix H: Expert #2 Criteria Weighting and Project Scoring Survey ................. 44Appendix I: Expert #3 Criteria Weighting and Project Scoring Survey .................. 49Appendix J: Expert #4 Criteria Weighting and Project Scoring Survey .................. 54Appendix K: Expert #5 Criteria Weighting and Project Scoring Survey ................. 59Appendix L: Calculations and Raw Data ................................................................. 64
V
List of Tables
Table PageTable 2.1 Criteria Listing ................................................................................................. 6Table 3.1 Procurement Method Characteristics ............................................................. 13Table 4.1 Initial Criteria Listing W ith Descriptions ...................................................... 17Table 4.2 Criteria Listing Response Scale .................................................................... 18Table 4.3 Criteria List Expert Responses ...................................................................... 18Table 4.4 Expert Criteria Weights ................................................................................ 20Table 5.1 Sample Expert Scoring Input ...................................................................... 23
vi
List of Figures
Figure PageFigure 2.1 Criteria Listing Evolution and Project Scoring ............................................ 6Figure 2.2 Individual Criterion Utility Function ............................................................. 8Figure 3.1 Procurement Method Relationships ............................................................ 9Figure 3.2 Current DB Regulatory Environment .............................................................. 11Figure 3.3 Procurement Method Usage Trends ................................................................ 11Figure 4.1 Study Project Characteristics ....................................................................... 19Figure 5.1 t-value Equation .......................................................................................... 21Figure 5.2 Significant Mean Difference Equation ........................................................ 21Figure 5.3 Example Significant Mean Difference Calculation ..................................... 22Figure 5.4 Initial Criteria List Results ........................................................................ 22Figure 5.5 Sample Utility Function ............................................................................. 24Figure 5.6 Criteria Relative Weighting Results ........................................................... 25Figure 5.7 Utility Value Equation ................................................................................ 25Figure 5.8 Criterion U Value Sample Calculation ........................................................ 26Figure 5.9 Hierarchical Process Used To Reach Total Utility Value UT ......................... 26Figure 5.10 Actual vs. Recommended Procurement Method ....................................... 27
Vii
ABSTRACT
Stauffer, Griffin, K. MSCE, Purdue University, August, 2006.Design-Build vs. Design-Bid-Build: A Procurement Method Selection Framework.Major Professor: Luh-Mann Chang.
Proper procurement method selection is an integral part of project success. Better
informed owners are able to more successftilly select the project delivery systems that
best suit their needs. This study utilizes utility theory to construct a framework to assist
in the procurement decision making process. Through the use of expert weighting of
important procurement criteria, real world projects were used to develop an overall
threshold to which future owner's can compare their subsequent projects. This threshold,
which marks the boundary between Design-Build and Design-Bid-Build, can be used to
measure an owner's propensity to use either procurement method. It is fully tailorable to
any owner, as owner-specific inputs are used.
This ability for owners to objectify the largely subjective procurement decision
making process allows owners to create a predictable, measurable trend, thereby
improving their overall decision making ability.
CHAPTER 1. INTRODUCTION
1.1 Problem Statement
A reoccurring question facing owners is how to best meet their evolving needs.
When it comes to expanding mission or capacity, those needs are often met through the
construction of a new facility. One important driving factor contributing to the success of
the new facility is the procurement method used to deliver the facility to the owner. The
two most prevalent procurement methods, Design-Build (DB) and Design-Bid-Build
(DBB), are well known. Less available, however, are tailorable tools or guidelines that
illustrate or suggest when a particular procurement method is superior. It is perceived
that more research is needed to develop a useful tool to assist in procurement method
decision making.
1.2 Objectives
Procurement method selection is directly linked to owners' project goals,
preferences, and unique circumstances surrounding their specific projects [1]. The goal
of this research is to explore a generic framework to assist owners in determining which
procurement method, specifically Design-Build or Design-Bid-Build, would be most
beneficial to meeting their unique needs.
Several factors play a role in the level of success of a construction project.
Different procurement methods each possess unique characteristics, emphasize different
focus areas, and have inherent strengths and weaknesses [2]. Owners' failure to identify
or understand these characteristics place them in a precarious position when committing
funds to a project. At best, they run the risk of not giving themselves the fullest possible
chance to fulfill their expectations, and at worst, may position themselves where different

2aspects of the project and/or project team goals are in direct competition, possibly
resulting in project failure [5,16].
In an attempt to improve the owner's ability to make informed procurement
method decisions, it is hypothesized that by following the procurement selection
framework constructed herein to determine the procurement method best suited to a
particular owner's needs, an owner's requirements will be better satisfied than if an
alternate method is used. The model incorporates several expert opinions and transforms
them into a singular recommendation through the use of utility theory. This compilation
of expert input into the framework of procurement method decision making delivers
proven expertise into the hands of the owner.
The supporting evidence behind the procurement selection model rests largely on
expert input throughout the entire process. As outlined by Love et al., given the high
variability of application across numerous projects, objective measures cannot be used to
obtain procurement method selection criteria [3,5]. Therefore, actual project data will be
used to validate the model, and experts will evaluate the actual degree to which their
expectations and needs were met [3]. Similarly, expert surveys have proven highly
useful in determining construction industry performance and productivity trends [4].
Results of this study are generic and can be adapted to other owners utilizing
construction as a means to meet their expanding needs. This study utilized U.S. Navy
data to exemplify the model. For the U.S. Navy, making better procurement selection
decisions carries with it a substantial monetary savings. Since the Navy's construction
organization, the U. S. Naval Facilities Engineering Command (NAVFAC), is a global
entity performing over $10 billion in business annually, even slight improvement in
selecting how to procure facilities to meet its needs can translate into significant savings.
In short, this framework can help to further the Navy's goal of establishing "best
practices" for the government as well as being fully adaptable to any owner desiring
improved procurement method decision making.
Additionally, the need for the U.S. Navy to strive for the best value in
procurement goes beyond simple economics and improved profitability. Though
profitability might be the case in the civilian sector, the requirement for a government to
3best utilize its taxpayer's dollars adds an important social context to the equation. The
socio-political impacts of proper public funds expenditures can be significant and should
in no case be overlooked. Proper spending in the form of best value projects resulting
from proper procurement is a guiding principle that the government must adhere to, as it
will certainly be judged by it.
1.3 Organization
This report outlines the methodology and process used in reaching an overall
procurement method threshold between DB and DBB. It presents a literature background
and discusses the different characteristics of each procurement method. It also offers a
synopsis of previous work performed in this field and its influence on this report. The
data collected from the experts is presented and subsequently analyzed; examples are
provided to demonstrate the various formulas used in the calculation of each step.
Finally, overall findings are presented and discussed, along with recommendations,
possible future extensions of this work, and overall conclusions.
1.4 Research Summary
Through expert input on important procurement method selection criteria and
application to real-world projects, this research demonstrates a framework that assists in
improving future procurement method decision making. Utility functions synthesized the
raw data to yield repeatable, predictable results and the formulation of an overall
threshold. Owners are able to apply their future projects to this framework in a unique
comparison of their current situation to the reference data. It is expected that those
projects scoring above the threshold lend themselves to being more successful if procured
as DB. Similarly, projects scoring below the model's threshold are expected to be better
suited to be delivered via DBB means.

4
CHAPTER 2. RESEARCH METHODOLOGY
2.1 Methodology
The crux of the model lies in the selection and prioritization of certain
procurement selection criteria to consider when choosing a procurement method. Owners
must determine their position on each of these criteria prior to making a procurement
method selection. Examples of these criteria include sustainability and speed required to
deliver a facility.
An initial list of criteria was developed through literature review and content
analysis. Experts were asked to evaluate the criteria on their level of importance for
consideration prior to deciding on a particular procurement method. If experts felt there
was an important criterion absent from the list provided to them, they were asked to add
it and score it accordingly. Next, the list was streamlined to include only those criteria
that the group of experts collectively graded as the most important. Third, the experts
were asked to assign relative weights to the criteria, evaluate their positions on real-world
projects relative to each criterion, rate their overall level of satisfaction with the project,
and offer any confounding factors present. Finally, utility theory was used to convert the
experts' marks into overall criterion scores. Utility theory was further utilized to compile
these overall criterion scores together with their corresponding expert assigned weights
into an overall threshold. This threshold, or total utility value, indicates the framework's
recommendations of either DB or DBB to increase owner satisfaction.
This method allowed this independent research study to establish a reference to
which future projects can be compared based upon how experts score individual
procurement performance criteria. This can be extremely versatile and useful in future
5
projects as a way to evaluate an owner's specific project situation.
The independent variable used in this report was the individual project's score for
each criterion. This scoring of specific performance criteria reflected the unique result of
the expert's situation prior to the procurement of the project. This score proved a solid
independent variable on which to determine relative dependent variable performance.
The overall threshold, or dependant variable, is a product of a utility function and
consequently serves as the reference to which an owner can compare future projects.
As with any study, the model offered herein cannot completely capture all
possible variables contributing to each project's outcome. While procurement method
selection plays a prominent role in determining project success, other confounding factors
may be present that contribute (either positively or negatively) to the results suggested by
procurement method selection alone.
Possible confounding factors may include poor contractor performance, unilateral
funding reduction on the part of the owner, or other unforeseen circumstances. Any
confounding factors encountered on a project will be noted by the experts. This will be
accomplished by asking the experts in addition to scoring each project, to annotate if
there were specific situations that affected project performance external to the
procurement criteria in question.
2.2 Research Process
Literature review, expert input, and personal experience contributed to the
creation of an initial procurement method performance criteria listing [5]. This list
contained the top 13 criterion thought to matter most in determining which procurement
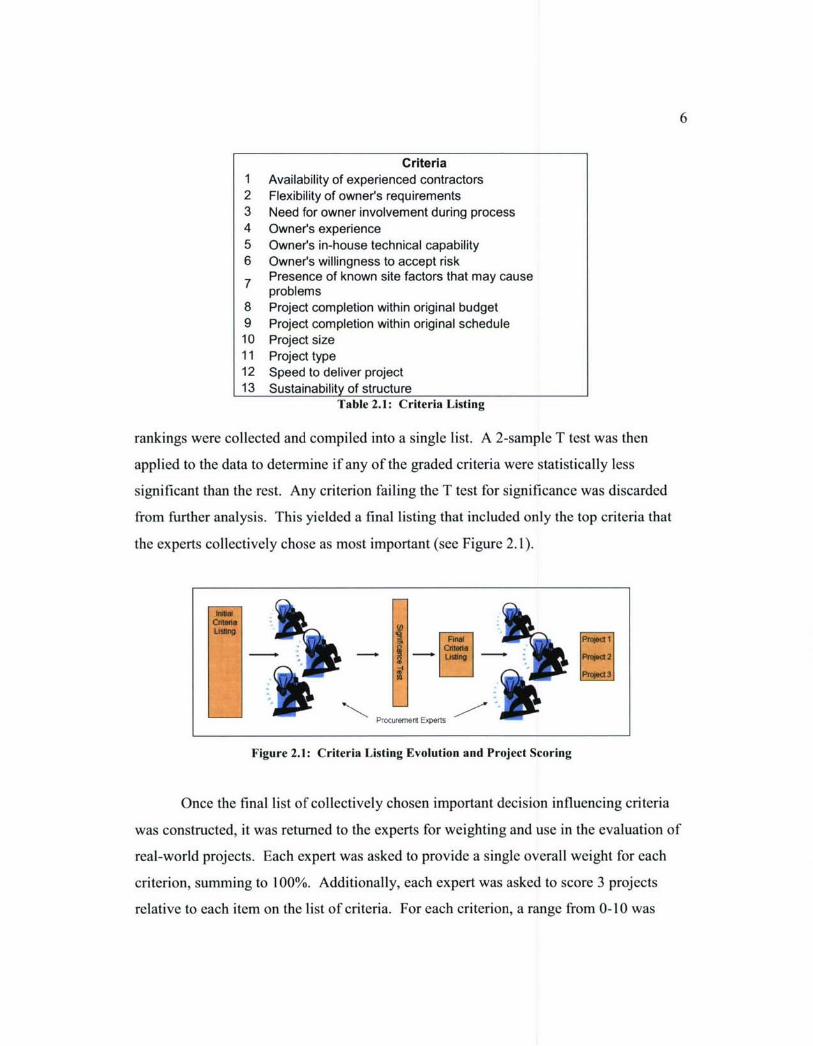
method will best meet an owner's needs (see Table 2.1). In short, these criteria were
thought to be the top parameters on which owners must define their position when going
through the procurement method selection process.
Once an initial criteria list was built, that list was sent to 5 experts on facility
management and source selection. The experts were asked to use their professional
judgment to independently rank which of the criteria they felt was most important to
consider when making a procurement method selection. The results of the expert's
6
Criteria1 Availability of experienced contractors2 Flexibility of owner's requirements3 Need for owner involvement during process4 Owner's experience5 Owner's in-house technical capability6 Owner's willingness to accept risk
Presence of known site factors that may causeproblems
8 Project completion within original budget9 Project completion within original schedule10 Project size11 Project type12 Speed to deliver project13 Sustainability of structure
Table 2.1: Criteria Listing
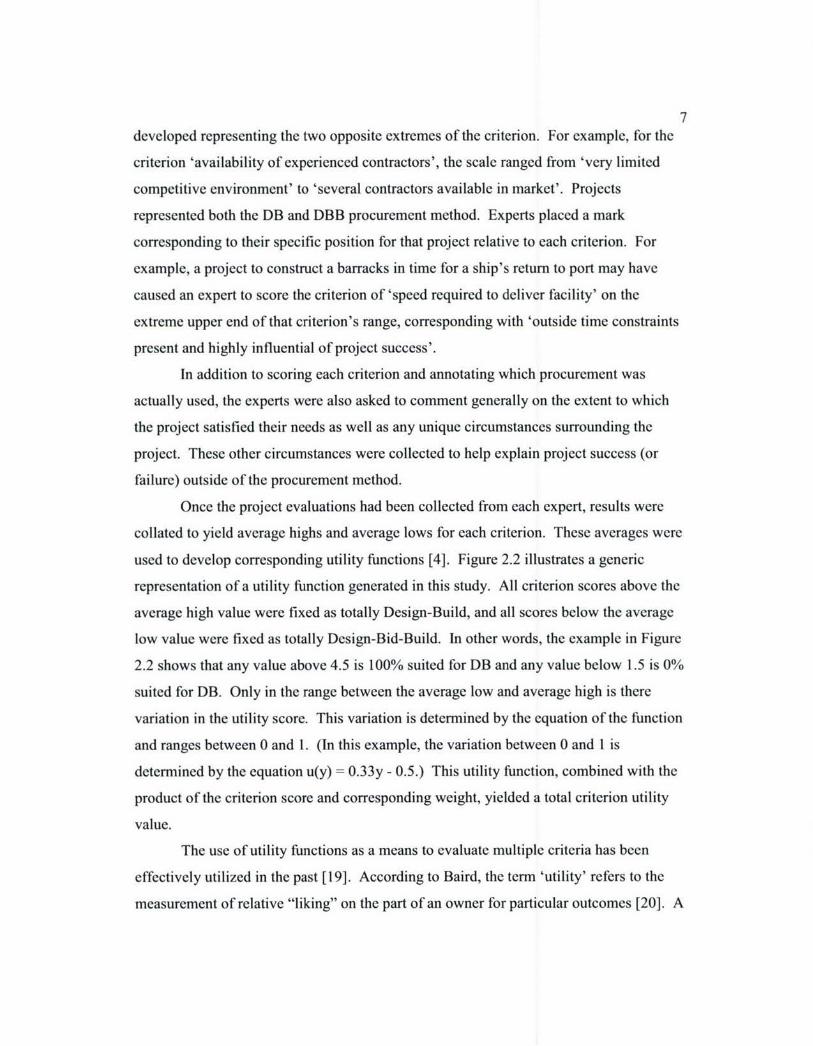
rankings were collected and compiled into a single list. A 2-sample T test was then
applied to the data to determine if any of the graded criteria were statistically less
significant than the rest. Any criterion failing the T test for significance was discarded
from further analysis. This yielded a final listing that included only the top criteria that
the experts collectively chose as most important (see Figure 2.1).
Procuremerd Experts
Figure 2.1: Criteria Listing Evolution and Project Scoring
Once the final list of collectively chosen important decision influencing criteria
was constructed, it was returned to the experts for weighting and use in the evaluation of
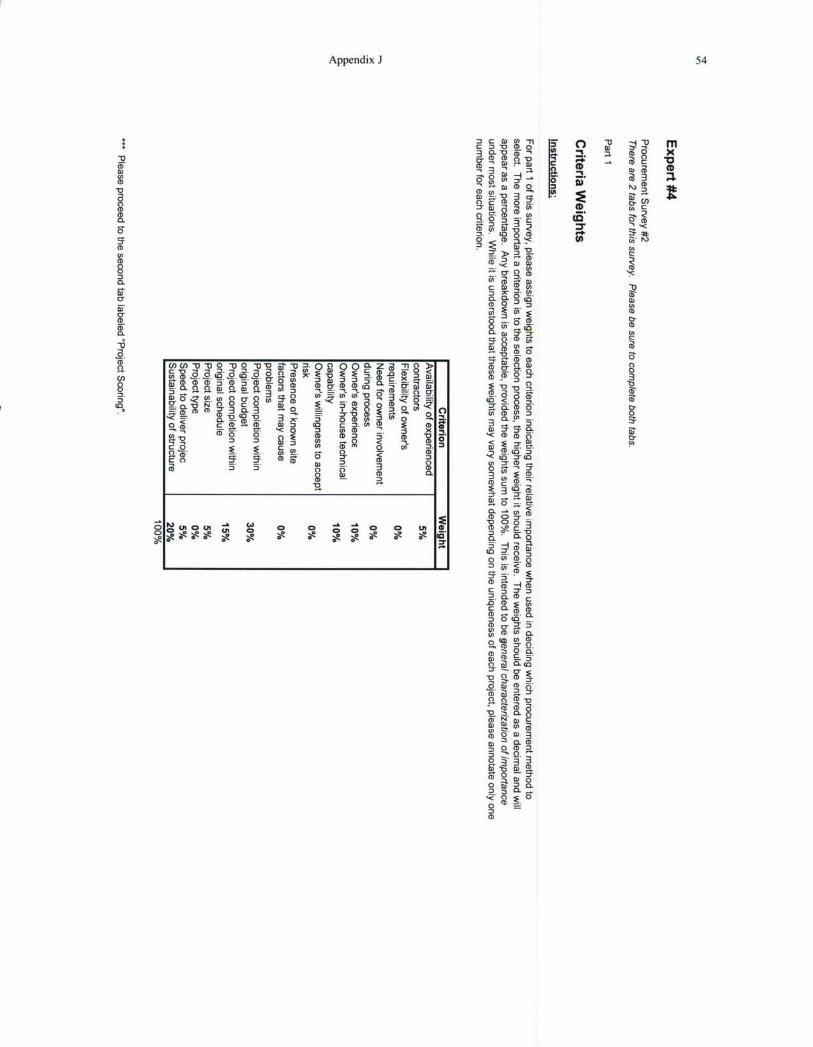
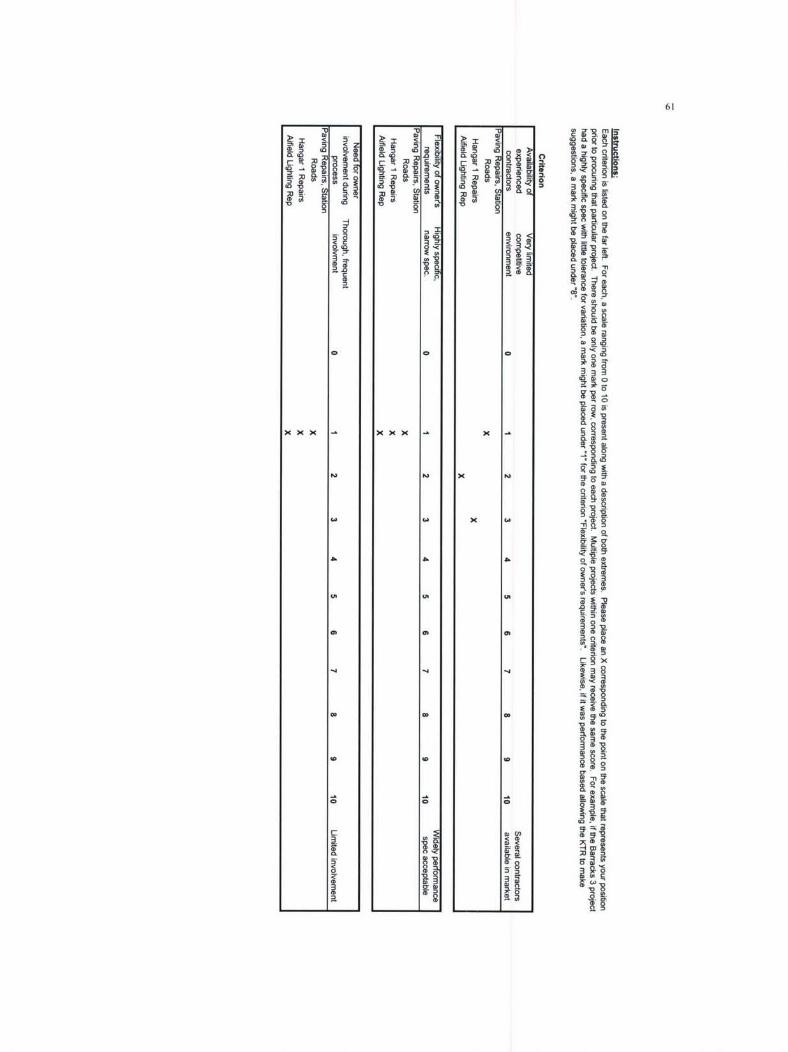
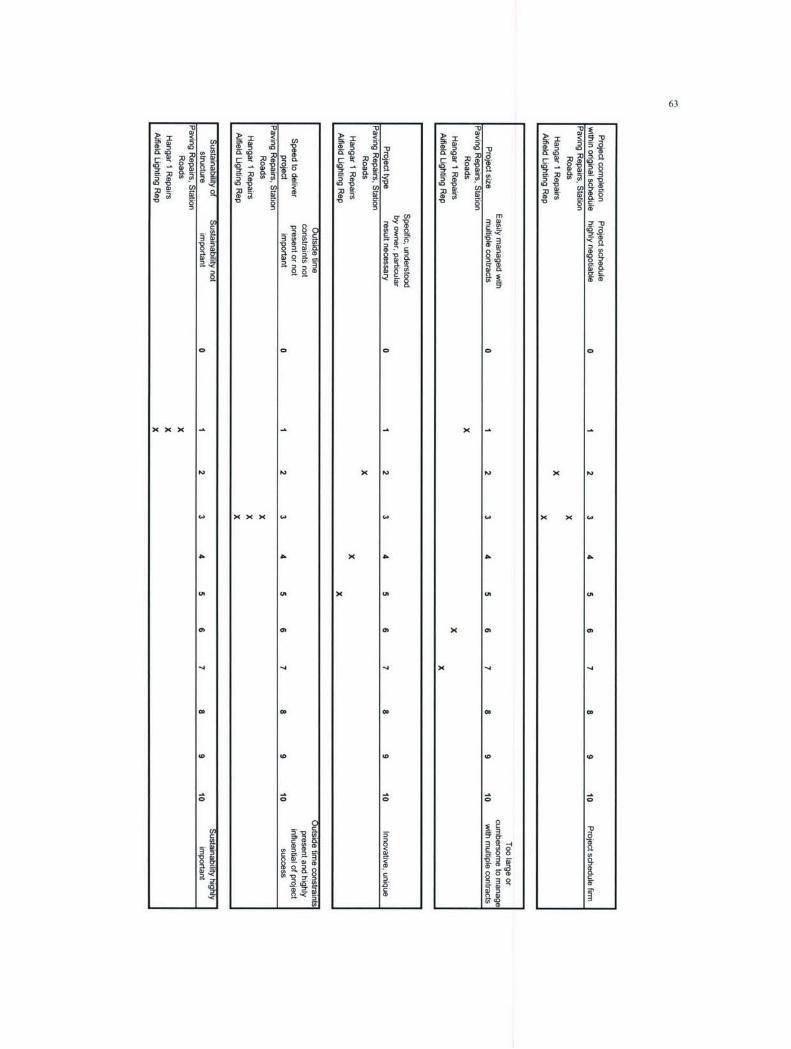
real-world projects. Each expert was asked to provide a single overall weight for each
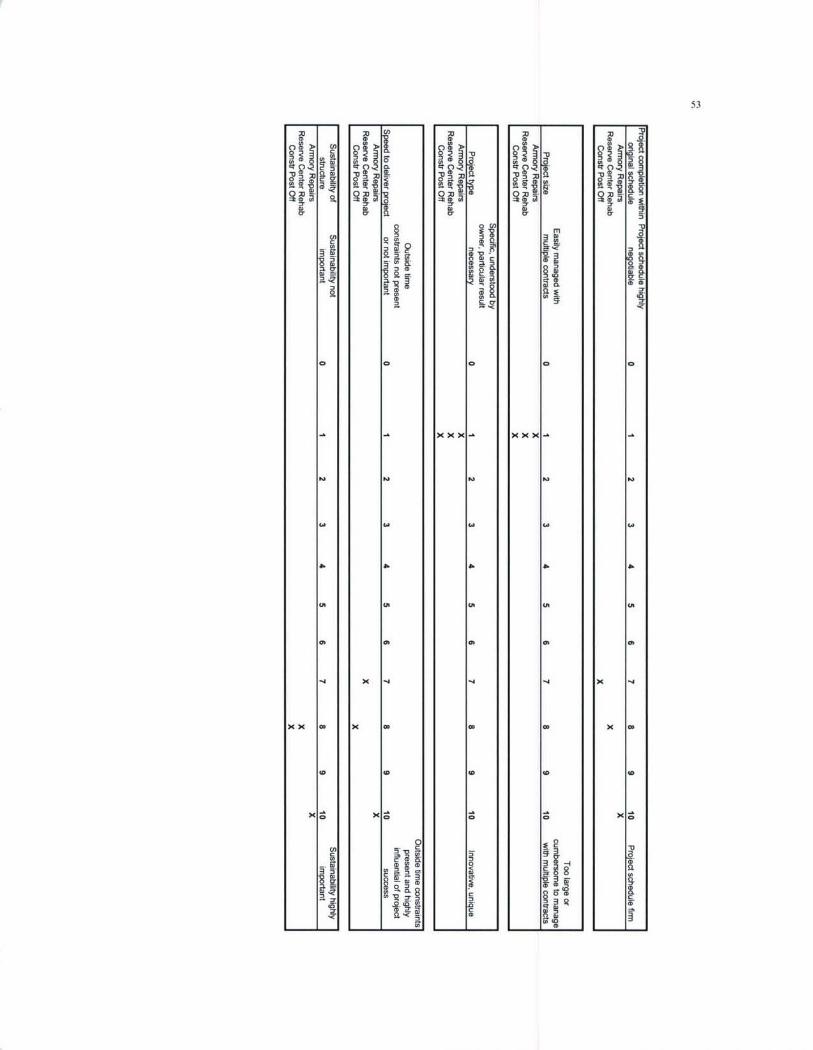
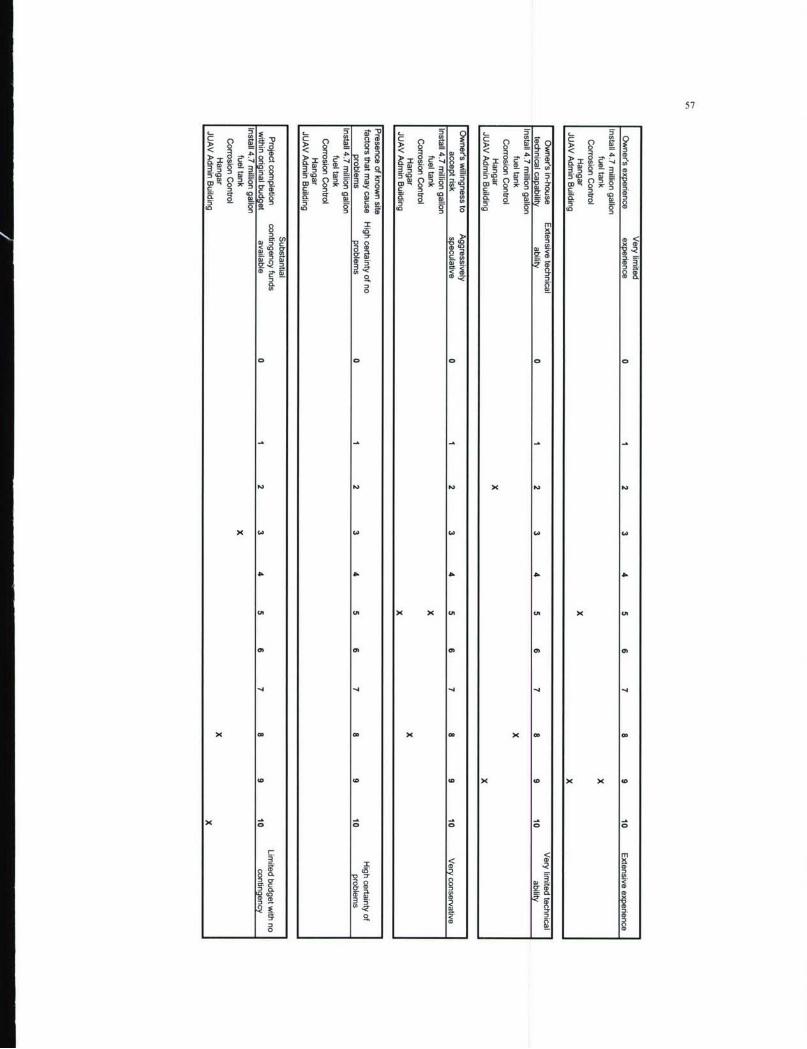
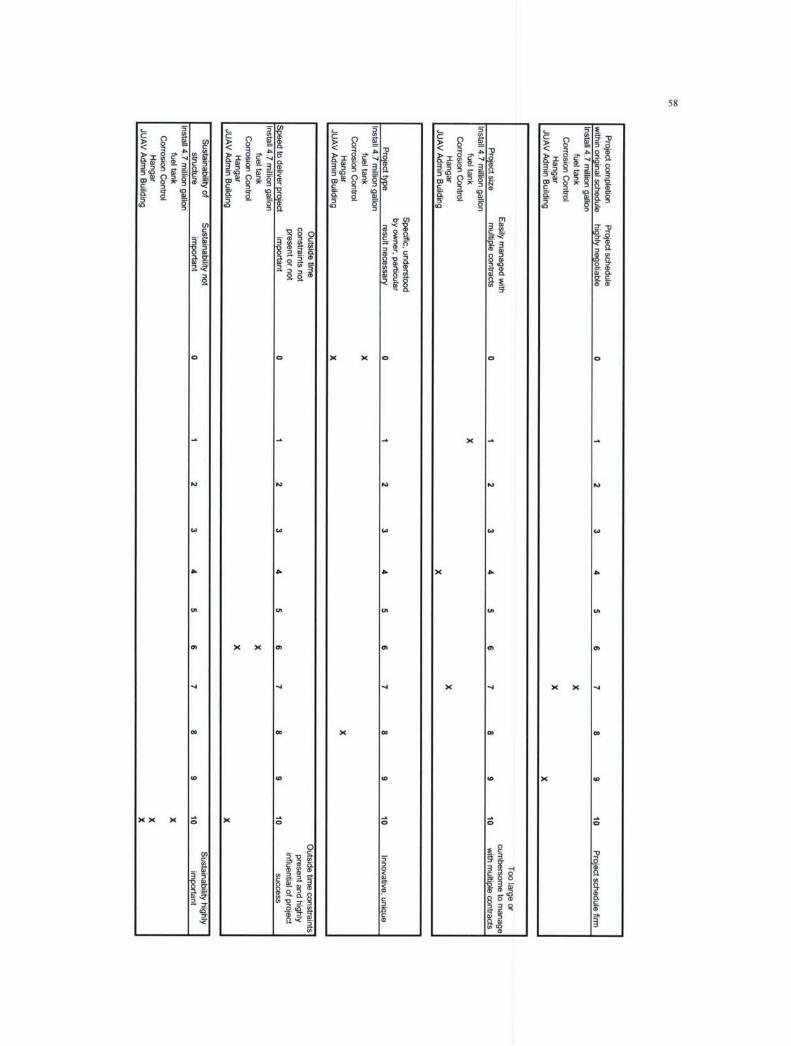
criterion, summing to 100%. Additionally, each expert was asked to score 3 projects
relative to each item on the list of criteria. For each criterion, a range from 0-10 was
7
developed representing the two opposite extremes of the criterion. For example, for the
criterion 'availability of experienced contractors', the scale ranged from 'very limited
competitive environment' to 'several contractors available in market'. Projects
represented both the DB and DBB procurement method. Experts placed a mark
corresponding to their specific position for that project relative to each criterion. For
example, a project to construct a barracks in time for a ship's return to port may have
caused an expert to score the criterion of 'speed required to deliver facility' on the
extreme upper end of that criterion's range, corresponding with 'outside time constraints
present and highly influential of project success'.
In addition to scoring each criterion and annotating which procurement was
actually used, the experts were also asked to comment generally on the extent to which
the project satisfied their needs as well as any unique circumstances surrounding the
project. These other circumstances were collected to help explain project success (or
failure) outside of the procurement method.
Once the project evaluations had been collected from each expert, results were
collated to yield average highs and average lows for each criterion. These averages were
used to develop corresponding utility functions [4]. Figure 2.2 illustrates a generic
representation of a utility function generated in this study. All criterion scores above the
average high value were fixed as totally Design-Build, and all scores below the average
low value were fixed as totally Design-Bid-Build. In other words, the example in Figure
2.2 shows that any value above 4.5 is 100% suited for DB and any value below 1.5 is 0%
suited for DB. Only in the range between the average low and average high is there
variation in the utility score. This variation is determined by the equation of the function
and ranges between 0 and 1. (In this example, the variation between 0 and 1 is
determined by the equation u(y) = 0.33y - 0.5.) This utility function, combined with the
product of the criterion score and corresponding weight, yielded a total criterion utility
value.
The use of utility functions as a means to evaluate multiple criteria has been
effectively utilized in the past [ 19]. According to Baird, the term 'utility' refers to the
measurement of relative "liking" on the part of an owner for particular outcomes [20]. A

8
major benefit to using this approach is that traditional multiple attribute utility theory
provides a methodology for selecting from among a set of alternatives in the presence of
uncertainty [21 ]. This allows several independent variables or decision outcomes to be
described as probability density functions, thus uniformly representing varying inputs as
a common output [ 19]. This common output serves as a singular representation of
several different owner, project, and external environment characteristics.
Design-Build 1 u(y) M 3y -.5
u(y)
Design-Bid- 0Build
,' 1.5 4.5,Avg Low Avg High
-0.5 Cteon score (y)
Figure 2.2: Individual Criterion Utility Function
The summation of all criterion utility values resulted in a single project utility
value. Averaging all project utility values yielded an overall total utility value, or
framework threshold. This threshold, based directly on the expert-inputted performance
criteria scores, serves as a reference, or boundary, between the two procurement types,
DB and DBB. Future projects can be compared to this total utility value to assist in
procurement selection; higher values lend themselves to DB, while values lower than the
threshold are better suited for DBB.

9
CHAPTER 3. PROCUREMENT SELECTION PARAMETERS
3.1 Literature Review
A brief overview, history, and trend analysis of the Design-Build and Design-Bid-
Build procurement methods follow in an attempt to describe the choices that owners face
for project delivery system. Figure 3.1 illustrates the different owner-contractor-designer
relationships present in each delivery method.
Under Design-Bid-Build, the owner enlists an architect to prepare the design of
the complete facility, including construction drawings, specifications, and contract
packages. The design package is then presented to general contractors who bid for the
work and engage subcontractors to provide various aspects of the project. Usually the
lowest bid is selected. The selected contractor is then responsible for building the facility
according to the design. With this project delivery system, the owner retains increased
control over the project due to the separate selection of architect and contractor [6].
Design-Bid-Build Design-Build
) 0 Singleownerrelationship
Multiple/~relationships
Figure 3.1: Procurement Method Relationships

10
In contrast, when Design-Build is the procurement method of choice, an owner
contracts with a DB team, which is often a joint venture of a general contractor and a
designer. Usually led by a general contractor (though a push for an increase in
architect/designer lead teams is in progress [7]), the team designs the facility based on
discussions with the owner about the needed functionality of the new facility. At an early
point in the process, the DB team and the owner negotiate a contract to complete the
design and construction of the facility. Once the owner approves the design, the design-
build team is then responsible for construction of the project and for the coordination
between design and construction [6].
Though often referred to as an 'alternative delivery method', Design-Build is not
a new concept. In fact, it is most likely the earliest and oldest form of project delivery.
Its roots originate in the ancient "Master Builder" concept where responsibility for both
design and construction resided with one person [8]. From the Great Pyramids to the
Parthenon, owners looked to a single person to both envision a structure that met the
owner's needs and construct that structure based on a design that took specific
constructability-related issues into account.
During the last century, however, project procurement systems have primarily
utilized the so-called "traditional" process of Design-Bid-Build [9]. The federal
government has undoubtedly steered the public sector toward DBB through the
enactment of federal laws such the Federal Acquisition Regulation (FAR) and the 1972
Brooks Act [10]. As originally passed, these statues inhibited the use of DB in public
projects, and state and local procurement statutes generally followed the federal
procurement models. As a result of the continuous use of these approaches, a litigious
environment of clients, contractors, lawyers, and claim consultants since the 1970's had
begun to characterize the industry [10]. By the 1990's, however, issues such as
accelerated project delivery, qualification of bidders, lack of innovation, and quality
construction had challenged the public sector to rethink its position on other alternative
delivery methods and restructure governing regulations to allow the use of Design-Build
[10,13].

11
200@ Design-5uildS~te" Pebili Proaeweomont Lawsa
.Oer,,-t.1d nid.1
Figure 3.2: Current DB Regulatory Environment jIlIl
This amending of regulations has resulted in the current project delivery market
experiencing a resurgence in the use of Design-Build procurement. Figure 3.2 illustrates
the current U.S. regulatory environment as it relates to Design-Build [ I11]. Figure 3.3
outlines the historical usage of both DB and DBB and provides the Design-Build Institute
of America's future projections on their use [11 I].
Non-Residential Design and Constructionin the United States
100% _
90%_00%-
10% -,
40%
30%I
20% -
10% 1
0%,1985 1990 1995 2000 2005 2010 2015
Figure 3.3: Procurement Method Usage Trends [i11

12
3.2 Procurement Method Characteristics
As stated earlier, different procurement methods each possess unique
characteristics, which lead to advantages and disadvantages of using each one.
According to Ling, et al., it has been shown that most clients consistently use the
procurement method with which they are most familiar [14]. Unfortunately, relatively
few construction industry professionals both fully understand the differences in the
various procurement systems and are subsequently unable to make recommendations on
which system would be more appropriate for a specific project. It is therefore no surprise
why owners and building professionals often resort to the procurement system with
which they are most familiar, regardless of its appropriateness for the project [ 14].
Indeed, the DBB method has survived for so many years because it has several
advantages. These include familiarity to participants in the construction process, firmly
defined contractual relationships, and increased owner control over the design through
direct contractual relationship with the designer [ 14].
DBB does, however, contain some limitations. Most notably is the greater
propensity for conflict due to greater fragmentation throughout the project. In Design-
Bid-Build, the designer creates the plans for a structure with little to no outside influence.
The constructor then bids upon these documents on which he has had no constructive
input. In fact, design and constructor rarely interact during the construction phase unless
there is a conflict. Sitting squarely in the middle of this conflict (given his separate
contractual relationships) is the owner. As a result, the contractor is encouraged to
submit for extra payment to correct any design deficiencies (which takes added time), and
the designer is encouraged to report that any deficiencies are due to improper
construction by the contractor. This adversarial situation often results in the owner
bearing increased cost and/or forcibly accepting increased time to complete the project.
The owner's single relationship and point of responsibility to the contractor is said
to be the greatest strength of Design-Build [ 14]. Owners are able to enjoy efficient and
centralized accountability and authority. In DB, there is no adversarial relationship
between contractor and designer since they work together as a single project team [14].
13
Both the ability for this combined team to resolve issues internally much faster than in
DBB along with the often non-linear project schedule often results in reduced time
necessary to complete the project.
DB has its disadvantages as well. Because of its ability for design and
construction to take place non-linearly, an owner must commit to decisions earlier in the
process. While not an absolute necessity in DB, "fast-tracking", or the construction of
certain approved portions of the project prior to a complete set of project plan documents,
is not uncommon. As in any construction project, the changing of a parameter by the
owner once construction has begun is much more costly than had the owner changed it
prior to construction.
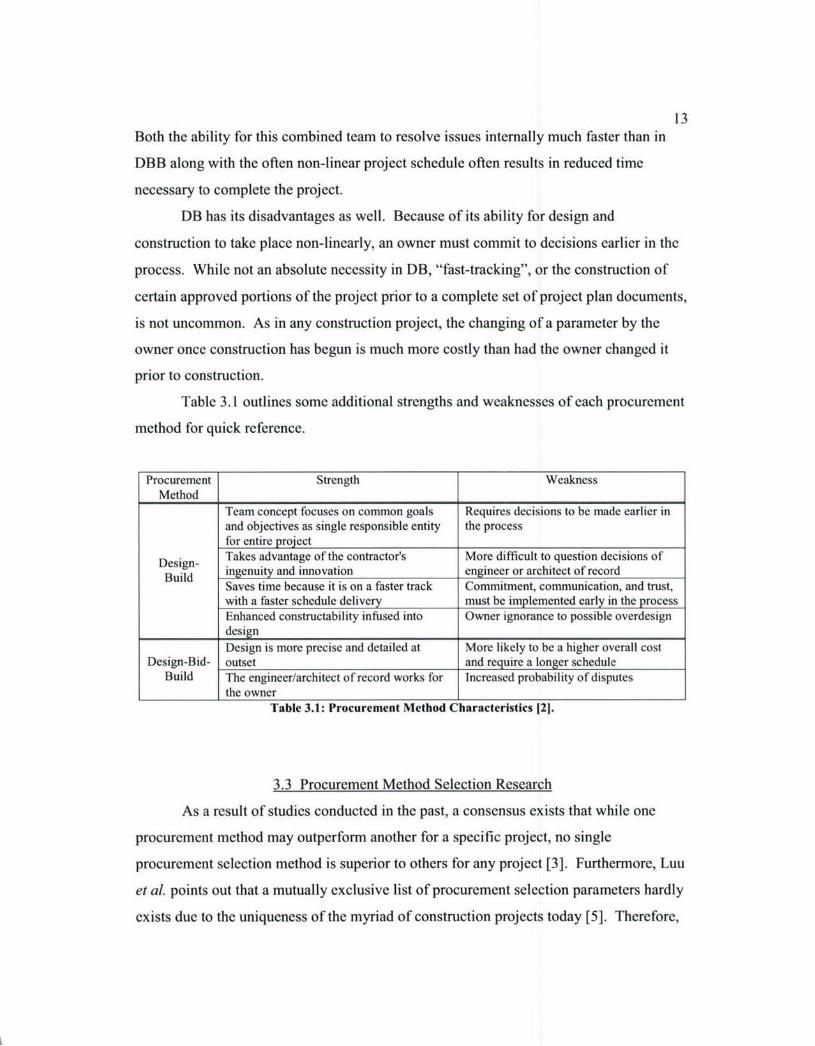
Table 3.1 outlines some additional strengths and weaknesses of each procurement
method for quick reference.
Procurement Strength WeaknessMethod
Team concept focuses on common goals Requires decisions to be made earlier inand objectives as single responsible entity the processfor entire project
Design- Takes advantage of the contractor's More difficult to question decisions of
Build ingenuity and innovation engineer or architect of recordSaves time because it is on a faster track Commitment, communication, and trust,with a faster schedule delivery must be implemented early in the processEnhanced constructability infused into Owner ignorance to possible overdesign
I designDesign is more precise and detailed at More likely to be a higher overall cost
Design-Bid- outset and require a longer scheduleBuild The engineer/architect of record works for Increased probability of disputes
the ownerTable 3.1: Procurement Method Characteristics 121.
3.3 Procurement Method Selection Research
As a result of studies conducted in the past, a consensus exists that while one
procurement method may outperform another for a specific project, no single
procurement selection method is superior to others for any project [3]. Furthermore, Luu
et al. points out that a mutually exclusive list of procurement selection parameters hardly
exists due to the uniqueness of the myriad of construction projects today [5]. Therefore,

14
prior research in this area demonstrates that a tailored approach involving surveys of
procurement experts is the preferred method by which to collect data [3,5,9].
As this project's focus is toward the U. S. Navy, the project experts polled in this
study were from the Naval Facilities Engineering Command. NAVFAC is responsible to
the U. S. Navy for over $10 billion in annual work. In a hierarchical system typical of
the U. S. Government, NAFVAC is divided into three levels: an overall headquarters,
two overall regional commands (NAVFAC Atlantic and Pacific), 12 geographic divisions
(NAVFAC Northwest, Southwest, Europe, Hawaii, etc.), and several Integrated Project
Teams (IPTs) consisting of contract field offices and installation public works offices.
Appendix A has a brief graphical breakdown of the NAVFAC organization. The experts
in this study are employed at the IPT level. They represent the level at which most
project-level decisions are made. They routinely decide which procurement method to
utilize on projects. On average, the experts in this study have over 18 years of experience
in procurement selection; all have a minimum of 10 years of experience. These experts
serve as either project managers, business directors, or public works officers responsible
for overall management of construction and maintenance on a naval installation.
Research into procurement methods and the related success or failure of each
method has been accomplished in the past. Among the most notable are Kumaraswamy
and Dissanayaka [16,17], Molenaar [12], Love, Skitmore, and Earl [3], and Konchar and
Sanvido [ 13]. Kumaraswamy and Dissanayaka explored the impacts of both procurement
and non-procurement related variables (such as project conditions and team
characteristics) on project performance by measuring 11 performance areas [ 16, 17].
Love, Skitmore, and Earl used expert surveys to poll attitudes toward different delivery
options [3], while Molenaar specifically investigated the DB delivery system and
developed key criteria to measure performance in comparison to other project delivery
systems such as DBB [ 12]. Similarly, Konchar and Sanvido relied on empirical studies
to develop specific Design-Build performance parameters upon which they could
recommend the use of DB [13].
Luu, et al.'s work took elements of many of these previous studies into account
when developing a listing of procurement selection parameters to be considered prior to
15procurement selection. Luu, et al. also utilized expert input to determine specific areas
of interest (client's characteristics and objectives, project characteristics, and external
environment) while developing a model to evaluate procurement selection methods [5].
The parameters outlined by Luu, et al. (criteria 1-2, and 4-11) were selected following
responses by 84 industry leaders as to what items were most important to consider prior
to procurement method selection. This independent research study draws on several of
the above listed individual's work for support.
While Luu, et al. provided a solid basis for the initial criteria listing generated in
this study, the initial listing also included Hibberd and Basden's important criteria of"owner's propensity to accept risk" [ 15]. This facet gave insight into an owner's
propensity to assume a decision-making role throughout the project's life. Criteria 3, 12,
and 13 were also added to the initial listing. They were not explicitly annotated in prior
research, but were considered important through the investigator's field experience.
16
CHAPTER 4. DATA COLLECTION
4.1 Procurement Selection Criteria List Formulation
Table 4.1 shows the initial criteria listing sent for expert review. The
experts were asked to score the importance of each criteria listed as well as add and score
any additional criteria they felt demanded consideration.
The aim of this initial listing was to adequately represent the various main
categories of inputs into procurement selection: owner characteristics, project
characteristics, and external environment [5]. To that end, criteria such as "need for
owner involvement during process" and "owner's willingness to accept risk" represent
owner characteristics. Similarly, criteria such as "project size" and "project type"
illustrate project characteristics, and "availability of experienced contractors" and"presence of known site factors that may cause problems" represent external environment
factors.
17
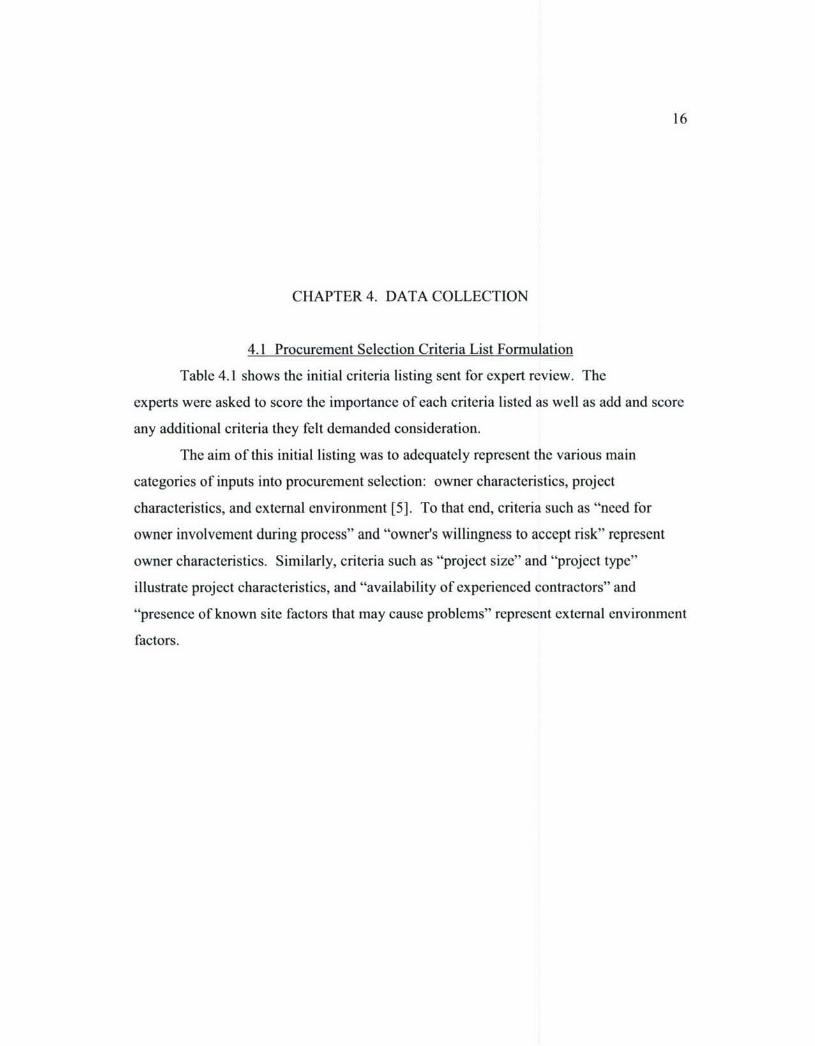
Type Criteria name Further criteria description
Very narrow specification allowing for little orFlexibility of owner's requirements no contractor flexibility vs. widely flexible
3erformance specificationExtent to which owner must be involved in
" N eed for owner involvement during process design review, specification creation or___enforcement, etc.
O wner's experience Owner's experience with similar projectsU
SOwner's in-house technical capability Owner's ability to act as design engineer orcp tnswer technical questions during construction
ropensity for owner to assume decisionOwner's willingness to accept risk aking role throughout project design &
onstruction
Presence of known site factors that may cause [oil conditions, unknown utility conditions,"E > roblems etc.
v Extent of owner's pool of contractors fromW4 Availability of experienced contractors which to receive offers
Project completion within original budget /A
P roject completion within original schedule N/A"�sizOwner's ability to manage contract via
roject single/multiple contract(s)
New technology or innovative vs. wellU roject type understood or proven scope
"deliver Necessity to meet delivery date due to outsideS.peed to project constraint vs. ability for schedule to slip
Whether sustainable or other "green" buildingustainability of structure techniques are to be implemented
Table 4.1: Initial Criteria Listing with Descriptions
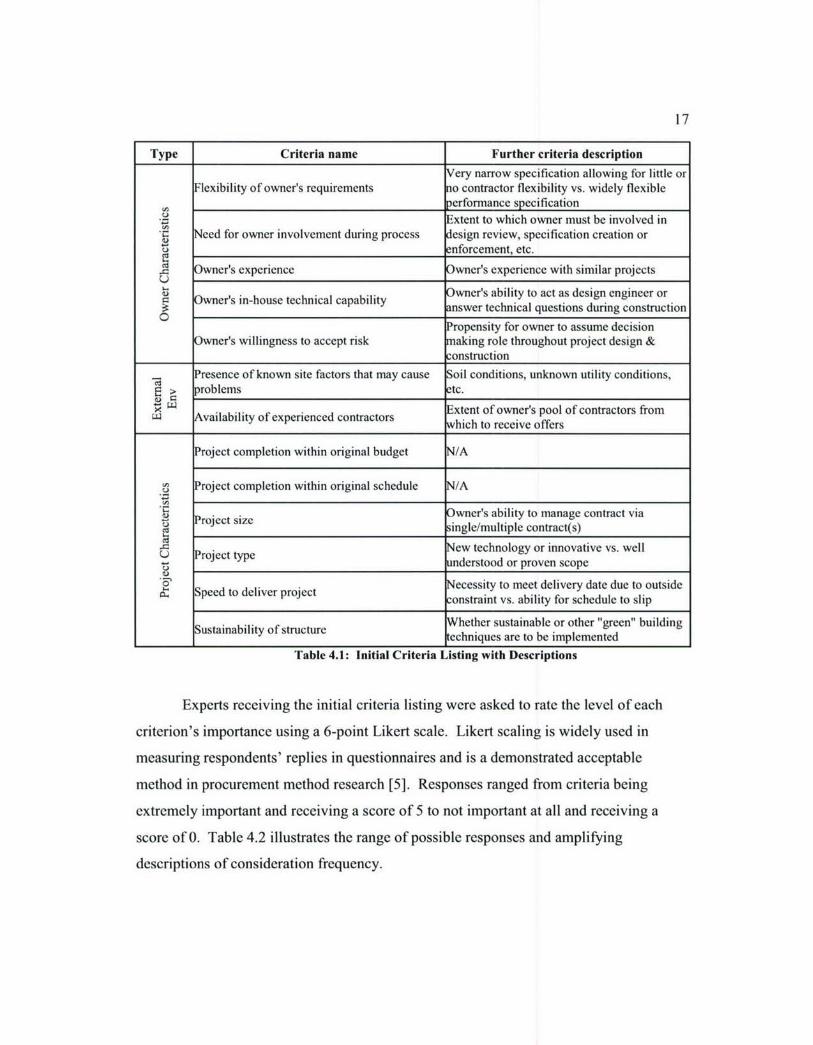
Experts receiving the initial criteria listing were asked to rate the level of each
criterion's importance using a 6-point Likert scale. Likert scaling is widely used in
measuring respondents' replies in questionnaires and is a demonstrated acceptable
method in procurement method research [5]. Responses ranged from criteria being
extremely important and receiving a score of 5 to not important at all and receiving a
score of 0. Table 4.2 illustrates the range of possible responses and amplifying
descriptions of consideration frequency.
18
Score Response Description
5 Extremely Important Owners should consider this criterion every time
4 Very Important Owners should consider this criterion most times
3 Somewhat Important Owners should consider this criterion occasionallyor only on specific projects
2 Somewhat Unimportant Owners may or may not consider this criterionwithout expected effect
1 Not Very Important Owners seldom consider this criterion or only forI _specifically unique projects
0 Not at All Important Owners rarely if ever consider this criterion
Table 4.2: Criteria Listing Response Scale
The results of each expert's responses were collected and compiled into Table 4.3.
Averages and standard deviations were calculated for each. These were later used to
determine if any criteria should be discarded from further analysis.
Criterion Expert I Expert 2 Expert 3 Expert 4 Expert 5 Average Std Dev
1 Availability of experienced contractors 1 5 5 4 4 3.80 1.64
2 Flexibility of owners requirements 3 3 4 4 4 3.60 0.553 Need for owner involvement during 4 2 2 5 5 3.60 1.52
process4 Owner's experience 1 2 5 3 3 2.80 1.485 Owners in-house technical capability 3 4 4 3 5 3.80 0.846 Owner's willingness to accept risk 5 3 5 3 4 4.00 1.00
Presence of known site factors that 1 4 4 5 3.80 1.64may cause problems
8 Project completion within original 4 4 5 5 5 4.60 0.55budget
9 Project completion within original 5 5 4 4 4.40 0.55schedule
10 Project size 3 2 3 4 3 3.00 0.7111 Project type 1 3 3 4 5 3.20 1.4812 Speed to deliver project 5 3 5 4 4 4.20 0.8413 Sustainability of structure 2 2 4 4 5 3.40 1.34
Table 4.3: Criteria List Expert Responses
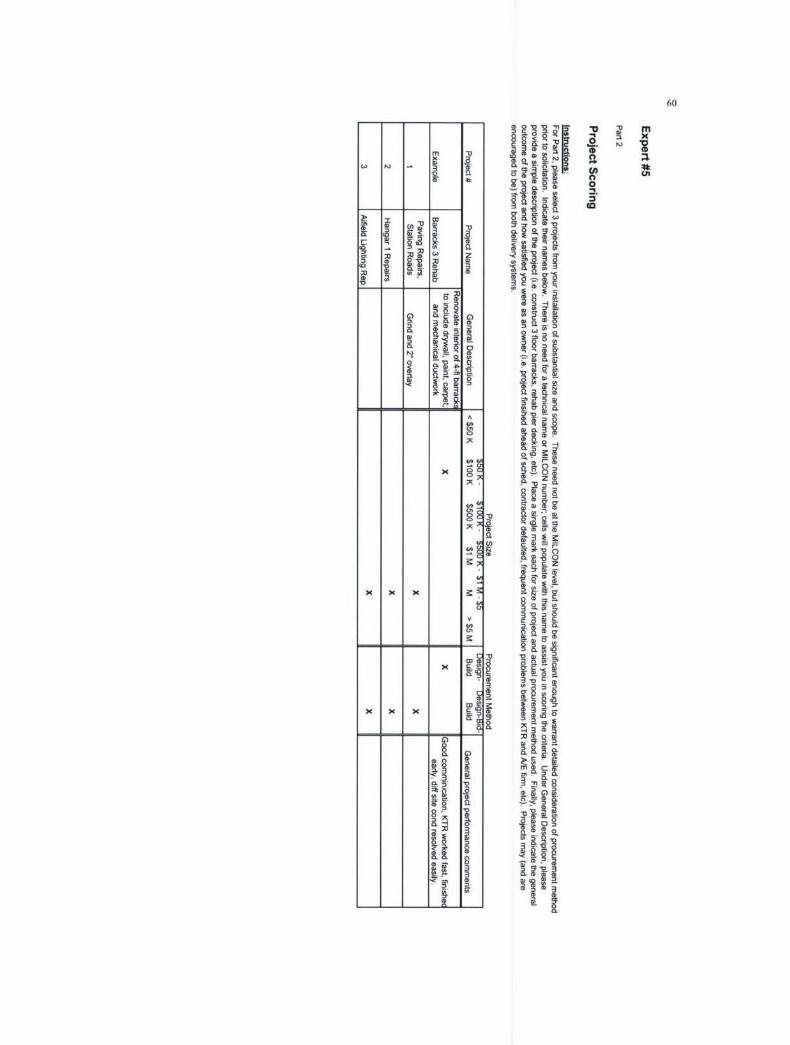
4.2 Project Scoring and Expert Evaluation
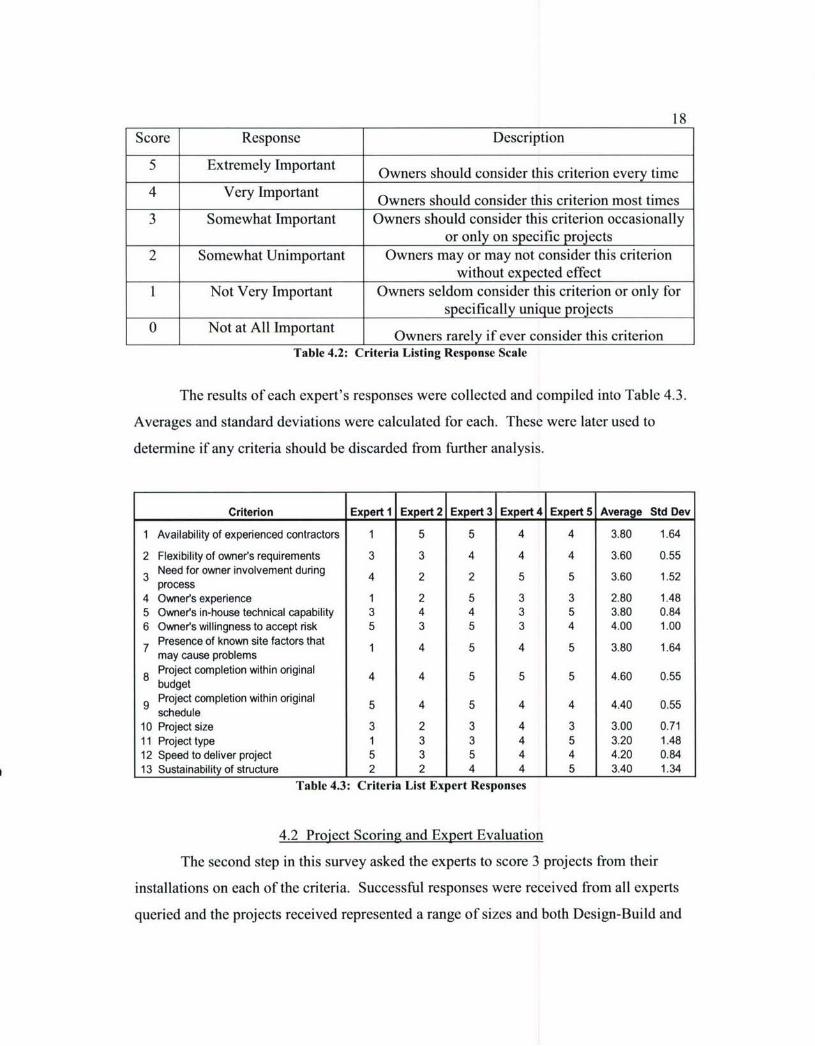
The second step in this survey asked the experts to score 3 projects from their
installations on each of the criteria. Successful responses were received from all experts
queried and the projects received represented a range of sizes and both Design-Build and
19Design-Bid-Build project delivery systems. See Figure 4.1 for a graphical
representation of the projects characteristics.
Deslgn-Build Project Sizes Deslgn-Sid-Build Project Sizes
01 > $5M 3 U$ 5M
VI1 M$SM M 1 Ei M.SM
a$500 K-$1 M G $SOO K-$ SM
O100K -$500 K OSIOOK -$500 K
@$SO K- $100 K d $SO K- $100 K
*550 K 6 U $50 K
Figure 4.1: Study Project Characteristics
These projects served as the building blocks of the procurement framework. The
scores that the experts submitted were the inputs that determined the corresponding utility
function shapes and ultimately led to an overall utility value. Appendices G through K
contain the scoring data for each expert.
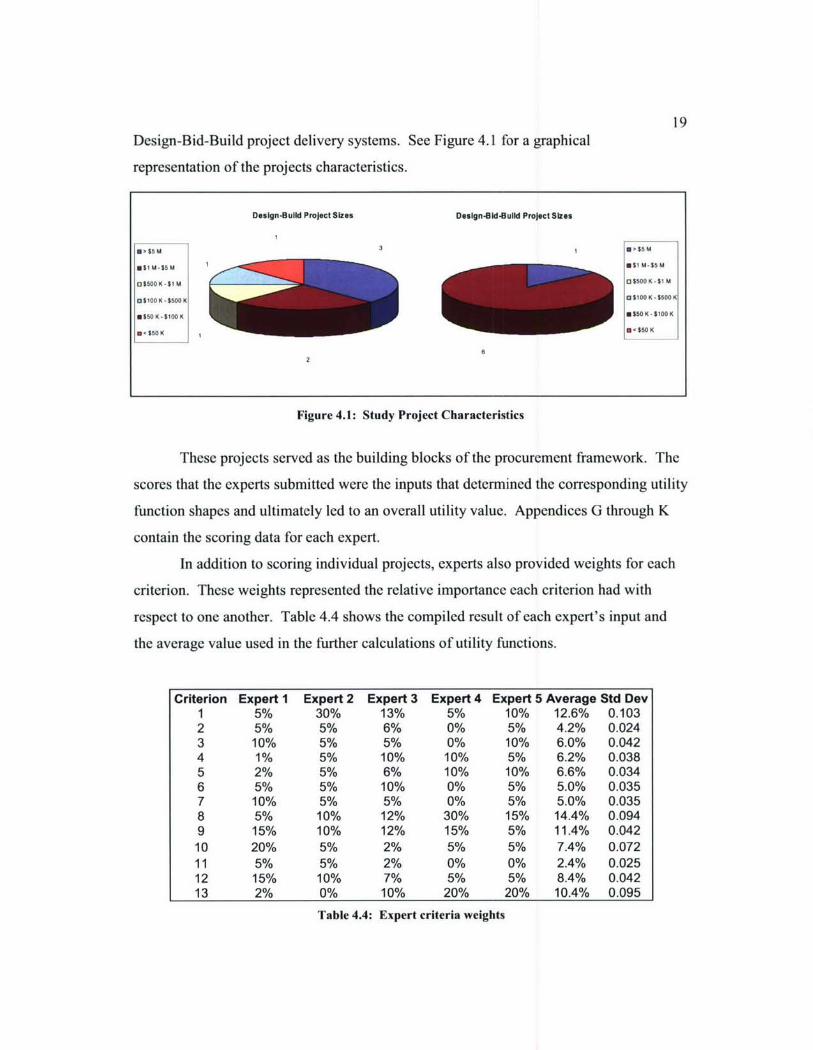
In addition to scoring individual projects, experts also provided weights for each
criterion. These weights represented the relative importance each criterion had with
respect to one another. Table 4.4 shows the compiled result of each expert's input and
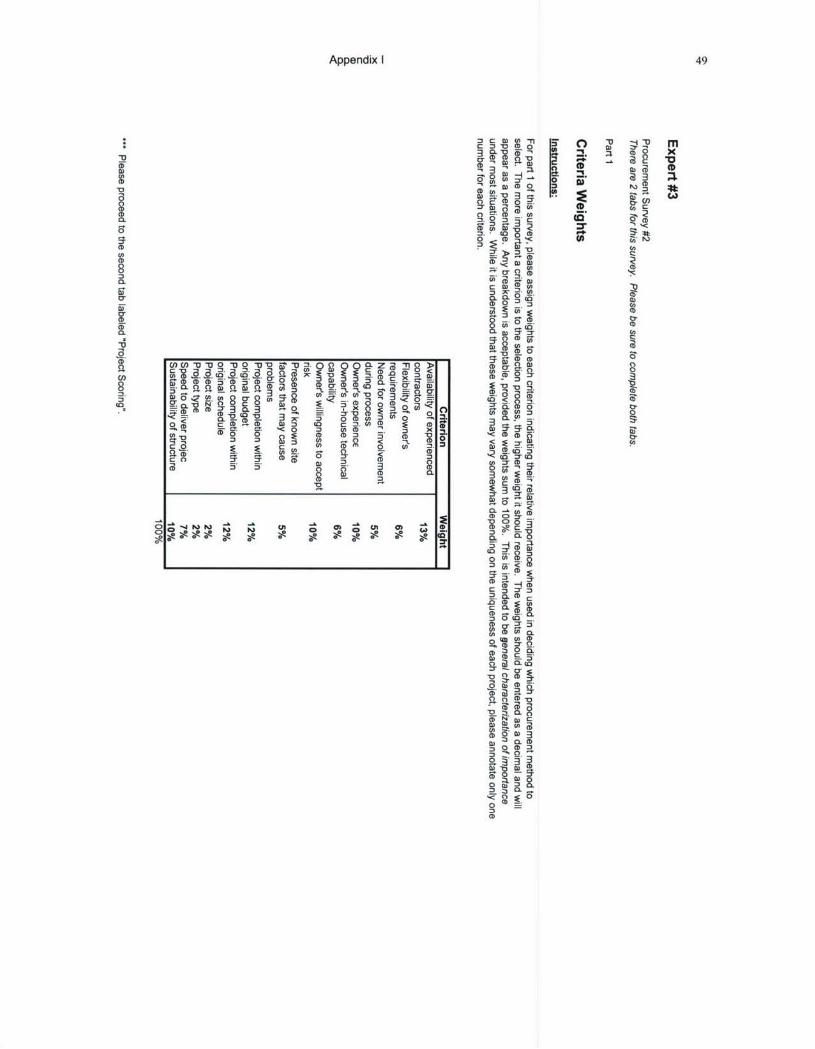
the average value used in the further calculations of utility functions.
Criterion Expert I Expert 2 Expert 3 Expert 4 Expert 5 Average Std Dev1 5% 30% 13% 5% 10% 12.6% 0.1032 5% 5% 6% 0% 5% 4.2% 0.0243 10% 5% 5% 0% 10% 6.0% 0.0424 1% 5% 10% 10% 5% 6.2% 0.0385 2% 5% 6% 10% 10% 6.6% 0.0346 5% 5% 10% 0% 5% 5.0% 0.0357 10% 5% 5% 0% 5% 5.0% 0.0358 5% 10% 12% 30% 15% 14.4% 0.0949 15% 10% 12% 15% 5% 11.4% 0.04210 20% 5% 2% 5% 5% 7.4% 0.07211 5% 5% 2% 0% 0% 2.4% 0.02512 15% 10% 7% 5% 5% 8.4% 0.04213 2% 0% 10% 20% 20% 10.4% 0.095
Table 4.4: Expert criteria weights

20
CHAPTER 5. DATA ANALYSIS
5.1 Criteria List Analysis
Once the experts' results were received on the initial criteria listing survey, it was
necessary to analyze them to determine if any of the criteria ought to be excluded from
further calculations due to insignificance with the remainder of the data. This was done
utilizing 2-sample T test methodology. Figure 5.1 illustrates the governing formula for
the t-value used in the 2-sample test where x is the average criterion score, s is the
standard deviation, and n is the sample size [ 18].
X1 -x 22 2
S1 S2
Sn n2-ý
Figure 5.1: t-value equation
Rearranging the equation in Figure 5.1 solves for the difference in two criterion's
means (See Figure 5.2).
2 2
X1 -- X2 +
Figure 5.2: Significant mean difference equation
For example, the t-value corresponding to a 90% degree of confidence and sample
size of 10 is 1.38 [18]. With standard deviations of 1.5 and 1.8 respectively, the equation
in Figure 5.2 yields the result illustrated in Figure 5.3.
21
1.52 1.82x1 - x2 = 1.38* +- = 1.02
ý 10 10
Figure 5.3: Example significant mean difference calculation
Therefore, given the confidence level and sample size, the result is that for x2 to be
significantly different than x1, its mean must differ from Xl's by more than 1.02.
For this study, a confidence level of 75% was utilized. This was chosen because
the inputs are, unlike highly predictable laboratory experiments, based on human
experience and therefore widely variable. Using a 90% or higher level of confidence was
therefore avoided, and lower confidence values were not chosen to retain meaningfulness
in the resulting analysis. The t-value corresponding to a 75% degree of confidence and a
sample size of 5 is 0.741 [18].
The result in this study was for a criterion not to be considered significant when
compared to the remainder of the group, its mean must have differed by at least 0.544
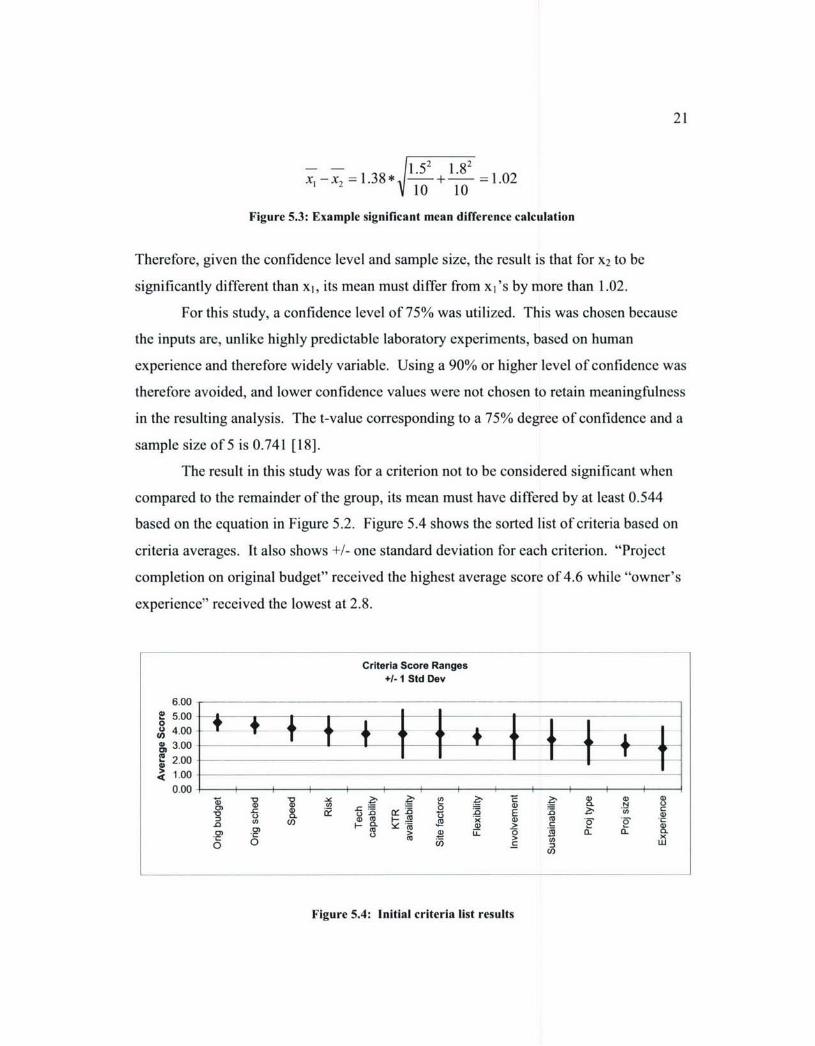
based on the equation in Figure 5.2. Figure 5.4 shows the sorted list of criteria based on
criteria averages. It also shows +/- one standard deviation for each criterion. "Project
completion on original budget" received the highest average score of 4.6 while "owner's
experience" received the lowest at 2.8.
Criteria Score Ranges
+I- 1 Std Dev
6.00 - -- ---
5.00 JLU 4.00
& 3.00 - T2.00
<1.000.001 I I I i
.• .• • > L _ >oLQ- a
04 0. l t
Figure 5A4 Initial criteria list results

22
All thirteen criteria's means differed by 0.2 or less. Since none of the criteria
scores were greater than 0.544 apart, it was determined that all thirteen criteria annotated
on the initial list were significant and were therefore all included in further analysis.
Additionally, nearly all criteria yielded average values above 3.0, corresponding to"somewhat important". Only 'owner's experience' fell below that mark at 2.8, but was
considered close enough to warrant continued inclusion. In essence, since none of the
criteria needed to be discarded, the initial criteria listing became the final criteria listing.
5.2 Utility Function Generation
This framework applied procedures previously outlined in Chang, et al. utilizing
utility functions to quantify subjective expert input [4]. Since all 13 criteria were deemed
valid for further consideration, this system requested that all 5 experts each score 3
projects on all 13 criteria. The result was a database of fifteen projects representing a
range of project types, sizes, and both DB and DBB delivery methods. The scores for
these projects were used to calculate a utility function for each criterion.
Earlier, Figure 2.2 showed how the utility function for each criterion encapsulated
both the average high and average low scores received from the experts. For example,
Table 5.1 demonstrates the approach for the third criterion "owner involvement during
process". It uses inputs from 2 experts scoring 3 projects each.
Owner involvement during process
1 2 3 4 5
Expert I X X X
Expert 2 X X X
Table 5.1: Sample Expert scoring input
From this data, average low and average high values were calculated. In this
example, low values of 1 from Expert 1 and 2 from Expert 2 yield an average low value
of 1.5. Similarly, high values of 4 from Expert 1 and 5 from Expert 2 yield an average
high value of 4.5. Consequently, any value below the average low is fixed (in this
23
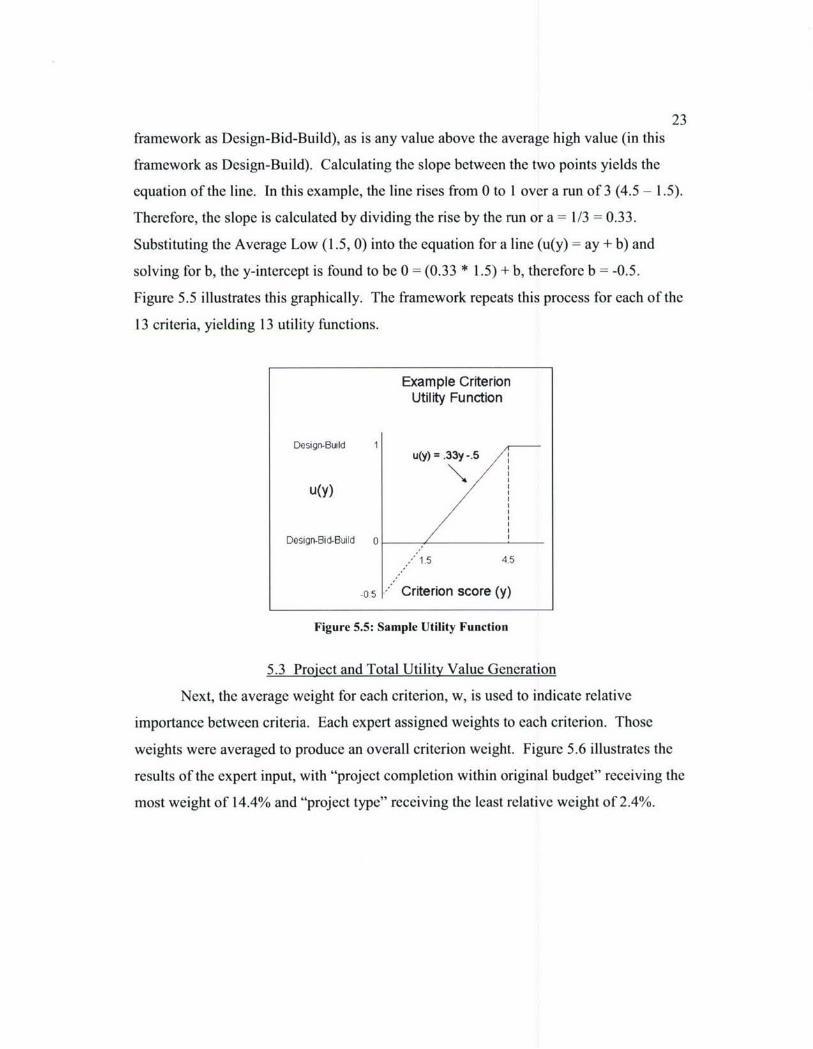
framework as Design-Bid-Build), as is any value above the average high value (in this
framework as Design-Build). Calculating the slope between the two points yields the
equation of the line. In this example, the line rises from 0 to 1 over a run of 3 (4.5 - 1.5).
Therefore, the slope is calculated by dividing the rise by the run or a = 1/3 = 0.33.
Substituting the Average Low (1.5, 0) into the equation for a line (u(y) = ay + b) and
solving for b, the y-intercept is found to be 0 = (0.33 * 1.5) + b, therefore b = -0.5.
Figure 5.5 illustrates this graphically. The framework repeats this process for each of the
13 criteria, yielding 13 utility functions.
Example CriterionUtility Function
Design-Build 1u(y)3My -.5 /
Design-Bid-Build 0
1.5 4.5
-0,5 Criterion score (y)
Figure 5.5: Sample Utility Function
5.3 Project and Total Utility Value Generation
Next, the average weight for each criterion, w, is used to indicate relative
importance between criteria. Each expert assigned weights to each criterion. Those
weights were averaged to produce an overall criterion weight. Figure 5.6 illustrates the
results of the expert input, with "project completion within original budget" receiving the
most weight of 14.4% and "project type" receiving the least relative weight of 2.4%.
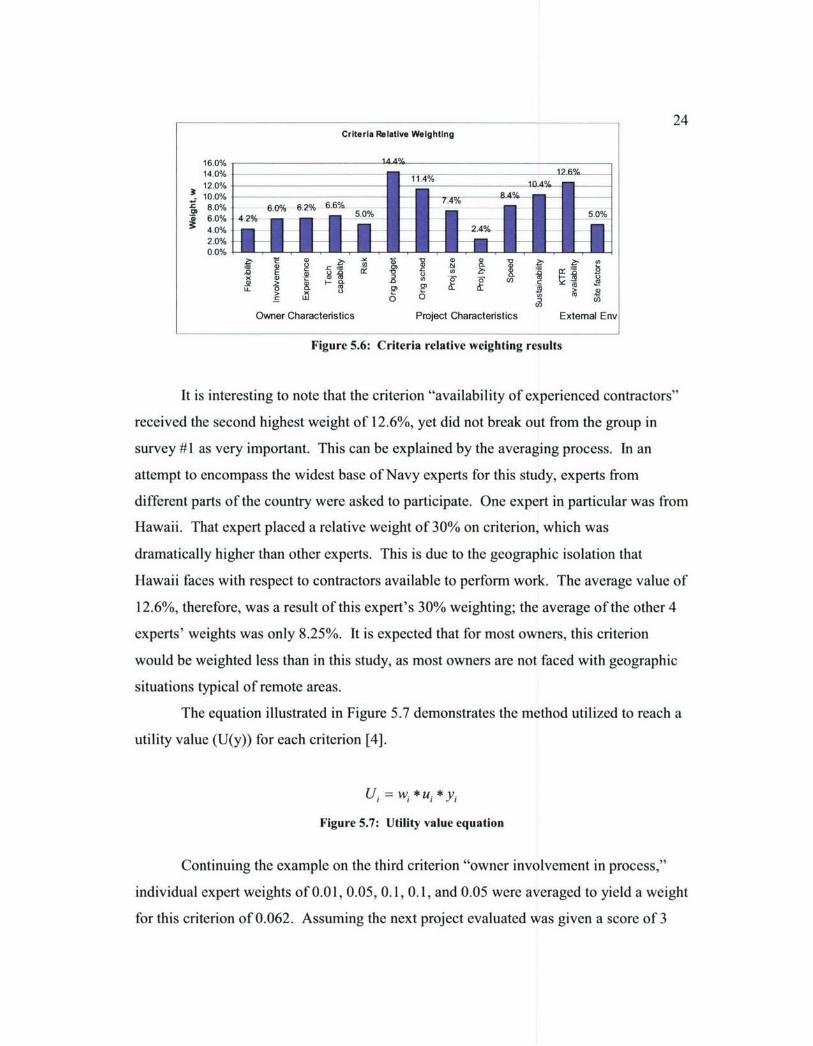
24Criteria Relative Weighting
16.0% 144%14.0% 11.4%12.0%
S10.0% 8.4-C 8.0% 6.0% 6.2% 66% m U
4.0% ?.4%2.0%500% 1. 1 . M . m , M, 14 , M .l
Owner Characteristics Project Characteristics External Env
Figure 5.6: Criteria relative weighting results
It is interesting to note that the criterion "availability of experienced contractors"
received the second highest weight of 12.6%, yet did not break out from the group in
survey #1 as very important. This can be explained by the averaging process. In an
attempt to encompass the widest base of Navy experts for this study, experts from
different parts of the country were asked to participate. One expert in particular was from
Hawaii. That expert placed a relative weight of 30% on criterion, which was
dramatically higher than other experts. This is due to the geographic isolation that
Hawaii faces with respect to contractors available to perform work. The average value of
12.6%, therefore, was a result of this expert's 30% weighting; the average of the other 4
experts' weights was only 8.25%. It is expected that for most owners, this criterion
would be weighted less than in this study, as most owners are not faced with geographic
situations typical of remote areas.
The equation illustrated in Figure 5.7 demonstrates the method utilized to reach a
utility value (U(y)) for each criterion [4].
Ui = wi *Ui *yi
Figure 5.7: Utility value equation
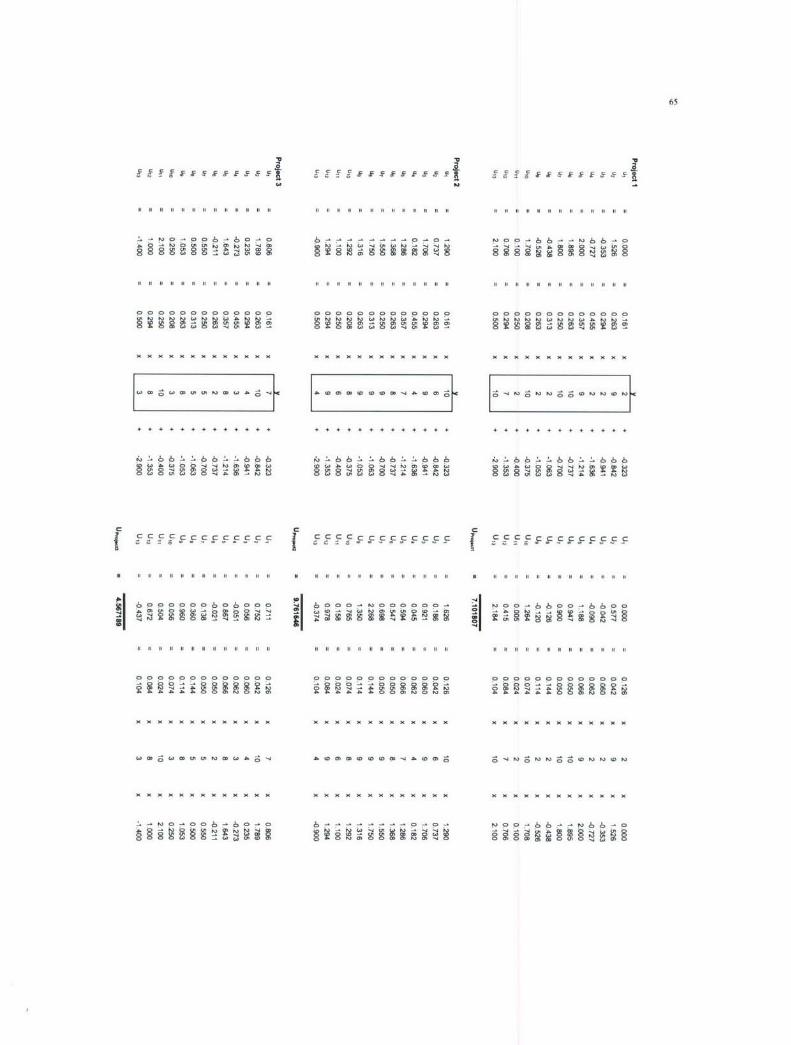
Continuing the example on the third criterion "owner involvement in process,"
individual expert weights of 0.01, 0.05, 0.1, 0.1, and 0.05 were averaged to yield a weight
for this criterion of 0.062. Assuming the next project evaluated was given a score of 3
25for this criterion, the corresponding utility value would be 0.09114 as shown in Figure
4.8 below.
from utility functionA
w=.062 u(y) = (.33 * 3) -. 5 =.49 y = 3See Figure 5.5
U3 = w3 *u3 *Y3 - .062*.49*3 = 0.09114
Figure 5.8: Criterion U value sample calculation
0.09114 is the utility value for the third criterion only, represented by U3. To
reach the project's U value, this process must be repeated for each of the remaining 12
criteria. The summation of all 13 criterion utility values (U1 through U1 3) results in a
single project U value (Uprojct). For example, Project 3 yielded criteria values of 0.711,
0.752, 0.056, -0.051, 0.867, -0.021, 0.138, 0.360, 0.960, 0.056, 0.504, 0.672, and -0.437
for a project utility value of 4.57. This study yielded project U values ranging from -0.27
to 13.28. Each project's U values were then averaged to yield a total utility value, or
threshold, for the entire study (UT). This threshold represents the collective input of the
experts and reflects a single value to which future projects can be compared. Figure 5.9
illustrates the hierarchical process undertaken to reach the total utility value [4].
Toto
Criteria Project
wI E UPrUojectl Uprojectl5 = uWl * Ul * Y1 = UI U, •U... U13 = Uprojec, 1 -41
IdtJ15
Figure 5.9: Hierarchical process used to reach Total Utility Value UT
5.4 Purpose and Use of Threshold Value
The framework described above yielded project utility values of 7.10, 9.76, 4.56,
5.20, 3.04, 6.65, 9.09, 6.78, 6.98, 6.82, 6.23, 13.28, -0.27, -0.07, and 0.15 for each of the
15 projects. Following the framework, the average of these project utility values yields a
total utility value of 5.69. This number, therefore, represents these 5 Navy experts'
current position with respect to importance of procurement method selection criteria,

26
their relationship to one another in the form of relative weights, and their personal
tolerance within a range of each criterion. Another way this can be expressed is to treat
the threshold value as a "Navy industry average". This is useful because future owners
can utilize this same framework to establish their own average. As more projects are
undertaken, the total utility value will track as appropriate to reveal the owner's true
threshold between Design-Build and Design-Bid-Build.
For example, the current Navy threshold (understanding that "the Navy" is being
represented by the 5 experts and 15 projects polled in this study) is 5.69 as stated earlier.
As future projects come about, Navy owners can score them as they see fit (assigning
individual y values to each of the 13 criteria), and the system will produce that project's
corresponding U value. This project U value will either be above or below the Navy
threshold. If the project is substantially below the threshold, then it is well suited for
Design-Bid-Build. On the other hand, if the project is well above the Navy total utility
value, it would serve the owner more to procure it via Design-Build. It is important to
note that this is a sliding scale, meaning that the further away from the threshold a future
project scores (either above or below) the more convincing it is to follow the procurement
method recommended.
5.5 Framework Recommendation vs. Actual Project Procurement Method
Figure 5.10 illustrates framework performance in recommending procurement
method. The threshold of 5.69 is clearly indicated by a solid green line. The clear area
Actual vs. Recommended Procurement
14.0012.00t10.00,a 8.00 •i•+0/2
~~ 8.0-•5.69
-2.00
1 2 3 4 5 6 7 8 9 10 11 12 13 14 15Project Number A DB U DBB Threshold
Figure 5.10: Actual vs. Recommended Procurement

27
surrounding the threshold is bound by +/- half of one standard deviation (a/2). Beyond
this clear area are red and blue regions corresponding to stronger recommendations of
DB and DBB, respectively. Projects falling in the clear area are close to the threshold
value and can be reasonably expected to be successful if procured by either method.
Overall, Projects 1, 5-7, 9, 11, and 12-15, or 67% of the projects were actually
procured by the same method recommended by the framework (i.e. had project utility
values above or below the threshold corresponding to either DB or DBB). Specifically,
75% of DB projects (Projects 1, 6, 7, 9, 11, and 12) agreed with the framework while
57% of DBB projects (Projects 5, and 13-15) also followed the recommendation. While
having two thirds overall support the framework lends credibility to the process, further
investigation reveals an even stronger result. In the areas beyond half of one standard
deviation, 85.7%, (Projects 5, 7, and 12-15) followed the framework. These are the areas
which the framework more strongly recommends a particular procurement method, as it
is further away from the midpoint where either method may be acceptable.
Nearly every project was either successful in its procurement method or poor
performance explained through one or more confounding factors. Specifically, the
projects located in the stronger areas of recommendations that followed the framework's
recommendation had acceptable performance. The owner of Project 12 indicated that
despite a tight budget and timeline, the Design-Build project had both successful design
and construction phases. Additionally, the owner of Projects 13, 14, and 15 did not
indicate any negative effects suffered during these projects. See Appendicies G-K for
expert comments on each project.
Project 2 is the only project that did not follow the framework outside of the clear
area. This project was actually procured using DBB means while the framework clearly
recommends DB for a project having a utility value of 9.7. The expert overseeing this
project reported serious problems with the performance of this project. Specifically, he
cited schedule delays and conflicts over design flaws and the need for change orders.
This project involved the renovation of an existing facility. Renovation projects
are often subject to numerous changes due to unforeseen conditions differing from what

28
was originally specified or thought to be true on design documents. The inflexibility
of the DBB contract to compensate for this fact resulted in low owner satisfaction and
overall poor contract performance. The fact that the one and only project that did not
follow the framework's recommendation suffered from poor performance even further
bolsters the credibility of the system.
It is important to note that the projects used to develop this framework were not
selected retrospectively based on their compliance with the study. Conversely, the
framework was established first, and the fifteen projects (which made up the entire
project database) were subsequently subjected to the process and the results calculated.
5.6 Confounding Factors
It is important to mention that simply following the procurement method
recommended as a result of following this framework does not guarantee project success.
There are several confounding factors external to procurement method that may
significantly influence a project's outcome. In this study, the majority of the projects
illustrated the standard strengths and weaknesses of their procurement type. According
to the project owners, most DB procured projects completed on time and were
sufficiently flexible to cope with varying design and site conditions. Furthermore, the
DBB procured projects often completed behind schedule, had greater communication
difficulties, and in extreme cases, were fraught with claims over design omissions and
differing site conditions.
Some projects used in this study, however, had confounding factors override the
standard procurement method parameters. For example, a boiler replacement project
procured via DB suffered from design omission discovered following project closeout.
Similarly, an armory renovation and decontamination project procured via DB suffered
from poor contractor performance in the form of a delayed start and subsequent late
finish. Finally, a DBB project to install a flightline fuel tank delivered a successful
product on time with minimal changes. These exceptions demonstrate that the
procurement method alone does not automatically deliver a successful project.

29
CHAPTER 6. RECOMMENDATIONS AND CONCLUSIONS
6.1 Results and Findings
Using U.S. Navy data, a total utility value, or threshold, was determined to be
5.69 based on 5 experts and 15 projects. While not intended to be all inclusive, this study
demonstrated a generic framework by which owners can follow to determine their own
threshold between Design-Build and Design-Bid-Build. As future projects come about,
owners can compare the new projects scores to their threshold to determine which
delivery method better suits their individual needs.
It was found that the framework successfully recommended either the DB or DBB
procurement method based on owner inputs. Within the boundaries of 5 experts and 15
projects this study's data set included, 67% of projects tested agreed with the system
regardless of distance from the threshold. Beyond half of one standard deviation, the
framework properly recommended 87% of the projects' actual procurement methods.
The sole project in this realm that did not follow the framework's recommendation
suffered from poor contract performance and low owner satisfaction.
6.2 Research Limitations
It is important to note that while this study has produced encouraging results, it
does have its limitations. Specifically, the study group utilized in this work consisted of
only five experts to represent the U.S. Navy, an extremely diverse owner. Additionally,
the project database consisted of 15 projects, only a minute fraction of the total projects
procured by this owner. This framework attempt to demonstrate method over individual
figures, as these figures will be different for each owner utilizing this methodology.
30
6.3 Recommendations
It is the recommendation of this study for owners to utilize the generic framework
developed herein to improve their procurement method selection and decision making
capability. By establishing a threshold unique to them, owners can quantify their
subjective biases on various procurement criteria. Furthermore, they can compare future
projects to this threshold to better select the procurement method that leads to project
success.
This framework can be improved through future extensions that subject a great
many more projects to this framework. By polling several owners spanning different
backgrounds, areas, and expertise in the construction industry, a large number of projects
inputted into this framework would yield an overall industry average for many different
construction sectors. This extension would add an additional benefit to the framework,
allowing owners to not only compare their future projects against their own threshold, but
against a threshold representing the sector of construction in which their project lies.
6.4 Research Conclusions
This study was successful in using utility theory to produce a potential frameworkto measure owner propensity toward either the Design-Build or Design-Bid-Build
procurement method. Its use will allow owners to quantify an often subjective process to
assist in procurement method decision making. It is fuilly tailorable to the owners' needs
and reflects owners' individual preferences toward their specific projects. The end result
is more informed owners who can better determine the proper procurement method best
suited to meet their needs.

31
REFERENCES
[1] Construction Industry Update, Project Delivery for the Public Owner, CI News,www.construction.org, Fall 2002.
[2] Carter & Burgess, Inc., Design-Build vs. Design-Bid-Build, Carter & Burgess'sQuarterly, Issue 2, 2002.
[3] Love, P.E.D., Skitmore, M, and Earl, G., Selecting a Suitable ProcurementMethod for a Building Project, Construction Management and Economics (1998)Volume 16, pp 221-233.
[4] Chang, Luh-Mann, Georgy, Maged E., and Zhang, Lei, Engineering ProductivityMeasurement, Construction Industry Institute, December 2001, pp 17-30, 123-162.
[5] Luu, Duc Thanh, Ng, S. Thomas, and Chen, Swee Eng, Parameters Governing theSelection of Procurement System - an Empirical Survey, Engineering,Construction, and Architectural Management, June 2003, Volume 10, Issue 3, pp209-218.
[6] Tyson Building Corporation, Design-Build, Design-Bid-Build and ContractManagement: How to select the one that is right for you!, IBSS Marketing,http://www.tysonbuilding.com/tysonhelp/delivery system.php, 2005.
[7] Quatman, G. William and Sell, Martin, Return of the Master-Builder: Designer-Led Design-Build, American Institute of Architects, June 2005.
[8] Design-Build Institute of America, An Introduction to Design-Build,www.dbia.org, April 2006.
[9] Ndekugri, I. and Turner, A. (1994). "Building Procurement by the Design andBuild Approach," Journal of Construction Engineering and Management, (120)2,243-256.
[10] Pietroforte, Roberto, and Miller, John B., "Procurement methods for USinfrastructure: historical perspectives and recent trends." Building Research andInformation, November 2002, Volume 30, Number 6, pp 425-434.

32
[11] Design-Build Institute of America, Industry Information, www.dbia.org, April2006.
[12] Songer, Anthony D., Molenaar, Keith R., and Robinson, Graham D., SelectionFactors and Success Criteria for Design-Build in the U.S. and U.K., University ofColorado, 1997.website: http://www.colorado.edu/engineering/civil/db/papers/usuk/
[13] Konchar, Mark and Sanvido, Victor, Comparison of US Project DeliverySystems, Journal of Construction Engineering and Management, Nov/Dec 1998,Volume 124, Number 6, pp 435-444.
[14] Ling, Florence Yean Yng, and Kerh, Shu Hui, Comparing the Performance ofDesign-Build and Design-Bid-Build Building Projects in Singapore, ArchitecturalScience Review, Volume 47, 2004.
[15] Hibberd, P. and Basden, A. (1996) The relationship between procurement andcontractual arrangements, in Proceedings of CIB-W92 Procurement SystemsSymposium, North Meets South, Developing Ideas, Durban, South Africa, 14-17January, pp. 639-646.
[16] Kumaraswamy, Mohan M. and Dissanayaka, Sunil M., Linking procurementsystems to project priorities, Building Research & Information, 1998, Volume 26,Number 4, pp. 223-238.
[17] Kumaraswamy, Mohan M. and Dissanayaka, Sunil M., Developing a DecisionSupport System for Building Project Procurement, Building and Environment,2001, Volume 36, Number 3, pp. 337-349.
[18] Distribution Tables, www.statsoft.com, Website as of 6/26/2006.
[19] Georgy, Maged E., Chang, Luh-Maan, and Zhang, Lei, Utility-Function Modelfor Engineering Performance Assessment, Journal of Construction Engineeringand Management, ASCE, May 2005, pp. 558-568.
[20] Baird, B. F., Managerial Decisions Under Uncertainty: an introduction to theanalysis of decision making., John Wiley & Sons, Inc., New York, NY, 1989.
[21] Georgy, Maged E., Utility-based Nerofuzzy Approach for EngineeringPerformance Assessment in Industrial Construction Projects, Ph. D. Dissertation,Purdue University, August 2000, p. 41.

Appendix A 34
0)
0)3- 06 Um 0C
-0 a~I i .F,
* tn 0) 00 C
-o "o
3
3 0
Q.
002o
-a..g s3 00
0 -
-• -'.4-..0,o
-I..00

Appendix B 34
3 5L
X IiX X 3P 5J5 __ _
-L F
0 z
xx x x i
_ 3- - - - ~, i5

Appendix C 3
PII
cI I I
91P1j. a I 1 62
E . S-L f < 1 ,, 11 t-ilii xx 111 ~[ip
Appendix D 36
II p~ QQ~. rng ~m~3Rt a 1 1Ii~G SL ~ 3
g~c~ -
us
'2 -FQ
[ zzI
Appendix E
37
I 49f Fl
IS
R__1 u
xxIt
N M g
Xq
x x Xi 0
X X 39J
Nzz
a

Appendix F 38
2i 1
c c
< <
z3 L
9t figst
Appendix G 39
g -n . 0 -v ;I- M'a 0
~0~' ~ 0D
ID I.30
C L 0 "I
w-
(3 c ca v -uq -uo, u (5 g 20
22 T 6;M'0
J. J. D cC
?S g0 ý 0
2o.~ @aS Owt (AtEr 8- 0 O
j )WOn U~ 8~8 r-- 08r
. =o =~ M WMC
EP CD~CD (ao =Dr
a0 -
~< 32=
V4 0. 0
0 LnCA 0 a
CLIDC
COO0
S0c 0)
EL a
CD
lu9

40
mm 05- -0 X'P* g
-n ) j
w CL R
m U)* - 5
-ngji
xx
x fo
x -
x Ir I
~.01

41
III ..
3 3
- 0
-4 -4
40 o to
0 x

42
-r T40 -
SXm
a _
" " 0 0
-4 J- -4 -4
0p 00 w( a*
xx to to to 40

43
0 0
a C
crcn mcn 3
r4
x w o o w
x a, a, & &
C" CA &%
S) X 0 ch a
-4 X -,4 - *4
a X Go G X a g ac
0 x 0 0 40 0 O
cn
x .a• a 8 a
C'.3

Appendix H 44
So• o .
0 CL
0 Tg~
fD
0 -. _ 8
MCI) -V T 0 - 0 0;
0 .0 " . 3r
8, •-•-u8 -- o-"-• ' " i. _
-8. m a .IS ID .
• ,o,8 O= ' 9 , 0!
R . - Ila
,8. ;r -8
a <0.
e", i:oo
0 03 , 0
-59.~~~ 9. C .m
LD.c
c" ~ ~ ~ ~ ~ I cnC " n C A n C
0 .ID I
0
• a,
45
ao 60
M . (A z
w EP
-cL
x -'a~a19
xx
4A
x x x ,u3 A
::11w [M
@ a-
hD s9 Yo~ S.9a a.

46
-. a.
Sg
C a L
ra
x~
gj
x x
x op xIG(4 (l U
* afu
3 SL
szia X aX

47
o I
I m
a. a a a
ۥA CAm
Ch 0 a xxxo
"-4 -4 -4 -4 -4
* X a a a
€cm x o a Go co
) 3
no a aD
Li
48
lu [
0. C$
x 4-4 -4 -4-
R 2
I EF
ST.~
SCL 'C C
S~J MH
=r ~ ( ' (c ) C
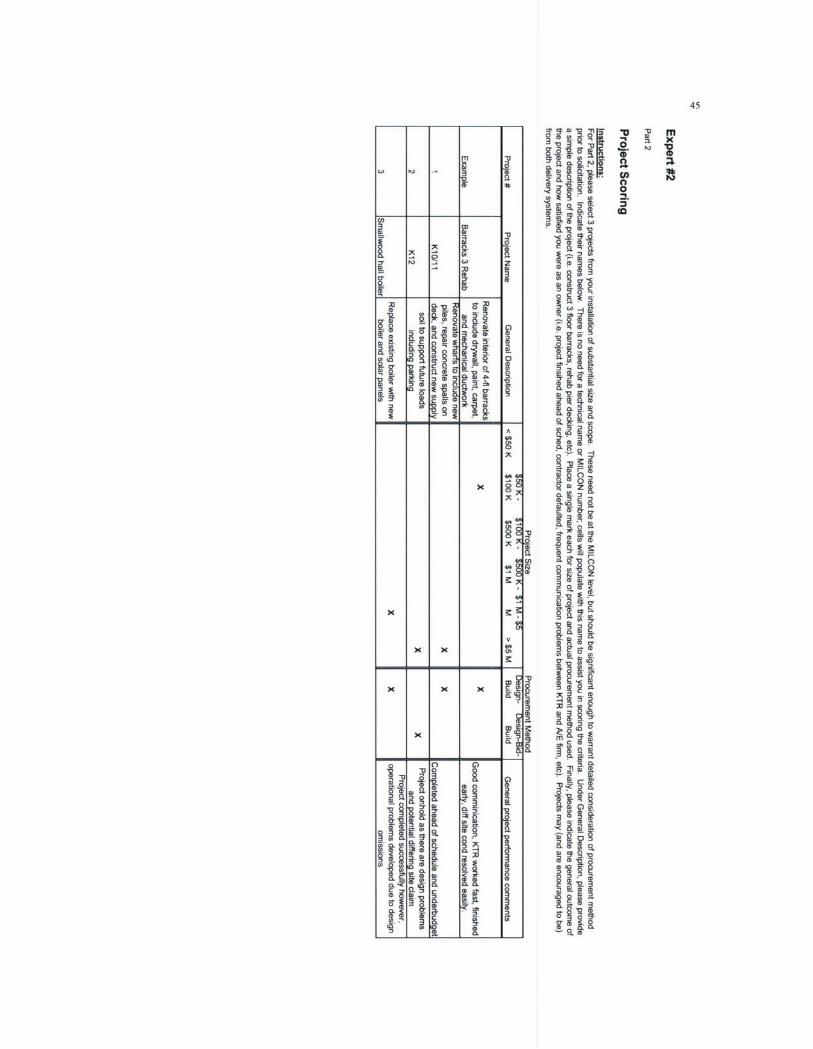
Appendix 1 49
0 5 00~ mu
00
2. 01
00
Cr 0
ID (D - :3 c
00
ara
0 0 0 0 D .9 0______ ___g_ 0uWW0U0V~U~.Q~QQ0Z C
0O5O5 ~ ~ so<
8 0 a0 0 ~ & w
CD 3)
0CO'
0 CO
.0c 0 ft5
(D 0-CO:) (
go
o0W
00
50
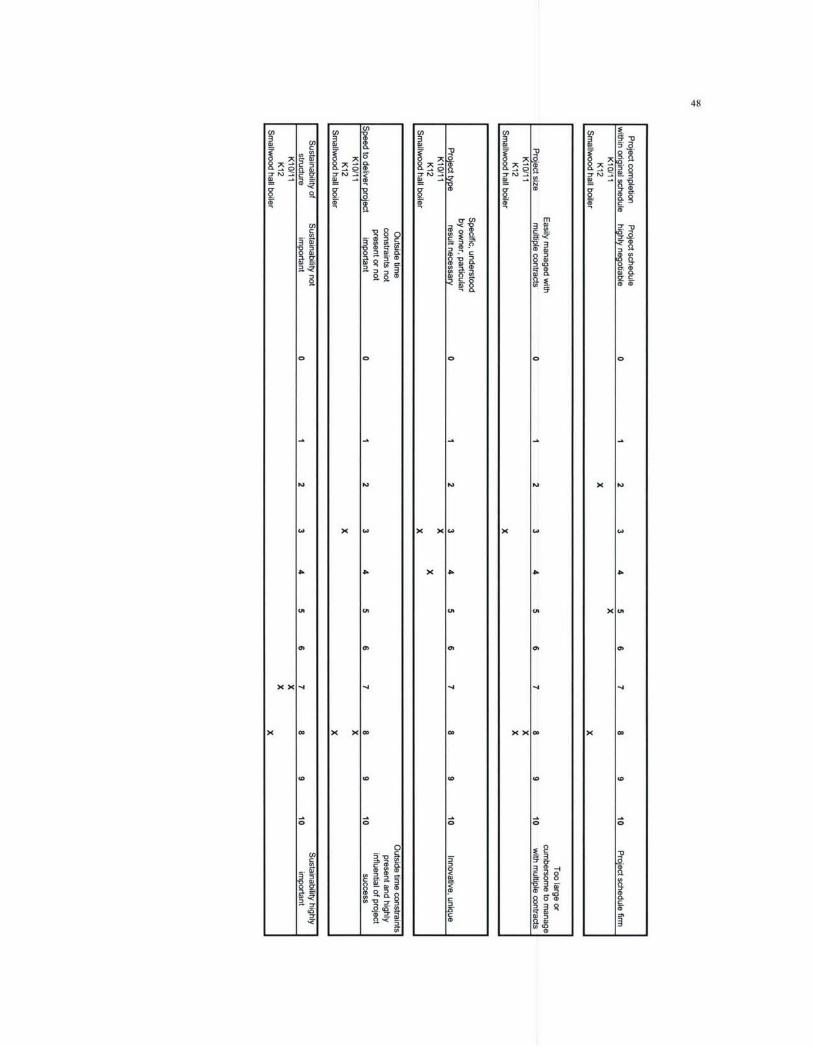
S0
CL N.
zO*3-
K .
x
v
12i 1 i I
x IicoI
-Tn >G5: M g .
c
D 43

C5'
Fil op iI j
~9 @
CC
x co x o
x co
§
CD

52
R cr
Ii
X- X XX X- ~ -
X x J X
to 0 X 0
(a IS
53
u iS M M
m
0
a co 0 a
-4 -4 xx- x-
Co.R
0 C0
L
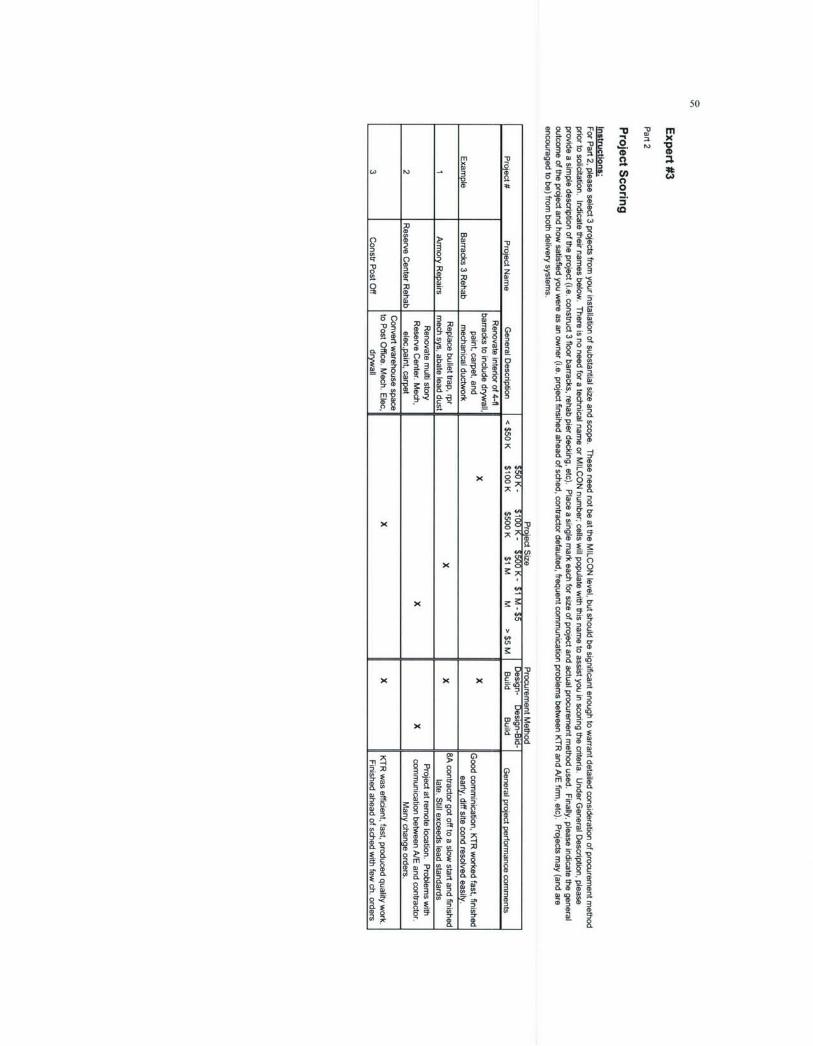
Appendix J 54
.3 3.
3 1.
C.,
00
00
_; m
-- R-. a') PMg.- -:S; 0 5 R. (D 0*' M 0 *_ _LTL7_ _Du_:E_ _ I tI
"0cg3 a = a
<~ 5
0C 00 -1cn. 0'
5'~~0 5,2 3E
co
~~0
; 0).05
0 a0 0
00

55
0 ~0Ru -4u'
5 k W 4 W z P
3 g a
4A0
; 0
VZ
x '4AM
K K KIn
~'~§S ~a'Zx x xs
SS

56
g !R 1. =
Lt~ r it
=r=
o a a
0
a- a, S
cfl th R
(D 5
co x OD
0
57
c 9., c ?=o o
0 -.
00
0 a
58
5,~13_ ~
co~
o 0 to m a I
to~
a x 4b
*4 XA -4 X X 3
0 0 30 30 x0
xx( x x 8 8 8
s0
w3
A3

Appendix K 59
II
vi*cn 0 03 U -n
12: Q 5wa
Q 3
aR A A
FL0
V _
60
m 'aI
40 ~0S j~ CL
3IL.
ýo 'm
x )( x
x
I IE0
61
81 q
y. 6.
C, iz 2 0.
0 0 0
c x
(-4
Jfg gD

62
lk V
~c
C CC CA
Im 3
x xx
63
U)3'a 40
~ ~-4
a* Go do a*c
co W to to
8
cn~ ~

Appondix L 64
5: aR ag
ag
(Af F (AqA- ("s
65
""s Es§' 9918 s 8 8 F S§ g
1. 1. .1 11 I1 11 .1 11 , II I I i .I II I II I 11 . 1 1 111 It 11 1 1. .. 1
x II I II x1, I I II x II I I I x x x II x I x II I II F x x II I IF x I II x F IF IF IF IF
5 51 1 IF I I I IF I IF IIF F F 5 I F IF IF IF IF I F IF IF 5: S: 9F I I F I F I F I I I F 1
11 1 11 11 1 11 1 . t 11 1 1 . 1 1 1 1
5bpI 6oo 9~ 6 po 9p P P P N P P P P P- 66 ~~- b -6bo6
'T F i R
II ~~~~~~ ~1 11I F I F I F I ~ I I I F IF I F I I I I I F I I I I I It 11 IF 11 11 IF 11 .1 it .1 11
ooo oo oo oo o oo ooo oo o oo oo oo aa
xH~, ~ ~ 3 O, *bx~ CCW x xxxxxxxx xxxxxxxx
. . 81, . t,, 8 .I.oo,.8"" ~ ~
66
6 6 6 p 68 8 0 st
, m i x i Ii , x II x x I I, I II I I I, I II I II I II I II I II I II I II I I II II II II x
I .I .I . .I .I .I .I .I . .I .I .I .I .I . .I .I .I .I .I .I . . . . . . . . . . . . . . . . .
0 0 0 0 0 0 0 0 0 0 0 0 0 0 0 0 0 0 0 0 0 0 0 0 0 0 0 0 0 . 6 . U.- . ý L L .6 .6
14 1 E 1. . . . .8&.. . . . .§.8. . . .A t
F0 0 S O w W f0 0 t W0 N ~ C F0 0 M 1 O fO 5:2:FS :f : FFFFS 05
6 + - - 6 6 6 6 + + *+++ 4 , , . +4
f89 1
II I II II II II 1 9 I II I II x I II I II I II I I' I II I II I x mI I II I II I II I II I II II I
ooox, o b xo 6 oo b~ x
0 6i ooo69oo6
";w 8
67
6 6 6 66 6 6 6 6 66 66 6 691 L1 "a L9 8
I ~ ~ ~ ~ ~ ~ 1 11 11 111, 11 11 I I I I II I I I I I II I I I F p n , F F F i
a p p o p - pi F F II I FIF I F I I I I I F I I IF I F I I F I F F I F II I I I
0 0 0 0 0 0 0 0 0 0 0 0 0 0 0 0 0 00 00 0 0 00 0
f I f I I I F 1 I:F II F EI FI II f: N I F F I f 1 IF F SI I IF F 5: N F I F I I I I F 1 1 1 I I
IF~~~~ :1 fF I5F5 I F I I I IF I IF I F I F I IF I IF I IF I I I FI I I F I F II I F I F F I F F
.1, 1 III I t IC
av2 ^ 9

68
!6 6,, , 4, 6 6 6 b 6++, 6 6 +L6+4LL+,6 6
.. t
18 II i OS 8F "1 19 II 8I II 8I I F I F I F I F I I I F I I I I U I I I I I F I F I F I I
51 f: FI :FF5 : f :5
6 ~ 60 1 -I I -0- - - wo66 E
0

69
k_-6 -- -6 P k - 6 P P6 6 6 6 6 p8
01 1. (
xb -b~ o o~ x xxx xxx xxx xxx xx x xxx xxx
II~ ~~~~~~~~~~ ~~~ ~~ -I -I -t -t -I -I -t -I -t -t -t -tI I I I I I I t I t I I ItI t I t I t I t
0000000000000 0000000000000 0000000000000
X X X X X .6~ .6 kC XI I IC I XX6 (I6 .6 IC6CICI IC6CIC6 XI C 6
R 73* ~ ~~ ~~ 12 II II I t I I I I I t I t I t I t it t I I t t I I I I N I t I I I t 1 1 1 t I
x~ ~ ~~5 x xxxxxxIxxxxx x
bboxo o~ -. xb o b o S b x xxxxxxxxxxx x
kt 6t aI 6t 6I 6t 6t ot kI 6I ot 6t 6I at It 6t It 6t 6t 6t 6t 6t 6t 6t 6I 6tI t I t I