2007 regional system plan - ky psc home cases/2007-00477/oci...2007 regional system plan 1 iso new...
TRANSCRIPT
2006 Regional System Plan 1 ISO New England Inc.
2007 Regional System Plan .
© ISO New England Inc.
October 18, 2007

2007 Regional System Plan i ISO New England Inc.
Table of Contents
List of Figures.......................................................................................v
List of Tables .......................................................................................vi
Section 1 Executive Summary .............................................................................1 1.1 RSP07 Results .................................................................................................................................4
1.1.1 Growth in Demand ...............................................................................................................4 1.1.2 Resource Adequacy..............................................................................................................5 1.1.3 Supply- and Demand-Side Capacity ....................................................................................5 1.1.4 Operating Reserves...............................................................................................................6 1.1.5 Fuel Diversity and Availability ............................................................................................6 1.1.6 Impacts of Environmental Emission Regulations ................................................................7 1.1.7 Status of Transmission Upgrades .........................................................................................7 1.1.8 Scenario Analysis .................................................................................................................9 1.1.9 Planning with Neighboring Systems ..................................................................................11 1.1.10 Planning Process...............................................................................................................11
1.2 Future Actions and Recommendations..........................................................................................12
Section 2 Introduction ........................................................................................14 2.1 ISO New England..........................................................................................................................14 2.2 The New England Bulk Power System .........................................................................................15 2.3 RSP Purpose and Requirements ....................................................................................................16 2.4 Features of RSP07 .........................................................................................................................19
Section 3 Forecasts of Annual and Peak Use of Electric Energy in New England...................................................................................21 3.1 Short- and Long-Run Forecasts.....................................................................................................21 3.2 Economic and Demographic Factors and Electric Energy Use.....................................................24 3.3 Forecast Methodology Review......................................................................................................25 3.4 Subarea Use of Electric Energy.....................................................................................................26 3.5 Summary of Key Findings.............................................................................................................29
2007 Regional System Plan ii ISO New England Inc.
Section 4 Resource Adequacy...........................................................................30 4.1 New England Systemwide Resource Adequacy............................................................................30
4.1.1 Installed Capacity Requirements........................................................................................30 4.1.2 Operable Capacity Analysis ...............................................................................................34
4.2 Subarea Resource Adequacy .........................................................................................................34 4.3 Summary .......................................................................................................................................34
Section 5 Capacity ..............................................................................................35 5.1 The Forward Capacity Market.......................................................................................................35
5.1.1 Annual Forward Capacity Market Auction ........................................................................35 5.1.2 Status of the Forward Capacity Market..............................................................................36
5.2 Demand-Side Resources................................................................................................................36 5.2.1 Capacity Available from Demand-Response Resources ....................................................36 5.2.2 Capacity Available from Other Demand Resources...........................................................38 5.2.3 Reflecting Wholesale Electricity Market Costs in Retail Electricity Prices.......................39
5.3 Generating Units in the ISO Generator Interconnection Queue....................................................39 5.4 Summary .......................................................................................................................................41
Section 6 Operating Reserves............................................................................42 6.1 Requirements for Operating Reserves...........................................................................................42
6.1.1 Systemwide Operating-Reserve Requirements ..................................................................42 6.1.2 Forward Reserve Market Requirements for Major Import Areas ......................................43
6.2 Types of Operating Reserves.........................................................................................................46 6.3 Demand-Response Reserve Pilot Program....................................................................................46 6.4 Summary of Key Findings.............................................................................................................47
Section 7 Fuel Diversity......................................................................................48 7.1 Fuel Mix of 2007 Installed Capacity .............................................................................................48 7.2 Fuels Used to Produce Electric Energy in 2006 ............................................................................49 7.3 Summary of Winter 2006/2007 Operations...................................................................................50
7.3.1 Pre-Winter Preparations .....................................................................................................50 7.3.2 Post-Winter Analysis..........................................................................................................51

2007 Regional System Plan iii ISO New England Inc.
7.4 The Need for Dual-Fuel Capacity .................................................................................................52 7.4.1 Summary of Existing Dual-Fuel Capacity .........................................................................52 7.4.2 Amount of New Dual-Fuel Operable Capacity Needed.....................................................52
7.5 Natural Gas Supply Risks and Strategies to Improve the Fuel Mix ..............................................55 7.5.1 Gas-Fired Generation in Neighboring Systems..................................................................55 7.5.2 LNG and Regional Pipeline Expansion..............................................................................55
7.6 Summary .......................................................................................................................................56
Section 8 Environmental Issues ........................................................................57 8.1 Air Emissions ................................................................................................................................57
8.1.1 U.S. EPA Clean Air Interstate Rule ...................................................................................58 8.1.2 OTC’s CAIR Plus...............................................................................................................58 8.1.3 OTC’s High Electric Demand Days for NOX Reduction ...................................................58 8.1.4 U.S. EPA Clean Air Mercury Rule ....................................................................................59 8.1.5 U.S. EPA Clean Air Visibility Rule ...................................................................................59 8.1.6 Regional Greenhouse Gas Initiative...................................................................................59 8.1.7 Major New State Air Regulations ......................................................................................61
8.2 Water Discharges ..........................................................................................................................62 8.3 Renewable Portfolio Standards, Energy-Efficiency Goals, and Related Requirements................62
8.3.1 Requirements of the New England States’ Renewable Portfolio Standards ......................63 8.3.2 Other New Renewable Resource Requirements.................................................................66 8.3.3 New Energy-Efficiency Requirements...............................................................................66 8.3.4 Compliance with Renewable Portfolio Standards ..............................................................67 8.3.5 ISO’s Projected Outlook for New RPS Requirements .......................................................67
8.4 Summary .......................................................................................................................................72
Section 9 Transmission Security and Upgrades ..............................................73 9.1 Basis for Transmission Security....................................................................................................73 9.2 Transmission Planning ..................................................................................................................74 9.3 Transmission System Performance and Needs..............................................................................74
9.3.1 Northern New England.......................................................................................................75 9.3.2 Southern New England.......................................................................................................82
9.4 Major Transmission Projects .........................................................................................................90 9.5 Transmission Improvements to Load and Generation Pockets .....................................................91
9.5.1 Major Load Pockets with Generating Units Needed for Maintaining Reliability ..............91 9.5.2 Transmission Plans to Mitigate the Need for Reliability Agreements
and Other Out-of-Merit Operating Situations ....................................................................94 9.6 Summary of Key Findings.............................................................................................................97

2007 Regional System Plan iv ISO New England Inc.
Section 10 New England Electricity Scenario Analysis.....................................98 10.1 Background .................................................................................................................................98 10.2 The Scenarios ............................................................................................................................100 10.3 Assumptions and Methodology.................................................................................................100 10.4 Key Themes of the Results........................................................................................................103 10.5 Scenario Analysis Conclusions .................................................................................................106
Section 11 Interregional Planning and Regional Initiatives ............................107 11.1 National Initiatives of the Energy Policy Act of 2005 ...............................................................107
11.1.1 U.S. DOE Study of National Interest Electric Transmission Corridors .........................107 11.1.2 Electric Reliability Organization Overview ...................................................................107
11.2 Interregional Coordination ........................................................................................................108 11.2.1 IRC Activities.................................................................................................................108 11.2.2 Northeast Power Coordinating Council..........................................................................109 11.2.3 Northeastern ISO/RTO Planning Coordination Protocol ...............................................110 11.2.4 Imports from Eastern Canada.........................................................................................111
11.3 Coordination among the New England States...........................................................................112 11.4 Summary of Interregional Planning ..........................................................................................113
Section 12 Conclusions......................................................................................114 12.1 Status of the Planning Process...................................................................................................114 12.2 Need for Resources....................................................................................................................115 12.3 Need for Demand-Side, “Clean,” and Renewable Resources ...................................................116 12.4 Need for Reliability and Fuel Diversity ....................................................................................116 12.5 Need for Transmission ..............................................................................................................117
List of Acronyms and Abbreviations..............................................118
2007 Regional System Plan v ISO New England Inc.
List of Figures
Figure 2-1: Key facts on New England’s bulk electric power system and wholesale electricity market. .............................................................................................................................16
Figure 2-2: RSP07 geographic scope of the New England bulk electric power system.....................18 Figure 3-1: New England annual load factor......................................................................................24 Figure 5-1: Capacity of generation-interconnection requests by RSP subarea...................................40 Figure 7-1: Generation capacity mix by primary fuel type, 2007, summer ratings, MW and
percentage. .......................................................................................................................49 Figure 7-2: New England electric energy production by fuel type, 2006, 1,000 MWh. ....................50 Figure 9-1: Northern New England summer-peak load distribution. .................................................76 Figure 9-2: Northern New England generation distribution. ..............................................................76 Figure 9-3: Typical northern New England summer-peak transmission flows. .................................77 Figure 9-4: Southern New England summer-peak load distribution. .................................................83 Figure 9-5: Southern New England generation distribution. ..............................................................83 Figure 9-6: Typical southern New England summer-peak transmission flows. .................................84 Figure 9-7: Reliability concerns in the southern New England region...............................................88

2007 Regional System Plan vi ISO New England Inc.
List of Tables Table 3-1 Summary of the Short-Run Forecast of New England’s Annual Use
of Electric Energy and 50/50 Peak Loads........................................................................21 Table 3-2 Summary of Annual and Peak Use of Electric Energy for New England
and the States ...................................................................................................................23 Table 3-3 New England Economic and Demographic Forecast Summary ......................................25 Table 3-4 Forecasts of Annual and Peak Use of Electric Energy in RSP Subareas,
2007 and 2016..................................................................................................................27 Table 3-5 Peak Use of Electric Energy for RSP Subareas, SMD Load Zones,
and the New England States ............................................................................................28 Table 4-1 Systemwide Monthly Peak-Load Forecast and ICRs, 2007 to 2008, MW ......................32 Table 4-2 Representative Future New England Installed Capacity Requirements and
Additional Installed Capacity Possibly Needed to Meet the Resource Adequacy Criterion, MW..................................................................................................................33
Table 5-1 Capacity Data Assumed for 2007 to 2008 Demand-Response Programs........................38 Table 5-2 Effectiveness of Adding Resources in Various Locations for Meeting
Systemwide LOLE Criterion for 2015/2016....................................................................41 Table 6-1 Representative Future Forward Reserve Market Requirements in Major
New England Import Areas, MW ....................................................................................44 Table 7-1 Projected New England Operable Capacity Situation, Winter 2007/2008
to 2011/2012 50/50 Peak-Load Forecast, MW ................................................................54 Table 7-2 Projected New England Operable Capacity Situation, Winter 2007/2008
to 2011/2012 90/10 Peak-Load Forecast, MW ................................................................54 Table 8-1 Summary of Technologies Designated in State Renewable Portfolio Standards ............64 Table 8-2 Renewable Portfolio Standards’ Required Percentages of Electric Energy Use
that Renewable Resources Must Provide Annually, %....................................................65 Table 8-3 Projected New England Requirements for Electricity Generation by Existing,
New, and Other Renewable Resources and Energy Efficiency Based on the ISO’s 2007 Forecast of Annual Electric Energy Use, GWh and %.................................69
Table 8-4 New England’s Projected RPS Requirements for “New” Renewable Resources, GWh.................................................................................................................................70
Table 8-5 New England Renewable Energy Projects in the ISO Queue..........................................71 Table 9-1 Generating Units Under or Pursuing Reliability Agreements .........................................95 Table 9-2 SMD Load Zones that Contain Generating Units that Are Not Under
Reliability Agreements but Have Received Significant Reliability Payments ................97 Table 10-1 The Seven Core Scenarios and Associated Sensitivity Analyses ..................................102

2007 Regional System Plan 1 ISO New England Inc.
Section 1 Executive Summary ISO New England Inc. (ISO) is the not-for-profit corporation responsible for the reliable operation of New England’s bulk power generation and transmission system. It also administers the region’s wholesale electricity markets and manages the comprehensive planning of the regional bulk power system. The planning process is open and transparent and involves advisory input from regional stakeholders, particularly members of the Planning Advisory Committee (PAC).1 Each year, the ISO prepares a comprehensive Regional System Plan (RSP). These 10-year plans include forecasts of future load (i.e., the demand for electricity measured in megawatts, MW) and how the system as planned can meet that demand by adding supply-side and demand-side resources and transmission.2 Each plan addresses systemwide needs and the needs in specific areas to ensure the reliability of the system, as well as compliance with national and regional planning standards, criteria, and procedures. Each plan also includes information that serves as input for improving the design of the markets and the economic performance of the system. In addition, these plans summarize the coordination of the ISO’s short- and long-term plans with neighboring systems as well as some initiatives and other actions the ISO, transmission owners (TOs), other market participants, state officials, policymakers, and other regional stakeholders can take to meet the needs of the system. The ISO’s 2007 Regional System Plan (RSP07) presents the results of the recent load, resource, and transmission studies of New England’s electric power system through 2016. The plan meets applicable North American Electric Reliability Corporation (NERC), Federal Energy Regulatory Commission (FERC), and the ISO’s Transmission, Markets, and Services Tariff requirements.3,4 It also builds on the comprehensive work completed in the 2006 Regional System Plan (RSP06), recertifies the applicable results, and provides updates as needed.5 Similar to RSP06, RSP07 accounts for uncertainties in assumptions about this period related to changing demand, fuel prices, technologies, market rules, environmental requirements, and other relevant variables. RSP07 documents many projects that were completed from 2006 through June 2007, as well as recent responses to market improvements that are proving to meet the system needs identified in RSP06. For example, 108 major transmission projects out of over 350 projects are nearing completion or have met significant approval or construction milestones. In particular, the first phase of NSTAR’s 1 The PAC, a regional forum for interested parties, helps the ISO assess and develop Regional System Plans and conduct studies on enhancing and expanding the system. PAC materials (2001–2007) are available online at http://www.iso-ne.com/committees/comm_wkgrps/prtcpnts_comm/pac/mtrls/index.html. 2 In general, supply-side resources are generating units that use nuclear energy, fossil fuels (such as gas, oil, or coal), or renewable fuels (such as water, wind, or the sun) to produce electricity. Demand-side resources are measures that reduce consumer demand for electricity from the bulk power system, such as by using energy-efficient appliances and lighting, advanced cooling and heating technologies, electronic devices to cycle air conditioners on and off, and equipment to shift load to off-peak hours of demand. It also includes using electricity generated on site (i.e., distributed generation or DG). 3 Information on NERC requirements is available online at http://www.nerc.com (Princeton, NJ: NERC, 2007). 4 The ISO operates under several FERC tariffs, including the ISO New England Transmission, Markets, and Services Tariff (hereafter cited as the Transmission Tariff) (2007), a part of which is the Open Access Transmission Tariff (OATT), and the Self-Funding Tariff. These documents are available online at http://www.iso-ne.com/regulatory/tariff/index.html. The OATT can be accessed online at http://www.iso-ne.com/regulatory/tariff/sect_2/index.html. 5 2006 Regional System Plan (hereafter cited as RSP06) (Holyoke, MA: ISO New England, October 26, 2006); available online at http://www.iso-ne.com/trans/rsp/2006/rsp06_final_public.pdf or by contacting ISO Customer Service at 413-540-4220.
2007 Regional System Plan 2 ISO New England Inc.
transmission upgrades into Boston was completed in early 2007, Phase 1 of the Southwest Connecticut upgrade was completed in October 2006, and Phase 2 of this upgrade is proceeding on schedule. Also, after a multi-year effort by the ISO, New England Power Pool (NEPOOL) participants, and state regulators to improve the design of the wholesale electricity markets, Phase II of the Ancillary Services Market project (reserve markets) was implemented in October 2006, and FERC approved the Forward Capacity Market (FCM) rules in spring 2007.6,7 A robust transmission planning process, combined with a sound market structure, not only ensures that future electricity needs can be met reliably and efficiently but also provides a solid foundation for the region to respond to policies related to the need for increased fuel diversity, reduced greenhouse gas emissions, and an increasing role for demand-side resources. The major findings and observations of RSP07 (and a reference to the sections that more fully discuss each finding) are listed below:
• Growth in Demand—The RSP07 10-year forecast for peak-load growth in New England is
1.7% per year, compared with the RSP06 forecast of 1.9%. Because the RSP07 load forecast is only slightly lower than the RSP06 forecast, many RSP06 results and conclusions that depend on the load forecast remain valid. (Section 3)
• Resource Needs—The Forward Capacity Market is expected to result in the development of sufficient resources to meet the region’s need for capacity. On the basis of existing capacity and assuming no retirements, an additional 60 MW of installed capacity (ICAP) would be required in New England by 2010, and a total of 3,500 MW would be required by 2016 to ensure that New England meets its resource adequacy criterion.8,9 (Section 4)
• Demand-Side Capacity—Conservation, energy efficiency, and demand-response resources, which can participate in the FCM, may reduce the need to construct or produce energy from supply-side resources and defer the need to expand the transmission and distribution systems.10 (Section 5)
6 NEPOOL was formed by the region’s private and municipal utilities to foster cooperation and coordination among the utilities in the six-state region and ensure a dependable supply of electricity. Today, NEPOOL members serve as ISO stakeholders and market participants. Information about NEPOOL participants is available online at http://www.iso-ne.com/committees/nepool_part/index.html#top (2007). 7 The Forward Capacity Market is a wholesale capacity market to encourage investment in demand and supply resources. The reserve markets procure operating reserves for producing power if required as a result of a contingency or if demand is much higher than forecast. Additional information on these markets is contained in the ISO’s 2006 Annual Markets Report (Holyoke, MA: ISO New England, June 2007) (hereafter cited as AMR06), http://www.iso-ne.com/markets/mkt_anlys_rpts/annl_mkt_rpts/index.html. 8 Installed capacity is the megawatt capability of a generating unit, dispatchable load, external resource or transaction, or demand-side resource that qualifies as a participant in the ISO’s FCM per the market rules. Additional information on the FCM is available online at http://www.iso-ne.com/markets/othrmkts_data/fcm/index.html. 9 The New England system must comply with Northeast Power Coordinating Council (NPCC) resource adequacy criterion, which states that the “probability (or risk) of disconnecting any firm load due to resource deficiencies shall be, on average, not more than once in 10 years.” Compliance with the criterion can be achieved, in part, through the procurement of adequate resources, assistance from neighboring systems, and the use of operating procedures designed to mitigate capacity deficiencies and more likely to be invoked during periods of extremely high loads or severe generator-outage conditions. Basic Criteria for the Design and Operation of Interconnected Power Systems, Document A-2 (New York: NPCC, May 6, 2004), https://www.npcc.org/publicFiles/reliability/criteriaGuidesProcedures/new/A-02.pdf. 10 Demand response in wholesale electricity markets occurs when market participants reduce their consumption of electric energy in exchange for compensation based on wholesale market prices. The ISO can request demand-response program participants to reduce demand to maintain system reliability (called reliability-activated demand response). Participants also can voluntarily reduce demand in response to high wholesale prices (called price-activated demand response) (see Section 5.2.1).

2007 Regional System Plan 3 ISO New England Inc.
• Operating Reserves—Adequate operating reserves are also needed to support reliable system operations. Fast-start resources, including demand response, are needed in transmission-constrained areas to improve system security and help reduce reliability costs to consumers.11 RSP07 projects the requirements for forward reserve in Greater Southwest Connecticut, Greater Connecticut, and BOSTON.12 These requirements will be met through the locational Forward Reserve Market (FRM). (Section 6)
• Fuel Diversity—The growth of natural-gas-fired generation since 1999 means that New England will continue to rely heavily on natural gas to meet the region’s need for electricity. A significant amount of this generation now has the ability to use an alternate fuel in the winter months when the use of natural gas to generate electricity directly competes with home heating needs.13 Additional conversions to dual-fuel capability would further promote system reliability. The growing state requirements for Renewable Portfolio Standards (RPSs) are increasing the need for and development of new renewable resources in the region, which will also assist in diversifying the region’s fuel supply. (Sections 7 and 8)
• Environmental Compliance—Emerging federal, state, and regional environmental regulations [i.e., the U.S. Environmental Protection Agency (EPA)’s Clean Air Interstate Rule (CAIR), the Regional Greenhouse Gas Initiative (RGGI), and RPSs] will require fossil fuel plants to decrease emissions of sulfur dioxide (SO2), nitrogen oxides (NOX), carbon dioxide (CO2), and mercury (Hg). These regulations will increase the demand for “clean” renewable sources of energy and demand-side resources. ISO analyses show that meeting these requirements will be challenging for the region. (Section 8)
• Transmission—Significant progress has been made over the past several years in developing, siting, and constructing new transmission infrastructure throughout New England. In the past five years, approximately $1 billion has been invested in new regional transmission projects that have been placed in service. Over 350 upgrades presently in the ISO’s planning process, which will go into service over the next several years, represent a currently estimated $4.4 billion in transmission system investment.14 These upgrades are required throughout New England to maintain system reliability, improve the efficiency of system operations, increase system transfer capabilities, serve major load pockets, and reduce locational dependence on generating units.15 RSP07’s assessment of the transmission system also can be used to develop market solutions (in place of proposed transmission upgrades) for meeting one or more of the same system needs. This could serve to replace or defer proposed transmission upgrades. (Section 9)
11 Fast-start resources can start up and synchronize to the system in less than 30 minutes. They help with recovery from contingencies and assist in serving peak load. 12 To conduct some RSP studies, the region is divided into various areas related to their electrical system characteristics. Greater Connecticut is an area that has boundaries similar to the State of Connecticut but is slightly smaller because of electrical system limitations near Connecticut’s borders with western Massachusetts and Rhode Island. Greater Southwest Connecticut includes southwestern and western portions of Connecticut. The BOSTON area (all capitalized) includes the city of Boston and northeast Massachusetts (see Figure 2-2). 13 Dual-fuel units have the flexibility and storage capacity to use fuel oil as well as natural gas. 14 The total cost of projects for which costs have been estimated ranges from $3.5 billion to $6.3 billion. Cost estimates have not been fully developed for all projects. 15 Load pockets are areas of the system in which the transmission capability is not adequate to import capacity from other parts of the system, and demand is met by relying on local generation (e.g., Southwest Connecticut and the Boston area).

2007 Regional System Plan 4 ISO New England Inc.
• Scenario Analysis—The ISO’s Scenario Analysis initiative provides tools for stakeholders to evaluate the economic, reliability, and environmental impacts that various resource technologies could have on meeting the future resource needs of New England. Studies conducted by the ISO through an open stakeholder process confirmed that reducing demand or supplying a significant amount of electric energy from low- or no-cost and low-emitting resources could lower electric energy prices and reduce air emissions. The results also showed that New England will continue to greatly depend on power produced by natural gas, and energy prices and air emissions will be strongly influenced by the relative costs of natural gas and oil. Additionally, the power sector will need to employ multiple strategies to meet the region’s challenging goals for the reduction of CO2 emissions. (Section 10)
• Interregional Planning—Through its ongoing participation in various interregional processes and studies, the ISO has been coordinating its planning activities on an interregional basis. The planning process will continue to evolve in response to emerging FERC requirements and the need to coordinate with other government entities, such as the New England States Committee on Electricity (NESCOE). Interregional planning efforts have been initiated to explore the system requirements relevant to allowing access to renewable energy sources in New York and eastern Canada. (Section 11)
1.1 RSP07 Results The following sections summarize the main RSP07 results that support the plan’s key findings.
1.1.1 Growth in Demand
The growth in demand drives the need for generation, transmission, and demand-side resources. New England’s summer peak demand is projected to grow at a compound annual growth rate (CAGR) of 1.7% from 2007 through 2016, or approximately 500 MW per year. The reduction in the projected growth rates from RSP06 is, in part, a function of the assumed increased prices for electricity capacity and the price of electric energy, which reflect the rate of inflation, including the cost of fuels. Also, the region’s increased penetration of air-conditioning load is a key contributor to the summer peak demand that occurs under hot and humid conditions. This has resulted in the annual load factor decreasing from 65% in 1985, to 62% in 2000, and to 56% by 2006.16 This means that the peak hourly load has been increasing relative to average load levels. The annual load factor is expected to continue to decline, further driving the need to add peaking capacity and demand response in the region (see Section 3).17 Alternatively, installing additional off-peak energy storage on the system, which would reduce demand during peak periods and increase demand during light-load periods, may be an economic strategy to increase the load factor and more fully use of the existing and planned electric power system infrastructure.
16 The annual load factor is the ratio of the average hourly load during a year to peak hourly load. 17 Relative to other types of resources, a peaking unit is designed to start up quickly on demand and operate for only a few hours, typically during system peak days, which amounts to a few hundred hours per year. These units (e.g., combustion turbines) tend to have relatively low capital costs but high production costs.
2007 Regional System Plan 5 ISO New England Inc.
In combination, the systemwide and subarea forecasts are only slightly different for RSP07 than for RSP06.18 Thus, many of the RSP06 results and conclusions that depend on the load forecast are still valid.
1.1.2 Resource Adequacy
With the timely addition of new resources, the region will meet established reliability criteria, decreasing the possibility of needing to implement emergency operating procedures that might involve disconnecting firm customers during periods of peak demand. The actual amounts, locations, timing, and characteristics of resource development are influenced by the markets, public policy initiatives, environmental regulations, growth in demand, and transmission system constraints. A review of the long-term resource adequacy of the subareas will be conducted later this year. The results of this review will reflect the new rules governing the FCM. Partly because RSP07’s load forecasts and estimated installed capacity requirements for New England are comparable with those of RSP06, the projected system resource needs are forecast to remain approximately the same. While the ISO is projecting adequate resources for New England through 2009 absent retirements, by 2010, an additional 60 MW of capacity would be required in New England to meet the resource adequacy criterion of disconnecting non-interruptible customers no more than once in 10 years. During the study period, again assuming no retirements, a total of 3,500 MW would be needed by 2016, if load and resource assumptions materialized as forecast. The most effective location to add capacity to meet the New England resource adequacy criterion remains Greater Connecticut, especially Greater Southwest Connecticut, because of its expected load, capacity, and limited transmission import capability.
1.1.3 Supply- and Demand-Side Capacity
The Forward Capacity Market will help ensure that New England has adequate resources to provide sufficient systemwide capacity. When properly sized and located, these resources also will be able to provide critical system support in areas with limited transmission capability, particularly in import-constrained load pockets. By design, the FCM will continue to encourage the development of resources in the desired quantity and locations of need. The 90 or so projects in the ISO’s Generator Interconnection Queue (the queue) totaling in excess of 10,500 MW (as of May 25, 2007) indicate that market signals are encouraging resource development.19 Because the Forward Capacity Auction (FCA) will be held more than three years in advance of the delivery period, future resources will be better known in advance, which will facilitate and improve the planning process. Demand-side resources also will play a key role in meeting New England’s resource needs. Demand resources are expected to grow, partly because they will be eligible for capacity payments according to the FCM rules. Several hundred demand resources, representing 2,449 MW (also as of May 25, 2007), have expressed interest in the first FCA, scheduled for February 2008. Additional alignments
18 Within New England, 13 subsets of the electric power system, called subareas, have been established to assist in modeling and planning electricity resources. These subareas reflect a simplified model of major transmission bottlenecks of the system, which are physical limitations of the flow of power that evolve over time because of the variety of system changes that occur. Refer to Section 2.2 for additional information. 19 The Generator Interconnection Queue includes the status and other information about requests made to interconnect proposed generators to the New England bulk power system. It is unlikely that all the projects in the queue will be commercially developed. (See Section 5.3 for further discussion of the queue.)

2007 Regional System Plan 6 ISO New England Inc.
between the wholesale market costs and retail electricity prices could further encourage the development of demand-side resources. Demand-side resources can reduce environmental emissions as well as the region’s reliance on expensive supplies of energy and investment in transmission and distribution infrastructure. Through several ISO programs and markets, demand-side resources provide a variety of services and receive compensation.
1.1.4 Operating Reserves
Beyond needing a certain amount of resources for reliably meeting the region’s demand for electricity, the system needs reserve resources that can maintain operational control. This control is needed to quickly respond to system contingencies related to equipment outages or to reduce peak demand that is higher than forecast. A lack of fast-start resources in transmission-constrained subareas could require the ISO to use more costly resources to provide these necessary services. In the worst case, reliability could degrade as a result of inadequate resources. The locational Forward Reserve Market is intended to encourage the development of fast-start and flexible demand-response resources in load pockets to meet these operating needs and reduce reliability payments.20 RSP07 shows the representative future FRM requirements for Greater Southwest Connecticut, Greater Connecticut, and BOSTON. The actual required amounts will depend on operating conditions and requirements, which will change in accordance with the market rules and the addition of transmission improvements. With approximately 4,300 MW of fast-start resources in the ISO’s Generator Interconnection Queue (as of May 25, 2007) and the recent increased development of demand resources, the system will likely have adequate types of new resources when and where they are needed and in sufficient amounts.
1.1.5 Fuel Diversity and Availability
Similar to the results for RSP06, which identified the risks related to disruptions in fuel-supply chains, RSP07 shows that New England continues to face potential reliability risks and exposure to high wholesale electric energy costs. The primary reason is that the region depends heavily on natural gas and oil to generate electricity. As the results from previous RSPs have shown, as the demand for electricity grows, the region must continue to find ways to reduce its reliance on natural gas. Or, it must increase the gas storage and transportation infrastructure to support the increased demand, particularly during winter peak-load conditions, when a heavy dependence on natural-gas-fired generation can coincide with the need for space heating with natural gas. These stresses on the natural gas delivery system continue to be a reliability concern. Significant progress has been made to improve system operations during the winter and to increase the region’s dual-fuel capability. New market incentives, such as those provided by the FCM, are designed to promote the availability of resources when needed most. These incentives have increased and should continue to increase the number of generators with dual-fuel generating capability or firm fuel supplies. Over the long term, upgrading and adding to the region’s natural gas infrastructure would also improve access to the natural gas supply. This could occur by building new liquefied
20 The rules for the locational FRM have changed since the 2006 Regional System Plan was published, and the RSP07 forecast is based on the updated rules. For additional information on the locational FRM, refer to AMR06.

2007 Regional System Plan 7 ISO New England Inc.
natural gas (LNG) import terminals (backed by firm gas supply-and-demand contracts) and by expanding existing intrastate, interstate, and international natural gas pipelines. Emerging environmental regulations will most likely stimulate the development of renewable energy sources and other alternatives, such as imports from eastern Canada or New York, to improve the fuel-diversity situation. The proportion of electric energy that renewable resources and energy efficiency will need to provide will increase from about 6% in 2007 to approximately 19% by 2016. To meet state requirements and emerging policy goals, new energy-efficiency programs would need to make up about 5% of the 19%. This increase is primarily due to Renewable Portfolio Standards and related policies in the New England states. This growth in the RPS requirements could be filled by additional projects being proposed for the queue, small “behind-the-meter” renewable projects, or the purchase of Renewable Energy Certificates (RECs) from projects in neighboring regions.21 Alternatively, load-serving entities (LSEs) will be able to make Alternative Compliance Payments to the states’ clean energy funds, which help finance new renewable projects.
1.1.6 Impacts of Environmental Emission Regulations
Federal, regional, and state environmental regulations being implemented over the next 10 years will directly affect the operation and planning of fossil-fueled electric generators throughout the northeastern United States. These regulations include the Regional Greenhouse Gas Initiative, which affects all six New England states as well as neighboring regions. By specifically encouraging the development of new renewable resources and other low-emitting resources or retrofitting existing resources, these regulations will affect the mix of fuels used to generate electricity. RSP06 and the Scenario Analysis (see Section 9) show that meeting New England’s allocation of RGGI’s carbon dioxide cap will be a challenge for the generators affected by RGGI. Stronger conservation and energy-efficiency measures, the addition of low- or zero-emitting baseload generation, or a combination of all these measures will be needed.22 The cost of buying RGGI allowances and offsets will likely be reflected in the wholesale electricity markets.23 ISO analyses show that meeting the RGGI cap allocated to the New England states will be challenging.
1.1.7 Status of Transmission Upgrades
The ISO, in consultation with transmission owners and input from stakeholders, continues to develop a number of major transmission-upgrade plans. These plans are designed to ensure the continued adequacy and security of the transmission system by aiming to reduce significant bottlenecks when transferring power into load pockets throughout New England and to relieve the dependence on local generation within these pockets. From 2002 to June 2007, 182 projects were completed, representing
21 A Renewable Energy Certificate represents the environmental attributes of one megawatt-hour of electricity from a certified renewable generation source for a specific state’s Renewable Portfolio Standard. Providers of renewable energy are credited with RECs, which are usually sold or traded separately from the electric energy commodity. 22 Baseload generating units satisfy all or part of the minimum load of the system and, as a consequence, produce electric energy continuously and at a constant rate. These units are usually economic to operate on a day-to-day basis. Intermediate-load generating units are used during the transition between baseload and peak-load requirements. These units come on line during intermediate load levels and ramp up and down to follow the system load that peaks during the day and is at its lowest in the middle of the night. (Peaking units are defined in Section 1.1.1.) 23 A CO2 allowance is a regulatory agency’s authorization under the RGGI CO2 trading program to emit up to one ton of CO2 (subject to limitations of the initiative). Offsets are reductions in greenhouse gas emissions in certain nonelectric sectors. These include reductions in landfill gas (LFG) emissions and sulfur hexafluoride (SF6) leaks, gas end-use efficiency savings, and afforestation. Generating units would need to recover the cost of buying RGGI allowances and offsets though the markets or other means.

2007 Regional System Plan 8 ISO New England Inc.
an investment of approximately $1 billion. As of June 2007, 44 of approximately 108 approved projects in the RSP07 10-year plan are currently under construction. Much progress has been made toward completing transmission upgrades identified in previous RSP reports, ranging from substation improvements to new 345 kilovolt (kV) circuits. Several major projects to add new 345 kV circuits are under construction or have been recently placed in service. These projects, consisting of transmission circuits, transformers, and substation equipment, include the following:
• Northeast Reliability Interconnection (NRI) Project—includes a new 144-mile, 345 kV transmission line and supporting equipment to connect the Point Lepreau substation in New Brunswick, Canada, to the Orrington substation in northern Maine. This international tie line, 84 miles of which are in Maine, is designed to increase transfer capability from New Brunswick to New England by 300 MW. The scheduled in-service date for this project is December 2007.
• Northwest Vermont Reliability Project—addresses the reliability needs in the northwestern area of Vermont. The new 36-mile, 345 kV line connecting the West Rutland substation to a new 345 kV substation in New Haven, Vermont, was energized early in 2007. The project also includes a new 28-mile, 115 kV line, additional phase-angle regulating transformers (PARs), dynamic voltage-control devices, and static compensation. Various 115 kV components of this project have been already placed in service, and others are scheduled for 2008 and 2010.
• Boston 345 kV Transmission Reliability Project24—addresses the reliability needs in the Boston area and increases the Boston-import transfer capability by approximately 1,000 MW. This project includes the construction of a 345 kV substation in Stoughton and the installation of three new underground 345 kV lines: one 17-mile cable to K Street substation, one 11-mile cable to Hyde Park substation, and then a second 17-mile cable to K Street substation. The first portion of this reliability project was completed in 2007; the final cable is currently scheduled to be completed in 2008.
• Southwest Connecticut Reliability Project—addresses the reliability needs in Greater Southwest Connecticut, including the need to address operating constraints and impediments to interconnecting new generation. Phase 1 includes a 20-mile 345 kV circuit from Bethel to Norwalk, which was put in service in 2006. Phase 2 includes a 70-mile 345 kV circuit from Middletown to Norwalk, which is planned to be put in service in 2009. Southwest Connecticut also requires a pair of new 115 kV lines from Norwalk to Glenbrook, planned to be in service in 2008.
In addition to the major 345 kV projects highlighted above, transmission studies and projects are ongoing for all six New England states. Studies for southern New England have identified a series of projects, referred to as the New England East–West Solution (NEEWS), which comprehensively address a number of significant long-term reliability issues affecting Connecticut, Rhode Island, and the Greater Springfield area in western Massachusetts. These projects aim to integrate eastern and western New England and allow for the increased power flow across these areas, which would increase the transmission security of these areas. Two groups of projects, the Greater Rhode Island
24 This project is otherwise known as the NSTAR 345 kV Transmission Reliability Project.

2007 Regional System Plan 9 ISO New England Inc.
Transmission Reinforcements and the Springfield 115 kV Reinforcements, have been identified to improve system reliability in the near term, while the longer-term NEEWS projects are being designed and implemented. A possible new interconnection with Maine Public Service (MPS), which could provide access to wind energy and additional Canadian imports, and short- and long-term improvements for the lower southeastern Massachusetts (SEMA) area are two of many transmission projects for the region (as discussed in Section 9). These projects, along with others in the Transmission Projects Listing, will bring significant reliability benefits to the system while providing a platform to support efficient and effective wholesale power markets.25 These planning efforts have been coordinated with neighboring regions, and additional work has begun to investigate increasing the import capability from the eastern Canadian provinces. The development of renewable resources in remote areas of the system may require further transmission improvements.
1.1.8 Scenario Analysis
In theory, many options are available for satisfying New England’s electricity needs. Among them are ways to reduce demand, such as to increase the use of more efficient electrical appliances and equipment or to install devices that cycle appliances on and off during peak hours or shift load to off-peak hours. To increase supply, the region can build additional supply-side infrastructure, such as new transmission lines that will allow more power to be imported. It can also add generation, such as nuclear plants, new gas-fired plants, or new-technology coal plants, and renewable resources, such as wind farms and solar photovoltaic (PV) projects. While some of the technologies may come about naturally as a result of market forces, others may require a change in public policy to encourage their development. To help clarify some of the economic, reliability, and environmental impacts of various technologies on the New England power system, the ISO sponsored a regionwide initiative, the New England Electricity Scenario Analysis. For over eight months beginning in fall 2006, the ISO worked with a Steering Committee, a number of focused working groups, and a plenary group made up of over 100 representatives from the ISO, utility and environmental regulators from the New England states, market participants, environmental and efficiency advocates, and other interested stakeholders. Together, these participants identified and analyzed a number of supply- and demand-side resource scenarios, each revolving around a particular type of technology. The ISO’s intention for the Scenario Analysis was to present a one-year snapshot of a comparable set of diverse configurations and impacts that might reasonably be expected to occur if one electric technology were pursued over another. The aim of the analysis was to show how various technology outcomes could differ, as opposed to showing realistic outcomes. The initiative also aimed to provide a public venue for examining and discussing how the various ways of supplying electricity to the region that were presented in the analysis could affect the costs to provide power, the system’s overall reliability, and the environment. Another goal was to provide information and data that regional policymakers and other stakeholders could consider as they develop policies and investments and take other actions in the near term that can affect New England’s electricity markets, power system
25 The Transmission Projects Listing is a summary of needed transmission projects for the region. Information about the RSP07 Transmission Projects Listing, July 2007 Update, can be accessed online at http://www.iso-ne.com/trans/rsp/index.html.

2007 Regional System Plan 10 ISO New England Inc.
reliability, environmental performance, and ability to meet consumer electricity needs in the long term. The Scenario Analysis did not predict what the future would look like in New England or prescribe one particular scenario over another.26 Rather, it presented a range of results for the different technologies. Furthermore, the analysis did not consider a full economic model of the region that would encompass overall regional economic development, demographic changes, job impacts, patterns of urbanization, technological innovation, and the adoption of electrotechnologies.27 Although the analysis presented a variety of economic results for comparison, it was not a least-cost plan or multi-year, present-worth analysis, and it did not include a “feedback loop” that accounted for how consumers or investors would react to these different sets of circumstances presented. Additionally, the analysis did not identify “right” or “wrong” technologies, attempt to build consensus about “preferable” technologies or outcomes, or develop a plan for what the region should or will do. Based on the assumptions and other inputs developed with stakeholders, the results of the Scenario Analysis include the following:
• New England will continue to depend on natural-gas-fired electricity production for a large percentage of its electric energy.
• Energy prices and air emissions will be strongly influenced by the relative costs of natural gas and oil.
• The power sector will need to follow various strategies to meet the region’s challenging goals for reducing CO2 emissions.
The Scenario Analysis produced volumes of detailed information about the economic, reliability, and environmental impacts of the various technologies on the region’s future electric power system and how these impacts change under different sets of assumptions.28 Potential users may access the data to gain a more complete view of the estimated impacts of the seven core scenarios and the many sensitivity analyses performed on them. Readers who want to use the results of the Scenario Analysis to carry out further investigations can use a spreadsheet tool posted on the ISO’s Web site.29 With this tool, stakeholders can “mine” the information, undertake other investigations, and explore the impacts of making different assumptions. The spreadsheet tool allows the user to adjust, for example, “post-processing” assumptions about capital costs of the generating resource or demand-side measures, needs and costs of the transmission and distribution systems, and the costs of controlling emissions. The user, however, cannot rerun the production simulation model with different assumptions. The spreadsheet on the Web site is
26 Consistent with its mission, the ISO remained neutral in depicting the technologies and avoided taking a position on any technology outcome. It selected simplifying modeling assumptions and approaches to provide insights into the issues rather than specific approaches to developing any specific technology. 27 Other entities may be able to analyze these other factors using the results of this Scenario Analysis. 28 The full report and all the results and presentations are available online at the ISO’s Web site, “Scenario Analysis Stakeholder Working Group Materials” (2007), http://www.iso-ne.com/committees/comm_wkgrps/othr/sas/mtrls/index.html. 29 The data-extraction spreadsheet tool and user guide are available online at http://www.iso-ne.com/committees/comm_wkgrps/othr/sas/mtrls/sprdsheet/index.html.

2007 Regional System Plan 11 ISO New England Inc.
accompanied by instructions to assist users in understanding the capabilities of the tool and the assumptions that users will be able to change.
1.1.9 Planning with Neighboring Systems
Planning across interregional boundaries has successfully continued through the ISO’s participation in Northeast Power Coordinating Council (NPCC) activities and the implementation of the Northeastern ISO/RTO Planning Coordination Protocol.30,31 Some of the benefits have included improved reliability and efficiency of generator interconnections close to regional boundaries. With neighboring systems, the ISO completed several studies of resource adequacy and cross-border transmission reliability, including loss-of-source contingencies in New England that considered the loss of more than 1,200 MW on the Phase II high-voltage direct-current (HVDC) interconnection with Québec. Other studies of the interregional grid’s overall fuel mix and common concerns of the risks to fuel-supply chains also have been completed. The group also evaluated the sharing of capacity resources with neighboring systems throughout the northeastern United States and eastern Canada. A follow-up analysis is examining the impact that system improvements could have on the loss-of-source contingencies. The expansion of wind and hydro resources in eastern Canada and New York may provide an opportunity for additional exports to New England in the long term. This is consistent with the goals of the Northeast International Committee on Energy (NICE), which has sought to reduce the overall emissions of greenhouse gases and to facilitate increased transfers of electrical energy.32 A study of these issues will be initiated in late 2007 or 2008. The ISO is continuing to pursue numerous activities to improve the adequacy, reliability, and security of the system. These include national initiatives mandated by the Energy Policy Act of 2005 (EPAct) and interregional and systemwide planning efforts.33
1.1.10 Planning Process
Aspects of the ISO’s planning process, including planning methods to reflect demand-side resources, the process for transmission owners to develop local improvements, and dispute resolution, are also being refined as part of FERC Order 890.34 On June 28, 2007, ISO New England and the New England transmission owners participated in a FERC technical conference to describe the planning process in New England, during which they highlighted their recent successes and areas for continued refinement. One key to success is the active involvement of public officials and state agencies in the planning process. To enhance their participation, the six New England states have proposed forming the regional state committee, NESCOE. 30 Additional information on NPCC is available online at http://www.npcc.org/ (New York: NPCC Inc., 2007). 31 An RTO is a Regional Transmission Organization. 32 NICE consists of representatives from the New England Governors and the Eastern Canadian Premiers (NEG/ECP). Additional information about NICE is available online as follows: 1) the NEG Conference Inc. Web site, “New England Governors’ Conference Programs, NEGC Energy Programs,” http://www.negc.org/energy.html, and 2) NEG/ECP Resolution 31-1 of the 31st Conference of New England Governors and Eastern Canadian Premiers, Resolution Concerning Energy and the Environment (Brudenell, Prince Edward Island: NEG/ECP, June 26, 2007), http://www.negc.org/documents/NEG-ECP_31-1.pdf. All accessed August 28, 2007. 33 Energy Policy Act of 2005, Pub. L. No.109-58, Title XII, Subtitle B, 119 Stat. 594 (2005) (amending the Federal Power Act). 34 Preventing Undue Discrimination and Preference in Transmission Service, Final Rule, 18 CFR Parts 35 and 37, Docket Nos. RM05-17-000 and RM05-25-000, Order No. 890 (Washington, DC: FERC, February 16, 2007), http://www.ferc.gov/whats-new/comm-meet/2007/021507/E-1.pdf.

2007 Regional System Plan 12 ISO New England Inc.
1.2 Actions and Recommendations The region will need to undertake a number of actions to ensure that all the necessary improvements identified in RSP06 and RSP07 analyses for providing a reliable, economic, and more robust electric power system in New England are implemented over the next 10 years. These actions will involve the development of market incentives, where appropriate, and proactive decision making and cooperation among ISO New England, other ISOs and RTOs, state officials, regional and environmental policymakers, transmission owners, and other market participants and stakeholders. The ISO recommends the following steps be taken not only by the ISO but also by policymakers and stakeholders:
• Resource Development—Encourage the development of resources through the Forward Capacity Market and the locational Forward Reserve Market. In the short term, add dual-fuel, fast-start resources and demand resources, especially in Greater Connecticut, to satisfy both the systemwide requirements and the load-pocket needs; make more efficient use of existing transmission and generation infrastructure; and reduce out-of-merit commitment of units and congestion costs.35 Upon completion of the Southwest Connecticut Reliability Project, promote the interconnection of resources in the northern and western parts of Southwest Connecticut.
• Use of System Resources—Provide signals for encouraging more demand response and energy efficiency, which would improve the reliable operation of the system, decrease costs to consumers, and decrease generator air emissions. Promote conservation, energy efficiency, and demand response directly to residential, commercial, and industrial customers. Increasing the system’s annual load factor would result in the more full use of the existing and planned electric power infrastructure.
• Fuel Diversity and Availability—Monitor the success of market mechanisms and environmental regulations to determine the most effective actions for diversifying the fuels used to generate electricity in New England. Provide incentives through the FCM and locational FRM for investing in dual-fuel, fast-start resources in locally constrained areas. Develop diverse energy technologies, such as renewable sources of energy, distributed generation, imports from eastern Canada and New York, and new coal and nuclear technologies.
• Gas Supply—Identify the requirements for new natural gas supplies, and expand the delivery capability of the natural gas system. Add LNG import and storage facilities to meet the overall increased demand for natural gas in New England, and facilitate the availability of natural gas supply to gas-fired generation.
• Seasonal Availability of Natural-Gas-Fired Resources—Continue working with the Northeast Gas Association (NGA) to coordinate electric and gas system operations and planning activities and refine ISO operating procedures. Assess the arrangements for firm procurement and transportation of natural gas, and expand the operability of dual-fuel units.
35 Out-of-merit commitment of units refers to the dispatching of capacity (in megawatts) that is more expensive than the marginal, price-setting, supply offer.
2007 Regional System Plan 13 ISO New England Inc.
• Regional Environmental Goals—Develop zero- or low-emitting resources, such as renewable resources and “clean” demand-side resources, to ensure that the region meets national, regional, and state environmental and renewable resource requirements.
• Transmission Projects—Work with transmission owners to complete the transmission improvements identified in RSP07 in a timely manner, which will improve the New England transmission infrastructure and maintain power system reliability in accordance with federal and regional standards over the next 10 years. Update the Transmission Projects Listing as new improvements are identified and projects are completed or eliminated from the listing. Improve estimates and updates of project costs to facilitate decision making about the projects and the development of viable alternatives.
• Coordination and Joint Planning with Neighboring Systems—Work closely with other
control areas to improve the coordination of planning efforts.36 Over the long term, conduct joint planning studies and improve the ability to import power from and export power to the eastern Canadian provinces and New York. Support the Northeast International Committee on Energy sponsored by the Conference of New England Governors and Eastern Canadian Premiers as the group explores initiatives concerning energy and the environment. Participate in national and regional activities, including those of the U.S. Department of Energy (DOE) and NERC.
• National Electric Reliability Organization (ERO) and Regional Reliability Organization
Standards—Ensure that the ISO meets specific mandatory reliability standards to maintain the reliable and secure operation and planning of the bulk power system. For the ISO and its participants, comply with all required reliability standards through the NPCC Reliability Compliance and Enforcement Program.
• The Planning Process—Implement requirements of Order 890 and work with NESCOE, once established, and other stakeholders. In the interim, work with representatives of the New England states, primarily through the PAC, but also through other designated representative organizations, such as the New England Conference of Public Utilities Commissioners (NECPUC) and the New England Governors’ Conference (NEGC). Focus planning efforts on the incorporation of demand resources and renewable resources and on market-efficiency needs of the region to reduce costs and use existing resources more efficiently.
36 A control area is an electric system bounded by interconnection metering and communication systems that can control generation to maintain an import-export schedule with other control areas and contribute to regulating the frequency of the interconnection.

2007 Regional System Plan 14 ISO New England Inc.
Section 2 Introduction This report describes the annual Regional System Plan (RSP) for the area served by ISO New England (ISO). This plan discusses the projected annual and peak demand for electric energy for the next 10 years, the need for resources over this period, and how incentives associated with recent improvements to the markets can assist in providing these resources. The report also covers fuel-diversity issues, provides an environmental assessment and update, and summarizes the major regional Scenario Analysis initiative that compared how various technologies could affect New England’s future resource needs. The report addresses the need for, as well as the status of, planned transmission improvements and interregional planning and summarizes the planning work being conducted by the northeastern Independent System Operators (ISOs) and Regional Transmission Operators (RTOs) and eastern Canadian control areas.37 The comprehensive 2006 Regional System Plan (RSP06) provided information on the need for, as well as the amount, type, and location of, demand-side and supply-side resources.38,39 RSP06 also discussed the need for transmission upgrades. With relatively few changes in system needs identified over the past year, RSP07 builds on the 2006 plan by either recertifying the results from RSP06 or providing specific updates to the system plan. This section provides an overview of the bulk power system in New England and the role of the RSP in identifying system enhancements required to ensure the reliability and efficiency of the system. It also summarizes the key features of this year’s plan.
2.1 ISO New England The ISO is the not-for-profit Regional Transmission Organization for the six New England states. The ISO has three main responsibilities, which are as follows:
• Reliable day-to-day operation of New England’s bulk power generation and transmission system
• Oversight and administration of the region’s wholesale electricity markets
• Management of a comprehensive regional bulk power system planning process
37 A control area is an electric system bounded by interconnection metering and communication systems that can control generation to maintain an import-export schedule with other control areas and contribute to regulating the frequency of the interconnection. Further information is available online at the Northeast Power Coordinating Council (NPCC) Web site in NPCC Control Area Certification Process (New York: NPCC Inc., n.d.), http://www.npcc.org/default.cfm and http://www.nerc.com/. 38 2006 Regional System Plan (hereafter cited as RSP06) (Holyoke, MA: ISO New England, October 26, 2006); available online at http://www.iso-ne.com/trans/rsp/2006/rsp06_final_public.pdf or by contacting ISO Customer Service at 413-540-4220. 39 In general, supply-side resources are generating units that use nuclear energy, fossil fuels (such as gas, oil, or coal), or renewable fuels (such as water, wind, or the sun) to produce electricity. Demand-side resources are measures that reduce consumer demand for electricity from the bulk power system, such as by using energy-efficient appliances and lighting, advanced cooling and heating technologies, electronic devices to cycle air conditioners on and off, and equipment to shift load to off-peak hours of demand. It also includes using electricity generated on site (i.e., distributed generation or DG).

2007 Regional System Plan 15 ISO New England Inc.
Approved by the Federal Energy Regulatory Commission (FERC) in 1997, the ISO became an RTO in 2005. In this role, the ISO has assumed broader authority over the daily operation of the region’s transmission system and greater independence to manage the region’s electric power system and competitive wholesale electricity markets. The ISO works closely with state officials, policymakers, transmission owners, other participants in the marketplace, and other regional stakeholders to carry out its functions.
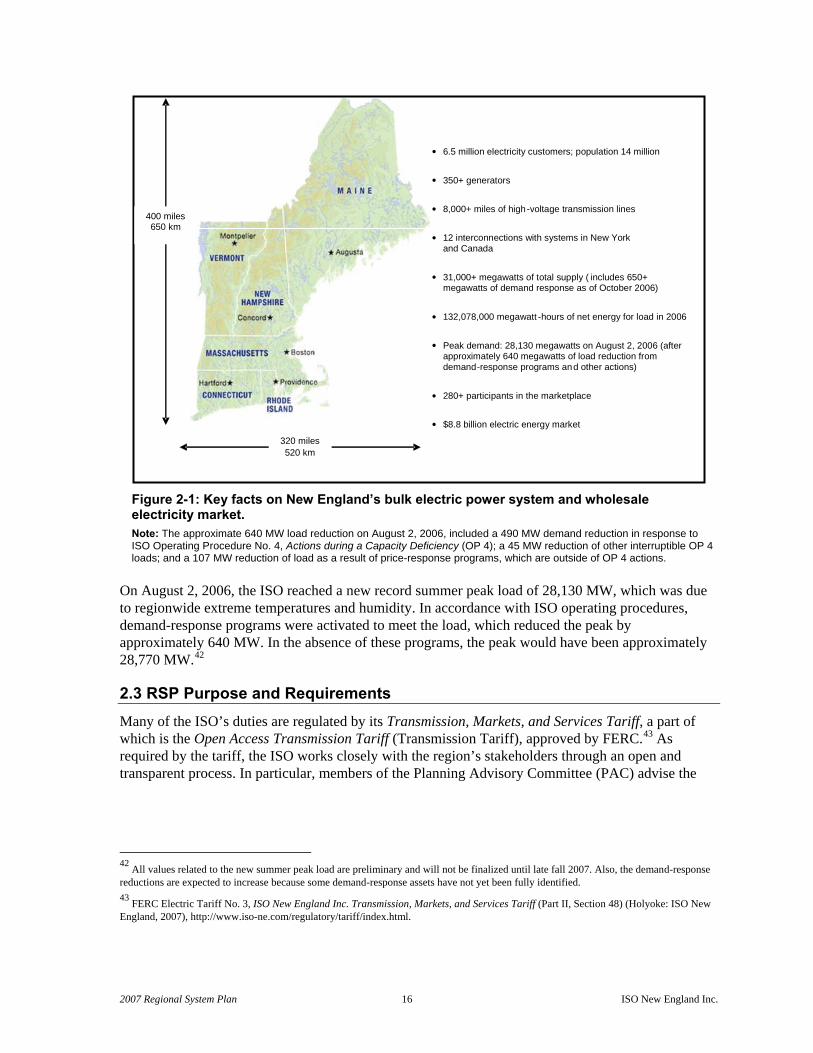
2.2 The New England Bulk Power System The New England Power Pool (NEPOOL) created New England’s electric power grid and its central dispatch system in 1971.40 The New England system is fully integrated and uses all regional generating resources to serve all regional load (i.e., the demand for electricity measured in megawatts, MW) independent of state boundaries. Most of the transmission lines are relatively short and networked as a grid. Therefore, the electrical performance in one part of the system affects all areas of the system. As shown in Figure 2-1, the New England regional electric power system serves 14 million people living in a 68,000 square-mile area. More than 350 generating units, representing approximately 31,000 MW of total generating capacity, produce electricity. Most of these facilities are connected to approximately 8,000 miles of high-voltage transmission lines. Twelve tie lines interconnect New England with its neighbors, New York and New Brunswick and Québec, Canada. As of summer 2007, nearly 1,000 MW of demand resources are registered as part of ISO’s demand-response programs. Customers in these programs reduce load quickly to enhance system reliability or in response to price signals, in exchange for compensation based on wholesale electricity prices (see Section 5.2.1).41
40 NEPOOL was formed by the region’s private and municipal utilities to foster cooperation and coordination among the utilities in the six-state region and ensure a dependable supply of electricity. Today, NEPOOL members serve as ISO stakeholders and market participants. More information on NEPOOL participants is available online at http://www.iso-ne.com/committees/nepool_part/index.html#top (2007). 41 The over 1,000 MW quantity does not include the demand response provided by other customer-based programs that are outside the ISO markets or control (i.e., other demand resources, ODRs) (see Section 5.2.2).
2007 Regional System Plan 16 ISO New England Inc.
• 6.5 million electricity customers; population 14 million
• 350+ generators
• 8,000+ miles of high-voltage transmission lines
• 12 interconnections with systems in New York and Canada
• 31,000+ megawatts of total supply ( includes 650+ megawatts of demand response as of October 2006)
• 132,078,000 megawatt -hours of net energy for load in 2006
• Peak demand: 28,130 megawatts on August 2, 2006 (after
approximately 640 megawatts of load reduction from demand-response programs an d other actions)
• 280+ participants in the marketplace
• $8.8 billion electric energy market
400 miles 650 km
320 miles 520 km
Figure 2-1: Key facts on New England’s bulk electric power system and wholesale electricity market. Note: The approximate 640 MW load reduction on August 2, 2006, included a 490 MW demand reduction in response to ISO Operating Procedure No. 4, Actions during a Capacity Deficiency (OP 4); a 45 MW reduction of other interruptible OP 4 loads; and a 107 MW reduction of load as a result of price-response programs, which are outside of OP 4 actions.
On August 2, 2006, the ISO reached a new record summer peak load of 28,130 MW, which was due to regionwide extreme temperatures and humidity. In accordance with ISO operating procedures, demand-response programs were activated to meet the load, which reduced the peak by approximately 640 MW. In the absence of these programs, the peak would have been approximately 28,770 MW.42
2.3 RSP Purpose and Requirements Many of the ISO’s duties are regulated by its Transmission, Markets, and Services Tariff, a part of which is the Open Access Transmission Tariff (Transmission Tariff), approved by FERC.43 As required by the tariff, the ISO works closely with the region’s stakeholders through an open and transparent process. In particular, members of the Planning Advisory Committee (PAC) advise the
42 All values related to the new summer peak load are preliminary and will not be finalized until late fall 2007. Also, the demand-response reductions are expected to increase because some demand-response assets have not yet been fully identified. 43 FERC Electric Tariff No. 3, ISO New England Inc. Transmission, Markets, and Services Tariff (Part II, Section 48) (Holyoke: ISO New England, 2007), http://www.iso-ne.com/regulatory/tariff/index.html.

2007 Regional System Plan 17 ISO New England Inc.
ISO about the RSP scope of work and assumptions and comment on the preliminary study results and the final draft of the report.44 The purpose of the RSP is to provide an annual assessment of how to maintain the reliability of the New England bulk power system while promoting the operation of efficient wholesale electricity markets. To conduct this assessment, the ISO and its stakeholders analyze the system and its components as a whole, accounting for the many varied and complex interactions that occur among the components. The individual areas and parts of the system are also analyzed because the performance of these components affects the performance of the system overall. During the planning process, the options for satisfying the needs that have been defined are evaluated to determine which ones would be most effective, such as adding resources, reducing demand, upgrading the transmission system, or using a combination of solutions. Poorly designed system modifications can result in negligible benefits or even significant negative impacts. Within New England, 13 subsets of the electric power system, called subareas, have been established to assist in modeling and planning electricity resources. These subareas reflect a simplified model of major transmission interfaces across the system, which represent possible physical limitations of the flow of power that evolve over time because of the variety of system changes that occur. Figure 2-2 is a simplified model of the system that shows the ISO subareas and three external control areas. The types of analyses that use the subareas include the resource adequacy studies and environmental emission studies. More detailed models are used for other types of analyses, including transmission planning studies, and for the real-time operation of the system.
44 Any stakeholder can designate a member to the PAC by providing written notice to the ISO. PAC materials (2001–2007) are available online at http://www.iso-ne.com/committees/comm_wkgrps/prtcpnts_comm/pac/index.html.

2007 Regional System Plan 18 ISO New England Inc.
SEMARI
NORSWCT
BHE
ME
NB
BOSTON
NH
SME
CMA/NEMA
HQ
NY
CT
VT
WMASEMA
RI
NORSWCT
BHE
ME
NB
BOSTON
NH
SME
CMA/NEMA
HQ
NY
CT
VT
WMA
Subarea Designation Region or State Subarea or Control Area
Designation Region or State
BHE Northeastern Maine WMA Western Massachusetts
ME Western and central Maine/ Saco Valley, New Hampshire SEMA Southeastern Massachusetts/
Newport, Rhode Island
SME Southeastern Maine RI Rhode Island/bordering MA
NH Northern, eastern, and central New Hampshire/eastern Vermont and southwestern Maine
CT Northern and eastern Connecticut
VT Vermont/southwestern New Hampshire SWCT Southwestern Connecticut
BOSTON Greater Boston, including the North Shore NOR Norwalk/Stamford, Connecticut
CMA/NEMA Central Massachusetts/ northeastern Massachusetts NB, NY, and HQ
New Brunswick (Maritimes), New York, and Hydro-Québec external control areas
Figure 2-2: RSP07 geographic scope of the New England bulk electric power system. Notes: Some RSP studies investigate conditions in Greater Connecticut, which combines the NOR, SWCT, and CT subareas. This area has similar boundaries to the State of Connecticut but is slightly smaller because of electrical system limitations near the borders with western Massachusetts and Rhode Island. Greater Southwest Connecticut includes the southwest and western portions of Connecticut and consists of the NOR and SWCT subareas. NB includes New Brunswick, Nova Scotia, and Prince Edward Island (i.e., the Maritime provinces).
In addition to assessing the amount of resources that the overall system and individual subareas of the system need, the planning process assesses the types of resources that can satisfy these needs and any critical time constraints for addressing them. Thus, the RSP specifies the characteristics of the

2007 Regional System Plan 19 ISO New England Inc.
physical solutions that can meet the defined needs and includes information on market solutions to address them. Market participants can then use this information to develop the most efficient solutions, such as investments in demand-side projects, distributed generation, other generation, and merchant transmission. If the market responses fall short of meeting these needs, or if additional transmission infrastructure is required to facilitate the efficient operation of the market, the RSP must also identify a regulated transmission solution. RSPs must account for the uncertainty in the assumptions made about the next 10 years relating to changing demand, fuel prices, technologies, market rules, and environmental requirements; other relevant events; and the physical conditions under which the system might be operating. Another requirement for developing RSPs is for the ISO to coordinate study efforts with surrounding RTOs and control areas and analyze information and data presented in neighboring plans. Each report must also provide the status of proposed and ongoing transmission upgrades and justify any newly proposed transmission improvements. Regional System Plans must comply with North American Electric Reliability Corporation (NERC) and Northeast Power Coordinating Council (NPCC) criteria and standards and ISO planning and operating procedures.45 The RSPs must also conform to transmission owner criteria, rules, standards, guides, and policies consistent with NERC, NPCC, and ISO criteria, standards, and procedures.
2.4 Features of RSP07 RSP07 provides information about the region’s electricity needs from 2007 through 2016, updates the comprehensive summary of resource and transmission plans for New England included in RSP06, and provides a status of planned, ongoing, and completed studies and transmission projects as of June 2007. Section 3 presents the load forecast, which is a key assumption for evaluating the reliability of the bulk power system under various conditions and for determining whether and when improvements are needed. Section 4 provides an estimate of the amount of additional resources the system will need in the short term to meet the resource adequacy requirements. An evaluation of long-term resource adequacy needs is also included, and plans for further resource adequacy studies scheduled for later this year are summarized. Section 5 discusses capacity issues. It summarizes the Forward Capacity Market (FCM), a locational capacity market intended to meet the system’s resource needs by sending appropriate price signals to attract new investment and maintain existing investment both where and when needed. This section also describes available demand-response resources, other types of demand resources, the impacts of conservation and energy efficiency on the use of electricity, and how aligning retail customer electricity prices with wholesale electricity costs could further reduce demand. A status of the supply-side resources in the ISO Generation Interconnection Queue (the queue) (i.e., those generators interested in interconnecting to the ISO New England bulk power system that have submitted interconnection requests to the ISO) is also included. Section 6 discusses how to meet identified system and load-pocket needs for operating reserves through the locational
45 “NERC Reliability Standards” (Princeton, NJ: NERC, 2007), http://www.nerc.com/~filez/standards/Reliability_Standards.html. “NPCC Criteria, Guides, and Procedures” (New York: NPCC Inc., 2007), http://www.npcc.org/document/abc.cfm. “ISO New England Planning Procedures” (Holyoke, MA: ISO New England, 2007), http://www.iso-ne.com/rules_proceds/isone_plan/index.html. “Operating Procedures” (Holyoke, MA: ISO New England, 2007), http://www.iso-ne.com/rules_proceds/operating/index.html.
2007 Regional System Plan 20 ISO New England Inc.
Forward Reserve Market (FRM), a seasonal forward-procurement market.46 In addition, the section describes the Demand-Response Reserve Pilot Program. Section 7 discusses the potential benefits of enhancing the region’s fuel diversity. The section provides information on the mix of the fuels that run the region’s generating capacity, the mix of fuels actually used to generate electricity, and actions taken in past years to address fuel-diversity-related issues. This section also discusses the risks related to the lack of fuel diversity and strategies that could change the regional mix of fuels used to generate electricity. Section 8 discusses environmental requirements related to power plant air emissions and water discharges and renewable resources.47 Section 9 summarizes transmission planning, security, and upgrades. The section describes the status of transmission investment, transmission system performance and development, and specific transmission projects, planned and underway, including those to reduce dependence on generating units in small load pockets. Section 10 briefly describes a scenario analysis that showed the economic, reliability, and environmental impacts of various demand-side changes and generation additions to the system for meeting a future system peak load of 35,000 MW. Section 11 covers the status of national, interregional, and systemwide planning efforts and other initiatives for improving the reliability and security of the New England bulk power system, neighboring power systems, and the systems of the United States and North America as a whole. Section 12 includes RSP07’s conclusions and recommendations. A list of acronyms and abbreviations used in RSP07 is included at the end of the report.
46 Load pockets are areas of the system where the transmission capability is not adequate to import capacity from other parts of the system, and load must rely on local generation. 47 Renewable sources of energy are those that are continually replenished and never exhausted, such as solar, hydro, wind, selected biomass, geothermal, ocean thermal, and tidal sources of power. Landfill gas (LFG) is also regarded as a renewable resource. Some states consider fuel cells to be renewable. Pumped hydro is not counted as a renewable resource since the electricity for pumping comes mostly from fossil fuel (i.e., nonrenewable) generators.

2007 Regional System Plan 21 ISO New England Inc.
Section 3 Forecasts of Annual and Peak Use of Electric Energy in New England This section summarizes the short-run and long-run forecasts of the annual and peak use of electric energy in New England and the states and subareas. The section describes the economic and demographic factors accounted for in the forecasts and explains the forecast methodology. It also summarizes the recent review of the ISO’s forecast methodology, including suggestions for improved transparency and technical accuracy.
3.1 Short- and Long-Run Forecasts The ISO forecasts are estimates of the total annual and seasonal peak-hour amounts of electric energy used in the New England states. Each forecast cycle updates the data for the region’s historical annual and peak use of electric energy by including an additional year of data, the most recent economic and demographic forecasts, and resettlement adjustments.48 Table 3-1 summarizes the ISO’s short-run forecasts of annual electric energy use and seasonal peak loads for 2007 and 2008. The net energy for load (NEL) shown in the table is the net generation output within an area, accounting for electric energy imports from other areas and electric energy exports to others. It also accounts for system losses but excludes the electric energy consumption required to operate pumped-storage plants. The peak loads shown in the table have a 50% chance of being exceeded and are expected to occur at a weighted New England-wide temperature of 90.4ºF (i.e., the 50/50 “reference” case). Peak loads with a 10% chance of being exceeded, expected to occur at a weighted New England-wide temperature of 94.2ºF, are considered the 90/10 “extreme” case.
Table 3-1 Summary of the Short-Run Forecast of New England’s Annual Use of Electric Energy and 50/50 Peak Loads
2006(a) 2007 2008 % Change 2006–2007
% Change2007–2008
Annual use of electric energy (1,000 MWh)(b) (NEL) 132,435 132,615 133,980 0.1 1.0
Summer peak (MW) 26,940 27,360 27,885 1.6 1.9
Winter peak (MW)(c) 22,850 23,070 23,375 1.0 1.3
(a) Weather-normal actual loads are shown for 2006. (b) “MWh” refers to megawatt-hours. (c) The winter peak could occur in the following year. The first two years of the forecast, 2007 and 2008, are affected by the 20% increase in the price of electricity that took place in 2006 due to the increase in natural gas costs and the 9% increase in 2007
48 Two ISO Web sites contain more detailed information on short-run and long-run forecast methodologies, models, and inputs; weather normalization; regional, state, and subarea annual electric energy and peak-load forecasts; high- and low-forecast bandwidths; and retail electricity prices: “CELT Forecasting Details 2007,” http://www.iso-ne.com/trans/celt/fsct_detail/index.html, and “CELT Report 2007,” http://www.iso-ne.com/trans/celt/report/index.html. (CELT stands for “capacity, energy, load, and transmission.”)
2007 Regional System Plan 22 ISO New England Inc.
due to the assumed transition costs associated with the Settlement Agreement for the Forward Capacity Market ($1.2 billion in 2007 and $1.4 billion in 2008) (see Section 5).49,50 Electric energy growth is forecast to slow to 0.1% in 2007 but rebound to 1.0% in 2008. The summer peak is forecast to grow 1.6% in 2007 and 1.9% in 2008, which is equivalent to a compound annual growth rate (CAGR) of 1.7% for 2006 through 2008.51 The winter peak is forecast to grow 1.0% in 2007 and 1.3% in 2008. Table 3-2 summarizes the ISO’s long-run forecasts of annual electric energy use and seasonal peak load (50/50 and 90/10) for New England overall and for each state. The forecast assumes that natural gas prices decline to and remain at their pre-Hurricane Katrina levels (see Section 7). The electricity-price forecasts for 2007 to 2016 assume that increases will be held to the rate of inflation (2.5% average annual growth) and will incorporate the assumed transition costs from the FCM Settlement Agreement and assumed capacity costs from the Forward Capacity Market ($1.9 billion in 2010, increasing to $2.5 billion in 2016). 52,53 The assumed capacity costs of the FCM are based on RSP06’s projected systemwide installed capacity (ICAP) requirements and an assumed capacity clearing price of $4.75/kW-month after adjustments for peak-energy rent.54,55 The price of electricity and other economic and demographic factors (see Section 3.2) will drive the annual use of electric energy and the growth of the seasonal peak.
49 From 2000 to 2005, the price of natural gas increased from about $5/million British thermal units (MBtu) to $9.75/MBtu, and the price for No. 6 fuel oil increased from $4/MBtu to $6.70/MBtu. 50 The 2009 assumed transition costs associated with the Settlement Agreement for the FCM are $1.6 billion, as presented to the NEPOOL Markets Committee in September 2006. The presentation is available online at http://www.iso-ne.com/committees/comm_wkgrps/mrkts_comm/mrkts/mtrls/2006/sep12132006/a12_iso_presentation_fcm_09_13_06_r1.ppt. For background information, see Devon Power LLC, Order Accepting Proposed Settlement Agreement, Docket Nos. ER03-563-030 and ER03-563-055, 115 FERC ¶61,340 (June 16, 2006). 51 The CAGR is calculated as follows:
⎪⎭
⎪⎬⎫
⎪⎩
⎪⎨⎧
×⎥⎥
⎦
⎤
⎢⎢
⎣
⎡−⎟⎟
⎠
⎞⎜⎜⎝
⎛=
⎟⎟⎠
⎞⎜⎜⎝
⎛− 1001
YearInitialin PeakYearFinalin PeakCAGRPercent YearInitialYearFinal
1
52 The inflation rate was obtained from the “Moody’s Economy.com” Web site (West Chester, PA, 2007), http://www.economy.com/. 53 U.S. EIA, 2006 Annual Energy Outlook, DOE/EIA-0383 [Washington, DC: U.S. Department of Energy (DOE), Energy Information Administration, February 2006], http://tonto.eia.doe.gov/FTPROOT/forecasting/0383(2006).pdf. 54 Installed capacity is the megawatt capability of a generating unit, dispatchable load, external resource or transaction, or demand-side resource that qualifies as a participant in the ISO’s Forward Capacity Market per the market rules. Additional information is available online at http://www.iso-ne.com/markets/othrmkts_data/fcm/index.html. 55 For each capacity zone that will experience price separation in an upcoming Forward Capacity Auction, the peak energy rent is the market-based hourly revenue that a capacity resource will be able to earn, minus its variable operating cost, including fuel cost. See Sections 4.1.1 and 5.1.1 for additional information.
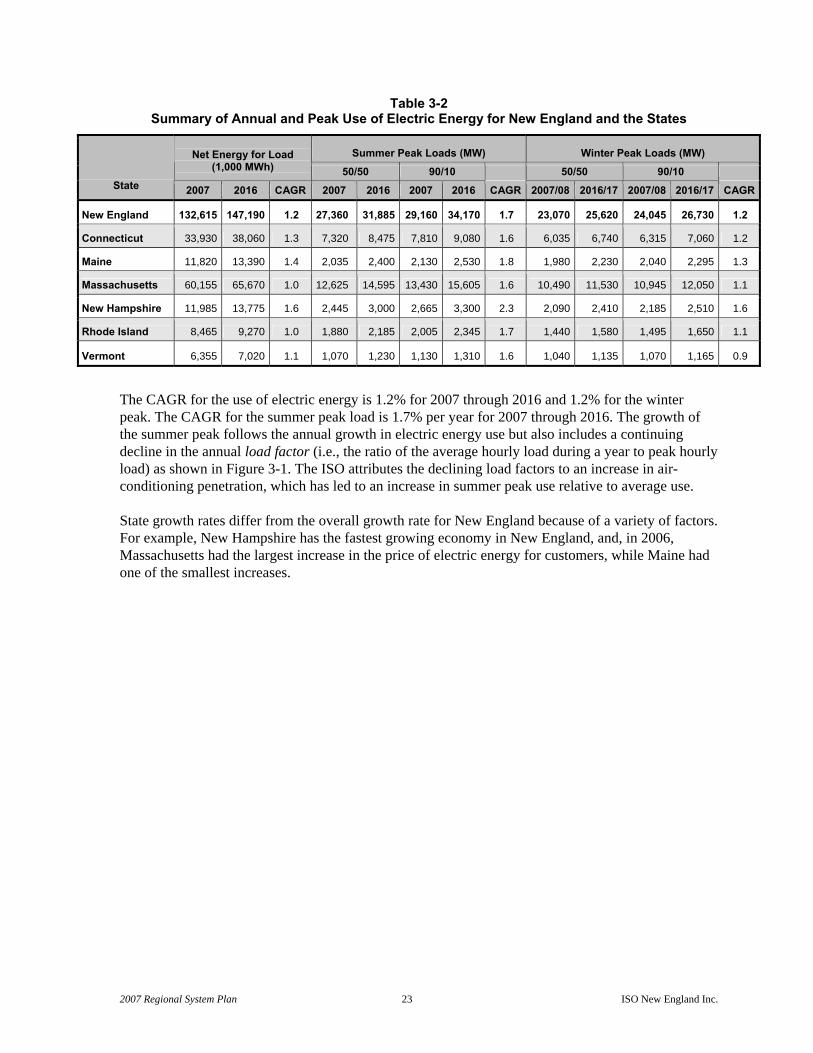
2007 Regional System Plan 23 ISO New England Inc.
Table 3-2 Summary of Annual and Peak Use of Electric Energy for New England and the States
Summer Peak Loads (MW) Winter Peak Loads (MW) Net Energy for Load (1,000 MWh) 50/50 90/10 50/50 90/10
State 2007 2016 CAGR 2007 2016 2007 2016 CAGR 2007/08 2016/17 2007/08 2016/17 CAGR
New England 132,615 147,190 1.2 27,360 31,885 29,160 34,170 1.7 23,070 25,620 24,045 26,730 1.2
Connecticut 33,930 38,060 1.3 7,320 8,475 7,810 9,080 1.6 6,035 6,740 6,315 7,060 1.2
Maine 11,820 13,390 1.4 2,035 2,400 2,130 2,530 1.8 1,980 2,230 2,040 2,295 1.3
Massachusetts 60,155 65,670 1.0 12,625 14,595 13,430 15,605 1.6 10,490 11,530 10,945 12,050 1.1
New Hampshire 11,985 13,775 1.6 2,445 3,000 2,665 3,300 2.3 2,090 2,410 2,185 2,510 1.6
Rhode Island 8,465 9,270 1.0 1,880 2,185 2,005 2,345 1.7 1,440 1,580 1,495 1,650 1.1
Vermont 6,355 7,020 1.1 1,070 1,230 1,130 1,310 1.6 1,040 1,135 1,070 1,165 0.9
The CAGR for the use of electric energy is 1.2% for 2007 through 2016 and 1.2% for the winter peak. The CAGR for the summer peak load is 1.7% per year for 2007 through 2016. The growth of the summer peak follows the annual growth in electric energy use but also includes a continuing decline in the annual load factor (i.e., the ratio of the average hourly load during a year to peak hourly load) as shown in Figure 3-1. The ISO attributes the declining load factors to an increase in air-conditioning penetration, which has led to an increase in summer peak use relative to average use. State growth rates differ from the overall growth rate for New England because of a variety of factors. For example, New Hampshire has the fastest growing economy in New England, and, in 2006, Massachusetts had the largest increase in the price of electric energy for customers, while Maine had one of the smallest increases.
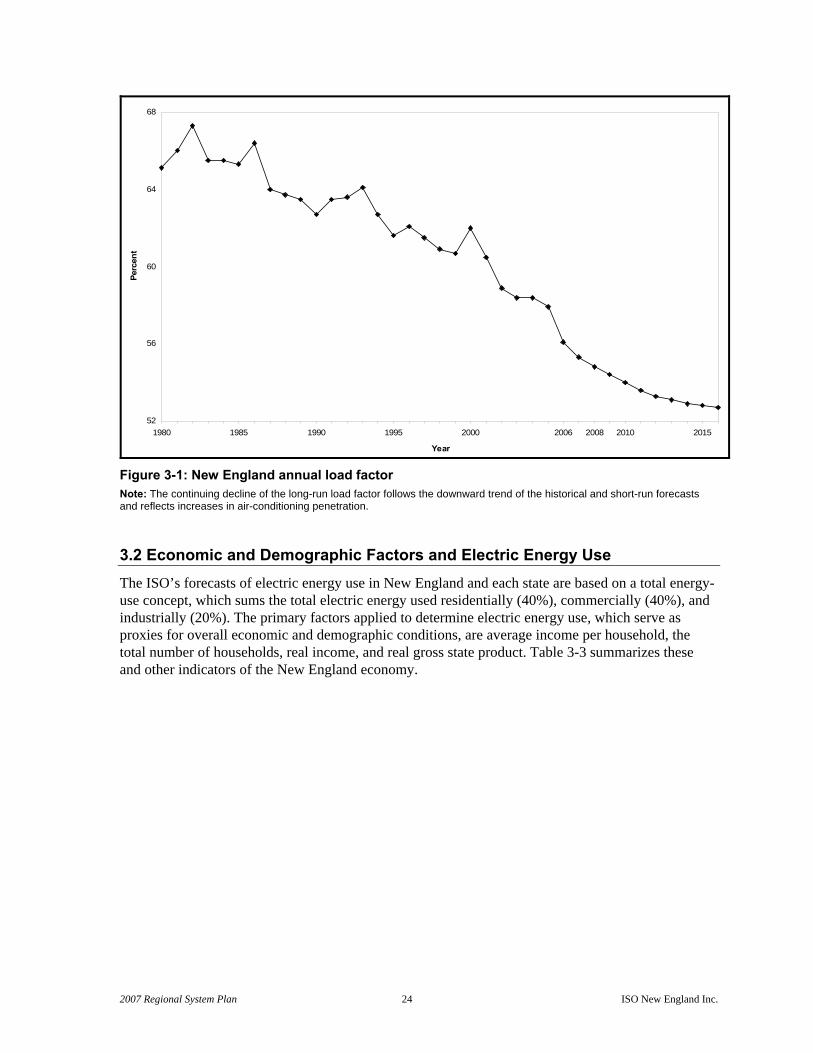
2007 Regional System Plan 24 ISO New England Inc.
52
56
60
64
68
1980 1985 1990 1995 2000 2006 2008 2010 2015
Year
Per
cent
Figure 3-1: New England annual load factor Note: The continuing decline of the long-run load factor follows the downward trend of the historical and short-run forecasts and reflects increases in air-conditioning penetration.
3.2 Economic and Demographic Factors and Electric Energy Use The ISO’s forecasts of electric energy use in New England and each state are based on a total energy-use concept, which sums the total electric energy used residentially (40%), commercially (40%), and industrially (20%). The primary factors applied to determine electric energy use, which serve as proxies for overall economic and demographic conditions, are average income per household, the total number of households, real income, and real gross state product. Table 3-3 summarizes these and other indicators of the New England economy.
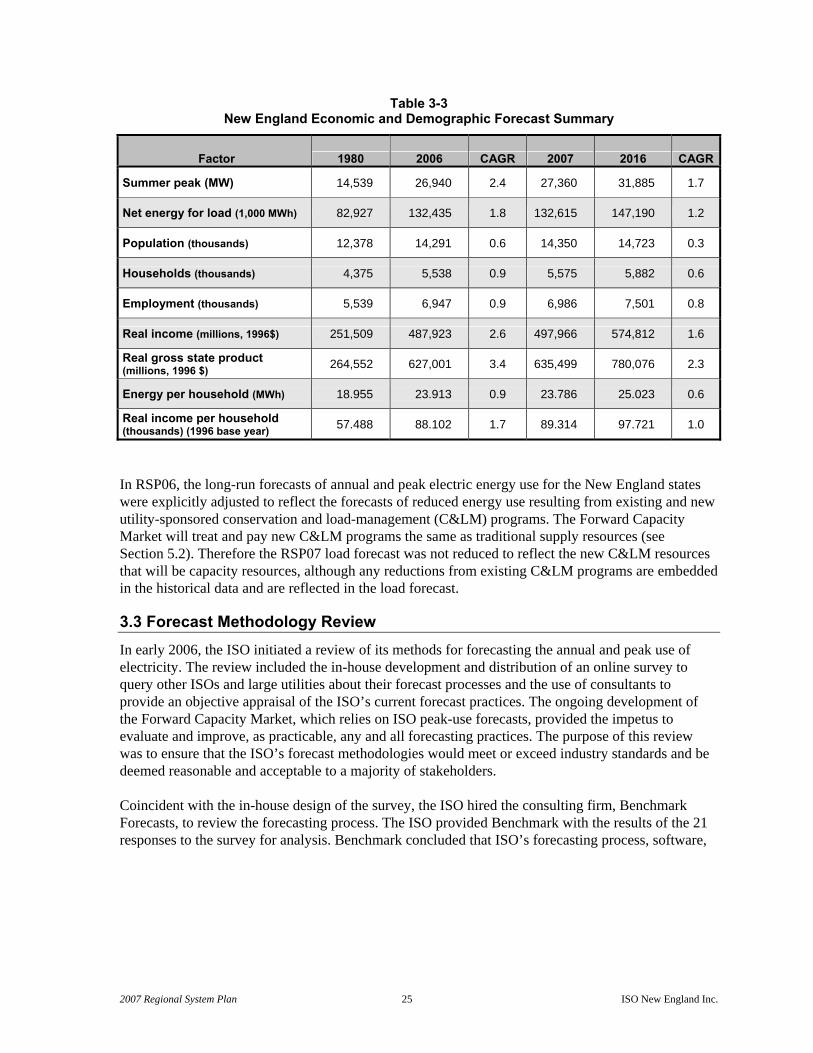
2007 Regional System Plan 25 ISO New England Inc.
Table 3-3 New England Economic and Demographic Forecast Summary
Factor 1980 2006 CAGR 2007 2016 CAGR
Summer peak (MW) 14,539 26,940 2.4 27,360 31,885 1.7
Net energy for load (1,000 MWh) 82,927 132,435 1.8 132,615 147,190 1.2
Population (thousands) 12,378 14,291 0.6 14,350 14,723 0.3
Households (thousands) 4,375 5,538 0.9 5,575 5,882 0.6
Employment (thousands) 5,539 6,947 0.9 6,986 7,501 0.8
Real income (millions, 1996$) 251,509 487,923 2.6 497,966 574,812 1.6
Real gross state product (millions, 1996 $) 264,552 627,001 3.4 635,499 780,076 2.3
Energy per household (MWh) 18.955 23.913 0.9 23.786 25.023 0.6
Real income per household (thousands) (1996 base year) 57.488 88.102 1.7 89.314 97.721 1.0
In RSP06, the long-run forecasts of annual and peak electric energy use for the New England states were explicitly adjusted to reflect the forecasts of reduced energy use resulting from existing and new utility-sponsored conservation and load-management (C&LM) programs. The Forward Capacity Market will treat and pay new C&LM programs the same as traditional supply resources (see Section 5.2). Therefore the RSP07 load forecast was not reduced to reflect the new C&LM resources that will be capacity resources, although any reductions from existing C&LM programs are embedded in the historical data and are reflected in the load forecast.
3.3 Forecast Methodology Review In early 2006, the ISO initiated a review of its methods for forecasting the annual and peak use of electricity. The review included the in-house development and distribution of an online survey to query other ISOs and large utilities about their forecast processes and the use of consultants to provide an objective appraisal of the ISO’s current forecast practices. The ongoing development of the Forward Capacity Market, which relies on ISO peak-use forecasts, provided the impetus to evaluate and improve, as practicable, any and all forecasting practices. The purpose of this review was to ensure that the ISO’s forecast methodologies would meet or exceed industry standards and be deemed reasonable and acceptable to a majority of stakeholders. Coincident with the in-house design of the survey, the ISO hired the consulting firm, Benchmark Forecasts, to review the forecasting process. The ISO provided Benchmark with the results of the 21 responses to the survey for analysis. Benchmark concluded that ISO’s forecasting process, software,
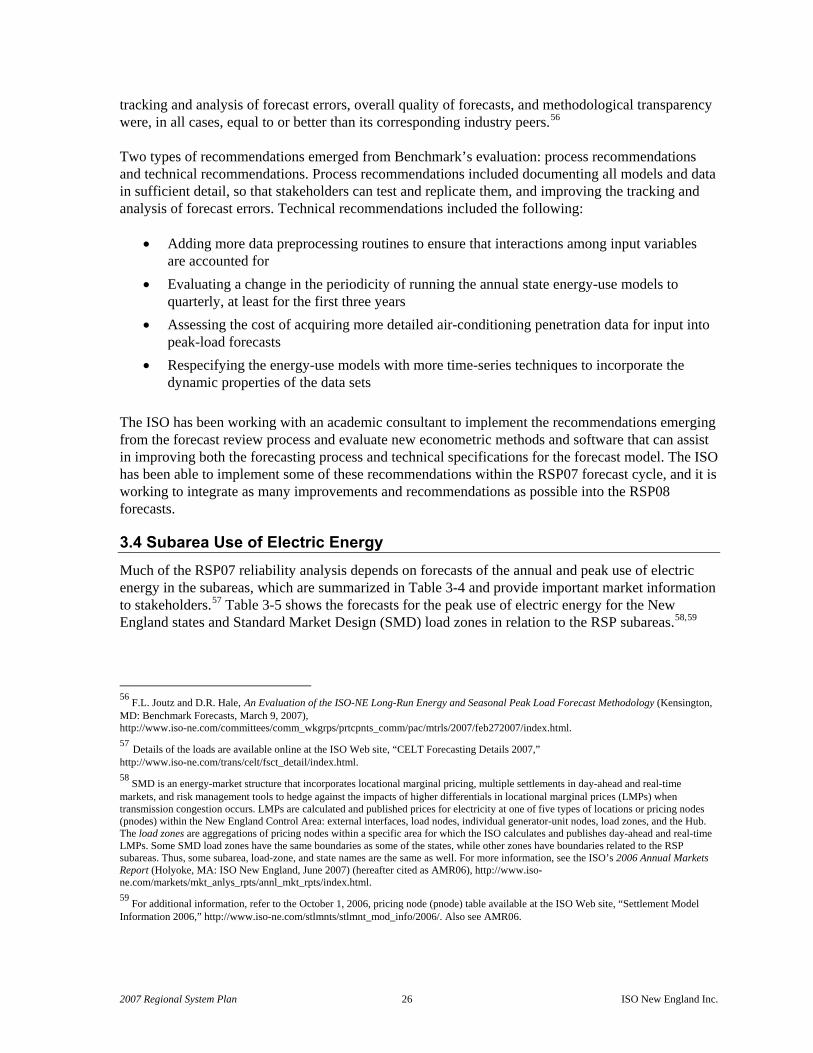
2007 Regional System Plan 26 ISO New England Inc.
tracking and analysis of forecast errors, overall quality of forecasts, and methodological transparency were, in all cases, equal to or better than its corresponding industry peers.56 Two types of recommendations emerged from Benchmark’s evaluation: process recommendations and technical recommendations. Process recommendations included documenting all models and data in sufficient detail, so that stakeholders can test and replicate them, and improving the tracking and analysis of forecast errors. Technical recommendations included the following:
• Adding more data preprocessing routines to ensure that interactions among input variables are accounted for
• Evaluating a change in the periodicity of running the annual state energy-use models to quarterly, at least for the first three years
• Assessing the cost of acquiring more detailed air-conditioning penetration data for input into peak-load forecasts
• Respecifying the energy-use models with more time-series techniques to incorporate the dynamic properties of the data sets
The ISO has been working with an academic consultant to implement the recommendations emerging from the forecast review process and evaluate new econometric methods and software that can assist in improving both the forecasting process and technical specifications for the forecast model. The ISO has been able to implement some of these recommendations within the RSP07 forecast cycle, and it is working to integrate as many improvements and recommendations as possible into the RSP08 forecasts.
3.4 Subarea Use of Electric Energy Much of the RSP07 reliability analysis depends on forecasts of the annual and peak use of electric energy in the subareas, which are summarized in Table 3-4 and provide important market information to stakeholders.57 Table 3-5 shows the forecasts for the peak use of electric energy for the New England states and Standard Market Design (SMD) load zones in relation to the RSP subareas.58,59
56 F.L. Joutz and D.R. Hale, An Evaluation of the ISO-NE Long-Run Energy and Seasonal Peak Load Forecast Methodology (Kensington, MD: Benchmark Forecasts, March 9, 2007), http://www.iso-ne.com/committees/comm_wkgrps/prtcpnts_comm/pac/mtrls/2007/feb272007/index.html. 57 Details of the loads are available online at the ISO Web site, “CELT Forecasting Details 2007,” http://www.iso-ne.com/trans/celt/fsct_detail/index.html. 58 SMD is an energy-market structure that incorporates locational marginal pricing, multiple settlements in day-ahead and real-time markets, and risk management tools to hedge against the impacts of higher differentials in locational marginal prices (LMPs) when transmission congestion occurs. LMPs are calculated and published prices for electricity at one of five types of locations or pricing nodes (pnodes) within the New England Control Area: external interfaces, load nodes, individual generator-unit nodes, load zones, and the Hub. The load zones are aggregations of pricing nodes within a specific area for which the ISO calculates and publishes day-ahead and real-time LMPs. Some SMD load zones have the same boundaries as some of the states, while other zones have boundaries related to the RSP subareas. Thus, some subarea, load-zone, and state names are the same as well. For more information, see the ISO’s 2006 Annual Markets Report (Holyoke, MA: ISO New England, June 2007) (hereafter cited as AMR06), http://www.iso-ne.com/markets/mkt_anlys_rpts/annl_mkt_rpts/index.html. 59 For additional information, refer to the October 1, 2006, pricing node (pnode) table available at the ISO Web site, “Settlement Model Information 2006,” http://www.iso-ne.com/stlmnts/stlmnt_mod_info/2006/. Also see AMR06.

2007 Regional System Plan 27 ISO New England Inc.
Table 3-4 Forecasts of Annual and Peak Use of Electric Energy in RSP Subareas, 2007 and 2016
Summer Peak Loads (MW) Winter Peak Loads (MW) Net Energy for Load (1,000 MWh) 50/50 Load 90/10 Load 50/50 Load 90/10 Load
Area 2007 2016 CAGR 2007 2016 2007 2016 CAGR 2007/08 2016/17 2007/08 2016/17 CAGR
ISO New England Total 132,615 147,190 1.2 27,360 31,885 29,160 34,170 1.7 23,070 25,620 24,045 26,730 1.2
BHE 1,790 1,990 1.2 305 350 320 370 1.5 295 335 305 345 1.4
ME 6,250 7,085 1.4 1,060 1,260 1,110 1,330 1.9 1,085 1,230 1,120 1,270 1.4
SME 3,700 4,120 1.2 660 780 690 820 1.9 600 670 620 690 1.2
NH 9,820 11,565 1.8 1,980 2,525 2,155 2,775 2.7 1,745 2,000 1,825 2,085 1.5
VT 7,190 7,990 1.2 1,245 1,460 1,325 1,565 1.8 1,220 1,360 1,260 1,405 1.2
BOSTON 26,180 28,625 1.0 5,490 6,255 5,835 6,680 1.5 4,500 4,970 4,690 5,185 1.1
CMA/NEMA 8,550 9,280 0.9 1,865 2,105 1,990 2,255 1.4 1,510 1,660 1,580 1,735 1.1
WMA 10,640 11,695 1.1 2,095 2,455 2,230 2,625 1.8 1,865 2,025 1,940 2,110 0.9
SEMA 13,640 15,005 1.1 2,930 3,380 3,115 3,610 1.6 2,380 2,620 2,485 2,740 1.1
RI 11,240 12,450 1.1 2,510 2,950 2,680 3,170 1.8 1,900 2,080 1,980 2,180 1.0
CT 16,550 18,400 1.2 3,540 4,140 3,780 4,435 1.8 2,965 3,285 3,105 3,445 1.1
SWCT 11,185 12,560 1.3 2,400 2,765 2,560 2,965 1.6 1,985 2,260 2,070 2,365 1.5
NOR 5,900 6,445 1.0 1,290 1,470 1,380 1,580 1.5 1,030 1,135 1,080 1,190 1.1

2007 Regional System Plan 28 ISO New England Inc.
Table 3-5 Peak Use of Electric Energy for RSP Subareas, SMD Load Zones, and the New England States
2007 Summer Peak-Load Forecast 50/50 Load 90/10 Load
Percent of Percent of RSP
Subarea SMD Load Zone(a) State MW RSP
SubareaState
Peak Load MW RSP
Subarea State
Peak Load BHE 305 320 ME Maine 305 100 15.0 320 100 15.0
ME 1,055 1,105 ME Maine 1,015 96.2 49.9 1,060 95.9 49.8
NH New Hampshire 40 3.8 1.6 45 4.1 1.7
SME 665 700 ME Maine 665 100 32.7 700 100 32.9
NH 1,980 2,155 ME Maine 55 2.8 2.7 55 2.6 2.6
NH New Hampshire 1,855 93.7 75.9 2,025 94.0 76.0 VT Vermont 75 3.8 7.0 80 3.7 7.1
VT 1,245 1,325 NH New Hampshire 325 26.1 13.3 355 26.8 13.3
VT Vermont 920 73.9 86.0 970 73.2 85.8
BOSTON 5,490 5,835 NEMA/Boston Massachusetts 5,410 98.5 42.9 5,750 98.5 42.8 NH New Hampshire 80 1.5 3.3 85 1.5 3.2
CMA/NEMA 1,870 1,990 West Central
Massachusetts (WCMA)
Massachusetts 1,720 92.0 13.6 1,830 92.0 13.6
NH New Hampshire 150 8.0 6.1 165 8.3 6.2
WMA 2,095 2,230 CT Connecticut 85 4.1 1.2 90 4.0 1.2 WCMA Massachusetts 1,935 92.4 15.3 2,060 92.4 15.3
VT Vermont 80 3.8 7.5 80 3.6 7.1
SEMA 2,930 3,115 SEMA Massachusetts 2,780 94.9 22.0 2,955 94.9 22.0
RI Rhode Island 150 5.1 8.0 160 5.1 8.0
RI 2,515 2,685 SEMA Massachusetts 785 31.2 6.2 840 31.3 6.3 RI Rhode Island 1,730 68.8 92.0 1,845 68.7 92.0
CT 3,545 3,780 CT Connecticut 3,545 100 48.4 3,780 100 48.4
SWCT 2,400 2,560 CT Connecticut 2,400 100 32.8 2,560 100 32.8
NOR 1,290 1,380 CT Connecticut 1,290 100 17.6 1,380 100 17.7
(a) The total SMD load-zone projections are similar to the state load projections and are available online at the ISO’s “2007 Forecast Data File,” http://www.iso-ne.com/trans/celt/fsct_detail/2007/isone_2007_forecast_data.xls; tab #2, “ISO-NE Control Area, States, & Regional System Plan (RSP07) Subareas Energy and Seasonal Peak-Load Forecast and SMD Load Zones.”

2007 Regional System Plan 29 ISO New England Inc.
3.5 Summary of Key Findings The RSP07 forecasts of annual and peak use of electric energy accounted for a projected decrease in the system load factor over time. Two types of changes had an impact on the forecasts. These changes and their effects on the forecasts are as follows:
• As a result of including the assumed transition costs from the Forward Capacity Market Settlement Agreement (2007 to 2009) and the assumed capacity costs from the FCM (2010 to 2016), the 50/50 summer-peak forecast was lowered from the RSP06 forecast by 65 MW for 2008, 145 MW for 2010, and larger amounts for the long term (185 MW for 2016).
• As a result of 1) updating the historical data; 2) having new assumptions for the economic forecast; and 3) treating new conservation and energy-efficiency programs (demand resources) the same way as supply resources and not as adjustments to the load forecast, the 50/50 summer-peak forecast was raised from the RSP06 forecast by 50 MW for 2008, lowered by 5 MW for 2010, and lowered by 195 MW for 2016.
Other key findings of the forecasts are as follows:
• Summer peak is expected to grow at an average rate of 1.7% per year. Over the next 10 years, the net energy for load and winter peak are expected to grow at an average rate of 1.2% per year.
• The forecast method has been improved, and further enhancements will be reflected in future planning efforts. The ISO will strive to address the remaining process and technical recommendations made by Benchmark Forecasts for the RSP08 forecast.
• The systemwide RSP07 forecast of peak use is somewhat lower than RSP06’s forecast, ranging from a reduction of 15 MW for 2008 to 380 MW for 2016. Some differences exist in the subarea forecasts, but they are also roughly comparable with the RSP06 forecasts, given the above systemwide changes. Thus, many of the RSP06 results and conclusions that depend on the load forecasts are still considered valid.

2007 Regional System Plan 30 ISO New England Inc.
Section 4 Resource Adequacy Resource adequacy analyses are conducted routinely to determine the overall adequacy of the New England bulk power system now and into the future. Such analyses are conducted to estimate the necessary amounts and locations of supply- and demand-side resources for ensuring that load requirements are met. This section describes the requirements for resource adequacy, the analyses conducted to determine specific systemwide and local-area resource adequacy needs, and the results of these analyses.
4.1 New England Systemwide Resource Adequacy To ensure that the system overall has adequate resources, the ISO uses a well-established probabilistic loss-of-load-expectation (LOLE) analysis.60 The LOLE analysis identifies the amount of installed capacity (MW) the system needs and when it will be needed to meet the NPCC and ISO resource adequacy planning criterion to not disconnect firm load more frequently than once in 10 years.61 The analysis examines the system resource adequacy under assumptions for the load forecast, resource conditions, and possible tie-line benefits (i.e., the receipt of emergency electric energy from neighboring regions).62 Using a deterministic approach, the ISO also analyzes the systemwide operable capacity to estimate the net capacity that will be available under specific scenarios.63 The analysis identifies operable capacity margins (i.e., the amount of resources that must be operational to meet peak demand plus operating-reserve requirements) under assumed 50/50 and 90/10 peak-load conditions (see Section 3.1). The results of these examinations show either an expected system surplus or deficiency in meeting the operating requirements for the 50/50 and 90/10 loads. A negative margin indicates the potential need to implement ISO Operating Procedure No. 4, Actions during a Capacity Deficiency, or Operating Procedure No. 7, Actions in an Emergency (OP 7), to maintain reliable operations at the specified load level.
4.1.1 Installed Capacity Requirements
To meet the NPCC once-in-10-year requirement for preventing the disconnection of firm load due to a capacity deficiency, a system needs installed capacity in an amount equal to the expected demand plus enough to handle any uncertainties associated with the performance of the generating resources and load. The total amount of installed capacity needed is termed the Installed Capacity Requirement (ICR). Under the FCM (see Section 5.1), the ISO will use the ICR to establish the amount of resources to be purchased in an auction up to three years in advance to ensure that the region will
60 Probabilistic analyses reflect the use of statistical estimates of an event taking place. These analyses explicitly recognize that the inputs are uncertain; thus, the outcome of a probabilistic analysis is a measure of the likelihood of an event taking place. 61 Not meeting this criterion could result in a penalty for the New England Control Area, currently being developed by NPCC. Additional information is available online at the NPCC Web site, “NPCC Inc. Criteria, Guides, and Procedures,” http://www.npcc.org/document/abc.cfm. 62 Tie-line benefits account for both the transmission-transfer capability of the tie lines and the emergency capacity assistance that may be available from neighboring systems when New England would need it. 63 Deterministic analyses are snapshots of assumed specific conditions that do not attempt to quantify the likelihood that these conditions will actually materialize. The results are based on analyzing a set of conditions representing an acceptable state.

2007 Regional System Plan 31 ISO New England Inc.
have adequate resources to meet the regional resource needs. The FCM will be implemented starting on June 1, 2010, and the FCM auction to purchase the ICR for that year is targeted for February 2008. In addition to the ICR, the ISO determines the Local Sourcing Requirement (LSR) for certain load zones in New England. The LSR is the minimum amount of capacity that must be located within an import-constrained load zone to meet the systemwide LOLE requirement. The ISO also calculates systemwide resulting reserves (RRs), which is the amount of capacity the system has above the expected systemwide peak demand. The RR is calculated by subtracting the 50/50 peak load from the ICR and dividing that total by the 50/50 forecast peak load for the year. The resulting reserves are often expressed as a percentage of the annual 50/50 peak-load forecast. The RRs are sometimes mistakenly referred to as required reserves because the ISO does not have a predefined required percentage for installed reserve capacity. The RSP07 focuses on projecting ICR values for the 2008 through 2016 period and RR values for 2007 to 2008. The ISO will project LSRs at a later date and document these results in a resource adequacy report targeted for publication at the end of 2007. Therefore, RSP07 contains only ICR information.
4.1.1.1 Systemwide ICR Calculation for 2007/2008 The model used for conducting the 2007/2008 systemwide ICR calculations for New England accounts for the load and capacity relief obtainable from operating procedures, including the load-response programs as well as tie-line benefits assumed to be available from neighboring systems. The ICR computation, known as a single-bus model, does not consider the transmission system constraints within New England.64 The ICR analysis also models all known external firm purchases and sales, as reported in the ISO’s 2007–2016 Forecast Report of Capacity, Energy, Loads, and Transmission (2007 CELT Report).65 The assumptions used to develop the ICR for 2007/2008 were fully discussed with the NEPOOL Power Supply Planning Committee and the NEPOOL Reliability Committee and are documented in the ISO New England Installed Capacity Requirements for the 2007–2008 Power Year Report.66 Table 4-1 summarizes the Installed Capacity Requirements for the 2007/2008 power year, assuming 800 MW of total tie-reliability benefits from the Maritimes and New York and 1,200 MW of Hydro-Québec Installed Capacity Credit (HQICC) (the current FERC-approved level).67 As shown, ICRs range from a low of 31,270 MW for July 2007 to a high of 34,217 MW for November 2007. The monthly variations in the ICRs are a result of the calculation methodology.
64 A bus is a point of interconnection to the system. 65 2007–2016 Forecast Report of Capacity, Energy, Loads, and Transmission (Holyoke: ISO New England, April, 2007), http://www.iso-ne.com/trans/celt/report/index.html. 66 ISO New England Installed Capacity Requirements for the 2007–2008 Power Year Report (Holyoke: ISO New England, May 4, 2007), http://www.iso-ne.com/genrtion_resrcs/reports/nepool_oc_review/index.html. 67 As defined in the ISO’s tariff, the HQICC is a monthly value that reflects the annual installed capacity benefits of the HQ Interconnection, as determined by the ISO using a standard methodology on file with FERC. A power year runs from June 1 through May 31 of the following year.
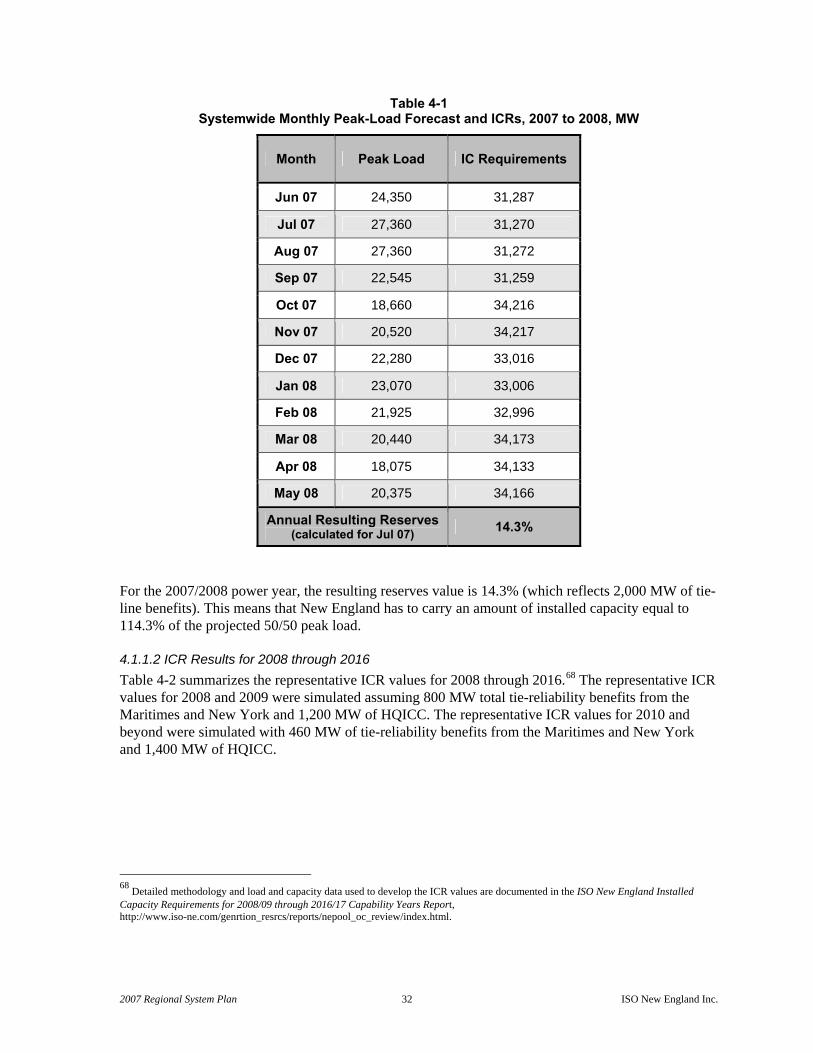
2007 Regional System Plan 32 ISO New England Inc.
Table 4-1 Systemwide Monthly Peak-Load Forecast and ICRs, 2007 to 2008, MW
Month Peak Load IC Requirements
Jun 07 24,350 31,287
Jul 07 27,360 31,270
Aug 07 27,360 31,272
Sep 07 22,545 31,259
Oct 07 18,660 34,216
Nov 07 20,520 34,217
Dec 07 22,280 33,016
Jan 08 23,070 33,006
Feb 08 21,925 32,996
Mar 08 20,440 34,173
Apr 08 18,075 34,133
May 08 20,375 34,166
Annual Resulting Reserves (calculated for Jul 07) 14.3%
For the 2007/2008 power year, the resulting reserves value is 14.3% (which reflects 2,000 MW of tie-line benefits). This means that New England has to carry an amount of installed capacity equal to 114.3% of the projected 50/50 peak load.
4.1.1.2 ICR Results for 2008 through 2016 Table 4-2 summarizes the representative ICR values for 2008 through 2016.68 The representative ICR values for 2008 and 2009 were simulated assuming 800 MW total tie-reliability benefits from the Maritimes and New York and 1,200 MW of HQICC. The representative ICR values for 2010 and beyond were simulated with 460 MW of tie-reliability benefits from the Maritimes and New York and 1,400 MW of HQICC.
68 Detailed methodology and load and capacity data used to develop the ICR values are documented in the ISO New England Installed Capacity Requirements for 2008/09 through 2016/17 Capability Years Report, http://www.iso-ne.com/genrtion_resrcs/reports/nepool_oc_review/index.html.

2007 Regional System Plan 33 ISO New England Inc.
Table 4-2 Representative Future New England Installed Capacity Requirements and
Additional Installed Capacity Possibly Needed to Meet the Resource Adequacy Criterion, MW
Year Forecast
50/50 Peak
Representative Future ICAP Requirement
Assumed Existing ICAP(a)
Additional ICAP
Needed(b)
2008 27,885 31,848 33,199
2009 28,495 32,657 33,199
2010 29,035 33,705 33,644 61
2011 29,635 34,449 33,644 805
2012 30,175 35,103 33,644 1,459
2013 30,660 35,716 33,644 2,072
2014 31,100 36,250 33,644 2,606
2015 31,510 36,755 33,644 3,111
2016 31,885 37,187 33,644 3,543
(a) Assumed existing installed capacity is based on the April 30, 2007, tabulation of qualified capacity (not including new resources). Qualified capacity is the amount of capacity a resource may provide in summer or winter in a capacity commitment period (see Section 5.1) as determined by the FCM qualification process. Qualified capacity includes existing capacity resources (not including future resources elected to be treated as existing capacity resources), import capacity resources, demand resources, and Hydro-Québec Installed Capacity Credit. The assumed existing installed capacity values for 2008 and 2009 reflect different values for the combined effects of purchases, sales, and HQICC from those assumed for 2010 through 2016. [For full definitions relating to these capacity terms, refer to the ISO’s Market Rule 1, Standard Market Design (Holyoke, MA: ISO New England, February 1, 2005), Section III of FERC Electric Tariff No. 3, http://www.iso-ne.com/regulatory/tariff/sect_3/mr1_sections_1-12_eff_6-19-07.pdf.]
(b) “Additional installed capacity possibly needed” represents a high-level approximation of future capacity needs assuming no resource additions or retirements during the study period.
As shown, with 33,644 MW of assumed installed capacity in New England, the system would possibly need an additional 60 MW in 2010 to meet the resource adequacy planning criterion, assuming no additions or retirements before 2010. By 2016, the total amount of additional capacity possibly needed to meet the resource adequacy criterion would be approximately 3,550 MW. The percentage values for annual resulting reserves when reflecting HQICC in the calculation range from 16.0% for 2008 to 16.6% for 2016. When not reflecting HQICC in the calculation, the values range from 11.7% for 2008 to 12.2% for 2016. The year that additional resources will possibly be needed to meet the once-in-10-year LOLE has changed from 2009 in RSP06 to 2010 in RSP07 because of the following:
• RSP07’s assumed total amount of installed resources for 2009 is 290 MW higher than the installed resources assumed for RSP06.
• The 2009 50/50 load forecast for RSP07 is 45 MW lower than RSP06’s load forecast. Changes in system capacity that have occurred since April 30, 2007, will be reflected in the first Forward Capacity Auction.

2007 Regional System Plan 34 ISO New England Inc.
4.1.2 Operable Capacity Analysis
In late 2007, the ISO also will conduct the systemwide operable capacity analysis to estimate the net systemwide operable capacity margin and the amount of operable resources that the system will need to meet system-peak operating requirements. It will publish the results in the resource adequacy report in conjunction with the results of the local sourcing requirement forecast and subarea resource adequacy assessment (see below).
4.2 Subarea Resource Adequacy To determine the impacts that subarea load and resource changes could have on system LOLE, the ISO performs more detailed probabilistic analyses. The results of these analyses provide insights about which subareas contain sufficient resources to contribute to meeting systemwide resource adequacy, accounting for the projected capability of the transmission system interfaces. The results and findings of RSP06 regarding subarea resource adequacy are expected to still be generally applicable because the changes to subarea load and resources have been minor. A full review of subarea resource adequacy will be conducted in fall 2007.
4.3 Summary New England has adequate installed capacity to meet its regional capacity needs through 2009. The ISO is optimistic that adequate demand and supply resources will be purchased and installed in time to meet the projected capacity needs and the resource adequacy requirements for 2010 and beyond.

2007 Regional System Plan 35 ISO New England Inc.
Section 5 Capacity With the introduction of the Forward Capacity Market, demand resources will be able to participate on a comparable basis with generation resources to meet regional capacity needs. The FCM will procure capacity more than three years in advance of need, which will align the market with the lead time needed for developing new capacity resources and allow providers to better coordinate entry of these new resources. This section describes the FCM and the development of demand and generation resources to meet regional needs.
5.1 The Forward Capacity Market Previous Regional System Plans, including RSP06, indicated the need for additional capacity for meeting the region’s growing demand for electricity.69 The Forward Capacity Market is a locational capacity market intended to ensure that these capacity needs are met by sending appropriate price signals to attract new investment where and when needed and to maintain existing resources. Generation, demand resources, and imports may participate in the FCM on a comparable basis. Each resource type, including intermittent generation, has a resource-specific set of rules for participation. The FCM will procure the required amount of installed capacity resources to maintain system reliability consistent with the region’s criterion for resource adequacy (see Section 4.1). The FCM includes a requirement that capacity resources perform during shortage events, which occur when the region is not able to meet its load and operating-reserve requirements (see Section 6). This should improve the alignment between resource needs and the capacity product provided.
5.1.1 Annual Forward Capacity Market Auction
In the FCM, resources will be purchased annually through the Forward Capacity Auction (FCA). Before each auction, the ISO will determine the amount to be purchased based on the minimum amount of capacity the region and each capacity zone will require per year (see Section 4.1.1) as well as on the transfer limits between zones. Existing capacity will be required to participate in the auction each year and will have a one-year capacity commitment period (also known as capability year). New capacity will be able to choose a capacity commitment period of one to five years. Commitment period years run from June 1 through May 31of the following year. Resources that have been purchased in an auction will be paid after the commitment year begins and on the basis of their performance. For each commitment period, starting with June 1, 2010, to May 31, 2011, a descending clock auction will be conducted to procure the predetermined amount of required installed capacity. Each auction will have the following additional features:
• Three-year planning period. Each auction will take place roughly three years (about 42 months) before the commitment period begins. However, to limit the length of the transition period, the first auction will be held in the first quarter of 2008 for delivery in June 2010. Subsequent auctions will gradually reach 42 months in advance of the commitment period.
69 The ISO’s Regional System Plans from previous years (2000–2006) are available online at the ISO Web site, “Regional System Plans 2007,” http://www.iso-ne.com/trans/rsp/index.html, under the Archives tab.
2007 Regional System Plan 36 ISO New England Inc.
• Qualification process. Before each auction, potential bidders will submit to the ISO a predefined package of qualification materials. Each bidder will specify the location and capacity of its existing resources and potential projects that could be completed by the beginning of the commitment period.
• Descending-clock format. A descending-clock auction will be used to determine the market clearing prices and the capacity suppliers for each capacity zone. Each auction will be iterative, for which the auction manager will first announce prices well above the expected clearing price, one for each of the locational products being procured. The bidders will then indicate the maximum amount of capacity they intend to offer in the auction at the current prices. Prices for products with excess supply should then decrease. As prices fall below the levels at which a participant wishes to provide capacity, the participant will withdraw capacity or express quantities at the lower prices. This process will be repeated for each product until supply equals demand. The auction will conclude when the amount of capacity offered just meets the needs predetermined for the auction; the final price for each product will be the one at which only the needed amount of capacity will be made available.
• Reconfiguration auction. Reconfiguration auctions will be conducted to allow minor quantity adjustments to reflect changes in the ICR, to procure any quantities not purchased in the FCA as a result of high-priced delist bids, and to facilitate the trading of commitments made in the previous forward auction.
5.1.2 Status of the Forward Capacity Market
FERC has approved the market rules for the Forward Capacity Market.70 The qualification process for the first Forward Capacity Auction is expected to be completed on November 1, 2007, when the ISO will file with FERC information about the qualified capacity for the first FCA. The first FCA is expected to be held in February 2008 to procure capacity for the 2010 to 2011 capacity commitment period. Several hundred demand resources, representing 2,449 MW, have expressed interest in the first FCA, scheduled for February 2008.
5.2 Demand-Side Resources This section discusses the potential capacity that demand-side resources—demand-response resources, conservation, and energy efficiency—can provide. The section also discusses mechanisms for encouraging retail customers to respond to price signals that more closely reflect the supply and demand conditions of the wholesale electric energy market as a way to reduce peak loads.
5.2.1 Capacity Available from Demand-Response Resources
The ISO operates a number of programs that make use of demand-response resources. Reliability-activated demand-response resources reduce electricity consumption in response to system reliability events in exchange for compensation based on wholesale electricity prices. Price-activated demand-response resources respond to price signals. Reliability-based demand-response resources are activated during various OP 4 action steps when system reliability is threatened. These resources receive ICAP credit and are generally categorized as mandatory; their ICAP credit encourages their
70 Devon Power LLC, Order Accepting Proposed Settlement Agreement, Docket Nos. ER03-563-030 and ER03-563-055, 115 FERC ¶61,340 (June 16, 2006).
2007 Regional System Plan 37 ISO New England Inc.
response when needed. Price-responsive demand-response resources are generally voluntary and do not receive ICAP credit; however, their response during peak hours reduces their ICAP payments. Currently, three ISO real-time reliability-based demand-response programs contribute toward reducing system capacity needs.71 Approximately 260 MW of real-time demand-response resources located in SWCT are under supplemental capacity agreements with the ISO. These resources were selected through the ISO’s Request for Proposals (RFP) for SWCT Emergency Capability (SWCT “Gap” RFP).72 Table 5-1 lists the total demand-response capacity available as of June 1, 2007, through all the ISO’s demand-response programs.
71 Additional information about these programs is available online at the ISO Web site “DR Brochure and Customer Tools” (2007), http://www.iso-ne.com/genrtion_resrcs/dr/broch_tools/index.html (2007). Also see AMR06. 72 Request for Proposals for Southwest Connecticut Emergency Capability (Holyoke, MA: ISO New England, December 1, 2003), http://www.iso-ne.com/genrtion_resrcs/rfps/SWCT_GAP_RFP_2003-12-01.pdf. Additional information on the RFP is available in the ISO’s Final Report on Evaluation and Selection of Resources in SWCT RFP for Emergency Capability 2004–2008. (October 4, 2004), http://www.iso-ne.com/genrtion_resrcs/reports/rmr/swct_gap_rfp_fnl_rpt_10-05-04.doc.

2007 Regional System Plan 38 ISO New England Inc.
Table 5-1 Capacity Data Assumed for 2007 to 2008 Demand-Response Programs
Program(a) SMD Load Zone Capacity Assumed
for Summer 2007 (MW)(b)
PerformanceRate (%)(c)
CT(d) 0.8 SWCT(d) 0.8
ME 10.8 NH 1.3
RI 3.9
SEMA 1.1
VT 3.0
Real-Time 2-Hour Demand Response
WCMA 15.6
CT(d) 591.8 78 SWCT(d) 312.0 89
ME 123.9 71 NEMA/Boston 76.8 194
NH 10.0 49 RI 22.3 0
SEMA 20.7 66
VT 10.1 266
Real-Time 30-Minute Demand Response
WCMA 30.5 115
ME 11.0 78.0 Profiled Response VT 5.9 122.0
Total 939.5
(a) Additional information about these programs is available online at the ISO Web site, “DR Brochure and Customer Tools” (2007): http://www.iso-ne.com/genrtion_resrcs/dr/broch_tools/index.html. (b) The table summarizes demand-response enrollment as of June 1, 2007. Additional information is available online in the ISO’s presentation, “ISO/NEPOOL Demand-Response Working Group Meeting” (Holyoke: ISO New England, June 6, 2007), http://www.iso-ne.com/committees/comm_wkgrps/mrkts_comm/dr_wkgrp/mtrls/2007/jun62007/intro_dr_working_group_meeting_06_06_2007.ppt.
(c) The performance rate is based on how the resources performed on August 2, 2006.
(d) The SWCT values are included in CT values and are not included in the 939.5 MW total.
5.2.2 Capacity Available from Other Demand Resources
Under the market rules governing the transition period of the Forward Capacity Market, the ISO began accepting and registering qualified other demand resources (ODRs) as capacity resources. ODRs consist of energy efficiency, load management, and distributed generation projects implemented by market participants at retail customer facilities. As of June 1, 2007, 27 ODR projects, representing approximately 150 MW of summer capacity, registered with the ISO.

2007 Regional System Plan 39 ISO New England Inc.
5.2.3 Reflecting Wholesale Electricity Market Costs in Retail Electricity Prices
Another mechanism aimed at reducing peak loads is the development of dynamic retail electricity prices. Dynamic pricing involves encouraging retail customers to respond to price signals that more closely reflect the supply and demand conditions of the wholesale electric energy market. Prices for interruptible and curtailable loads and related demand-reduction options, real-time use, and critical-peak use can provide these signals. Because, in general, these retail prices are indexed to wholesale electric energy costs, retail customers would be encouraged to reduce energy use during high-cost, peak-period hours. Reducing electricity demand, by even a modest amount, when wholesale electric energy costs are high has a number of advantages. In addition to helping to lower the electric energy price for retail customers and contributing to the more efficient use of resources, reducing demand reduces the use of more expensive generation. A report commissioned by the ISO in 2005 estimated the wholesale market impacts that would result from increasing the penetration of dynamic pricing among larger commercial and industrial customers. The study concluded that if about one-third of all the New England customers over 1 MW (representing a peak demand of 1,600 MW) reduced their electricity consumption in response to retail prices indexed to day-ahead electric energy costs, the financial benefits over five years to all New England consumers would be approximately $340 million.
5.3 Generating Units in the ISO Generator Interconnection Queue This section discusses the interest in building new generation capacity in the region, as shown through interconnection requests in the ISO’s Generator Interconnection Queue. The section also discusses the most effective locations to place new capacity. Figure 5-1 shows the capacity of the 90 active generation-interconnection requests in the queue by RSP subarea, as of May 25, 2007. Most of the active proposed capacity additions are in the BOSTON, SEMA, NOR, and CT subareas. As a part of Greater Connecticut, NOR and SWCT are the preferred locations for adding new resources. These areas have the most capacity under active development, a total of 2,832 MW.

2007 Regional System Plan 40 ISO New England Inc.
0
2,000
4,000
6,000
8,000
10,000
12,000
MW
RSP Subarea
Active 116 348 0 1,064 186 655 726 527 1,440 1,088 1,492 2,199 633Commercial 755 390 520 1,304 110 687 0 1,633 1,135 2,442 80 1,244 58Withdrawn 260 3,246 1,100 1,689 1,446 592 776 2,351 8,677 2,092 9,114 2,385 698
BHE ME SME NH VT WMA CMA BOSTON SEMA RI CT SWCT NORBOSTON
Figure 5-1: Capacity of generation-interconnection requests by RSP subarea. Note: All capacities are based on the project ratings in the ISO Generator Interconnection Queue as of May 25, 2007. Since the first publication of the Generator Interconnection Queue in November 1997 through May 25, 2007, 41 generating projects out of 229 total generator applications have become commercial.73 Together, these projects have yielded over 10,340 MW of new capacity in the region. The 90 active projects in the queue as of May 25, 2007, total approximately 10,500 MW. Since the queue’s inception, 98 proposed projects, totaling approximately 34,500 MW, have been withdrawn. The locations most suitable for adding resources to meet the systemwide LOLE criteria are summarized in Table 5-2 (and as shown in RSP06). As shown, adding resources or reducing load in the Greater Connecticut area (NOR, SWCT, and CT) would have the greatest impact on reducing systemwide LOLE. Reducing load or adding resources in other subareas that are south of the North–South interface has LOLE benefits up to approximately 2,000 MW in SEMA/RI and up to 3,500 MW in BOSTON, CMA/NEMA, and WMA.74 Reducing load or adding resources above 700 MW in the Maine subareas contributes minimal benefits to systemwide LOLE in the long run because the resource needs are in the subareas of the Greater Connecticut area. The various transmission limits would reduce the load-serving capability of the resources located in Maine to meet these needs.
73 Many projects have been proposed but have been discontinued because of problems faced during their development related to financing, licensing, insufficient market incentives, or other issues. More specific information on interconnection projects is available online at the ISO Web site, “Interconnection Status” (2007), http://www.iso-ne.com/genrtion_resrcs/nwgen_inter/status/index.html. 74 The North–South interface separates the subareas located in ME, NH, and VT from those located in CT, MA, and RI.
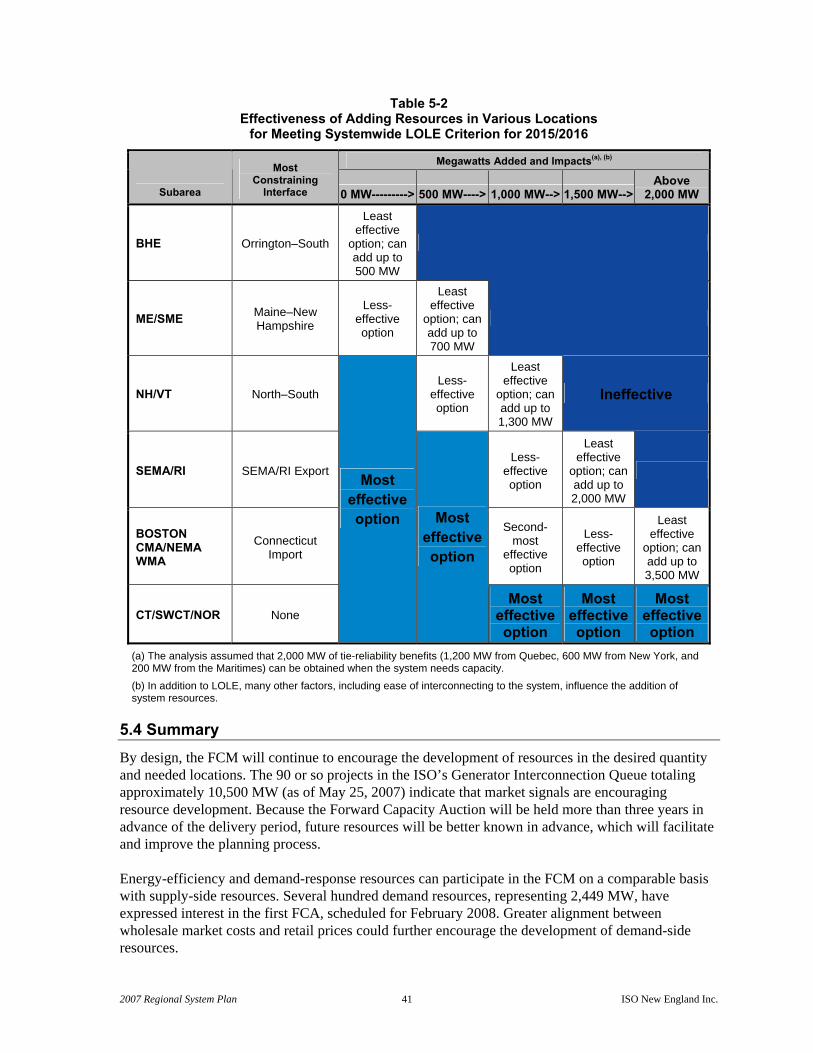
2007 Regional System Plan 41 ISO New England Inc.
Table 5-2 Effectiveness of Adding Resources in Various Locations
for Meeting Systemwide LOLE Criterion for 2015/2016
Megawatts Added and Impacts(a), (b)
Subarea
Most Constraining
Interface 0 MW---------> 500 MW----> 1,000 MW--> 1,500 MW--> Above
2,000 MW
BHE Orrington–South
Least effective
option; can add up to 500 MW
ME/SME Maine–New Hampshire
Less- effective option
Least effective
option; can add up to 700 MW
NH/VT North–South Less-
effective option
Least effective
option; can add up to 1,300 MW
Ineffective
SEMA/RI SEMA/RI Export Less-
effective option
Least effective
option; can add up to 2,000 MW
BOSTON CMA/NEMA WMA
Connecticut Import
Second-most
effective option
Less-effective option
Least effective
option; can add up to 3,500 MW
CT/SWCT/NOR None
Most effective option Most
effectiveoption
Most effective option
Most effective option
Most effective option
(a) The analysis assumed that 2,000 MW of tie-reliability benefits (1,200 MW from Quebec, 600 MW from New York, and 200 MW from the Maritimes) can be obtained when the system needs capacity. (b) In addition to LOLE, many other factors, including ease of interconnecting to the system, influence the addition of system resources.
5.4 Summary By design, the FCM will continue to encourage the development of resources in the desired quantity and needed locations. The 90 or so projects in the ISO’s Generator Interconnection Queue totaling approximately 10,500 MW (as of May 25, 2007) indicate that market signals are encouraging resource development. Because the Forward Capacity Auction will be held more than three years in advance of the delivery period, future resources will be better known in advance, which will facilitate and improve the planning process. Energy-efficiency and demand-response resources can participate in the FCM on a comparable basis with supply-side resources. Several hundred demand resources, representing 2,449 MW, have expressed interest in the first FCA, scheduled for February 2008. Greater alignment between wholesale market costs and retail prices could further encourage the development of demand-side resources.
2007 Regional System Plan 42 ISO New England Inc.
Section 6 Operating Reserves In addition to needing a certain level of resources to reliably meet the region’s actual demand for electricity, as discussed in Section 4, the system needs some of its resources to have certain operating characteristics for providing operating reserves. The overall mix of resources providing operating reserves must be able to respond quickly to system contingencies related to equipment outages and forecast errors. These resources also may be called on to provide regulation service for maintaining operational control or to serve or reduce peak loads during high-load conditions.75 A suboptimal mix of these operating-reserve characteristics could lead to the need to use more costly resources to provide these services. In the worst case, reliability would be degraded. Fast-start and demand-response resources have the operating characteristics to provide operating reserves for responding to contingencies, maintaining operational control, and serving peak demand. This section discusses the needs for operating reserves, both systemwide and in major import areas, and the use of specific types of fast-start and demand-response resources to fill these needs. An overview of the locational Forward Reserve Market and a forecast of representative future operating-reserve requirements for Greater Southwest Connecticut, Greater Connecticut, and BOSTON are provided. This section also describes a pilot program studying the use of demand-response resources to provide operating reserves.
6.1 Requirements for Operating Reserves During daily operation, the ISO determines operating-reserve requirements for the system as a whole, as well as for major transmission-constrained areas. The requirement for systemwide operating-reserves is based on the two largest loss-of-source contingencies within New England, which typically consist of some combination of the two largest generating units or imports on the Phase II interconnection with Quebec (see Section 9.3). The operating reserves required within subareas of the system depend on many factors, including the economic dispatch of generation (systemwide), the projected peak load of the area, the most critical contingency in the area, possible resource outages, and expected transmission-import limitations. ISO Operations conducts analyses to determine how the generating resources within the load pockets must be committed to meet the following day’s operational requirements to withstand possible contingencies. The locational FRM is in place to procure these required operating reserves.
6.1.1 Systemwide Operating-Reserve Requirements
A certain amount of the bulk power system’s resources must be available to provide operating reserves to assist in addressing systemwide contingencies, as follows:
• Loss of generating equipment within the New England Control Area or within any other NPCC control area
75 Regulation is the capability of specially equipped generators to increase or decrease their generation output every four seconds in response to signals they receive from the ISO to control slight changes on the system. This capability is necessary to balance supply levels with the second-to-second variations in demand. Regulation services are purchased through a market separate from the reserves market.

2007 Regional System Plan 43 ISO New England Inc.
• Loss of transmission equipment within or between NPCC control areas, which might reduce the capability to transfer energy within New England or between the New England Control Area and any other control area
The ISO’s operating-reserve requirements, as established in Operating Procedure No. 8, Operating Reserve and Regulation (OP 8), protect the system from the impacts associated with a loss of generating or transmission equipment within New England.76 According to OP 8, during normal conditions, the ISO must maintain a sufficient amount of reserves to be able to replace the first-contingency loss (N-1) in the New England Control Area within 10 minutes. Typically, the first-contingency loss is between 1,200 and 1,400 MW. In addition, OP 8 requires the ISO to maintain a sufficient amount of reserves to be able to replace at least 50% of the second-contingency loss (N-2) within 30 minutes. Typically, 50% of the second-contingency loss is between 600 and 700 MW. In accordance with NERC and NPCC criteria on bulk power system operation, ISO Operating Procedure No. 19, Transmission Operations (OP 19), requires the system to operate such that when any power system element (N-1) is lost, power flows remain within applicable emergency limits of the remaining power system elements.77 This N-1 limit may be a thermal, voltage, or stability limit of the transmission system. OP 19 further stipulates that within 30 minutes of the loss of the first-contingency element, the system must be able to return to a normal state that can withstand a second contingency. To implement these requirements, OP 8 requires operating reserves to be distributed to ensure that the ISO can fully use them for any probable contingency without exceeding transmission system limitations and that the operation of the system remains in accordance with NERC, NPCC, and ISO New England manuals, operating policies, and procedures.
6.1.2 Forward Reserve Market Requirements for Major Import Areas
To maintain subregional reliability, OP 8 mandates the ISO to maintain certain reserve levels within subareas that rely on resources located outside the area. The amount and type of operating reserves a subarea needs depend on the system’s reliability constraints and the characteristics of the generating units within the subarea. The subarea reserve requirements also vary as a function of system conditions related to load levels, unit commitment and dispatch, system topology, and special operational considerations. Table 6-1 shows representative future operating-reserve requirements for Greater Southwest Connecticut, Greater Connecticut, and BOSTON. These needs are based on the methodology for calculating the requirements for the locational Forward Reserve Market. The estimated requirements are calculated on the basis of representative future system conditions for load, generation availability, N-1 and N-2 transfer limits, and the largest generation contingencies in each subarea. Actual market requirements are calculated immediately before each locational FRM procurement period and are based on historical data that reflect actual system conditions. The table also shows the existing amount of fast-start capability in each subarea.
76 Operating Procedure No. 8, Operating Reserves and Regulation (Holyoke, MA: ISO New England, September 29, 2006), http://www.iso-ne.com/rules_proceds/operating/isone/op8/index.html. 77 Operating Procedure No. 19, Transmission Operations (Holyoke, MA: ISO New England, April 13, 2007), http://www.iso-ne.com/rules_proceds/operating/isone/op19/index.html.

2007 Regional System Plan 44 ISO New England Inc.
Table 6-1 Representative Future Forward Reserve Market Requirements
in Major New England Import Areas, MW
Representative Future Locational Forward Reserve Market Requirements (MW)(a)
Area/Improvement Market
Period(b)
Existing Amount of Fast-Start
Resources (MW)(c)Summer
(June to Sept.) Winter(d)
(Oct. to May)
2007 520(f) 611(f)
2008 500–600 400–500
Greater Southwest Connecticut
2009 500–600 400–500
2010 0 0 With SWCT Reliability Project Phase 2(g) 2011
497 (summer)(e)
604 (winter)
0 0
2007 1,055(f) 1,366(f)
2008 1,100–1,200 1,100–1,200
2009 1,100–1,200 1,100–1,200
2010 1,100–1,200 1,100–1,200
Greater Connecticut
2011
731 (summer)(h)
903 (winter)
1,100–1,200 1,100–1,200
BOSTON(i) 2007 1,050(f) 280(f)
With NSTAR 345 kilovolt (kV)Transmission Reliability Project (Phase I) 2008 150 to 500 0
2009 0 to 200 0
2010 0 to 300 0
With NSTAR 345 kV Transmission Reliability Project (Phase II)(g)
2011
214 (summer) 323 (winter)
100 to 400 0
(a) Phase II of the Ancillary Services Market project, which addressed the reserve markets, was implemented in October 2006. Thus, the rules for the locational Forward Reserve Market have changed since RSP06. The RSP07 forecast is based on the updated rules. (b) The market period is from June 1 through May 31 of the following year. (c) These values are based on the resources’ ratings of seasonal claimed-capability (SCC) (i.e., the maximum dependable load-carrying ability of a generating unit, excluding the capacity required for station service use), as reflected in the 2007 CELT Report. They do not account for outage adjustments. (d) “Winter” means October of the associated power year through May of the following year (e.g., the 2007 value is for October 2007 through May 2008). (e) This value does not include SWCT emergency-capability resources (available from the SWCT “Gap” RFP), except for Waterside, which is an ICAP resource (see Sections 4.1.1 and 5.2.1). (f) These values are based on actual historical data. (g) These requirements are based on in-service dates provided by the transmission owners. (h) This value does not include SWCT emergency-capability resources (available from the SWCT “Gap” RFP) but does include other resources in Greater Southwest Connecticut and the Waterside plant. (i) The values for BOSTON would be lower without consideration of the simultaneous loss of Mystic units #8 and #9.

2007 Regional System Plan 45 ISO New England Inc.
Because the local contingency requirements in Greater SWCT are nested within CT (i.e., operating reserves that meet the Greater SWCT requirement also meet the Greater Connecticut requirement), installing the resources in the Greater SWCT area would also satisfy the need for resources located anywhere in Greater Connecticut.78
6.1.2.1 Greater Southwest Connecticut The year-to-year changes in representative Forward Reserve Market requirements for Greater SWCT, as shown in Table 6-1, are a result of anticipated load growth and the increased import limits expected from the transmission upgrades currently under construction in that area (see Sections 9.3.2 and 9.5.1.9). As the transmission import limits increase for this area, the system operators will have more flexibility to use generation located within and outside the subarea to meet native load and local 30-minute operating-reserve requirements. If maximizing the use of transmission import capability to meet demand is more economical, the subarea will require more local operating reserves to protect for the N-2 contingency. If using import capability is less economical, generation located outside the subarea could be used to provide operating reserves, thus minimizing or eliminating operating-reserve support needed within the subarea. As shown in Table 6-1, the 497 MW of fast-start resources in the Greater Southwest Connecticut area currently meets most of that area’s local, second-contingency, operating-reserve requirements. The Forward Reserve Market requirement is expected to decrease in Greater Southwest Connecticut with the addition of transmission improvements that will increase the import capability into this area.
6.1.2.2 Greater Connecticut The need for additional resources in Greater Connecticut to alleviate reliability and economic considerations can be met by adding demand or fast-start resources, or resources with electric energy prices competitive with those resources external to the subarea. Greater Connecticut already has 731 MW of fast-start resources. Local reserve requirements are expected to remain at the 1,100 to 1,200 MW level for the next several years.
6.1.2.3 BOSTON As shown in Table 6-1, the Forward Reserve Market requirements for the BOSTON subarea, which depend on the economics of operating generating units within and outside the subarea, were obtained by evaluating load growth in conjunction with the increased import limits expected from the proposed transmission upgrades for that area (i.e., the addition of the NSTAR 345 kV Transmission Reliability Project Phase I and Phase II; see Section 9.4). The analysis also reflects the possible contingency of the simultaneous loss of Mystic units #8 and #9. As the import limits into BOSTON increase, operators will be able to optimize the use of regional generation to meet both load and reserve requirements. If the transmission lines were fully utilized to import lower-cost generation into BOSTON, this subarea would need to provide operating reserves to protect against the larger of either the loss of the largest native generation source or the loss of a transmission line into the subarea.79
78 The types of reserves that can meet these requirements are defined in Market Rule 1, Standard Market Design (Section III of FERC Electric Tariff No. 3) (Holyoke, MA: ISO New England, 2007), available online at “Section III, Market Rule 1,” http://www.iso-ne.com/regulatory/tariff/sect_3/index.html. 79 In some circumstances, when transmission contingencies are more severe than generation contingencies, shedding some load may be acceptable.

2007 Regional System Plan 46 ISO New England Inc.
6.1.2.4 Summary of Forward Reserve Market Requirements in Major Load Pockets Adding demand-response or fast-start resources in either Greater SWCT or Greater Connecticut load pockets would provide much needed operating flexibility and operating reserves, if the transmission interface were consistently operated near its N-1 limit. Alternatively, adding baseload resources that were on line most of the time in these areas could allow the use of reserves from outside areas.80
6.2 Types of Operating Reserves The generating units that provide operating reserves in New England respond to contingencies within 10 or 30 minutes by offering either synchronized (spinning) or nonsynchronized (nonspinning) reserve capability. Spinning reserve is generation that already is on line, is synchronized, and can increase output. Nonspinning reserves are off-line, fast-start resources that can be electrically synchronized to the system and quickly reach rated capability. Dispatchable asset-related demand (DARD) (i.e., demand that can be interrupted within 10 or 30 minutes in response to a dispatch order) also can provide operating reserves, serve or reduce peak loads, and avert the need to commit more costly resources to supply operating reserves. Resources located within or outside a subarea may provide subareas with operating reserves. The types of reserves that can be used to provide operating reserves to subareas are flexible and include spinning reserves, fast-start resources, and dispatchable asset-related demand. Subareas with local reserve requirements greater than the available DARD plus fast-start generation, and without sufficient in-merit generation (i.e., generation that was accepted and dispatched because it was less expensive than other accepted and dispatched supply offers), require additional internal generation to provide spinning reserve (local second-contingency resources).81
6.3 Demand-Response Reserve Pilot Program The ISO is conducting a Demand Response Reserve pilot program (DRR Pilot) to determine whether smaller (less than 5 MW) generation and demand-response resources can provide a reserve product. The 12-month pilot, which started in October 2006, will test the responsiveness of smaller generation and demand-response resources to more frequent and shorter-duration activations. The DRR Pilot may continue for a second year and consists of two distinct subprojects:
• Determination of the ability of demand resources to respond to reserve-activation events
• Evaluation of the features of lower-cost, two-way communication alternatives, compared with the current combination of SCADA and Electronic Dispatch Remote Intelligent Gateway technology now required to connect dispatchable resources to the ISO82
80 Baseload generating units satisfy all or part of the minimum load of the system and, as a consequence, produce electric energy continuously and at a constant rate. These units are usually economic to operate on a day-to-day basis. Intermediate-load generating units are used during the transition between baseload and peak-load requirements. These units come on line during intermediate load levels and ramp up and down to follow the system load that peaks during the day and is at its lowest in the middle of the night. (Peaking units are defined in Section 8.1.3.) 81 Out-of-merit generation refers to dispatched capacity that is more expensive than the marginal, price-setting, supply offer. 82 SCADA refers to “supervisory control and data acquisition.”
2007 Regional System Plan 47 ISO New England Inc.
6.4 Summary of Key Findings Fast-start resources with a short lead time for project development can satisfy near-term operating-reserve requirements, while providing operational flexibility to major load pockets and the system overall. Locating economical baseload generation in major load pockets can allow for the use of reserves from outside areas by reducing local subarea imports. Transmission improvements can also allow for the increased use of reserves from outside these areas.

2007 Regional System Plan 48 ISO New England Inc.
Section 7 Fuel Diversity New England will continue to face challenges with respect to diversifying its existing fuel mix used to produce electricity. Some of these fuel-diversity issues are as follows:
• Short-term seasonal reliability issues—In New England, winter reliability is still a concern as highlighted during the January 14–16, 2004, cold snap (January 2004 Cold Snap).83 In addition, the devastation to Gulf Coast energy infrastructure caused by Hurricanes Katrina and Rita in fall 2005 highlighted the types of major events that can temporarily interrupt traditional fuel-supply chains serving the region. These events exemplified the need for improved coordination between the electric and gas industries and the development of greater dual-fuel capability, which provide operational flexibility and system reliability.
• Long-term ramifications of maintaining the current fuel mix—Although various regulatory entities are mandating the increased use of supply-side resources fueled by renewable resources, for the foreseeable future, New England will continue to have a generation fleet fueled primarily by natural gas. The diversification of the generation fuel mix and the expansion of the regional natural gas transportation infrastructure will best serve the interests of all New Englanders.
This section discusses some of the more prominent issues related to fuel diversity within New England. Statistics on the current mix of fuels and the amount of electricity these fuels generate are presented. This section also discusses the risks to fuel-supply chains and identifies potential actions to reduce these risks.
7.1 Fuel Mix of 2007 Installed Capacity Figure 7-1 depicts the generation capacity mix by fuel type used by New England’s power generators, expressed in terms of summer capacity ratings for 2007 (MW and associated percentages). Fossil-fueled generation continues to supply over 70% of the installed capacity within the region. Natural-gas-fired generation represents the largest amount of installed capacity at 40% totaling 12,205 MW. Oil-fired generation is the second-largest component at 6,730 MW, or approximately 22%. Nuclear generation accounts for 4,555 MW, or approximately 15% of the installed capacity, and coal-fired generation accounts for 2,782 MW, or approximately 9%. Renewables (hydro and non-hydro) and miscellaneous resources make up approximately 8%, and pumped-storage hydro makes up approximately 6% of the total installed capacity in New England. Non-hydro renewables and miscellaneous resources include landfill gas (LFG), other biomass gas, refuse (municipal solid waste), wood and wood-waste solids, wind, and tire-derived fuels.
83 During January 14–16, 2004, New England experienced extremely low temperatures, which resulted in a record winter-peak electrical demand while simultaneously experiencing the short-term loss of numerous supply-side resources. Additional information on the ISO’s Cold Snap Task Force and related reports are available online at the ISO Web site, “Special Reports 2005,” http://www.iso-ne.com/pubs/spcl_rpts/2005/index.html.

2007 Regional System Plan 49 ISO New England Inc.
Pumped Storage1,689
Coal2,782
Nuclear4,555
Oil6,730
Hydro1,648
Non-Hydro Renew ables/
Misc.917
Gas12,205
Oil22.1%
Nuclear14.9%
Coal9.1%
Pumped Storage
5.5%
Hydro5.4%
Non-Hydro Renewables/
Misc.3.0%
Gas40.0%
Figure 7-1: Generation capacity mix by primary fuel type, 2007, summer ratings, MW and percentage. Note: The “non-hydro renewables/miscellaneous” category includes landfill gas (LFG), other biomass gas, refuse (municipal solid waste), wood and wood-waste solids, wind, and tire-derived fuels.
7.2 Fuels Used to Produce Electric Energy in 2006 Figure 7-2 shows the production of electric energy by fuel type for 2006. As shown, natural gas, nuclear, oil, and coal fueled most of the region’s electricity production. In total, fossil fuels accounted for close to 60% of the production of electricity within New England in 2006. In addition, New England imported 10,766 gigawatt-hours (GWh) of energy and exported 4,578 GWh of energy, which resulted in net imports of 6,188 GWh or 4.7% of net energy for load.

2007 Regional System Plan 50 ISO New England Inc.
1.2%
5.4%6.3%
15.2%
28.9%
39.7%
3.3%
0
10,000
20,000
30,000
40,000
50,000
60,000
Gas
Nuclea
rCoa
l
Hydro
Non-H
ydro
Ren
ewab
les/M
isc.
Oil
Pumpe
d Stor
age
1,00
0 M
Wh
Figure 7-2: New England electric energy production by fuel type, 2006, 1,000 MWh. Note: The “non-hydro renewables/miscellaneous” category includes landfill gas (LFG), other biomass gas, refuse (municipal solid waste), wood and wood-waste solids, wind, and tire-derived fuels.
7.3 Summary of Winter 2006/2007 Operations Each summer and winter season, NERC and NPCC mandate the ISO to perform both pre- and post-seasonal assessments of projected system performance. These assessments form the basis for projecting upcoming systemwide operable capacity margins (see Section 4.1.2) as well as documenting operational history.
7.3.1 Pre-Winter Preparations
Before winter 2006/2007 operations, the ISO performed several analyses that updated the forecasts and tools used to support reliable winter operations, as follows:
• Retained the consulting firm of Levitan and Associates, Inc. (LAI) to identify the recovery efforts for damaged oil, natural gas, and refinery infrastructure that Hurricanes Katrina and Rita inflicted in 200584
• Proactively shared the results and findings of the LAI study with the New York ISO (NYISO) and PJM to improve the overall reliability readiness of the interconnected systems85
84 LAI. Pre-Winter 2006/07 Assessment of Fuel Supply Adequacy and Bulk Power Security in New England. (Boston: Levitan and Associates, Inc., October 31, 2006). (www.levitan.com).

2007 Regional System Plan 51 ISO New England Inc.
• Verified the operational readiness of all generators claiming dual-fuel capability
• Reviewed all gas-fired generators’ regional gas pipeline capacity contracts
• Forecast the availability of gas-fired resources based on the likelihood that their natural gas transportation contracts will be interrupted
• Proactively worked with the Northeast Gas Association (NGA) to include emergency contact information for both ISO New England and the New York ISO86
7.3.2 Post-Winter Analysis
New England experienced somewhat of a split winter season. New England’s weather from November 2006 through mid-January 2007 was uncharacteristically mild. As an example, on December 1, 2006, and January 5, 2007, the weighted (eight-city) average regional temperatures at the time of the electrical peak were 59oF and 57oF, respectively.87 However, the weather from the end of January through mid-March 2007 was typical of New England (i.e., normal winter weather) or even below normal; the Northeast experienced some extremely cold weather near the end of January that lasted into February and early March. On January 25, 2007, and March 6, 2007, the weighted (eight-city) average regional temperatures at the time of the electrical peak were 7oF and 9oF, respectively. Overall, however, the average regional temperature at the time of the weekday electrical peak was 33oF for the 61-day (on-peak, weekday-only) period beginning on December 1, 2006, and ending on March 1, 2007.88 From December 1, 2006, through March 31, 2007, the ISO implemented OP 4, Action during a Capacity Deficiency, only one time and did not implement OP 21, Action during an Energy Emergency.89 The cold weather experienced from the end of January through early March prompted the ISO to invoke certain actions of Appendix H of Market Rule 1, Operations during Cold Weather Conditions.90 On Wednesday, January 24, the ISO declared a Cold Weather Watch for Friday, January 26 and subsequently updated that declaration to a Cold Weather Warning on Thursday, January 25, primarily because of the cold weather and the loss of some baseload generation. On Sunday, February 4, the ISO declared a Cold Weather Watch for Monday, February 5.
85 PJM Interconnection is the RTO for all or parts of Delaware, Illinois, Indiana, Kentucky, Maryland, Michigan, New Jersey, North Carolina, Ohio, Pennsylvania, Tennessee, Virginia, and the District of Columbia. 86 “Gas Supply Information for the Northeast Gas Industry,” Emergency Communication Manual (Needham Heights, MA: NGA, December 1, 2006). 87 The weighted eight-city average regional temperature is based on a load-weighted composite of temperature observations from eight weather stations in New England, which are: 1) Burlington, VT, 2) Portland, ME, 3) Concord, NH, 4) Boston, MA, 5) Worcester, MA, 6) Providence, RI, 7) Hartford, CT, and 8) Bridgeport, CT. 88 This warmer than normal weather is reflected in the fact that Boston had 349 fewer heating degree days (HDD) than normal for the 2006/2007 winter season, as calculated by the National Weather Service. (HDD is an aggregate measure of the hours for a heating season from October to April. The normal HDD for New England is about 4,000.) The expected temperature at the time of the ISO winter peak is 7°F for the weighted eight-city average regional temperature. 89 On Saturday, February 10, 2007, from 9:40 until 11:00 a.m., the ISO implemented OP 4 Actions #1 and #6 systemwide in New England. 90 Market Rule 1, Appendix H (FERC Electric Tariff No. 3) (Holyoke, MA: ISO New England, 2006), http://www.iso-ne.com/regulatory/tariff/sect_3/mr1_appendix_h_11-27-06.pdf.
2007 Regional System Plan 52 ISO New England Inc.
Although the regional temperatures for Monday, February 5, were not the lowest recorded during the winter 2006/2007 season, high winds drove the effective wind-chill temperatures to 2oF.91,92 The highest peak load for the winter 2006/2007 season, 21,540 MW, was subsequently recorded on Monday, February 5, at 7:00 p.m.; no OP 4 actions were necessary to serve that peak load.93 Finally, at 9:40 a.m. on Saturday, February 10, the ISO implemented OP 4 Actions #1 and #6 because the morning peak had a negative operable capacity margin of 166 MW. This negative margin was a result of the combination of higher than expected loads, lower than expected imports into New England, and slightly higher than anticipated forced generator outages and reductions. OP 4 Actions #1 and #6 were subsequently cancelled at 11:00 a.m. that same day. During winter 2006/2007, the ISO was able to reliably manage grid operations.
7.4 The Need for Dual-Fuel Capacity For each pre-winter assessment, the ISO not only incorporates variations in projected peak loads (50/50 and 90/10) but also assesses sensitivity cases based on the temporary loss of specific fuel supplies that are vitally important to the region. The 2007 Regional System Plan takes these seasonal assessments one step further by creating forecasts for several additional years. The ISO developed a five-year outlook on winter operations, assuming the temporary interruption of natural gas supply into the region. This assessment shows the amounts of dual-fuel conversions or firm fuel contracting necessary to mitigate the identified levels of risk.
7.4.1 Summary of Existing Dual-Fuel Capacity
In an assessment of winter seasonal claimed capability (WSCC), the ISO found that approximately 77 units or 16,733 MW of installed capacity are currently capable of burning natural gas as a start-up, primary, secondary, or stabilization fuel source.94,95 Fifty-one of these 77 units, totaling 8,146 MW, are currently fully functional, dual-fuel units capable of burning gas or heavy- and light-liquid fuel oils. The ISO assumes that these units could switch from natural gas to a liquid fuel source if economics warranted or if they were dispatched to do so for maintaining system reliability. Twenty-six units totaling approximately 8,587 MW have been identified as single-fuel-source units capable of burning only natural gas. Gas-only units that hold air permits for dual-fuel operation remain the most suitable candidates for immediate dual-fuel conversion.96
7.4.2 Amount of New Dual-Fuel Operable Capacity Needed
Since the New England region relies so heavily on natural gas to generate electricity, a significant amount of that generation must be able to use an alternate fuel to help ensure system reliability in the winter months. Converting single-fuel (gas-only) generators into dual-fuel-capable units should increase overall unit availability. New market incentives, such as those to be provided by the Forward
91 The eight-city regional average temperature at time of electrical peak (hour ending 7:00 p.m.) on Monday, February 5, 2007, was 13OF. 92 The lowest eight-city regional average temperature at the time of the electrical peak during the winter of 2006/2007 was 7OF, which occurred on Friday, January 26, 2007 (hour ending 7:00 p.m.). This resulted in a daily-peak electrical load of 21,076 MW. 93 The 21,640 MW was the actual peak on February 5, 2007, at 7:00 p.m. 94 Seasonal Claimed Capability Report (Holyoke: ISO New England, April 1, 2007), http://www.iso-ne.com/genrtion_resrcs/snl_clmd_cap/2007/scc_apr_2007.xls. 95 This value includes only claimed capacity that burns pipeline-quality gas and not claimed capacity that burns landfill gas. 96 Gas-only units totaling 3,091 MW currently hold air permits for limited fuel oil operation.
2007 Regional System Plan 53 ISO New England Inc.
Capacity Market, are designed to promote the availability of resources when most needed and should stimulate the procurement of and contracting for fuel supplies and delivery necessary to support that availability. Similarly, the incentives provided through the FCM as well as the locational Forward Reserve Market should stimulate investment in dual-fuel, fast-start resources where such resources are needed. The ISO continues to monitor the success of market mechanisms and pending environmental regulations that promote the increased use of renewable fuels (see Section 8) to determine the most effective actions or incentives for diversifying the fuels used to generate electricity in New England. RSP07 assesses the effects of losing natural-gas-only resources within New England on systemwide operable capacity. Winter operable capacity assessments were conducted for the 2007/2008 to 2011/2012 periods. These assessments identified the amount of natural-gas-fired generation that would need to be available over the winter peak to maintain positive operable capacity margins. Negative operable capacity margins indicate the need for firm gas purchases or additional dual-fuel conversions. The studies do not reflect resource additions, retirements, or deactivations that could also occur during the planning period.
7.4.2.1 Study Approach For this study, in addition to assuming the usual amount of pool-wide forced outages across the generation fleet, the winter assessment also assumed that all natural-gas-only units served from pipelines and local distribution companies (LDCs) would be temporarily unavailable as well. While this scenario reflects a very low probability event, it highlights the important role that natural-gas-only units serve in New England.
7.4.2.2 Findings Table 7-1 shows the results of the systemwide winter operable capacity analysis associated with the 50/50 load forecast and assuming that all natural-gas-only generation was temporarily out of service. On the basis of these results, New England could experience a negative operable capacity margin of approximately 444 MW during winter 2007/2008. This negative operable capacity margin would grow to 1,649 MW by winter 2011/2012. Table 7-2 shows that New England could experience a negative operable capacity margin of approximately 1,419 MW during winter 2007/2008, assuming natural gas-only generation outages and winter loads associated with the 90/10 forecast. This negative operable capacity margin reaches approximately 2,694 MW by winter 2011/2012.

2007 Regional System Plan 54 ISO New England Inc.
Table 7-1 Projected New England Operable Capacity Situation, Winter 2007/2008 to 2011/2012
50/50 Peak-Load Forecast, MW
Capacity Situation (Winter MW) 2007/2008 2008/2009 2009/2010 2010/2011 2011/2012
Load (50/50 forecast) 23,070 23,375 23,635 23,965 24,265
Operating reserves 1,800 1,800 1,800 1,800 1,800
Total requirement 24,870 25,175 25,435 25,765 26,065
Capacity 34,155 34,155 34,155 34,155 34,155
Net purchases/sales 58 58 48 48 48
Assumed gas-only capacity unavailable (8,587) (8,587) (8,587) (8,587) (8,587)
Additional unavailable capacity (1,200) (1,200) (1,200) (1,200) (1,200)
Total net capacity 24,426 24,426 24,416 24,416 24,416
Operable capacity margin(a, b) (444) (749) (1,019) (1,349) (1,649)
(a) Operable capacity margin = (total net capacity – total requirement). (b) A negative margin is the minimum amount of natural-gas-fired units that would need to be available during the system peak. This would be achievable through dual-fuel conversions or firm gas deliveries.
Table 7-2 Projected New England Operable Capacity Situation, Winter 2007/2008 to 2011/2012
90/10 Peak-Load Forecast, MW
Capacity Situation (Winter MW) 2007/2008 2008/2009 2009/2010 2010/2011 2011/2012
Load (90/10 forecast) 24,045 24,365 24,645 24,990 25,310
Operating reserves 1,800 1,800 1,800 1,800 1,800
Total requirement 25,845 26,165 26,445 26,790 27,110
Capacity 34,155 34,155 34,155 34,155 34,155
Net purchases/sales 58 58 48 48 48
Assumed gas-only capacity unavailable (8,587) (8,587) (8,587) (8,587) (8,587)
Additional unavailable capacity (1,200) (1,200) (1,200) (1,200) (1,200)
Total net capacity 24,426 24,426 24,416 24,416 24,416
Operable capacity margin(a, b) (1,419) (1,739) (2,029) (2,374) (2,694)
(a) Operable capacity margin = (total net capacity – total requirement). (b) A negative margin is the minimum amount of natural-gas-fired units that would need to be available during the system peak. This would be achievable through dual-fuel conversions or firm gas deliveries.

2007 Regional System Plan 55 ISO New England Inc.
The results for the systemwide 90/10 winter operable capacity analysis show that during winter 2007/2008, New England should not have negative margins, if approximately 1,500 MW of the 8,587 MW of natural-gas-only units are available.97 In fall 2006, in preparation for winter 2006/2007 operations, the ISO determined that approximately 3,200 MW of natural-gas-fired generating units had firm gas-transportation contracts through the five-year study period. If these natural-gas-fired resources remain operational over winter peak loads, or significant new or expanded dual-fuel capacity are added to the system, New England should have adequate winter operable capacity margins during the study period.
7.5 Natural Gas Supply Risks and Strategies to Improve the Fuel Mix Some of the more prominent fuel-diversity issues in New England relate to the status of resource modification in neighboring systems, the expansion of liquefied natural gas (LNG) facilities and regional natural gas pipelines, and the continued risks of disruptions to fuel-supply chains serving the region. The region can take several measures to manage these risks.
7.5.1 Gas-Fired Generation in Neighboring Systems
The build-out of new gas-fired power generation in neighboring markets exacerbates New England’s fuel-supply concerns because gas-fired units “upstream” from New England compete for supply and seasonally constrained deliverability. In general, gas-fired generation that resides within neighboring systems is exposed to essentially the same fuel supply and delivery concerns as those in New England. The ISO routinely meets with representatives of the NYISO, PJM, and Ontario to monitor and discuss fuel supply concerns.
7.5.2 LNG and Regional Pipeline Expansion
To ensure the short-term seasonal availability of fuels and winter-peak reliability, New England’s generators must bolster their ability to procure firm fuel supply and delivery and manage potential shortfalls of oil and natural gas during periods of extreme weather or other abnormal conditions. Participants can promote fuel diversity and system reliability by using existing infrastructure more efficiently through demand-response and energy-efficiency programs. An essential long-term strategy to enhance seasonal availability is to expand the regional natural gas supply and delivery infrastructure, especially for imported LNG. Adding new LNG import, storage, and regasification facilities would help meet the increased demand for natural gas in New England. Near-term stakeholder efforts reflect initiatives within the natural gas sector to satisfy incremental gas demand. The longer-term efforts deal with finding alternative fuel sources to reduce the region’s continued dependence on fossil fuels. A number of major fuel-supply risks and concerns affect New England’s electric power sector. While some of the issues, as follows, are relatively new, others have confronted regional stakeholders for some time:
• The electric power sector continues to face exposure to seasonal fuel-supply concerns. The regional power sector fuel supply (gas and oil) is continuously at risk of pending storms or Gulf Coast hurricanes.
97 The 8,587 MW of gas-only generation includes the Mystic units #8 & #9 that are fuel primarily by vaporized LNG.
2007 Regional System Plan 56 ISO New England Inc.
• A fuel-procurement strategy that relies on interruptible or spot-market contracts makes the availability of fuels less certain and reduces system reliability.
• Regional gas pipeline capacity may not be sufficient to serve the coincident demand for natural gas during winter peak-load periods from both the core natural gas and electricity generation sectors.
• New Gas Integrity Management Protocols (IMP) from the U.S. Department of Transportation’s (DOT) Pipeline and Hazardous Materials Safety Administration (PHMSA) mandate increased inspection, testing, and remedial maintenance of natural gas and oil pipelines in the near term. Gas-sector testing and maintenance activities that may affect the delivery of fuel to gas-fired generators will require tighter coordination between the gas-fired generators, natural gas pipeline/LDC operators, and the ISO.
• Although new LNG import terminals are projected to satisfy near-term incremental gas demand, the commercialization of any one of these new regional facilities is not expected until the 2008 to 2009 timeframe and later. Within power markets, global events now dictate where spot-market LNG cargoes will be delivered. While some forecasts show new LNG import facilities dampening regional natural gas prices, others suggest that LNG suppliers will seek to maximize their economic returns by pricing and shipping their gas to capture the highest prices for their product, which might not always be in New England.
• New England’s generation fleet is continuously adapting to and complying with new state and federally mandated environmental regulations that protect air and water resources. These new regulations may, in turn, cause some non-gas-fired facilities to retire as a result of economic considerations and could potentially increase the region’s dependence on gas-fired generators.
7.6 Summary New England will continue to rely heavily on natural gas to meet the region’s need for electricity, and the region must continue to take actions that improve reliability, especially during the winter season. Significant progress has been made to increase the region’s dual-fuel capability and to improve the coordination of electric and gas system operations. Over the long term, improving and adding to the region’s natural gas infrastructure, especially by building new LNG import terminals (backed by firm supply contracts) and by expanding existing intrastate, interstate, and international natural gas pipelines, can also reduce the risk of interrupting New England’s natural gas supply.

2007 Regional System Plan 57 ISO New England Inc.
Section 8 Environmental Issues A number of new federal, regional, and state environmental regulations will be implemented over the next 10 years that most likely will directly affect the production of electricity within the northeastern United States. Individually or together, these regulations could potentially affect system reliability, production and other costs, regional air emission levels, and the quality of the surface water into which power plant cooling waters are discharged. They will affect the generation of electricity by fossil fuels as well as renewable sources of fuel and potentially nuclear plants. This section discusses federal, regional, and state air emission and water discharge requirements and the various state requirements for renewable energy sources.
8.1 Air Emissions Federal, regional, and state air emission regulations and additional strategies under development include the following:
• U.S. Environmental Protection Agency (EPA)’s Clean Air Interstate Rule (CAIR)98 • Ozone Transport Commission (OTC)’s CAIR Plus99 • EPA’s Clean Air Mercury Rule (CAMR)100 • OTC’s High Electric Demand Days (HEDD) strategy101 • EPA’s Clean Air Visibility Rule (CAVR)102 • Regional Greenhouse Gas Initiative (RGGI)103
Connecticut, Massachusetts, and New Hampshire also have significant new and revised state air regulations affecting nitrogen oxides (NOX), sulfur dioxide (SO2), mercury (Hg), and carbon dioxide (CO2) emissions, as summarized in the following sections.104
98 “Clean Air Interstate Rule” (Washington, DC: U.S. EPA, 2007), http://www.epa.gov/interstateairquality/. 99 The Ozone Transport Commission is a multi-state organization created under the U.S. EPA 1990 Clean Air Act Amendments that advises EPA on ozone transport issues and develops and implements regional solutions to ground-level ozone problems in the Northeast and Mid-Atlantic regions. Additional information is available online at the OTC Web site (2007), http://www.otcair.org/index.asp. 100 “Clean Air Mercury Rule” (Washington, DC: U.S. EPA, 2007), http://www.epa.gov/camr/. 101 OTC, Memorandum of Understanding (MOU) Among the States of the Ozone Transport Commission Concerning the Incorporation of High Electric Demand Day Emission Reduction Strategies into Ozone Attainment State Implementation Planning (hereafter cited as OTC’s MOU on HEDD) (Washington, DC: Ozone Transport Commission, March 2, 2007), http://www.otcair.org/document.asp?fview=Report. (Also accessible at http://www.ct.gov/dep/lib/dep/air/climatechange/otcheddmou070307.pdf.) 102 Fact Sheet—Final Amendments to the Regional Haze Rule and Guidelines for Best Available Retrofit Technology (BART) Determinations (Washington, DC: U.S. EPA, 2007), http://www.epa.gov/visibility/fs_2005_6_15.html. 103 “Regional Greenhouse Gas Initiative” (2007), http://www.rggi.org. 104 Sulfur dioxide contributes to acid rain, and nitrogen oxides are precursors to the formation of ozone (smog), which is harmful to human health (see http://www.epa.gov/interstateairquality/). Carbon dioxide is a major contributor to greenhouse gases that are believed to be responsible for the earth’s warming [see Intergovernmental Panel on Climate Change Working Group 1. Physical Science Basis; Fourth Assessment Report of the IPCC, Summary for Policymakers (Geneva: World Meteorological Organization and United Nations Environment Programme, April 2007), http://www.ipcc.ch/WG1_SPM_17Apr07.pdf]. Mercury is a toxic substance that can enter the food chain;

2007 Regional System Plan 58 ISO New England Inc.
8.1.1 U.S. EPA Clean Air Interstate Rule
In 2005, EPA promulgated CAIR to further reduce air pollution in areas in the eastern United States not yet in compliance with the ground level ozone (O3) standards established by EPA.105 CAIR requires SO2 and NOX reductions across a 28-state region, which includes all northeastern states except Maine, Vermont, New Hampshire, and Rhode Island. CAIR requires stationary sources to limit NOX emissions to levels below the NOX emissions cap of 3.3 million tons by 2009 and to make additional reductions to meet a lower cap of 1.3 million tons by 2015. Similarly, generators in these states will have to limit total SO2 emissions to below the SO2 emissions cap of 3.6 million tons by 2010 and a lower cap of 2.5 million tons by 2015. Allowance trading will be permissible, and states will have the option to implement their own trading systems.106 The NOX cap replaces the 19-state NOX State Implementation Plan (SIP) Call Budget Program currently in effect.107 States have the option to use the proposed federal CAIR program or create their own rules implementing CAIR.
8.1.2 OTC’s CAIR Plus
Because CAIR does not seem to have yet achieved ozone attainment in the more severe ozone nonattainment states (i.e., the so-called “inner-corridor” states of Connecticut, New York, New Jersey, Pennsylvania, Delaware, and Maryland), the OTC is evaluating additional ozone attainment measures called CAIR Plus. An industry regulatory working group under the guidance of the OTC is evaluating several options for electric power generating units to reduce their NOX emissions even lower than required by CAIR. The OTC has no regulatory authority for implementing rules and, as of August 1, 2007, it has not issued a final proposal.
8.1.3 OTC’s High Electric Demand Days for NOX Reduction
The OTC is also coordinating the development of a strategy for ozone attainment for the inner-corridor states on so-called high electric demand days (HEDDs), a designation drawn up by the OTC states that indicates when high ozone concentrations are likely to occur .108 Typically, high ozone days highly correlate with peak electricity demand days. The Northeast States for Coordinated Air Use Management (NESCAUM) reported that a high contribution of NOX emissions on peak ozone days comes from oil-fired steam units and peaking turbines that have no NOX controls.109,110
mercury emissions have been shown to have detrimental health effects (see U.S. EPA. Mercury Web page, http://www.epa.gov/mercury/index.htm (2007). 105 Ozone is one of six Criteria Pollutants for which EPA has set standards for geographic areas. Over 400 metropolitan areas are not achieving (attaining) the ozone standards. 106 An emissions allowance is a regulatory agency’s authorization to emit up to a certain amount of a pollutant, such as one ton, over a specified period (e.g., one season, one year, three years). Under several existing and potential federal and regional programs, generating units will be able to purchase or trade allowances. 107 “NOX Budget Trading Program/NOx SIP Call” (Washington, DC: U.S. EPA, 2007), http://www.epa.gov/airmarkets/progsregs/nox/sip.html. 108 OTC’s MOU on HEDD (2007). 109 Relative to other types of resources, a peaking unit is designed to start up quickly on demand and operate for only a few hours, typically during system peak days, which amounts to a few hundred hours per year. 110 NESCAUM. High Electric Demand Day and Air Quality in the Northeast (White Paper) (Boston: NESCAUM; June 5, 2006), http://www.nescaum.org/documents/high-electric-demand-day-and-air-quality-in-the-northeast. The Northeast States for Coordinated Air Use Management is a nonprofit association of air quality agencies in the six New England states plus New York and New Jersey that provides scientific, technical, analytical, and policy support to the air quality programs of these Northeast states.
2007 Regional System Plan 59 ISO New England Inc.
A cooperative effort among the OTC, state regulators, power generators, and the ISOs/RTOs developed voluntary multi-strategies to reduce the NOX emissions on these critical ozone days. The strategies include controlling peaking units on the peak ozone days and adding incentives for increasing energy efficiency, using renewable resource options, and installing cleaner distributed generation. The trigger mechanism for declaring an HEDD day and for determining when the measures would go into effect will be a PJM Interconnection Mid-Atlantic Day-Ahead Market load forecast of 52 GWh or higher, which will capture many but not all of the ozone exceedance days.111 Because the HEDD region includes Connecticut, New York, New Jersey, Pennsylvania, Delaware, and Maryland, Connecticut is the only state within New England that would have to implement more stringent measures for controlling NOX emissions.
8.1.4 U.S. EPA Clean Air Mercury Rule
EPA promulgated a Clean Air Mercury Rule in 2005 for a portion of the country that must reduce mercury emissions from coal-fired power plants. This rule will be implemented in two phases—by 2010, emissions must be reduced by 10 tons to below a cap of 38 tons; and by 2018, emissions must be reduced further by 23 tons to below a lower cap of 15 tons. The installation of SO2 scrubbers for compliance with the first phase of CAIR will help achieve the first reduction of mercury needed by 2010 for compliance with CAMR. However, to comply with the second phase of CAMR, coal-fired power plants most likely will need to add specific mercury emissions controls. The three New England states with coal plants are implementing more aggressive mercury rules than CAMR (see Section 8.1.7).
8.1.5 U.S. EPA Clean Air Visibility Rule
EPA also promulgated the Clean Air Visibility Rule, which requires power plants to reduce regional haze by 2013 where haze affects wilderness areas and scenic views within national parks. This rule requires generating units to use best available retrofit technology (BART) and could affect 13 New York generating plants, as well as some plants in Maine, New Hampshire, and Vermont.112 However, if states opt for implementing CAIR, they will get a waiver from having to mandate BART implementation, since CAIR should achieve cleaner air.
8.1.6 Regional Greenhouse Gas Initiative
The Regional Greenhouse Gas Initiative is a voluntary agreement by 10 northeastern states to cap CO2 emissions from electric generators in those states that are equal to or greater than 25 MW in capacity starting January 1, 2009.113 The RGGI agreement set the CO2 cap for these states at 188 million tons starting in 2009 on the basis of recent historical power plant CO2 emissions for generators in those states. The agreement specifies that the cap will stay at this level through 2014 and then decrease 10% by 2018 to 169.2 million tons.
111 Doug Austin, HEDD stakeholder email correspondence (Washington, DC: OTC, June 26, 2007). Also see the PJM Interconnection Web site, “Day Ahead” (Valley Forge, PA: PJM Interconnection, 2007), http://www.pjm.com/markets/energy-market/day-ahead.html. 112 “Regulatory Actions” (Washington, DC: U.S. EPA, 2007), http://www.epa.gov/visibility/actions.html. 113 The following states have signed a RGGI Memorandum of Understanding: Maine, New Hampshire, Vermont, Massachusetts, Rhode Island, Connecticut, New York, New Jersey, Delaware, and Maryland.

2007 Regional System Plan 60 ISO New England Inc.
8.1.6.1 RGGI CO2 Cap Allocation and Offsets Each participating state has a specific allocation of the 188 million ton RGGI CO2 cap in the form of allowances. The total allocation of these allowances for the New England states is 55.8 million tons. Each state will be able to allocate or auction a portion of its share of CO2 allowances to the affected fossil-fueled electricity generators in its state. The states will set aside a minimum of 25% of their state’s cap to use (i.e., auction for raising funds) for developing conservation, renewable resources, or consumer refunds. RGGI explicitly provides for allowance trading among the RGGI states. The use of offsets also will be allowed for meeting up to 3.3% of a generator’s compliance obligation.114 This could increase to 5% and 10% if the cost of allowances increased above certain CO2-allowance trigger prices of $7 and $10/ton, respectively. At the end of the each compliance period, RGGI-affected generators will have to have sufficient CO2 allowances plus allowable offsets to cover their CO2 emissions for the compliance period. RGGI uses three-year compliance periods, the first being 2009 to 2011. Compliance periods for SO2 and NOx are annual and seasonal.
8.1.6.2 RGGI Model Rule A RGGI stakeholder process developed a Model Rule to help guide states in developing their own new legislation or to promulgate regulations, such that the regional implementation of RGGI would occur in a uniform manner. This rule became final in August 2006. The states are currently deciding on their methods for allocating their state cap to generators, set-asides for conservation, method for auctioning allowances, and their allowance trading programs. To date, it appears that Connecticut, Massachusetts, Rhode Island, and Vermont are planning to auction 100% of their allowance allocations. A single regional auction for RGGI also is being considered.
8.1.6.3 Potential Impacts of RGGI and Other Issues The economic impact of RGGI on affected fossil fuel generators will be the added cost of the CO2 allowances to the energy production (bid) cost of these generators. The CO2 adder for coal-fired power plants will increase their costs the most because of their higher CO2 emission rates compared with oil- and natural-gas-fired power plants. RGGI also potentially could result in system reliability impacts by adding a new air emission constraint on the operation of fossil fuel plants. Such impacts could result from a shortage of allowances or offsets in the market due to a lack of market liquidity, higher energy demand, or poor operation of carbon-free resources. Unlike the caps for SO2 and NOx, no post-combustion control options currently exist for CO2 that would, like scrubbers for SO2, cap the price of CO2 allowances. This lack of control options makes the CO2 cap a potential reliability issue for New England’s bulk electric power system. A significant issue with RGGI is the intent of the RGGI organization to control “leakage.”115 RGGI produced a draft report that documented the need to track energy imports into the RGGI region using the current generation information systems of the ISO/RTOs in the RGGI region but with some modifications. The report discussed a number of policy options to control leakage that would affect
114 Offsets are emission reductions achieved in specific energy sectors outside electricity generation. 115 Leakage for RGGI is an increase in lower-cost imported power from non-RGGI control areas (i.e., Canada, the non-RGGI part of PJM, etc.). The concern is that this could increase the CO2 emissions from outside the RGGI states without being subject to the RGGI cap. To some degree, imports could offset the intended CO2 reductions within the RGGI states and thereby compromise RGGI’s effect.
2007 Regional System Plan 61 ISO New England Inc.
the electric energy supply of the load-serving entities (LSEs) but not directly affect system reliability. The RGGI states’ regulators are developing further steps needed to deal with leakage. As shown by an RSP06 analysis, meeting the RGGI allocation of the cap for the New England states will be challenging. The Scenario Analysis results also suggest that the region would need to add substantial low- or zero-CO2-emitting resources to the region to meet the RGGI allocation (see Section 10).
8.1.7 Major New State Air Regulations
Connecticut, Massachusetts, and New Hampshire have recently revised or promulgated new regulations that address NOX, SO2, Hg, and CO2 emissions.
8.1.7.1 Connecticut Connecticut is revising its existing NOX reasonably achievable control technology (RACT) regulations to lower the NOX emissions rates of certain generating units to achieve ozone attainment in the state. These changes are in accordance with the OTC’s Model Rule to control NOX. For implementation of CAMR, Connecticut has proposed a Clean Air Mercury Rule to ensure compliance by the two coal generators affected by the rule. The rule would require an emission rate of 0.6 lb/MBtu for these generators by 2013 and prohibit emission trading.
8.1.7.2 Massachusetts Massachusetts has recently implemented the last of its 310 Code of Massachusetts Regulations (CMR) 7.29 multi-pollutant regulations that cover SO2, NOX, Hg, and CO2.116 The state already has implemented regulations to achieve reductions in SO2 and NOX emissions. The recent regulations add a requirement for solid fuel plants to make an 85% reduction in mercury emissions by January 1, 2008, or meet an emission limit of 0.0075 lb/MWh. Similarly, these plants must reduce Hg emissions 95% by 2012 or meet an average emission rate of 0.0025 lb/MWh. These CMR 7.29 regulations set two CO2 limits for six existing fossil plants in Massachusetts. The first limit is a CO2 tonnage cap on each of these plants, which totals 27.8 million tons for the six plants. These CO2 caps went into effect on January 1, 2006. The second CO2 limit is an emission-rate cap of 1,800 lb/MWh for all six plants, which takes effect on January 1, 2008. No allowance trading is permitted to meet these two caps, but the use of CO2 offsets for compliance is allowed. When a regional market ceiling price of $10/ton for CO2 offsets is reached, this price sets a cap on the amount that plants will have to pay for such offsets. Alternatively, the plants will have the option to pay into a state fund that supports renewable resource development that could create the offsets. The Massachusetts Department of Environmental Protection (MA DEP) currently is planning a transition from the 7.29 regulations for CO2 offsets to RGGI offsets.
8.1.7.3 New Hampshire In 2005, New Hampshire reached an agreement among multiple parties for the state’s coal plants to reduce SO2 emissions by 90% by installing scrubbers and to reduce mercury emissions by 80% by
116 Attachment A. Final Regulatory Revisions to 310 CMR 7.00: Appendix B (310 CMR 7.00: Appendix B), “Emission Banking, Trading, and Averaging” (Boston: MA Department of Environmental Protection, 2006), http://www.mass.gov/dep/air/laws/ghgappb.doc.

2007 Regional System Plan 62 ISO New England Inc.
2013. The mercury reductions will exceed EPA’s CAMR requirements, and no allowance trading will be permitted.
8.2 Water Discharges The principal water issue at power plants in the United States relates to reducing the impact of their thermal discharge as required by the Clean Water Act (CWA). Section 316b of the CWA requires EPA to ensure that the location, design, construction, and capacity of cooling water intake structures reflect the best technology available to minimize adverse environmental impact.117 EPA implemented the rule in three phases. Phase I applies to new facilities [i.e., power plants and manufacturers that withdraw more than two million gallons per day (MGD) from U.S. waters and use more than 25% of the water for cooling]. New facilities with smaller intake amounts are still regulated individually by site. In December 2001, EPA established standards for cooling water intake structures at new plants. Phase II affects large existing facilities designed to withdraw at least 50 MGD and use more than 25% of that water for cooling purposes. The final rule, promulgated in February 2004, established performance standards stating that the number of aquatic organisms that are impinged on the intake screens must be reduced by 80 to 95% compared with uncontrolled levels, and the number of organisms entrained in (drawn into) the cooling system must be reduced by 60 to 90%. The rule, which affects over 500 power plants in the United States, allows a number of compliance alternatives using fish-protection technologies and restorative measures. Although a July 2007 federal court ruling suspended Phase II performance standard requirements, EPA has since clarified that permitting authorities must still develop best professional judgment controls for existing facility cooling water intake structures that reflect the best technology for minimizing adverse environmental impact.118 Phase III affects other existing facilities, such as manufacturers and new offshore and coastal oil and gas extraction facilities, but it does not affect power plants. The need to add cooling towers might become the required method for compliance with water discharge regulations, which could have a significant impact on maintenance outages and costs for the affected plants. The aggregate impact of the 316b rules on the affected plants in New England will need to continue to be assessed to determine whether compliance with these water regulations could have an impact on electric power system operations and reliability.
8.3 Renewable Portfolio Standards, Energy-Efficiency Goals, and Related Requirements Five of the six New England states (all but Vermont) have Renewable Portfolio Standards (RPSs). New Hampshire is the most recent state to establish a standard, although it must still promulgate regulations for the RPS to take effect in 2008. Several states have other related requirements for the
117 Cooling Water Intake Structures, CWA Section 316b; Phase I—New Facilities. Fact Sheet. EPA-821-F-01-01 (Washington, DC: U.S. EPA, November 2001), http://www.epa.gov/waterscience/316b/phase1/316bph1fs.html. 118 EPA’s suspension of Phase II of the CWA Section 316b was in response to the Second Circuit Court of Appeals decision in Riverkeeper, Inc., v. EPA, 475 F.3d 83 (2d Cir., 2007). Additional information is available online at EPA’s Web site, “National Pollutant Discharge Elimination System—Suspension of Regulations Establishing Requirements for Cooling Water Intake Structures at Phase II Existing Facilities” (Washington, DC: U.S. EPA, July 9, 2007), http://www.epa.gov/fedrgstr/EPA-WATER/2007/July/Day-09/w13202.htm.

2007 Regional System Plan 63 ISO New England Inc.
growth of renewable resources and energy efficiency. Vermont and Maine have newly established renewable requirements outside the RPS structure. Connecticut has new growth requirements for energy-efficiency programs, and Massachusetts recently announced energy-efficiency goals. The ISO has analyzed the projected requirements for renewable resources over the next 10 years. It also has analyzed other state policies requiring growth in renewable resources and in energy efficiency and combined heat and power (CHP) resources.119 This section discusses these requirements in more detail and the ISO’s outlook for their compliance. This analysis and regional outlook are provided for informational purposes only and does not represent a plan to meet state renewable requirements.
8.3.1 Requirements of the New England States’ Renewable Portfolio Standards
The general structure for Renewable Portfolio Standards in the New England states is a requirement for a percentage of the electric energy produced or purchased by utilities to be from designated types of renewable resources. This percentage typically increases annually up to a specified level. General types of renewable resources exist that the states qualify as renewables, such as small hydro, solar, wind, biomass, landfill gas, and the like. Some specific types unique to each state’s RPS exist as well. The RPSs are intended to stimulate the development of new renewable resources and achieve a more diverse and “clean” generation portfolio. Widespread integration of some of these new technologies, such as wind power, into ISO and RTO systems may present technical challenges, especially if their level of penetration grows to a significant percentage. This section presents the structure and requirements of the RPSs in the five states that have these standards and discusses each state’s categories for existing and new renewable resources. The requirements for new renewable sources are compared with the proposed renewable resource projects in the ISO’s Generator Interconnection Queue, and their total contribution to meeting the RPSs by 2012 and 2016 is estimated. Table 8-1 and Table 8-2 summarize the RPS requirements for the five New England states that have Renewable Portfolio Standards. The tables list the specific renewable technologies permitted in the states’ RPSs and the annual percentage of electric energy consumption that those resources must supply in a given year. Connecticut and New Hampshire have several classes of renewable resources. Maine has an existing RPS requirement of 30%, which the state has met since 2000.120 Massachusetts’s and Rhode Island’s RPSs, along with Connecticut’s Classes I and II and New Hampshire’s Classes I and II renewable requirements, are considered the main drivers for the growth of new renewable resources in New England. Maine’s existing requirement and New Hampshire’s Classes III and IV can be considered to be for retaining the use of existing renewable resources, although some growth in these requirements is tied mainly to the projected growth in electricity use in these states. Finally, Connecticut’s Class III requires some combination of an increase in energy efficiency and the use of combined heat and power. 119 CHP resources typically are different from renewable resources, which continually regenerate an energy source and therefore are sustainable, like wind, solar power, or sustainable biomass. Conversely, CHP resources typically generate electricity from a depletable resource, such as oil or gas. The benefit of CHP, however, is that it uses fuel more efficiently, because in addition to generating electricity, it makes use of thermal energy. 120 Maine’s RPS allows FERC-qualifying facilities (i.e., efficient cogeneration plants) to count toward meeting its goal of 30%. Maine’s many paper mills typically meet this goal.
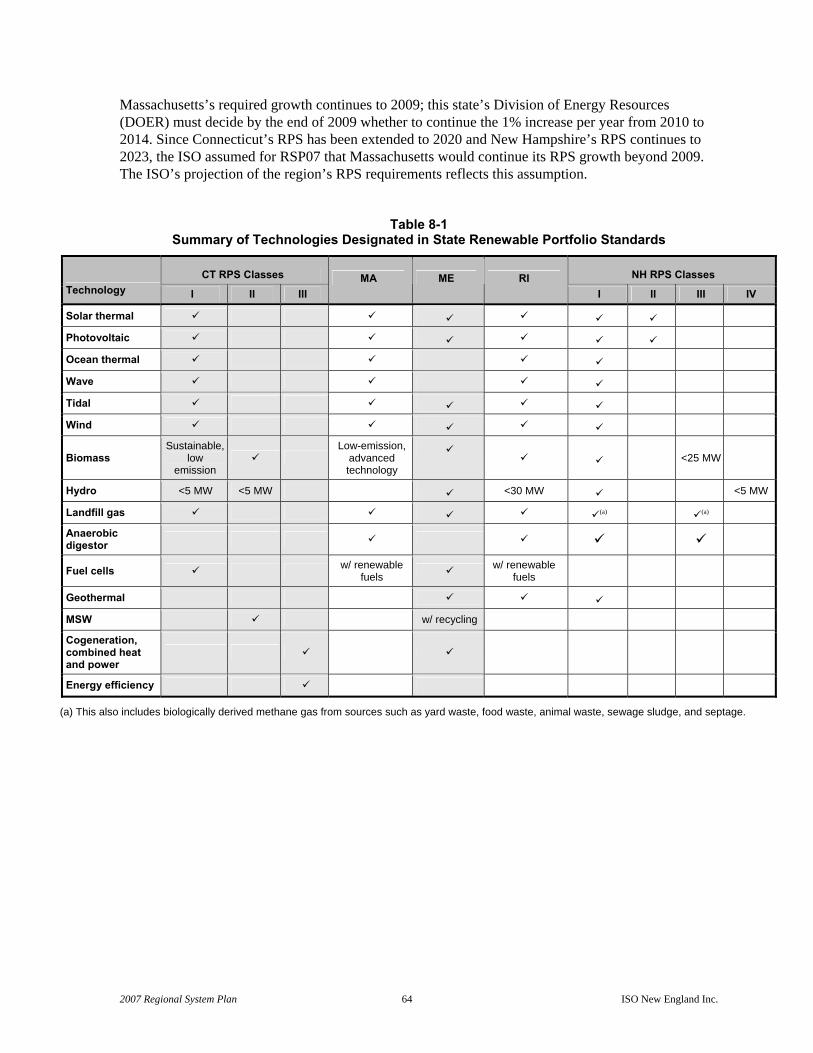
2007 Regional System Plan 64 ISO New England Inc.
Massachusetts’s required growth continues to 2009; this state’s Division of Energy Resources (DOER) must decide by the end of 2009 whether to continue the 1% increase per year from 2010 to 2014. Since Connecticut’s RPS has been extended to 2020 and New Hampshire’s RPS continues to 2023, the ISO assumed for RSP07 that Massachusetts would continue its RPS growth beyond 2009. The ISO’s projection of the region’s RPS requirements reflects this assumption.
Table 8-1 Summary of Technologies Designated in State Renewable Portfolio Standards
CT RPS Classes NH RPS Classes Technology I II III
MA ME RI I II III IV
Solar thermal
Photovoltaic
Ocean thermal
Wave
Tidal
Wind
Biomass Sustainable,
low emission
Low-emission,
advanced technology
<25 MW
Hydro <5 MW <5 MW <30 MW <5 MW
Landfill gas (a) (a)
Anaerobic digestor
Fuel cells w/ renewable fuels w/ renewable
fuels
Geothermal
MSW w/ recycling
Cogeneration, combined heat and power
Energy efficiency
(a) This also includes biologically derived methane gas from sources such as yard waste, food waste, animal waste, sewage sludge, and septage.
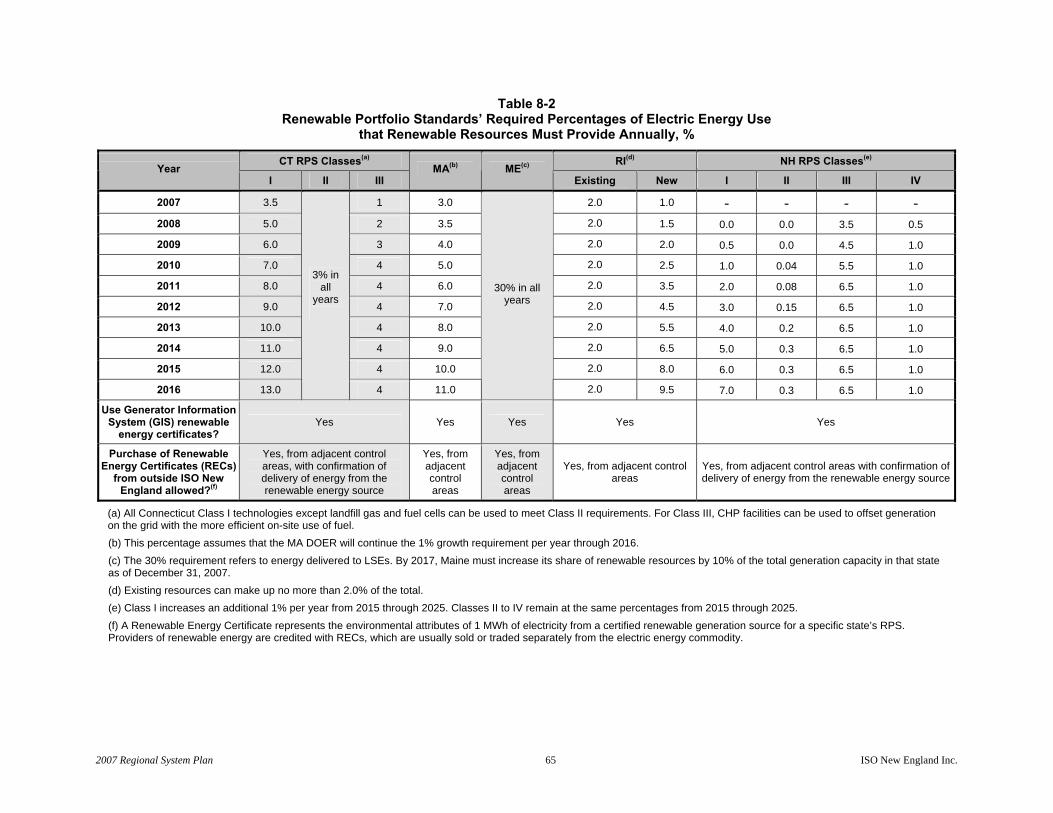
2007 Regional System Plan 65 ISO New England Inc.
Table 8-2 Renewable Portfolio Standards’ Required Percentages of Electric Energy Use
that Renewable Resources Must Provide Annually, %
CT RPS Classes(a) RI(d) NH RPS Classes(e)
Year I II III
MA(b) ME(c) Existing New I II III IV
2007 3.5 1 3.0 2.0 1.0 - - - - 2008 5.0 2 3.5 2.0 1.5 0.0 0.0 3.5 0.5
2009 6.0 3 4.0 2.0 2.0 0.5 0.0 4.5 1.0
2010 7.0 4 5.0 2.0 2.5 1.0 0.04 5.5 1.0
2011 8.0 4 6.0 2.0 3.5 2.0 0.08 6.5 1.0
2012 9.0 4 7.0 2.0 4.5 3.0 0.15 6.5 1.0
2013 10.0 4 8.0 2.0 5.5 4.0 0.2 6.5 1.0
2014 11.0 4 9.0 2.0 6.5 5.0 0.3 6.5 1.0
2015 12.0 4 10.0 2.0 8.0 6.0 0.3 6.5 1.0
2016 13.0
3% in all
years
4 11.0
30% in all years
2.0 9.5 7.0 0.3 6.5 1.0
Use Generator Information System (GIS) renewable
energy certificates? Yes Yes Yes Yes Yes
Purchase of Renewable Energy Certificates (RECs)
from outside ISO New England allowed?(f)
Yes, from adjacent control areas, with confirmation of delivery of energy from the renewable energy source
Yes, from adjacent control areas
Yes, from adjacent control areas
Yes, from adjacent control areas
Yes, from adjacent control areas with confirmation of delivery of energy from the renewable energy source
(a) All Connecticut Class I technologies except landfill gas and fuel cells can be used to meet Class II requirements. For Class III, CHP facilities can be used to offset generation on the grid with the more efficient on-site use of fuel. (b) This percentage assumes that the MA DOER will continue the 1% growth requirement per year through 2016. (c) The 30% requirement refers to energy delivered to LSEs. By 2017, Maine must increase its share of renewable resources by 10% of the total generation capacity in that state as of December 31, 2007. (d) Existing resources can make up no more than 2.0% of the total. (e) Class I increases an additional 1% per year from 2015 through 2025. Classes II to IV remain at the same percentages from 2015 through 2025. (f) A Renewable Energy Certificate represents the environmental attributes of 1 MWh of electricity from a certified renewable generation source for a specific state’s RPS. Providers of renewable energy are credited with RECs, which are usually sold or traded separately from the electric energy commodity.

2007 Regional System Plan 66 ISO New England Inc.
8.3.2 Other New Renewable Resource Requirements
Both Vermont and Maine have promulgated new renewable requirements. Vermont established a requirement to meet all its growth in electricity use from 2005 to 2012 with new renewable resource projects. Vermont set up a Sustainably Priced Energy Enterprise Development (SPEED) program to advance the establishment of long-term renewable purchase contracts between utilities and renewable project developers to meet this requirement.121 Using the ISO’s forecasted growth in energy use for Vermont from 2005 to 2012, the ISO estimated Vermont’s new renewable resource requirement. Assuming the state requirement would extend to 2016, new renewable resources would need to generate 500 GWh of electric energy annually by 2016. Maine established a requirement for new growth in the state’s renewable resource capacity starting in 2008. It requires a 1% increase in new renewable capacity based on the state’s total generation capacity on December 31, 2007, and reaching a total of 10% by the end of 2017 of that 2007 capacity.122 This translates to a new capacity requirement of 310 MW by 2017. The ISO “converted” this requirement into an estimate for electric energy production on the basis of a mix of renewables of this capacity proportional to the mix of the renewable projects in the ISO’s Generator Interconnection Queue in Maine, 98% of which are onshore wind projects. Using an assumed capacity factor (CF) of 32% for onshore wind, which was the assumption used in the ISO’s recent Scenario Analysis initiative (see Section 10), the ISO projects that by 2016 the new renewable capacity sources in Maine could generate 930 GWh of electric energy annually.123
8.3.3 New Energy-Efficiency Requirements
Although in New England, utility energy-efficiency programs generally are funded from ratepayer charges, Connecticut and Massachusetts have added new energy-efficiency requirements. Connecticut added an RPS Class III specifically for energy efficiency or CHP, which relates to energy efficiency because it uses fuel more efficiently. The percent requirements for this class are shown in Table 8-2. The ISO estimated that by 2016, this Connecticut class would require energy-efficiency resources to provide an additional 1,450 GWh annually. In June 2007, the governor and legislative leaders in Massachusetts set a goal to meet all growth in the state’s electricity use within three years with energy efficiency. For the purpose of this New England analysis, the ISO assumed this goal would continue throughout the next 10 years and estimated that 5,490 GWh of new energy-efficiency resources would be needed annually by 2016, based on the current ISO forecast of Massachusetts’s electric energy use.
121 Sustainably Priced Energy Enterprise Development System, Rule 4.300 (Montpelier, VT: Vermont Public Service Board, September 10, 2006), http://www.state.vt.us/psb/rules/OfficialAdoptedRules/4300_SPEED.pdf. 122 An Act to Stimulate Demand for Renewable Energy, LD 1920, Public Law, Chapter 403 (Augusta, ME: Maine State Legislature, June 15, 2007), http://janus.state.me.us/legis/LawMakerWeb/externalsiteframe.asp?ID=280025923&LD=1920&Type=1&SessionID=7. 123 A generator's capacity factor represents its amount of utilization over a specified time period (usually one year). A high CF represents a high amount of operation, which is typical of a baseload generator, while a low CF represents little operation, which is typical of a peaking generator. Capacity factor equals the megawatt-hour production of a generator divided by the product of its nameplate rating in megawatts and the hours in the period of interest. The capacity factor for this analysis was based on the assumption from Scenario Analysis for onshore wind. See Final Scenario Analysis Modeling Assumptions, Slide 28 (Holyoke, MA: ISO New England, May 21, 2007), http://www.iso-ne.com/committees/comm_wkgrps/othr/sas/mtrls/may212007/final_sa_modeling_assumptions.pdf.

2007 Regional System Plan 67 ISO New England Inc.
8.3.4 Compliance with Renewable Portfolio Standards
Massachusetts, Maine, and Connecticut already have historical years of RPS compliance. In 2005, the Massachusetts’s RPS required LSEs to provide 2.0% of their electricity using renewable resources. The LSEs in Massachusetts met about 62% of this requirement from RPS-qualified generation. For the remaining 38%, the LSEs made Alternative Compliance Payments at $53.19/MWh, paying a total of $19.6 million. New England projects, mostly landfill gas and biomass projects, supplied 86% of the 62% of electricity generated by RPS-renewable sources.124 The rest of the RPS-qualified generation projects were from New York. In 2005, Maine’s renewable resources provided 33% of that state’s electric energy. Hydro provided about 18%, biomass provided 12%, municipal solid waste generators provided 3%, and other eligible sources provided a small amount.125 In Connecticut, all the retail suppliers and LSEs complied with that state’s 2005 RPS by purchasing RECs from Connecticut RPS-qualified facilities.126 For 2005, Class I resources needed to supply 1.5% of the total electric energy provided, and Class II resources needed to supply 3.0%. Biomass plants supplied 42% of the Class-I-qualified RECs, landfill gas supplied 41%, run-of-the-river hydro supplied 15%, and wind and fuel cells supplied about 1% each. Trash-to-energy plants supplied 60% of the Class-II-qualified RECs, run-of-the-river hydro supplied 25%, and biomass plants provided 15%.
8.3.5 ISO’s Projected Outlook for New RPS Requirements
To help provide a New England-wide outlook of the requirements for RPSs and other related state policies, the ISO performed two analyses. One analysis summarized all the RPS and related state policy requirements, and the second focused on the policies that are creating the significant growth requirements for renewable resources in New England. As described below and shown in Table 8-3, the various state RPS classes and other policy requirements have been grouped into four categories:
1. Existing—RPS requirements provided by existing renewable resources. This includes Maine and Rhode Island’s “existing” category and New Hampshire’s Classes III and IV. All these include some growth due to the ISO’s total estimated growth in demand for each state over the next 10 years. New Hampshire’s Classes III and IV also include some growth in the percentage requirements for several years, as shown in Table 8-3.
2. New—RPS requirements using new renewable resources. This category includes
requirements with the most new growth in Massachusetts, Rhode Island, Connecticut, and New Hampshire.
124 Annual RPS Compliance Report for 2005 (Boston: MA DOER, February 20, 2007), http://www.mass.gov/doer/rps/rps-2005annual-rpt.pdf. 125 2006 Annual Report on Electric Restructuring (Augusta, ME: ME Public Utilities Commission, December 31, 2006), http://www.maine.gov/mpuc/staying_informed/legislative/2006legislation/ERreport2006-final.doc. 126 DPUC Investigation into Renewable Portfolio Standards Compliance for 2005, Docket No, 06-09-17 (New Britain, CT: CT Department of Public Utilities Control, July 25, 2007), http://www.dpuc.state.ct.us/dockcurr.nsf/6eaf6cab79ae2d4885256b040067883b/41011aa77a3fd2d78525732b006e5aef/$FILE/060917-072507.doc.

2007 Regional System Plan 68 ISO New England Inc.
3. Other—Other state requirements for new renewable resources. This includes Vermont’s requirements for meeting the estimated new growth in demand with renewable resources and Maine’s new renewable capacity requirement converted to an estimated projection of the electric energy production likely from the renewable resources added in Maine.
4. Energy efficiency—New energy-efficiency requirements. This includes Connecticut’s
Class III requirements and Massachusetts’s goal of meeting all growth in demand with energy efficiency extrapolated to 2016.
Table 8-3 shows the 2006, 2007, 2012, and 2016 RPS requirements for generating electricity based on the ISO’s 2007 10-year forecasts for annual electric energy use by state and the RPS percentage requirements shown in Table 8-2. The table organizes these requirements into the above four categories. For each year, the table shows the total amount of electric energy that each of these categories of renewables must generate in each state. It also shows the totals of these requirements as a percentage of the projected total electric energy use in New England. The table shows that by 2016, these four categories of renewables (i.e., existing, new, other, and energy efficiency) would need to supply about 18.7% of the total amount of electricity used in New England. Not including energy efficiency, which represents 4.7% of the total requirement, renewable resources would need to supply about 14.0% of the region's electricity in 2016 to meet the renewable requirements established by the New England states—“new” RPS renewable resources would need to supply about 9.4%, “existing” resources would need to supply about 3.6%, and “other” renewables would need to provide about 1.0%. “New” renewable resources are the focus of the ISO’s assessment because these resources serve as the main driver for the growth in renewable resources.
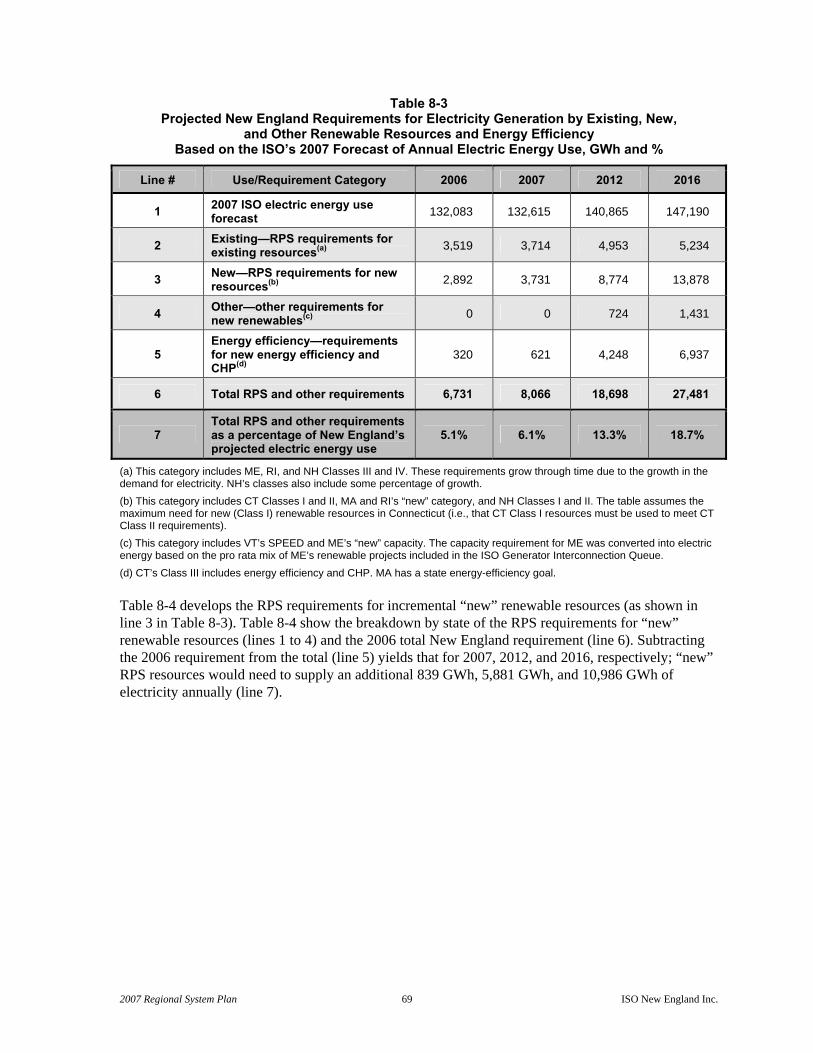
2007 Regional System Plan 69 ISO New England Inc.
Table 8-3 Projected New England Requirements for Electricity Generation by Existing, New,
and Other Renewable Resources and Energy Efficiency Based on the ISO’s 2007 Forecast of Annual Electric Energy Use, GWh and %
Line # Use/Requirement Category 2006 2007 2012 2016
1 2007 ISO electric energy use forecast 132,083 132,615 140,865 147,190
2 Existing—RPS requirements for existing resources(a) 3,519 3,714 4,953 5,234
3 New—RPS requirements for new resources(b) 2,892 3,731 8,774 13,878
4 Other—other requirements for new renewables(c) 0 0 724 1,431
5 Energy efficiency—requirements for new energy efficiency and CHP(d)
320 621 4,248 6,937
6 Total RPS and other requirements 6,731 8,066 18,698 27,481
7 Total RPS and other requirements as a percentage of New England’s projected electric energy use
5.1% 6.1% 13.3% 18.7%
(a) This category includes ME, RI, and NH Classes III and IV. These requirements grow through time due to the growth in the demand for electricity. NH’s classes also include some percentage of growth. (b) This category includes CT Classes I and II, MA and RI’s “new” category, and NH Classes I and II. The table assumes the maximum need for new (Class I) renewable resources in Connecticut (i.e., that CT Class I resources must be used to meet CT Class II requirements). (c) This category includes VT’s SPEED and ME’s “new” capacity. The capacity requirement for ME was converted into electric energy based on the pro rata mix of ME’s renewable projects included in the ISO Generator Interconnection Queue. (d) CT’s Class III includes energy efficiency and CHP. MA has a state energy-efficiency goal. Table 8-4 develops the RPS requirements for incremental “new” renewable resources (as shown in line 3 in Table 8-3). Table 8-4 show the breakdown by state of the RPS requirements for “new” renewable resources (lines 1 to 4) and the 2006 total New England requirement (line 6). Subtracting the 2006 requirement from the total (line 5) yields that for 2007, 2012, and 2016, respectively; “new” RPS resources would need to supply an additional 839 GWh, 5,881 GWh, and 10,986 GWh of electricity annually (line 7).

2007 Regional System Plan 70 ISO New England Inc.
Table 8-4 New England’s Projected RPS Requirements for “New” Renewable Resources, GWh(a)
Line # State 2006 2007 2012 2016
1 Connecticut (Classes I & II) 1,599 2,095 4,175 5,785
2 Massachusetts 1,294 1,552 3,795 6,212
3 Rhode Island 0(b) 84 398 875
4 New Hampshire (Classes I & II) 0(c) 0 406 1,006
5 Total “new” RPS requirements (from Table 8-3, line 3) 2,892 3,731 8,774 13,878
6 2006 “new” RPS requirements(d) 2,892 2,892 2,892
7 Incremental requirements beyond 2006 for “new” RPS resources(c)
839 5,881 10,986
(a) Based on the ISO’s 2007 electric energy use forecast. Modest growth requirements in the “existing” and “other” RPS categories are not included here. (b) Rhode Island’s RPS went into effect in 2007. (c) New Hampshire’s RPS will go into effect in 2008. (d) This assumes that the 2006 requirements for “new” renewable resources will be met by existing renewable projects in New England.
To provide a regional outlook for meeting the requirements by 2016, Table 8-5 compares the incremental requirements shown in Table 8-4 with an assumed total electric energy production from the projects in the ISO Generator Interconnection Queue that would meet the states’ RPS requirements. The table shows estimates of the electricity that the proposed renewable projects in the ISO’s Generator Interconnection Queue (as of May 25, 2007) could provide annually. These estimates are based on an assumed capacity factor for each type of renewable resource project. They also assume that all the projects would be built as proposed and would be certified as RPS projects by the respective states.127 The ISO also estimated the potential for the proposed renewable generation projects in the queue to meet the growth required by the “new” RPS category beyond 2006, as shown in Table 8-5. This potential assumes that the existing state-certified renewable projects will continue to meet current requirements and that most of the future growth in renewable resources most likely will come from grid-connected renewable projects as proposed in the ISO queue.
127 The ISO recognizes that the resources meeting the RPS requirements are based on the certification of the resources by each state. These state-certified projects include generators connected to the grid, generators “behind the meter,” and generators in adjacent control areas (where allowed).

2007 Regional System Plan 71 ISO New England Inc.
Table 8-5 New England Renewable Energy Projects in the ISO Queue
Type (#) of Projects Size (MW)
Assumed Capacity Factor(a)
(%)
Estimated Annual Electricity Production
(GWh)
Hydro (3) 26 25% 57
Landfill gas (3) 15 90% 118
Biomass (8) 326 90% 2,569
Wind onshore (19) 1,526 32% 4,269
Wind offshore (1) 462 37% 1,295
Fuel Cells 67 95% 558
Total (35) 2,467 8,866
(a) Capacity factors are based on the ISO’s Scenario Analysis (see Section 10). The wind capacity factors were adjusted to account for a generic assumption that wind turbines have 90% availability.
All the renewable resource projects in the queue, as shown in Table 8-5, would more than satisfy the increased RPS requirements for 2012 (8,866 GWh of “new” projects compared with 5,881 GWh required). Similarly, comparing the requirements for new renewable resources in 2016 with the queue resources, the total estimated electricity to be generated by these projects appears to be deficient by about 2,120 GWh (10,986 GWh minus 8,866 GWh) in meeting that year’s “new” RPS requirements for the four states shown. To cover this potential RPS compliance gap, about 270 MW of “new” renewable capacity would be needed, if this electric energy were supplied by a baseload renewable project with a 90% capacity factor. Alternatively, if onshore wind projects were to meet this requirement, assuming they have a 32% capacity factor, a total of about 760 MW of new wind projects would be needed in addition to those projects in the queue as of May 25, 2007. In the past, the region has experienced the withdrawal of a significant portion of projects in the queue before the projects were built. The project attrition has been due to project cost escalation, financing, siting, permitting problems, or a combination of these issues. Given that this attrition pattern could continue, the deficiency estimate in meeting the RPS in 2016 probably is understated. Thus, the shortfall may be even greater than that shown by the comparison of Table 8-4 and Table 8-5. This shortfall could be met if additional renewable projects were proposed that are not yet in the queue or by using Renewable Energy Certificates from projects in adjacent control areas that are certified to meet a given state’s RPS. The compliance deficiency could also be met by small renewable projects “behind the meter” or by the LSEs paying the Alternative Compliance Payment. To meet their RPS requirements, Massachusetts and Connecticut have been certifying existing renewable generators generally to meet the “existing” RPS category and, in some cases, requiring technology upgrades. These existing certified renewable generators will likely continue to provide partial compliance for the LSEs for these requirements. However, these existing plants may not be sufficient to meet the increasing requirements that stem from the needed growth in “existing” RPS resources, as shown in Table 8-3, making new renewable projects in the region critical.

2007 Regional System Plan 72 ISO New England Inc.
By 2016, the region will need significantly more renewable projects than those currently in the ISO’s Generator Interconnection Queue to meet the projected growth in the RPSs of the New England states. If some of the proposed projects are withdrawn from the existing queue, as consistent with past experience, this need will be even greater than estimated for RSP07.
8.4 Summary A number of emerging federal, regional, and state air regulations will require New England fossil fuel generators to lower their emissions of SO2, NOX, CO2, and mercury over the next 10 years. The principal regulations are CAIR, affecting SO2 and NOX emissions, and RGGI, which will affect CO2
emissions. In addition, existing plants will likely face tighter requirements for thermal discharges into waterways. These all have a potential impact on fossil fuel plants, and thermal discharge requirements will affect larger fossil and nuclear generators in New England in ways that could affect system reliability. The portion of electric energy that renewable resources and energy efficiency will need to provide of New England’s total projected electric energy use will increase to approximately 18.7% by 2016, up from about 5.1% in 2006. State requirements for new energy-efficiency programs make up about 4.7% of the 18.7%; the remainder is attributable to Renewable Portfolio Standards and related policies. If all projects in the ISO Generator Queue were built, the ISO estimates that they would meet 81% of the need for the growth of new renewables. The shortfall could be filled by additional projects being proposed for the queue, small “behind-the-meter” renewable projects, or the purchase of RECs from projects in neighboring regions. Alternatively, LSEs will be able to make Alternative Compliance Payments to the states’ clean energy funds, which help finance new renewable projects.

2007 Regional System Plan 73 ISO New England Inc.
Section 9 Transmission Security and Upgrades Much progress has been made over the past few years in analyzing the transmission system and developing solutions to address existing and projected inadequacies. From 2002 to June 2007, 182 projects have been placed in service for a total of $974 million in new transmission investment.128 Nine major 345 kV projects are in various stages of development in the region. Four of these projects are expected to be placed in service by the end of 2007. Not only are these transmission upgrades critical for maintaining bulk transmission system reliability and meeting NERC and NPCC reliability standards (see Section 4.1), they also can improve the economic performance of the system. Over the next five to 10 years, all of these projects will enhance the region’s ability to support a robust, competitive wholesale power market by reliably moving power from various internal and external sources to the region’s load centers. This section discusses the basis for transmission security and the performance of the transmission system in New England. It addresses the need for transmission upgrades, including improvements to load and generation pockets, based on known plans for the addition of resources. It also updates the progress of the current major transmission projects in the region. Information regarding the detailed analyses associated with many of these efforts can be found in RSP06, other PAC presentations, and previous regional plans.129
9.1 Basis for Transmission Security A reliable, well-designed transmission system is essential for meeting mandatory reliability standards and providing regional transmission service that serves a number of purposes, as follows:
• Provides for the secure dispatch and operation of generation
• Delivers numerous products and services:
o Capacity o Electric energy o Operating reserves o Load-following o Automatic generation control o Immediate contingency response for sudden generator or transmission outage
Transmission systems also assist in the following tasks:
• Improving the reliability of and access to supply resources
• Regulating voltage and minimizing voltage fluctuations
128 RSP07 Transmission Projects Listing, July 2007 Update, http://www.iso-ne.com/trans/sys_studies/rsp_docs/pres/indx.html. 129 RSP06, Section 9, http://www.iso-ne.com/trans/rsp/2005/index.html.

2007 Regional System Plan 74 ISO New England Inc.
• Stabilizing the grid after transient events
• Using existing regional resources efficiently
• Reducing reserves required for the secure operation of the system
• Facilitating the scheduling of equipment maintenance
9.2 Transmission Planning The complexities associated with operating the bulk power system are a major factor that drives the need to plan for and improve the transmission system, which can reduce or eliminate these complexities. All proposed system modifications, including transmission and generation additions or significant load reductions or additions, must be analyzed and designed carefully to ensure systemwide coordination and continued system reliability. For example, infrastructure throughout many parts of the system, which was planned and implemented many years ago, is becoming increasingly inadequate. In addition to relatively old, low-capacity 115 kV lines, many of which were converted from 69 kV design, a number of aging 345/115 kV transformers and generating stations are connected to the 115 kV system. This increases the risk of the system experiencing extended equipment outages, which cannot be repaired or replaced quickly. Thus, many of the transmission system projects underway in the region will facilitate the operation of those areas of the system currently complicated by equipment age, as well as facilitate generator dispatch, the use of special protection systems (SPSs), load levels, and facility outages, for example. The ISO develops its plans for the networked transmission facilities, which provide regional network service to address cost effectively both local and broad system needs. All plans are reviewed to ensure that they can be implemented without degrading the performance of the New England system, the NPCC region, or the remainder of the Eastern Interconnection.130 In addition to preparing this 10-year RSP07 consistent with compliance with NERC planning standards, the ISO also is examining the five- and 10-year outlook for system performance on the basis of forecasted load levels and the expected transmission configuration for 2012 and 2017. This high-level study will identify whether marginal conditions for the five-year horizon may require solutions with longer lead times. If so, additional transmission system expansion plans will be developed, as required by NERC planning standards. These conceptual plans will provide guidance on developing more detailed system assessments and solutions. Further analyses and the development of refined solutions will be conducted through the normal regional system planning process.
9.3 Transmission System Performance and Needs The New England bulk power system serves a diverse region, which ranges from rural agricultural areas to densely populated urban areas, integrating widely dispersed and varied types of power supply resources to meet the region’s demand for electricity. The geographic distribution of New England’s summer and winter peak loads is approximately 20% in the northern states, Maine, New Hampshire, and Vermont, and 80% in the southern states, Massachusetts, Connecticut, and Rhode Island. Although the northern states’ land area is larger than the southern states’, the greater urban
130 The Eastern Interconnection consists of the interconnected transmission and distribution infrastructure that synchronously operates east of the Rocky Mountains, excluding the portion of the system located in the Electric Reliability Council of Texas (ERCOT) and Québec.
2007 Regional System Plan 75 ISO New England Inc.
development in the south creates the relatively larger southern demand and corresponding transmission density. The New England bulk transmission system is composed of mostly 115 kV, 230 kV, and 345 kV circuits and transmission lines in the north that are generally longer and fewer in number than in the south. The New England area has nine interconnections with New York: two 345 kV ties, one 230 kV tie, one 138 kV tie, three 115 kV ties, one 69 kV tie, and one 330 MW high-voltage direct-current (HVDC) tie. Currently, New England and New Brunswick are connected through one 345 kV tie, although a second 345 kV tie is planned to be in service by the end of 2007.131 New England also has two HVDC interconnections with Quebec: a 225 MW back-to-back converter at Highgate in northern Vermont and a +/– 450 kV HVDC line with terminal configurations that allow up to a 2,000 MW delivery at Sandy Pond in Massachusetts. The Transmission Projects Listing is a summary of needed transmission projects for the region.132 The list is updated at least three times per year, although the justification for transmission improvements are discussed on an ongoing basis with the PAC and the Reliability Committee, which provide guidance and comment on study scopes, assumptions, and results. The following sections summarize the status of several transmission planning studies and the need for upgrades.133
9.3.1 Northern New England
The northern New England (NNE) area encompasses the Maine, New Hampshire, and Vermont transmission system. This section discusses the features of northern New England’s transmission system and the studies being conducted to address the area’s transmission system needs.
9.3.1.1 Northern New England Transmission The single 345 kV interconnection between New England and New Brunswick leads into a 345 kV corridor at Orrington, Maine, which spans hundreds of miles and eventually ties into Massachusetts. The transmission system through northern New England is limited in capacity. Underlying the limited number of 345 kV transmission facilities are a number of old, low-capacity, and long 115 kV lines. These lines serve a geographically dispersed load as well as the concentrated, more developed load centers in southern Maine, southern New Hampshire, and northwestern Vermont. Figure 9-1 and Figure 9-2 show the distribution of northern New England’s typical summer-peak load and generation, respectively. Figure 9-3 shows the area’s summer-peak transmission flows.
131 One exception is that Aroostook and Washington Counties in Maine are served radially from New Brunswick. 132 RSP07 Transmission Projects Listing, July 2007 Update, http://www.iso-ne.com/trans/rsp/index.html. 133 Further detailed information on individual transmission projects can be obtained by contacting ISO Customer Service at (413) 540-4220.
2007 Regional System Plan 76 ISO New England Inc.
This graphic has been redacted
and may be accessed by calling
ISO New England Customer Service
at (413) 540-4220.
Figure 9-1: Northern New England summer-peak load distribution.
This graphic has been redacted
and may be accessed by calling
ISO New England Customer Service
at (413) 540-4220.
Figure 9-2: Northern New England generation distribution.

2007 Regional System Plan 77 ISO New England Inc.
This graphic has been redacted
and may be accessed by calling
ISO New England Customer Service
at (413) 540-4220.
Figure 9-3: Typical northern New England summer-peak transmission flows.
The northern New England transmission system is weak in places and faces numerous transmission security concerns. The most significant issues facing the area have been to maintain the general performance of the long 345 kV corridor and the reliability of supply to meet demand. The region faces thermal and voltage performance issues and stability concerns and is reliant on several special protection systems that are subject to incorrect or undesired operation (see Section 9.3.1.2). Rapid load growth has raised particular concerns in northwestern Vermont; the southern and seacoast areas of New Hampshire and Maine; and the tri-state “Monadnock” area of southeastern Vermont, southwestern New Hampshire, and north-central Massachusetts. The system of long 115 kV lines with weak sources and high real- and reactive-power losses is exceeding its ability to efficiently and effectively serve load as well as integrate generation. In many instances, the underlying systems of 34.5 kV, 46 kV, and 69 kV lines are also exceeding their capabilities and must be upgraded, placing greater demands on an already stressed 115 kV system. Over the last several years, the addition of 3,000 MW of this generation in Maine and New Hampshire, in combination with the area’s limited transfer capability and limited transmission expansion, has increased the likelihood of operating the system near its limits for all northern New England interfaces and creating restrictions on northern resources. Because these interface limits depend on generation dispatch, the operation of the system becomes complex. Additional concerns in northern New England include limited system flexibility to accommodate maintenance outages, limited dynamic reactive-power resources, and high real- and reactive-power losses.
9.3.1.2 Northern New England Transmission System Studies Study efforts are progressing in various portions of Maine, New Hampshire, and Vermont to address a number of 115 kV system concerns. Some of these studies have focused on defining short-term needs and developing solutions. While some longer-term analyses have been conducted or are in their

2007 Regional System Plan 78 ISO New England Inc.
initial phases, additional work is required to develop comprehensive solutions for this part of the system. Maine. Some of the system needs of the Bangor Hydro Electric and southern Maine areas have been identified. The 115 kV transmission lines proposed and under study should improve the performance of the Bangor system. Central Maine Power (CMP) is proposing 115 kV expansions in western Maine to address area thermal and voltage issues. Upgrades north of Augusta and near Rumford, including a new 115 kV substation, will reduce potential voltage concerns. Additional system reinforcements south of Orrington are being explored to address issues. Reinforcements at 115 kV, including the addition of a new substation at Maguire Road in southern Maine, will help serve southern Maine load in the near term. New Hampshire. A number of studies of the New Hampshire portion of the system have been conducted. The midterm needs of northern and central New Hampshire will be addressed by closing the Y-138 tie with Maine (see below). A number of 115 kV transmission reinforcements are already under development in southern New Hampshire. Studies have indicated a midterm need for additional 345/115 kV area autotransformers, most likely at Scobie, at Deerfield, and near Newington. Longer-term studies are needed to determine the reinforcements necessary for supporting load growth in these areas. Transmission improvements in New Hampshire intended to address the local growth in demand will likely have the ancillary benefit of improving the overall performance of this area. Additionally, new legislation in New Hampshire, Senate Bill (SB) 140, which was signed into law on July 17, 2007, could influence future transmission needs.134 SB 140 states that it is in the public interest for New Hampshire to encourage the development of renewable energy. To develop substantial renewable resources, existing transmission infrastructure, particularly in the northern part of the state, will need to be upgraded or replaced, or new transmission facilities will need to be built. The new law also states that appropriate upgrades to the transmission infrastructure are important to economic development. To further comply with its duties under RSA 374-F-8, the NH PUC must facilitate discussions among interested parties regarding the upgrade of transmission in the northern part of the state and report on these discussions by December 1, 2007.135 This report must address New Hampshire’s existing transmission system; the current progress for siting, constructing, and financing transmission upgrades and expansion; the approximate costs of potentially appropriate transmission upgrades; approaches pursued by other states to encourage transmission expansion related to renewable generation; and actions the PUC has taken to advance New Hampshire interests with respect to transmission. Vermont. Study efforts to assess the needs of Vermont have also progressed. A set of transmission reinforcements, the Northwest Vermont (NWVT) Reliability Project, which is partially in-service, is designed to address the diminishing reliability of the broad northwestern portion of Vermont in the near term and midterm. A number of solutions continue to be studied to address concerns in southern Vermont, including subtransmission issues, specifically between Bennington and Brattleboro. Transmission upgrades in the Burlington area have been designed to maintain adequate supply in the event of a transmission or subtransmission outage, as well as to facilitate load growth. A longer-term 134 Senate Bill 140—Final Version, Transmission Infrastructure; Action by Public Utilities Commission. (Concord, NH: State of New Hampshire, July 17, 2007), http://www.gencourt.state.nh.us/legislation/2007/sb0140.html. 135 Electric Utility Restructuring, Chapter 374-F, Section 374-F-8. (Concord, NH: State of New Hampshire, May 22, 2001), http://www.gencourt.state.nh.us/rsa/html/XXXIV/374-F/374-F-8.htm.

2007 Regional System Plan 79 ISO New England Inc.
analysis conducted by the Vermont Electric Power Company (VELCO) confirmed Vermont-state transmission system reliability concerns highlighted in previous analyses. The results demonstrate a need for a combination of further expansion of the 115 kV and 345 kV, and potentially the 230 kV, transmission network. System reinforcements, which may include new as well as upgraded transmission facilities, will be studied to resolve these reliability issues. Monadnock region. The Monadnock region encompasses a three-state area of southeastern Vermont (Brattleboro to Bellows Falls and Ascutney), southwestern New Hampshire (Keene north to Claremont), and north-central Massachusetts (Pratts Junction to the northern border with New Hampshire). In addition to supplying localized load, the transmission facilities in this region are critical for supplying a wider area, including most of Vermont and northern New Hampshire. A new 345/115 kV substation at Fitzwilliam, New Hampshire, and a number of 115 kV upgrades are being developed to address existing and midterm voltage and thermal performance concerns. Studies indicate that future transmission system reinforcements most likely will be needed in this area. In addition to conducting the above studies, the ISO is identifying upgrades that will address voltage and stability issues and the thermal performance of key northern New England transmission corridors. These analyses are assessing options to maintain or improve current and future system reliability. Some of the projects will likely have the ancillary benefit of improving the overall performance of the Northern New England transmission system by increasing the transfer capabilities of the northern New England interfaces and reducing operational interdependencies of specific generator outputs and the related transfer capability of the system. The sections of the system most notably affected by these analyses are as follows:
• Orrington–South interface
• Surowiec–South interface
• Maine–New Hampshire interface
• Northern New England Scobie and 394 interface
• North–South interface
The ISO has identified alternatives that address these transmission system performance issues, either individually or in combination. Some of these alternatives, as described in the previous sections, address more subregional reliability issues and also have the ancillary benefit of improving the performance of these transmission corridors. The alternatives are as follows:
• Closing the Y-138 line. This project, actively being developed to address central New Hampshire reliability needs, also will provide some limited improvement to the Surowiec–South and Maine–New Hampshire voltage and thermal performance problems. The planned in-service date for this project is 2008.
• Londonderry Reliability Reinforcement Project. This project is adding a third 345/115 kV autotransformer at the Scobie 345 kV substation and one 115 kV interconnection for the expansion of the Mammouth Road substation. The loss of local autotransformers results in a redistribution of power flows on the remaining transmission lines. This condition also stresses import capabilities from other areas in New Hampshire and from neighboring electric systems. Under certain system conditions, the loss of one of the Scobie 345/115 kV
2007 Regional System Plan 80 ISO New England Inc.
transformers can overload the remaining one. The addition of the third autotransformer will eliminate this scenario.
• New Hampshire Seacoast Reliability Project. The need for additional 345 kV transformation capability is necessary to reduce autotransformer loadings and 115 kV transmission line power flows. The components of this proposed project will address these reliability requirements. The NH Seacoast Reliability Project consists of the following plans:
o Looping section 391 of the Buxton–Scobie 345 kV line into the Deerfield 345 kV substation. This project would reduce the complexities and interdependencies of the generator output and voltage limits of the Surowiec–South and Maine–New Hampshire interfaces. It could also help improve the thermal-transfer capability of these interfaces.
o Upgrading 115 kV facilities near the southern Maine–New Hampshire border. These upgrades will address load growth in the coastal area of New Hampshire and southern Maine and help mitigate potential thermal overloads and voltage concerns near the Maine–New Hampshire border during peak-load or shoulder peak-load periods.
o Adding a new 345/115 kV Gosling Road substation adjacent to the existing 345 kV Newington substation and 115 kV Schiller substation. These upgrades add two new 345/115 kV autotransformers and two 345 kV bus sections with separate transmission ties from the existing Newington substation. Each transmission tie serves one 345/115 kV autotransformer to provide a strong supply from the 345 kV network into the New Hampshire Seacoast area.
• Maguire Road Switching Station 115 kV Project. Various single-element contingencies, numerous 115 and 345 kV stuck breaker contingencies, and several 115 kV bus faults result in post-contingent or outage voltage levels below reliability criteria. Many of these outages also create thermal loading violations on the 115 kV transmission lines between South Gorham substation and Three Rivers substation. Future load growth will continue to aggravate violations of reliability criteria. This project consists of the following plans:
o Eliminating critical Buxton 345 kV contingencies resulting from the failure of key circuit breakers. The installation of four additional 345 kV breakers at Buxton will eliminate critical contingencies that contribute to complex steady-state and stability limitations of the Surowiec–South and Maine–New Hampshire interfaces.
o Mitigating violations of voltage and thermal reliability criteria within CMP’s southern Maine transmission system. Upgrades include 30 miles of rebuilding three 115 kV lines and nine miles of reconductoring one 115 kV line. In addition, reactive support is required to alleviate violations of voltage reliability criteria in southern Maine.
• Rumford–Woodstock–Kimball Road (RWK) Corridor Transmission Project. The northwestern Maine transmission system is influenced heavily by pulp and paper industrial load, yet it also has significant area generation, which is presently the area’s main source of voltage support. The needs for additional transmission and voltage support have been identified. The RWK project upgrades include constructing a new transmission line, upgrading existing transmission lines, installing additional capacitor banks, and changing substation configurations. All these upgrades will increase the system reliability of the western Maine network. The planned in-service date for this project is the end of 2008.
2007 Regional System Plan 81 ISO New England Inc.
• Haywood Road (formerly Benton) Project. Transmission upgrades are required to mitigate low voltages and voltage collapse in the Skowhegan–Waterville–Winslow area that could result from the contingent loss of section 84, a line that connects Maxcys and Winslow. A new switchyard connecting section 83 and section 67A in a six-breaker ring-bus configuration will provide an additional path from Maxcys to the Waterville–Winslow area. (Section 83 is a 115 kV line between Winslow and Wyman Hydro, and section 67A is a 115 kV tap off section 67 between Detroit and Maxcys that goes to Rice Rips.) This new switchyard will enable the system to tolerate the loss of section 84 without causing severe voltage sags in the area. The upgraded Haywood Road switchyard will be located along an existing right-of-way where sections 67A and 83 can be joined at a common point. This project also includes the addition of a 20 MVAR capacitor bank at the Haywood Road switchyard and an upgrade of portions of section 83 between Wyman Hydro and the switchyard.136 The planned in-service date for this project is the end of 2008.
• Maine Power Reliability Program (MPRP). This study provides a 10-year look at the Maine transmission system and has identified the following inadequacies for meeting reliability criteria in the future:
o Insufficient 345 kV transmission—Maine currently has two 345 kV transmission paths from southern to central Maine, and it is building a second tie from northern Maine to New Brunswick. In the central part of the system, Maine has a single 345 kV path, which limits reliability performance and is a weak link in the system.
o Insufficient 345/115 kV transformation capacity—The reliability of Maine’s 115 kV system depends on the capacity and availability of autotransformers at five locations. Overloads of the autotransformers with all-lines-in service illustrate insufficient transformation capacity.
o Insufficient 345 kV transmission support for Portland and southern Maine—The South Gorham 345 kV substation is the single bulk power source for the largest load pocket in Maine, which is served by a radial 345 kV transmission line. Any outage of this line or the autotransformer may cause overloads on the remaining system and voltage collapse in this area.
o Insufficient transmission infrastructure in western, central, and southern Maine regions—Each of these regions in Maine represents a major load pocket that depends on local generation to meet reliability standards.
o Insufficient transmission infrastructure in Midcoast and Downeast Maine regions—These regions in Maine represent load pockets with no local generation and fully depend on the transmission system.
This study will identify transmission upgrades to serve load pockets and ensure that the system will meet national and regional transmission reliability criteria. Not only are these upgrades critical for maintaining bulk transmission system reliability and meeting reliability standards, they likely will provide the ancillary benefit of improving the maintainability of the system in Maine. The transmission alternatives identified will be evaluated to determine the most cost-effective and strategic transmission system expansion plan to address both reliability needs in Maine, in coordination with systemwide needs.
136 MVAR stands for “megavolt-ampere reactive.”

2007 Regional System Plan 82 ISO New England Inc.
• Maine Power Connection. Currently, the Maine Public Service (MPS) territory is served solely from interconnections to New Brunswick. CMP and Maine Public Service have agreed to study the feasibility of a new interconnection between the MPS system (including existing and planned generation) and the MEPCO system, which would provide a direct electrical connection to the New England transmission system. An initial scope document was developed, and this study effort will be coordinated with the Maine Power Reliability Program, although this is a separate study. (Refer to Section 11.2.3.)
• Adding capacitor banks in western Maine and at Maxcys. These additions could improve the Maine–New Hampshire voltage limits and support local voltage requirements. As transmission solutions are developed to address the needs identified by the MPRP, the need for these capacitor banks likely will be addressed.
• Redesigning the SPSs at Maxcys and Bucksport. The MEPCO SPS will replace the Maxcys SPS and Bucksport overcurrent SPSs. It will eliminate a number of system concerns, including poor transient-voltage response in the local area, possible inadvertent SPS operation, difficulty in ensuring the proper operation of the normal line-protection equipment, and a discontinuity in the protection provided by the existing system. The planned in-service date for this project is the end of 2007.
• Adding a 500 to 600 MVAR dynamic-reactive device to provide voltage control at the Deerfield 345 kV substation. This project would reduce the complexities and interdependencies of the generator output and voltage limits of the Maine–New Hampshire interface and could increase the Maine–New Hampshire and northern New England Scobie and 394 interface stability limitations.
• Adding a major north–south reinforcement (such as a Scobie–Tewksbury 345 kV line). Studies are necessary to examine reinforcements for the 345 kV transmission corridor connecting northern and southern New England, links that are vital to both areas. Significant reinforcement will be necessary to sustain existing levels of north–south transfers at the higher Boston import levels that will be attainable with the Boston-area improvements (see below). Load growth has already illustrated the diminished ability of the key north–south 345 kV facilities to sustain historical transfer levels. Additionally, as load continues to grow in northern New England, such a reinforcement may be necessary to ensure sufficient transfer capability into the northern states during periods of generation unavailability or a lack of Canadian imports.
9.3.2 Southern New England
The southern New England area encompasses the Massachusetts, Rhode Island, and Connecticut transmission system. This section discusses the features of southern New England’s transmission system and the studies being conducted to address this area’s transmission system needs.
9.3.2.1 Southern New England Transmission The 345 kV facilities that traverse southern New England comprise the primary infrastructure that integrates southern New England, northern New England, and the Maritimes Control Area with the rest of the Eastern Interconnection. This network serves the majority of New England demand, integrating a substantial portion of the region’s resources. Figure 9-4 and Figure 9-5 show the distribution of southern New England’s summer-peak load and generation, respectively. Figure 9-6 shows the area’s typical summer-peak transmission flows.
2007 Regional System Plan 83 ISO New England Inc.
This graphic has been redacted
and may be accessed by calling
ISO New England Customer Service
at (413) 540-4220.
Figure 9-4: Southern New England summer-peak load distribution.
This graphic has been redacted
and may be accessed by calling
ISO New England Customer Service
at (413) 540-4220.
Figure 9-5: Southern New England generation distribution.

2007 Regional System Plan 84 ISO New England Inc.
This graphic has been redacted
and may be accessed by calling
ISO New England Customer Service
at (413) 540-4220.
Figure 9-6: Typical southern New England summer-peak transmission flows.
The southern New England system serves the majority of load in New England. The area faces thermal, low-voltage, high-voltage, and short-circuit concerns, the most significant being to maintain the reliability of supply to serve load and develop the transmission infrastructure to integrate generation throughout this area. In many areas, an aging low-capacity 115 kV system has been overtaxed and is no longer able to serve load and support generation reliably. Upgrades to the bulk power system are currently being planned and developed to ensure that the system can meet its current level of demand and prepare for future load growth (see Section 3).
9.3.2.2 Southern New England Transmission System Studies Study efforts in southern New England have been progressing to address a wide range of system concerns. Past and ongoing major efforts have focused on the load areas with the most significant risks to reliability and threats to the bulk power system, particularly the Boston area and southwestern Connecticut. Recent efforts have been undertaken to address the reliability of other parts of the system, particularly in western Massachusetts, including the Springfield area, and Rhode Island, as well as the broad east–west transmission system requirements. While many of the major efforts have primarily focused on near-term and midterm concerns, longer-term analyses also have been performed, particularly for the 115 kV system. Massachusetts. A number of studies have addressed the Boston and northeastern Massachusetts areas. The short-term NEMA/Boston upgrades were placed in service in the 2001 to 2002 timeframe. The first phase of the NSTAR 345 kV Transmission Reliability Project has been placed in service, and the second phase is scheduled to be in service by the end of 2008; the Ward Hill substation reinforcements already have been placed in service. Studies have been completed to support the addition of a Wakefield substation in the North Shore area, an upgrade that should support area reliability for a longer-term period. Additional reactors also have been placed in service at North Cambridge and Lexington to address high-voltage control during light-load periods. Studies are ongoing to assess the long-term requirements for low- and high-voltage control.

2007 Regional System Plan 85 ISO New England Inc.
Located to the west of the Boston area, the central Massachusetts transmission system is instrumental in integrating imports from the +/– 450 kV HVDC Phase II interconnection to Hydro-Québec and distributing them to the 345 kV system as well as to the lower-voltage systems. The long-range study of this area resulted in the plan to develop the Wachusett 345/115 kV substation. Additional studies are underway to further address the reliability needs in central Massachusetts and adjoining areas of western Massachusetts. These studies are looking at a 10-year planning horizon and different scenarios with respect to load growth and generation dispatch. The solution likely will include additional 345/115 kV transformation in the area and some upgrades to the 115 kV and 69 kV systems. Studies suggest that system improvements are needed to support the reliability of the far western Massachusetts area. Two capacitor banks have been installed in 2006, one at the Pleasant 16B substation and one at the Woodland 17G substation. The capacitors eliminate the dependence on Woodland Road unit #10 but not the Pittsfield generating facility. Studies are presently being conducted to evaluate options to address concerns in the area. A possible solution could include adding 345/115 kV autotransformers, 230/115 kV autotransformers, or a combination of both in the area to mitigate thermal and voltage concerns. The comprehensive New England East–West Solution (NEEWS) analysis performed for the entire southern New England region revealed numerous reliability problems in the Greater Springfield area.137 The transmission system in the Springfield area consists of a large number of aging double-circuit tower (DCT) structures and antiquated cable systems. This system also serves as a path for power flow to the Connecticut load pocket. Under stressed system conditions of load levels, generation dispatch, and external interface flows, a number of facilities in the Greater Springfield area can overload and experience low-voltage conditions. Projects to address these problems in Greater Springfield have been identified and are currently being implemented. Recent operating experience has identified the need to develop procedures for committing generating units in lower southeastern Massachusetts. The procedures ensure that adequate generation has been committed to address second-contingency protection for the loss of two major 345 kV lines. This situation has resulted in some significant out-of-merit operating costs. Studies of what has become known as the Lower SEMA area are ongoing to develop both short- and long-term plans to reduce the reliance on these units. The short-term proposed plan with an in-service date of 2008 includes the following actions:
• Looping the Bridgewater–Pilgrim 345 kV line into the Carver substation • Adding a second Carver autotransformer • Expanding the Carver 345 kV and 115 kV substations and the Brook Street and Barnstable
115 kV substations • Upgrading the Kingston terminal of the 191 line between Kingston and Auburn Street
137 The comprehensive analysis of system needs in the southern New England region is known as the Southern New England Transmission Reinforcement (SNETR) study. As part of this effort, on August 7, 2006, the ISO issued a draft report, Southern New England Transmission Reliability Needs Analysis. The report is posted on the ISO’s password-protected PAC Web site, which can be accessed by contacting ISO Customer Services at (413) 540-4220. This major study effort has spawned short-term groups of projects in the Springfield and Rhode Island areas as well as the major longer-term projects now referred to by the participating transmission owners as the New England East-West Solution.
2007 Regional System Plan 86 ISO New England Inc.
• Installing a second Carver–Tremont 115 kV line • Connecting the spare conductors of the Jordan Road–Auburn Street line as a new Brook
Street–Auburn Street 115 kV circuit • Adding 115 kV breakers at Auburn Street • Reconnecting the Auburn Street–Kingston line to a new position at Auburn Street • Adding a dynamic VAR device at Barnstable
Several of the long-term alternatives, although still under study and in the conceptual stage, include adding either a 345 kV or possibly a 115 kV Cape Cod canal crossing and extending the 345 kV facilities further down the Cape. The previous addition of the Canal–Bourne autotransformer in the Cape Cod area significantly improved the performance of the area’s transmission system. The completed second supply to Nantucket and the capacitor additions now provide firm load service to the island. Remedying the adverse system response to the loss of the 345 kV double-circuit canal crossing is currently being studied, as previously mentioned, as part of the long-term Lower SEMA analysis. Static capacitors to provide additional voltage support have been scheduled for installation in 2007; dynamic voltage support will be put in place in 2008 also, as mentioned, as part of the short-term Lower SEMA projects. The 115 kV system in the Bridgewater–Somerset–Tiverton areas of southeastern Massachusetts and the adjoining area in Rhode Island have reliability concerns. Studies are underway to mitigate the reliability problems that were identified. Proposed solutions include the construction of new 115 kV transmission circuits from Brayton Point to Somerset and from Somerset to Bell Rock. Rhode Island. Studies of the Southern Rhode Island (SRI) area have identified the need for 115 kV upgrades to address long-term reliability and allow line 1870’s special protection system to be retired. The construction of some components of the southern Rhode Island improvements is already underway. The comprehensive analysis performed for the entire southern New England region revealed other reliability problems on the Rhode Island 115 kV system, in and around the Providence area. The possible mitigating solutions to these transmission constraints have been identified and currently are being reviewed in detail. Connecticut. The Southwest Connecticut Reliability Study identified needed reinforcements for the southwestern Connecticut area. Construction is complete for the Bethel–Norwalk phase of the SWCT Reliability Project, and the Middletown–Norwalk phase of this project currently is under construction. Studies indicate that additional longer-term area reinforcements may be necessary, particularly in the Bridgeport and New Haven areas. The planned Norwalk–Glenbrook 115 kV cable circuits should provide long-term reinforcement of the Stamford area. A number of other Connecticut reliability issues currently are being examined or addressed. Studies are examining alternatives to address low voltages on the 115 kV system in the Naugatuck Valley. Alternatives are being evaluated that can improve reliability in the Groton/Mystic area. The new Haddam 345/115 kV station has been added to improve reliability to the Middletown area, although operating studies suggest that a second 345/115 kV transformer may be needed to maintain longer-term reliability. Studying the addition of this second transformer has not yet begun, however. The new Killingly 345/115 kV substation has been constructed and is in service. This new substation and the 345/115 kV autotransformer address reliability concerns in the eastern Connecticut area; studies

2007 Regional System Plan 87 ISO New England Inc.
will be conducted to evaluate the future need for a second 345/115 kV transformer. Study work has been completed to identify the need and to support the construction of a 345/115 kV substation in the Manchester/Barbour Hill area with a new 345/115kV autotransformer. The comprehensive analysis performed for the entire southern New England region revealed a number of reliability problems in the Hartford area. If local generation is out of service, contingencies could lead to the thermal overload of local transmission lines. Solutions have been identified and are currently being reviewed in greater detail. Additional study work in this area may be necessary in the near future. Southern New England region. The ISO continues to analyze the short- and long-term needs of the bulk power system and transmission reinforcements for the southern New England region. Recently conducted regional planning studies identified a number of different emerging reliability issues, which regional stakeholders initially pursued solving independently. As described in RSP05 and RSP06, these analyses, which cover a large portion of New England load, identified many interrelationships among the transmission reinforcement projects in the region, such as for the Springfield area, Rhode Island, and the Connecticut–Rhode Island–Massachusetts 345 kV bulk supply.138 As a result, the widespread problems were studied comprehensively through the NEEWS analysis to ensure that solutions could be coordinated and would be regionally effective.
The NEEWS analysis has shown that the southern New England transmission system has five major reliability concerns identified below and depicted in Figure 9-7:
• Regional east–west power flows are limited across New England because of potential thermal and voltage violations to area transmission facilities under contingency conditions.
• The Springfield, Massachusetts, area experiences thermal overloads under forecasted normal conditions and significant thermal overloads and voltage problems under numerous contingencies. The severity of these problems increases as the system tries to move power into Connecticut from the rest of New England.
• Power transfers into and out of Connecticut are limited and will eventually result in the inability to serve load under many probable system conditions.
• East-to-west power flows inside Connecticut stress the existing system that could result in future thermal overloads under contingency conditions.
• The Rhode Island system overly depends on limited transmission lines or autotransformers to serve its needs, resulting in thermal overloads and voltage problems for contingency conditions.
138 RSP06, Section 8, and 2005 Regional System Plan (hereafter cited as RSP05) (Holyoke, MA: ISO New England, October 20, 2005), Section 5. Available online at http://www.iso-ne.com/trans/rsp/2005/index.html or by contacting ISO Customer Service at 413-540-4220.

2007 Regional System Plan 88 ISO New England Inc.
This graphic has been redacted
and may be accessed by calling
ISO New England Customer Service
at (413) 540-4220.
Figure 9-7: Reliability concerns in the southern New England region.
All these concerns are related to the significant degree of load growth experienced in the SNE region and will ultimately lead to violations of reliability standards. Some of these violations could occur in today’s system under specific extreme or severely stressed conditions. For example, with a line out of service, the current system could be overloaded as a result of limitations of New England’s east–west transfer capability. Currently, operator actions are employed to address these events, but such actions will no longer be viable as system loading increases and the resulting overload conditions worsen.
The studies conducted were a part of a geographically comprehensive planning effort, addressing the weaknesses in southern New England, including five interrelated problems in three states and multiple service territories. Analyses performed for the 10-year period revealed a number of system deficiencies in transmission security, specifically area-transmission requirements and transfer capabilities. These deficiencies form the basis for the needed transmission system improvements. These improvements will benefit all New England states by addressing regional transmission system reliability and constrained generation, limitations that have regional consequences. For example, addressing the transfer limitations associated with the New England East–West interface also will address limitations for delivering power from other New England areas to load centers all across New England.139
139 The East–West interface separates eastern New England from western New England.
2007 Regional System Plan 89 ISO New England Inc.
Specific transmission-security concerns related to transfer capability in the SNE region are as follows:
• Connecticut-area power-transfer capabilities will not meet transmission security requirements as early as 2009. If improvements are not made by 2016, the import deficiency for this area (as identified using the load-margin analysis included in RSP06) under conditions of generator unavailability and the loss of a single power system element (N-1 conditions) is expected to be greater than 1,500 MW, assuming no new capacity is added.
• On the basis of planning assumptions concerning future generation additions and retirements within the Connecticut area, by 2016, an import level of 3,600 MW for N-1 and 2,400 MW for N-1-1 (i.e., conditions under which a transmission element is unavailable and another design contingency occurs) will be needed.
• Connecticut also has internal elements that limit Connecticut east–west power transfers across the central part of Connecticut. The movement of power from east to west in conjunction with higher import levels to serve Connecticut results in overloads of transmission facilities located within Connecticut.
• Under “line-out” or N-1-1 conditions and certain dispatch scenarios, the 345 kV transmission system in the southeastern Massachusetts and Rhode Island areas cannot support the southeastern Massachusetts–Rhode Island, New England east–west, and Connecticut power transfers following a contingency. These interfaces all have simultaneous and interdependent power-transfer limits.
• Rhode Island and Springfield have insufficient transmission system capability to meet their load margins through 2016. Springfield can be exposed to reliability issues at current load levels, depending on system conditions, hence the area’s Reliability Agreement contracts (see Section 9.5). The Rhode Island reliability issues are not as severe but could occur as early as 2009, also depending on system conditions.
Specific transmission-security concerns in the SNE region related to area-transmission requirements are as follows:
• In the Springfield area, local DCT outages, stuck breaker outages, and single element outages result in severe thermal overloads and low-voltage conditions. These weaknesses are independent of the ability to handle power flows into Connecticut.
• The flow of power through the Springfield 115 kV system into Connecticut increases when the major 345 kV tie-line between western Massachusetts and Connecticut (the Ludlow–Manchester–North Bloomfield 345 kV line) is open because of either an unplanned or a planned outage. As a result, numerous overloads occur for all years simulated on the Springfield 115 kV system. These overloads are exacerbated when Connecticut transfers increase.
• The severity, number, and location of the Springfield overloads and low voltages strongly depend on the area’s generation dispatch. Additional load growth and potential unit retirements would significantly aggravate these problems. As a result, network constraints in the Springfield area limit the ability to serve local load under contingency conditions and limit Connecticut load-serving capability under certain area-dispatch conditions.
• Thermal and voltage violations are observed on the transmission facilities in Rhode Island. Causal factors include high load growth (especially in southwestern Rhode Island and the coastal communities) and planned or unplanned unit or transmission outages.

2007 Regional System Plan 90 ISO New England Inc.
The Rhode Island 115 kV system is significantly constrained when a 345 kV line is out of service. Outage of any one of a number of 345 kV transmission lines results in limits to power-transfer capability into Rhode Island. For line-out conditions, the next critical contingency involving the loss of a 345/115 kV autotransformer or a second 345 kV line would result in numerous thermal and voltage violations. This condition could occur as early as 2009, depending on load level and generator availability. After considerable analyses of alternatives, a plan has been tentatively selected that addresses the reliability issues discussed and consists of a number of projects with in-service dates ranging from 2009 to 2013. The major components of the plan are as follows:
• A new Millbury–West Farnum–Lake Road–Card 345 kV line
• A second West Farnum–Kent County 345 kV line
• Two additional Kent County 345/115kV autotransformers
• A new 345/115 kV substation and autotransformer in the 345 kV line from Brayton Point to ANP-Bellingham
• A new North Bloomfield–Frost Bridge 345 kV line
• An additional Frost Bridge 345/115kV autotransformer
• A new Ludlow–Agawam–North Bloomfield 345 kV line
• A new 345/115 kV substation with two 345/115kV autotransformers at Agawam
• A new 345/115kV autotransformer at North Bloomfield
The plan also includes other projects ranging from relatively minor ones, such as the replacement of 115 kV substation terminal equipment, to projects that are more involved, such as the installation of new 115 kV cables in the Hartford and Springfield areas. The definitive plan and how it will be implemented will be forthcoming as the routing, costing, and remaining engineering analyses move toward completion.
9.4 Major Transmission Projects Significant progress has been made toward improving the transmission system, as identified in previous RSP reports. Major projects that have recently started construction or are nearing completion include the following:
• Northeast Reliability Interconnect Project—consists of a new 144-mile, 345 kV transmission line connecting the Point Lepreau substation in New Brunswick to Orrington substation in northern Maine and supporting equipment. The line, 84 miles of which are in Maine, is designed to increase transfer capability from New Brunswick to New England by 300 MW and will help improve area stability and voltage performance, as well as provide additional benefits beyond immediate needs. The planned in-service date for this project is the end of 2007.
• Monadnock Project—includes a new 345/115 kV substation at Fitzwilliam, New Hampshire, and a number of 115 kV upgrades. The substation will be located where the Vermont Yankee–Amherst–Scobie Pond 345 kV line (379/380) passes near the Bellows Falls–Monadnock–Flagg Pond (I-135N) line. The new autotransformer, along with the

2007 Regional System Plan 91 ISO New England Inc.
115 kV transmission upgrades, will improve the area’s voltage profile, support future load growth, and improve post-contingency system response. The planned in-service date for this project is 2009.
• Northwest Vermont Reliability Project—improves reliability of the northwestern area of Vermont. The project consists of a new 36-mile, 345 kV line; a new 28-mile, 115 kV line; two 230/115 kV three-winding transformers; three additional 115 kV phase-angle regulating transformers (PARs); four dynamic voltage-control devices; and static compensation. The planned in-service dates for various components of this project range from late 2006 through 2008. One of three PARs was placed in-service in December 2006 at Blissville substation. In addition, the 345 kV line was placed in-service in January 2007.
• NSTAR 345 kV Transmission Reliability Project—addresses Boston-area reliability problems and increases the Boston-import transfer capability by approximately 1,000 MW. This project includes the construction of a Stoughton 345 kV station and the installation of three new underground 345 kV lines and associated 345/115 kV autotransformers. One 17-mile cable connecting the Stoughton and K Street substations has been placed in service, and a second one is scheduled for installation in 2008. An 11-mile cable connecting Stoughton and Hyde Park substations also has been placed in service.
• SWCT Reliability Project—addresses operating constraints and impediments to generation interconnection and improves the area’s near-term and midterm reliability and infrastructure. Phase 1 has been placed in service; its main component was a 20-mile 345 kV circuit from the Plumtree substation in Bethel to the Norwalk substation. Phase 2 includes a 70-mile 345 kV circuit from the Middletown area (the new Beseck substation) to Norwalk, planned to be in service in 2009. The Norwalk, Beseck, and East Devon substations each will have a 345/115 kV autotransformer installed.
9.5 Transmission Improvements to Load and Generation Pockets The performance of the transmission system highly depends on embedded generators operating to maintain reliability in several smaller areas of the system. Consistent with ISO operating requirements, the generators may be required to provide voltage support or to avoid overloads of transmission system elements. Reliability may be threatened when only a few generating units are available to provide system support, especially when considering normal levels of unplanned or scheduled outages of generators or transmission facilities. This transmission system dependence on local-area generating units typically results in relatively high reliability payments associated with out-of-merit unit commitments. Transmission solutions are needed for the areas where developers have not proposed adding new wholesale electricity market resources to relieve transmission system performance concerns. The ISO is studying many of these areas, and transmission projects are being planned for some areas, while other areas already have projects under construction to mitigate dependence on the imbedded generating units. The following sections describe several of the areas that currently depend on generating units for maintaining reliability and provide the status of the transmission projects that will reduce the need to run these units.
9.5.1 Major Load Pockets with Generating Units Needed for Maintaining Reliability
The following areas need generators for local reliability support:
• Western Maine
2007 Regional System Plan 92 ISO New England Inc.
• Massachusetts—the Boston area, the North Shore area, southeastern Massachusetts, western Massachusetts, and the Springfield area
• Connecticut—all generation in the state, in particular, the Middletown area, the Norwalk–Stamford area, and the southwestern Connecticut area
9.5.1.1 Western Maine Western Maine has generation that has been frequently designated as daily second-contingency generation (see Section 6.1.1). This area is being evaluated as part of the Maine Power Reliability Program.
9.5.1.2 Boston Area Several units in the Boston area have been frequently designated as daily second-contingency units. New Boston unit #1, recently approved for deactivation, has been needed for local reliability support for the Boston downtown area along with Mystic units #7, #8, and #9. NSTAR is completing the NSTAR 345 kV Transmission Reliability Project to serve future load growth and improve the reliability of this area. With the April 2007 completion of Phase I of the project (two 345 kV cables and associated variable reactors), no single generator is required for reliability. In late 2005 and early 2006, two shunt reactors were installed—one at the North Cambridge 345 kV station and the other at the Lexington 345 kV station. These reactors will help reduce the high-voltage conditions that exist during light-load periods. The goal is to eliminate the need to run specific local generation for reactive compensation during these periods. The costs associated with running the local generation for this purpose had become relatively high, bringing attention to this concern. In addition to continuing to examine further short-term improvements, the ISO is working with NSTAR to complete a long-term reactive study that is determining future VAR requirements for the Boston area, including the possibility of installing a dynamic VAR device. These studies are assessing the ability to adequately control voltages and maintain 345 kV system stability over a wide range of operating conditions.
9.5.1.3 North Shore In the North Shore area, Salem Harbor units #1–#4 have been critical for supporting the reliable operation of this area. The North Shore upgrades project (including Ward Hill substation) helps relieve this area of its near-term need to depend on the Salem Harbor units for reliability. Studies of additional longer-term modifications to this area, including the Wakefield Junction and West Amesbury stations, are complete and proceeding through the approval process.
9.5.1.4 Southeastern Massachusetts In the southeastern part of Massachusetts, the Canal units have been run to control the high-voltage conditions that exist during light-load periods and to provide for transmission security during virtually all load levels. As detailed in Section 9.3.2.2, studies are in progress to develop both short- and long-term plans to reduce the reliance on these units.
9.5.1.5 Western Massachusetts The primary supplies for the Pittsfield area consist of the Berkshire autotransformer, Bear Swamp autotransformer, and the Altresco units. The Altresco units are located in an extremely weak part of the system. Without these facilities, the area relies on a 115 kV transmission system that cannot adequately provide voltage support in the area under certain conditions. Studies of alternative transmission solutions are underway and should be completed in 2008.

2007 Regional System Plan 93 ISO New England Inc.
The Woodland Road and Pleasant capacitors have been in service since June 2006, so that the Woodland Road generator is no longer needed to support low-voltage conditions in the Pittsfield area.
9.5.1.6 Springfield Area Two generators in the Springfield area, West Springfield unit #3 and Berkshire Power, have been frequently designated as daily second-contingency units. These generators, in addition to West Springfield units #1 and #2, are also needed to support local reliability during peak hours and to avoid overloads, in violation of reliability criteria. A tentative solution for the Greater Springfield area has been formulated as part of the study of southern New England (see Section 9.3.2.2). This solution will provide for load growth as well as reduce dependence on the operation of these local units. It may also allow for the eventual retirement of the older of these units.
9.5.1.7 Connecticut Most of the existing generation in Connecticut is required to ensure reliable service until new resources are added or transmission improvements are made in this area. Imports into Connecticut are constrained by both thermal and voltage limits for contingency events. NEEWS, as discussed in Section 9.3.2.2, is expected to substantially mitigate the transmission-security constraints that currently result in the inefficient operation of local-area generation.
9.5.1.8 Middletown Area Four 115 kV lines and three generators connected to the 115 kV system—Middletown unit #2 (117 MW), Middletown unit #3 (236 MW), and Middletown unit #10 (17 MW)—supply the Middletown, Connecticut, area. Unit #10, 38 years old, is the newest of these units. Middletown unit #4 (400 MW) is connected to the 345 kV line without transformation to the 115 kV system; thus, it does not support the local load in the area. ISO Operations has flagged Middletown units #2 and #3 as daily second-contingency units that provide critical voltage support to the local 115 kV area. These units help to avoid low voltages that would result from single- or double-circuit outages in the area. The most effective solution for providing for future load growth, which would also reduce dependence on the operation of these Middletown units and potentially allow the future retirement of the units, was found to be building a new 345/115 kV Haddam substation and implementing other area improvements. The substation and a single 345/115 kV autotransformer have been placed in service; additional 115 kV reinforcements are forthcoming. These changes will significantly reduce the dependence on the Middletown units and will improve the ability to perform maintenance on these units and area transmission. A study has not yet been scheduled to determine the requirements for adding a second autotransformer and altering the line configuration in this area, the latter of which could necessitate the alteration of an SPS at Millstone Point station.
9.5.1.9 Southwest Connecticut Area The ISO has designated many units in the SWCT area, excluding the Norwalk–Stamford area, as daily second-contingency units that must operate due to the limitations of the transmission system in the area. These units are Bridgeport Energy, Bridgeport Harbor units #2 and #3, Devon units #11 to #14, Milford units #1 and #2, and Wallingford units #1 to #5. The capacity deficiency in this area and the weakness of the existing transmission system have been the basis for the SWCT Reliability Project, Phase 2, which will help reduce the dependence on these units. Measures to relieve capacity deficiencies, such as those included in the SWCT “Gap” RFP for emergency-capability resources (see Section 5.2.1), has provided some relief during OP 4 conditions.

2007 Regional System Plan 94 ISO New England Inc.
9.5.2 Transmission Plans to Mitigate the Need for Reliability Agreements and Other Out-of-Merit Operating Situations
This section provides information on situations that have resulted in units qualifying for or receiving reliability payments, whether under a Reliability Agreement or for second-contingency or voltage-control purposes.140 It also summarizes the reason for the payment and the planned mitigation measures. Table 9-1 lists, by SMD load zone, the units that have effective Reliability Agreements in place, those that have agreements pending at FERC, and those that had contracts terminated. The total annualized fixed-income requirement for these is almost $600 million, or just under $300 million excluding units with contracts terminated. Table 9-2 lists the SMD load zones that contain units that are not under contract but received annual payments in excess of $1,000,000 in 2006. (A number of other units received relatively insignificant payments.) The transmission improvements shown in Table 9-1 and Table 9-2 will improve system reliability and lessen the economic dependence on generators.
140 Reliability Agreement contracts were formerly known as Reliability-Must-Run contracts.

2007 Regional System Plan 95 ISO New England Inc.
Table 9-1 Generating Units Under or Pursuing Reliability Agreements
Owner/Unit
2007 CELT Summer
Capability (MW)
Annualized Fixed-Revenue Requirement Reliability Requirement
Mitigating Transmission Solutions(a)
NEMA/Boston Exelon—New Boston unit #1(b) Contract terminated
350 $30,000,000 NEMA/Boston capacity and transmission reliability (thermal and voltage)
NSTAR 345 kV Transmission Reliability Project (Phase I)
Dominion—Salem Harbor (Not a standard agreement; the unit may not apply for deactivation or retirement until October 1, 2008.)
664 $3,375,000(c) North Shore area and NEMA/Boston transmission reliability (thermal)
North Shore upgrades and NSTAR 345 kV Transmission Reliability Project
Mirant—Kendall Steam units #1–#3 and Jet unit #1(d) Contract terminated
73 $7,920,000 Local-area transmission reliability support (thermal) East Cambridge substation
Boston Gen– Mystic units #8 and #9(e) Contract terminated
1,398 $155,000,000 NEMA/Boston capacity and transmission reliability (thermal and voltage)
NSTAR 345 kV Transmission Reliability Project (Phases I and II)
Western Central MA
Con Ed— West Springfield unit #3 94 $7,050,000 Local-area transmission
reliability support (thermal)
Springfield 115 kV reinforcements and Greater Springfield Reliability Project (NEEWS)
Con Ed— West Springfield units GT-1 and Gt-2
74 $9,800,000 Local-area transmission reliability support (thermal)
Springfield 115 kV reinforcements and Greater Springfield Reliability Project (NEEWS)
Berkshire Power 229 $26,000,000 Local-area transmission reliability support (thermal)
Springfield 115 kV reinforcements and Greater Springfield Reliability Project (NEEWS)
Pittsfield Gen–Altresco 141 $13,000,000 Local-area transmission reliability support (voltage)
(1) Pittsfield/Greenfield area reinforcements
(2) Pleasant and Woodland capacitors; in service, June 2006
Connecticut NRG—Devon units #11–#14(e)
Contract terminated 121 $19,692,116
Connecticut-area capacity and SWCT transmission reliability (thermal and voltage)
(1) SWCT Reliability Project (2) NEEWS
NRG— Middletown units #2–#4 753 $49,611,273
Middletown unit #4—Connecticut-area capacity Middletown units #2, #3—Connecticut-area and Middletown area transmission reliability (thermal and voltage)
(1) NEEWS (2) Haddam/Middletown
reliability improvements (3) Second Haddam 345/115kV
autotransformer
NRG—Montville units #5, #6, #10, and #11 494 $28,696,612
Connecticut-area capacity and transmission reliability (thermal and voltage)
NEEWS
Milford Power units #1 and #2 492 $72,500,000
Connecticut-area capacity and SWCT transmission reliability (thermal and voltage)
(1) SWCT Reliability Project (2) NEEWS
PSEG—New Haven Harbor 448 $37,492,000 Connecticut-area capacity and transmission reliability (thermal and voltage)
NEEWS

2007 Regional System Plan 96 ISO New England Inc.
Owner/Unit
2007 CELT Summer
Capability (MW)
Annualized Fixed-Revenue Requirement Reliability Requirement
Mitigating Transmission Solutions(a)
PSEG—Bridgeport Harbor unit #2 130 $14,008,000 SWCT transmission reliability
(thermal and voltage) (1) SWCT Reliability Project (2) NEEWS
Bridgeport Energy(f) Contract terminated 448 $57,825,915
Connecticut-area capacity and SWCT transmission reliability (thermal and voltage)
(1) SWCT Reliability Project (2) NEEWS
PPL—Wallingford(g) units #2–#5 Contract terminated
171 $30,720,000 Connecticut-area capacity and SWCT transmission reliability (thermal and voltage)
(1) SWCT Reliability Project (2) NEEWS
NRG Norwalk Harbor units #1 and #2 330 $37,664,400
Connecticut-area capacity and SWCT transmission reliability (thermal and voltage)
(1) SWCT Reliability Project (2) NEEWS
(a) Mitigating solutions should help reduce problems and their associated costs but may not necessarily fully eliminate them. (b) Terminated November 15, 2006, based on the completion of Phase 1 project and thus the loss of need. (c) This is a stipulated payment over 24 months. (d) Terminated May 1, 2007, based on the completion of the East Cambridge project and thus the loss of need. (e) Terminated January 1, 2007, as a result of a settlement agreement. (f) Effectively terminated as of April 1, 2007, as a result of a settlement agreement. The settlement provides for a refund of $12.5 million. (g) Terminated by terms of a settlement agreement as of June 1, 2007.

2007 Regional System Plan 97 ISO New England Inc.
Table 9-2 SMD Load Zones that Contain Generating Units that Are Not Under Reliability Agreements
but Have Received Significant Reliability Payments(a)
Unit Location
2006 Second-
Contingency Payments
2006 Voltage-Control
Payments Reliability
Requirement
Mitigating Transmission Solutions(b)
NEMA/Boston $32,533,122 $4,106,480 Operable capacity, transmission security, and voltage control
(1) NSTAR 345 kV Transmission Reliability Project (Phases I and II)
(2) Boston voltage study(in progress)
SEMA $85,203,833 $8,801,964 Operable capacity, transmission security, and voltage control
Lower SEMA short-term and long-term upgrades
CT $59,103,591 $1,770,204 SWCT transmission security
SWCT Reliability Project
(a) Major units receiving more than $1 million in reliability payments for 2006. (b) Mitigating solutions should help reduce problems and their associated costs but may not necessarily fully eliminate them.
9.6 Summary of Key Findings Transmission upgrades identified in previous RSP reports are progressing, although additional improvements are needed to ensure compliance with national and regional standards that address overall system transfers, serve major load pockets, and reduce dependence upon local generating units. Much progress has been made toward completing these improvements through the significant 345 kV projects described in this section. Additional transmission system needs have been identified, and studies are underway to review alternatives and address system performance issues. As with any 10-year plan, the needs and projects that are defined in the later years must be reviewed continuously with respect to changes in load distributions and magnitudes; changes to the underlying subtransmission and distribution systems; changes in generation dispatch and commitment; and operating experiences.

2007 Regional System Plan 98 ISO New England Inc.
Section 10 New England Electricity Scenario Analysis Through an open and well-represented stakeholder process, the ISO conducted a Scenario Analysis and developed spreadsheet tools to assist the region’s electric industry stakeholders and policymakers in evaluating and comparing the potential impacts of various technologies on meeting New England’s future electricity needs. The ISO’s intention was to present a one-year snapshot of a comparable set of diverse outcomes and impacts that might reasonably be expected to occur if one electric power technology were pursued over another. The aim of the analysis was to show how various technology outcomes could differ as opposed to showing realistic outcomes. The initiative also aimed to provide a public venue for examining and discussing how the various ways of supplying electricity to the region that were presented in the analysis could affect the costs to provide power, the system’s overall reliability, and the environment. Another goal was to provide information and data that regional policymakers and other stakeholders could consider as they develop policies and investments and take other actions in the near term that can affect New England’s electricity markets, power system reliability, environmental performance, and ability to meet consumer electricity needs in the long term.
The Scenario Analysis did not predict what the future would look like in New England or prescribe one particular scenario over another.141 Rather, it presented a range of results for the different technologies. Furthermore, the analysis did not consider a full economic model of the region that would encompass overall regional economic development, demographic changes, job impacts, patterns of urbanization, technological innovation, and the adoption of electrotechnologies.142 Although the analysis presented a variety of economic results for comparison, it was not a least-cost plan or multi-year, present-worth analysis, and it did not include a “feedback loop” that accounted for how consumers or investors would react to these different sets of circumstances presented. Additionally, the analysis did not identify “right” or “wrong” technologies, attempt to build consensus about “preferable” technologies or outcomes, or develop a plan for what the region should or will do. As summarized in this section, the Scenario Analysis produced much information about the economic, reliability, and environmental impacts of the expansion technologies on the region’s future electric power system, under the systemwide, technology-specific, and economic assumptions used, and how these impacts changed under the different sets of assumptions. The ISO encourages interested parties to use the spreadsheet tool to compare the results for the different scenarios and reach their own conclusions about the various options.143
10.1 Background New England’s public officials and other stakeholders face a number of issues with respect to the future path for the region’s electric power system. In the past decade, New England has seen 141 Consistent with its mission, the ISO remained neutral in depicting the technologies and avoided taking a position on any technology outcome. It selected simplifying modeling assumptions and approaches to provide insights into the issues rather than specific approaches to developing any specific technology. 142 Other entities may be able to analyze these other factors using the results of this Scenario Analysis. 143 Additional results are summarized in the full Scenario Analysis report, and all the results are available online at the ISO’s Web site, “Scenario Analysis Stakeholder Working Group Materials” (2007), http://www.iso-ne.com/committees/comm_wkgrps/othr/sas/mtrls/index.html.

2007 Regional System Plan 99 ISO New England Inc.
substantial investment in new power production facilities needed for reliability, which was made in response to market signals and regional energy-related policies. Most of these new power plants, which were planned and built when natural gas prices were forecast to remain relatively low, generate electricity using natural gas as the primary fuel. Even though the newer plants are much more efficient (i.e., they consume less fossil fuel overall) and have lower emissions than the older plants, natural gas prices have doubled since 2000, which has resulted in electric energy price spikes and concerns about the lack of fuel diversity and overall system reliability. This situation is challenging for a number of reasons. Residents and businesses expect reliable power on demand, and they want it at reasonable and competitive prices. But New England has long been a region with high energy costs and some of the highest retail electricity prices in the nation, and policymakers are searching for ways to lower, or at least stabilize, electricity bills. At the same time, policymakers and consumers alike want the power sector to continue to make environmental progress, as exhibited by many New England states adopting air emission regulations that are stricter than those required by EPA to limit SO2, NOX, and CO2 emissions (see Section 8). New England policymakers also want the region’s electricity consumers to pursue energy efficiency to a greater extent than in the recent past. To improve system reliability, system planners have identified the need to diversify the types of fuels used to generate electricity and decrease the region’s dependence on natural gas.144 Simultaneously accomplishing these economic, reliability, and environmental objectives is highly complex. Given the region’s lack of indigenous fuel supplies, its dependence on imported fossil fuels, and its tightening environmental policies, substantially reducing regional electricity costs will be difficult. The challenge for policymakers is to find an appropriate balance between economic and environmental goals while ensuring reliability. In theory, many options are available for satisfying New England’s electricity needs. Among them are ways to reduce demand, such as by increasing the use of more efficient electrical appliances and equipment or by installing devices to cycle appliances on and off during peak hours or shift load off-peak. To increase supply, new transmission lines that allow more power to be imported can be built. Additionally, new nuclear power plants, gas-fired plants, new-technology coal plants, and renewable resources, such as wind farms and solar PV projects, to name a few, can be added. While some of the technologies may come about naturally as a result of market forces, others may require a change in public policy to encourage their development. To help clarify some of the economic, reliability, and environmental impacts of various technologies on the New England power system, the ISO sponsored a regionwide initiative, the New England Electricity Scenario Analysis. For over eight months beginning in fall 2006, the ISO worked with a Steering Committee, a number of focused working groups, and a plenary group made up of over 100 representatives from the ISO, utility and environmental regulators from the New England states, market participants, environmental and efficiency advocates, and other interested stakeholders. Together, these participants identified and analyzed a number of supply- and demand-side resource scenarios, each revolving around a particular type of technology.
144 RSP06, Section 6, and RSP05, Section 5.
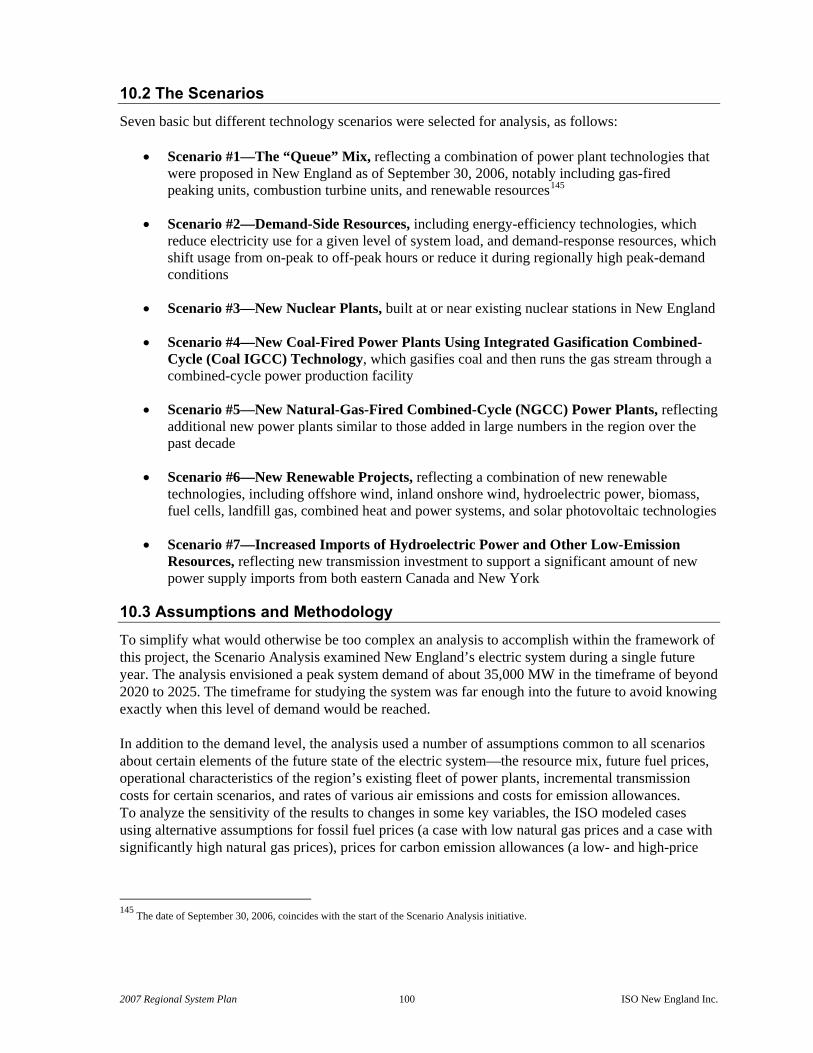
2007 Regional System Plan 100 ISO New England Inc.
10.2 The Scenarios Seven basic but different technology scenarios were selected for analysis, as follows:
• Scenario #1—The “Queue” Mix, reflecting a combination of power plant technologies that were proposed in New England as of September 30, 2006, notably including gas-fired peaking units, combustion turbine units, and renewable resources145
• Scenario #2—Demand-Side Resources, including energy-efficiency technologies, which reduce electricity use for a given level of system load, and demand-response resources, which shift usage from on-peak to off-peak hours or reduce it during regionally high peak-demand conditions
• Scenario #3—New Nuclear Plants, built at or near existing nuclear stations in New England
• Scenario #4—New Coal-Fired Power Plants Using Integrated Gasification Combined-Cycle (Coal IGCC) Technology, which gasifies coal and then runs the gas stream through a combined-cycle power production facility
• Scenario #5—New Natural-Gas-Fired Combined-Cycle (NGCC) Power Plants, reflecting additional new power plants similar to those added in large numbers in the region over the past decade
• Scenario #6—New Renewable Projects, reflecting a combination of new renewable technologies, including offshore wind, inland onshore wind, hydroelectric power, biomass, fuel cells, landfill gas, combined heat and power systems, and solar photovoltaic technologies
• Scenario #7—Increased Imports of Hydroelectric Power and Other Low-Emission Resources, reflecting new transmission investment to support a significant amount of new power supply imports from both eastern Canada and New York
10.3 Assumptions and Methodology To simplify what would otherwise be too complex an analysis to accomplish within the framework of this project, the Scenario Analysis examined New England’s electric system during a single future year. The analysis envisioned a peak system demand of about 35,000 MW in the timeframe of beyond 2020 to 2025. The timeframe for studying the system was far enough into the future to avoid knowing exactly when this level of demand would be reached. In addition to the demand level, the analysis used a number of assumptions common to all scenarios about certain elements of the future state of the electric system—the resource mix, future fuel prices, operational characteristics of the region’s existing fleet of power plants, incremental transmission costs for certain scenarios, and rates of various air emissions and costs for emission allowances. To analyze the sensitivity of the results to changes in some key variables, the ISO modeled cases using alternative assumptions for fossil fuel prices (a case with low natural gas prices and a case with significantly high natural gas prices), prices for carbon emission allowances (a low- and high-price
145 The date of September 30, 2006, coincides with the start of the Scenario Analysis initiative.

2007 Regional System Plan 101 ISO New England Inc.
case), the type and degree of penetration of demand-side resources, the retirement of the oldest power plants in the region, and several other variables. Accounting for these assumptions and the system’s existing generation and transmission facilities, the ISO modeled how various combinations of resources within each scenario performed in supplying customers’ electricity needs. The simulations represented system performance in all hours of the single future “study year.” The analysis ran a total of 52 simulations using these different sets of assumptions, as shown in Table 10-1, and produced results that were summarized as different metrics.
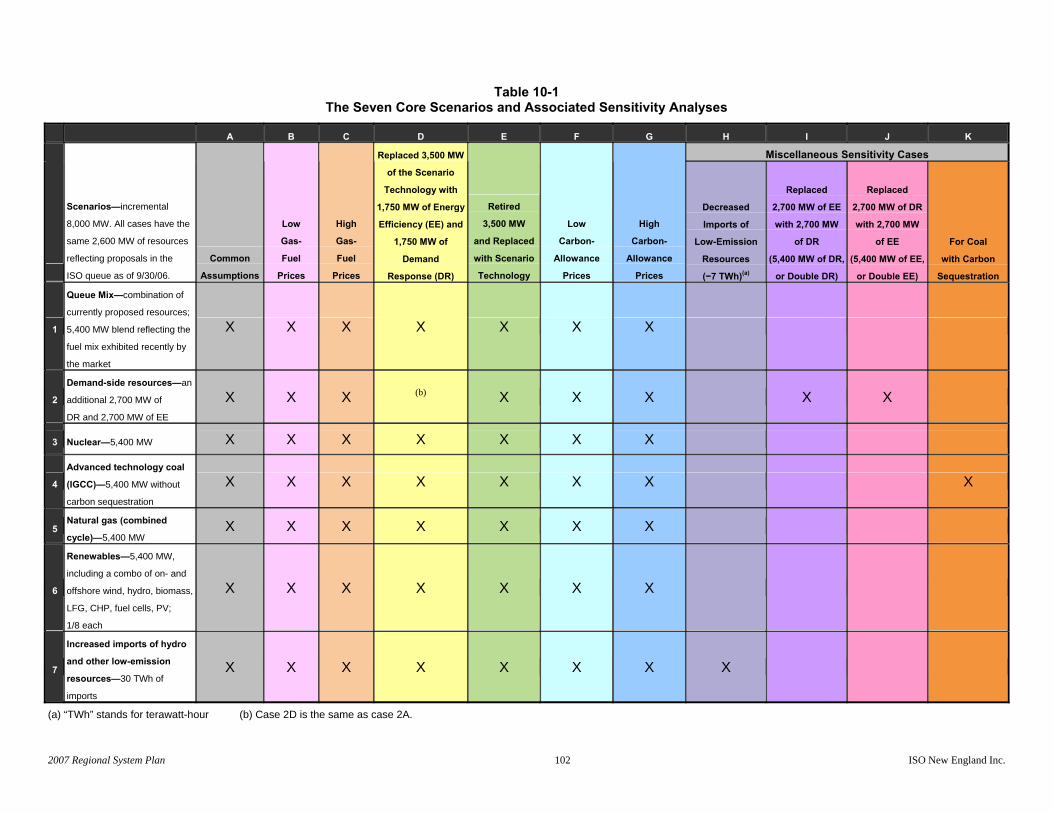
2007 Regional System Plan 102 ISO New England Inc.
Table 10-1 The Seven Core Scenarios and Associated Sensitivity Analyses
A B C D E F G H I J K Miscellaneous Sensitivity Cases
Scenarios—incremental
8,000 MW. All cases have the
same 2,600 MW of resources
reflecting proposals in the
ISO queue as of 9/30/06. Common
Assumptions
Low
Gas-
Fuel
Prices
High
Gas-
Fuel
Prices
Replaced 3,500 MW
of the Scenario
Technology with
1,750 MW of Energy
Efficiency (EE) and
1,750 MW of
Demand
Response (DR)
Retired
3,500 MW
and Replaced
with Scenario
Technology
Low
Carbon-
Allowance
Prices
High
Carbon-
Allowance
Prices
Decreased
Imports of
Low-Emission
Resources
(−7 TWh)(a)
Replaced
2,700 MW of EE
with 2,700 MW
of DR
(5,400 MW of DR,
or Double DR)
Replaced
2,700 MW of DR
with 2,700 MW
of EE
(5,400 MW of EE,
or Double EE)
For Coal
with Carbon
Sequestration
1
Queue Mix—combination of
currently proposed resources;
5,400 MW blend reflecting the
fuel mix exhibited recently by
the market
X X X X X X X
2 Demand-side resources—an
additional 2,700 MW of
DR and 2,700 MW of EE X X X (b) X X X X X
3 Nuclear—5,400 MW X X X X X X X
4 Advanced technology coal
(IGCC)—5,400 MW without
carbon sequestration X X X X X X X X
5 Natural gas (combined
cycle)—5,400 MW X X X X X X X
6
Renewables—5,400 MW,
including a combo of on- and
offshore wind, hydro, biomass,
LFG, CHP, fuel cells, PV;
1/8 each
X X X X X X X
7
Increased imports of hydro
and other low-emission
resources—30 TWh of
imports
X X X X X X X X
(a) “TWh” stands for terawatt-hour (b) Case 2D is the same as case 2A.

2007 Regional System Plan 103 ISO New England Inc.
For each scenario and associated sensitivity analyses, the results included systemwide economic, reliability, and environmental metrics. Economic metrics included the following:
• Average and total systemwide costs to produce power
• Overall efficiency in producing power
• Average clearing prices in New England’s wholesale electric energy markets
• A comparison of net revenues that each type of resource was assumed to gain in New England’s wholesale power markets with the capital investment for different technologies, given ranges of capital and operating costs for each type of resource and certain transmission and fuel costs
These economic metrics provided basic information for comparing the costs of the various technologies and, for each scenario, comparing net revenues with total capital and operating costs. However, comprehensive cost-comparative information would need to consider site-specific costs and revenues over several years and include tax incentives (e.g., investments in renewable, nuclear, and coal IGCC technologies) as well as other costs and revenues. Therefore, the metrics presented in this analysis suggest, rather than fully explain, the reasons for the cost differences among the technology options. The reliability metrics included the amount of electricity produced by the different types of power plants, total fuel consumed to produce power (by type of fuel), and exposure of the electric power system to various types of fuel-related shortages. The environmental outcomes that were tracked include such metrics as systemwide emissions of SO2, NOX, and CO2; the 10 highest daily NOX emissions for peak-load summer days; and the generation sources that contribute to such emissions on peak days. The use of water for cooling new power plants, the incremental amount of land needed to produce and transmit power, and the percentage of power produced by renewable resources were also evaluated.
10.4 Key Themes of the Results The numerous results of the Scenario Analysis show the variations in the economic, reliability, and environmental impacts that the different scenarios had on the electric power system under the range of assumptions used. Some of the key themes that have emerged and the supporting results follow:
• Under all the scenarios, New England will continue to depend on natural gas to supply electricity. A large amount of gas-fired generating capacity has been built in New England over the past decade. Even adding 5,400 MW of new capacity from a single non-gas-fired technology or resource type (i.e., nuclear, renewables, imports, or energy efficiency) did not change this dependence—in all scenarios, natural gas constituted a minimum of 36% of the systemwide capacity. This is because, in large part, each of the cases assumed that 8,000 MW of new generating capacity was added to a capacity base of approximately 31,000 MW existing in 2007—capacity that is 40% gas-fired. Natural-gas-fired unit capacity under the common set of assumptions for Scenario #5 (NGCC) constituted 50% of the total systemwide capacity of almost 39,000 MW.

2007 Regional System Plan 104 ISO New England Inc.
The capacity mix changed the most for the sensitivity cases that assumed the retirement of 3,500 MW of the oldest generating capacity in the region and its replacement with capacity provided by that scenario’s core technology. For example, in the case in which 8,900 MW of NGCC generating units were added to meet load growth and replaced retired capacity (Scenario #5, retirement case), the region’s dependence on gas-fired capacity increased to 58% of total generating capacity. By contrast, an increase of 8,900 MW of new non-gas-fired capacity (i.e., demand response, nuclear, coal IGCC, imports) meant that natural-gas-fired generation provided approximately 35% of the region’s capacity, slightly less than the minimum natural gas capacity under the common set of assumptions.
• Fossil fuel prices, particularly for natural gas, drive the region’s electric energy mix,
electric energy prices, and level of emissions. Relatively low natural gas prices tended to decrease the comparative price advantages of coal, shift reliance to gas-fired plants, reduce electric energy prices, and lower air emissions. By contrast, high natural gas prices tended to increase the price of electric energy and increase the overall emissions of SO2, NOX, and CO2. Thus, if gas prices were to increase, emissions would rise as a result of adhering to merit-order dispatch and dispatching power plants that burn more oil. If gas shortages were to occur, commodity prices would increase, and the system would be exposed to fuel interruptions, which would in turn expose New England to greater electric energy price volatility and reliability problems. Over time, however, consumers and suppliers would likely make changes to moderate these effects. Consumers would increase the use of electric energy when prices are low and decrease energy use at higher prices. Suppliers would make similar changes in their investment decisions by investing in more efficiency when electricity prices are higher.
• The underlying and unpredictable forces in global oil and natural gas markets could lead to a wide variability of results for the scenarios analyzed. Adding infrastructure in the regional natural gas supply and delivery systems and lessening gas-sector demands could mitigate price volatility during periods of high demand. Several demand-side technologies [e.g., efficient gas-fired heating systems; additional home insulation; and heating, ventilation, and air-conditioning (HVAC) environmental controls] could provide the dual benefits of reducing the demand for natural gas and electricity while simultaneously reducing the prices for both products.
• Across all the scenarios and sensitivity cases, gas-fired power plants tended to be among the last plants dispatched (the so-called marginal units) to serve typical daily loads in New England to meet demand. These plants set the wholesale electric energy clearing prices in most hours of the year, approximately 90% of the time. The average clearing prices for all the scenarios were sensitive to the price of natural gas, and the overall average clearing prices differed only modestly. However, Scenarios #3, #5, and #6 (nuclear, natural gas combined cycle, and renewables) and a sensitivity case that doubled the amount of energy efficiency had more efficient natural gas units on the margin and average clearing prices that were lower by up to 13% than several other cases.
• Under the assumptions for this analysis, the net revenues from the energy markets alone for most of the power technologies evaluated were less than total overall capital and operating costs. However, as illustrated in the single-technology sensitivity case that doubled energy efficiency, net revenues were greater than overall costs for energy-efficiency resources and some technologies in Scenario #1 (the queue). The results also showed that the technologies in the queue that had relatively low capital costs, such as natural gas units, were

2007 Regional System Plan 105 ISO New England Inc.
more economically viable than other technology types. For example, wind and nuclear resources tended to have high capital costs and thus would be relatively expensive to build. For these technologies, the analysis showed a modest to significant gap between the net revenues they would receive in the New England wholesale electric energy markets and the annual revenue requirements (ARRs) associated with investment in these technologies.146 Therefore, to induce investment in these technologies and their entry into the market within a system as modeled, some other means would be needed to fill this revenue gap. These could include payments from the Forward Capacity Market or the provision of ancillary services; tax credits; the sale of emission allowances; Renewable Energy Certificates; long-term purchased power agreements for electric energy, capacity, or both; counting capital costs in the rate base; new regulatory provisions or requirements; and other sources.
• As confirmed by this analysis, adding large amounts of resources that produced large amounts of electric energy and had low operating costs and low emissions (as in the nuclear and imports scenarios and sensitivity case that doubled energy efficiency) reduced systemwide production costs, energy prices, and emissions. Just as the overall efficiency of the region’s power system has improved in the past decade—as newer, more efficient power plants with lower air emissions have been added—the scenarios showed continued improvements in the overall systemwide efficiency of converting fossil fuels to electrical energy. The scenario cases in which the region’s oldest generating capacity was retired further underscored this result, producing fewer overall emissions of NOX, SO2, and CO2
and lower production costs.
• New England’s CO2 emissions from the power sector varied considerably across the scenarios (and within some scenarios, depending on the assumptions about such variables as fuel prices, emission allowance costs, and unit retirements). The results of the analyses indicate that to meet the region’s CO2 emissions targets under the Regional Greenhouse Gas Initiative, the different scenarios and sensitivity-analysis cases would need to add substantial amounts of low- or zero-CO2-emitting resources to the region and some combination of economically based actions. These actions could include requiring regulated power plants, for example, to rely on offsets from other sectors; buy additional CO2 allowances from sources outside New England, but within the RGGI region; use previously banked allowances; and redispatch facilities to burn fossil fuel (or no fuel) more efficiently and thus to lower carbon emissions. Adding more renewable sources of power with no or low CO2 emissions in areas far from load centers or importing more hydroelectric power would require the region to build substantially more transmission to move this power to the load centers.
• Adding significant demand-side resources provided capacity and electric energy benefits to the system and resulted in fewer emissions. Energy efficiency lowered the growth of peak demand, as well as the demand for electricity across the many hours of the year. Energy efficiency, which has operating characteristics similar to baseload or intermediate units, also provided both capacity and energy savings. Another result was that demand-response resources, which have operating characteristics similar to peaking units, tended to provide capacity but less relative electric energy to the system in other hours.
146 A plant’s annual revenue requirement is the amount of revenue the plant owner needs to cover the plant’s fixed costs for that year. The ARR includes return of and on investment, fixed operations and maintenance costs, and other costs, such as taxes. For the Scenario Analysis, the ARR is assumed to include all costs except for some costs required for producing electricity (e.g., fuel costs and the costs for environmental emissions allowances).

2007 Regional System Plan 106 ISO New England Inc.
• Additional transmission and distribution investment may be needed to support various technologies, depending on where actual resources are added in the future. To a limited degree, the Scenario Analysis examined the transmission implications of different types of resource technologies for the system and found that incremental investments may well be needed to support the system’s transmission and distribution needs in the future. For example, significant transmission investment would be needed in New England under the import scenario, and, while not modeled, it also would likely be needed in Canada. Because it is not known where any actual demand-side or supply-side resources might actually develop, the Scenario Analysis used simplifed assumptions about transmission and distribution costs.
In summary, the results of the Scenario Analysis suggest that, absent policy changes, natural gas resources will be the capacity of choice. The addition of natural gas resources is consistent with recent experience, the types of resources in the queue, projections of net revenues exceeding the annual revenue requirements for inexpensive units, and the air emissions constraints, including RGGI. However, an expansion of the natural gas capacity would expose New England to potentially high prices and additional fuel-diversity issues.
10.5 Scenario Analysis Conclusions The Scenario Analysis produced detailed information about the economic, reliability, and environmental impacts of the expansion technologies on the region’s future electric power system and how these impacts change under different sets of assumptions. This summary provides only the tip of the “information iceberg.” Additional results are summarized in the full report; all the results are available to the public on the ISO Web site.147
To assist stakeholders in analyzing the data that became available as part of the Scenario Analysis, the ISO has posted on its Web site a spreadsheet tool that stakeholders can use to explore the information, undertake other investigations, and assess the impacts of making different assumptions (i.e., about capital costs, transmission needs, gas delivery infrastructure costs, and the like).148 The ISO encourages interested parties to compare the results for the different scenarios and reach their own conclusions about the various outcomes. Consistent with the original objectives of this initiative, the Scenario Analysis stops short of indicating what steps the region should now carry out. The ISO is willing to continue to work with policymakers and stakeholders to define the next stage of this analysis.
147 “Scenario Analysis Stakeholder Working Group Materials” (2007), http://www.iso-ne.com/committees/comm_wkgrps/othr/sas/mtrls/index.html. 148 The data-extraction spreadsheets and user guide are available online at http://www.iso-ne.com/committees/comm_wkgrps/othr/sas/mtrls/sprdsheet/index.html.

2007 Regional System Plan 107 ISO New England Inc.
Section 11 Interregional Planning and Regional Initiatives The ISO is participating in numerous national, interregional, and systemwide initiatives with the U.S. Department of Energy (DOE), the Northeast Power Coordinating Council, and other control areas in the United States and Canada. The aim of these projects, as described in this section, is to ensure that planning efforts are coordinated to enhance the widespread reliability of the electric power system.
11.1 National Initiatives of the Energy Policy Act of 2005 The Energy Policy Act of 2005 (amending the Federal Power Act) mandates DOE and FERC to ensure the reliability of the transmission infrastructure through system expansion and the implementation of enforceable reliability standards.149 The Energy Policy Act (EPAct) includes provisions related to the federal siting of transmission facilities, called National Interest Electric Transmission Corridors (NIETCs), and the establishment of a national Electric Reliability Organization (ERO).
11.1.1 U.S. DOE Study of National Interest Electric Transmission Corridors
The aim of Section 1221 of the EPAct is to ensure the timely siting of needed transmission infrastructure and attention to other issues involving national concerns (e.g., economic growth and security).150 To further this goal, the act delegates specific, yet very different tasks to DOE and FERC. New Section 216(a)(2) of the act requires DOE to designate geographic areas as National Interest Electric Transmission Corridors. These NIETCs are areas that experience, for example, transmission capacity constraints or congestion that adversely affect consumers. Under new Section 216(b), FERC has the authority to implement several provisions. One provision is to permit the construction of specific transmission projects within designated NIETCs under certain circumstances, such as when state authorities lack the power to permit the project or consider the interstate benefits, or when state authorities fail to authorize the project. New Section 216(h)(9)(C) of the EPAct requires the U.S. Secretary of Energy to regularly consult with, among others, transmission organizations (i.e., ISOs, RTOs, independent transmission providers, or other FERC-approved transmission organizations). DOE currently is evaluating the possibility of NIETC designation in the mid-Atlantic area, but it has not identified areas within New England. ISO New England remains committed to working with DOE on future studies and coordinating activities with other ISOs and RTOs as well as policymakers and electric power industry stakeholders in New England.
11.1.2 Electric Reliability Organization Overview
The Federal Power Act directed FERC to establish one Electric Reliability Organization.151 The statutory responsibilities for the ERO include establishing and enforcing standards for the North 149 Energy Policy Act of 2005, Pub. L. No.109-58, Title XII, Subtitle B, 119 Stat. 594 (2005) (amending the Federal Power Act to add a new Section 216). 150 Federal Power Act §216(a)(2). 151 “Becoming the New NERC,” information about the status of NERC as the ERO (Princeton, NJ: NERC, 2007), http://www.nerc.com/about/ero.html. “ERO Documentation,” ISO filings to FERC on the ERO (Holyoke, MA: ISO New England, 2005, 2006, and 2007), http://www.iso-ne.com/rules_proceds/nerc_npcc/ero_docs/index.html.
2007 Regional System Plan 108 ISO New England Inc.
American bulk power system and periodically publishing reliability reports. The North American Electric Reliability Corporation has been designated as the ERO, and ISO New England has administered applicable enforcement standards and participated in interregional studies.
11.2 Interregional Coordination In addition to being part of the federal-level programs affecting the electricity industry, the ISO is participating in the ISO/RTO Council (IRC), an association of the nine functioning North American Independent System Operators and Regional Transmission Organizations. The ISO is also actively participating in NPCC interregional planning activities and a number of other activities designed to reduce seams issues with other ISOs and RTOs.
11.2.1 IRC Activities
Created in April 2003, the ISO/RTO Council works collaboratively to develop effective processes, tools, and standard methods for improving competitive electricity markets across North America. In fulfilling this mission, the IRC balances reliability considerations with market practices that encourage the addition of needed resources. This results in each ISO/RTO managing efficient, robust markets that provide competitive and reliable electricity service. Among its activities, the IRC has been assisting DOE in conducting congestion studies necessary for NIETC designation. Specifically, IRC members have provided considerable data and made technical expertise available to DOE, as necessary, to facilitate this determination. While the IRC members have different authorities, they have many planning responsibilities in common because of their similar missions to independently and fairly administer the respective wholesale electricity markets in the various regions. Each ISO/RTO leads the planning effort among its participants through an open stakeholder process. This ensures a level playing field for developing infrastructure that is efficiently driven by competition and that meets all reliability requirements. ISOs/RTOs have also met with their respective stakeholders to discuss whether any improvements in their planning processes are necessary to comply with recently issued FERC Order No. 890.152
Order No. 890, among other things, requires transmission providers to develop and incorporate in their respective Open Access Transmission Tariffs a coordinated, open, and transparent transmission planning process on both a local and regional level. Although Order 890 affords great flexibility to transmission providers to develop a transmission planning process that suits the respective region, the process must comply with certain FERC principles. Specifically, the transmission planning process must provide for coordination, openness, transparency, information exchange, comparability, dispute resolution, regional coordination, economic planning studies, and cost allocation. In December 2007, ISO New England will make a compliance filing to FERC that will incorporate changes in its Open Access Transmission Tariff to reflect the reforms adopted in Order No. 890, as applicable. The PAC reviewed the ISO’s Order 890 planning-process strawman and provided input to further enhance the process.
152 Preventing Undue Discrimination and Preference in Transmission Service, Final Rule, 18 CFR Parts 35 and 37, Docket Nos. RM05-17-000 and RM05-25-000, Order No. 890 (Washington, DC: FERC, February 16, 2007), http://www.ferc.gov/whats-new/comm-meet/2007/021507/E-1.pdf. Also see Open Access Transmission Tariff Reform, Order No. 890 Final Rule (Washington, DC: FERC, 2007), http://www.ferc.gov/industries/electric/indus-act/oatt-reform/sum-compl-filing.asp.

2007 Regional System Plan 109 ISO New England Inc.
11.2.2 Northeast Power Coordinating Council
ISO New England is actively participating in the NPCC interregional planning activities. The NPCC is one of a number of power system organizations in the United States. It has about 40 members from the utility and public sectors in five control areas, as follows:
• The Maritimes (including the New Brunswick System Operator, Nova Scotia Power Inc., the Maritime Electric Company Ltd., and the Northern Maine Independent System Administrator, Inc.)
• New England (ISO New England)
• New York (New York Independent System Operator)
• Ontario (Independent Electric System Operator, IESO)
• Québec (Hydro-Québec TransÉnergie)
The council was established not to only prevent major blackouts from occurring but also to ensure the continued reliability of the electrical network in the northeastern United States and some of the interconnected Canadian provinces. To meet these objectives, the council has established criteria, guidelines, and procedures that address the security and adequacy of the interconnected bulk power supply system. With the formation of the ERO, the structure and responsibilities of NPCC have changed. NPCC is now a “regional entity” to which the ERO delegates authority for proposing and enforcing reliability standards. NPCC also provides other services to its members, including the coordination of studies. ISO New England is committed to the goals and methods of the NPCC organization. The ISO remains determined to plan and operate the New England system in full compliance with NPCC criteria, guidelines, and procedures, and to participate in NPCC interregional studies and planning initiatives.
11.2.2.1 Compliance with NPCC Criteria and Standards NPCC reliability criteria are specific and mandatory and address a wide variety of factors related to maintaining the reliability and security of the bulk power system. The criteria and standards address the following activities:
• Designing and operating interconnected power systems
• Monitoring the performance of a control area’s interconnection frequency
• Meeting customer demands for electricity
• Handling frequency disturbances
• Operating during emergencies
• Shedding load
• Restoring system operations
• Designing, maintaining, and testing system protection equipment
• Maintaining operating reserves
• Rating transmission and generation facilities
2007 Regional System Plan 110 ISO New England Inc.
• Reviewing and approving system documentation
Through its Reliability Compliance and Enforcement Program, the NPCC assesses and enforces the control areas’ compliance with these criteria. In turn, each control area assesses and enforces its market participants’ compliance with these criteria. As the administrator of New England’s compliance program, ISO New England surveys its participants and has the ability to issue sanctions for noncompliance. The ISO’s participants have complied with all NPCC planning requirements and have fully cooperated with the ISO during these efforts. All participants must continue to engage in this process because standards are periodically revised or added.
11.2.2.2 Planning for Interregional Resource Adequacy NPCC initiates studies of its control areas and coordinates member-system plans to facilitate interregional improvements to reliability. The council evaluates control area assessments, area resource reviews, and interim and comprehensive reviews of transmission. The studies also include short-term assessments to ensure that developments in one region do not have significant adverse effects on other regions. The NPCC Task Force on Coordination of Planning (TFCP) reviews the adequacy of the NPCC systems to supply load, considering forecasted demand, installed and planned supply and demand resources, and required reserve margins. The review is accomplished in accordance with the NPCC Guidelines for Area Review of Resource Adequacy (Document B-8), on the basis of the schedule set forth in the NPCC Reliability Assessment Program.153 All studies are well coordinated across control area boundaries and include the development of common databases that can serve as the basis for internal studies by ISO New England. As an active member of NPCC, ISO New England fully participates in NPCC’s coordinated interregional studies with its neighboring control areas. Recognizing the diversity of the Northeast, the NPCC assisted NERC in gathering data to assess the resource adequacy of its five control areas.154 The results of this study show that among the five NPCC areas, the Maritimes and Québec are winter-peaking systems. Ontario historically has experienced its annual peak demand in the winter. However, in three of the last five years, Ontario’s annual peak demand occurred during the summer as a result of extreme weather conditions. On the basis of normal weather conditions, Ontario is forecast to become a summer-peaking area in 2007. The New York and New England areas continue to be summer-peaking systems. Owing to the mix of winter- and summer-peaking control areas, the wider NPCC region has reserves to share among the control areas during the peaks. Thus, when each of its control areas is in compliance with its once-in-10-year LOLE resource-planning criterion (see Section 4.1), the resource adequacy of the entire NPCC region is ensured.
11.2.3 Northeastern ISO/RTO Planning Coordination Protocol
ISO New England, NYISO, and PJM follow a Planning Protocol to enhance the coordination of planning activities and address planning seams issues among the interregional control areas. Hydro-Québec TransÉnergie, IESO, and New Brunswick Power participate on a limited basis to share data
153 Guidelines for Area Review of Resource Adequacy, Document B-8 (New York, NPCC Inc., November 29, 2005), http://www.npcc.org/PublicFiles/Reliability/CriteriaGuidesProcedures/B-08.pdf. 154 2005 Long-Term Reliability Assessment (Princeton, NJ: NERC, September 2005), http://www.nerc.com/~filez/rasreports.html.

2007 Regional System Plan 111 ISO New England Inc.
and information. The key elements of the protocol are to establish procedures that accomplish the following tasks:
• Exchange data and information to ensure the proper coordination of databases and planning models for both individual and joint planning activities conducted by all parties
• Coordinate interconnection requests likely to have cross-border impacts
• Analyze firm transmission service requests likely to have cross-border impacts
• Develop the Northeast Coordinated System Plan
• Allocate the costs associated with projects having cross-border impacts consistent with each party’s tariff and applicable federal or provincial regulatory policy
To implement the protocol, the group formed the Joint ISO/RTO Planning Committee (JIPC) and an open stakeholder group called the Inter-Area Planning Stakeholder Advisory Committee (IPSAC).155 Through the open stakeholder process, the JIPC has addressed several interregional control area issues, as follows:
• Resource adequacy
• Fuel diversity
• Cross-border impacts of transmission security, including the consideration of loss-of-source contingencies in New England
• Environmental regulations
Loss-of-source contingencies in excess of 1,200 MW could have an adverse impact on the neighboring New York and PJM systems. Studies that examine the possibility of increasing this 1,200 MW limit, possibly through the addition of system improvements, are being conducted. The potential benefits of a higher loss-of-source limit include increased imports from Canada over the HVDC Phase II interconnection, fewer reductions in dispatch of larger nuclear units and Mystic units #8 and #9, and the allowance of large new generating units or interconnections. All planning activities appear to be well coordinated, as shown by the system impact studies and system assessments that more accurately and thoroughly account for neighboring systems. IPSAC has discussed the need for further work, and the JIPC will continue to coordinate study efforts.
11.2.4 Imports from Eastern Canada
The eastern Canadian premiers and Canadian utilities have announced a strategy to build significant new hydro resources (4,000 MW to 6,000 MW) by 2015 and intend to sell power to Ontario and New England during the summer months. Taking into consideration the seasonal load diversity previously referenced (see Section 11.2.2.2), some of the Canadian provinces would expect to purchase power from the northeastern United States during the winter months. This is consistent with the goals of the Northeast International Committee on Energy (NICE) that has sought to reduce the overall emissions
155 See “Inter-ISO Planning,” IPSAC meeting notices (2007), http://www.interiso.com.

2007 Regional System Plan 112 ISO New England Inc.
of greenhouse gases and to facilitate increased transfers of electrical energy.156 This plan would diversify electric energy supplies for New England and potentially reduce costs to New England electric energy customers. The ISO will work with stakeholders to develop a comprehensive transmission plan that can accommodate additional transfers between New England and eastern Canada. For all projects that could have an interregional impact, the ISO also will closely coordinate with all neighboring systems to study and implement these projects to ensure reliable system performance between the control areas. To optimize system performance at lowest cost, new improvements and interconnections, such as the Northeast Reliability Interconnection (see Section 9.4) and the Maine Power Connection (Section 9.3.1.2), require joint studies with neighboring systems. Additionally, through the Northeastern ISO/RTO Planning Coordination Protocol, ISO New England has remained alert to opportunities for jointly planning facilities with neighboring areas.
11.3 Coordination among the New England States The six New England states are proposing to form a regional state committee to be known as the New England States Committee on Electricity (NESCOE). As defined by FERC, a regional state committee is a forum for state representatives to participate in the RTO's or ISO's decision-making process.157
The states have developed a NESCOE Term Sheet, which has been approved by the NEPOOL Participants Committee. The states are preparing to file the proposal with FERC.158
The term sheet specifies that NESCOE will focus on resource adequacy and system planning and expansion. When NESCOE is formed, the ISO will work with representatives of the committee through the ISO planning process and the PAC to develop the Regional System Plans. The ISO will also continue to work with other representatives of the New England states, primarily through the PAC but also through designated representative organizations, such as the New England Conference of Public Utilities Commissioners (NECPUC) and the New England Governors' Conference (NEGC). Other developments in the New England states could affect the planning process, such as the need for transmission improvements to encourage the development of renewable resources (see Section 9.3.1.1).
156 NICE includes representatives from the New England Governors and the Eastern Canadian Premiers (NEG/ECP). Additional information about NICE is available online as follows: 1) the NEG Conference Inc. Web site, “New England Governors’ Conference Programs, NEGC Energy Programs,” http://www.negc.org/energy.html, and 2) NEG/ECP Resolution 31-1 of the 31st Conference of New England Governors and Eastern Canadian Premiers, Resolution Concerning Energy and the Environment (Brudenell, Prince Edward Island: NEG/ECP, June 26, 2007), http://www.negc.org/documents/NEG-ECP_31-1.pdf. All accessed August 8, 2007. 157 Wholesale Power Market Platform (SMD Notice of Proposed Rulemaking White Paper), Docket No. RM01-12-000 (Washington, DC: FERC, April 28, 2003). 158 Previous filings related to NESCOE are on file with FERC in Docket No. EL04-112, “The Governors of Connecticut, Maine and Massachusetts et al submits a joint petition for declaratory order to form a New England Regional State Committee under EL04-112,” Accession No: 20040628-0086 (June 25, 2004), http://elibrary.ferc.gov/idmws/docket_search.asp.

2007 Regional System Plan 113 ISO New England Inc.
11.4 Summary of Interregional Planning Resource adequacy is a common concern for the Northeast; retirements of existing supply resources are a potential concern. In the longer term, additional seasonal-diversity power transactions with the eastern Canadian provinces will benefit both areas and generate the need for a comprehensive transmission plan to move power between the regions. ISO New England’s planning activities are closely coordinated among the six New England states, as well as with neighboring systems and the federal government. The ISO has achieved full compliance with all required planning standards and has successfully implemented the northeastern ISO/RTO Planning Protocol, which has further improved interregional planning among control areas. Sharing capacity resources, particularly during periods of fuel shortages, may become increasingly necessary. Thus, identifying the impacts that proposed generating units and transmission projects can have on neighboring systems is beneficial.

2007 Regional System Plan 114 ISO New England Inc.
Section 12 Conclusions The publication of the 2007 Regional System Plan and the issuance of the current Transmission Projects Listing serve to meet the ISO’s requirements of its FERC tariff to issue an annual RSP. With broad input from regional stakeholders, this plan assesses New England’s bulk power system and identifies system improvements required for serving load reliably throughout New England for the next 10 years. The plan builds on the results of RSP06 and other regional activities, and it reports on the significant progress that has been made over the past several years by the ISO, regional stakeholders, state regulators, elected officials, market participants, and transmission owners to improve the reliability of the system as a result of implementing projects stemming from the RSP planning process. One of the major accomplishments over the last several years has been to recognize the need for new transmission infrastructure. Since 2002, 182 new projects have been completed, representing approximately $1 billion in new transmission investment. Several major 345 kV reinforcement projects are under construction in 2007, and four projects are scheduled for completion by the end of the year. These projects, along with others on the Transmission Projects Listing, will bring significant reliability benefits to the system while providing a platform to support an efficient and effective power market. Another accomplishment has been the progress made to improve the wholesale markets, including the Forward Capacity Market and the locational Forward Reserves Market, both of which provide incentives for developing supply-side and demand-side resources in the amounts and locations needed for reliability at competitive prices. Although significant progress has been made, RSP07 has identified that the region must develop new resources and further transmission improvements to serve the long-term forecast for this 10-year period of a 1.7% annual average growth in peak demand. Additionally, under the framework and assumptions used in the Scenario Analysis, several economic, reliability, and environmental themes emerged about the future of the system beyond the 10-year timeframe, including the following:
• New England will continue to depend on natural-gas-fired electricity production for a large percentage of its electric energy.
• Energy prices and air emissions will be strongly influenced by the relative costs of natural gas and oil.
• The power sector will need to follow various strategies to meet the region’s challenging goals for reducing CO2 emissions.
The full set of assumptions for the Scenario Analysis must be taken into consideration, however, when assessing these results and their implications for New England’s bulk electric power system. This section provides the ISO’s conclusions about the planning process and the need for new and alternative resources, fuel diversity, and transmission based on the results of the studies conducted for RSP07 and the activities that took place during the year.
12.1 Status of the Planning Process The successful operation of the system during the 2007 peak-load periods demonstrated, in part, how proper system planning can help ensure adequate capacity and transmission capability. RSP07 and related planning studies continue to benefit from an open stakeholder planning process on a regional

2007 Regional System Plan 115 ISO New England Inc.
and interregional basis. Stakeholders, particularly members of the PAC, provide valuable input on the RSP, including the scope of work, draft results, and final draft plans, which are subject to ISO/RTO approval. The ISO is undertaking a number of planning-related initiatives to improve the planning process with the aim of improving the electric power system in New England and in the broader region overall. ISO’s participation in NERC, regional reliability councils, and working groups with other ISO/RTOs ensures that the ISO’s plans are well coordinated with those of neighboring systems. In addition, aspects of the ISO’s planning process, including planning methods to reflect demand-side resources, the process for transmission owners to develop local improvements, and dispute resolution, are also being refined as part of FERC Order 890. Continuous planning by the ISO is necessary, given that studies are ongoing and because of the uncertainties of load, electric energy growth, generator performance, fuel prices, and other assumptions and unforeseen events. NECPUC has developed a white paper that reviews transmission cost allocation methodologies, and further discussion of this issue is anticipated. The allocation of costs for transmission required to access sources of renewable energy likely will be discussed as well.
12.2 Need for Resources The New England electric power system is projected as having adequate resources through 2009. However, additional resources will by required by 2010, and this need will grow with time. The desired locations and operating characteristics of system resources are summarized below:
• The addition of resources in transmission-constrained areas, such as Greater Connecticut, will provide the most system benefit by improving system security and reducing costs to customers.
• The addition of fast-start and demand-response resources in Greater Southwest Connecticut, Greater Connecticut, and Boston could reduce the use of more costly resources that provide operating reserves and serve peak load.
• The interconnection of generators near relatively high concentrations of demand, especially Greater Southwest Connecticut, is generally preferred.
• An increase in energy efficiency, conservation, and demand response also could help New England meet a portion of its resource needs. In addition to reducing environmental emissions, reducing peak loads would result in the more efficient use of existing system infrastructure, delaying the need to add new supply resources and transmission.
While emphasis is needed on promoting energy efficiency and reducing peak demand, new generation resources also are needed. Planned improvements to the markets, such as the Forward Capacity Market and the locational Forward Reserves Market, provide incentives for the development of both supply-side and demand-side resources in the desired amounts and locations. Based on the show of interest in resource development through the FCM and the number of generators in the ISO Generator Interconnection Queue, New England most likely will meet its long-term resource adequacy requirements through established planning and market mechanisms. The locational Forward Reserve Market is providing incentives to add new generation and demand-response peaking resources in critical load pockets to support local reliability needs and more efficient market outcomes.
2007 Regional System Plan 116 ISO New England Inc.
12.3 Need for Demand-Side, “Clean,” and Renewable Resources State, regional, and national environmental regulations, such as the Regional Greenhouse Gas Initiative and Renewable Portfolio Standards, will promote the development of “clean” renewable resources, as well as energy efficiency, conservation, and demand response to help meet the resource needs of the system. Interregional planning efforts have been well coordinated and are underway to investigate access to renewable energy sources in New York and eastern Canada. These measures also can improve the diversity of the fuel supply and defer transmission improvements. Planning the system must consider how new environmental requirements, such as the Clean Air Interstate Rule and RGGI, affect generators. These requirements have the potential to increase wholesale energy costs and affect system reliability in a number of ways. For example, allowance costs could increase the price of electric energy, and generating units may elect to limit the number of hours they operate. The requirements of New England states’ Renewable Portfolio Standards are increasing along with the establishment of other new policy requirements that include the need to increase energy-efficiency programs. Renewable and demand-side resources can help meet the region's need for resources with zero or low emissions. If completed, the renewable resource projects in the ISO's Generator Interconnection Queue (as of May 25, 2007) would be able to meet about 80% of the region's need for new RPS renewable resources by 2016. Assuming no attrition of these queue projects, additional strategies would be needed over the 10-year period to meet the RPS requirements. These include adding projects to the queue, using other small, “behind-the-meter” RPS-qualifying resources, and purchasing RECs from projects in neighboring regions. LSEs also could make Alternative Compliance Payments to the states’ clean energy funds to help finance new renewable projects.
12.4 Need for Reliability and Fuel Diversity Natural-gas-fired combined-cycle generating units that have been added to New England since 1999 are relatively efficient and have low emissions. However, the region’s heavy dependence on natural gas to generate electricity presents a potential reliability risk and exposure to high wholesale electric energy costs, especially during winter peak-demand periods. Several regional actions, as follows, have been or can be taken to improve the reliability of the system and reduce exposure to price volatility:
• The market incentives provided by the FCM and the locational Forward Reserve Market are designed to increase the availability of generators, including those fueled solely by natural gas. This can be achieved by converting additional units to dual-fuel capability or through firm gas purchases.
• The proposed addition of renewable generating resources to comply with Renewable Portfolio Standards should help to improve the region’s fuel diversity. Related state programs coupled with improvements to the markets will encourage the use of energy efficiency and demand-response resources, as well, which are actions that also will decrease the region’s dependence on natural-gas-fired generating units.

2007 Regional System Plan 117 ISO New England Inc.
• Additions to the natural gas infrastructure, including LNG terminals and pipeline expansion, are currently being planned that can improve the reliability of and expand the natural gas supply to the region.
These actions will be monitored over the long term. To further address reliability concerns, new market rules and operating procedures have been developed to provide necessary market and operations information during times of extremely cold weather. ISO Operations personnel are now routinely in contact with their operations counterparts in the gas industry to identify maintenance requirements and share critical system information for supporting reliable operations in times of system stress.
12.5 Need for Transmission Transmission improvements are needed throughout New England to ensure the reliability of service to New England’s major load centers as well as contribute to market efficiency throughout the region. A transmission-improvement plan has been developed that coordinates major power transfers across the system, service to large and small load pockets, and requirements with neighboring control areas. The Transmission Projects Listing identifies a series of system upgrades that are required to address national and regional planning criteria. The development and implementation of these projects will help ensure the continued reliable operation of the New England transmission system. The ongoing review and modification of the Transmission Projects Listing will continue to reflect projected changes in the system. Improved estimates and updates of project costs would facilitate decision making about the projects and the development of viable alternatives.

2007 Regional System Plan 118 ISO New England Inc.
List of Acronyms and Abbreviations
Acronym/Abbreviation Description
AMR06 2006 Annual Markets Report
ARRs annual revenue requirements
Appendix H Appendix H of Market Rule 1, Operations during Cold Weather Conditions
BART best available retrofit technology
BHE RSP subarea of Northeastern Maine
BOSTON RSP subarea of Greater Boston, including the North Shore C&LM conservation and load-management
CAGR compound annual growth rate
CAIR Clean Air Interstate Rule
CAMR Clean Air Mercury Rule
CAVR Clean Air Visibility Rule
CELT capacity, energy, loads, and transmission
2007 CELT Report 2007–2016 Forecast Report of Capacity, Energy, Loads, and Transmission
CF capacity factor
CHP combined heat and power
CMA/NEMA RSP subarea that comprises central Massachusetts and northeastern Massachusetts
CMP Central Maine Power
CMR Code of Massachusetts Regulations
CO2 carbon dioxide
CT 1) State of Connnecticut 2) RSP subarea that includes northern and eastern Connecticut 3) Connecticut SMD Load Zone
CWA Clean Water Act
DARD dispatchable asset-related demand
DCT double-circuit tower
DG distributed generation
Document B-8 NPCC Guidelines for Area Review of Resource Adequacy
DOE U.S. Department of Energy
DOER Division of Energy Resources
DOT U.S. Department of Transportation
DPUC Department of Public Utilities Control
DR demand response
DRR Pilot Demand-Response Reserve Pilot Program
EE energy efficiency
EIA Energy Information Administration (U.S. DOT)
EPAct Energy Policy Act of 2005
EPA U.S. Environmental Protection Agency

2007 Regional System Plan 119 ISO New England Inc.
Acronym/Abbreviation Description
ERCOT Electric Reliability Council of Texas
ERO Electric Reliability Organization
FCA Forward Capacity Auction
FCM Forward Capacity Market
FERC Federal Energy Regulatory Commission
FRM Forward Reserve Market
Gap RFP Southwest Connecticut Gap Request for Proposal
GIS Generator Information System
Greater Connecticut RSP study area that includes the RSP subareas of NOR, SWCT, and CT
Greater Southwest Connecticut
RSP study area that includes the southwestern and western portions of Connecticut and comprises the SWCT and NOR Subareas
GWh gigawatt-hour(s)
HDD heating degree days
HEDD(s) high electric demand day(s)
Hg mercury
HQ Hydro-Québec Control Area
HQICC Hydro-Québec Installed Capacity Credit
HVAC heating, ventilation, and air conditioning
HVDC high-voltage direct current
ICAP installed capacity
ICR Installed Capacity Requirement
IESO Independent Electricity System Operator (Ontario, Canada)
IGCC integrated coal-gasification combined cycle
IMP Integrity Management Protocols
IPSAC Inter-Area Planning Stakeholder Advisory Committee
IRC ISO/RTO Council
IRR Installed Reserve Requirement
ISO Independent System Operator of New England; ISO New England
JIPC Joint ISO/RTO Planning Committee
kV kilovolt(s)
LAI Levitan and Associates, Inc.
LDCs local distribution companies
LFG landfill gas
LLC limited liability company
LMP locational marginal price
LNG liquefied natural gas
LOLE loss-of-load expectation
LSE load-serving entity
LSR Local Sourcing Requirement
MA Massachusetts

2007 Regional System Plan 120 ISO New England Inc.
Acronym/Abbreviation Description
MA DEP Massachusetts Department of Environmental Protection
MBtu million British thermal units
MGD million gallons per day
MD Maryland
ME
1) State of Maine 2) RSP subarea that includes western and central Maine and Saco Valley,
New Hampshire
3) Maine SMD Load Zone
MEPCO Maine Electric Power Company, Inc.
MOU memorandum of understanding
MPRP 1) Maine Power Reliability Project
2) Maine Power Reliability Program
MPS Maine Public Service
MVAR megavolt-ampere reactive
MW megawatt(s)
MWh megawatt-hour(s)
N-1 first-contingency loss
N-2 second-contingency loss
NECPUC New England Conference of Public Utilities Commissioners
NEEWS New England East–West Solution
NEGC New England Governors' Conference
NEG/ECP New England Governors and the Eastern Canadian Premiers
NEL net energy for load
NEMA 1) Northeast Massachusetts Subarea
2) Northeast Massachusetts SMD Load Zone
NEMA/Boston Combined SMD load zone that includes Northeast Massachusetts and the Boston area
NEPOOL New England Power Pool
NERC North American Electric Reliability Corporation
NESCAUM Northeast States for Coordinated Air Use Management
NESCOE New England States Committee on Electricity
NGA Northeast Gas Association
NGCC natural gas combined-cycle
NH
1) State of New Hampshire 2) RSP subarea that comprises northern, eastern, and central New Hampshire;
eastern Vermont; and southwestern Maine
3) New Hampshire SMD Load Zone
NICE Northeast International Committee on Energy
NIETC National Interest Electric Transmission Corridor
NNE northern New England
NOR RSP subarea that includes Norwalk and Stamford, Connecticut
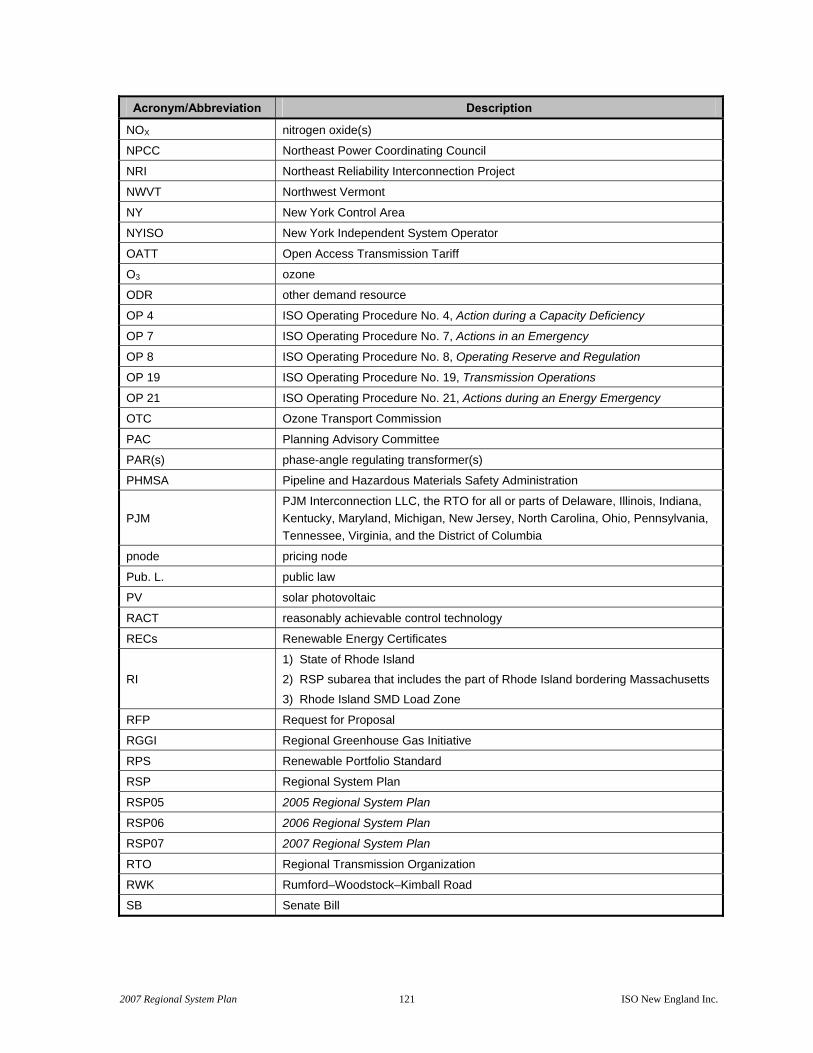
2007 Regional System Plan 121 ISO New England Inc.
Acronym/Abbreviation Description
NOX nitrogen oxide(s)
NPCC Northeast Power Coordinating Council
NRI Northeast Reliability Interconnection Project
NWVT Northwest Vermont
NY New York Control Area
NYISO New York Independent System Operator
OATT Open Access Transmission Tariff
O3 ozone
ODR other demand resource
OP 4 ISO Operating Procedure No. 4, Action during a Capacity Deficiency
OP 7 ISO Operating Procedure No. 7, Actions in an Emergency
OP 8 ISO Operating Procedure No. 8, Operating Reserve and Regulation
OP 19 ISO Operating Procedure No. 19, Transmission Operations
OP 21 ISO Operating Procedure No. 21, Actions during an Energy Emergency
OTC Ozone Transport Commission
PAC Planning Advisory Committee
PAR(s) phase-angle regulating transformer(s)
PHMSA Pipeline and Hazardous Materials Safety Administration
PJM PJM Interconnection LLC, the RTO for all or parts of Delaware, Illinois, Indiana, Kentucky, Maryland, Michigan, New Jersey, North Carolina, Ohio, Pennsylvania, Tennessee, Virginia, and the District of Columbia
pnode pricing node
Pub. L. public law
PV solar photovoltaic
RACT reasonably achievable control technology
RECs Renewable Energy Certificates
RI
1) State of Rhode Island
2) RSP subarea that includes the part of Rhode Island bordering Massachusetts
3) Rhode Island SMD Load Zone
RFP Request for Proposal
RGGI Regional Greenhouse Gas Initiative
RPS Renewable Portfolio Standard
RSP Regional System Plan
RSP05 2005 Regional System Plan
RSP06 2006 Regional System Plan
RSP07 2007 Regional System Plan
RTO Regional Transmission Organization
RWK Rumford–Woodstock–Kimball Road
SB Senate Bill

2007 Regional System Plan 122 ISO New England Inc.
Acronym/Abbreviation Description
SEMA 1) RSP subarea that comprises southeastern Massachusetts and Newport,
Rhode Island
2) Southeastern Massachusetts SMD Load Zone
SIP State Implementation Plan
SMD Standard Market Design
SME RSP subarea for Southeastern Maine
SNE southern New England
SNETR Southern New England Transmission Reinforcement
SO2 sulfur dioxide
SF6 sulfur hexafluoride
SPEED Sustainably Priced Energy Enterprise Development
SPS(s) special protection system(s)
SRI Southern Rhode Island
Stat. statute
SWCT RSP subarea for Southwest Connecticut; Southwest Connecticut
SWRI Southwest Rhode Island
TFCP NPCC Task Force on Coordination of Planning
TMOR 30-minute operating reserves
TO transmission owner
Transmission Tariff Open Access Transmission Tariff
TWh terawatt-hour(s)
U.S. United States
VELCO Vermont Electric Power Company
VT
1) State of Vermont
2) RSP subarea that includes Vermont and southwestern New Hampshire
3) Vermont SMD Load Zone
WCMA West Central Massachusetts SMD Load Zone
WMA RSP subarea for Western Massachusetts
WSCC winter seasonal claimed capability