2007 office of the cio technology poll results
DESCRIPTION
2007 Office of the CIO Technology Poll Results. Information Technology Questions Office of the Chief Information Officer. 2007 Technology Poll Background. Conducted between January and February 2007 - PowerPoint PPT PresentationTRANSCRIPT

2007 Office of the CIOTechnology Poll Results
Information Technology QuestionsOffice of the Chief
Information Officer
2007 Technology Poll Background
• Conducted between January and February 2007• Survey contained information technology (IT)
questions from the Chief Information Officer (CIO), including the Office of Information Technology (OIT), Technology Enhanced Learning and Research (TELR), OSU Libraries and the Ohio Learning Network
• Faculty and Staff – first contact by campus mail; then sent an e-mail direct them to to online survey
• Students sent e-mail directing them to web survey

2007 Technology Poll Background
1817 respondents in total
Segment Sampled Valid Responses
Valid Response
Rate
Faculty (F) 2,000 464 23.8
Grad/Prof (G/P)
2000 258 12.9
Undergrad (U) 2500 452 18.2
Staff (S) 2,000 643 32.2

Response rate
0
500
1000
1500
2000
2500
F G/P U S
Sampled Respondents

Satisfaction with TELR instructional support services
0
10
20
30
40
50
Very SatisfiedSomewhat Sat.Somewhat Dis.V. Dissat. (Not sat.)Don’t use service
2005 2006 2007

Communications from the CIO Keep
Faculty Informed about Events/Services
0
10
20
30
40
50
60
Strongly agree
AgreeDisagree
Strongly disagree
Don't Know
2005 F
2006 F
2007 F

Communications from the CIO Keep Staff Informed about Events/Services
0
10
20
30
40
50
Strongly agree
AgreeDisagree
Strongly disagree
Don't Know
2005 S
2006 S
2007 S

Communications from the CIO Keep Grad/Professional Students Informed
about Events/Services
0
10
20
30
40
50
60
Strongly agree
AgreeDisagree
Strongly disagree
Don't Know
2005 G/P
2006 G/P
2007 G/P
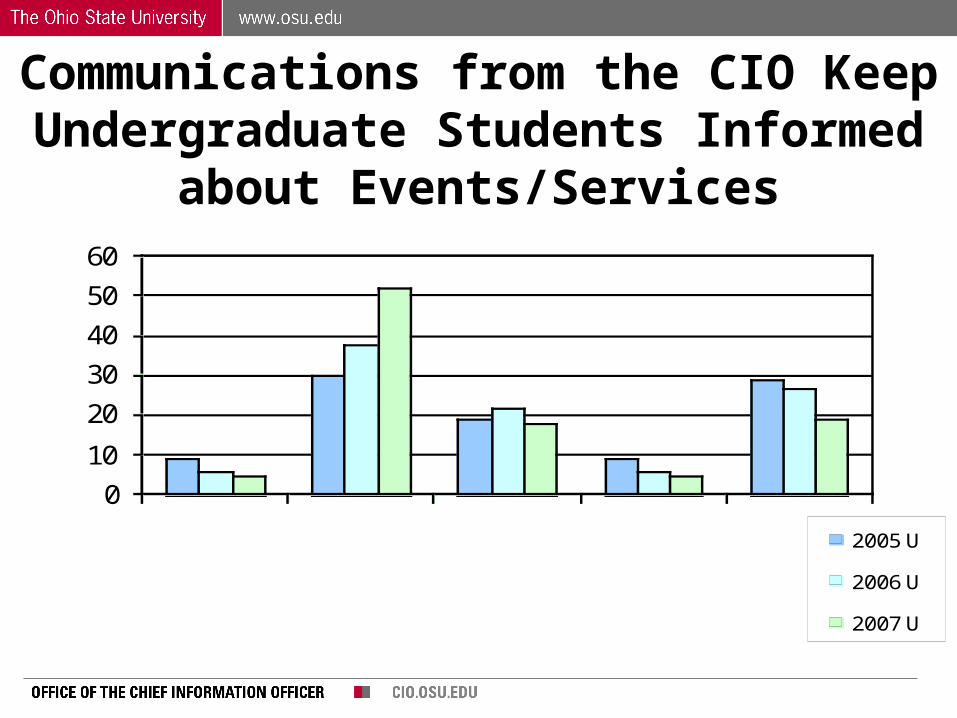
Communications from the CIO Keep Undergraduate Students Informed about
Events/Services
0
10
20
30
40
50
60
Strongly agree
AgreeDisagree
Strongly disagree
Don't Know
2005 U
2006 U
2007 U

Ohio State meets your information technology needs
0
10
20
30
40
50
60
70
80
90
2005 F2006 F2007 F2005 G/P2006 G/P2007 G/P
2005 U2006 U2007 U 2005 S2006 S2007 S
Yes No No Opinion

IT was a factor in coming to Ohio State
0
10
20
30
40
50
60
70
2002 F 2003 F 2004 F 2005 F 2006 F 2007 F
Strongly Agree AgreeNeither Agree or Disagree DisagreeStrongly Disagree Don't Know

IT is a factor for remaining at Ohio State
0
5
10
15
20
25
30
35
40
45
50
2004 F 2005 F 2006 F 2007 F
Strongly Agree Agree Neither Agree or Disagree
Disagree Strongly Disagree Don't Know

Satisfaction with helpfulness and responsiveness of other IT support resources at Ohio State in 2007
0
5
10
15
20
25
30
35
40
45
50
2007 F% 2007 G/P% 2007 U% 2007 S%
Ve ry sa tis fie d S ome wha t sa tis fie d S ome wha t dissa tis fie d
Ve ry dissa tis fie d Don't know

Satisfaction with the Ohio State central e-mail service in 2007
0
5
10
15
20
25
30
35
40
45
50
2007 F% 2007 G/P% 2007U% 2007 S%
Very satisfied Somewhat satisfied Somewhat dissatisfied
Very dissatisfied Don't know
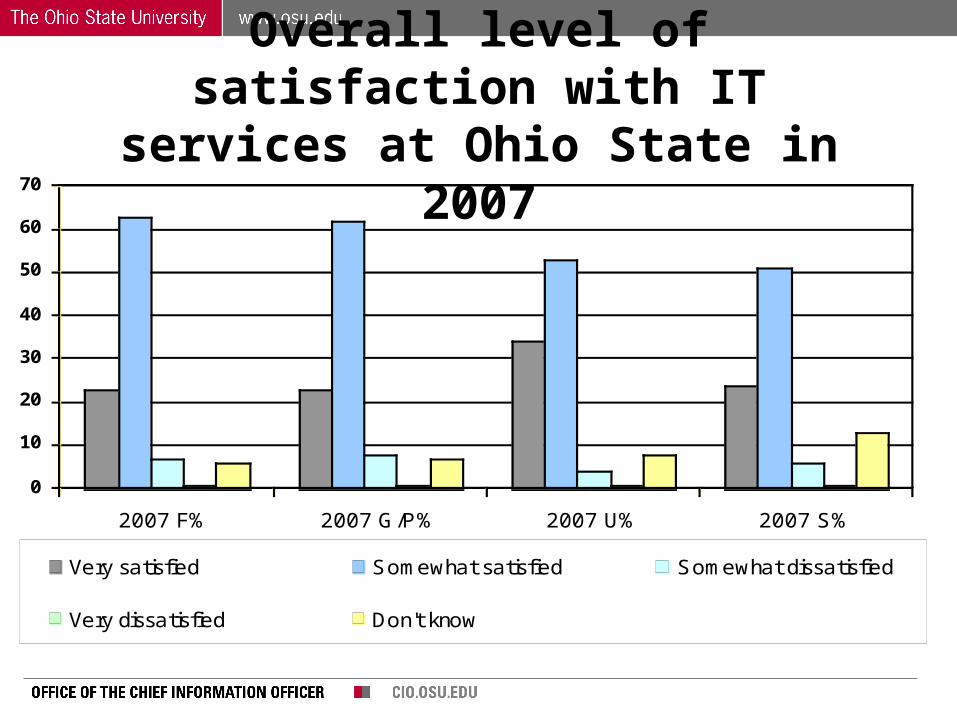
Overall level of satisfaction with IT services at Ohio State in 2007
0
10
20
30
40
50
60
70
2007 F% 2007 G/P% 2007 U% 2007 S%
Very satisfied Somewhat satisfied Somewhat dissatisfied
Very dissatisfied Don't know

Familiarity with IT resources
010
20
3040
50
60
2005 F2006 F2007F2005 G/P2006 G/P2007G/P 2005 U2006 U2007 U 2005 S2006 S2007 S
Very familiar Familiar Somewhat familiar Not familiar Do not use

Familiarity with IT resources
• Very familiar or familiar with IT resources• 34% Undergraduate students• 33% Graduate/Professional students• 25% Staff • 24% Faculty
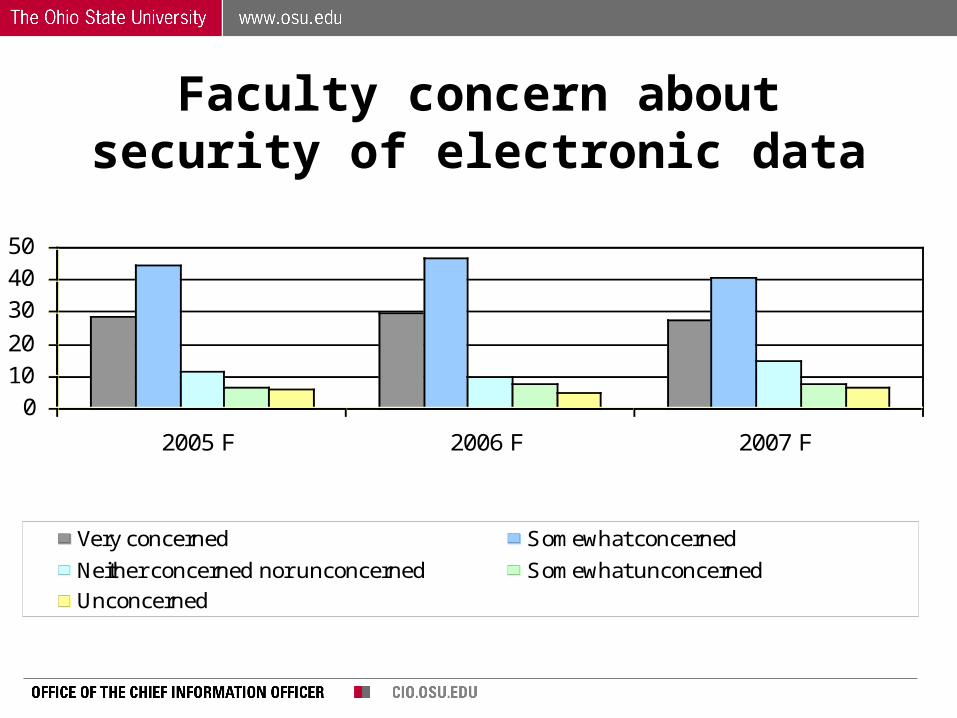
Faculty concern about security of electronic data
01020
304050
2005 F 2006 F 2007 F
Very concerned Somewhat concerned
Neither concerned nor unconcerned Somewhat unconcerned
Unconcerned

Faculty concern about privacy of communications
01020304050
2005 F 2006 F 2007 F
Very concerned Somewhat concernedNeither concerned nor unconcerned Somewhat unconcernedUnconcerned

Home Computers
84
86
88
90
92
94
96
98
100
F% G/P% U% S%
2004 2005 2006 2007
2007data
•98% Faculty
•99% G/P
•99% U
•94% Staff

Laptop as primary computer among respondents having home computers
010203040506070
F% G/P% U% S%
2004 2005 2006 2007
2007 data
• 46% Faculty
• 62% G/P
• 62% U
• 32% Staff

Windows PC vs. Mac as primary platform
0
20
40
60
80
100
PC FMac FPC G/PMac G/PPC UMac UPC SMac S
2005
2006
2007
2007 Mac data
•20% Faculty
•13% G/P
•10% U
•5% Staff

Presence of two or more computers at home in 2007
67
49
33
41
76
56
30
4538
4447
61
0
10
20
30
40
50
60
70
80
F% G/P% U% S%
2005 2006 2007

Laptops as Secondary computers
51
59
4347
42 44
37
4449
44 43
39
0
10
20
30
40
50
60
70
2005 2006 2007
F% G/P% U% S%

Use of wireless connection for secondary computer
0
10
20
30
40
50
60
70
80
F% G/P% U% S%
200520062007
• Over 66% of all groups reported wireless connections for secondary computers in the 2007poll

Mac platform for secondary computer
0
2
4
6
8
10
12
14
16
18
20
F% G/P% U% S%
2005
2006
2007

Presence of home Internet Service Provider (ISP)
78%
80%
82%
88%
87% 87% 88%
92% 92%
70%
72%
74%
76%
78%
80%
82%
84%
86%
88%
90%
1999 2000 2001 2002 2003 2004 2005 2006 2007

Primary home ISP used to connect to university network
0%
5%
10%
15%
20%
25%
30%
35%
40%
45%
50%
2004 2005 2006 2007
Roadrunner SBC/DSL WOWResNet OSUWeb HomeNet
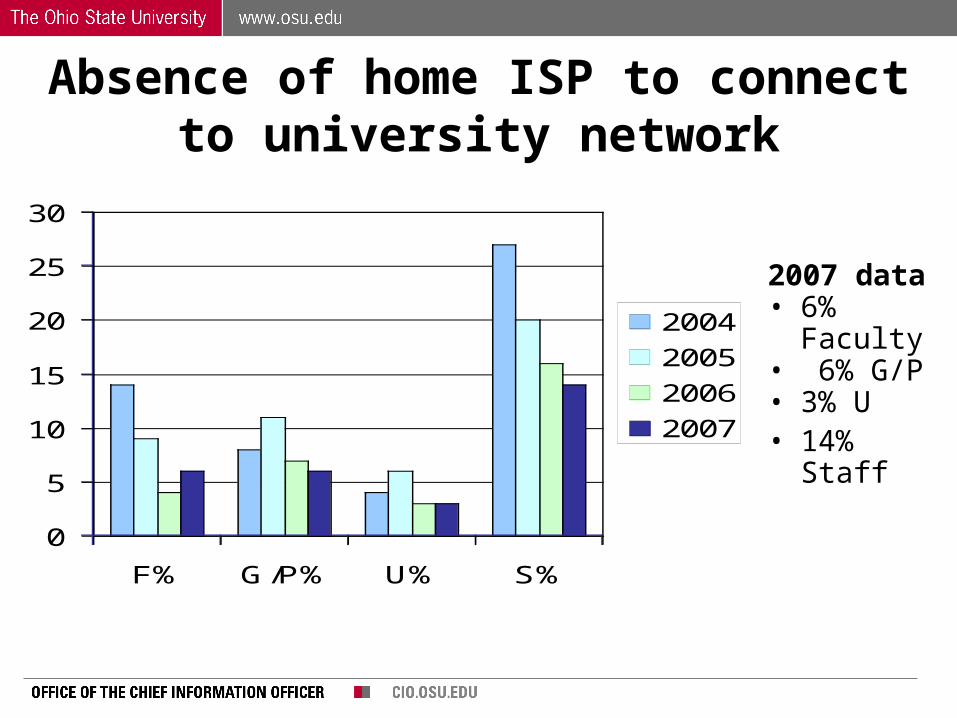
Absence of home ISP to connect to university network
0
5
10
15
20
25
30
F% G/P% U% S%
2004
2005
2006
2007
2007 data• 6%
Faculty• 6% G/P• 3% U• 14% Staff

Undergraduate students with ISP before OSU and retention
0
10
20
30
40
50
60
70
80
90
100
2006 2007
Had ISP
Still UsingISP
• In 2007, of the 83% who had an ISP before coming to Ohio State, 46% retained the ISP

Graduate/Professional students with ISP before OSU and retention
0
10
20
30
40
50
60
70
80
90
2006 2007
Had ISP
Still UsingISP
• In 2007, of the 74% who had an ISP before coming to Ohio State, 42% retained the ISP

Use of home ISP for more than 20 hours per week
0
10
20
30
40
50
60
F% G/P% U% S%
2004
2005
2006
2007
2007 Data• 42% U• 40% G/P• 34%
faculty• 18% Staff

Use of computer labs by undergraduate students
010
2030
4050
6070
8090
<10hrs/wk
10-20hrs/wk
21-60hrs/wk
>60hrs/wk
2004
2005
2006
2007
2007 data
74% <10 hours
19% 10-20 hours
6% 21-60 hours
<1% >60 hours

Use of computer labs by graduate/professional students
010
2030
4050
6070
8090
<10hrs/wk
10-20hrs/wk
21-60hrs/wk
>60hrs/wk
2004
2005
2006
2007
2007 data
74% <10 hours
14% 10-20 hours
9% 21-60 hours
2% >60 hours

Aware of OSU Central Anti-Spam on Central E-mail
0
10
20
30
40
50
60
70
80
90
F% G/P% U% S%
2006
2007
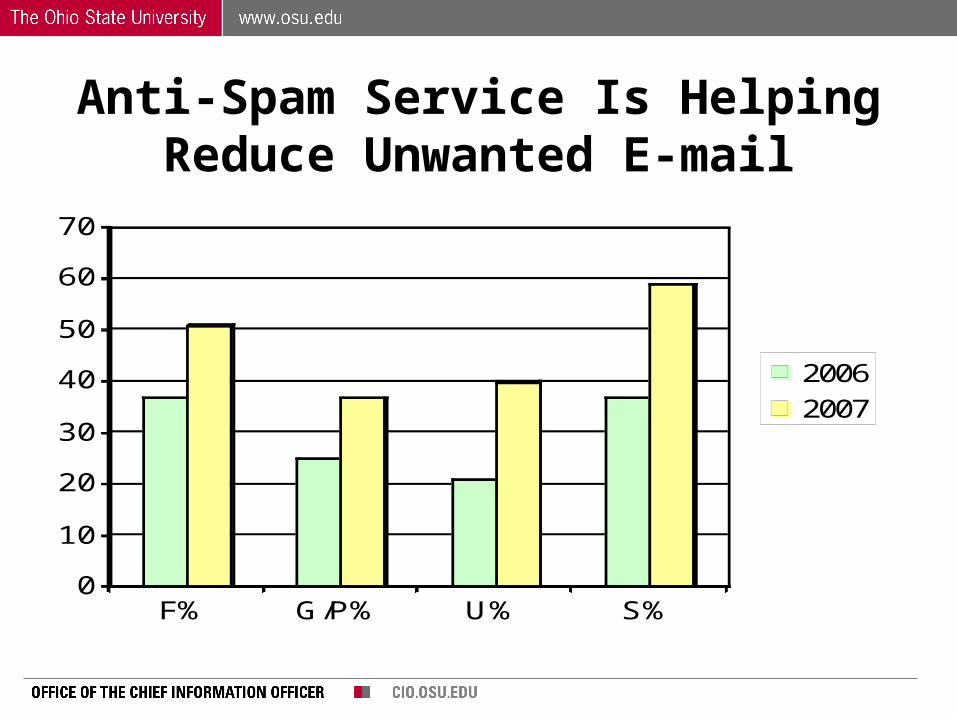
Anti-Spam Service Is Helping Reduce Unwanted E-mail
0
10
20
30
40
50
60
70
F% G/P% U% S%
2006
2007
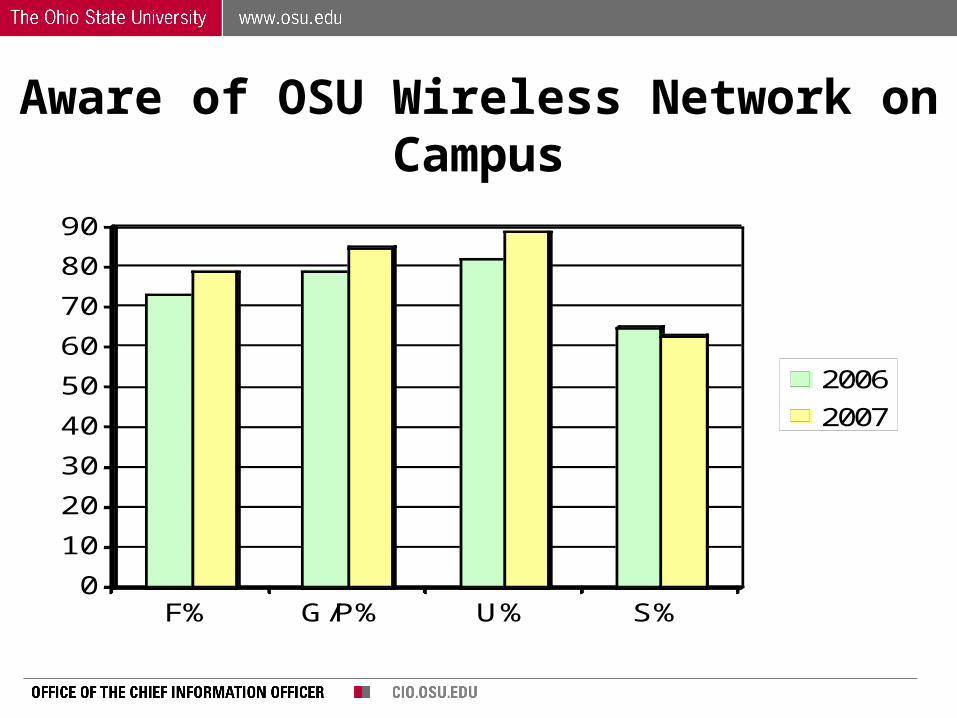
Aware of OSU Wireless Network on Campus
0
10
20
30
40
50
60
70
80
90
F% G/P% U% S%
2006
2007

Activated an OSU Wireless Account
0
5
10
15
20
25
30
35
40
45
F% G/P% U% S%
2006
2007
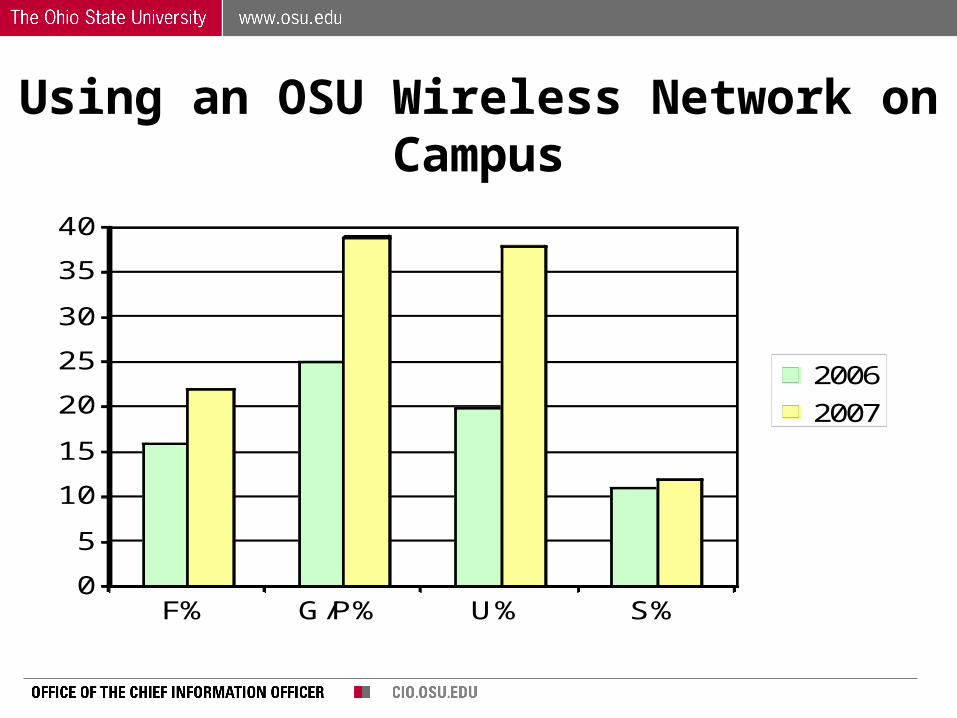
Using an OSU Wireless Network on Campus
0
5
10
15
20
25
30
35
40
F% G/P% U% S%
2006
2007

Aware of OSU/OIT System Status Page (monitoring E-mail, Carmen etc.)
0
10
20
30
40
50
60
70
F% G/P% U% S%
2006
2007

Experienced a virus on any computer
010203040506070
F% G/P% U% S%
2004 2005 2006 2007
2007 data• 15% Faculty• 29% G/P• 34% U• 22% Staff

Virus on personal vs. Ohio State computers
0
10
20
30
40
F G/P U S
Personal% OSU% Both personally-owned & OSU%
2007 data• Student data
shows that computer labs tend to almost free of viruses
• Faculty (3%) almost no viruses on Ohio State computers
• Staff reported slightly more viruses (6%)

Use of personal firewalls
0
10
20
30
40
50
60
70
80
F% G/P% U% S%
2005
2006
2007
2007 data• 64%
Faculty• 68% G/P• 72% U• 62% Staff

Use of PDA’s
0
10
20
30
40
50
F% G/P% U% S%
2005 2006 2007
Overall use of PDA’s
29% in 2005
25% in 2006
23% in 2007

Use of PDA’s with wireless
0
10
20
30
40
50
60
F% G/P% U% S%
2004 2005 2006 2007
Overall Use of PDA’s with wireless
24% in 2004
29% in 2005
32% in 2006
49% in 2007
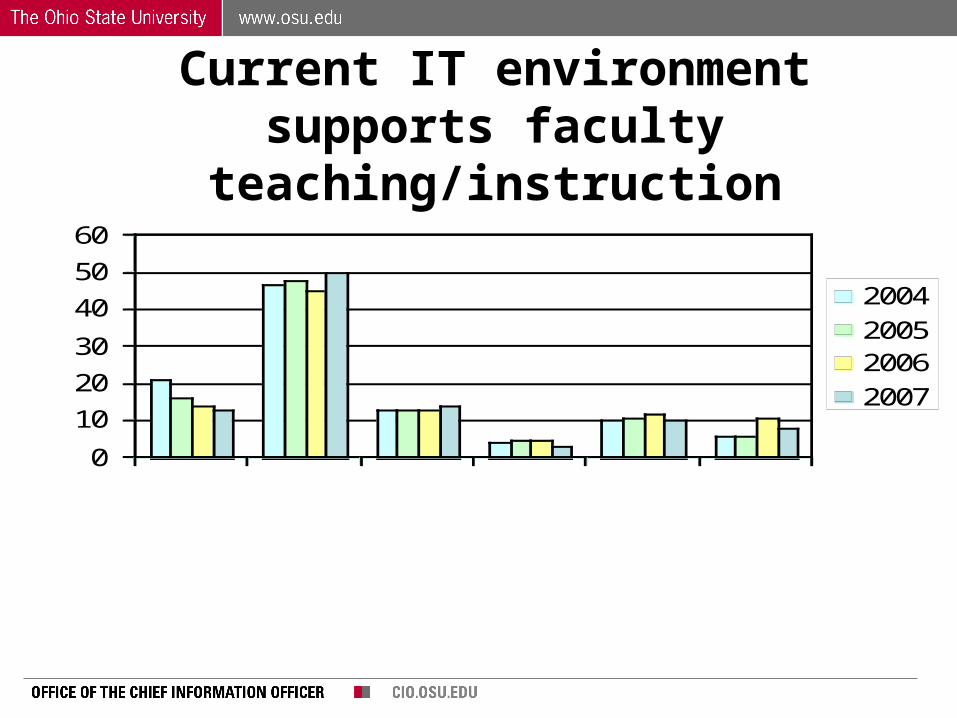
Current IT environment supports faculty teaching/instruction
0
10
20
30
40
50
60
%Very well%Somewhat
%Somewhat poorly
%Very poorly
%DK
%Not teaching
2004
20052006
2007

Current IT environment supports graduate/professional students in
teaching/instruction
0
10
20
30
40
50
60
Very wellSomewhat
Somewhat poorly
Very poorlyDon't KnowNot teaching
2004
2005
2006
2007

Ability to access Ohio State computing and electronic information from office/lab
05
101520253035404550
2005 F 2006 F 2007 F 2005 G/P 2006 G/P 2007 G/P 2007 S
Strongly Agree Agree Disagree Strongly Disagree Don't Know

Ability to access Ohio State computing and electronic information from home
0
10
20
30
40
50
60
2005F
2006F
2007F
2005G/P
2006G/P
2007G/P
2005U
2006U
2007U
2005S
2006S
2007S
Strongly Agree Agree Disagree Strongly Disagree Don't Know
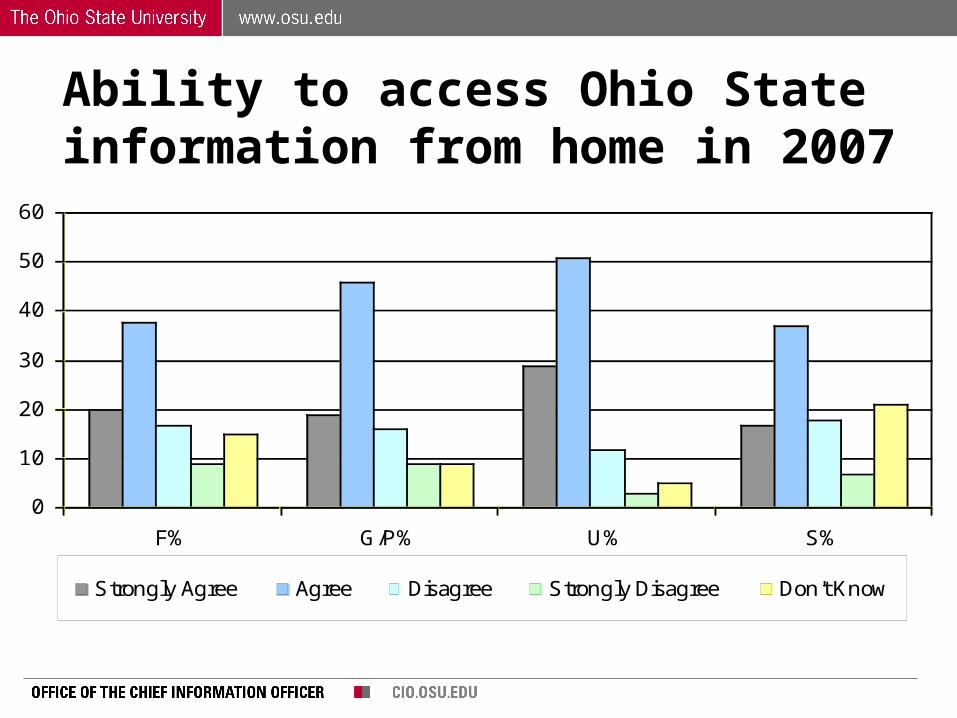
Ability to access Ohio State information from home in 2007
0
10
20
30
40
50
60
F% G/P% U% S%
Strongly Agree Agree Disagree Strongly Disagree Don't Know

Faculty - Ohio State IT helps increase my impact and productivity
010
2030
40
5060
2005 2006 2007
Strongly Agree Agree Disagree Strongly Disagree Don't know

Ability to use IT to contribute to professional development
0
10
20
30
40
50
60
70
2005 F2005 G/P
2005 S 2006 F2006 G/P
2006 S 2007 F2007G/P
2007 S
Strongly Agree Agree Disagree Strongly Disagree Don't Know
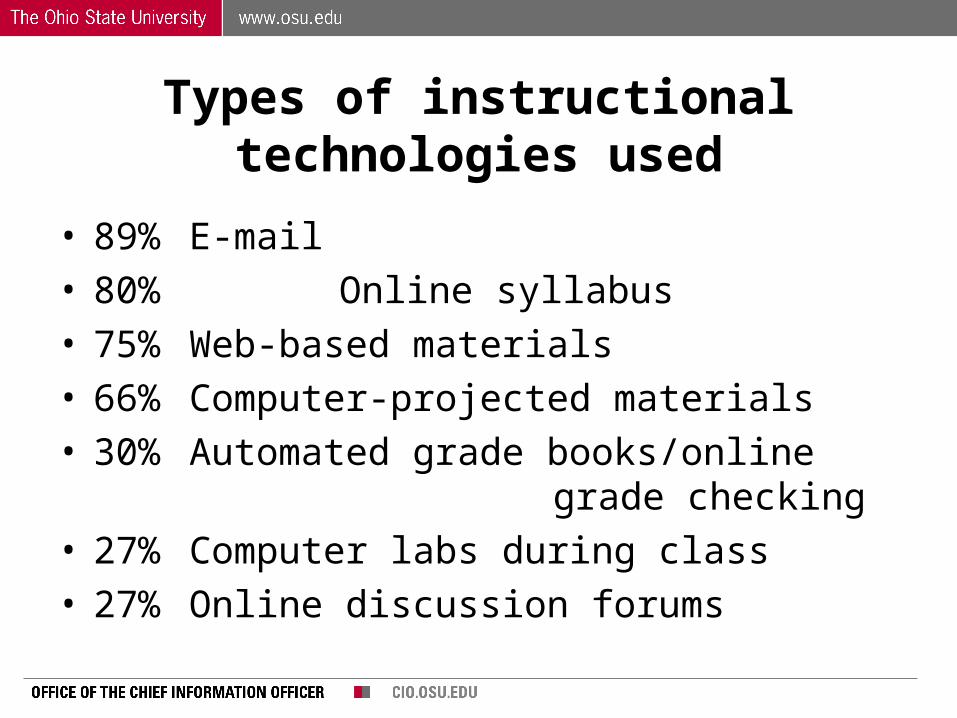
Types of instructional technologies used
• 89% E-mail• 80% Online syllabus• 75% Web-based materials• 66% Computer-projected materials• 30% Automated grade books/online
grade checking• 27% Computer labs during class• 27% Online discussion forums

Faculty - Ohio State’s IT is important to my student’s success
0102030405060
2005 2006 2007
Strongly Agree Agree Disagree
Strongly Disagree Don't Know

Incentives for faculty to use IT in instruction
0102030405060708090
Help Desk Rewards Access tohw/sw
IPOwnership
Ease of use
2002 2003 2004 2005 2006 2007

Faculty - Majors in my discipline should be required to demonstrate certain level of
knowledge of computer applications
0
10
20
30
40
50
2005 2006 2007
Strongly Agree Agree Disagree Strongly Disagree Don't know

Faculty using a university-supported CMS (either Carmen or WebCT)
0
10
20
30
40
50
60
70
Using CMSNot using CMS
Don't Know
Prefer Not to Answer No Response
2005
20062007
40%
53%
58% 60%
47%
32%
1%1%
8%

Reasons for faculty not using Carmen
0
5
10
15
20
25
Not teaching
No time for development
Don't KnowHow to Get StartedDoesn't Count Towards P & TDoesn't Suit Course Needs
Carmene Too DifficultUsing Course WebsiteDon't Know What It IsUsing Different CMS
Other
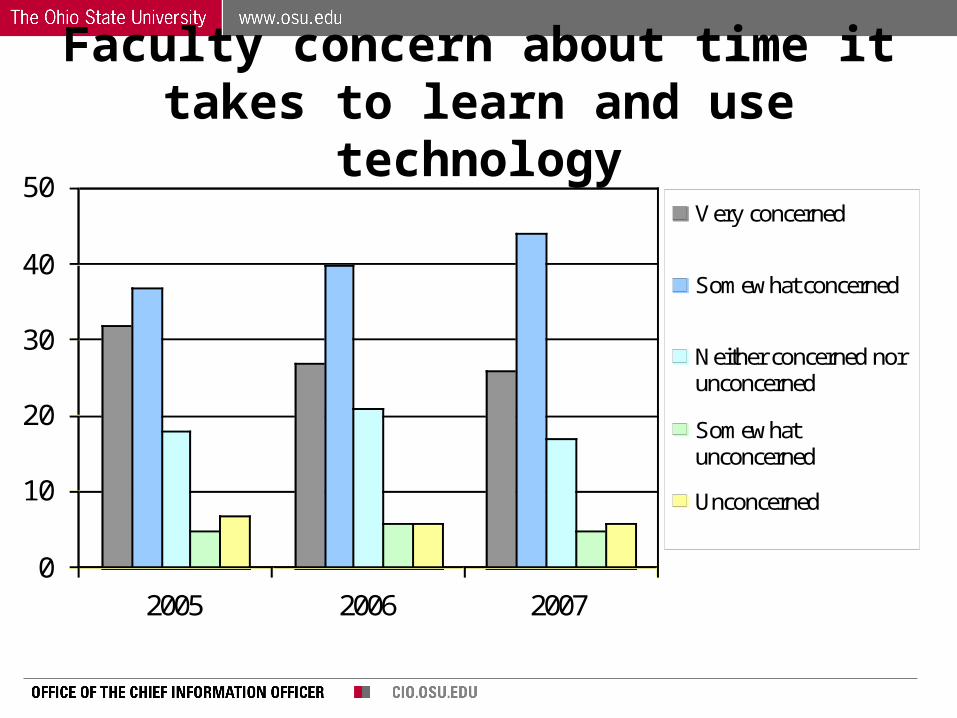
Faculty concern about time it takes to learn and use technology
0
10
20
30
40
50
2005 2006 2007
Very concerned
Somewhat concerned
Neither concerned norunconcerned
Somewhatunconcerned
Unconcerned

Faculty opinion about technical support needed to learn and use technology
05
101520253035404550
2005 2006 2007
Have everythingneeded
Have much ofwhat is neededLack a fewthings neededDo not havewhat is neededDon’t know/NoOpinion
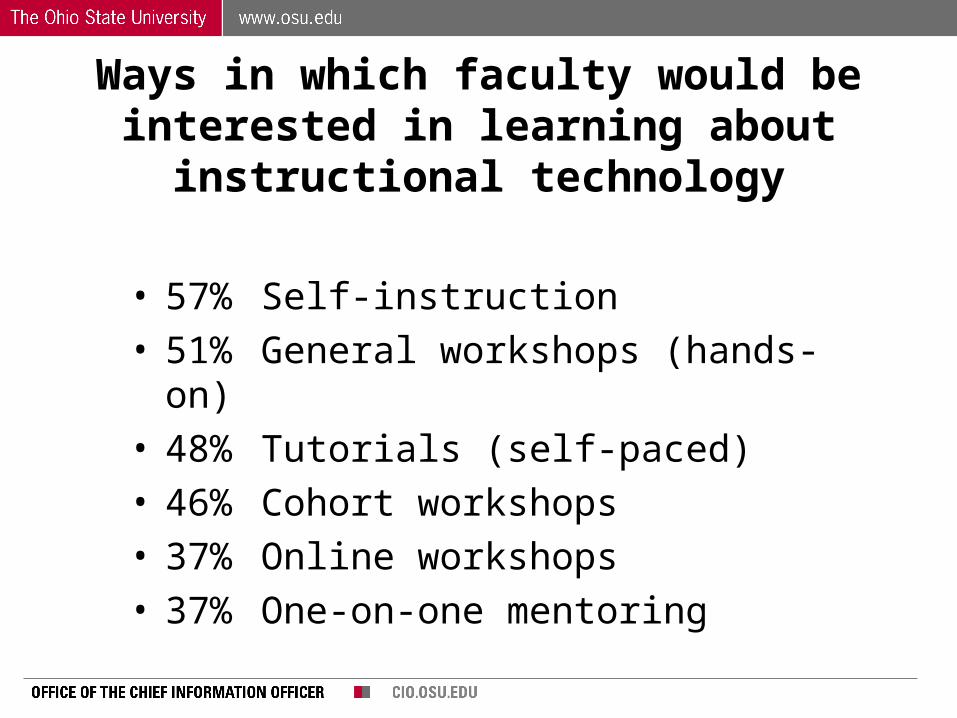
Ways in which faculty would be interested in learning about instructional technology
• 57% Self-instruction• 51% General workshops (hands-on)• 48% Tutorials (self-paced)• 46% Cohort workshops• 37% Online workshops• 37% One-on-one mentoring

Given adequate support, faculty interest in offering online/distance education courses
0
10
20
30
40
50
60
70
2003 2004 2005 2006 2007
%Yes %No %Don't Know Already offer fully online course

Undergraduate students on the role of IT in education
0102030405060708090
Very ImportantSomewhat important
NegligibleNo role
2004 2005 2006 2007

Graduate/professional students on the role of IT in education
010
2030
40
5060
7080
90
Very ImportantSomewhat important
Negligible No role
2004 2005 2006 2007

Undergraduate student belief that use of IT at Ohio State has helped make them more marketable to future
employers
05
101520253035404550
Strongly agree
AgreeDisagree
Strongly disagreeDon't Know
2005 2006 2007

Undergraduate student belief that use of IT at Ohio State has helped make them more likely to
succeed in academic work
0
10
20
30
40
50
60
70
Strongly agree
AgreeDisagree
Strongly disagreeDon't Know
2004 2005 2006 2007
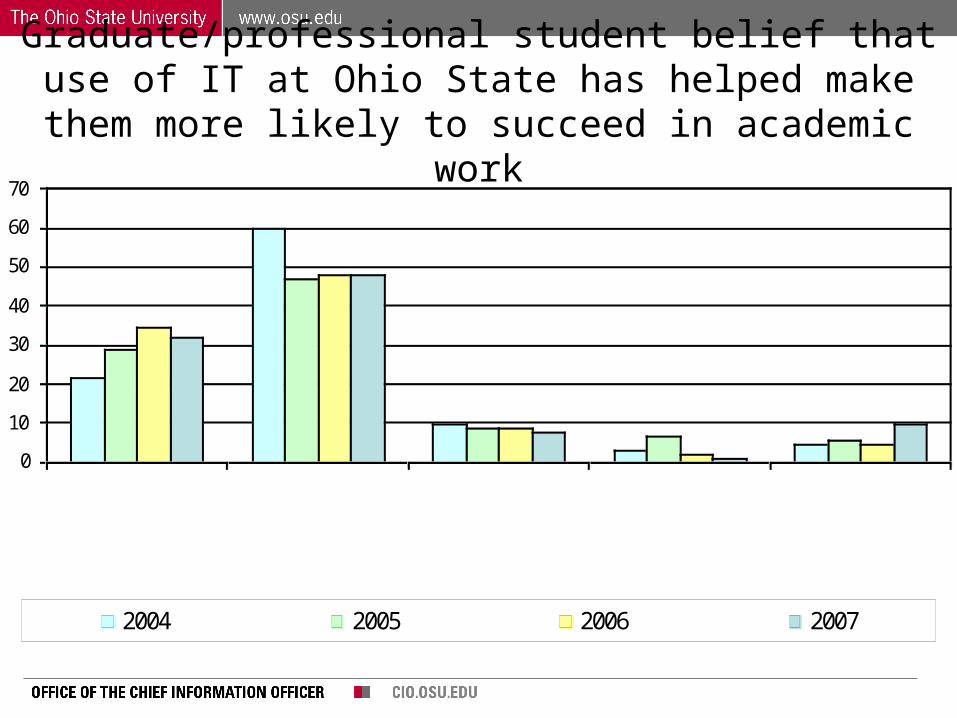
Graduate/professional student belief that use of IT at Ohio State has helped make them more likely to
succeed in academic work
0
10
20
30
40
50
60
70
Strongly agree
AgreeDisagree
Strongly disagreeDon't Know
2004 2005 2006 2007
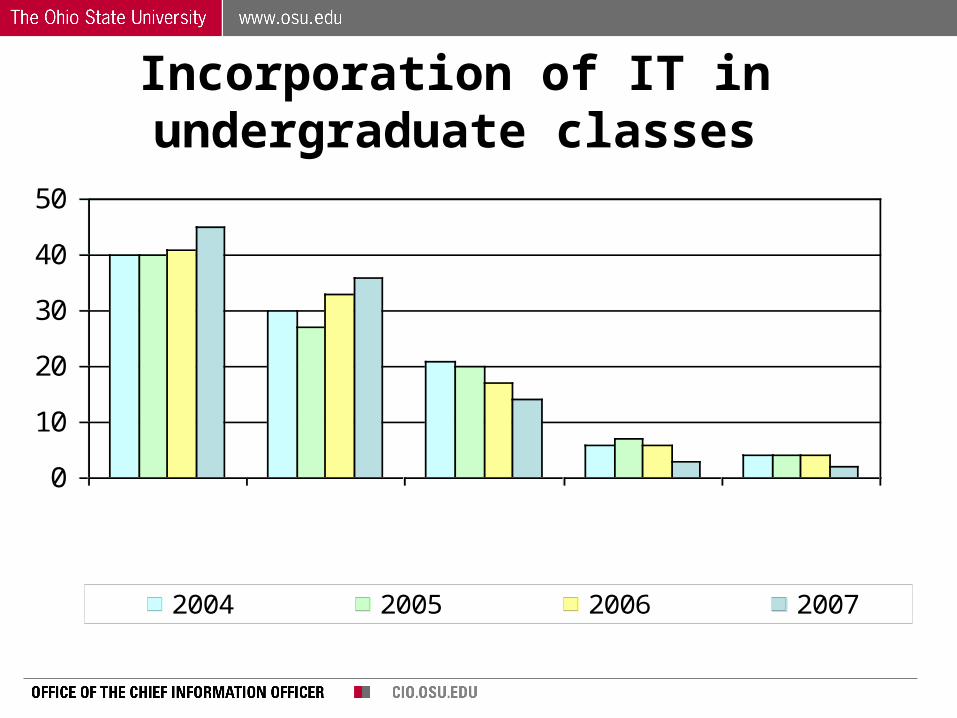
Incorporation of IT in undergraduate classes
0
10
20
30
40
50
%Nearly every%Several
%Few %Never%Didn’t take
2004 2005 2006 2007

Incorporation of IT in graduate/professional classes
0
10
20
30
40
50
60
%Nearly every %Several %Few %Never %Didn’t take
2004 2005 2006 2007

Undergraduate student preferences for method of instructional delivery
0102030405060708090
Partly online Instructor ledonly online
Fully online“self-paced”
Primarily face-to-face
2004 2005 2006 2007

Graduate/professional student preferences for method of instructional
delivery
0102030405060708090
Partly online Instructor ledonly online
Fully online“self-paced”
Primarily face-to-face
2004 2005 2006 2007

Faculty use of IT in class
0
10
20
30
40
50
60
2004 2005 2006 2007
%Every class %Several %A Few %Never % Do not teach

Ways campus community use OSU libraries
0102030405060708090
Ind. research/studyGrp. research/studyUse computers
Pick-up materialsConfer with librarian
Attend class/social functionMeet friends/colleagues
Do Not Use Library
Other
F G/P U S
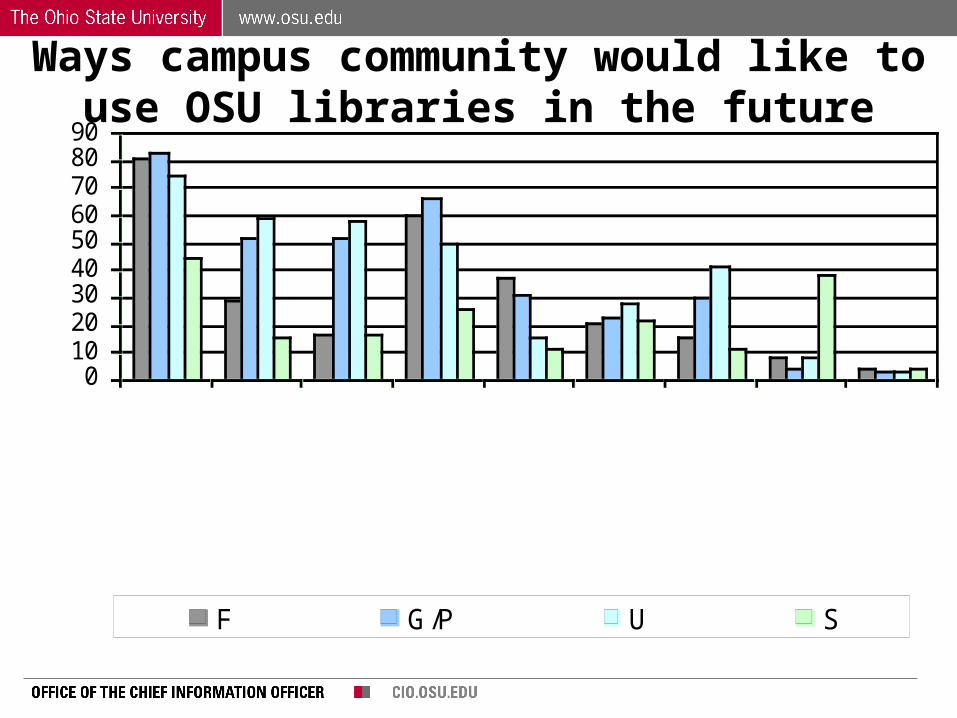
Ways campus community would like to use OSU libraries in the future
0102030405060708090
Ind. research/studyGrp. research/studyUse computers
Pick-up materialsConfer with librarian
Attend class/social functionMeet friends/colleagues
Do Not Plan to Use Library
Other
F G/P U S