2007 national healthcare disparities report (nhdr) progress is being made, but many of the biggest...
TRANSCRIPT

2007 National Healthcare 2007 National Healthcare Disparities Report (NHDR)Disparities Report (NHDR)
Progress is Progress is being made, but being made, but
many of the many of the biggest gaps biggest gaps
remainremain
Released March 3, 2008Released March 3, 2008

Health Care Quality Health Care Quality
Disparities in Disparities in health care health care quality are quality are staying the staying the same or same or increasing increasing
n=number of core measures

Access to Health CareAccess to Health Care
Disparities in Disparities in access to access to care are care are staying the staying the same or same or increasing increasing
n=number of core measures

NHDR FindingsNHDR Findings
Over 60% of disparities in quality of care Over 60% of disparities in quality of care have stayed the same or worsened for have stayed the same or worsened for Blacks, Asians, and poor populationsBlacks, Asians, and poor populations
Nearly 60% of disparities have stayed Nearly 60% of disparities have stayed the same or worsened for Hispanicsthe same or worsened for Hispanics
For Blacks, Asians, Hispanics, and poor For Blacks, Asians, Hispanics, and poor populations, disparities in about half the populations, disparities in about half the core measures of access to care are core measures of access to care are lesseninglessening

Core Measures That Showed Reduction Core Measures That Showed Reduction in Disparities, 2000-2001 to 2004-2005in Disparities, 2000-2001 to 2004-2005
GroupGroup MeasureMeasure
Relative rate for Relative rate for earliest year in earliest year in
NHDRNHDR
Relative rate for Relative rate for most recent year in most recent year in
NHDRNHDR
Black Black compared with compared with WhiteWhite
Hemodialysis patients with adequate Hemodialysis patients with adequate dialysis (urea reduction ratio 65% or dialysis (urea reduction ratio 65% or greater)greater) 1.291.29 1.081.08
New AIDS cases per 100,000 population New AIDS cases per 100,000 population age 13 and overage 13 and over 10.410.4 10.010.0
Children 19-35 months who received all Children 19-35 months who received all recommended vaccinesrecommended vaccines 1.311.31 1.141.14
Asian Asian compared with compared with WhiteWhite
Persons who have a usual primary care Persons who have a usual primary care providerprovider 1.401.40 1.131.13
Children 19-35 months who received all Children 19-35 months who received all recommended vaccinesrecommended vaccines 1.211.21 1.121.12
Tuberculosis patients who completed a Tuberculosis patients who completed a curative course of treatment within 12 curative course of treatment within 12 months of initiation of treatmentmonths of initiation of treatment 1.091.09 .97.97
AI/AN AI/AN compared with compared with WhiteWhite
High-risk short-stay nursing home High-risk short-stay nursing home residents who developed pressure soresresidents who developed pressure sores 1.151.15 1.061.06
High-risk long-stay nursing home High-risk long-stay nursing home residents who developed pressure soresresidents who developed pressure sores 1.171.17 1.071.07

Core Measures That Showed Reduction Core Measures That Showed Reduction in Disparities, 2000-2001 to 2004-2005in Disparities, 2000-2001 to 2004-2005
GroupGroup MeasureMeasure
Relative rate for Relative rate for earliest year in earliest year in
NHDRNHDR
Relative rate for Relative rate for most recent year in most recent year in
NHDRNHDR
Hispanic Hispanic compared with compared with Non-Hispanic Non-Hispanic WhiteWhite
Adult perforated appendix per 1,000 Adult perforated appendix per 1,000 admissions with appendicitisadmissions with appendicitis 1.061.06 1.011.01
Adults who can sometimes or never get Adults who can sometimes or never get care for illness or injury as soon as care for illness or injury as soon as wantedwanted 2.002.00 1.621.62
Children 19-35 months who received all Children 19-35 months who received all recommended vaccinesrecommended vaccines 1.281.28 1.181.18
New AIDS cases per 100,000 population New AIDS cases per 100,000 population age 13 and overage 13 and over 3.643.64 3.523.52
Pregnant women receiving prenatal care Pregnant women receiving prenatal care in first trimesterin first trimester 2.122.12 2.032.03
Poor Poor compared with compared with High incomeHigh income
Adult perforated appendix per 1,000 Adult perforated appendix per 1,000 admissions with appendicitisadmissions with appendicitis 3.473.47 1.101.10
Persons under age 65 with health Persons under age 65 with health insuranceinsurance 6.156.15 4.864.86

Three Largest Disparities in Health Care Three Largest Disparities in Health Care Quality for Selected Groups: Quality for Selected Groups:
2005 Versus 2007 NHDR2005 Versus 2007 NHDR
2005 NHDR2005 NHDR 2007 NHDR2007 NHDR
GroupGroup MeasureMeasureRelative Relative
raterate MeasureMeasureRelative Relative
raterate
BlackBlack
New AIDS cases per 100,000 population New AIDS cases per 100,000 population age 13 and overage 13 and over
10.410.4 New AIDS cases per 100,000 New AIDS cases per 100,000 population age 13 and overpopulation age 13 and over
10.010.0
Hospital admissions for pediatric asthma Hospital admissions for pediatric asthma per 100,000 population ages 2-17per 100,000 population ages 2-17
4.04.0 Hospital admissions for pediatric Hospital admissions for pediatric asthma per 100,000 population asthma per 100,000 population ages 2-17 ages 2-17
3.83.8
Percent of patients who left the Percent of patients who left the emergency department without being emergency department without being seenseen
1.91.9 Hospital admissions for lower Hospital admissions for lower extremity amputations in patients extremity amputations in patients with diabetes per 100,000 with diabetes per 100,000 population population
3.83.8
AsianAsian
Persons age 18 or older with serious Persons age 18 or older with serious mental illness who did not receive mental illness who did not receive mental health treatment or counseling in mental health treatment or counseling in the past yearthe past year
1.61.6 Composite: Adults who reported Composite: Adults who reported poor communication with health poor communication with health providersproviders
1.61.6
Adults who can sometimes or never get Adults who can sometimes or never get care for illness or injury as soon as care for illness or injury as soon as wantedwanted
1.61.6 Long-stay nursing home Long-stay nursing home residents who were physically residents who were physically restrainedrestrained
1.51.5
Adults age 65 and over whoAdults age 65 and over who did not ever did not ever receive pneumococcal vaccinationreceive pneumococcal vaccination
1.51.5 Adults age 65 and over whoAdults age 65 and over who did did not ever receive pneumococcal not ever receive pneumococcal vaccinationvaccination
1.51.5

Three Largest Disparities in Health Care Three Largest Disparities in Health Care Quality for Selected Groups: Quality for Selected Groups:
2005 Versus 2007 NHDR2005 Versus 2007 NHDR
2005 NHDR2005 NHDR 2007 NHDR2007 NHDR
GroupGroup MeasureMeasureRelative Relative
raterate MeasureMeasureRelative Relative
raterate
AI/ANsAI/ANs Women not receiving prenatal care Women not receiving prenatal care in the first trimesterin the first trimester
2.12.1 Women not receiving prenatal Women not receiving prenatal care in the first trimester care in the first trimester
2.12.1
Composite: Adults who reported Composite: Adults who reported poor communication with health poor communication with health providersproviders
1.81.8 Composite: Adults who Composite: Adults who reported poor communication reported poor communication with health providerswith health providers
1.81.8
Children ages 2-17 with no advice Children ages 2-17 with no advice about physical activityabout physical activity
1.31.3 Women age 40 and over who Women age 40 and over who reported they did not have a reported they did not have a mammogram within the past 2 mammogram within the past 2 yearsyears
1.81.8
HispanicHispanic New AIDS cases per 100,000 New AIDS cases per 100,000 population age 13 and overpopulation age 13 and over
3.73.7 New AIDS cases per 100,000 New AIDS cases per 100,000 population age 13 and over population age 13 and over
3.53.5
Adults who can sometimes or never Adults who can sometimes or never get care for illness or injury as soon get care for illness or injury as soon as wantedas wanted
2.02.0 Hospital admissions for lower Hospital admissions for lower extremity amputations in extremity amputations in patients with diabetes per patients with diabetes per 100,000 population 100,000 population
2.92.9
Composite: Children whose parents Composite: Children whose parents reported poor communication with reported poor communication with their health providerstheir health providers
1.81.8 Women not receiving prenatal Women not receiving prenatal care in the first trimestercare in the first trimester
2.02.0

Three Largest Disparities in Health Care Three Largest Disparities in Health Care Quality for Selected Groups: Quality for Selected Groups:
2005 Versus 2007 NHDR2005 Versus 2007 NHDR
2005 NHDR2005 NHDR 2007 NHDR2007 NHDR
GroupGroup MeasureMeasureRelative Relative
raterate MeasureMeasureRelative Relative
raterate
PoorPoor Composite: Children whose Composite: Children whose parents reported poor parents reported poor communication with their communication with their health providershealth providers
3.33.3 Composite: Children whose Composite: Children whose parents reported poor parents reported poor communication with their communication with their health providershealth providers
3.03.0
Adults who can sometimes or Adults who can sometimes or never get care for illness or never get care for illness or injury as soon as wantedinjury as soon as wanted
2.32.3 Adults who can sometimes or Adults who can sometimes or never get care for illness or never get care for illness or injury as soon as wantedinjury as soon as wanted
2.42.4
Children ages 2-17 who did not Children ages 2-17 who did not have a dental visithave a dental visit
2.02.0 Women age 40 and over who Women age 40 and over who reported they did not have a reported they did not have a mammogram within the past mammogram within the past 2 years2 years
2.12.1

Uninsurance Is a Major Barrier Uninsurance Is a Major Barrier To Reducing DisparitiesTo Reducing Disparities
Uninsured Uninsured individuals do individuals do worse than worse than privately insured privately insured individuals on individuals on almost 90% of almost 90% of quality measures quality measures and on all access and on all access measuresmeasures
CRM=core report measures
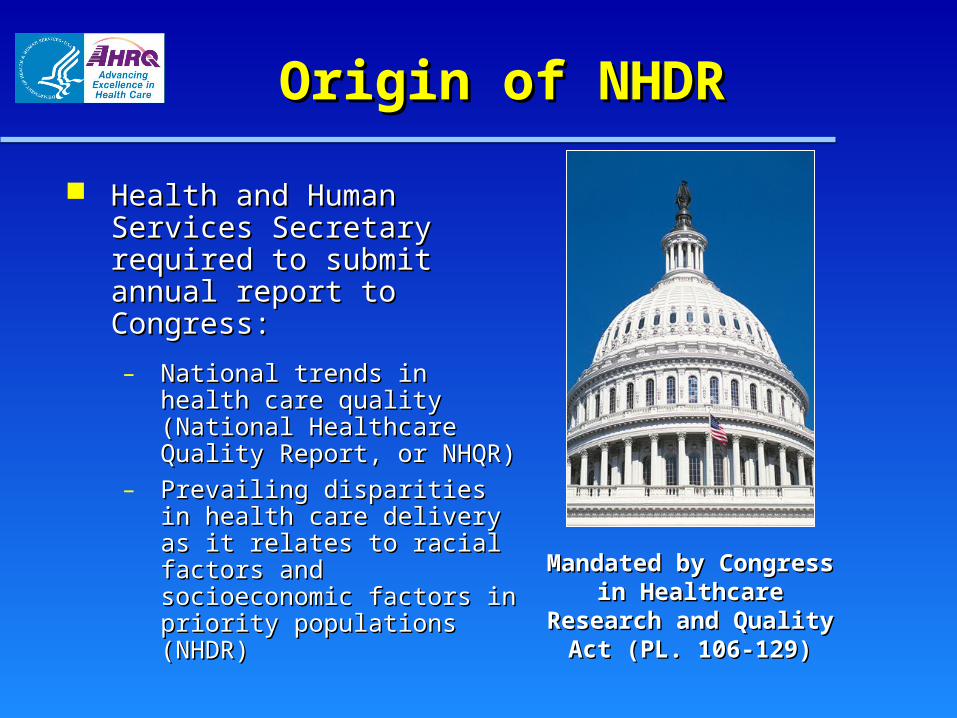
Origin of NHDROrigin of NHDR
Health and Human Services Health and Human Services Secretary required to submit Secretary required to submit annual report to Congress:annual report to Congress:
– National trends in health care National trends in health care quality (National Healthcare quality (National Healthcare Quality Report, or NHQR)Quality Report, or NHQR)
– Prevailing disparities in Prevailing disparities in health care delivery as it health care delivery as it relates to racial factors and relates to racial factors and socioeconomic factors in socioeconomic factors in priority populations (NHDR)priority populations (NHDR)
Mandated by Congress in Mandated by Congress in Healthcare Research and Healthcare Research and Quality Act (PL. 106-129)Quality Act (PL. 106-129)

NHQR and NHDR GoalsNHQR and NHDR Goals
Provide a snapshot of health care deliveryProvide a snapshot of health care delivery
– 41 core measures of quality and access41 core measures of quality and access
– 211 total measures211 total measures
Indicate the biggest gaps in careIndicate the biggest gaps in care
Show national and State trendsShow national and State trends
Tell us how we can reach our goals Tell us how we can reach our goals
Help align measures across public and private Help align measures across public and private quality initiativesquality initiatives

NHQR and NHDR FrameworkNHQR and NHDR Framework
Consumer Consumer Perspectives on Perspectives on
Health Care NeedsHealth Care Needs Components of Health Care QualityComponents of Health Care Quality
SafetySafety EffectivenessEffectivenessPatient Patient
CenterednessCenteredness TimelinessTimeliness
Staying healthyStaying healthy
Getting betterGetting better
Living with illness or Living with illness or disabilitydisability
Coping with end-of-Coping with end-of-life matterslife matters
Source:Source: Institute of Medicine Committee. “Envisioning the National Health Care Quality Institute of Medicine Committee. “Envisioning the National Health Care Quality Report,” 2001Report,” 2001

Relationship Between Relationship Between NHDR and NHQRNHDR and NHQR
NHDRNHDR NHQRNHQRSnapshot of disparities in Snapshot of disparities in health care in America health care in America
Snapshot of quality of Snapshot of quality of health care in Americahealth care in America
Quality + accessQuality + access Quality Quality
Safety, effectiveness, Safety, effectiveness, timeliness, patient timeliness, patient centeredness + equitycenteredness + equity
Safety, effectiveness, Safety, effectiveness, timeliness, patient timeliness, patient centerednesscenteredness
Variation across Variation across populationspopulations
Variation across StatesVariation across States

NHQR/NHDR Content and NHQR/NHDR Content and OrganizationOrganization
Effectiveness Effectiveness – Cancer Cancer – Diabetes Diabetes – End Stage Renal Disease (ESRD) End Stage Renal Disease (ESRD) – Heart Disease Heart Disease – HIV and AIDS HIV and AIDS – Maternal and Child Health Maternal and Child Health – Mental Health and Substance AbuseMental Health and Substance Abuse– Nursing Home, Home Health, Nursing Home, Home Health,
and Hospice Care and Hospice Care Patient SafetyPatient Safety Timeliness Timeliness Patient Centeredness Patient Centeredness Access to Health Care Access to Health Care Priority PopulationsPriority Populations
*Also includes a chapter on Efficiency*Also includes a chapter on Efficiency
NHQR*NHDR

New in the 2007 NHDRNew in the 2007 NHDR
Chapter 2, Patient Centeredness: Diversity of the Chapter 2, Patient Centeredness: Diversity of the Registered Nurse WorkforceRegistered Nurse Workforce
Chapter 2, Patient Centeredness: Focus on Health Chapter 2, Patient Centeredness: Focus on Health LiteracyLiteracy
Chapter 4, Priority Populations: Supplemental data for Chapter 4, Priority Populations: Supplemental data for Asians and Hispanics from the California Health Asians and Hispanics from the California Health Interview Survey (CHIS)Interview Survey (CHIS)
Chapter 4, Priority Populations: People With Chapter 4, Priority Populations: People With Disabilities and Special Health Care Needs, Adults Disabilities and Special Health Care Needs, Adults With DisabilitiesWith Disabilities

For more information…For more information…
NHQR and NHDR Web Page NHQR and NHDR Web Page http://www.ahrq.gov/qual/qrdr07.htmhttp://www.ahrq.gov/qual/qrdr07.htm
NHDRnet for data tables and queriesNHDRnet for data tables and queries
http://http://nhdrnet.ahrq.gov/nhdr/jsp/nhdr.jspnhdrnet.ahrq.gov/nhdr/jsp/nhdr.jsp
Request a copy (AHRQ publication no. 08-0041) Request a copy (AHRQ publication no. 08-0041) from AHRQ Publications Clearinghouse from AHRQ Publications Clearinghouse
1-800-358-9295 or 1-800-358-9295 or [email protected]@ahrq.hhs.gov