2007 intercontinentalexchange annual report -...
TRANSCRIPT

2007 IntercontinentalExchange Annual Report
open


UNITED STATES SECURITIES AND EXCHANGE COMMISSIONWashington, D.C. 20549
Form 10-K(Mark One)
¥ ANNUAL REPORT PURSUANT TO SECTION 13 OR 15(d)OF THE SECURITIES EXCHANGE ACT OF 1934For the fiscal year ended December 31, 2007
Orn TRANSITION REPORT PURSUANT TO SECTION 13 OR 15(d)
OF THE SECURITIES EXCHANGE ACT OF 1934For the transition period from to
Commission File Number 001-32671
INTERCONTINENTALEXCHANGE, INC.(Exact name of registrant as specified in its charter)
Delaware(State or other jurisdiction ofincorporation or organization)
58-2555670(IRS Employer
Identification Number)
2100 RiverEdge Parkway,Suite 500, Atlanta,
Georgia(Address of principal executive offices)
30328(Zip Code)
(770) 857-4700Registrant’s telephone number, including area code
Securities registered pursuant to Section 12(b) of the Act:Title of Each Class Name of Each Exchange on Which Registered
Common Stock, $0.01 par value per share New York Stock ExchangeSecurities registered pursuant to Section 12(g) of the Act:
None
Indicate by check mark if the registrant is a well-known seasoned issuer, as defined in Rule 405 of the SecuritiesAct. Yes ¥ No n
Indicate by check mark if the registrant is not required to file reports pursuant to Section 13 or Section 15(d) of theAct. Yes n No ¥
Indicate by check mark whether the registrant: (1) has filed all reports required to be filed by Section 13 or 15(d) of the Actduring the preceding 12 months (or for such shorter period that the registrant was required to file such reports), and (2) has beensubject to such filing requirements for the past 90 days. Yes ¥ No n
Indicate by check mark if disclosure of delinquent filers pursuant to Item 405 of Regulation S-K is not contained herein, andwill not be contained, to the best of the registrant’s knowledge, in definitive proxy or information statements incorporated byreference in Part III of this Annual Report on Form 10-K or any amendment to this Form 10-K. ¥
Indicate by check mark whether the registrant is a large accelerated filer, an accelerated filer, a non-accelerated filer, or asmaller reporting company. See the definitions of “large accelerated filer,” “accelerated filer” and “smaller reporting company” inRule 12b-2 of the Exchange Act. (Check one):Large accelerated filer ¥ Accelerated filer n Non-accelerated filer n
(Do not check if a smaller reporting company)Smaller reporting company n
Indicate by check mark whether the registrant is a shell company (as defined in Rule 12b-2 of the ExchangeAct). Yes n No ¥
The aggregate market value of the registrant’s voting and non-voting common equity held by non-affiliates computed byreference to the price at which the common equity was last sold as of the last business day of the registrant’s most recentlycompleted second fiscal quarter was $9,811,206,389. As of February 11, 2008, the number of shares of the registrant’s CommonStock outstanding was 70,135,975 shares.
DOCUMENTS INCORPORATED BY REFERENCECertain information contained in the registrant’s Proxy Statement for the 2008 Annual Meeting of Stockholders is incorporated
herein by reference in Part III of this Annual Report on Form 10-K. The Proxy Statement will be filed with the Securities andExchange Commission within 120 days after the end of the registrant’s fiscal year to which this report relates.

INTERCONTINENTALEXCHANGE, INC.
ANNUAL REPORT ON FORM 10-KFor the Fiscal Year Ended December 31, 2007
TABLE OF CONTENTS
ItemNumber
PageNumber
PART I1. Business . . . . . . . . . . . . . . . . . . . . . . . . . . . . . . . . . . . . . . . . . . . . . . . . . . . . . . . . . . . . . . 2
1(A). Risk Factors . . . . . . . . . . . . . . . . . . . . . . . . . . . . . . . . . . . . . . . . . . . . . . . . . . . . . . . . . . . . 37
1(B). Unresolved Staff Comments . . . . . . . . . . . . . . . . . . . . . . . . . . . . . . . . . . . . . . . . . . . . . . . . 53
2. Properties. . . . . . . . . . . . . . . . . . . . . . . . . . . . . . . . . . . . . . . . . . . . . . . . . . . . . . . . . . . . . . 53
3. Legal Proceedings . . . . . . . . . . . . . . . . . . . . . . . . . . . . . . . . . . . . . . . . . . . . . . . . . . . . . . . 54
4. Submission of Matters to a Vote of Security Holders . . . . . . . . . . . . . . . . . . . . . . . . . . . . . . 55
4(A). Executive Officers of IntercontinentalExchange, Inc. . . . . . . . . . . . . . . . . . . . . . . . . . . . . . 56
PART II5. Market for Registrant’s Common Equity, Related Stockholder Matters and Issuer Purchases
of Equity Securities . . . . . . . . . . . . . . . . . . . . . . . . . . . . . . . . . . . . . . . . . . . . . . . . . . . . . . 57
6. Selected Financial Data . . . . . . . . . . . . . . . . . . . . . . . . . . . . . . . . . . . . . . . . . . . . . . . . . . . 59
7. Management’s Discussion and Analysis of Financial Condition and Results of Operations . . 64
7(A). Quantitative and Qualitative Disclosures about Market Risk. . . . . . . . . . . . . . . . . . . . . . . . . 95
8. Financial Statements and Supplementary Data . . . . . . . . . . . . . . . . . . . . . . . . . . . . . . . . . . . 97
9. Changes in and Disagreements with Accountants on Accounting and Financial Disclosure . . 148
9(A). Controls and Procedures . . . . . . . . . . . . . . . . . . . . . . . . . . . . . . . . . . . . . . . . . . . . . . . . . . . 148
9(B). Other Information . . . . . . . . . . . . . . . . . . . . . . . . . . . . . . . . . . . . . . . . . . . . . . . . . . . . . . . 148
PART III10. Directors, Executive Officers and Corporate Governance . . . . . . . . . . . . . . . . . . . . . . . . . . . 148
11. Executive Compensation. . . . . . . . . . . . . . . . . . . . . . . . . . . . . . . . . . . . . . . . . . . . . . . . . . . 149
12. Security Ownership of Certain Beneficial Owners and Management and RelatedStockholder Matters . . . . . . . . . . . . . . . . . . . . . . . . . . . . . . . . . . . . . . . . . . . . . . . . . . . . . . 149
13. Certain Relationships and Related Transactions, and Director Independence . . . . . . . . . . . . . 149
14. Principal Accountant Fees and Services . . . . . . . . . . . . . . . . . . . . . . . . . . . . . . . . . . . . . . . 149
PART IV15. Exhibits, Financial Statement Schedules . . . . . . . . . . . . . . . . . . . . . . . . . . . . . . . . . . . . . . . 149
SIGNATURES . . . . . . . . . . . . . . . . . . . . . . . . . . . . . . . . . . . . . . . . . . . . . . . . . . . . . . . . . . . . . . . . . 151
FINANCIAL STATEMENT SCHEDULE . . . . . . . . . . . . . . . . . . . . . . . . . . . . . . . . . . . . . . . . . . . . . 153
INDEX TO EXHIBITS . . . . . . . . . . . . . . . . . . . . . . . . . . . . . . . . . . . . . . . . . . . . . . . . . . . . . . . . . . 154
i

PART I
In this Annual Report on Form 10-K, unless otherwise specified or the context otherwise requires:
• “IntercontinentalExchange”, “we”, “us”, “our”, “our company” and “our business” refer toIntercontinentalExchange, Inc. and its consolidated subsidiaries.
• “ICE Futures Europe” refers to our wholly-owned subsidiary, which, prior to September 3, 2007,operated as ICE Futures and which, prior to October 25, 2005, operated as the International PetroleumExchange, or the IPE.
• “ICE Futures U.S.” refers to our wholly-owned subsidiary that we acquired on January 12, 2007, andwhich prior to our acquisition, operated as the Board of Trade of the City of New York, Inc., or NYBOT,a member-owned not-for-profit corporation, and after our acquisition, operated as the Board of Trade ofthe City of New York, Inc., or NYBOT, a wholly-owned subsidiary of IntercontinentalExchange. OnSeptember 3, 2007, we renamed NYBOT “ICE Futures U.S.”. “ICE Clear U.S.” refers to ICE FuturesU.S.’s wholly-owned clearing subsidiary which previously operated as the New York Clearing Corpora-tion, or NYCC.
• “ICE Futures Canada” refers to our wholly-owned subsidiary that we acquired on August 27, 2007 andwhich previously operated as the Winnipeg Commodity Exchange, Inc, or the WCE. “ICE ClearCanada”, refers to ICE Futures Canada’s wholly-owned clearing subsidiary which previously operatedas WCE Clearing Corporation, or WCECC.
Due to rounding, figures in tables may not sum exactly.
Forward-Looking Statements
This Annual Report on Form 10-K, including the sections entitled “Business”, “Legal Proceedings” and“Management’s Discussion and Analysis of Financial Condition and Results of Operations”, contains forward-looking statements that are based on our present beliefs and assumptions and on information currently available tous. You can identify forward-looking statements by terminology such as “may,” “will,” “should,” “could,” “would,”“targets,” “goal,” “expect,” “intend,” “plan,” “anticipate,” “believe,” “estimate,” “predict,” “potential,” “continue,” orthe negative of these terms or other comparable terminology. These statements relate to future events or our futurefinancial performance and involve known and unknown risks, uncertainties and other factors that may cause ouractual results, levels of activity, performance or achievements to differ materially from those expressed or impliedby these forward-looking statements. These risks and other factors include those set forth in Item 1(A) under thecaption “Risk Factors” and elsewhere in this Annual Report on Form 10-K and other filings with the Securities andExchange Commission, or SEC. Although we believe that the expectations reflected in the forward-lookingstatements are reasonable, we cannot guarantee future results, levels of activity, performance or achievements. Wecaution you not to place undue reliance on these forward-looking statements. Forward-looking statements and otherfactors that may affect our performance include, but are not limited to:
• our expectations regarding the business environment in which we operate and trends in our industry,including increasing competition;
• our initiative to establish a European clearing house to clear our energy futures and cleared OTCbusiness and our ability to commence operations and transition positions from a third party;
• our ability to keep pace with rapid technological developments;
• the accuracy of our cost estimates and expectations;
• our belief that cash flows will be sufficient to fund our working capital needs and capital expenditures,at least through the end of 2009;
• our ability, on a timely and cost-effective basis, to increase the connectivity to our marketplace, expandour market data business, develop new products and services, and pursue select strategic acquisitionsand alliances, all on a timely, cost-effective basis;
1
• our ability to maintain existing market participants and attract new ones;
• our ability to protect our intellectual property rights, including the costs associated with such protection,and our ability to operate our business without violating the intellectual property rights of others;
• the impact of any changes in domestic and foreign regulations or government policy, including anychanges or reviews of previously issued regulations and policies;
• potential adverse litigation results; and
• our belief in our electronic platform and disaster recovery system technologies, as well as our ability togain access on a timely basis to comparable products and services if our key technology contracts wereterminated.
Any forward-looking statement speaks only as of the date on which such statement is made, and weundertake no obligation to update any forward-looking statement or statements to reflect events or circum-stances after the date on which such statement is made or to reflect the occurrence of an unanticipated event.New factors emerge from time to time, and it is not possible for management to predict all factors that mayaffect our business and prospects. Further, management cannot assess the impact of each factor on the businessor the extent to which any factor, or combination of factors, may cause actual results to differ materially fromthose contained in any forward-looking statements.
The following discussion should be read in conjunction with our audited consolidated financial statementsincluded in this Annual Report on Form 10-K.
ITEM 1. BUSINESS
General
We are a leading operator of regulated futures exchanges as well as global over-the-counter, or OTC,markets. Currently, we are the only marketplace to offer an integrated electronic platform for side-by-sidetrading of energy products in futures and both cleared and bilateral OTC markets. Through our widely-distributed electronic trading platform, our marketplace brings together buyers and sellers of derivative andphysical commodities and financial contracts and allows our participants to optimize their trading, riskmanagement and hedging operations. We conduct our OTC business directly through IntercontinentalExchangeas an Exempt Commercial Market under the Commodity Exchange Act, or CEA. We conduct our regulatedU.K. futures markets through our wholly-owned subsidiary, ICE Futures Europe. ICE Futures Europe is thelargest energy futures exchange outside of North America, as measured by 2007 traded contract volume, andone of the top 10 commodity exchanges in the world, according to the Futures Industry Association. Weconduct our regulated U.S. futures markets through our wholly-owned subsidiary, ICE Futures U.S. Weconduct our regulated Canadian futures markets through our wholly-owned subsidiary, ICE Futures Canada.We completed our acquisition of ICE Futures U.S. on January 12, 2007 and our acquisition of ICE FuturesCanada on August 27, 2007.
ICE Futures U.S. has a wholly-owned clearing house subsidiary, ICE Clear U.S. ICE Futures Canada hasa wholly-owned clearing house subsidiary, ICE Clear Canada. Our clearing houses are designed to ensure thesafety and soundness of our markets. Our clearing houses serve as a counterparty to every trade — becomingthe buyer to each seller of a futures contract and the seller to each buyer. This process substantially reducescredit risk to our customers.
Our Business
We operate diverse markets that are globally accessible, promote price transparency and offer participantsthe opportunity to trade a variety of energy, soft agricultural and agricultural commodities and financialproducts. Our core products include contracts based on crude and refined oil products, natural gas and power,and emissions, as well as sugar, cotton, coffee, cocoa, canola and orange juice along with foreign exchangeand index products. Our derivative and physical products provide participants with a means for managing risksassociated with changes in the prices of these commodities, asset allocation, ensuring physical delivery of
2

select commodity products, speculation and arbitrage. The majority of our trading volume is financially, orcash settled, meaning that settlement is made through cash payments based on the difference between thepurchase price of the contract and the value of the underlying commodity at contract expiration, rather thanthrough physical delivery of the commodity itself. We offer futures, options and swaps, which are based onunderlying commodity products, and are listed primarily on our electronic trading platform. We also offeropen-outcry trading and privately negotiated transactions for certain products.
Trading in futures, options on futures, and OTC products offers a way to protect against — and potentiallyprofit from — price changes in financial instruments and physical commodities. Futures contracts are standard-ized agreements to buy or sell a commodity or financial product at a specified price in the future. The buyerand seller of a futures contract agree on a price today for a product to be delivered or settled and paid for inthe future. Each contract specifies the quantity of the product and the time of delivery or payment. An optionon a futures contract is the right, but not the obligation, to buy or sell a futures contract at a specified price onor before a certain expiration date. In the OTC markets, swap contracts are the primary instrument used toreduce or gain exposure to price movements related to a commodity or financial product. Swap contracts aretypically less standardized than futures contracts, and are typically financially settled against either a futurescontract price or an index price in order to hedge against or gain exposure to commodity price fluctuations.Our customer base includes professional traders, financial institutions, institutional and individual investors,corporations, manufacturers, commodity producers and refiners, and governmental bodies.
All futures and options contracts are cleared through a central clearing house. In contrast, we also offerOTC swap contracts that can be traded on a bilateral basis and certain OTC contracts that can be traded on acleared basis. Bilateral contracts are settled between counterparties, while cleared contracts are novated to aclearing house, where they are marked to market and margined daily before final settlement at expiration. Wedo not take proprietary trading positions in any contracts in our markets.
We operate our European, Canadian and OTC markets exclusively on our electronic platform, and wecurrently offer ICE Futures U.S.’s markets on both our electronic platform and through an open-outcry tradingfloor based in New York City. In December 2007, we announced our intention to end open-outcry trading forfutures contracts at ICE Futures U.S. at the end of February 2008, although we will continue to offer open-outcry trading for all options on futures contracts at ICE Futures U.S. We believe that electronic trading offerssubstantial benefits to market participants. In contrast to alternate means of trade execution, market participantsexecuting trades electronically on our platform are able to achieve improved trade execution and costefficiencies through firm posted prices and greater speed and market transparency, reduced trading errors andreduced need for market intermediaries. In addition to trade execution, our electronic platform offers acomprehensive suite of trading-related services, including electronic trade confirmation and access to clearingservices. Through our electronic platform, we facilitate straight-through processing of trades, with the goal ofproviding seamless integration of front-, back- and mid-office trading and risk management activities.
We operate and manage our business on the basis of three segments: our futures business segment, ourOTC business segment and our market data business segment. For a discussion of these segments and relatedfinancial disclosure, refer to note 21 to our consolidated financial statements and related notes includedelsewhere in this Annual Report on Form 10-K. For financial disclosure related to our geographic areas, referto note 21 to our consolidated financial statements.
Futures Marketplaces
ICE Futures Europe operates as a Recognized Investment Exchange in the United Kingdom, where it isregulated by the United Kingdom Financial Services Authority, or FSA. ICE Futures Europe was founded in1980 as a traditional open-outcry auction market by a group of leading energy and financial servicescompanies. Today, ICE Futures Europe operates exclusively as an electronic exchange. Trades in our energyfutures markets may only be executed in the name of exchange members for the members’ own account ortheir customers’ account. Our members and their customers include many of the world’s largest energycompanies and leading financial institutions.
3

ICE Futures U.S. is the leading global futures and options exchange for trading in a broad array of “soft”agricultural commodities, including cocoa, coffee, cotton, frozen concentrated orange juice, or FCOJ, andsugar. ICE Futures U.S. also provides trading in futures and options contracts for a variety of financialproducts, including its futures and options contracts based on the U.S. Dollar Index, or USDX. ICE FuturesU.S. operates as a Designated Contract Market and is regulated by the Commodity Futures TradingCommission, or CFTC. Until February 2, 2007, ICE Futures U.S. operated exclusively as an open-outcryexchange and provided floor-based trading for all of its contracts. On that date, ICE Futures U.S. introducedits core soft commodity contracts for trading on our electronic platform, and has subsequently also introducedthe Russell index, currency pairs and USDX futures contracts electronically.
ICE Futures U.S. owns its own clearing house, ICE Clear U.S., which clears and settles contracts tradedon, or subject to, the rules of ICE Futures U.S. ICE Clear U.S. is a Derivatives Clearing Organization and isregulated by the CFTC. In 2005, ICE Clear U.S. implemented the Extensible Clearing System, known as ECS,which is a flexible Internet-based clearing system. ECS has permitted ICE Clear U.S. to provide its clearingmembers with real-time clearing information and the ability to scale and complete clearing processes moreefficiently.
ICE Futures Canada is Canada’s only agricultural futures and options exchange and North America’s firstfully electronic futures commodity exchange. Based in Winnipeg, ICE Futures Canada offers futures andoptions contracts on canola, domestic feed wheat, and western barley. For over a century ICE Futures Canada,and its predecessor companies, have operated regulated futures markets that bring together agricultural industryparticipants, traders, and investors to engage in price discovery, price risk transfer and price dissemination forthe markets. ICE Futures Canada is a recognized commodity futures exchange under the provisions of TheCommodity Futures Act (Manitoba), or the CFA, and is regulated by the Manitoba Securities Commission, orMSC.
ICE Futures Canada owns it own clearing house, ICE Clear Canada, which clears and settles contractstraded on, or subject to, the rules of ICE Futures Canada. ICE Clear Canada is a recognized clearing houseunder the provisions of the CFA and is regulated by the MSC.
OTC Marketplace
In our OTC business, we operate over-the-counter energy markets through our globally distributedelectronic platform. We offer trading in thousands of OTC contracts, covering a broad range of energy-relatedproducts and contract types. These contracts include derivative contracts as well as contracts that provide forphysical delivery of the underlying commodity, principally relating to natural gas, power, natural gas liquids,chemicals and crude and refined oil products. We are able to offer a wide range of derivative contracts in ourOTC markets due to the availability of various combinations of commodities, product types, delivery “hub”locations and terms or settlement dates for a given contract. In 2007, we acquired ChemConnect Inc. andChatham Energy, and as a result, have expanded our markets to include natural gas liquids, chemicals andnatural gas options contracts. Our OTC market participants include many of the world’s largest energycompanies, leading financial institutions and proprietary trading firms, as well as natural gas distributioncompanies and utilities. Participants in our OTC markets must qualify as eligible commercial entities underthe CEA.
Market Data
We offer a variety of market data services for both futures and OTC markets through our market datasubsidiary, ICE Data, which we established in 2002 to meet the growing demand for objective, transparent andverifiable energy market data. ICE Data compiles and repackages market data derived from trading activity onour platform into information products that are sold to a broad customer base extending beyond our coretrading community.
Since its inception, ICE Data has expanded to provide data services covering our energy futures and OTCmarkets, as well as soft agricultural and agricultural commodities, equity indices and currency pairs. Marketdata services for these segments include publication of daily indices, access to historical price and other data,
4

view only access to our trading platform, end of day settlements and pricing data sets, as well as a service thatprovides independent validation of participants’ own valuations for OTC products.
Global Clearing Strategy
In April 2007, we announced our intention to establish a European clearing house, based in London, aspart of our strategic plan to offer clearing services through our wholly-owned clearing businesses in the U.S.,Canada and the U.K. Currently, our energy futures and cleared OTC businesses rely on clearing servicesprovided by LCH.Clearnet Ltd., an independent third party clearing house based in the U.K. We provideclearing services in the U.S. for all ICE Futures U.S. contracts through ICE Clear U.S. ICE Clear Canada isthe designated clearing house for all ICE Futures Canada contracts.
To date, we have executed significant portions of our strategic plan for ICE Clear Europe. We intend tobegin clearing our energy futures and OTC contracts through ICE Clear Europe in the third quarter of 2008.We believe that gaining greater control over this core clearing capability will allow us to introduce moreproducts and services to the futures and OTC markets for broker-dealers and for our customers, as well asensure service levels meet the standards that we have set within our execution business. We also believe thatthis flexibility will allow us to increase our speed-to-market for new cleared products and to expand ourproducts further into physically-delivered commodity products. Finally, it is our objective to provide a clearingmodel that benefits customers and clearing firms alike, through competitive pricing, profit participations andnew value-added services. Longer term, we anticipate that collectively, our European, Canadian and U.S. clear-ing houses might partner to serve our global customer base across the commodities and financial productsmarketplace, in an innovative and highly capital efficient manner. Our clearing strategy is designed tocomplement our diverse markets while meeting the risk management and capital and regulatory requirementsof an expanding global marketplace.
Prior to commencing operations, ICE Clear Europe must be approved by the FSA as a RecognisedClearing House. We submitted the final FSA application in the third quarter of 2007, and assuming that theinformation provided is satisfactory and the initial timeline is met, regulatory approval is anticipated in thefirst quarter of 2008.
On July 18, 2007, we formally notified LCH.Clearnet of our intention to terminate our clearingagreements with them and provided the required one year’s written notices of termination of these agreements.The notices of termination specify that the termination date will be a date agreed to between the parties, or, inthe event that no agreement is reached between the parties regarding a termination date, will be the date thatis twelve months from the date of notice.
Acquisitions and Strategic Relationships
Over the past two years, we have made several strategic acquisitions and developed strategic relationshipsto expand our product offering and client base, including our acquisitions of ICE Futures U.S., CommoditrackInc., Chemconnect Inc., ICE Futures Canada, and Chatham Energy. We also acquired the exclusive rights tothe U.S. Russell Index futures contracts, as well as key natural gas indices from both NGI and NGX. We alsoentered into strategic alliances relating to our electronic platform with Natural Gas Exchange, Inc., and Platts,among others.
On December 21, 2006, we acquired an 8% equity stake in the National Commodity and DerivativesExchange, Ltd., or NCDEX, a derivatives exchange located in Mumbai, India. NCDEX is presently privatelyheld. The NCDEX investment was made with the strategic view of allowing the Company to participate in thedevelopment of exchanges and derivatives markets in India and potentially elsewhere in Asia, which is a keyemerging region in the exchange sector.
On January 12, 2007, we completed the transaction to acquire NYBOT, now ICE Futures U.S. Theacquisition provided us with the capability to acquire the technology and systems to provide clearing, as wellas material revenue and expense synergies, and the diversification and expansion of our product offering intosoft agricultural commodities, foreign exchange and equity index futures and options on futures products.
5
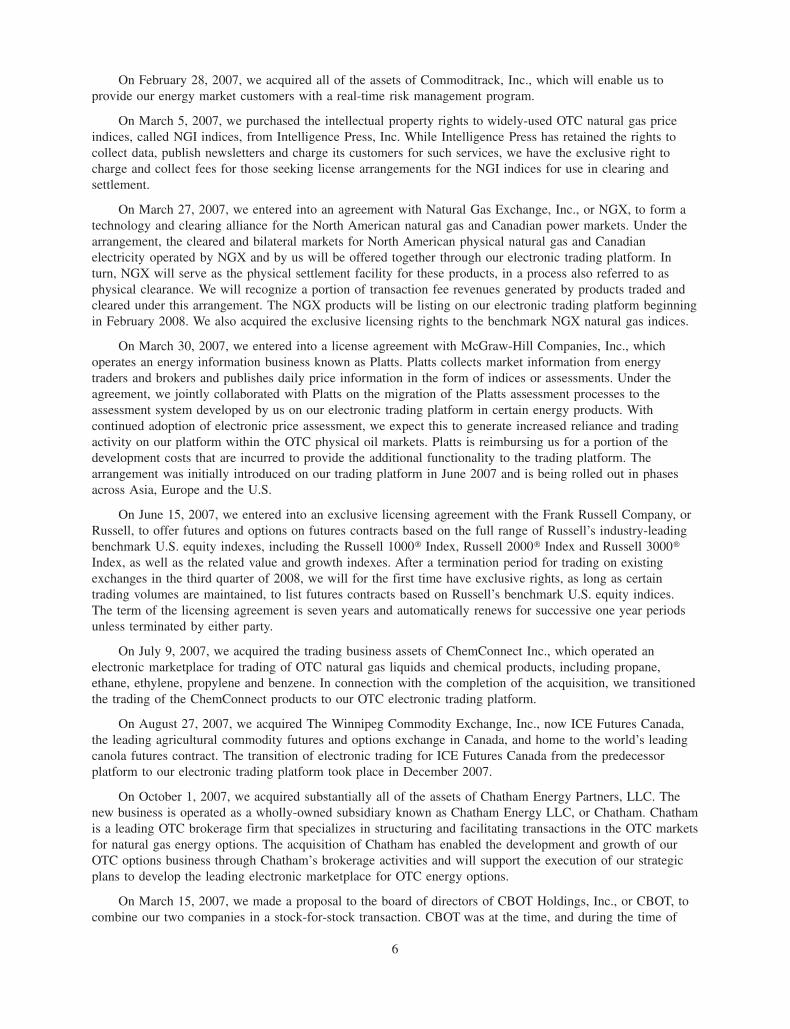
On February 28, 2007, we acquired all of the assets of Commoditrack, Inc., which will enable us toprovide our energy market customers with a real-time risk management program.
On March 5, 2007, we purchased the intellectual property rights to widely-used OTC natural gas priceindices, called NGI indices, from Intelligence Press, Inc. While Intelligence Press has retained the rights tocollect data, publish newsletters and charge its customers for such services, we have the exclusive right tocharge and collect fees for those seeking license arrangements for the NGI indices for use in clearing andsettlement.
On March 27, 2007, we entered into an agreement with Natural Gas Exchange, Inc., or NGX, to form atechnology and clearing alliance for the North American natural gas and Canadian power markets. Under thearrangement, the cleared and bilateral markets for North American physical natural gas and Canadianelectricity operated by NGX and by us will be offered together through our electronic trading platform. Inturn, NGX will serve as the physical settlement facility for these products, in a process also referred to asphysical clearance. We will recognize a portion of transaction fee revenues generated by products traded andcleared under this arrangement. The NGX products will be listing on our electronic trading platform beginningin February 2008. We also acquired the exclusive licensing rights to the benchmark NGX natural gas indices.
On March 30, 2007, we entered into a license agreement with McGraw-Hill Companies, Inc., whichoperates an energy information business known as Platts. Platts collects market information from energytraders and brokers and publishes daily price information in the form of indices or assessments. Under theagreement, we jointly collaborated with Platts on the migration of the Platts assessment processes to theassessment system developed by us on our electronic trading platform in certain energy products. Withcontinued adoption of electronic price assessment, we expect this to generate increased reliance and tradingactivity on our platform within the OTC physical oil markets. Platts is reimbursing us for a portion of thedevelopment costs that are incurred to provide the additional functionality to the trading platform. Thearrangement was initially introduced on our trading platform in June 2007 and is being rolled out in phasesacross Asia, Europe and the U.S.
On June 15, 2007, we entered into an exclusive licensing agreement with the Frank Russell Company, orRussell, to offer futures and options on futures contracts based on the full range of Russell’s industry-leadingbenchmark U.S. equity indexes, including the Russell 1000» Index, Russell 2000» Index and Russell 3000»Index, as well as the related value and growth indexes. After a termination period for trading on existingexchanges in the third quarter of 2008, we will for the first time have exclusive rights, as long as certaintrading volumes are maintained, to list futures contracts based on Russell’s benchmark U.S. equity indices.The term of the licensing agreement is seven years and automatically renews for successive one year periodsunless terminated by either party.
On July 9, 2007, we acquired the trading business assets of ChemConnect Inc., which operated anelectronic marketplace for trading of OTC natural gas liquids and chemical products, including propane,ethane, ethylene, propylene and benzene. In connection with the completion of the acquisition, we transitionedthe trading of the ChemConnect products to our OTC electronic trading platform.
On August 27, 2007, we acquired The Winnipeg Commodity Exchange, Inc., now ICE Futures Canada,the leading agricultural commodity futures and options exchange in Canada, and home to the world’s leadingcanola futures contract. The transition of electronic trading for ICE Futures Canada from the predecessorplatform to our electronic trading platform took place in December 2007.
On October 1, 2007, we acquired substantially all of the assets of Chatham Energy Partners, LLC. Thenew business is operated as a wholly-owned subsidiary known as Chatham Energy LLC, or Chatham. Chathamis a leading OTC brokerage firm that specializes in structuring and facilitating transactions in the OTC marketsfor natural gas energy options. The acquisition of Chatham has enabled the development and growth of ourOTC options business through Chatham’s brokerage activities and will support the execution of our strategicplans to develop the leading electronic marketplace for OTC energy options.
On March 15, 2007, we made a proposal to the board of directors of CBOT Holdings, Inc., or CBOT, tocombine our two companies in a stock-for-stock transaction. CBOT was at the time, and during the time of
6

our offer continued to be, a party to a definitive merger agreement with Chicago Mercantile ExchangeHoldings, Inc., or CME, which permitted CBOT to consider superior transaction proposals. Ultimately,CBOT’s board of directors did not accept our proposal to merge with CBOT, and accepted an improvedproposal from CME, which resulted in a completed transaction between CME and CBOT on July 13, 2007.
Our Competitive Strengths
We have established ourselves as a leading operator of regulated futures exchanges as well as OTCmarkets. We believe our key strengths include:
• highly liquid global markets and benchmark contracts;
• diverse portfolio of products and services;
• leading electronic derivatives trading platform;
• integrated access to futures and OTC markets;
• highly scalable, proven technology infrastructure;
• strong value proposition, including improved trading execution and in-house clearing capabilities; and
• market transparency.
Highly Liquid Global Markets and Benchmark Contracts
Several of our core products serve as global benchmarks for managing risk relating to exposure to pricemovements in the underlying commodities. We operate the leading market for trading in Brent crude oilfutures, as measured by the volume of contracts traded in 2007, according to the Futures Industry Association.The ICE Brent Crude futures contract is the leading benchmark for pricing light, sweet crude oil produced andconsumed outside of the U.S. Similarly, the ICE Gas Oil futures contract is a leading benchmark for thepricing of a range of refined oil products outside the United States. We also operate the world’s second largestmarket for trading in West Texas Intermediate, or WTI, crude oil futures, as measured by the volume ofcontracts traded in 2007, according to the Futures Industry Association. The WTI Crude futures contract is theleading benchmark for pricing light, sweet crude oil produced and consumed within the U.S. We operate theleading cleared OTC market for trading in Henry Hub natural gas contracts. We also list hundreds of othercontracts based on natural gas and electric power hubs, or delivery points, in North America, as well as certainrefined products. We believe that our introduction and adoption of futures-style clearing for OTC products hasenabled us to build significant liquidity within the OTC markets we operate, while removing the counterpartyrisk that is inherent in the bilateral OTC markets.
Our Sugar No. 11 futures contract serves as the benchmark for raw sugar, a basic commodity nowproduced in over 120 countries and consumed by every country in the world. Our Coffee “C” and Cotton No. 2contracts are also recognized as benchmark contracts. These products have been synonymous with the twopredecessor exchanges that formed ICE Futures U.S. — the Coffee, Sugar & Cocoa Exchange and the NewYork Cotton Exchange. We believe that our existing liquidity and history and that of ICE Futures U.S.’spredecessors in trading these commodity products for over 100 years has enabled the development of ourstrong industry relationships.
7

The following table shows the number and notional value of commodities futures contracts traded in ourmost significant futures markets. The notional value of contracts represents the aggregate value of theunderlying commodities covered by the contracts.
Number ofContracts
NotionalValue
Number ofContracts
NotionalValue
Number ofContracts
NotionalValue
2007 2006 2005Year Ended December 31,
(In thousands) (In billions) (In thousands) (In billions) (In thousands) (In billions)
ICE Brent Crude futures. . . . . 59,729 $4,293.2 44,346 $2,936.2 30,412 $1,712.5
ICE WTI Crude futures(1) . . . 51,388 3,727.2 28,673 1,919.4 — —
ICE Gas Oil futures . . . . . . . . 24,510 1,582.8 18,290 1,071.6 10,972 569.1
Sugar No. 11 futures(2) . . . . . 20,706 289.9 — — — —
(1) Trading commenced on February 3, 2006.
(2) Sugar No. 11 futures trades on ICE Futures U.S., which was acquired on January 12, 2007.
The following table shows the number and notional value of OTC commodities contracts traded on ourelectronic platform in our most significant OTC markets:
Number ofContracts
NotionalValue
Number ofContracts
NotionalValue
Number ofContracts
NotionalValue
2007 2006 2005Year Ended December 31,
(In thousands) (In billions) (In thousands) (In billions) (In thousands) (In billions)
North American natural gas . . . . 157,956 $2,705.6 121,047 $2,289.3 55,524 $1,300.4
North American power . . . . . . . . 8,331 394.2 6,014 284.7 3,145 165.1
Global oil and refined products . . 8,471 305.9 3,772 116.3 3,320 101.6
Diverse Portfolio of Products and Services
We have developed and offer our customers a diverse array of products and a broad range of tradeexecution, market data and post-trade and clearing services on a single platform. We have a history ofdeveloping innovative products and services for the markets we serve, including electronic trade confirmationfor the bilateral OTC markets, independent price validation services, OTC clearing and customized contractdesign. Our markets provide important risk management tools and are constantly evolving based on changes inmarket conditions, market structure and technological advancements. We work closely with our customers tocreate products and services that meet their requirements. These relationships help us to anticipate and leadindustry changes.
Leading Electronic Derivatives Trading Platform
Our electronic trading platform provides centralized and direct access to risk management and tradeexecution for a variety of energy, soft and agricultural commodities, and financial products. We operate ourenergy futures and OTC markets, and our Canadian agricultural markets, exclusively on our electronicplatform. Our electronic platform has enabled us to attract significant liquidity from traditional marketparticipants as well as new market entrants seeking the access, efficiency, and ease of execution offered byelectronic trading. We have developed a significant global presence with thousands of active screens at over1,500 OTC participant firms and over 750 futures participant firms as of December 31, 2007.
Integrated Access to Futures and OTC Markets
We believe that our growth has been driven in part by our ability to uniquely offer qualified marketparticipants integrated access to both the futures and OTC markets. We believe that our demonstrated ability
8

to develop technology and launch new products for both the futures and OTC markets provides us with severalcompetitive advantages, including:
• Diverse Markets: Our globally accessible electronic trading platform offers qualified market partici-pants a single interface to multiple exchanges, covering five unique product categories, includingagricultural, energy, chemicals, equity index and foreign exchange products, as well as a range of OTCenergy products. By offering trading in multiple markets and products we provide our participants withmaximum flexibility to implement their trading and risk management strategies.
• Multiple Access Options: Our participants access our electronic marketplace through a variety ofmeans, including through telecommunications hubs in the U.S., Canada, Europe and Asia, via theInternet or through dedicated lines. We offer various front-end trading alternatives, including proprietaryfront-end systems, ISVs, our own front-end called WebICE and brokerage firms. ISVs allow marketparticipants to access multiple exchanges through a single interface, which is integrated with theparticipants’ risk management systems.
• Cleared and Bilateral OTC Markets: We were the first marketplace in North America to introducecleared OTC energy contracts. We believe that the introduction of cleared energy contracts in the OTCmarkets we operate has increased market liquidity, transparency and attracted new participants to ourOTC markets by reducing bilateral credit risk and by improving capital efficiency. Today, qualifiedOTC participants can trade bilateral and cleared contracts side-by-side on our platform.
Highly Scalable, Proven Technology Infrastructure
Our electronic trading platform provides rapid trade execution and is, we believe, one of the world’s mostflexible, efficient and secure systems for commodities trading. We have designed our platform to be highlyscalable — meaning that we can expand capacity and add new products and functionality efficiently atrelatively low cost and without disruption to our markets. For example, we launched side-by-side trading ofICE Futures U.S.’s benchmark soft agricultural commodities on our electronic trading platform on February 2,2007, just twenty one days after we closed the acquisition on January 12, 2007. Our platform can also beadapted for use in other markets, as demonstrated by the decision of the Chicago Climate Exchange, or CCX,to operate its emissions markets on our trading platform. We believe that our commitment to investing intechnology to enhance our network infrastructure, electronic trading platform and post-trade processes willcontinue to contribute to the growth and development of our business.
Strong Value Proposition, Including Improved Trade Execution and In-house Clearing Capabilities
We believe that by using our electronic platform, market participants benefit from price transparency andcan achieve price improvement over alternate means of trade execution. Electronic trade execution offers timeand cost efficiencies by providing firm posted prices and reducing trade-processing errors and back officeoverhead, and allows us to accelerate the introduction of new products on our platform. The combination ofelectronic trade execution across a range of commodities and derivatives markets and market data servicesfacilitates automation by our participants in all phases of processing from front-office to back office, andranging from trading and risk management to trade settlement. In addition, in our U.K futures business,eligible participants who become members may trade directly in our markets by paying a maximum annualmembership fee of approximately $16,000 per year. In contrast, participants on many other exchanges arerequired to purchase a “seat” on the exchange before they are eligible to trade directly on or gain membershipin the exchange, the cost of which is substantial.
ICE Clear U.S. clears and settles contracts traded on, or subject to, the rules of ICE Futures U.S and ICEClear Canada clears and settles contracts traded on, or subject to, the rules of ICE Futures Canada. Withrecognized and highly respected clearing operations, we believe that these clearing houses’ assurance ofperformance to its clearing members substantially reduces counterparty risk and is a critical component of ICEFutures U.S. and ICE Futures Canada’s identity as a reliable and secure marketplace for global transactions. InApril 2007, we announced plans to establish a European clearing house, based in London, as part of our
9

strategic plan to transition our clearing services in-house from a third party clearing house. This clearing housewill be known as ICE Clear Europe.
Market Transparency
We offer market participants price transparency — meaning a complete view of the depth and breadth ofour markets — through our electronic platform. This format provides equal access and market information toall participants, as well as an electronic record of all bids, offers and trades. This is in contrast to thetraditional open-outcry exchanges and voice-brokered markets with less transparency, speed and access tothese markets. All orders placed on our platform are executed in the order in which they are received, ensuringthat all participants have equal execution priority. In addition, we believe our transparent electronic marketsassist regulators through increased market visibility and through the generation and maintenance by our systemof complete and confidential records of all transactions executed in our markets.
Our Growth Strategy
The record revenues and trading volume we achieved in 2007 reflect our focus on the implementationand execution of our long-term growth strategy. We have expanded our core business organically, developedinnovative new products for global markets, and provided trading-related services more broadly. In addition,we have completed a number of acquisitions and alliances to leverage our core strengths and grow ourbusiness. We seek to advance our leadership position in the commodity derivatives markets by focusing ourefforts on the following key strategies for growth:
• attract new market participants;
• offer additional markets and services;
• continue to develop our electronic platform and increase connectivity;
• expand our market data and services businesses; and
• pursue select strategic opportunities.
Attract New Market Participants
In recent years, our customer base has grown and diversified due to the emergence of new participants inthe commodities markets, the increased use of hedging programs by commercial enterprises, our expansioninto new markets, the increased access to our markets as a result of electronic trading, and the increasedallocation to the commodities asset class by institutional investors. New and traditional participants includefinancial services companies, such as investment banks, hedge funds, proprietary trading firms and assetmanagers, as well as industrial businesses that are increasingly engaging in hedging, trading and riskmanagement strategies. We believe that many of these participants have been attracted to our markets in partdue to the availability of electronic trading and due to the need to hedge price volatility associated withcommodity prices. We intend to continue to expand our customer base by targeting these and other newmarket participants and by offering a growing range of products and electronic trade execution, as well as pre-trade and post-trade processing capabilities.
Offer Additional Markets and Services
We have grown, and intend to continue to grow, as a result of our ability to leverage the combination ofOTC markets, clearing services and new product development. As we continue to develop and launch ourEuropean clearing house, we will seek additional markets and services with unmet needs in clearing,settlement and trade confirmation services, including markets we do not currently serve. We intend to continueto expand the range of products we offer, both by commodity type and structure, by working with customersand potential partners to develop new OTC, futures and option products that provide relevant risk managementtools. We may also seek to license our platform to other exchanges for the operation of their market on ourplatform, as we have with the Chicago Climate Exchange and the Natural Gas Exchange.
10

Continue to Develop our Electronic Platform and Increase Connectivity
We develop and maintain our own network infrastructure and electronic trading platform to ensure thedelivery of a leading-edge technology platform. Our participants may access our electronic platform for tradingin our markets through our proprietary front-end, known as WebICE, via a dedicated line or the Internet,through our application programming interface, or API, through one of our telecommunication hubs, throughco-location at our data center, or through the front-end systems developed by any of 29 ISVs. These representa substantial portion of the ISVs that serve the commodities futures markets. Furthermore, participants in ourmarkets can access our platform directly through their own proprietary interfaces or through a number ofbrokerage firms. We intend to extend our initiatives in this area by continuing to increase ease of access andconnectivity with our existing and prospective market participants.
Expand our Market Data and Services Businesses
We continue to leverage the value of the market data derived from our trade execution, clearing andconfirmation system by developing enhancements to our existing information services and creating new marketdata products. Currently, we publish daily transaction-based indices for the North American spot natural gasand power markets based on data collected from trading activity on our platform. In addition, we sell real-timeand historical futures quotes and other futures market data through 137 data vendors that distribute thisinformation, directly and through various sub-vendors, to approximately 63,000 subscribers. We believe thatthe database of information generated by our platform serves as the single largest repository of energy marketdata. As a result of the breadth of our global data offerings, we believe that we are well positioned to meet thegrowing demand for additional energy market data.
An important revenue source for us is our market data offerings. We intend to further develop our marketdata offerings by integrating proprietary information generated by us into new market data products designedto meet the requirements of a greater number of participants. Sophisticated quantitative approaches to riskmanagement as well as customer time sensitivity has created new applications, uses and demands for tradingrelated data and analytics. For example, we acquired Commoditrack in 2007 to address opportunities forserving the demand for real-time risk management systems. We intend to create new value-added services tocomplement our market data products, including risk management technology, analytical tools and otherservices to assist end users. We believe our market data business is highly scalable, with limited incrementalcosts.
Pursue Select Strategic Opportunities
We intend to continue to explore and pursue acquisition opportunities to strengthen our competitiveposition and grow our company. We may enter into business combination transactions, make acquisitions orenter into strategic partnerships, joint ventures or alliances, any of which may be material. We may enter intothese transactions for a variety of reasons, including to expand our products and services, advance ourtechnology or take advantage of new developments and potential changes in the industry.
Our Products and Services
As a leading operator of global futures and OTC marketplaces, we seek to provide our participants withcentralized and direct access to the futures and OTC markets for price transparency, electronic trade execution,clearing services and services that support their trading and risk management activities. The primary serviceswe provide are electronic price discovery in futures markets, trade execution and trade processing in futuresand OTC markets, and the delivery of technology to facilitate these and other trading and risk managementactivities. We also offer a broad range of market data services for the futures and OTC markets.
11

Regulated Futures Markets
Regulated Energy Future Products
We operate regulated markets for energy futures contracts and options on those contracts through oursubsidiary, ICE Futures Europe. These contracts include the ICE Brent Crude futures contract, the ICE WTICrude futures contract, the ICE Gas Oil futures contract, the ICE ECX CFI futures contract, the ICE UKNatural Gas futures contract, the ICE UK Electricity futures contract, the ICE Unleaded Gasoline Blendstock(RBOB) futures contract, the ICE Heating Oil futures contract and options based on the ICE Brent Crude, ICEWTI Crude, ICE ECX CFI and ICE Gas Oil futures contracts. The ICE Brent Crude futures contract is basedon forward delivery of the Brent light, sweet grade of crude oil that originates from the North Sea. Brentcrude is a leading benchmark used to price a range of traded oil products, including approximately two-thirdsof the world’s oil. The ICE WTI Crude futures contract is a cash-settled futures contract based on WTI, also alight, sweet crude. The ICE Gas Oil futures contract is a European heating oil contract and serves as asignificant pricing benchmark for refined oil products particularly in Europe and Asia.
Our futures markets are fully regulated. As a Recognized Investment Exchange, ICE Futures Europe isresponsible for carrying out certain regulatory and surveillance functions. ICE Futures Europe has its ownregulatory, compliance and market supervision functions, as well as a framework for disciplining marketparticipants who do not comply with exchange rules. Any information that ICE Futures Europe obtains in itsregulatory capacity is confidential and accessible only by a select group of compliance and surveillance staffwithin ICE Futures Europe.
We offer trading in each of our energy futures products exclusively in our electronic markets. We provideaccess to trading our oil contracts and related options continuously for 24 hours, from 11:00 p.m. on Sundaythrough to 11:00 p.m. on Mondays, and then for 22 hours (from 1:00 a.m. to 11:00 p.m.) Tuesday throughFriday (GMT). In our other energy futures contracts and related options and in our emissions futures contracts,we provide electronic market access for 10 hours on business days (from 7:00 a.m. to 5:00 p.m.), Mondaythrough Friday (GMT).
Electronic trading of our energy futures products is available to members and their customers. ICEFutures Europe members may access our trading platform directly via the Internet, through private telecommu-nication lines, through co-location at our primary data center, through an independent software vendor orthrough a member’s own front-end system. Customers of our members may obtain order-routing access to ourmarkets through members. Once trades are executed on our platform, they are matched and forwarded to atrade registration system that routes them to LCH.Clearnet, our current third party clearing services provider,for clearing and settlement. Electronic trading allows participants to execute directly on our platform, whentraditionally such orders were delivered via telephone.
We have taken a number of steps to increase the accessibility and connectivity of our electronic platform,including opening our electronic platform to ISVs and allowing members to develop their own conformedfront-end systems. Our participants can currently access our platform using 29 ISVs. We do not depend on theservices of any one independent software vendor for access to a significant portion of our participant base.
We also have made a number of enhancements to our technology infrastructure and electronic platform tofacilitate trading in futures contracts. Those enhancements include increased speed, reliability and additionalfeatures, such as stop-limits and extensive implied spread functionality, which allows certain bids and offers toimply prices from one contract month to another, as well as the use of formula-based spreadsheet tools and thedevelopment of administrative and monitoring tools.
Regulated Soft Agricultural Future Products
ICE Futures U.S. is a leading world market for the trading of “soft” commodities, including coffee, sugar,cotton, orange juice and cocoa futures and options. ICE Futures U.S. and its predecessor companies haveoffered trading in traditional soft agricultural commodities for over 100 years and have maintained a strongfranchise in these products. These markets are designed to provide effective pricing and hedging tools toindustry users worldwide as well as strategic trading opportunities for individual and institutional investors.
12

These soft commodity contracts were listed electronically for the first time in their history in February 2007.The prices for many of our agricultural contracts serve as global benchmarks for the physical commoditymarkets, including Sugar No. 11 (world raw sugar), Coffee “C” (Arabica coffee) and Cotton No. 2 (cotton).
Through close cooperation with agricultural industry participants, ICE Futures U.S. has supported thedevelopment of innovative and internationally recognized futures and options contracts that reflect the basicrequirements of the commodity industry. ICE Futures U.S.’s contract committees, in conjunction with industryrepresentatives, continuously review contracts and trading practices to adjust specifications and procedures tointroduce new contracts when cash market conditions warrant change.
Soft agricultural products have historically accounted for most of ICE Futures U.S.’s trading volume. In2007, soft agricultural products represented approximately 93.0% of the total number of futures and optionscontracts traded in ICE Futures U.S.’s markets.
Regulated Agricultural Future Products
ICE Futures Canada is the only commodity futures exchange in Canada that facilitates the trade of futuresand options on futures contracts for canola, feed wheat and western barley. ICE Futures Canada, and itspredecessor companies, have been operating for over 137 years and have maintained a strong franchise inagricultural commodities. ICE Futures Canada contracts are designed to provide effective pricing and hedgingtools to industry users worldwide as well as strategic trading opportunities for individual and institutionalinvestors. ICE Futures Canada markets converted to a fully electronic marketplace in December 2004. Theprice of the canola futures contracts is the worldwide benchmark. In 2007, the canola contract representedapproximately 92.6% of the total number of contracts traded on the ICE Futures Canada marketplace.
Regulated Financial Future Products
ICE Futures U.S. offers financial products in the currency markets, equity index and commodity indexmarkets, including the US Dollar Index, or USDX, the Russell equity indexes, the CCI and RJ/CRB anddozens of currency pair futures and options contracts. In 2007, contracts traded in our financial productmarkets represented 7.0% of the total number of contracts traded in ICE Futures U.S.’s futures and optionsmarkets.
ICE Futures U.S. offers specialized tools such as financial cross-rate contracts to complement its globalagricultural markets. We provide futures and options markets for a variety of currency pair contracts includingeuro-based, U.S. dollar-based, yen-based, sterling-based and other useful cross-rates as well as the originalcontract based on the USDX introduced in 1985. By identifying interbank market signals and customer needs,we developed currency contracts and defined trading procedures that serve institutional financial managers.These products began being introduced on our electronic platform in the second half of 2007.
ICE Futures U.S. lists futures and options contracts on the Russell Indices of U.S. equities, beginningwith the Russell 1000 Index in 1999, followed by the Russell 2000 and the Russell 3000 along with the valueand the growth components of these indices. In June 2007, ICE entered into an exclusive licensing agreementwith Russell with respect to its U.S. equity index future and options on futures, which will commence in 2008.
Clearing House Function
We currently operate our own clearing house for our ICE Futures U.S. business through ICE ClearU.S. and for our ICE Futures Canada business through ICE Clear Canada. These clearing houses clear, settleand guarantee to their clearing members the financial performance of all futures contracts and options onfutures contracts matched through our execution facilities and accepted by the clearing house from clearingmembers in our U.S. and Canadian futures markets. Through our clearing houses, we maintain a system forperformance of financial obligations owed to the clearing members through which buyers and sellers conducttransactions. This system is supported by several mechanisms, including rigorous clearing membershiprequirements, the posting of original margin deposits, daily mark-to-market of positions and payment ofvariation margin, maintenance of a guaranty fund in which clearing members maintain deposits with our
13

clearing house and broad assessment authority to recoup financial losses if they arise due to a clearing memberfinancial default. The amount of margin deposits on hand will fluctuate over time as a result of, among otherthings, the extent of open positions held at any point in time by market participants and the volatility of themarket as reflected in the margin rates then in effect for such contracts.
We believe that having an integrated clearing function provides us with significant competitiveadvantages. Ownership and control of our own clearing house at ICE Clear U.S. and ICE Clear Canadaenables us to capture the revenue associated with both the trading and clearing of our futures and optionscontracts. This is particularly important for trade execution alternatives such as privately negotiated blocktrades, where we can derive a higher clearing fee for each contract traded compared to trades executed on ourplatform. By owning these clearing houses, we can also control the cost structure and the technologydevelopment cycle for our clearing services and are able to manage our new product initiatives without beingdependent on a third party approval. We intend to begin clearing our ICE Futures Europe and OTC contractsthrough ICE Clear Europe in the third quarter of 2008 upon the transition of this business from LCH.Clearnet.
Our clearing houses are a significant attraction, and an important part of the functioning of our exchanges.Because the role of the clearing house is to serve as a single counterparty for each matched trade, clearingmembers do not need to evaluate the credit of each potential counterparty or limit themselves to a selected setof counterparties. This flexibility increases the potential liquidity available for each trade. Additionally, thesubstitution of our clearing house as the counterparty for each matched trade allows our customers to establisha position with one party and then to offset the position with another party. This contract offsetting processprovides our customers with flexibility in establishing and adjusting positions and provides for original marginefficiencies.
In order to ensure performance, our clearing houses establish and monitor financial requirements for ourclearing members and set minimum margin requirements for our traded products. Our clearing houses useproprietary software, based on an industry standard margining convention, to determine the appropriate marginrequirements for a member by simulating the gains and losses of complex portfolios. We typically hold margincollateral to cover at least 97% of price changes for a given product within a given historical period.
At each settlement cycle, our clearing houses value, at the market price prevailing at that time, or mark-to-market, all open futures positions and require payments from clearing members whose positions have lostvalue and make payments to clearing members whose positions have gained value. Our clearing houses mark-to-market all open futures positions at least twice a day, and more often if market volatility warrants.Marking-to-market provides both participants in a transaction with an accounting of their financial obligationsunder the contract.
Having a mark-to-market cycle of a minimum of two times a day for ICE Clear U.S. and once daily forICE Clear Canada helps protect the financial integrity of our clearing houses, our clearing members andmarket participants. This allows our clearing houses to identify quickly any clearing members that may not beable to satisfy the financial obligations resulting from changes in the prices of their open contracts beforethose financial obligations become exceptionally large and jeopardize the ability of our clearing houses toensure financial performance of their open positions.
As a self-regulatory organization, ICE Clear U.S. has instituted detailed risk-management policies andprocedures to guard against default risk with respect to cleared contracts. In order to manage the risk offinancial non-performance, we (i) have established that clearing members maintain at least $5 million inminimum working capital; (ii) limit the risk exposure of open positions based upon that clearing member’scapital; (iii) require clearing members to post original margin collateral for all open positions, and to collectoriginal margin from their customers; (iv) pay and collect variation margin on a marked-to-market basis atleast twice daily; (v) require clearing members to collect funds from under-margined customers; (vi) requiredeposits to the guaranty fund from clearing members which would be available to cover financial non-performance; and (vii) have broad assessment authority to recoup financial losses.
ICE Clear Canada has instituted a similar multi-layered risk management system of rules, policies andprocedures to protect against default which include (i) operational and financial standards for clearing
14

participants applicable to category of registration, (ii) requirements for clearing participants to post originalmargin for house and client positions and requirements to collect additional margin from clients, (iii) assessingand collecting intra-day margin payments on a pre-determined basis, (iv) requiring all clearing participants topay into a guaranty fund and (v) rules requiring all clearing participants to provide additional monies for theclearing fund in the event of a default.
We also maintain extensive surveillance and compliance operations and procedures to monitor andenforce compliance with rules pertaining to the trading, position sizes, delivery obligations and financialcondition of clearing members and large trader accounts.
In the unlikely event of a payment default by a clearing member, we would first apply assets of theclearing member to cover its payment obligation. These assets include original margin, variation margin andthe guaranty fund deposits and any other available assets. In addition, we would make a demand for paymentpursuant to any applicable guarantee provided to the clearing houses by the parent of a clearing member.Thereafter, if the payment default remains unsatisfied, we would use the guaranty fund of other clearingmembers and funds collected through an assessment against all other solvent clearing members to satisfy thedeficit. We have agreed to reserve $50.0 million of the $250.0 million available under our revolving creditfacility for use by ICE Clear U.S. to provide liquidity in the event of default by a clearing member. ICE ClearCanada has arranged a total of $3.0 million in revolving standby credit facilities with the Royal Bank ofCanada to provide liquidity in the event of default by a clearing member.
As part of our powers and procedures designed to backstop financial obligations in the event of a default,we may levy assessments on all of our clearing members if there are insufficient funds available to cover adeficit. There is no limit on this assessment of each clearing member unless the clearing member has notifiedthe clearing house that it is withdrawing as a clearing member. Despite our authority to levy assessments, therecan be no assurance that the relevant clearing members will have the financial resources available to pay, orwill not choose to be expelled from membership rather than pay, any such assessments. Despite the riskmitigation techniques adopted by, and the other powers and procedures implemented by our clearing houses,which are designed to, among other things, minimize the potential risks associated with the occurrence ofmonetary defaults, there can be no assurance that these powers and procedures will prevent such defaults orwill otherwise function to preserve the liquidity of the clearing houses.
Our clearing houses have an excellent risk management track record. ICE Clear U.S. and ICE ClearCanada, and their predecessor companies, have never experienced an incident of a clearing member defaultwhich has required the use of the guaranty funds or assets of either clearing house.
Global OTC Marketplace
Our transparent, electronic platform offers real-time access to the liquidity in our global OTC energymarkets — meaning the complete range of bids, offers, trades and volumes posted for hundreds of contractslisted on our electronic platform. Our platform displays a live ticker for all contracts traded in our OTCmarkets and provides information relating to each trade, such as the volume weighted average price andtransacted volumes by contract. We offer fast, secure and anonymous trade matching services, which webelieve generally are offered at a lower cost compared to traditional means of execution.
Our electronic platform provides trade execution on the basis of extensive, real-time price data wheretrades are processed accurately, rapidly and at minimal cost. We have designed our technology platform toensure the secure, high-speed flow of data from trading desks through the various stages of trade processing.Qualified participants executing in our markets benefit from straight-through processing whereby trades areautomatically confirmed and routed to back office departments and risk management systems. We believe thatthe broad availability of real-time OTC energy market access and data, together with the availability of clearedOTC contracts at the same price as bilateral products, has allowed us to achieve a critical mass of liquidity inour OTC markets. The following diagram illustrates the processing of an OTC trade from order entry torecording in a company’s risk management system. This process typically occurs within a matter of seconds.
15

Our OTC Trade ProcessClearedhandled by third-party,
LCH.Clearnet
TradeCapture
(executed trade data transferredto participants
risk management system)
Bilateral(handled between
Participants)
ParticipantTrade
Execution(handled by our platform)
TradeConfirmation
(handled by our platform)
DealTicker
(Real-time publication of tradeinformation on ICE Screen
OTC Products Overview
We offer market participants a wide selection of derivative contracts, as well as contracts for physicaldelivery of energy commodities, to satisfy their risk management and trading objectives. We offer trading inover 1,000 unique contracts as a result of the availability of various combinations of products, locations andstrips — meaning the duration or settlement date of the contract. Excluding the strip element, over 23,700unique contracts based on products and hub locations were traded in our OTC market in 2007. A substantialportion of the trading volume in our OTC markets relates to approximately 20-25 highly liquid contracts innatural gas, power and oil. For these contracts, the highest degree of market liquidity resides in the prompt, orfront month, contracts, with decreasing liquidity for longer-dated contracts.
On October 1, 2007, we acquired substantially all of the assets of Chatham. Chatham is a leading OTCbrokerage firm that specializes in structuring and facilitating transactions in the OTC markets for natural gasenergy options. The acquisition of Chatham has enabled the development and growth of our OTC optionsbusiness through Chatham’s brokerage activities and will support the execution of our strategic plans todevelop the leading electronic marketplace for these OTC energy options.
We characterize the range of instruments that participants may trade in our markets by reference to typeof commodity (such as global oil products, North American power, North American gas, etc.), products (suchas forwards and swaps, differentials and spreads, and OTC options) and contracts (meaning products specifiedby delivery dates).
The following table indicates the number of unique commodities, products and contracts traded in ourOTC business for the periods presented:
2007 2006 2005Year Ended December 31,
Commodities markets traded . . . . . . . . . . . . . . . . . . . . . . . . . . . . . . . . 10 7 9
Products traded . . . . . . . . . . . . . . . . . . . . . . . . . . . . . . . . . . . . . . . . . . 1,041 990 843
Contracts traded . . . . . . . . . . . . . . . . . . . . . . . . . . . . . . . . . . . . . . . . . 23,780 17,540 15,264
Cleared OTC Contracts
We developed the concept of cleared OTC energy contracts, which provide participants with access tocentralized clearing and settlement arrangements. As of December 31, 2007, we listed 107 cleared contracts,including 43 cleared natural gas contracts, 49 cleared power contracts and 15 cleared oil contracts, all ofwhich are financially settled. Transaction fees derived from trade execution in cleared electronic OTC contractswere $167.6 million for the year ended December 31, 2007 and represented 69.3% of our total OTC revenuesduring the year ended December 31, 2007, net of intersegment fees. This compares to $121.2 million for theyear ended December 31, 2006 or 71.8% of our total OTC revenues for the year ended December 31, 2006.
The introduction of cleared OTC contracts has reduced bilateral credit risk and the amount of capital ourparticipants are required to post on each OTC trade, as well as the resources required to enter into multiplenegotiated bilateral settlement agreements to enable trading with other counterparties. In addition, the
16

availability of clearing for both OTC and futures contracts traded in our markets enables our participants tocross-margin their futures and OTC positions — meaning that a participant’s position in its futures or OTCtrades can be offset against each other, thereby reducing the total amount of capital the participant mustdeposit with the futures commission merchant clearing members, known as FCMs. In order to cleartransactions executed on our platform, a participant must therefore either be a member of the clearing houseitself, or have an account relationship with an FCM that is a member. FCM’s clear transactions for participantsin substantially the same way they clear futures transactions for customers. Specifically, each FCM acts as theconduit for payments, such as margin and settlement, required to be made by participants to the clearinghouse, and for payments due to participants from the clearing house.
Cleared OTC contracts are available for trading on the same screen and are charged the same commissionrate as bilaterally traded contracts. In a cleared OTC transaction, the clearing house acts as the counterpartyfor each side to the trade, thereby reducing counterparty credit risk in the traditional principal-to-principalOTC markets. However, participants to cleared trades also pay a clearing fee directly to the clearing house andto an FCM. There are currently over 50 FCMs clearing OTC transactions in our markets. Participants alsohave the option to trade on a bilateral basis with the counterparty to avoid paying fees to the clearing houseand a FCM subject to the availability of bilateral credit with the counterparty. While we currently derive norevenue directly from providing access to these clearing services through LCH.Clearnet, we believe theavailability of clearing services and attendant improved capital efficiency has attracted new participants to themarkets for energy commodities trading. Therefore, we plan to introduce clearing in the third quarter of 2008,with the establishment of ICE Clear Europe as the clearing house for OTC markets and ICE Futures Europe.
We have extended the availability of our cleared OTC contracts to voice brokers in our industry throughour block trading facility. Block trades are those trades executed in the voice broker market, typically over thetelephone, and then transmitted to us electronically for clearing. We charge participants fifty percent of ourstandard commission fee for block trades. We believe that our block trading facility is a valuable part of ourcleared business as it serves to expand our open interest. As of December 31, 2007, open interest in ourcleared OTC contracts was 7.2 million contracts in North American natural gas and power, and global oil, ascompared to 4.6 million contracts as of December 31, 2006. Open interest refers to the total number ofcontracts that are currently open, in other words, contracts that have been traded but not yet liquidated byeither an offsetting trade, exercise, expiration or assignment.
OTC Trade Execution Services
We offer a broad range of automated OTC trade execution services, including straight-through tradeprocessing, electronic trade confirmation, market data and risk management functionality.
Automated Trade Execution Services — Straight-Through Trade Processing.
Our electronic platform offers the following features:
• Viewing Live Markets: Traders may view all live, firm quotes posted by other traders in our markets.
• Counterparty, Credit and Risk Management Screening: Quotes visible to a participant’s traders on thescreen are color-coded. One color indicates that quotes have originated from parties other than thatparticipant. Another color indicates whether or not particular quotes meet counterparty, credit and riskmanagement criteria established by the participant’s risk management personnel.
• Instant Messaging: Our instant messaging service allows participants to communicate directly withothers in our markets on a secure, anonymous and real time basis.
• Simple Click Execution: Traders may act on a bid or an offer with one or more clicks of a mouse oruse of a shortcut key programmable set-up.
• Order Matching: Once an order is placed by a participant’s trader, it is automatically matched with aquote meeting the participant’s counterparty, credit and risk management criteria at the best available
17

price. If there are two quotes at the same price, priority goes to the one that was entered first. Ordersare matched on an anonymous basis.
• Application Programming Interfaces: Our application programming interfaces allow participants tobuild their own customized front office trading systems, which can be linked to our platform, therebyenabling high speed data flow to their trading desk and back through to their risk management,settlement and accounting systems.
• Automated Spreadsheet Trading: Participants may send orders to, and execute trades on, our platformusing their own proprietary formulas and strategies without the use of our application programminginterfaces or any code level programming.
• Trade Reporting: A confirmation is automatically transmitted to each party to a trade.
• Order Monitoring and Deal Surveys: Traders are able to monitor and manage the status of all bidsand offers that they have entered on our platform, across all markets.
• Electronic Invoicing: Our platform generates electronic invoices and other reports detailing the feesand trading commissions due from each participant.
Electronic Trade Confirmation Services
Our electronic trade confirmation system offers market participants an efficient, reliable and automatedalternative to manual trade verification and confirmation. When trading on a traditional exchange or throughOTC voice brokers, market participants typically manually prepare and exchange paper confirmationsevidencing trade execution in order to create a legal record of the trade.
Our automated electronic trade confirmation system reviews electronic trade data received from individualtraders, screens and matches this data electronically, then highlights any discrepancies in a report to thetraders’ respective back offices. This allows back office personnel to focus primarily on those trades thatrequire correction and verification, rather than also reviewing the larger percentage of trades withoutdiscrepancies. Participants using this service may elect to use this confirmation as the official record of thetransaction in place of the fax traditionally generated by participants’ back offices.
Our electronic trade confirmation service accepts data from trades executed on our platform, throughother exchanges or trading facilities or through OTC voice brokers. We believe that the convenience and costsavings offered by our electronic trade confirmation service could attract new participants to our platform,increasing the revenues that we derive from OTC transaction fees.
OTC Risk Management Functionality
Trades in the OTC commodities markets historically have been executed as bilateral contracts in whicheach counterparty bears the credit and/or delivery risk of the other. Our electronic platform allows participantsto pre-approve trading counterparties and establish parameters for trading with each counterparty, therebyenforcing internal risk management policies. Participants may set firm-wide limits on tenor (duration) and thetotal daily value of trades that its traders may conduct with a particular counterparty in a given market.
Market Data Services
Through ICE Data, we generate market information and indices based primarily upon auditable transac-tion data derived from actual bid and offer postings and trades executed in our markets. Therefore, thisinformation is not affected by subjective estimation or selective polling, the methodologies that currentlyprevail in the OTC markets. Each trading day, we deliver proprietary market data directly from our OTCmarket to the desktops of thousands of market participants.
ICE Data publishes ICE daily indices for our spot natural gas and power markets with respect to over 90of the most active gas hubs and over 20 of the most active power hubs in North America. In 2005, ICE Datawas recognized by the Federal Energy Regulatory Commission, or FERC, as the only publisher of natural gas
18

and power indices to fully comply with all of the natural gas and power index publishing standards identifiedin its Policy Statement on Price Indices. ICE Data transmits our daily indices via e-mail to approximately10,000 energy industry participants on a complimentary basis each trading day. In the future, we may begincharging recipients for what we believe is increasingly valuable data.
The ICE Data end of day report is a comprehensive electronic summary of trading activity in our OTCmarkets. The report features indicative price statistics, such as last price, high and low price, total volume,volume-weighted average price, best and offer, closing bid and closing offer, for all natural gas and powercontracts that are traded or quoted on our platform. This information is sold as various subscription basedproducts. Also, for both our futures and OTC markets, we offer view only access to market participants whoare not active traders, but who still desire access to real-time prices of physical and financial energy derivativecontracts.
ICE Data market price validation, or MPV, service provides independent, consensus forward curve andoption values for long-dated global energy contracts on a monthly basis. On the last business day of eachmonth, MPV service participant companies, representing the world’s largest energy and commodities tradingentities, submit their month-end forward curve and option prices for over 200 global commodity contracts.MPV service participants use these consensus values to validate internal forward curves, mark-to-market theirmonth-end portfolios and establish profit and loss valuations in accordance with the Financial AccountingStandard Board, or FASB, and the International Account Standards recommendations concerning the treatmentand valuation of energy derivative contracts.
We provide our real-time futures data to data distributors, commonly called quote vendors, or QVs. Thesecompanies such as Bloomberg or Reuters then package this data into real-time, tick, intra-day, delayed, end-of-day and historical data packages to sell to end users. The real-time packages are accessed on a subscriptionbasis and the appropriate “exchange fee” is paid for each user/screen taking ICE Futures U.S. or ICE FuturesEurope data. The futures data includes the trading activity in those markets, including bids, offers, trades andother key price information. End users include a range of financial information providers, FCMs, pensionfunds, financial services companies, funds, insurance companies, commodity pools and individual investors.
Our Participant Base
Futures Business Participant Base
Participants of ICE Futures Europe include representatives from segments of the underlying industriesserved by our energy markets, including, among others, the oil, gas and power industries. Participants currentlytrade in our energy futures markets, either directly as members or through an ICE Futures Europe member.The participant base in our energy futures business is globally dispersed, although we believe a significantproportion of our participants are concentrated in major financial centers in North America, the UnitedKingdom, Continental Europe and Asia. We have obtained regulatory clearance or received legal adviceconfirming that there is no legal or regulatory impediment for the location of screens for electronic trading inour energy futures markets in 54 jurisdictions in addition to the United Kingdom for ICE Futures Europe,including the United States, Singapore, Dubai and all of the member countries of the European EconomicArea. Like our OTC participant base, the participant base in our energy futures business has grownsignificantly since we acquired ICE Futures Europe in 2001. Memberships in our energy futures marketsincreased to 144 members for the year ended December 31, 2007 as demand for electronic access to globalenergy markets increased.
The five most active clearing members of ICE Futures Europe, which handle cleared trades for their ownaccounts and on behalf of their customers, accounted for 57.7%, 51.0% and 45.6% of our energy futuresbusiness revenues, net of intersegment fees, for the years ended December 31, 2007, 2006 and 2005,respectively. Revenues from one member accounted for 18.2%, 15.4% and 13.3% of our energy futuresbusiness revenues, net of intersegment fees, for the years ended December 31, 2007, 2006 and 2005,respectively. Revenues from two other members accounted for 14.8% and 10.7% of our energy futuresbusiness revenues, net of intersegment fees, for the year ended December 31, 2007 and another memberaccounted for 12.1% of our energy futures business revenues, net of intersegment fees, for the year ended
19

December 31, 2006. A substantial part of the trading activity of these participants typically represents tradesexecuted on behalf of their respective clients, rather than by the firm for their own account.
Trades in our energy futures markets may only be executed in the name of an ICE Futures Europemember for its own or others’ accounts. In order to become an ICE Futures Europe member, an applicantmust complete an application form, undergo a due diligence review and execute an agreement stating that itagrees to be bound by ICE Futures Europe regulations. All energy futures trades executed on our electronicplatform are overseen by or attributable to “responsible individuals.” Each member may register one or moreresponsible individuals, who are responsible for trading activities of both the member and its customers, andwho are accountable to ICE Futures Europe for the conduct of trades executed in the member’s name. As ofDecember 31, 2007, there were over 2,150 responsible individuals registered in our energy futures market.
ICE Futures U.S.’s trading members include representatives from segments of the underlying industriesserved by our soft agriculture and financial markets, including, among others, the citrus, cocoa, coffee, cottonand sugar industries. Trading rights are also held by FCMs, floor brokers and floor traders. A tradingmembership in ICE Futures U.S. enables the holder to trade any of the exchange’s futures and optionscontracts. ICE Futures U.S. also issues trading permits that allow the holder to trade a specified category ofproducts, such as options or financial contracts. To gain membership status, a person must be approved by themembership committee. All floor brokers and floor traders must be appropriately registered under CFTCregulations and must be guaranteed by a member of ICE Clear U.S.
ICE Futures U.S. has approval to list its screens in 25 jurisdictions. Traders in these futures marketsinclude hedgers, speculators and investors. Hedgers are commercial firms that trade futures and options toreduce their price risk exposure in the cash market, protect their profit margins and assist in business planning.Investors and speculators, who seek to profit from fluctuating prices, typically place an order through FCMs,or through introducing brokers, who have clearing relationships with FCMs. Investors also participate in themarkets by pooling their funds with other investors in collective investment vehicles known as commoditypools, which are managed by commodity pool operators and commodity trading advisors. The CFTC requirescommodity professionals to be registered by the National Futures Association — a CFTC-designated futuresassociation that is charged with enforcing ethical, financial and customer protection standards in the futuresindustry.
The five most active clearing members of ICE Futures U.S., which handle cleared trades for their ownaccounts and on behalf of their customers, accounted for 38.4% of ICE Futures U.S. business revenues, net ofintersegment fees, for the period from January 12, 2007 to December 31, 2007. No participant accounted formore than 10% of ICE Futures U.S. business revenues for the period from January 12, 2007 to December 31,2007.
ICE Futures Canada’s market participants include representatives from companies that hedge their cashproducts in the markets, including international grain companies, feed lots, and food processors, as well asFCMs and liquidity providers. Individuals and companies can access ICE Futures Canada’s markets byregistering as participants with ICE Futures Canada, or trading through a registered participant. To gainparticipant status, a company or individual submits standard written application/agreement forms. All FCMsmust be appropriately registered with the statutory regulatory authority in their home jurisdiction and any self-regulatory organizations required by their statutory regulatory authority. All entities that have direct tradingstatus must be cleared by a registered clearing participant of ICE Clear Canada.
ICE Futures Canada has approval to have trading be done directly to its marketplace on screens inCanada, other than in Quebec, and in the United States through a no-action letter issued by staff of the CFTCdated December 2004. Trading may be done in the United Kingdom pursuant to a reliance on the overseaspersons exemption.
The five most active clearing members of ICE Futures Canada, which handle cleared trades for their ownaccounts and on behalf of their customers, accounted for 51.6% of ICE Futures Canada business revenues, netof intersegment fees, for the period from August 27, 2007 to December 31, 2007. Revenues from two
20

members accounted for 13.2% and 11.4%, respectively, of ICE Futures Canada business revenues for theperiod from August 27, 2007 to December 31, 2007.
OTC Business Participant Base
Pursuant to the CEA, our global OTC markets are principals-only markets, designed for professionaltraders or other commercial market participants. Stringent requirements apply to participants, which includesome of the world’s largest energy companies, financial institutions and other active contributors to tradingvolume in global commodities markets. They include oil and gas producers and refiners, power stations andutilities, chemical companies, transportation companies, banks, funds and other energy market participants.Our participant base is global in breadth, with thousands of participants located in 15 countries. The five mostactive trading participants together accounted for 17.8%, 23.3% and 24.4% of our OTC business revenues, netof intersegment fees, during the years ended December 31, 2007, 2006 and 2005, respectively. No participantaccounted for more than 10% of our OTC business revenues for the years ended December 31, 2007, 2006 or2005.
Trading in our OTC markets is available to a participant that qualifies as an eligible commercial entity, asdefined by the CEA and rules promulgated by the CFTC. Eligible commercial entities must satisfy certainasset-holding and other criteria and include entities that, in connection with their business, incur risks relatingto a particular commodity or have a demonstrable ability to make or take delivery of that commodity, as wellas financial institutions that provide risk management or hedging services to those entities. Pursuant to theCFTC’s oversight of our markets, since October 2006, we report all cleared positions in our primary OTCcontracts on a daily basis to the CFTC through futures-style large trader reports. In addition, during 2007, weadded regulatory staff to our OTC business and anticipate gaining increased authority to have oversight ofcertain of these markets in the future.
We require each qualified participant to execute a participant agreement, which governs the terms andconditions of its relationship with each participant and grants the participant a non-exclusive, non-transferable,revocable license to access our platform. While we generally establish the same contractual terms for all ofour users, in connection with our entry into new commodities markets, we have from time to time agreed tominor modifications to the terms of our participant agreement for trading in new products. We expect that anyfuture services that we may introduce will also be covered by our participant agreement, as we generally havea unilateral right to amend our terms with advance notice. As the OTC markets mature and conventionschange, our participant agreement provides us with considerable flexibility to manage our relationship withour participants on an ongoing basis.
Market Data Participant Base
Our market data revenues are derived from a diverse customer base including the world’s largestcommodity companies, leading financial institutions, proprietary trading firms, natural gas distributioncompanies and utilities, hedge funds and private investors. From an OTC perspective, a large proportion of ourmarket data revenues are derived from sales of market data to companies executing trades on our platform. Wealso continue to see an increasingly diverse and expanding list of non-participant companies purchasing ourdata and subscribing to view-only screens. The primary customer base for our futures market data revenues arethe market data redistributors themselves such as Bloomberg, CQG, Interactive Data Corporation or Reuterswho redistribute our real-time pricing data and remit to us a real-time exchange fee based on the user’s accessto our data. For both OTC and futures market data, end users include corporate traders, risk managers,individual speculators, consultants and analysts. No participant accounted for more than 10% of our marketdata revenues for the years ended December 31, 2007, 2006 or 2005.
Product Development
We leverage our customer relationships, global distribution, technology infrastructure and softwaredevelopment capabilities to diversify our products and services. New product development is an ongoingprocess that is part of our daily operations. We are continually developing, evaluating and testing new products
21

for introduction in our futures and OTC markets. Our goal is to create innovative solutions in anticipation of,or in response to, changing conditions in the markets for commodities trading to better serve our participantbase. The majority of our product development relates to evaluating new contracts or markets for tradingand/or clearing. We generally are able to develop and launch new bilateral OTC contracts for trading within anumber of weeks. For futures and cleared OTC contracts, we are required to collaborate with the clearinghouses with respect to a number of aspects of the development process. As a result, the investment of timeand resources required to develop cleared products is greater than for bilateral contracts. In addition, newcontracts in our futures markets must be reviewed and approved as needed by the FSA, the CFTC, the MSC orpossibly other foreign regulators. We do not incur separate, identifiable material costs in association with thedevelopment of new products — such costs are embedded in our normal costs of operation.
While we have historically developed our products and services internally, we also periodically evaluateand enter into strategic partnerships to identify opportunities to develop meaningful new products and services.If we believe our success will be enhanced by collaboration with a third party, we will enter into a licensingarrangement or other strategic arrangement.
In support of our product development goals, we rely on the input of our product management, clearing,technology and sales teams, who we believe are positioned to discern and anticipate our participants’ needs. InApril 2005, we introduced trading in futures contracts linked to E.U. Emissions Allowances issued under theEuropean Union’s mandatory Emissions Trading Scheme. These contracts are offered in our energy futuresmarkets in conjunction with the European Climate Exchange, a subsidiary of the Chicago Climate Exchange.In February 2006, we successfully launched the ICE WTI Crude futures contract and we have also introducedover 90 new cleared OTC contracts in 2006 and 2007. During 2007, we entered into strategic alliances withNGI, NGX, Platts and Russell.
Technology
Technology is a key component of our business strategy that we regard as crucial to our success. Wedesign, build, and operate the majority of our own software systems and believe that having control of ourtechnology allows us to be more responsive to the needs of our customers, supports the dynamic nature of ourbusiness and deliver the highest quality products. Our systems are built using state-of-the-art softwaretechnologies and best practices including modern programming languages, component-based architectures, anda combination of leading-edge open source and proprietary technology products. We leverage proven industrystandards from leading hardware, software and networking providers, as well as emerging technologies webelieve will give us a competitive edge in technology development. We take a customer focused, iterative andresults driven approach to software design and development that allows us to deliver innovative, high qualitysolutions quickly and effectively.
Significant investments in production planning, quality assurance and certification processes haveenhanced our ability to expedite the delivery of the system enhancements that we develop for our participants.We believe in offering our customers a choice, and as such, our electronic platform is accessible fromanywhere in the world via the Internet, traditional telecommunication hubs, the newly constructed ICE GlobalNetwork, or through co-location at our primary data center. Users can access our electronic trading platformvia our own web based interface, via ISVs, or build link in their own computer systems via one of ourapplication programming interfaces, or APIs. Over the past two years we have intensely focused on enhancingcapacity and performance of our electronic trading platform. This effort has resulted in the best performingplatform in our industry, as measured by transaction times and reliability relative to other futures tradingplatforms offered by other exchanges.
We also develop and operate software components used to support mid- and back office services such asclearing, market data and electronic confirmations. Our clearing infrastructure is designed to be easilyextendable to support integration with additional clearing interfaces. We currently support clearing integrationto four clearing houses, including LCH.Clearnet, KCBOT, The Clearing Corporation and our own ICE ClearU.S. for the purposes of clearing and settling the markets. We are currently developing the technologyinfrastructure for our new yet to be launched clearing house, ICE Clear Europe.
22

We maintain relationships with a range of technology partners, vendors and suppliers in respect ofclearing services, software licensing, hosting facilities and electronic trade routing. The technology systemssupporting our trading and clearing operations can be best described into the following major categories:
Personnel The employees that design, build, operate and support ourtechnology
Trading Systems, Softwareand Applications
The systems and applications that are the foundation of our tradingplatform, clearing infrastructure and related systems
Data Centers, GlobalNetwork, and Distribution
The data centers, hardware and networking technologies that host ourplatforms and support the ability of our participants to access ourmarketplace across our global marketplace
Security and DisasterRecovery
Technologies that maximize and maintain the security of ourmarkets, as well as provide for the transition to a redundantoperating environment in the event of system failure due to internalor external issues
Support Services The services we provide to insure optimal trading and riskmanagement services and customer support services
Personnel
Our technology staff is among the most productive and efficient in the industry. We carefully recruittalented individuals and once in the organization, we foster a culture of entrepreneurship, innovation, customerservice and results. Our electronic platform is designed, built and operated by our personnel. As ofDecember 31, 2007, we employed a team of approximately 200 experienced technology specialists, includingproduct managers, project managers, system architects, software developers, network engineers, securityspecialists, performance engineers, systems and quality analysts, database administrators, website designers,helpdesk and support personnel. We have established a track record of operating a successful electronicplatform by developing and integrating multiple evolving technologies that support substantial trading andclearing volume growth. The integrated suite of technologies that we employ has been designed to support asignificant expansion of our current business and provide us with the demonstrated ability to integrate newmarkets, scale our infrastructure, leverage our technology platform and distribution into new markets, and todevelop new products and services rapidly and reliably.
Trading Systems, Software and Applications
Our technology systems may be categorized into the following areas: trading platform, WebICE,application program interfaces, trading platform performance, clearing systems, and risk management systems.Each is discussed below.
Trading Platform
At the core of our trading business is our electronic trading platform. Our platform supports all of ourfutures exchanges as well as all of our OTC marketplace. Order matching, with a proprietary spread-implication algorithm, constitutes the core of our electronic platform. Large scale enterprise servers providethe processing capacity for the matching engine, which captures price requests by our participants and matchestrades instantaneously, based on the quantity and price at which orders were entered.
Our platform supports functionality for trading in bilateral and cleared OTC, futures and options onfutures contracts. For the futures products, the platform supports a myriad of order types, matching algorithms,price reasonability checks, intercommodity spread pricing and real-time risk management. In addition, we havedeveloped a multi-generation implied matching engine that automatically discovers best bid and offer pricesfurther out on the forward curve. For OTC products we also support bilateral trading with real-time credit riskmanagement between counterparties by commodity or company. We also offer brokers a facility to blocktrades for all their products. Our core functionality is available on a single platform for all of the products thatwe offer electronically, rendering it highly flexible and relatively easy to maintain. As a result, enhancementsmade for one product can easily be propagated for other products.
23

WebICE
Connectivity to our trading platform is available through our own web based front-end, multiple ISVs andAPIs. We provide secure access to our electronic platform via a graphical user interface, or front-end, knownas WebICE. The WebICE graphical user interface serves as a customizable, feature rich front-end to ourplatform. WebICE provides an easy to use and easily accessible front-end for the entire suite of futures andOTC products we offer. Participants can access our platform globally via the Internet by logging in via ourwebsite homepage. Our platform can be accessed using a number of operating systems, including MicrosoftWindows Vista, 2000/XP, Linux and Mac OS. Assuming all legal agreements are in place, a new participantcan be configured and onto our electronic platform within ten minutes. Thousands of users globally access ourelectronic platform each trading day via WebICE.
Application Programming Interfaces (APIs)
We selectively offer our participants use of APIs that allow users to create customized applications andservices around our electronic platform to suit their specific needs. Completely redesigned over the last twoyears, our interfaces are considered among the fastest and easiest to work with APIs in the industry.Participants using APIs are able to link their own internal computer systems to our platform and enablealgorithmic trading, risk management, data services, and straight through processing. Our APIs also enableISVs to adapt their products to our platform, thereby offering our participants a wide variety of front-endchoices in addition to our WebICE interface
We offer the following APIs to direct access customers and ISVs:
• Order Routing — The order routing specification is based on the industry standard Financial Informa-tion eXchange, or FIX, protocol. The FIX message specification is fully compliant with the standardprotocol. This reduces the time for development and maintenance for new and existing clients sincethere are many third party tools and vendors who support the same. We have developed FIX adaptersthat achieve very low latency for all transactions.
• Market Data — In the past year, we have developed a light weight, language independent and fastmarket data feed called iMpact. This feed provides full depth of book and can be used by both tradingclients and Quote vendors. The feed is designed to be scalable to handle the growth and volume ofmessages. The feed is currently based on the TCP/IP protocol. In 2008, we plan to offer this feed overmulticast with additional value-added features such as price levels that will further reduce bandwidthrequirements and latency.
• Trade Capture — We currently offer a java based API to capture all trades done by a given companythat can be used by firms for managing position and risk of their traders. In 2008, we will extend theuse of FIX protocol for trade capture so that our customer can reap the benefits of simplification andlower development and maintenance costs.
• Block Trade — In 2008, we plan to extend the use of the FIX protocol for booking block trades. Thiswill allow broker firms to book pre-consummated trades electronically and increase efficiencies withthis process.
• OTC — For OTC products that have complex bilateral and cleared trading requirements, we also offer aJava-based API that can be used to trade these products electronically on the trading platform.
Trading Platform Performance
Speed, reliability, scalability and capacity are critical performance criteria for electronic trading platforms.A substantial portion of our operating budget is dedicated to system design, development and operations inorder to achieve high levels of overall system performance. In 2007, we completed a major two-yeartechnology initiative to rebuild and optimize the trading platform software, hardware, network and securitycomponents to increase speed, access, capacity, reliability and functionality. Our platform now delivers thefastest published round-trip transaction time in the commodity markets, with average transaction times today
24

of three milliseconds in our futures markets, and a blended average of seven milliseconds for futures and OTCmarkets.
In our business, latency performance is not only measured in average time, but also in the percentage ofoutliers particularly during peak trading periods. We define outliers as any request taking over 50 milliseconds.These outlier metrics characterize the consistency of the platform’s performance. Not only is our platform fast,it is also consistent with better than 99.5% of transactions completing in less than 50 milliseconds during thebusiest of trading periods. Our platform is also highly reliable achieving 99.996% availability during 2007.Planning for capacity, performance and reliability is something we take very seriously and has become a corecompetency. We continually run benchmark tests and monitor our production systems and make adjustmentsas necessary in order to insure that our systems can handle approximately two to three times our peaktransactions in our highest volume products.
Clearing Systems
Through our wholly-owned clearing house, ICE Clear U.S., a broad range of trade management andclearing services are offered, and as is the case with the trading system, ICE now designs, develops, andoperates its own clearing technology. In 2007, ICE Clear U.S. launched a new Post Trade ManagementSystem, or PTMS, to client firms to efficiently manage their trades and trade allocations prior to theirsubmission to the trade clearance system. PTMS is used by brokers, clerks and clearing members to managetrades executed electronically on our platform as well as via floor trading. Direct integration of post-trademanagement functions within our clearing member’s internal systems is also available via our industry-standard FIXML protocol-based messaging solution. Our core clearing system, Extensible Clearing System, orECS, supports open and delivery position management, real-time trade and post-trade accounting, riskmanagement (daily and intra-day cash mark-to-market/option premium and initial margin using the CMESPAN@ algorithm), collateral management, daily settlement and banking. ECS is a state-of-the art systemoffering open Internet-based connectivity and integration options for clearing member access to user andaccount management, position reporting and collateral management. ECS also has an extensive reportingsystem which delivers on-line access to daily and historical reports in multiple formats, as well as an extensivecurrency delivery system to manage the delivery and payment of currency settlements. As we do with thetrading platform, we take a proactive approach to enhancing the reliability, capacity and performance of ourclearing systems. In the past year, we have improved the performance and capacity of each of our coreclearing components by a factor of ten.
Risk Management Systems
ICE Risk, formerly Commoditrack, Inc., is a unique hosted risk management solution we offer to our clientsto provide them with world class risk management features without significant investment in software orhardware. Developed to be a hosted solution, all data resides securely in our redundant data centers. Utilizing thelatest database technologies, clients can securely access the system with a front-end from any computer and seetheir entire real-time risk position. Streaming market data over the same link allows us to provide real-timeprices and profit/loss position, enhanced with formula processing to provide the most accurate real-time viewpossible. ICE Risk maintains multiple views of trades, from the top level as they were executed (like spreads,swaps, and other derivatives) all the way down to the lowest level breakdown. This allows traders and riskmanagers to operate at different levels, all while viewing the same position. The system also offers the ability tomove forward and backward in time, so customers can view their position and profit/loss position as it existedlast month, or how decaying trades and expirations will change in the future.
Data Centers, Global Network and Distribution
In June 2007, we completed the construction of a state-of-the art hosting center in Chicago, Illinois. Thenew hosting facility includes expanded co-location capabilities and will provide the physical space, electricpower, and bandwidth necessary to accommodate continued growth in our messaging traffic, trading volumeand customer base. The facility was used temporarily as our disaster recovery site but became the primary
25

production site in January 2008. The Atlanta-based data center then became the disaster recovery site for ourtechnology systems.
We offer access to our electronic markets through a broad range of interfaces including dedicated lines,server co-location data centers, telecommunications hubs in the U.S., Europe and Asia, and directly via theInternet. In 2007, the completed the build-out of the ICE Global Fiber Network which consists of high speeddedicated fiber-optic lines connecting data hubs in New York, Atlanta, Chicago, London and Singapore withthe exchange’s primary and disaster recovery data centers. This network offers customers an inexpensive, highspeed, high-bandwidth, fiber network solution to routing trading and pricing messages between each of thesedata hub locations and to the primary and secondary data centers.
In addition to our global network, the accessibility of our platform through the Internet differentiates ourmarkets and serves to attract liquidity in our markets. As of December 31, 2007, we had thousands of activeconnections to our platform at over 1,500 OTC participant firms and over 750 futures participant firms. As ofthe fourth quarter of 2007, there was an average of 8,400 simultaneous active connections daily during peaktrading hours. One active connection can represent many individual traders. In addition, we have 29 conformedISVs interfacing to our trading platform. As a result, we have the potential to attract thousands of additionalparticipants who may trade in our markets through ISVs rather than through our own front-end. Many ISVsrepresent a single connection to our platform, though numerous participants may access our markets throughmultiple ISVs.
For high velocity traders interested in the lowest latency possible we offer server co-location space at ourdata centers. This service allows customers to deploy their trading servers and applications which virtuallyeliminates data transmission latency between the customer and the exchange. The combination of our easy touse trading and data APIs, rapid trade execution and collocation serves to attract algorithmic traders which aregrowing liquidity contributors in many of our markets.
Security and Disaster Recovery
Physical and digital security are each critical to the operation of our platform. At our corporate officesand at all of our data centers, physical access controls have been instituted to restrict access to sensitive areas.We also employ leading-edge digital security technology and processes, including high level encryptiontechnology, complex passwords, multiple firewalls, network level virus detection, intrusion detection systemsand secured servers.
We use a multi-tiered firewall scheme to control access to our network. We have also incorporated severalprotective features into our electronic platform at the application layers to ensure the integrity of participantdata and connectivity. For example, we use access control profiles to prevent a given participant fromaccessing data affiliated with another participant. We are also able to restrict the functions that a particularuser can perform with any company data within a given application. Our electronic platform monitors theconnection with each user connected to our platform. If a connection to a particular participant can no longerbe detected, certain outstanding orders entered by that participant are automatically withdrawn and held. Usershave the ability to allow orders to remain in the market as inactive after logging out or disconnecting from ourplatform. In addition, though our electronic platform is accessible over the Internet, it is able to restrictplatform access to designated IP addresses, if so desired by a participant.
We use a remote data center to provide a point of redundancy for our trading technology. Our back-updisaster recovery facility fully replicates our primary data center and is designed to ensure the uninterruptedoperation of our electronic platform’s functionality in the event of external threats, unforeseen disasters orinternal failures. In the event of a major disruption, participants connecting to our electronic platform wouldbe rerouted automatically to the disaster recovery facility. Our primary data center continuously collects andsaves all trade information and periodically transmits it to our disaster recover site. For that reason, we expectthat our disaster recovery system would have current, and in most cases real-time, information in the event ofa platform outage. In the event that we were required to complete a changeover to our back-up disasterrecovery facility, we anticipate that our platform would experience less than six hours of down time.
26
Support Services
All of our participants have access via e-mail, online and telephone to our specialized help desk, whichprovides support with respect to general technical, business and administrative questions, and is staffed24 hours a day from Sunday at 5:30 p.m. Eastern Time until Friday at 6:30 p.m. Eastern Time. At all othertimes, support personnel are available to assist our participants via mobile phone and e-mail. We utilizecustomer relationship management software to assist support staff in tracing inbound calls, web requests ande-mails to centralize issue reporting and resolution tracking. Each week a summary of reported issues iscompiled and sent to operations management for review. In addition, our participants may access training andinformational materials, which are available on our website.
Competition
The markets in which we operate are highly competitive. We face competition in all aspects of ourbusiness from a number of different enterprises, both domestic and international, including traditionalexchanges, electronic platforms and voice brokers. Prior to the passage of the Commodity Futures Moderniza-tion Act of 2000, or the CFMA, futures trading was generally required to take place on, or subject to the rulesof, a federally designated contract market. The costs and difficulty of obtaining contract market designationand corresponding regulatory requirements created significant barriers to entry for competing exchanges. TheCFMA and other changing market dynamics have led to increasing competition from a number of differentdomestic and international sources of varied size, business objectives and resources.
We believe we compete on the basis of a number of factors, including:
• depth and liquidity of markets;
• price transparency;
• reliability and speed of trade execution and processing;
• technological capabilities and innovation;
• breadth of product range;
• rate and quality of new product developments;
• quality of service;
• distribution and ease of connectivity;
• mid- and back-office service offerings, including differentiated and value-added services;
• transaction costs; and
• reputation.
We believe that we compete favorably with respect to these factors, and that our deep, liquid markets;breadth of product offerings; new product development; and efficient, secure settlement, clearing and supportservices distinguish us from our competitors. We believe that in order to maintain our competitive position, wemust continue to develop new and innovative products and services; enhance our technology infrastructure;maintain liquidity and offer competitive transaction costs.
Our Principal Competitors
Currently, our principal competitors include exchanges such as the New York Mercantile Exchange, orNYMEX, the Chicago Mercantile Exchange, or CME, and London International Financial Futures and OptionsExchange, or LIFFE, which is now part of NYSE Euronext. In April 2006, NYMEX and CME announced thatthey had entered into a definitive technology services agreement under which CME, through CME Globex, isthe exclusive electronic trading services provider for NYMEX’s energy futures and options contracts.Subsequently, the volume of NYMEX energy futures contracts traded through Globex surpassed the volume ofNYMEX energy futures contracts traded in its open-outcry market. Among its primary products, NYMEX
27
offers trading in WTI light sweet crude oil futures and Henry Hub natural gas futures contracts. In addition,we currently compete with:
• voice brokers active in the OTC commodities markets;
• other electronic trading platforms for derivatives; and
• market data vendors.
Competition in our Futures Business
In our energy futures business, ICE Futures Europe, we currently compete with global exchanges such asNYMEX, CME and the Tokyo Commodity Exchange, or TOCOM, and European natural gas and powerexchanges, such as the European Energy Exchange. There are also several exchanges that may, in the future,offer trading in contracts that compete with our futures exchanges. In addition, the recent consolidation of, anddevelopment of industry alliances has resulted in a growing number of and well-capitalized trading servicesproviders, which compete with all or portions of our business.
ICE Futures U.S. faces competition from traditional exchanges as well as from new entrants to thederivatives exchange sector. According to Futures Industry Association, ICE Futures U.S. is currently the thirdlargest derivatives exchange in the U.S. The CME, the largest derivatives exchange in the United States,competes with ICE Futures U.S. in its markets for foreign currency and equity index contracts. In December2006, NYMEX listed cash-settled versions of ICE Futures U.S.’s physically delivered soft agriculturalcontracts, initiating competition with ICE Futures U.S. for the first time. Certain of NYMEX’s soft agriculturalcontracts have since been de-listed. Following the merger of the CME and CBOT in July 2007, ICE FuturesU.S. expects that competition will intensify.
ICE Futures U.S. also faces limited competition abroad from NYSE Euronext. Currently, ICE FuturesU.S. competes directly with NYSE Euronext in the cocoa, sugar and coffee markets. ICE Futures U.S. alsocompetes on a limited basis with other exchanges such as the Tokyo Grain Exchange and the BrazilianMercantile and Futures Exchange. At any time, a regional exchange in an emerging market country, such asIndia or China, or a producer country could attract enough activity from outside its borders to compete withICE Futures U.S.’s status as the benchmark pricing market for a given commodity.
ICE Futures Canada competes primarily with NYSE Euronext’s rapeseed contract and, to a lesser extent,the Australian Securities Exchange’s canola futures contract. There are no other exchanges that list contractsfor western barley or Canadian feed wheat, although the Minneapolis Grain Exchange, the Kansas City Boardof Trade and CME have wheat contracts that can be used to hedge Canadian wheat.
In addition to competition from derivates exchanges that offer commodity products, our futures businessalso faces competition from other exchanges, electronic trading systems, third party clearing houses, FCMsand technology firms.
Competition in Our OTC Business
Certain financial services or technology companies, in addition to the competitors named above, haveentered the OTC electronic trading services market. Additional joint ventures and consortia could form, orhave been formed, to provide services that would potentially compete with certain services that we provide.Others may acquire the capacity to compete with us through acquisitions. If we expand into new markets inthe future, we could face significant competition.
Competition in Our Market Data Business
We compete in the market data sector based on our data for futures markets and OTC markets.Competition for real-time data comes from both the U.S. and European exchanges and ‘online’ brokers suchas ICAP and Tradition Financial Services, which list and sell market data relating to OTC contracts thatco-exist along side our futures contracts. Competition for OTC market data comes from voice brokerage firms
28

such as Amerex, whose market data is derived from their brokerage activities in the North American powerand gas markets, market price assessment and reporting organizations such as Platts and NGI, as well asmarket data redistributors such as Bloomberg and Reuters, which produce their own OTC price assessments.
Intellectual Property
We rely on a wide range of intellectual property. We own or have a license to use all of the software thatis essential to the operation of our electronic platform, much of which has been internally-developed by ourtechnology team since our inception. In addition to our software, we regard certain business methods and ourbrand names, marketing elements, logos and market data to be valuable intellectual property. We protect thisintellectual property by means of patent, trademark, service mark, copyright and trade secret laws, contractualrestrictions on disclosure and other methods.
We license a U.S. patent for an apparatus and method for trading electric energy and share the rights andbenefits of this patent. Also, we are co-owners (together with NYMEX) of a U.S. patent directed to an impliedmarket trading system.
We currently have licenses to use several U.S. patents, including the Togher family of patents, whichrelate to the way in which bids and offers are displayed on an electronic trading system in a manner thatpermits parties to act only on those bids and offers from counterparties with whom the party has availablecredit. In connection with the settlement of patent infringement litigation with EBS Dealing Resources, Inc.,or EBS, we obtained from EBS a worldwide, fully paid, non-exclusive license to use technology covered underpatents known as the Togher patents (presently issued or to be issued in the future claiming priority toU.S. patent application 07/830,408). As a fully paid license, we pay no royalties to EBS on an ongoing basis.The EBS license expires on the latest expiration of the underlying patents. Additionally, on May 2, 2006, wereceived a U.S. patent jointly owned with NYMEX for an implied market trading system. The joint patentcovers a method for a computer-based trading system that implies spread markets for multiple real or impliedspread markets.
We cannot guarantee that the Togher patents, the joint patent with NYMEX or any other patents that wemay license or acquire in the future, are or will be valid and enforceable.
We have several U.S. and foreign patent applications pending, including with respect to our electronictrade confirmation service, our ICEMaker system, and our OTC clearing service. We can provide no assurancethat any of these applications will result in the issuance of patents.
We have received several U.S. federal registrations on trademarks used in our business, including“IntercontinentalExchange”, “IntercontinentalExchange” + design, “ICE” and “ICE” + design. We have alsoreceived U.S. federal registrations on other services or products we provide, including “ICEMaker”,“ICEBLOCK”, “ICE DATA”, “ICE DATA” + block design, “ICE Futures”, “ICE Futures + block design”,“WEBICE”, “IPN ICE Private Network & Design”, “The Interchange”, “Trade the World”, “The Edge inEnergy”, “The Energy Marketplace”, “10X”, and “10X” + design. In addition, we have several foreign andU.S. applications pending for other marks used in our business. For instance, in the United States, we haveapplications pending for the marks: “ICE Clear”, “ICE Clear U.S.”, “ICE Clear Canada”, “ICE Clear Europe”,“ICE Futures U.S.”, “ICE Futures Canada”, “ICE Futures Europe”, ICE eConfirm”, “ICE iMpact”, and “ICERisk”. In Canada, we have applications pending for the marks: “ICE”, “ICE” + block design, “ICE Clear”,“ICE Clear U.S.”, “ICE Clear Canada”, “ICE Clear Europe”, “ICE Futures”, “ICE Futures + block design”,“ICE Futures U.S.”, “ICE Futures Canada”, “ICE Futures Europe”, “ICE eConfirm”, “ICE iMpact”,“ICEMAKER”, “ICE Risk”, “ICE DATA”, and “ICE DATA” + block design. In the European Union, we haveapplications pending for the marks: “ICEMAKER”, “ICE Clear”, “ICE Clear U.S.”, “ICE Clear Canada”,“ICE Clear Europe”, “ICE Futures U.S.”, “ICE Futures Canada”, “ICE Futures Europe”, “ICE eConfirm”,“ICE iMpact”, and “ICE Risk”. In Singapore, we have applications pending for the marks: “ICE Clear”, “ICEClear U.S.”, “ICE Clear Canada”, “ICE Clear Europe”, “ICE Futures U.S.”, “ICE Futures Canada”, “ICEFutures Europe”, “ICE eConfirm”, “ICE iMpact”, and “ICE Risk”. We can provide no assurance that any ofthese applications will mature into registered trademarks.
29

ICE Futures U.S.’s key strength is the brand recognition of its “soft” commodity products. Unlike ourU.S. competitors, which have larger corporate identities, ICE Futures U.S.’s primary brand identity is derivedfrom the individual benchmark contracts that it trades. ICE Futures U.S.’s most significant brands are Coffee“C”, Sugar No. 11 and Cotton No. 2. We protect these brand names, as well as other products and services byrelying on trademark law and contractual safeguards. ICE Futures U.S. owns the following registered servicemarks: Coffee “C”, eCOPS, FINEX, TIPS, U.S. Dollar Index, and USDX. ICE Futures U.S also licenses thefollowing trademarks from third parties: Russell 1000, Russell 1000 Value, Russell 1000 Growth, Russell2000, Russell 2000 Value, Russell 2000 Growth, Russell 3000, Russell 3000 Value, Russell 3000 Growth,Russell Top 200, Russell Top 200 Value, Russell Top 200 Growth, Russell MidCap, Russell MidCap Value,Russell MidCap Growth, Russell 2500, Russell 2500 Growth, Russell Small Cap Completeness IndexTM,Russell Small Cap Completeness Value IndexTM and Russell Small Cap Completeness Growth IndexTM. Theseare trademarks and service marks of the Russell Investment Group. ICE Futures U.S. has an exclusive licenseto use the trademark of the Russell Investment Group. ICE Futures U.S. also licenses the NYSE CompositeIndex from NYSE Euronext. ICE Futures U.S.’s license with the NYSE Euronext is an exclusive license to listand trade futures and options contracts on the NYSE Composite Index. ICE Futures U.S. also has an exclusivelicense with Reuters America, LLC to list and trade futures and options contracts on the Reuters Jefferies CRBFutures Price Index and the Continuous Commodity Index.
We also have several foreign trademark registrations, including: “ICE”, “IntercontinentalExchange”, and“IntercontinentalExchange” + design, in the European Union; “ICEMAKER”, “ICE Futures” and “ICEFutures” + block design in Singapore; and “ICEBLOCK” in the European Union, China, Hong Kong, Norway,Singapore, and Switzerland.
This Annual Report on Form 10-K also contains additional trade names, trademarks and service marks ofour and of other companies. We do not intend the use or display of other parties’ trademarks, trade names orservice marks to imply, and this use or display should not be construed to imply, our endorsement orsponsorship of these other parties, their endorsement or sponsorship of it, or any other relationship between itand these other parties.
Sales
As of December 31, 2007, we employed 63 full-time sales personnel. Our global sales team is managedby a futures industry sales and marketing professional and is comprised primarily of former brokers andtraders with extensive experience and established relationships within the commodity trading community.Since our futures business is highly regulated, we also employ sales and marketing staff knowledgeable withrespect to the regulatory constraints upon marketing in this field.
Our marketing strategy is designed to expand relationships with existing participants through the provisionof value-added products and services, technology support and product information, as well as to attract newparticipants, including those in markets and geographic areas where we do not currently have a strongpresence. We also seek to build brand awareness and promote greater public understanding of our business,including how our technology can improve current approaches to price discovery and risk management in theenergy markets.
We use a cross-promotional sales and marketing team for our futures and OTC businesses. We believethis approach is consistent with, and will provide more effective support of, the underlying emphasis of ourbusiness model — an open architecture with flexibility that allows us to anticipate and respond rapidly tocustomers and evolving trends in the markets for commodities trading, while maintaining separate markets ona regulatory basis.
We typically pursue our marketing goals through a combination of on-line promotion through ourwebsite, third party websites, e-mail, print advertising, one-on-one client relationship management andparticipation in trade shows and conferences. From time to time, we also provide commission rate discounts oflimited duration to support new product launches. We participate in a number of domestic and internationaltrade shows, conferences and seminars regarding futures, options on futures and OTC markets and othermarketing events designed to inform market participants about our products.
30

Our marketing department designs materials, information and programs to educate market participantsabout our products and services. We seek to educate these users about changes in product design, marginrequirements and product usage. Our sales and marketing effort typically involves the development of personalrelationships with market participants who actively use our markets to ensure that our product and serviceofferings are based on their needs.
Employees
As of December 31, 2007, we had a total of 506 employees, with 167 employees at our headquarters inAtlanta, 218 in New York, 81 in London and a total of 40 employees in our Winnipeg, Houston, Chicago,Singapore, Dublin and Calgary offices. ICE Futures U.S. is a party to a collective bargaining agreement, whichrepresents a small percentage of its trading floor employees. We have not experienced any work stoppages,and we believe our relationship with our employees is good.
Business Continuity Planning and Disaster Recovery
We maintain comprehensive business continuity and disaster recovery plans and facilities to providecontinuous availability in the event of a business disruption or disaster.
Planning
We maintain incident and crisis management plans that address how we would respond to a crisis event atany of our locations world wide. We are committed to continuously understanding and evaluating businessrisks and their impact on operations, providing training to employees and performing exercises to validate theeffectiveness of our plans by participating in industry sponsored disaster recovery and business continuityexercises. We have invested in technology that will allow us to manage incidents, track results andcontinuously update our plans. We also utilize our strategic partners to provide an independent view of thecontinued viability of our plans.
Datacenters
We use a remote data center to provide a point of redundancy for our trading technology. Our back-upfacility fully replicates our primary data center and is designed to ensure the uninterrupted operation of ourelectronic platform’s functionality in the face of external threats, unforeseen disasters or internal failures. Inthe event of an emergency, participants connecting to our electronic platform would be rerouted automaticallyto the back-up facility. Our primary data center continuously collects and saves all trade information andperiodically transmits it to our back-up facility. For that reason, we expect that our disaster recovery systemwould have current, and in most cases real-time, information in the event of a platform outage. In the eventthat we were required to complete a changeover to our back-up disaster facility, we anticipate that ourplatform would experience less than six hours of down time. Our primary datacenter is currently located inChicago, Illinois. We currently maintain a disaster recovery hot-site in a secured Tier-1 datacenter in Atlanta,Georgia.
People
Office facilities are protected against physical unavailability via our incident management plans.Dedicated business continuity facilities in Atlanta, New York, London and Winnipeg are maintained foremployee relocation in the event that a main office is unavailable. Incident management plans place a priorityon the protection of our employees.
Regulation
We are primarily subject to the jurisdiction of regulatory agencies in the United States, the UnitedKingdom and Canada. With respect to the ICE Futures Europe products, we have permission from55 jurisdictions to allow trading on our platform. With respect to the ICE Futures U.S. products, we havepermission from 25 jurisdictions to allow trading on our platform. With respect to the ICE Futures Canada
31

products, we have permission from Canada (except Quebec), the United States and are able to facilitate tradingunder a statutory exemption in the United Kingdom.
Regulation of Our OTC Business in the United States
We operate our OTC electronic platform as an exempt commercial market under the CEA and regulationsof the CFTC. The CFTC generally oversees, but does not currently substantively regulate, the trading of OTCderivative contracts on our platform. Each of our participants must qualify as eligible commercial entities, asdefined by the CEA, and each participant must trade for its own account, as a principal. Eligible commercialentities include entities with at least $10 million in assets that incur risks (other than price risk) relating to aparticular commodity or have a demonstrable ability to make or take delivery of that commodity, as well asentities that regularly purchase or sell commodities or related contracts that are either (i) funds offered toparticipants that do not meet specified sophistication standards that have (or are part of a group of funds thatcollectively have) at least $1 billion in assets, or (ii) have, or are part of a group that has, at least $100 millionin assets. We have also obtained orders from the CFTC permitting us to treat floor brokers and floor traderson U.S. exchanges and ICE Futures Europe as eligible commercial entities, subject to their meeting certainrequirements. As an exempt commercial market, we are required to comply with access, reporting and record-keeping requirements of the CFTC. In 2006, we undertook technology enhancements and processes to beginreporting on a daily basis to the CFTC all cleared futures-look-alike positions. Our OTC business is nototherwise currently subject to substantive regulation by the CFTC or other U.S. regulatory authorities.However, both the CFTC and the Federal Energy Regulatory Commission, or FERC, have view only access toour trading screens on a real-time basis. In addition, we are required to:
• report to the CFTC certain information regarding transactions in products that are subject to the CFTC’sjurisdiction and that meet certain specified trading volume levels,
• report to the CFTC certain large trader position information for our cleared OTC natural gas marketspursuant to special call issued by the CFTC,
• record and report to the CFTC complaints that we receive of alleged fraud or manipulative tradingactivity related to certain of our products, and
• if it is determined by the CFTC that any of our markets for products that are subject to CFTCjurisdiction serve a significant price discovery function (that is, they are a source for determining thebest price available in the market for a particular contract at any given moment), publicly disseminatecertain market and pricing information free of charge on a daily basis.
In December 2007, the United States Senate and a committee of the House of Representatives passedlegislation to increase regulation of OTC markets. While the final legislation may change, both bills wouldrequire and grant authority to OTC electronic trading facilities to assume self regulatory responsibilities, suchas market monitoring and establishing position limits or accountability limits, over contracts that serve asignificant price discovery function. Presently, we believe that we would be required under the legislation toassume regulatory responsibilities over at least one OTC contract, the Henry Hub natural gas swap. Thelegislation could deter trading on our platform. In addition, we would incur additional costs in order to complywith new regulations in the OTC markets. However, these are not believed to be material on a consolidatedbasis. Specifically, the Senate version of the legislation would require us to become a registrant of the CFTC,which could mean that we may have to pay a regulatory fee on each trade to a registered futures association.
In addition to the legislation above, several pieces of legislation have recently been introduced inCongress that would (i) increase regulation of the bilateral OTC market and (ii) place a fee on cleared tradesto fund the CFTC. If any of these proposals are adopted, they could restrict or foreclose some of our business,require us and our participants to operate under heightened regulatory burdens and incur additional costs inorder to comply with additional regulations, and could deter some participants from trading on our OTCplatform.
We cannot predict whether this legislation will be adopted. If such legislation or other legislation were tobe enacted into law, it could have an adverse effect on our business.
32

The Energy Policy Act of 2005 grants to the FERC the power to prescribe rules related to the collectionand government dissemination of information regarding the availability and price of natural gas and wholesaleelectric energy. In 2006, FERC also issued final rules clarifying the agency’s authority over marketmanipulation by all electricity and natural gas sellers, transmission owners and pipelines, regardless of whetherthey are regulated by FERC. In July 2007, FERC brought its first case using its new authority againstAmaranth Advisors, LLC. FERC’s standard to prove manipulation is lower than the CFTC’s. Thus, given thelower standard, it is possible that FERC may bring more actions against our market participants. FERC’s newauthority and possible future exercises of its rulemaking powers will impose additional regulatory compliancecosts on us and could adversely impact demand for our data products in the United States. In addition, recentlypassed legislation provided the Federal Trade Commission with jurisdiction over fraud or false reports inconnection with transactions in crude oil or petroleum distillates. The Federal Trade Commission’s exercise ofthis authority could also adversely affect trading activity on our platform.
Regulation of Our Business in the United Kingdom and Europe
In the United Kingdom, we also engage in a variety of activities related to our business throughsubsidiary entities that are subject to regulation by the UK’s FSA. ICE Futures Europe is recognized as aninvestment exchange by the FSA in accordance with the Financial Services and Markets Act 2000, or FSMA.As such, ICE Futures Europe maintains front-line regulatory responsibility for its markets and is subject toregulatory oversight by the FSA. In order to retain its status as a recognized investment exchange, ICE FuturesEurope is required to dedicate sufficient resources to its regulatory functions and to meet various regulatoryrequirements relating to sufficiency of financial resources, adequacy of systems and controls and effectivenessof arrangements for monitoring and disciplining its members. Failure to comply with these requirements couldsubject ICE Futures Europe to significant penalties, including de-recognition.
Further, we engage in sales and marketing activities in relation to our OTC business through oursubsidiary ICE Markets Limited, or ICE Markets, which is authorized and regulated by the FSA as an arrangerof deals in investments and as an agency broker. ICE Markets agreed to be subject to certain aspects of theFSA’s Alternative Trading Systems regime which include various reporting, record keeping, and monitoringobligations with respect to use by its participants of our electronic trading platform.
The regulatory framework in relation to ICE Futures Europe’s status as a recognized investment exchangeis supplemented by a series of legislative provisions regulating the conduct of participants in the regulatedmarket. Importantly, FSMA contains provisions making it an offense to engage in certain market behavior andprohibits market abuse through the misuse of information, the giving of false or misleading impressions or thecreation of market distortions. Breaches of those provisions give rise to the risk of criminal or civil sanctions,including financial penalties. It should be noted, that under FSMA, ICE Futures Europe, as a recognizedinvestment exchange, enjoys statutory immunity in respect of any claims for damages brought against itrelating to any actions it has undertaken (or in respect of any action it has failed to take) in good faith, in thedischarge of its regulatory function.
The Markets in Financial Instruments Directive (Directive 2004/39/EC) came into force on November 1,2007, and introduced a harmonized approach to the licensing of services relating to commodity derivatives acrossthe European Economic Area. The legislation also imposed greater regulatory burdens on E.U.-based operatorsof regulated markets, alternative trading systems and authorized firms in the commodity derivatives area. Thelegislation also introduced the concept of a pan-European “passport” allowing ICE Futures Europe to offerservices in all European Economic Area member states in which our participants are based on the basis of UKregulation. This legislation is consistent with other initiatives introduced to provide a more harmonized approachto European regulation, for example, the Market Abuse Directive (Directive 2003/06/EC) which came into forcein October 2004 introducing a specific prohibition against insider dealing in commodity derivative products.
Regulation of our ICE Futures U.S. Business
ICE Futures U.S.’s operations are subject to extensive regulation by the CFTC under the CEA. The CEAgenerally requires that futures trading conducted in the United States be conducted on a commodity exchange
33

designated as a contract market by the CFTC. It also establishes non-financial criteria for an exchange to bedesignated to list futures and options contracts. Designation as a contract market for the trading of specifiedfutures contracts is non-exclusive. This means that the CFTC may designate additional exchanges as contractmarkets for trading in the same or similar contracts. As a designated contract market, ICE Futures U.S. is aself-regulatory organization that has instituted detailed rules and procedures to comply with the “coreprinciples” applicable to it under the CEA. ICE Futures U.S. also has surveillance and compliance operationsand procedures to monitor and enforce compliance with its rules, and ICE Futures U.S. is periodically auditedby the CFTC with respect to the fulfillment of ICE Futures U.S.’s self-regulatory programs in these areas. Thecost of regulatory compliance is substantial.
Additional legislation or regulation, or changes in existing laws and rules or their interpretation, maydirectly affect ICE Futures U.S.’s mode of operation and profitability. The regulations under which ICEFutures U.S. has operated since 1974 have been changed in a manner that will permit unregulated competitorsand competitors in other regulated industries to attempt to trade ICE Futures U.S.’s products in their owntrading facilities without the same regulatory costs that ICE Futures U.S. bears and allow ICE Futures U.S.’scompetitors to trade futures contracts identical to the ones that ICE Futures U.S. offers without any form ofregulation or oversight by the CFTC under certain circumstances. Generally, those exclusions are available tomarkets limited to financial products traded among institutions, whether traded electronically or not. ICEFutures U.S. could also comply with those exclusions and operate markets that are outside CFTC jurisdiction.
The CFTC is subject to periodic reauthorization by Congress. Congress is currently undertaking thisprocess of reviewing the laws and regulations embodied in the CEA to ensure that those affecting the futuresindustry are adequate as market conditions evolve. Changes made to the regulatory framework for exchangesduring reauthorization could make it easier for others to compete with ICE Futures U.S. at a lower regulatorycost.
Regulation of our ICE Futures Canada Business
ICE Futures Canada’s operations are subject to extensive regulation by the Manitoba Securities Commis-sion, or MSC, under the CFA. The CFA requires that an organization must be recognized and registered beforeit can carry on the business of a futures exchange. It establishes financial and non-financial criteria for anexchange. Registration and recognition under the CFA is non-exclusive. This means that the MSC mayrecognize and registered additional exchanges as futures exchanges for trading in the same or similar contracts.In addition, ICE Futures Canada is also recognized by the MSC as a self-regulatory organization and isrequired to institute and maintain detailed rules and procedures to fulfill its obligations. ICE Futures Canadaalso has surveillance and compliance operations and procedures to monitor and enforce compliance by marketparticipants with its rules, and ICE Futures Canada is under the audit jurisdiction of the MSC with respect tothese self-regulatory functions. ICE Futures Canada has a significant number of trading terminals in the UnitedStates for which it has received a no action letter. The no action letter requires it to comply with therequirements of the CFTC including making regular filings. The cost of regulatory compliance is substantial.
Additional legislation or regulation, or changes in existing laws and rules or their interpretation, maydirectly affect ICE Futures Canada’s mode of operation and profitability. The regulations under which ICEFutures Canada operates permit competitors in other regulated industries to attempt to trade ICE FuturesCanada’s products in their own trading facilities.
Industry Overview
The markets for commodities trading include trading in both physical commodities contracts andderivative instruments — instruments that derive their value from an underlying commodity or index — acrossa wide variety of products. Derivative instruments provide a means for hedging price risk, asset allocation,speculation or arbitrage. Contracts for physical commodities allow counterparties to contract for the deliveryof the underlying physical asset.
34

The Futures Market
A futures exchange typically operates as an auction market, where trading is conducted either on anelectronic platform or on an open-outcry trading floor. In an auction market, prices are established publiclyeither on a screen or on the floor of an exchange by participants posting bids, or buying indications, andoffers, or indications to sell. A futures exchange offers trading of standardized contracts and provides access toa centralized clearing system. Commodity futures exchanges are regulated in the United States by the CFTCand are required to publish certain information, such as contract settlement prices and participant information.Commodity futures exchanges are regulated in the United Kingdom by the FSA and in Canada by the MSC.In a typical futures market, participants can trade two types of instruments:
• Futures: A future is the most common exchange-traded commodity contract. It is a standardizedcontract to buy or sell a specified quantity of an underlying asset during a particular month (an exactdelivery date or a range of dates will be specified). Contract sizes are standardized and differ bycommodity. For example, the ICE Brent Crude futures contract has a contract quantity of 1,000 netbarrels, or 42,000 U.S. gallons. The price of the futures contract is determined through the auctionprocess on the exchange. Futures contracts are settled through either physical delivery or cashsettlement, depending on the contract specification.
• Options: An option is a contract that conveys to the buyer the right, but not the obligation, to call(buy) or put (sell) an underlying futures contract at a price determined at the time of the execution ofthe option.
Historically, trading in futures contracts took place exclusively through face-to-face interaction on aphysical trading floor by members of an exchange, also known as a “pit”, through an auction process knownas “open-outcry”. In an open-outcry market, the matching of buyers and sellers is achieved by traders in thepit locating other traders in the pit who have an opposite trading interest. As the name implies, traders “cryout” their bids and offers, often in combination with a system of hand signals, with the objective of finding acounterparty with whom to trade.
All futures contracts and options on futures contracts are cleared through a central clearing house.Clearing is the procedure by which each futures and options contract traded on an exchange is, typically,novated, or replaced, with a contract with the clearing house. In this process, the clearing house is interposedbetween the trading parties and becomes the buyer to each member firm that is a seller, and the seller to eachmember firm that is a buyer. By interposing itself between the member firm parties of every trade, the clearinghouse guarantees each member firm party’s performance, and eliminates the need to evaluate counterpartycredit risk. FCMs function, in turn, as intermediaries between market participants and a clearing house. Ineffect, the clearing house takes on the counterparty credit risk of the FCM, and the FCM assumes the creditrisk of each of its client market participants, which is partially offset by capital held by the FCM with respectto each of its client market participants.
The OTC Market
Over-the-counter, or OTC, is a term used to describe trading activity that does not take place on aregulated exchange through listed contracts. In this market, commercial market participants have historicallyentered into negotiated, bilateral contracts, although in recent years participants have begun to take advantageof cleared OTC contracts that, like futures contracts, are standardized and cleared through a central clearinghouse.
In contrast to the limited number of futures contracts available for trading on regulated exchanges,participants in the OTC markets have the ability to trade both standardized and customized contracts, wherecounterparties can specify contract terms, such as the underlying commodity, delivery date and location, termand contract size. Furthermore, while exchanges typically limit their hours of operation and restrict directtrading access to a limited number of exchange members, OTC markets operate virtually around the clock anddo not impose membership requirements. Our electronic OTC markets operate seven days a week for 23 hoursper day.
35

Financially- or cash-settled OTC contracts are classified as derivatives — meaning that the contract issettled through cash payments based on the value of the underlying commodity, rather than through physicaldelivery of the commodity. Physical contracts provide for settlement through physical delivery of theunderlying commodity. Physical contracts may be entered into for either immediate delivery of a commodity,in the cash or “spot” market, or for delivery of a commodity at a specified time in the future, in the “forward”market. Forward contract prices are generally based on the spot market prices of the underlying commodity,since long-term contracts evolve into short-term contracts over time.
Several types of contracts can be traded in the OTC market, including:
• Forwards and Swaps: A forward contract is an agreement between two parties to deliver or settle on aspecified quantity of an underlying asset, on a specified date, and at a specified location. Unlike futurescontracts discussed above, forward contracts are not always standardized, but can be negotiated on anindividual basis between counterparties. However, OTC cleared contracts are standardized contracts.Swaps generally are contracts between the holders of two different assets with differing risk andperformance profiles in which the risk or performance characteristics are exchanged. Swaps may besettled against the future price of a single commodity or against an index of commodity prices.
• Differentials and Spreads: Differentials, or basis swaps, are contracts that allow counterparties to“swap” delivery (or the financial equivalent of delivery) of a commodity between two different deliverypoints. For example, trading parties may enter into a basis swap for natural gas by swapping delivery ofnatural gas at the benchmark Henry Hub for delivery at any hub in North America. This type ofcontract allows market participants to hedge or speculate on forward natural gas prices in variousmarkets. The price of a basis swap contract is based on the price differential of deliveries at each hub.Spreads are the simultaneous purchase and sale of forward contracts for different months, differentcommodities or different grades of the same commodity.
• Options: Options are contracts that convey to the buyer the right, but not the obligation, to require theseller to make or take delivery of a stated quantity of a specified commodity at a specified price.Options may also be cash settled, based on the difference between the market price of the underlyingcommodity and the price of the commodity specified in the option.
Because bilateral OTC contracts are entered into and settled on a principal-to-principal basis, each partyis exposed to counterparty credit risk. Therefore, traditionally, OTC market participants have relied heavily ontheir internal risk management systems to monitor and mitigate counterparty credit and performance risk. Inrecent years, a growing number of markets, including ours, have begun to offer clearing for some of the morecommonly traded, standardized OTC contracts to address the risks associated with entering into bilateralagreements. Participants who choose to trade cleared OTC products must have an account with a FCM.
Industry Trends
We believe that the increasing interest in derivatives trading is being driven primarily by the followingkey factors:
• Growth in Electronic Trading: Innovations in technology have increased the speed of communicationsand the availability of information, which have enabled market participants to access and participate inthe commodities markets more easily and quickly and less expensively. During the last decade, the useof electronic trading has become increasingly prevalent, and offers a number of advantages relative tofloor-based trading. These include the ability to offer more contracts that on a floor, to increasedistribution, the benefits of the network-effect and increased speed and transparency.
• Lower Barriers to Entry for Market Participants: The barriers to entry for trading in derivatives havetraditionally been significant, which has limited the ability of many traders to participate in this market.In recent years, a considerable erosion of these barriers has occurred largely due to the availability ofelectronic trading. In addition to electronic trading, other changes in market structure contributing tolower barriers to entry include declining exchange membership fees, use of ISVs, and the introductionof cleared OTC contracts.
36

• Increasing Adoption of Energy Commodities as an Investable Asset Class: Investors’ interest incommodities as an asset class has experienced significant growth in recent years. A number of attributesinherent to commodities have contributed to this growth including higher volatility, geopolitical risk,low/negative correlation with other asset classes, asset diversification and attractive investment returns.
• New Market Participants: Recent growth in derivatives trading has been driven in part by increasedparticipation in derivatives markets by financial institutions, hedge funds, proprietary trading firms andinstitutional investors.
Available Information
Our principal executive offices are located at 2100 RiverEdge Parkway, Suite 500, Atlanta, Georgia30328. Our main telephone number is (770) 857-4700.
A copy of this Annual Report on Form 10-K, as well as any future Quarterly Reports on Form 10-Q,Current Reports on Form 8-K and any amendments to such reports are, or will be, available free of charge, onthe Internet at the Company’s website (www.theice.com) as soon as reasonably practicable after we file suchreports with, or furnish such reports to, the SEC. A copy of these filings is also available at the SEC’s website(www.sec.gov). The reference to our website address does not constitute incorporation by reference of theinformation contained on the website and should not be considered part of this report. Our reports, excludingexhibits, are also available free of charge by mail upon written request to our Secretary at the address listedabove.
In addition, we have posted on our website the charters for our (i) Audit Committee, (ii) CompensationCommittee and (iii) Nominating and Corporate Governance Committee, as well as our Code of Ethics andBusiness Conduct, Board of Directors Governance Principles, Board Communication Policy and GovernanceHotline. We will provide a copy of these documents without charge to stockholders upon request.
ITEM 1(A). RISK FACTORS
You should carefully consider the following risk factors, as well as other information contained in orincorporated by reference in this Annual Report on Form 10-K. The risks and uncertainties described beloware those that we currently believe may materially affect us. Other risks and uncertainties that we do notpresently consider to be material or of which we are not presently aware may become important factors thataffect our company in the future. If any of the risks discussed below actually occur, our business, financialcondition, operating results, or cash flows could be materially adversely affected.
Risks Relating to Our Business
We face intense competition that could materially and adversely affect our business. If we are not able tocompete successfully, our business will not survive.
The industry in which we operate is highly competitive and we expect competition to intensify in thefuture. Our current and prospective competitors, both domestically and internationally, are numerous.
We currently compete with:
• regulated futures exchanges globally that offer trading in a variety of markets, such as the CME Group;
• energy futures exchanges, such as NYMEX, European Energy Derivatives Exchange, or Endex(formerly known as Amsterdam Power Exchange), Nord Pool, and Powernext;
• other exchanges, such as the London International Financial Futures and Options Exchange, or LIFFE,which is part of NYSE Euronext, and regional exchanges, such as the Tokyo Grain Exchange and theBrazilian Mercantile and Futures Exchange, which provide trade execution in futures and optionscontracts on agricultural products such as sugar, coffee, canola and cocoa;
• voice brokers active in the global commodities markets;
37

• other electronic energy trading platforms for OTC markets, such as NYMEX Clearport and HoustonStreet;
• other clearing houses, including LCH.Clearnet, which presently clears futures trades for ICE FuturesEurope and ICE’s OTC contracts;
• market data and information vendors, such as Bloomberg, Reuters, Argus and Platts; and
• possible consortiums of customers and the above listed competitors that may pool their variouscompetitive advantages to establish a new exchange or trading platform.
The global derivatives industry has grown more competitive due to increasing consolidation and evolvingmarkets. We may also face additional competition from new entrants to our markets. Competition in themarket for derivatives trading has intensified in connection with the increase in electronic trading platforms.Competition will intensify if more exchanges are established, or if existing platforms or exchanges thatcurrently do not trade commodities products decide to do so. Additional competition from new entrants to ourmarkets could negatively impact our trading volumes and profitability.
In addition, some of the exchanges, trading systems, dealers and other companies with which we currentlyor in the future may compete are or may be substantially larger than us and have or may have substantiallygreater financial, technical, marketing, personnel and other resources and more diverse revenue streams thanwe do. Some of these exchanges and other businesses have long-standing, well-established and, in some cases,dominant positions in their existing markets. They may offer a broader range of products and services andmay take better advantage of business opportunities than we do.
Our ability to continually remain competitive with stronger current and potential competitors will have adirect impact on our results of operations. We cannot assure you that we will be able to compete effectively. Ifour markets, products and services are not competitive, our business, financial condition and operating resultswill be materially affected. Our business could also be materially affected if we fail to attract new customersor lose a substantial number of our current customers to competitors. In addition, even if new entrants orexisting competitors do not significantly erode our market share, we may be required to reduce significantlythe rates we charge for trade execution for certain contracts or market data to remain competitive, which couldhave a material adverse effect on our profitability.
One of our principal competitors is NYMEX, a regulated futures exchange that offers trading in futuresproducts and options on those futures in the crude oil, gas and metals markets, among other commodities marketsthat compete directly with some of our contracts. NYMEX has an agreement with CME under which CMEexclusively lists NYMEX energy contracts on its electronic trading platform. In addition, on January 28, 2008,CME and NYMEX announced that they are in discussions regarding CME’s potential acquisition of NYMEX.NYMEX’s electronic trading volume has surpassed the volume on its open outcry trading floor, which mayincrease the competition for trading in our electronic platform and negatively impact our trading volume and theliquidity in our markets.
Our business is primarily transaction-based, and declines in trading volumes and market liquidity wouldadversely affect our business and profitability.
We earn transaction fees for transactions executed in our markets and from the provision of electronictrade confirmation services. We derived 85.4%, 87.2% and 87.9% of our consolidated revenues for the yearsended December 31, 2007, 2006 and 2005, respectively, from our transaction-based business.
The success of our business depends on our ability to maintain and increase our trading volumes and theresulting transaction fees. Any decline in our trading volumes in the short-term or long-term will negativelyimpact our transaction fees and, therefore, our revenues. Accordingly, the occurrence of any event that reducesthe amount of transaction fees we receive, which may result from declines in trading volumes or marketliquidity, our decision to close the trading floor for futures contracts at the end of February 2008 for ICEFutures U.S.’s core soft agricultural commodity contracts, reductions in commission rates, regulatory changes,
38

rebates to customers, competition or otherwise, will have a significant impact on our operating results andprofitability.
Our business depends in large part on volatility in commodity prices generally and energy prices inparticular.
Participants in the markets for energy, soft agricultural and agricultural commodities trading pursue arange of trading strategies. While some participants trade in order to satisfy physical consumption needs,others seek to hedge contractual price risk or take speculative or arbitrage positions, seeking returns from pricemovements in different markets. Trading volume is driven primarily by the degree of volatility — themagnitude and frequency of fluctuations — in prices of commodities. Volatility increases the need to hedgecontractual price risk and creates opportunities for speculative or arbitrage trading. Commodities marketshistorically have experienced significant price volatility and in recent years reached record levels. We cannotpredict whether this pattern will continue, or for how long, or if this trend will reverse itself. Were there to bea sustained period of stability in the prices of commodities, we could experience lower trading volumes,slower growth or even declines in revenues.
In addition to price volatility, the increase in global energy prices, particularly for crude oil, during thepast several years may have had a positive impact on the trading volume of global energy commodities,including trading volumes in our markets. If global crude oil prices decrease or return to the lower levelswhere they historically have been, it is possible that many market participants could reduce their tradingactivity or leave the trading markets altogether. Global energy prices are determined by many factors,including those listed below, which are beyond our control and are unpredictable. Consequently, we cannotpredict whether global energy prices will remain at their current levels, and we cannot predict the impact thatthese prices will have on our future revenues or profitability.
Factors that are particularly likely to affect price volatility and price levels, and thus trading volumes,include:
• economic, political and market conditions in the United States, Europe, the Middle East and elsewherein the world;
• weather conditions, including hurricanes and other significant weather events, that impact the produc-tion of commodities, and, in the case of energy commodities, production, refining and distributionfacilities for oil and natural gas;
• the volatility in production volume of the commodities underlying our energy, soft agricultural andagricultural products and markets;
• war and acts of terrorism;
• legislative and regulatory changes;
• credit quality of market participants;
• the availability of capital;
• broad trends in industry and finance, including the consolidation in our industry;
• the level and volatility of interest rates;
• fluctuating exchange rates and currency values; and
• concerns over inflation.
Any one or more of these factors may reduce price volatility or price levels in the markets for derivativestrading generally and for commodity products in particular. Any reduction in price volatility or price levelscould reduce trading activity in those markets, including in our markets. Moreover, any reduction in tradingactivity could reduce liquidity — the ability to find ready buyers and sellers at current prices — which in turncould further discourage existing and potential market participants and thus accelerate any decline in the level
39

of trading activity in these markets. In these circumstances, the markets with the highest trading volumes, andtherefore the most liquidity, would likely have a growing competitive advantage over other markets. This couldput us at a greater disadvantage relative to our principal competitor and other competitors, whose markets arelarger and more established than ours.
We cannot predict whether or when these unfavorable conditions may arise in the future or, if they occur,how long or severely they will affect trading volumes. A significant decline in our trading volumes due toreduced volatility, lower prices or any other factor, could have a material adverse effect on our revenues sinceour transaction fees would decline and on our profitability since our revenues would decline faster than ourexpenses, some of which are fixed. Moreover, if these unfavorable conditions were to persist over a lengthyperiod of time and trading volumes were to decline substantially and for a long enough period, the liquidity ofour markets, and the critical mass of transaction volume necessary to support viable markets, could bejeopardized.
Our revenues have depended heavily upon trading volume in the markets for ICE Brent Crude, ICE WTICrude and ICE Gas Oil futures contracts, and OTC North American natural gas and power contracts. Inaddition, with the acquisition of ICE Futures U.S. in January 2007, sugar futures and options on sugarfutures contracts have added to ICE’s trading volumes. A decline in volume or in our market share inthese contracts would jeopardize our ability to remain profitable and grow.
Our revenues currently depend heavily on trading volume in the markets for ICE Brent Crude futurescontracts, ICE WTI Crude futures contract, ICE Gas Oil futures contracts, sugar futures and options on sugarfutures contracts, OTC North American natural gas contracts and OTC North American power contracts.Trading in these contracts in the aggregate has represented 73.0% of our consolidated revenues for the mostrecent annual period.
Our trading volume or market share in these markets may decline due to a number of factors, including:
• development of competing contracts, and competition generally;
• reliance on technology to conduct trading;
• the relative stability of commodity prices;
• reduced growth in mature commodity markets;
• increased availability of electronic trading on competing contracts;
• possible regulatory changes; and
• adverse publicity and government investigations.
A decline in trading volume would have a negative impact on our operating results and profitability.
A decline in the production of commodities traded in our markets could reduce our liquidity andadversely affect our revenues and profitability.
We derived 84.3%, 86.1% and 86.9% of our consolidated revenues for the years ended December 31,2007, 2006 and 2005, respectively, from exchange fees and commission fees generated from trading incommodity products in our futures and OTC markets. The volume of contracts traded in the futures and OTCmarkets for any specific commodity tends to be a multiple of the physical production of that commodity. Ifthe physical supply or production of any commodity declines, market participants could become less willing totrade in contracts based on that commodity. For example, ICE Brent Crude futures contract has been subject tothis risk as production of Brent crude oil peaked in 1984 and began steadily falling in subsequent years. We,in consultation with market participants, altered the mechanism for settlement of ICE Brent Crude futurescontract to a mechanism based on the Brent/Forties/Oseberg North Sea oil fields, known as the BFO Index, toensure that the commodity prices on which its settlement price is based reflect a large enough pool of tradersand trading activity so as to be less susceptible to manipulation. Market participants that trade in ICE Brent
40

Crude futures contract may determine in the future, however, that additional underlying commodity productsneed to be considered in the settlement of that contract or that the settlement mechanism is not credible.
Exchange fees earned from trading in ICE Brent Crude futures contract accounted for 47.6%, 50.5% and68.8% of our total revenues from our energy futures business, net of intersegment fees, for the years endedDecember 31, 2007, 2006 and 2005, respectively, or 15.2%, 20.4% and 26.5% of our consolidated revenuesfor the years ended December 31, 2007, 2006 and 2005, respectively. Any uncertainty concerning thesettlement of ICE Brent Crude futures contract, or a decline in the physical supply or production of any othercommodity on which our trading products are based could result in a decline in trading volumes in ourmarkets, adversely affecting our revenues and profitability.
In connection with our strategy to form a wholly-owned European clearing house, we served notice toterminate our clearing arrangements with LCH.Clearnet, which currently provides clearing services forthe trading of certain futures and cleared OTC contracts in our markets. We cannot offer our futures andcleared OTC products without clearing services, and any delay in commencing our European clearingoperations at ICE Clear Europe could result in a disruption to our business or materially and adverselyaffect our financial condition and results of operations.
On July 18, 2007, we provided LCH.Clearnet with written notice of our intent to terminate ourcontractual arrangements pursuant to which LCH.Clearnet currently provides clearing services to us for allenergy futures contracts and cleared OTC contracts traded in our markets. As provided in our notice oftermination, these services will terminate on a mutually agreed upon date or in July 2008.
As previously announced, we intend to expand our clearing operations globally by establishing a wholly-owned clearing house in Europe, to be named ICE Clear Europe, through which we intend to clear our energyfutures contracts and cleared OTC contracts. The successful establishment of ICE Clear Europe is subject to anumber of risks and uncertainties, including obtaining appropriate regulatory approvals in the U.K., buildingout or procuring appropriate clearing house technology and integrating that technology with ICE FuturesEurope and our OTC business, and ultimately the acceptance of the clearing house by FCMs and our tradingparticipants who will be the users of the clearing house. In addition, our competitors, who for this purposewould include LCH.Clearnet, may attempt to interfere with the transition of clearing to ICE Clear Europe ortake advantage of any issues or delays that occur with the clearing transition. In particular, LCH.Clearnet maybreach its clearing services agreements with us or attempt to legally challenge portions of the clearing servicesagreements that we believe obligate LCH.Clearnet to refrain from amalgamating, transferring or permittingcredit offset for margin purposes with respect to our contracts or they may attempt to interfere with thetransition of customer business to a new clearing house. Further, we may be forced to seek legal action againstLCH.Clearnet to enforce our rights under the clearing services agreements, which may disrupt our plans forproviding clearing services.
We cannot assure you that we will be able to obtain regulatory approval for ICE Clear Europe, that wewill execute our business plan in a timely manner or that there will be no issues, whether operationally or dueto the actions of competitors, with the transition of clearing to ICE Clear Europe. If our clearing services aredelayed, suspended or interrupted, our business, financial condition and results of operations would bematerially and adversely affected. For the years ended December 31, 2007, 2006 and 2005, transaction feesgenerated by our U.K. futures business, which are also referred to as exchange fees, accounted for 31.1%,39.3% and 36.7%, respectively, of our consolidated revenues.
In addition, if ICE Clear Europe, or our existing clearing operations at ICE Clear U.S. or ICE ClearCanada, are not able to provide clearing services relating to our OTC business following the termination ofour agreements with LCH.Clearnet, we may be unable to offer clearing services in connection with tradingcertain OTC contracts in our markets for a considerable period of time. For the years ended December 31,2007, 2006 and 2005, transaction fees derived from trading in cleared OTC contracts accounted for 29.2%,38.6% and 37.5%, respectively, of our consolidated revenues. Our cleared OTC contracts have been asignificant component of our business, and accounted for 69.3%, 71.8% and 69.3% of revenues, net of the
41

intersegment fees, generated by our OTC business for the years ended December 31, 2007, 2006 and 2005,respectively.
Legislation or regulatory changes preventing clearing facilities from being owned or controlled byexchanges may limit or stop our ability to run a clearing house.
Many clearing firms have emphasized the importance to them of centralizing clearing of futures contractsand options on futures in order to maximize the efficient use of their capital, exercise greater control over theirvalue at risk and extract greater operating leverage from clearing activities. Many have expressed the view thatclearing firms should have a choice of where to clear their transactions or should control the governance ofclearing houses. In addition, some clearing firms have expressed the view that multiple clearing houses shouldbe consolidated and operated as utilities rather than as for-profit enterprises. Some of these firms, along withthe Futures Industry Association and UK Futures and Options Associations, are attempting to cause legislativeor regulatory changes to be adopted that would allow market participants to transfer positions from anexchange-owned clearing house (such as ICEClear Europe) to a clearing house owned and controlled byclearing firms. Some market participants, including the UK Futures and Options Association, have expressedsupport for extending the European Union Code of Clearing and Conduct to derivatives, which would mandateclearing choice for customers through interoperability. In addition, the U.S. Department of Justice releasedcomments on February 7, 2008 requesting the U.S. Department of Treasury to review futures markets todetermine if a different regime for clearing is feasible, which could include ending exchange control offinancial futures clearing to foster exchange competition. The Department of Justice comments specificallyexcluded markets for commodities futures, such as energy futures markets. If these legislative or regulatorychanges are adopted, alternative clearing houses may seek to clear positions established on our exchanges.Even if they are not successful in their efforts, the factors described above may cause clearing firms to limitthe use of our clearing houses. If any of these events occur, our revenues and profits would be materially andadversely affected.
Owning clearing houses exposes us to risks, including risks related to the cost of operating the clearinghouses and the risk of defaults by our participants clearing trades through our clearing houses.
Operating clearing houses requires material ongoing expenditures and may consume a significant portionof management’s time. We cannot assure you that our participants will migrate their business fromLCH.Clearnet to ICE Clear Europe. In addition, we cannot assure you that our clearing arrangements will besatisfactory to our participants or will not require additional substantial system modifications to accommodatethem in the future. The transition to new clearing facilities for many of our participants could be disruptiveand costly. Our operation of clearing houses may not be as successful and may not provide us the benefits weanticipate. In addition, our operation of these clearing houses may not generate sufficient revenues to cover theexpenses we incur.
There are risks inherent in operating a clearing house, including exposure to the credit risk of clearingmembers and defaults by clearing members, which could subject our business to substantial losses. Althoughour clearing houses have policies and procedures to help ensure that clearing members can satisfy theirobligations (and ICE Clear Europe will adopt comparable policies and procedures), such policies andprocedures may not succeed in preventing defaults. We also have in place or plan to establish, as appropriate,various measures intended to enable our clearing houses to cover any default and maintain liquidity, such asdeposits in a guaranty fund. However, we cannot assure you that these measures and safeguards will besufficient to protect us from a default or that we will not be materially and adversely affected in the event of asignificant default. Additionally, the default of any one of the clearing members could cause our customers tolose confidence in the guarantee of our clearing houses, which would have an adverse affect on our business.
42

Currently, we continue to rely on LCH.Clearnet to provide clearing services for the trading of certain futuresand cleared OTC contracts in our markets despite owning ICE Clear U.S., ICE Clear Canada and formingICE Clear Europe. We cannot operate our futures and cleared OTC businesses without clearing services.
The termination of the contract with LCH.Clearnet will take effect at the end of the exit phase, which iscurrently expected to be in July 2008. Currently, we continue to rely on LCH.Clearnet to provide clearingservices to us for all energy futures contracts traded in our markets.
ICE Clear U.S. will continue to serve as the designated clearing house for trades executed at ICE FuturesU.S. and ICE Clear Canada will continue to provide clearing service for trades executed at ICE FuturesCanada. ICE Clear U.S. is seeking recognition from the FSA to be allowed to provide clearing services in theUnited Kingdom, for an exchange like ICE Futures Europe. ICE Clear Canada is not currently authorized byUnited Kingdom regulators to clear transactions executed on an exchange located in the United Kingdom.Consequently, these clearing houses are not currently able to clear trades in the United Kingdom until theyobtain such recognition, which could take considerable time and resources, but they may offer certain clearingservices as an “overseas person” under United Kingdom laws. There is no assurance that such recognition willbe granted.
If our clearing services are suspended or interrupted and we are unable to provide clearing services to ourcustomers through an alternate provider on a timely basis, our business, financial condition and results ofoperations would be materially and adversely affected. If ICE Clear U.S. and ICE Clear Canada could notprovide clearing services for our energy futures or OTC products, we could not obtain clearing services froman alternate provider, or ICE Clear Europe was unable to provide such services, we may be unable to operatecertain of our energy futures and OTC markets and would possibly be required to cease operations in thosesegments of our business. We cannot assure you that our energy futures or OTC businesses would be able toobtain clearing services from ICE Clear U.S. or ICE Clear Canada, an alternate provider or ICE Clear Europein sufficient time to avoid or mitigate the material adverse effects described above and, in the case of analternate provider, on acceptable terms.
We intend to explore acquisition opportunities and strategic alliances relating to other businesses, productsor technologies. We may not be successful in identifying opportunities or integrating other businesses,products or technologies successfully with our business. Any such transaction also may not produce theresults we anticipate.
We intend to continue to explore and pursue acquisition opportunities to strengthen our business and growour company. We may enter into business combination transactions, make acquisitions or enter into strategicpartnerships, joint ventures or alliances, any of which may be material. We may enter into these transactionsto acquire other businesses, products or technologies to expand our products and services, advance ourtechnology or take advantage of new developments and potential changes in the industry.
The market for acquisition targets and strategic alliances is highly competitive, particularly in light ofincreasing consolidation in the exchange sector. As a result, we may be unable to identify strategicopportunities or we may be unable to negotiate or finance any future acquisition successfully. Further, ourcompetitors could merge, making it more difficult for us to find appropriate entities to acquire or merge withand making it more difficult to compete in our industry due to the increased resources of our mergedcompetitors. For example, on January 28, 2008, CME and NYMEX announced that they are in discussionsregarding CME’s potential acquisition of NYMEX.
The process of integration may produce unforeseen regulatory and operating difficulties and expendituresand may divert the attention of management from the ongoing operation of our business. Further, as a result ofany future acquisition, we may issue additional shares of our common stock that dilute shareholders ownershipinterest in us, expend cash, incur debt, assume contingent liabilities or create additional expenses related toamortizing intangible assets with estimable useful lives, any of which could harm our business, financialcondition or results of operations and negatively impact our stock price.
43

We may fail to realize the anticipated cost savings, growth opportunities and synergies and other benefitsanticipated from our mergers and acquisitions, which could adversely affect the value of our commonstock.
We completed multiple acquisitions in 2007, including transactions with NYBOT (ICE Futures U.S.),Winnipeg Commodity Exchange, Inc. (ICE Futures Canada), Chatham Energy Partners, LLC, ChemConnectInc., and Commoditrack, Inc (ICE Risk). The success of our mergers and acquisitions will depend, in part, onour ability to realize the anticipated synergies and growth opportunities from combining the businesses, as wellas our expected cost savings and revenue growth trends. In general, we expect to benefit from operationalsynergies resulting from the consolidation of capabilities and elimination of redundancies in our mergers andacquisitions. If we fail to successfully integrate an acquired business, or if the reason we acquired the businessis materially impacted, we may be required to take an impairment charge on our financial statements, whichcould negatively impact our stock price.
With respect to the ICE Futures U.S. acquisition, we expect continued operational synergies from the useof ICE Futures U.S.’s clearing technology, as well as greater efficiencies from increased scale, marketintegration and increased automation. Management also expects the combined entity will enjoy revenuesynergies, including additional clearing alternatives; expense sharing; increased access, volume and liquidity tothe products traded on our respective markets; and expanded product offerings and increased geographic reach.
Integration of companies acquired by us is complex and time consuming, and requires substantialresources and effort. We must successfully combine the businesses in a manner that permits the expected costsavings and synergies to be realized. In addition, we must achieve the anticipated savings and synergieswithout adversely affecting current revenues and our investments in future growth. The integration process andother disruptions resulting from the mergers or acquisitions may also disrupt each company’s ongoingbusinesses or cause inconsistencies in standards, controls, procedures and policies that adversely affect ourrelationships with market participants, employees, regulators and others with whom we have business or otherdealings or our ability to achieve the anticipated benefits of the merger or acquisition. In addition, difficultiesin integrating the businesses or any negative impact on the regulatory functions of any of our companies couldharm the reputation of the companies. We may not successfully achieve the integration objectives, and we maynot realize the anticipated cost savings, revenue growth and synergies in full or at all, or it may take longer torealize them than expected.
We are currently subject to regulation in multiple jurisdictions. Failure to comply with existing regulatoryrequirements, and possible future changes in these requirements or in the current interpretation of theserequirements, could adversely affect our business.
ICE Futures Europe, through which we conduct our energy futures business, operates as a RecognizedInvestment Exchange in the United Kingdom. As a Recognized Investment Exchange, ICE Futures Europe hasregulatory responsibility in its own right and is subject to supervision by the FSA pursuant to the FinancialServices and Markets Act 2000, or FSMA. ICE Futures Europe is required under the FSMA to maintainsufficient financial resources, adequate systems and controls and effective arrangements for monitoring anddisciplining its members. Likewise, ICE Futures U.S. operates as a Designated Contract Market. As a self-regulatory organization, it is responsible for ensuring that the exchange operates in accordance with existingrules and regulations, and must comply with eighteen core principles under the CEA. The ability of ICEFutures Europe and ICE Futures U.S. to comply with all applicable laws and rules is largely dependent on itsmaintenance of compliance, audit and reporting systems. We cannot assure you that these systems andprocedures are fully effective. Failure to comply with current regulatory requirements and regulatoryrequirements that may be imposed on us in the future could subject us to significant penalties, includingtermination of our ability to conduct our regulated energy futures business conducted through ICE FuturesEurope and our regulated soft commodities business through ICE Futures U.S.
Electronic trading in our energy futures contracts on ICE Futures Europe is permitted in manyjurisdictions, including in the United States, through “no-action” relief from the local jurisdiction’s regulatoryrequirements. In the United States, direct electronic access to trading in ICE Futures Europe products is
44

offered to U.S. persons based on a series of no-action letters from the CFTC that permit non-U.S. exchanges,referred to as foreign boards of trade, to provide U.S. persons with electronic access to their markets withoutregistration with the CFTC. Our ability to offer new futures products under our existing no-action relief couldbe impacted by any actions taken by the CFTC as a result of future conditions being imposed on ICE FuturesEurope under its no-action relief. If our offering of products through ICE Futures Europe to U.S. participantsis subject to additional regulatory constraints, our business could be adversely affected. Similarly, electronictrading in ICE Futures U.S. contracts is permitted in many jurisdictions through “no-action” relief from thelocal jurisdiction’s regulatory requirements. With the proposed end of open outcry trading of ICE FuturesU.S. futures contracts scheduled for February 2008, the ability of ICE Futures U.S. to offer trading in futuresproducts in multiple jurisdictions will be dependent upon its ability to comply with the existing conditions ofits no-action relief in various jurisdictions and any new conditions that may be added.
New regulations or enforcement may force us to allocate more resources to regulation or confidence inour markets may be diminished and our business may be adversely affected. Even the perception of unfairnessor illegal behavior in our markets could adversely affect our business. In addition, the recent demise of certainhedge funds that traded energy commodities may result in additional regulation by the CFTC or Congress.Legislative and regulatory initiatives, either in the United States, the United Kingdom or elsewhere, couldaffect one or more of the following aspects of our business or impose one or more of the followingrequirements:
• the manner in which we communicate with and contract with our participants;
• the demand for and pricing of our products and services;
• the tax treatment of trading in our products;
• a requirement that we maintain minimum regulatory capital on hand;
• a requirement that we exercise regulatory oversight of our OTC participants, and assume responsibilityfor their conduct;
• our financial and regulatory reporting practices;
• our record-keeping and record-retention procedures;
• the licensing of our employees; and
• the conduct of our directors, officers, employees and affiliates.
The implementation of new regulations, or changes in or unfavorable interpretations of existingregulations by courts or regulatory bodies could require us to incur significant compliance costs and impedeour ability to operate, expand and enhance our electronic platform as necessary to remain competitive andexpand our business. Regulatory changes inside or outside the United States or the United Kingdom couldmaterially and adversely affect our business, financial condition and results of operations.
The nature and role of ICE Futures U.S.’s self-regulatory responsibilities may change.
Some financial services regulators have publicly stated their interest in evaluating the ability of a financialexchange, organized as a for-profit corporation, to adequately discharge its self-regulatory responsibilities. ICEFutures U.S.’s regulatory programs and capabilities contribute significantly to its brand name and reputation.We cannot assure you that ICE Futures U.S. will not be required to further modify or restructure its corporategovernance or regulatory functions in order to address these or other concerns. For example, the CFTCadopted, but recently stayed implementation of, final rules to minimize conflicts of interest on Boards ofDirectors of registered, futures exchanges, or designated contract markets. The new rules provided a safeharbor to designated contract markets that had at least 35% of their board of directors comprised of personswith no material relationship to the designated contract market or its members and were deemed to be “publicdirectors.” While the rules regarding conflicts of interest that were stayed would not likely result in costly orburdensome changes at ICE Futures U.S., implementation of such rules could alter the composition of ICE
45

Futures U.S.’s Board of Directors if implemented. Any future new rules, modifications of existing rules orrestructuring of regulatory functions could entail material costs.
The energy commodities trading industry in North America has been subject to increased regulatory scrutinyin the recent past, and we face the risk of changes to our regulatory environment in the future, which maydiminish trading volumes on our electronic platform.
We currently operate our OTC markets as an “exempt commercial market” under the CEA. As such, ourmarkets are subject to anti-fraud, anti-manipulation, access, reporting and record-keeping requirements of theCFTC. However, unlike a futures exchange, ICE is not itself a self regulatory organization that undertakesactive regulatory oversight of OTC trading. In December, the United States Senate and the United StatesHouse of Representatives each passed legislation to increase regulation of OTC markets, and in particular torequire active oversight of certain contracts traded on “exempt commercial markets” that are deemed by theCFTC to be “significant price discovery contracts.” Both bills require OTC electronic trading facilities toassume self regulatory responsibilities, such as market monitoring and establishing position limits or account-ability limits, over contracts that serve a significant price discovery function. If adopted, this legislation wouldrequire us and our OTC participants to operate under heightened regulatory burdens and incur additional costs,including recordkeeping and reporting costs, to comply with the additional regulations, and could deter someparticipants from trading on our OTC platform. Presently, we anticipate that our OTC Henry Hub natural gascontract, which comprised 73.4%, 81.6%, and 76.5% of our OTC transaction volumes in 2007, 2006, and2005, respectively, would be considered a “significant price discovery contract.”
In addition, the market for OTC energy commodities trading has been the subject of increased scrutiny byregulatory and enforcement authorities due to a number of highly publicized incidents alleging manipulativetrading activity by certain entities and the failure of several hedge funds.
Furthermore, in response to the rise in energy commodity prices in recent years and allegations thatmanipulative trading practices by certain market participants may have contributed to the rise in prices,legislative and regulatory authorities at both the federal and state levels, as well as political and consumergroups, have called for increased regulation and monitoring of the OTC energy commodities markets and areview of the no-action process pursuant to which ICE Futures’ contracts are presently offered to marketparticipants in the United States.
It is possible that future unanticipated events in the markets for energy commodities trading will lead toadditional regulatory scrutiny and changes in the level of regulation to which we are subject. Increasedregulation of our participants or our markets could materially adversely affect our business. The imposition ofstabilizing measures such as price controls in energy commodities markets could substantially reduce orpotentially even eliminate trading activity in affected markets. New laws and rules applicable to us couldsignificantly increase our regulatory compliance costs, delay or prevent us from introducing new products andservices as planned and discourage some market participants from using our electronic platform. Allegationsof manipulative trading by market participants or additional failures of hedge funds could subject us toregulatory scrutiny and possibly fines or restrictions on our business, as well as significant legal expenses andadverse publicity. All of this could lead to lower trading volumes, liquidity and transaction fees, higheroperating costs and lower profitability or losses.
If we are unable to keep up with rapid changes in technology and participant preferences, we may not beable to compete effectively.
To remain competitive, we must continue to enhance and improve the responsiveness, functionality,accessibility and reliability of our electronic platform and our proprietary technology. The financial servicesindustry is characterized by rapid technological change, change in use patterns, change in client preferences,frequent product and service introductions and the emergence of new industry standards and practices. Thesechanges could render our existing proprietary technology uncompetitive or obsolete. Our ability to pursue our
46

strategic objectives, including increasing trading volumes on our trading platforms, as well as our ability tocontinue to grow our business, will depend, in part, on our ability to:
• enhance our existing services and maintain and improve the functionality and reliability of ourelectronic platform, in particular, reducing network downtime or disruptions;
• develop or license new technologies that address the increasingly sophisticated and varied needs of ourparticipants;
• anticipate and respond to technological advances and emerging industry practices on a cost-effectiveand timely basis; and
• continue to attract and retain highly skilled technology staff to maintain and develop our existingtechnology and to adapt to and manage emerging technologies while attempting to keep our employeeheadcount low.
We cannot assure you that we will successfully implement new technologies or adapt our proprietarytechnology to our participants’ requirements or emerging industry standards in a timely and cost-effectivemanner. Any failure to remain abreast of industry standards in technology and to be responsive to participantpreferences could cause our market share to decline and negatively impact our profitability.
Our operating results may be subject to significant fluctuations due to a number of factors.
A number of factors beyond our control may contribute to substantial fluctuations in our operating results.As a result of the factors described in the preceding risk factors, you will not be able to rely on our historicaloperating results in any particular period as an indication of our future performance. The commodities tradingindustry, and energy commodities trading in particular, has historically been subject to variability in tradingvolumes due primarily to five key factors. These factors include:
• geopolitical events,
• weather,
• real and perceived supply and demand imbalances in the underlying commodities,
• the number of trading days in a quarter, and
• seasonality.
As a result of one or more of these factors, trading volumes in our markets could decline, possiblysignificantly, which would adversely affect our revenues derived from transaction fees. If we fail to meetsecurities analysts’ expectations regarding our operating performance, the price of our common stock coulddecline substantially.
Our cost structure is largely fixed in the short-term period. If our revenues decline and we are unable toreduce our costs, or if our expenses increase without a corresponding increase in revenues, our profitabilitywill be adversely affected.
Our cost structure is largely fixed and we expect that it will continue to be largely fixed. We base ourexpectations of our cost structure on historical and expected levels of demand for our products and services aswell as our fixed operating infrastructure, such as computer hardware and software, leases, hosting facilitiesand security and staffing levels. If demand for our products and services declines and, as a result, our revenuesdecline, we may not be able to adjust our cost structure on a timely basis. In that event, our profitability willbe adversely affected.
Fluctuations in currency exchange rates may adversely affect our operating results.
The revenues, expenses and financial results of ICE Futures Europe and other U.K. subsidiaries havehistorically been denominated in pounds sterling, which was the functional currency of our U.K. subsidiaries.As a result, we had foreign currency translation risk equal to our net investment in our U.K. subsidiaries. The
47

financial statements of our U.K. subsidiaries were translated into U.S. dollars using current rates of exchange,with gains or losses included in the cumulative translation adjustment account, a component of shareholders’equity. Effective as of July 1, 2006, the functional currency of the majority of our U.K. subsidiaries becamethe U.S. dollar. The decision to change the functional currency of these entities was based on variouseconomic factors and circumstances, including the fact that beginning in the second quarter of 2006, ICEFutures Europe began to charge and collect exchange fees in U.S. dollars rather than pounds sterling in its keyfutures contracts, including crude oil and heating oil contracts. The functional currency of an entity is thecurrency of the primary economic environment in which the entity operates. We will no longer recognize anytranslation adjustments relating to those U.K. subsidiaries that have switched their functional currency to theU.S. dollar.
The revenues, expenses and financial results of ICE Futures Canada and other Canadian subsidiaries aredenominated in Canadian dollars. We have foreign currency translation risk equal to our net investment in ourCanadian subsidiaries. The financial statements of our Canadian subsidiaries were translated into U.S. dollarsusing current rates of exchange, with gains or losses included in the cumulative translation adjustment account, acomponent of shareholders’ equity. As of December 31, 2007, the portion of our shareholders’ equity attributableto accumulated other comprehensive income from foreign currency translation was $33.0 million. The period-endforeign currency exchange rate for the Canadian dollar to the U.S. dollar increased from 1.0515 as of August 27,2007, the acquisition date of ICE Futures Canada, to 0.9881 as of December 31, 2007.
We have foreign currency transaction risk primarily related to the settlement of certain foreign assets,liabilities and payables that occur through our foreign operations which are received in or paid in poundssterling. We had foreign currency transaction gains (losses) of $842,000, ($288,000) and $1.5 million for theyears ended December 31, 2007, 2006 and 2005, respectively, primarily attributable to the fluctuations of poundssterling relative to the U.S. dollar. The average exchange rate of pounds sterling to the U.S. dollar increasedfrom 1.8434 for the year ended December 31, 2006 to 2.0020 for the year ended December 31, 2007.
We may experience substantial gains or losses from foreign currency transactions in the future given thatthere are still certain net assets or net liabilities and expenses of our subsidiaries that are denominated inpounds sterling and Canadian dollars. Of our consolidated operating expenses, 15.2%, 29.8% and 48.1% weredenominated in pounds sterling for the year ended December 31, 2007, 2006 and 2005, respectively. As thepounds sterling exchange rate changes, the U.S. equivalent of expenses denominated in foreign currencieschanges accordingly. All sales in our business are denominated in U.S. dollars, except for some small futurescontracts in our futures business segment. Our U.K. operations in some instances function as a natural hedgebecause we generally hold an equal amount of monetary assets and liabilities that are denominated in poundssterling.
While we may enter into hedging transactions in the future to help mitigate our foreign exchange riskexposure, these hedging arrangements may not be effective, particularly in the event of imprecise forecasts ofthe levels of our non-U.S. denominated assets and liabilities. Accordingly, if there is an adverse movement inexchange rates, we may suffer significant losses, which would adversely affect our operating results andfinancial condition.
Any infringement by us of intellectual property rights of others could result in litigation and adverselyaffect our ability to continue to provide, or increase the cost of providing, our products and services.
Patents and other intellectual property rights are increasingly important as further electronic componentsare added to trading, and patents and other intellectual property rights of third parties may have an importantbearing on our ability to offer certain of our products and services. Our competitors, as well as othercompanies and individuals, may have obtained, and may be expected to obtain in the future, patent rightsrelated to the types of products and services we offer or plan to offer. We cannot assure you that we are orwill be aware of all patents that may pose a risk of infringement by our products and services. In addition,some patent applications in the United States are confidential until a patent is issued, and therefore we cannotevaluate the extent to which our products and services may be covered or asserted to be covered in pending
48

patent applications. Thus, we cannot be sure that our products and services do not infringe on the rights ofothers or that others will not make claims of infringement against us.
In addition, our competitors may claim other intellectual property rights over information that is used byus in our product offerings. For example, in November 2002, NYMEX filed claims against us in theU.S. District Court for the Southern District of New York asserting that, among other things, it infringedcopyrights NYMEX claims exist in its publicly available settlement prices that we use in connection with theclearing of certain OTC derivative contracts. The court granted a motion for summary judgment in our favorin September 2005 dismissing all claims brought against us by NYMEX. NYMEX appealed the ruling of theDistrict Court to the Second Circuit Court of Appeals, and the Court of Appeals Affirmed the ruling of theDistrict Court by decision on August 1, 2007. On August 15, 2007, NYMEX filed a Combined Petition forPanel Rehearing and Rehearing En Banc, requesting that the case be reheard before the Second Circuit Courtof Appeals. On October 25, 2007, the Second Circuit Court of Appeals denied NYMEX’s Combined Petitionfor a rehearing. On January 16, 2008, NYMEX filed a writ of certiorari with the U.S. Supreme Court seekingdiscretionary review of the case, and the U.S. Supreme Court has not yet decided whether to hear the case.Should NYMEX be successful in its appeal to the Supreme Court and we are subsequently found to haveinfringed NYMEX’s intellectual property rights, we may incur substantial monetary damages and may beenjoined from using or referring to one or more types of NYMEX settlement prices. If we are so enjoined, wecould lose all or a substantial portion of our cleared trading volume in Henry Hub natural gas and WTI crudeoil contracts and the related commission revenues. Our OTC Henry Hub natural gas contract comprised35.0%, 47.8%, and 45.6% of our total transaction volumes in 2007, 2006, and 2005, respectively, and our ICEFutures Europe WTI Crude futures contract comprised 14.0% and 12.8% of our total transaction volumes in2007 and 2006, respectively.
With respect to our intellectual property, if one or more of our products or services is found to infringepatents held by others, it may be required to stop developing or marketing the products or services, obtainlicenses to develop and market the products or services from the holders of the patents or redesign theproducts or services in such a way as to avoid infringing the patents. We also could be required to paydamages if we were found to infringe patents held by others, which could materially adversely affect ourbusiness, financial condition and operating results. We cannot assess the extent to which we may be requiredin the future to obtain licenses with respect to patents held by others, whether such licenses would be availableor, if available, whether it would be able to obtain such licenses on commercially reasonable terms. If we wereunable to obtain such licenses, we may not be able to redesign our products or services at a reasonable cost toavoid infringement, which could materially adversely affect our business, financial condition and operatingresults.
Some of the proprietary technology we employ may be vulnerable to infringement by others.
Our business is dependent on proprietary technology and other intellectual property that we own orlicense from third parties. Despite precautions we have taken or may take to protect our intellectual propertyrights, third parties could copy or otherwise obtain and use our proprietary technology without authorization. Itmay be difficult for us to monitor unauthorized use of our intellectual property. We cannot assure you that thesteps that we have taken will prevent misappropriation of our proprietary technology or intellectual property.
We have filed patent applications in the U.S. and in other jurisdictions on a number of aspects of ourelectronic trading system and trade confirmation systems. In addition, we have licenses under two U.S. patentsfor trading electric energy, and two joint U.S. patents with NYMEX covering an implied market tradingsystem. We have also filed patent applications on certain aspects of our electronic trading and tradeconfirmation systems in the European Patent Office and Canada. We cannot assure you that we will obtain anyfinal patents covering these services, nor can we predict the scope of any patents issued. In addition, wecannot assure you that any patent issued will be effective to protect this intellectual property againstmisappropriation. Third parties in Europe or elsewhere could acquire patents covering this or other intellectualproperty for which we obtain patents in the United States, or equivalent intellectual property, as a result ofdifferences in local laws affecting patentability and patent validity. Third parties in other jurisdictions mightalso misappropriate our intellectual property rights with impunity if intellectual property protection laws are
49

not actively enforced in those jurisdictions. Patent infringement and/or the grant of parallel patents woulderode the value of our intellectual property.
We have secured trademark registrations for “IntercontinentalExchange” and “ICE” from the United StatesPatent and Trademark Office and from relevant agencies in Europe, as appropriate, with “ICE” also beingregistered in Singapore, as well as registrations for other trademarks used in our business. We also haveseveral U.S. and foreign applications pending for other trademarks used in our business. We cannot assure youthat any of these marks for which applications are pending will be registered.
In addition, we may have to resort to litigation to enforce our intellectual property rights, protect ourtrade secrets, and determine the validity and scope of the intellectual property rights of others or defendourselves from claims of infringement. We may not receive an adequate remedy for any infringement of ourintellectual property rights, and we may incur substantial costs and diversion of resources and the attention ofmanagement as a result of litigation, even if we prevail. As a result, we may choose not to enforce ourinfringed intellectual property rights, depending on our strategic evaluation and judgment regarding the bestuse of our resources, the relative strength of our intellectual property portfolio and the recourse available to us.
We face significant challenges in implementing our strategic goals of expanding product and serviceofferings and attracting new market participants to our markets. If we do not meet these challenges, wemay not be able to increase our revenues or remain profitable.
We seek to expand the range of derivative products that can be traded in our markets and to ensure thattrading in those new products becomes liquid within a sufficiently short period of time to support viabletrading markets. We also seek to expand the number of contracts traded in our futures markets. In meetingthese strategic goals, however, we face a number of significant challenges, including:
• Prior to launching a new contract, we must satisfy certain regulatory obligations, which if not satisfiedcould delay the launch of the new contract.
• When we expand our product offering through a merger or acquisition, we may need to introduce theICE trading platform to customers that have historically conducted business by telephone or on adifferent exchange. The process of transitioning customers to our electronic platform can be timeconsuming and expensive and if not ultimately accepted, could substantially impair or render worthlessthe assets we acquired through the merger or acquisition.
• We must meet regulatory obligations and overcome any technical or operational issues to successfullyimplement our clearing strategy.
• To expand the use of our electronic platform to additional participants and contracts, we must continueto expand capacity without disrupting functionality to satisfy evolving customer requirements.
• To introduce new trading-related services, we must develop additional systems technology that willinterface successfully with the wide variety of unique internal systems used by our participants. Thesechallenges may involve unforeseen costs and delays.
• We must continue to build significant brand recognition among commodities market participants inorder to attract new participants to our markets. This will require us to increase our marketingexpenditures. The cost of our marketing efforts may be greater than we expect, and we cannot assureyou that these efforts will be successful.
Even if we resolve these issues and are able to introduce new products and services, there is no assurancethat they will be accepted by our participants, attract new market participants, or be competitive with thoseoffered by other companies. If we do not succeed in these efforts on a consistent, sustained basis, we will beunable to implement our strategic objectives. This would seriously jeopardize our ability to increase anddiversify our revenues, remain profitable and continue as a viable competitor in our markets.
50

Reductions in our exchange fee rates or commission rates resulting from competitive pressures couldlower our revenues and profitability.
We may experience pressure on our exchange fee rates and commission rates as a result of competitionwe face in our futures and OTC markets. Some of our competitors offer a broader range of products andservices to a larger participant base, and enjoy higher trading volumes, than we do. Consequently, ourcompetitors may be able and willing to offer commodity trading services at lower commission rates than wecurrently offer or may be able to offer. As a result of this pricing competition, we could lose both marketshare and revenues. We believe that any downward pressure on commission rates would likely continue andintensify as we continue to develop our business and gain recognition in our markets. A decline in commissionrates could lower our revenues, which would adversely affect our profitability. In addition, our competitorsmay offer other financial incentives such as rebates or payments in order to induce trading in their markets,rather than in our markets.
Our business may be harmed by computer and communications systems failures and delays.
We support and maintain many of the systems that comprise our electronic platform. Our failure tomonitor or maintain these systems, or to find replacements for defective components within a system in atimely and cost-effective manner when necessary, could have a material adverse effect on our ability toconduct our business. Although we fully replicate our primary data center, our redundant systems or disasterrecovery plans may prove to be inadequate. Our systems, or those of our third party providers, may fail or,due to capacity constraints, may operate slowly, causing one or more of the following:
• unanticipated disruption in service to our participants;
• slower response time and delays in our participants’ trade execution and processing;
• failed settlement by participants to whom we provide trade confirmation or clearing services;
• incomplete or inaccurate accounting, recording or processing of trades;
• our distribution of inaccurate or untimely market data to participants who rely on this data in theirtrading activity; and
• financial loss.
We could experience system failures due to power or telecommunications failures, human error on ourpart or on the part of our vendors or participants, natural disasters, fire, sabotage, hardware or softwaremalfunctions or defects, computer viruses, intentional acts of vandalism or terrorism and similar events. Inthese instances, our disaster recovery plan may prove ineffective. If any one or more of these situations wereto arise, they could result in damage to our business reputation, participant dissatisfaction with our electronicplatform, prompting participants to trade elsewhere, or exposure to litigation or regulatory sanctions. As aconsequence, our business, financial condition and results of operations could suffer materially.
Our regulated business operations generally require that our trade execution and communications systemsbe able to handle anticipated present and future peak trading volume. Heavy use of computer systems duringpeak trading times or at times of unusual market volatility could cause those systems to operate slowly oreven to fail for periods of time. We will continue to constantly monitor system loads and performance andregularly implement system upgrades to handle estimated increases in trading volume. However, we cannotassure you that our estimates of future trading volume will be accurate or that our systems will always be ableto accommodate actual trading volume without failure or degradation of performance.
Our systems and those of our third party service providers may be vulnerable to security risks, whichcould result in wrongful use of our information, or which could make our participants reluctant to useour electronic platform.
We regard the secure transmission of confidential information on our electronic platform as a criticalelement of our operations. Our networks and those of our participants and our third party service providers,
51

may, however, be vulnerable to unauthorized access, computer viruses, firewall or encryption failures and othersecurity problems. We may be required to expend significant resources to protect our business and ourparticipants against the threat of security breaches or to alleviate problems caused by security breaches.Although we intend to continue to implement industry standard security measures, we cannot assure you thatthose measures will be sufficient to protect our business against losses or any reduced trading volume incurredin our markets as a result of any significant security breaches on our platform.
We rely on specialized management and employees.
Our future success depends, in part, upon the continued contributions of our executive officers and keyemployees whom we rely on for executing our business strategy and identifying new strategic initiatives. Someof these individuals have significant experience in the commodities trading industry and financial servicesmarkets generally, and possess extensive technology skills. Although we have entered into employmentagreements with our executive officers, it is possible that one or more of these persons could voluntarilyterminate their employment agreements with us. Furthermore, we have not entered into employmentagreements with non-executive personnel, who may terminate their employment at any time. Several of theseemployees have been with us since our inception and have vested stock options. Any loss or interruption ofthe services of our executive officers or other key personnel could result in our inability to manage ouroperations effectively or to execute our business strategy. We cannot assure you that we would be able to findappropriate replacements for these key personnel if the need arose. We may have to incur significant costs toreplace key employees who leave, and our ability to execute our business strategy could be impaired if wecannot replace departing employees in a timely manner. Competition in our industry for persons with tradingindustry and technology expertise is intense.
We rely on third party providers and other suppliers for a number of services that are important to ourbusiness. An interruption or cessation of an important service or supply by any third party could have amaterial adverse effect on our business.
We depend on a number of suppliers, such as online service providers, hosting service and softwareproviders, data processors, software and hardware vendors, banks, and telephone companies, for elements ofour trading, clearing and other systems. For example, we rely on Atos Euronext Market Solutions Limited forthe provision of a trade registration system that routes trades executed in our markets for clearing. AtosEuronext Market Solutions Limited and other companies within the NYSE Euronext group of companies, arepotential competitors to both our futures business and OTC business, which could affect the continuedprovision of these services in the future. Moreover, the general trend toward industry consolidation, mayincrease the risk that these services may not be available to us in the future. We also rely on access to certaindata used in our business through licenses with third parties and we rely on a large international telecommu-nications company for the provision of hosting services. If these companies were to discontinue providingservices to us, we would likely experience significant disruption to our business.
We cannot assure you that any of these providers will be able to continue to provide these services in anefficient, cost-effective manner or that they will be able to adequately expand their services to meet our needs.We also cannot assure you that any of these providers will not terminate our business relationship with us forcompetitive reasons or otherwise. An interruption in or the cessation of an important service or supply by anythird party and our inability to make alternative arrangements in a timely manner, or at all, would result in lostrevenues and higher costs.
In addition, participants trading on our electronic platform may access it through 29 ISVs, whichrepresent a substantial portion of the ISVs that serve the commodities markets. The loss of a significantnumber of ISVs providing access could make our platform less attractive to participants who prefer this formof access.
52

We are subject to significant litigation and liability risks.
Many aspects of our business, and the businesses of our participants, involve substantial risks of liability.These risks include, among others, potential liability from disputes over terms of a trade and the claim that asystem failure or delay caused monetary loss to a participant or that an unauthorized trade occurred. Forexample, dissatisfied participants that have traded on our electronic platform or on ICE Futures U.S.’s openoutcry exchange, or those on whose behalf such participants have traded, may make claims regarding thequality of trade execution, or alleged improperly confirmed or settled trades, abusive trading practices, securityand confidentiality breaches, mismanagement or even fraud against us or our participants. In addition, becauseof the ease and speed with which sizable trades can be executed on our electronic platform, participants canlose substantial amounts by inadvertently entering trade orders or by entering them inaccurately. A largenumber of significant error trades could result in participant dissatisfaction and a decline in participantwillingness to trade in our electronic markets.
Our compliance and risk management methods might not be effective and may result in outcomes thatcould adversely affect our financial condition and operating results.
Our ability to comply with applicable laws and rules is largely dependent on our establishment andmaintenance of compliance, audit and reporting systems, as well as our ability to attract and retain qualifiedcompliance and other risk management personnel. Our policies and procedures to identify, monitor andmanage risks may not be fully effective. Management of operational, legal and regulatory risk requires, amongother things, policies and procedures to record properly and verify a large number of transactions and events.We cannot assure you that our policies and procedures will always be effective or that we will always besuccessful in monitoring or evaluating the risks to which we are or may be exposed.
In addition, the CFTC has broad enforcement powers to censure, fine, issue cease-and-desist orders,prohibit us from engaging in some of our businesses or suspend or revoke our designation as a contract marketor the designation of ICE Clear U.S. as a derivatives clearing organization. Our ability to comply withapplicable laws and rules is largely dependent on our establishment and maintenance of compliance, audit andreporting systems, as well as our ability to attract and retain qualified compliance and other risk managementpersonnel. We face the risk of significant intervention by regulatory authorities, including extensive examina-tion and surveillance activity. In the case of non-compliance or alleged non-compliance with applicable lawsor regulations, we could be subject to investigations and proceedings that may result in substantial penalties orcivil lawsuits, including by customers, for damages which can be significant. Any of these outcomes wouldadversely affect our reputation, financial condition and operating results. In extreme cases, these outcomescould adversely affect our ability to conduct our business.
ITEM 1(B). UNRESOLVED STAFF COMMENTS
None.
ITEM 2. PROPERTIES
Our most valuable property is our technology and the infrastructure underlying it. Our intellectualproperty is described under the heading “Technology” in Item 1 — Business. In addition to our intellectualproperty, our other primary assets include computer equipment, software, internally developed software andreal property. We own an array of computers and related equipment. The net book value of our computerequipment, software and internally developed software was $46.8 million as of December 31, 2007.
Our principal executive offices are located in Atlanta, Georgia. We occupy 46,437 square feet of officespace in Atlanta under a lease that expires on February 15, 2012. We also lease an aggregate of 158,679 squarefeet of office space in New York, London, Chicago, Houston, Winnipeg, Calgary and Singapore. Our largestphysical presence outside of Atlanta is in New York, New York, where we have leased 111,255 square feet ofoffice space, primarily relating to ICE Futures U.S.’s executive office and its principal trading floor that arelocated at One North End Avenue, New York, New York. ICE Futures U.S. leases this space from NYMEXunder a lease that expires on July 1, 2013, unless an option to renew for five years is extended by NYMEX
53

following the initial term. In addition, ICE Futures U.S. leases space in lower Manhattan to house its primarycomputer center, its new grading facility and certain administrative offices. These leases expire on June 30,2014 or December 31, 2016. ICE Futures U.S. also maintains a back-up facility, which contains a fullyoperational trading floor and a lights-out 24 by 7 computer center, through leases of three parcels of space inLong Island City for this facility, which expires on December 31, 2013. Our second largest physical presenceoutside of Atlanta is in London, England, where we have leased 16,348 square feet of office space. Thevarious leases covering these spaces generally expire between 2008 and 2010.
We believe that our facilities are adequate for our current operations and that we will be able to obtainadditional space as and when it is needed.
ITEM 3. LEGAL PROCEEDINGS
We are involved in a number of legal proceedings (including those described below) concerning mattersarising in connection with the conduct of our business. We believe, based on currently available information,that the results of such proceedings, in the aggregate, will not have a material adverse effect on our financialcondition.
NYMEX Claim of Infringement
On September 29, 2005, the U.S. District Court for the Southern District of New York granted our motionfor summary judgment dismissing all claims brought by NYMEX against us in an action commenced inNovember 2002. NYMEX’s complaint alleged copyright infringement by us on the basis of our use ofNYMEX’s publicly available settlement prices in two of our cleared OTC contracts. The complaint alsoalleged that we infringe and dilute NYMEX’s trademark rights by referring to NYMEX trademarks in certainof our swap contract specifications and that we tortiously interfered with a contract between NYMEX and thedata provider that provides us with the NYMEX settlement prices pursuant to a license. In dismissing all ofNYMEX’s claims, the court found that NYMEX’s settlement prices were not copyrightable works as a matterof law, and we had not engaged in copyright or trademark infringement in referencing NYMEX’s publiclyavailable settlement prices. The trademark dilution and tortious interference claims, which are state law claims,were dismissed on jurisdictional grounds. While the court granted summary judgment in our favor on allclaims, NYMEX appealed the decision regarding the copyright claims and state law claims in the SecondCircuit Court of Appeals. On August 1, 2007, the Second Circuit Court of Appeals affirmed the DistrictCourt’s grant of motion for summary judgment in our favor. On August 15, 2007, NYMEX filed a CombinedPetition for Panel Rehearing and Rehearing En Banc, requesting that the case be reheard before the SecondCircuit Court of Appeals. On October 25, 2007, the Second Circuit Court of Appeals denied NYMEX’sCombined Petition for a rehearing. On January 16, 2008, NYMEX filed a writ of certiorari with theU.S. Supreme Court seeking discretionary review of the case, and the U.S. Supreme Court has not yet decidedwhether to hear the case. Should NYMEX be successful in its appeal to the Supreme Court and we aresubsequently found to have infringed NYMEX’s intellectual property rights, we may incur substantialmonetary damages and may be enjoined from using or referring to one or more types of NYMEX settlementprices.
Klein v. ICE Futures U.S.; ICE Futures U.S. v. Klein
In December 2007, the parties mutually agreed to settle all claims and disputes between the parties withrespect to the matters described below.
On July 26, 2000, Klein & Co. Futures, Inc., or Klein, commenced a civil action, referred to as the KleinAction, in the United States District Court for the Southern District of New York (00 Civ. 5563) againstnumerous defendants, including ICE Futures U.S., various affiliates of ICE Futures U.S. and officials of ICEFutures U.S. and/or its affiliates. Klein’s claims arose out of its collapse in the wake of the recalculation ofsettlement prices for futures and options on the Pacific Stock Exchange Technology Index (an index oftechnology stocks) in May 2000. Klein purported to allege federal claims arising under the CEA and variousstate law claims. On February 18, 2005, the District Court dismissed Klein’s CEA claims with prejudice in
54

accordance with Section 22(b) of the CEA for lack of standing and declined to exercise supplementaljurisdiction over Klein’s state law claims. That decision was affirmed on September 18, 2006, by a panel ofthe United States Court of Appeals for the Second Circuit, and a subsequent motion for rehearing insomuch asthe panel affirmed the District Court’s dismissal of its CEA claims against ICE Futures U.S. and certain of itsaffiliates was denied. Klein then filed a petition in the United States Supreme Court seeking to appeal thedecision of the United States Circuit Court on March 14, 2007. The petition was granted and the appeal washeard before the United States Supreme Court on October 29, 2007.
In March 2007, Klein filed a parallel action in the Supreme Court of the State of New York, New YorkCounty, against certain defendants, including ICE Futures U.S. and its former president. The action alleged aclaim of slander and libel against ICE Futures U.S. and its former president relating to certain statementsmade in connection with Klein’s collapse. In May 2007, ICE Futures U.S. filed a motion to dismiss onmultiple grounds. Oral argument was held in August 2007 but the motion was not decided by the court.
Also, on May 14, 2001, ICE Futures U.S. and ICE Clear U.S. commenced an action, referred to as ICEFutures U.S.’s Action, in the United States District Court for the Southern District of New York (01 Civ.4071) against Klein. ICE Futures U.S. and ICE Clear U.S. commenced this action in their capacity as theassignees of certain claims that were held against Klein by its former customers. ICE Futures U.S.’s Actionsought to recover money owed by Klein to those customers in the wake of Klein’s collapse. In the samedecision that dismissed the Klein action, the District Court dismissed all of Klein’s counterclaims against ICEFutures U.S., denied ICE Futures U.S.’s motion for judgment on the pleadings and found that the complaint inICE Futures U.S.’s Action did not state a claim for which relief could be granted. However, the District Courtgranted ICE Futures U.S. leave to replead. On April 14, 2005, ICE Futures U.S. and ICE Clear U.S. filed anamended complaint, which Klein subsequently moved to dismiss. ICE Futures U.S. and ICE ClearU.S. opposed that motion which was briefed on August 5, 2005, but was never decided by the court.
In December 2007 and prior to the Supreme Court’s ruling, the parties mutually agreed to settle all claimsand disputes between the parties through entry of an omnibus settlement agreement whereby all claims anddisputes between them were released and all actions dismissed, with prejudice, upon payment of anundisclosed amount by ICE Futures U.S. to Klein. The payment under the settlement agreement was apre-acquisition contingency that existed at the time of the ICE Futures U.S. acquisition. Therefore, thepayment to Klein was accrued as a liability in the purchase price allocation and had no income statementimpact.
Altman et al v. ICE Futures U.S.
On April 6, 2007, the Supreme Court of the State of New York, County of New York, granted ICEFutures U.S.’s motion to dismiss all claims brought against it in an action commenced on December 8, 2006,by certain holders of non-equity trading permits, or Permit Holders, of ICE Futures U.S. seeking declaratory,monetary and injunctive relief with respect to the merger. Plaintiffs alleged that, in violation of contract rightsand/or rights under New York’s Not-For-Profit Corporation Law, or NPCL, ICE Futures U.S.’s Permit Holders,including plaintiffs, were not permitted to vote with respect to the merger and would not receive any part ofthe merger consideration. Plaintiffs sought (i) to enjoin consummation of the merger, (ii) declaratory reliefregarding their past and future rights as Permit Holders, and (iii) an award of unspecified damages on claimsfor breach of fiduciary duty, breach of contract, unjust enrichment, estoppel and fraud. The court also deniedthe plaintiffs’ motion for a preliminary injunction. On February 4, 2008, the Permit Holders perfected theirappeal from the lower court’s ruling dismissing their complaint. The Permit Holders did not pursue an appealof the lower court’s denial of their request for an order enjoining the merger. ICE Futures U.S. will oppose theappeal and seek affirmance of the lower court’s decision.
ITEM 4. SUBMISSION OF MATTERS TO A VOTE OF SECURITY HOLDERS
There were no matters submitted to a vote of IntercontinentalExchange’s security holders during thefourth quarter of our fiscal year ended December 31, 2007.
55

ITEM 4(A). EXECUTIVE OFFICERS OF INTERCONTINENTALEXCHANGE, INC.
Set forth below, in accordance with General Instruction G(3) of Form 10-K and Instruction 3 toItem 401(b) of Regulation S-K, is information regarding our executive officers and certain other keyemployees:
Name Age Title
Jeffrey C. Sprecher. . . . . . . . 52 Chairman of the Board and Chief Executive Officer
Charles A. Vice . . . . . . . . . . 44 President and Chief Operating Officer
Scott A. Hill . . . . . . . . . . . . 40 Chief Financial Officer and Senior Vice President
David S. Goone . . . . . . . . . . 47 Senior Vice President, Chief Strategic Officer
Edwin D. Marcial . . . . . . . . 40 Chief Technology Officer and Senior Vice President
Johnathan H. Short. . . . . . . . 42 Senior Vice President, General Counsel and CorporateSecretary
David J. Peniket. . . . . . . . . . 42 President and Chief Operating Officer, ICE Futures Europe
Thomas W. Farley . . . . . . . . 32 President and Chief Operating Officer, ICE Futures U.S.
Jeffrey C. Sprecher. Mr. Sprecher has served as our Chief Executive Officer and a director since ourinception and has served as our Chairman of the Board since November 2002. As our Chief Executive Officer,he is responsible for our strategic direction, operation, and financial performance. Mr. Sprecher purchasedContinental Power Exchange, Inc., our predecessor company, in 1997. Prior to joining Continental PowerExchange, Inc., Mr. Sprecher held a number of positions, including President, over a fourteen-year period withWestern Power Group, Inc., a developer, owner and operator of large central-station power plants. While withWestern Power, Mr. Sprecher was responsible for a number of significant financings. In 2002, Mr. Sprecherwas recognized by Business Week magazine as one of its Top Entrepreneurs. Mr. Sprecher holds a B.S. degreein Chemical Engineering from the University of Wisconsin and an MBA from Pepperdine University.
Charles A. Vice. Mr. Vice has served as our President since October 2005 and our Chief OperatingOfficer since July 2001. As our President and Chief Operating Officer, Mr. Vice is responsible for overseeingour operations, including market development, customer support and business development activities. He hasover 15 years of experience in applying information technology in the energy industry. Mr. Vice joinedContinental Power Exchange, Inc. as a Marketing Director during its startup in 1994, and prior thereto was aPrincipal with Energy Management Associates for five years, providing consulting services to energy firms.From 1985 to 1988, he was a Systems Analyst with Electronic Data Systems. Mr. Vice holds a Bachelor’s ofScience degree in Mechanical Engineering from the University of Alabama and an MBA from VanderbiltUniversity.
Scott A. Hill. Mr. Hill has served as our Chief Financial Officer since May 2007. As our Chief FinancialOfficer, he is responsible for overseeing all aspects of our finance and accounting functions, including treasury,tax, cash management and investor relations. He is also responsible for financial planning, audit, businessdevelopment and human resources. Prior to joining us, Mr. Hill spent 16 years as an international financeexecutive for IBM. He oversaw IBM’s worldwide financial forecasts and measurements from 2006 through 2007,working alongside the CFO of IBM and with all of the company’s global business units. Prior to that, Mr. Hillwas Vice President and Controller of IBM’s Japan multi-billion dollar business operation from 2003 through2005. Mr. Hill earned his BBA in Finance from the University of Texas in Austin and his MBA from New YorkUniversity, where he was recognized as a Stern Scholar.
David S. Goone. Mr. Goone has served as our Senior Vice President, Chief Strategic Officer sinceMarch 2001. He is responsible for the expansion of our product line, including futures products and tradingcapabilities for our electronic platform. Mr. Goone also leads our global sale organization. Prior to joining us,Mr. Goone served as the Managing Director, Product Development and Sales at the Chicago MercantileExchange where he worked for nine years. From 1989 through 1992, Mr. Goone was Vice President atIndosuez Carr Futures, where he developed institutional and corporate business. Prior to joining Indosuez,Mr. Goone worked at Chase Manhattan Bank, where he developed and managed their exchange-traded foreign
56

currency options operation at the Chicago Mercantile Exchange. Mr. Goone holds a B.S. degree inAccountancy from the University of Illinois at Urbana-Champaign.
Edwin D. Marcial. Mr. Marcial has served as our Chief Technology Officer since May 2000. He isresponsible for all systems development and our overall technology strategy. He also oversees the softwaredesign and development initiatives of our information technology professionals in the areas of projectmanagement, architecture, software development and quality assurance. Mr. Marcial joined the softwaredevelopment team at Continental Power Exchange, Inc. in 1996 and has 14 years of IT experience buildinglarge-scale systems in the energy industry. Prior to joining Continental Power Exchange, Inc., he led designand development teams at Harris Corporation building software systems for the company’s energy controlsdivision. Mr. Marcial earned a B.S. degree in Computer Science from the College of Engineering at theUniversity of Florida.
Johnathan H. Short. Mr. Short has served as our Senior Vice President, General Counsel and CorporateSecretary since June 2004. In his role as General Counsel, he is responsible for managing our legal andregulatory affairs. As Corporate Secretary, he is also responsible for a variety of our corporate governancematters. Prior to joining us, Mr. Short was a partner at McKenna Long & Aldridge LLP, a national law firmwith approximately 350 attorneys. Mr. Short practiced in the corporate law group of McKenna, Long &Aldridge (and its predecessor firm, Long Aldridge & Norman LLP) from November 1994 until he joined us inJune 2004. From April 1991 until October 1994, he practiced in the commercial litigation department of LongAldridge & Norman LLP. Mr. Short holds a J.D. degree from the University of Florida, College of Law, and aB.S. in Accounting from the University of Florida, Fisher School of Accounting.
David J. Peniket. Mr. Peniket has served as President, ICE Futures Europe, since October 2005 andChief Operating Officer, ICE Futures Europe, since January 2005. Mr. Peniket is responsible for ICE FuturesEurope’s financial performance, technology and market operations, human resources, business developmentand regulation and risk management. Prior to assuming the role of Chief Operating Officer, Mr. Peniket servedas Director of Finance of ICE Futures Europe since May 2000. Before joining ICE Futures Europe in 1999,Mr. Peniket worked for seven years at KPMG LLP, where he trained as an accountant and was a consultant inits financial management practice. Mr. Peniket was Research Assistant to John Cartwright MP from 1988 to1991. He holds a B.Sc. (Econ) degree in Economics from the London School of Economics and PoliticalScience and is a Chartered Accountant.
Thomas W. Farley. Mr. Farley joined ICE Futures U.S. in February 2007 as President and ChiefOperating Officer. Mr. Farley is also a member of the Board of Directors of ICE Futures U.S. Prior to joiningICE Futures U.S., from July 2006 to January 2007, Mr. Farley was President of SunGard Kiodex, a riskmanagement technology provider to the commodity derivatives markets. From October 2000 to July 2006,Mr. Farley served as Kiodex’s Chief Financial Officer and he also served as Kiodex’s Chief Operating Officerfrom January 2003 to July 2006. Prior to Kiodex, Mr. Farley held positions in investment banking and privateequity. Mr. Farley holds a Bachelor of Arts in Political Science from Georgetown University.
PART II
ITEM 5. MARKET FOR REGISTRANT’S COMMON EQUITY, RELATED STOCKHOLDER MATTERSAND ISSUER PURCHASES OF EQUITY SECURITIES
Approximate Number of Holders of Common Stock
At February 11, 2008, there were approximately 743 holders of record of our common stock.
Dividends
We have paid no dividends on our common stock and we do not anticipate paying any dividends on ourcommon stock for the foreseeable future. Any determination to pay dividends in the future will be made at thediscretion of our board of directors and will depend upon our results of operations, financial conditions,
57

contractual restrictions, restrictions imposed by applicable law or the SEC and other factors our board ofdirectors deems relevant.
Price Range of Common Stock
Our common stock trades on the New York Stock Exchange under the ticker symbol “ICE”. Our common stockwas initially offered and sold to the public at a price of $26.00 per share and has been publicly traded sinceNovember 16, 2005. Prior to that date, there was no public market in our stock. On February 12, 2008, our commonstock traded at a high of $138.49 per share and a low of $130.77 per share. The following table sets forth thequarterly high and low sale prices for the periods indicated for our common stock on the New York Stock Exchange.
High Low
Common Stock MarketPrice
Year Ended December 31, 2006First Quarter . . . . . . . . . . . . . . . . . . . . . . . . . . . . . . . . . . . . . . . . . . . . . . . . . . $ 73.59 $ 36.00Second Quarter . . . . . . . . . . . . . . . . . . . . . . . . . . . . . . . . . . . . . . . . . . . . . . . . $ 82.40 $ 45.27Third Quarter . . . . . . . . . . . . . . . . . . . . . . . . . . . . . . . . . . . . . . . . . . . . . . . . . $ 77.92 $ 51.77Fourth Quarter . . . . . . . . . . . . . . . . . . . . . . . . . . . . . . . . . . . . . . . . . . . . . . . . $113.85 $ 72.15Year Ended December 31, 2007First Quarter . . . . . . . . . . . . . . . . . . . . . . . . . . . . . . . . . . . . . . . . . . . . . . . . . . $167.00 $108.15Second Quarter . . . . . . . . . . . . . . . . . . . . . . . . . . . . . . . . . . . . . . . . . . . . . . . . $162.47 $120.56Third Quarter . . . . . . . . . . . . . . . . . . . . . . . . . . . . . . . . . . . . . . . . . . . . . . . . . $174.15 $117.25Fourth Quarter . . . . . . . . . . . . . . . . . . . . . . . . . . . . . . . . . . . . . . . . . . . . . . . . $194.92 $151.76
Equity Compensation Plan Information
The following table provides information about our common stock that may be issued under our existingequity compensation plans as of December 31, 2007, which consists of the 2000 Stock Option Plan,2003 Directors Plan, 2004 Restricted Stock Plan and 2005 Equity Incentive Plan.
Plan Category
Number ofSecurities to be Issued
Upon Exercise ofOutstanding Options
and Rights(a)
Weighted AverageExercise Price of
Outstanding Options(b)
Number of SecuritiesAvailable for Future
Issuance Under EquityCompensation Plans(Excluding Securities
Reflected in Column (a))(c)
Equity compensation plans approvedby security holders(1) . . . . . . . . . . 2,063,364(1) $35.91(1) 1,521,800
Equity compensation plans notapproved by security holders(2) . . . 850,715 N/A(2) 333,947
TOTAL . . . . . . . . . . . . . . . . . . . . . 2,914,079 N/A(1)(2) 1,855,747
(1) The 2000 Stock Option Plan was approved by our stockholders in June 2000 and the 2005 Equity Incen-tive Plan was approved by our stockholders in June 2005. Of the 2,063,364 securities to be issued uponexercise of outstanding options and rights, 1,359,087 are options with a weighted average exercise price of$35.91 and the remaining 704,277 securities are restricted stock shares that do not have an exercise price.
(2) This category includes the 2003 Directors Plan and the 2004 Restricted Stock Plan. The weighted averageexercise price of outstanding options and rights in column (b) for equity compensation plans not approvedby security holders is not applicable since the only grants or awards under these plans have been restrictedstock and restricted stock units, which do not have an exercise price. For more information concerningthese plans, see note 11 to our consolidated financial statements that are included elsewhere in this AnnualReport on Form 10-K.
58

ITEM 6. SELECTED FINANCIAL DATA
The following tables present our selected consolidated financial data as of and for the dates and periodsindicated. We derived the selected consolidated financial data set forth below for the years ended December 31,2007, 2006 and 2005 and as of December 31, 2007 and 2006 from our audited consolidated financialstatements, which are included elsewhere in this Annual Report on Form 10-K. We derived the selectedconsolidated financial data set forth below for the years ended December 31, 2004 and 2003 and as ofDecember 31, 2005, 2004 and 2003 from our audited consolidated financial statements, which are not includedin this Annual Report on Form 10-K.
The selected consolidated financial data presented below is not indicative of our future results for anyperiod. The selected consolidated financial data set forth below should be read in conjunction with ourconsolidated financial statements and related notes and “Management’s Discussion and Analysis of FinancialCondition and Results of Operations” included elsewhere in this Annual Report on Form 10-K.
2007 2006 2005 2004 2003Year Ended December 31,
(In thousands, except for per share data)
Consolidated Statement of Income/(Loss) DataRevenues(1):
Transaction fees, net(2) . . . . . . . . . . . . . . . . . . $490,358 $273,629 $136,976 $ 90,906 $81,434Market data fees . . . . . . . . . . . . . . . . . . . . . . . 70,396 34,236 14,642 12,290 9,624Other . . . . . . . . . . . . . . . . . . . . . . . . . . . . . . . 13,539 5,934 4,247 5,218 2,688
Total revenues . . . . . . . . . . . . . . . . . . . . . . . . . . 574,293 313,799 155,865 108,414 93,746
Operating expenses:Compensation and benefits . . . . . . . . . . . . . . . 101,397 49,750 35,753 30,074 26,236Professional services . . . . . . . . . . . . . . . . . . . . 23,047 11,395 10,124 12,312 13,066Patent royalty . . . . . . . . . . . . . . . . . . . . . . . . . 1,705 9,039 1,491 32 14CBOT merger-related transaction costs(3) . . . . 11,121 — — — —Selling, general and administrative . . . . . . . . . 50,759 25,266 17,395 16,578 16,171Floor closure costs(4) . . . . . . . . . . . . . . . . . . . — — 4,814 — —Settlement expense(5) . . . . . . . . . . . . . . . . . . . — — 15,000 — —Depreciation and amortization . . . . . . . . . . . . . 32,701 13,714 15,083 17,024 19,341
Total operating expenses . . . . . . . . . . . . . . . . . . . 220,730 109,164 99,660 76,020 74,828
Operating income . . . . . . . . . . . . . . . . . . . . . . . . 353,563 204,635 56,205 32,394 18,918Other income, net . . . . . . . . . . . . . . . . . . . . . . . . 4,871 7,908 3,790 1,328 948
Income before income taxes . . . . . . . . . . . . . . . . 358,434 212,543 59,995 33,722 19,866Income tax expense . . . . . . . . . . . . . . . . . . . . . . 117,822 69,275 19,585 11,773 6,489
Net income(6) . . . . . . . . . . . . . . . . . . . . . . . . . . $240,612 $143,268 $ 40,410 $ 21,949 $13,377
Redemption adjustments to redeemable stockput(7) . . . . . . . . . . . . . . . . . . . . . . . . . . . . . . . — — (61,319) — 8,378
Deduction for accretion of Class B redeemablecommon stock . . . . . . . . . . . . . . . . . . . . . . . . — — — — (1,768)
Net income (loss) available to commonshareholders . . . . . . . . . . . . . . . . . . . . . . . . . . $240,612 $143,268 $ (20,909) $ 21,949 $19,987
Earnings (loss) per common share(8):Basic . . . . . . . . . . . . . . . . . . . . . . . . . . . . . . . $ 3.49 $ 2.54 $ (0.39) $ 0.42 $ 0.37
Diluted . . . . . . . . . . . . . . . . . . . . . . . . . . . . . . $ 3.39 $ 2.40 $ (0.39) $ 0.41 $ 0.37
Weighted average common sharesoutstanding(8):Basic . . . . . . . . . . . . . . . . . . . . . . . . . . . . . . . 68,985 56,474 53,218 52,865 54,329Diluted . . . . . . . . . . . . . . . . . . . . . . . . . . . . . . 70,980 59,599 53,218 53,062 54,640
59
(1) Includes revenues from related parties generated in the ordinary course of our business. For a presentationand discussion of our revenues attributable to related parties for the years ended December 31, 2007, 2006and 2005, see our consolidated statements of income and note 13 to our consolidated financial statementsthat are included elsewhere in this Annual Report on Form 10-K.
(2) Our transaction fees are presented net of rebates. For a discussion of these rebates, see Item 7 “Manage-ment’s Discussion and Analysis of Financial Condition and Results of Operations — Sources of Reve-nues — Transaction Fees” included elsewhere in this Annual Report on Form 10-K.
(3) In 2007, we incurred $11.1 million in transaction costs directly relating to the proposed merger withCBOT Holdings, Inc., or CBOT. We did not succeed in our proposed merger with CBOT and CME com-pleted its acquisition of CBOT in July 2007. These costs are classified as “CBOT merger-related transac-tion costs” in the accompanying consolidated statement of income for the year ended December 31, 2007.See note 18 to our consolidated financial statements that are included elsewhere in this Annual Report onForm 10-K.
(4) In 2005, we closed our open-outcry trading floor in London to take advantage of the increasing acceptanceand adoption of electronic trading, and to maintain and enhance our competitive position. Costs associatedwith the floor closure were $4.8 million and are classified as “Floor closure costs” in the accompanyingconsolidated statement of income for the year ended December 31, 2005. See note 20 to our consolidatedfinancial statements that are included elsewhere in this Annual Report on Form 10-K.
(5) In 2005, we settled a legal action brought by EBS against us related to alleged patent infringement. Underthe settlement agreement, we made a payment to EBS of $15.0 million, and were released from the legalclaims brought against us without admitting liability. The payment was recorded as “Settlement expense”in the accompanying consolidated statement of income for the year ended December 31, 2005. See note 19to our consolidated financial statements that are included elsewhere in this Annual Report on Form 10-K.
(6) The financial results for the year ended December 31, 2007 include $11.1 million in CBOT merger-relatedtransaction costs. Excluding these costs, net of taxes, our consolidated net income for the year endedDecember 31, 2007 would have been $247.8 million. The financial results for the year ended December 31,2005 include $4.8 million in expenses incurred relating to the closure of our open-outcry trading floor inLondon and a $15.0 million settlement expense related to the payment made to EBS to settle litigation.Excluding these charges, net of taxes, our consolidated net income for the year ended December 31, 2005would have been $53.1 million. See Item 7 “Management’s Discussion and Analysis of Financial Condi-tion and Results of Operations — Non-GAAP Financial Measures,” included elsewhere in this AnnualReport on Form 10-K.
(7) In connection with our formation, we granted a put option to Continental Power Exchange, Inc., an entitycontrolled by our Chairman and Chief Executive Officer, Jeffrey C. Sprecher. The put option would haverequired us under certain circumstances to purchase Continental Power Exchange, Inc.’s equity interest inour business at a purchase price equal to the greater of the fair market value of the equity interest or$5 million. We initially recorded the redeemable stock put at the minimum $5 million redemption thresh-old. We adjusted the redeemable stock put to its redemption amount at each subsequent balance sheet date.Adjustments to the redemption amount were recorded to retained earnings or, in the absence of positiveretained earnings, additional paid-in capital. In October 2005, we entered into an agreement with Conti-nental Power Exchange, Inc. to terminate the redeemable stock put upon the closing of our initial publicoffering of common stock in November 2005. We increased the redeemable stock put by $61.3 millionduring the year ended December 31, 2005 resulting from an increase in the estimated fair value of ourcommon stock from $8.00 per share as of December 31, 2004 to $35.90 per share as of November 21,2005, the closing date of our initial public offering of common stock and the termination date of theredeemable stock put. The balance of the redeemable stock put on November 21, 2005 was $78.9 millionand was reclassified to additional paid-in capital upon its termination. See note 10 to our consolidatedfinancial statements that are included elsewhere in this Annual Report on Form 10-K. In connection withthe termination of the put option, we amended certain registration rights previously granted to ContinentalPower Exchange, Inc. pursuant to which we may be obligated to pay the expenses of registration, includ-ing underwriting discounts up to a maximum of $4.5 million.
60

(8) The impact of outstanding stock options is considered to be antidilutive in the calculation of diluted earn-ings per share when a net loss available to common shareholders is reported. Our outstanding stock optionshave not been included in the computation of diluted earnings per share for the year ended December 31,2005 due to the $20.9 million net loss available to common shareholders as a result of the $61.3 millioncharged to retained earnings related to the redeemable stock put adjustments. Therefore, our diluted earn-ings per share are computed in the same manner as basic earnings per share for the year ended Decem-ber 31, 2005. If the redemption adjustments to the redeemable stock put are excluded from the calculationof earnings per share, the resulting adjusted basic earnings per share would have been $0.76 based on the$40.4 million in consolidated net income for the year ended December 2005 and adjusted diluted earningsper share would have been $0.74. The adjusted diluted earnings per share would have been based on54.4 million in adjusted diluted weighted average common shares outstanding, which includes 1.2 millionstock options and restricted stock having a dilutive effect for the year ended December 31, 2005. Theadjusted basic and diluted earnings per share for the year ended December 31, 2005, excluding theredeemable stock put adjustments, the $4.8 million floor closure costs and the $15.0 million settlementexpenses, would have been $1.00 and $0.98, respectively. See Item 7 “Management’s Discussion andAnalysis of Financial Condition and Results of Operations — Non-GAAP Financial Measures,” includedelsewhere in this Annual Report on Form 10-K.
2007 2006 2005 2004 2003As of December 31,
(In thousands)
Consolidated Balance Sheet DataCash and cash equivalents(1)(2) . . . . $ 119,597 $204,257 $ 20,002 $ 61,199 $ 44,913
Restricted cash and restricted short-term investments(1) . . . . . . . . . . . 19,624 16,193 12,578 18,421 36,797
Short-term investments(2) . . . . . . . . 140,955 77,354 111,181 5,700 12,000
Margin deposits and guaranty fundsasset(3) . . . . . . . . . . . . . . . . . . . . 792,052 — — — —
Total current assets . . . . . . . . . . . . . 1,142,094 340,917 164,015 100,042 105,893
Property and equipment, net . . . . . . 63,524 26,280 20,348 19,364 25,625Goodwill and other intangible
assets, net(4) . . . . . . . . . . . . . . . . 1,547,409 81,126 76,054 86,075 81,448Cost method investments(5) . . . . . . . 38,778 38,738 1,674 1,866 1,738
Total assets . . . . . . . . . . . . . . . . . . . 2,796,345 493,211 265,770 207,518 214,879
Margin deposits and guaranty fundsliability(3) . . . . . . . . . . . . . . . . . . 792,052 — — — —
Total current liabilities. . . . . . . . . . . 910,961 37,899 26,394 34,440 17,917
Current and long-term debt(1)(6) . . . 221,875 — — 25,000 —
Class B redeemable commonstock(1) . . . . . . . . . . . . . . . . . . . . — — — — 67,500
Redeemable stock put(7) . . . . . . . . . — — — 17,582 17,582
Shareholders’ equity . . . . . . . . . . . . 1,476,856 454,468 232,623 132,149 101,194
(1) We redeemed all outstanding shares of our Class B redeemable common stock in November 2004, whichresulted in a $18.5 million reduction in cash and cash equivalents, a $24.0 million reduction in restrictedshort-term investments, a $25.0 million increase in current and long-term debt and a corresponding$67.5 million reduction in Class B redeemable common stock.
(2) We received net proceeds from our initial public offering of our common stock in November 2005 of$60.8 million, after deducting the underwriting discount. We also invested a portion of our cash in excessof short-term operating needs in investment-grade marketable debt securities and municipal bonds.
61

(3) Clearing members of ICE Clear U.S., ICE Futures U.S.’s clearing house, and ICE Clear Canada, ICEFutures Canada’s clearing house, are required to deposit original margin and variation margin and to makedeposits to a guaranty fund. The cash deposits made to these margin accounts and to the guaranty fund arerecorded in the consolidated balance sheet as current assets with offsetting current liabilities to the clearingmembers that deposited them. See note 15 to our consolidation financial statement that are included else-where in this Annual Report on Form 10-K.
(4) The increase in the goodwill and other intangible assets in 2007 relates to the acquisitions of ICE FuturesU.S., ICE Futures Canada, Commoditrack, ChemConnect and Chatham that occurred during the yearended December 31, 2007. See note 8 to our consolidation financial statements that are included elsewherein this Annual Report on Form 10-K.
(5) In December 2006, we purchased an 8% equity share in NCDEX for $36.3 million. See note 6 to our con-solidated financial statements that are included elsewhere in this Annual Report on Form 10-K.
(6) We borrowed $250.0 million in a senior unsecured credit facility in connection with the purchase of ICEFutures U.S. in January 2007. See note 9 to our consolidation financial statements that are included else-where in this Annual Report on Form 10-K.
(7) In October 2005, we entered into an agreement with Continental Power Exchange, Inc. to cancel theredeemable stock put upon the closing of the initial public offering of our common stock in November2005. See note 10 to our consolidated financial statements that are included elsewhere in this AnnualReport on Form 10-K.
62

2007 2006 2005 2004 2003Year Ended December 31,
(In thousands, except for percentages)
Operating Data:Our Market Share of Selected Key Products:
Total crude oil futures contracts traded globally(1) . . . . . 232,643 144,085 91,049 78,477 69,450
ICE Brent Crude oil futures contracts traded . . . . . . . . . 59,729 44,346 30,412 25,458 24,013
ICE WTI Crude oil futures contracts traded . . . . . . . . . . 51,388 28,673 — — —
Our crude oil futures market share(1) . . . . . . . . . . . . . . . 47.8% 50.7% 33.4% 32.4% 34.6%
Total cleared Henry Hub natural gas contracts traded onus and NYMEX-ClearPort . . . . . . . . . . . . . . . . . . . . . 133,463 121,144 53,166 21,241 6,869
Our cleared Henry Hub natural gas contracts traded . . . . 117,256 96,957 42,760 15,887 4,512
Our market share — cleared Henry Hub natural gas vs.NYMEX-ClearPort(2) . . . . . . . . . . . . . . . . . . . . . . . . 87.9% 80.0% 80.4% 74.8% 65.7%
Total cleared PJM financial power contracts traded onus and NYMEX-ClearPort . . . . . . . . . . . . . . . . . . . . . 3,063 2,674 1,886 748 149
Our cleared PJM financial power contracts traded . . . . . 2,978 2,502 1,234 513 6
Our market share — cleared PJM financial power vs.NYMEX-ClearPort(3) . . . . . . . . . . . . . . . . . . . . . . . . 97.3% 93.6% 65.4% 68.7% 4.0%
Our Average Daily Trading Fee Revenues(4):
Our futures business average daily exchange feerevenues . . . . . . . . . . . . . . . . . . . . . . . . . . . . . . . . . . $ 1,122 $ 482 $ 226 $ 179 $ 158
Our bilateral OTC business average daily commissionfee revenues . . . . . . . . . . . . . . . . . . . . . . . . . . . . . . . 178 102 79 80 112
Our cleared OTC business average daily commission feerevenues . . . . . . . . . . . . . . . . . . . . . . . . . . . . . . . . . . 667 487 233 94 24
Our OTC business average daily commission feerevenues . . . . . . . . . . . . . . . . . . . . . . . . . . . . . . . . . . 845 589 312 174 136
Our total average daily exchange fee and commissionfee revenues . . . . . . . . . . . . . . . . . . . . . . . . . . . . . . . $ 1,967 $ 1,071 $ 538 $ 353 $ 294
Our Trading Volume(5):
Futures volume . . . . . . . . . . . . . . . . . . . . . . . . . . . . . . . 191,998 92,721 42,055 35,541 33,341
Futures average daily volume . . . . . . . . . . . . . . . . . . . . 771 373 166 140 132OTC volume . . . . . . . . . . . . . . . . . . . . . . . . . . . . . . . . . 174,858 130,832 61,999 30,961 24,260
OTC average daily volume . . . . . . . . . . . . . . . . . . . . . . 716 525 247 123 97
OTC Participants Trading Commission Percentages:
Commercial companies (including merchant energy) . . . 53.5% 46.8% 48.8% 56.5% 64.1%
Banks and financial institutions . . . . . . . . . . . . . . . . . . . 21.3% 21.2% 20.5% 22.4% 31.3%
Liquidity providers . . . . . . . . . . . . . . . . . . . . . . . . . . . . 25.2% 32.0% 30.7% 21.1% 4.6%
(1) Total crude oil futures contracts traded globally and our resulting crude oil futures market share is calcu-lated based on the number of ICE Brent Crude futures contracts and ICE WTI Crude futures contractstraded as compared to the total ICE Brent Crude futures contracts, ICE WTI Crude futures contracts,NYMEX Light Sweet Crude and London/Dublin Brent Crude futures contracts traded.
(2) Our cleared Henry Hub market share versus NYMEX-ClearPort is calculated based on the number of OTCcleared Henry Hub natural gas contracts traded as a percentage of the total OTC cleared Henry Hub natu-ral gas contracts and NYMEX-ClearPort Henry Hub natural gas OTC contracts traded.
63

(3) Our cleared PJM financial power market share versus NYMEX-ClearPort is calculated based on the num-ber of IntercontinentalExchange cleared PJM financial power contracts traded as a percentage of the totalIntercontinentalExchange cleared PJM financial power contracts and NYMEX-ClearPort cleared PJMfinancial power contracts traded. PJM refers to the Pennsylvania, New Jersey and Maryland power tradinghub. The NYMEX-ClearPort cleared PJM financial power contract was launched in April 2003 and ourPJM financial power contract was launched in November 2003.
(4) Represents the total commission fee and exchange fee revenues for the year divided by the number of trad-ing days during that year.
(5) Volume is calculated based on the number of contracts traded in our markets, which is the number ofround turn trades. Each round turn trade represents a matched buy and sell order of one contract. Averagedaily volume represents the total volume, in contracts, for the year divided by the number of trading daysduring the year.
ITEM 7. MANAGEMENT’S DISCUSSION AND ANALYSIS OF FINANCIAL CONDITION ANDRESULTS OF OPERATIONS
The following discussion contains forward-looking statements that involve risks and uncertainties. Ouractual results could differ materially from those anticipated in these forward-looking statements for manyreasons, including those set forth in Item 1(A) under the heading “Risk Factors” and elsewhere in this AnnualReport on Form 10-K. The following discussion is qualified in its entirety by, and should be read inconjunction with, the more detailed information contained in Item 6 “Selected Financial Data” and ourconsolidated financial statements and related notes included elsewhere in this Annual Report on Form 10-K.
Overview
We are a leading global exchange and over-the-counter, or OTC, market operator. We offer the leadingelectronic integrated futures and OTC marketplace for trading a broad array of energy products, as well as theleading soft commodities exchange. Currently, we are the only marketplace to offer an integrated electronicplatform for side-by-side trading of products in both futures and OTC markets. Through our widely-distributedelectronic trading platform, our marketplace brings together buyers and sellers of derivative and physicalcommodities and financial contracts. We conduct our regulated U.K. futures markets through our wholly-owned subsidiary, ICE Futures Europe (formerly known as ICE Futures). We conduct our regulated U.S. futuresmarkets through our wholly-owned subsidiary, ICE Futures U.S. (formerly known as the Board of Trade of theCity of New York, Inc., or NYBOT). We conduct our regulated Canadian futures markets through our wholly-owned subsidiary, ICE Futures Canada (formerly known as the Winnipeg Commodity Exchange Inc., orWCE). ICE Futures U.S. has a wholly-owned clearing house subsidiary called ICE Clear U.S. (formerlyknown as the New York Clearing Corp., or NYCC) and ICE Futures Canada has a wholly-owned clearinghouse subsidiary called ICE Clear Canada (formerly known as the WCE Clearing Corporation). We completedour acquisition of ICE Futures U.S. on January 12, 2007 and our acquisition of ICE Futures Canada onAugust 27, 2007.
We operate our business through three segments: a futures business segment, an OTC business segmentand a market data business segment. In our futures markets, we offer trading in standardized derivativecontracts on our regulated exchanges. In our OTC markets, we offer trading in over-the-counter, or off-exchange, derivative contracts, including contracts that provide for the physical delivery of an underlyingcommodity or for financial settlement based on the price of an underlying commodity. Through our marketdata segment, we offer a variety of market data services and products for both futures and OTC marketparticipants and observers.
Financial Highlights
• Our consolidated revenues increased by 83.0% to $574.3 million for the year ended December 31,2007, compared to the same period in 2006, primarily due to increased contract volumes in our futuresand OTC markets resulting from organic growth and acquisitions.
64

• Our consolidated operating expenses increased by 102.2% to $220.7 million for the year endedDecember 31, 2007, compared to the same period in 2006, primarily due to acquisitions, higher cashand non-cash compensation costs, CBOT merger-related transaction expenses and increased technologyspending.
• Our consolidated operating margin decreased to 61.6% for the year ended December 31, 2007,compared to 65.2% for the same period in 2006 primarily due to the ICE Futures U.S. acquisition andthe CBOT merger-related transaction expenses incurred during 2007.
• Our consolidated net income increased by 67.9% to $240.6 million for the year ended December 31,2007, compared to the same period in 2006.
On a consolidated basis, we recorded $574.3 million in revenues for year ended December 31, 2007, a83.0% increase compared to $313.8 million for the year ended December 31, 2006. Consolidated net incomewas $240.6 million for the year ended December 31, 2007, a 67.9% increase compared to $143.3 million forthe year ended December 31, 2006. The financial results for the year ended December 31, 2007 include$11.1 million in CBOT merger-related transaction costs, or $7.2 million after tax. Excluding these costs, ournet income would have been $247.8 million for the year ended December 31, 2007. During the year endedDecember 31, 2007, 192.0 million contracts were traded in our futures markets, up 107.1% from 92.7 millioncontracts traded during the year ended December 31, 2006. During the year ended December 31, 2007,174.9 million contract equivalents were traded in our OTC markets, up 33.7% from 130.8 million contractequivalents traded during the year ended December 31, 2006.
Our Business Environment
Our business is primarily transaction based, and our revenues and profitability relate directly to the levelof trading activity in our markets. Trading volumes are driven by a number of factors, including the degree ofvolatility in commodities prices. Price volatility increases the need to hedge contractual price risk and createsopportunities for arbitrage or speculative trading. Changes in our futures trading volumes and OTC averagedaily commissions have also been driven by varying levels of liquidity and volatility both in our markets andin the broader markets for commodities trading, which influence trading volumes across all of the markets weoperate.
We operate our energy futures and OTC markets and for ICE Futures Canada exclusively on ourelectronic platform and we currently offer ICE Futures U.S.’s markets on both our electronic platform andthrough our trading floor based in New York. We transitioned our Canadian futures contracts to our electronicplatform in the fourth quarter of 2007. We believe that the move toward electronic trade execution, togetherwith the improved accessibility for new market participants and the increased adoption of energy commoditiesas a tradable, investable asset class, has contributed to and will likely support continued secular growth in theglobal markets. As participation continues to increase and as participants continue to employ more sophisti-cated financial instruments and risk management strategies to manage their price exposure, we believe thereremains opportunity for further growth in derivatives trading on a global basis. We do not risk our own capitalby engaging in any trading activities.
Variability in Quarterly Comparisons
In addition to general conditions in the financial markets and in our markets in particular, commoditytrading has historically been subject to variability in trading volumes due primarily to five key factors. Thesefactors include:
• Geopolitical Events: Geopolitical events tend to impact global commodity prices and may impactcommodity supply. Because commodity prices often move in conjunction with changes in theperception of geopolitical risk, these events in the past have impacted trading activities in our marketsdue to the increased volatility and need for risk management in times of uncertainty.
• Weather: Weather events have been an important factor in price volatility and the supply and demandof energy, soft agricultural and agricultural commodities and, therefore, the trading activities of market
65

participants. Unexpected or extreme weather conditions, such as low temperatures or hurricanes, andother events that cause demand increases, supply disruptions or unexpected volatility tend to result inbusiness disruptions and expanded hedging and trading activity in our markets.
• Real and Perceived Supply and Demand Imbalances: Various agencies and groups, such as theInternational Energy Agency, regularly track commodity supply data. Reporting on supply or productionmay impact trading volume and price volatility due to real or perceived supply and demand imbalances.
• Number of Trading Days: The variability in the number of business days in each quarter affects ourrevenues, and will affect quarter-to-quarter revenue comparisons, since trading generally only takesplace on business days.
• Seasonality: Participants engaged in energy, soft agricultural and agricultural businesses tend toexperience moderate seasonal fluctuations in demand and price volatility, although such seasonalimpacts have been somewhat negated in periods of high volume trading.
These and other factors could cause our revenues to fluctuate from period to period. These fluctuationsmay affect the reliability of period to period comparisons of our revenues and operating results when, forexample, these comparisons are between periods in different seasons. Inter-seasonal comparisons will notnecessarily be indicative of our results for future periods.
Segment Reporting
For financial reporting purposes, as of December 31, 2007, our business is divided into three segments:our futures business segment, our OTC business segment and our market data business segment. For adiscussion of these segments and related financial disclosure, refer to note 21 to our consolidated financialstatements and related notes included elsewhere in this Annual Report on Form 10-K. We combined our U.K.futures business segment and our U.S. futures business segment into one single futures business segment tobetter reflect the manner in which management views the business and in connection with the globalization ofour futures business as a result of the acquisition of ICE Futures Canada.
66

Our Futures Business Segment
The following table presents, for the years indicated, selected statement of income data in dollars and as apercentage of revenues for our futures business segment:
2007 % 2006 % 2005 %Year Ended December 31,
(Dollar amounts in thousands)
Revenues(1):
Transaction fees, net(2):
ICE Brent Crude futures . . . . . . . . . . . . . . . . . . $ 87,308 29.8% $ 64,126 48.8% $41,334 63.4%
ICE WTI Crude futures . . . . . . . . . . . . . . . . . . . 49,942 17.0 30,683 23.3 — —
Sugar futures . . . . . . . . . . . . . . . . . . . . . . . . . . . 48,647 16.6 — — — —
Other futures products and options . . . . . . . . . . . 92,696 31.6 28,611 21.8 15,856 24.3
Intersegment fees . . . . . . . . . . . . . . . . . . . . . . . . . 3,754 1.3 4,404 3.4 5,108 7.8
Market data fees . . . . . . . . . . . . . . . . . . . . . . . . . . — — 36 — 389 0.6
Other . . . . . . . . . . . . . . . . . . . . . . . . . . . . . . . . . . 10,740 3.7 3,568 2.7 2,503 3.9
Total revenues . . . . . . . . . . . . . . . . . . . . . . . . . . . . . 293,087 100.0 131,428 100.0 65,190 100.0
Operating expenses:
Selling, general and administrative expenses(3) . . . 80,053 27.3 25,939 19.7 22,865 35.1
Intersegment expenses(4). . . . . . . . . . . . . . . . . . . . 30,836 10.5 24,892 18.9 10,289 15.8
Floor closure costs(5) . . . . . . . . . . . . . . . . . . . . . . — — — — 4,814 7.3
Depreciation and amortization . . . . . . . . . . . . . . . . 6,386 2.2 2,031 1.6 2,464 3.8
Total operating expenses . . . . . . . . . . . . . . . . . . . . . . 117,275 40.0 52,862 40.2 40,432 62.0
Operating income . . . . . . . . . . . . . . . . . . . . . . . . . . . 175,812 60.0 78,566 59.8 24,758 38.0
Other income, net . . . . . . . . . . . . . . . . . . . . . . . . . . . 14,217 4.9 1,687 1.3 2,686 4.1Income tax expense . . . . . . . . . . . . . . . . . . . . . . . . . 64,005 21.8 28,089 21.4 9,606 14.7
Net income(5) . . . . . . . . . . . . . . . . . . . . . . . . . . . . . $126,024 43.0% $ 52,164 39.7% $17,838 27.4%
(1) Revenues attributable to related parties were $424,000, $12.7 million and $11.4 million for the years endedDecember 31, 2007, 2006 and 2005, respectively. For a discussion of our related parties, see note 13 toour consolidated financial statements, which are included elsewhere in this Annual Report on Form 10-K.
(2) Our transaction fees are presented net of rebates. For a discussion of these rebates, see “— Sources ofRevenues — Transactions Fees”.
(3) Includes compensation and benefits expenses and professional services expenses.
(4) Intersegment expenses represent fees paid by our futures business segment for support provided by theOTC business segment to operate the electronic trading platform used in our futures business.
(5) The financial results for the year ended December 31, 2005 include $4.8 million in expenses incurredrelating to the closure of the open-outcry trading floor in London. Excluding these floor closure charges,net of taxes, our futures business net income for the year ended December 31, 2005 would have been$21.0 million. See “— Non-GAAP Financial Measures”.
Our ICE Brent Crude futures contract is a benchmark contract relied upon by a broad range of marketparticipants, including certain large oil producing nations, to price their crude oil. During the year endedDecember 31, 2007, the average daily quantity of Brent crude oil traded in our markets was 232.4 millionbarrels, with an average notional daily value of over $16.7 billion. We believe that market participants areincreasingly relying on this contract for their risk management activities, as evidenced by steady increases intraded volumes over the past several years. The growth of the ICE Brent Crude futures contract, as well as the
67

launch of our ICE WTI Crude futures contract in February 2006 and its continued growth, has allowed us toachieve a 47.8% market share of the global oil futures contracts traded for the year ended December 31, 2007.
In our futures business segment, we earn transaction fees from both counterparties to each futures contractor option on futures contract that is traded, based on the volume of the commodity underlying the futures oroption contract that is traded. We derived futures transaction fees of $278.6 million, $123.4 million and$57.2 million for the years ended December 31, 2007, 2006 and 2005, respectively, representing 48.5%, 39.3%and 36.7%, respectively, of our consolidated revenues. The transaction fees earned on energy futures andoption transactions, which occur through ICE Futures Europe, increased $55.5 million or 44.9% to $178.9 mil-lion for the year ended December 31, 2007 from $123.4 million during the year ended December 31, 2006.The transaction fees earned on soft agriculture and agriculture futures and options transactions, which occurthrough ICE Futures U.S. and ICE Futures Canada, were $93.8 million for the year ended December 31, 2007and transaction fees earned on financial futures and options transactions, which occur through ICE FuturesU.S., were $5.9 million for the year ended December 31, 2007.
A contract is a standardized quantity of the physical commodity underlying each futures contract. Thefollowing table presents the underlying commodity size per futures contract traded in our key futures marketsas well as the relevant standard of measure for each contract:
Futures Contract Size Measure
ICE Brent Crude . . . . . . . . . . . . . . . . . . . . . . . . . . . . . . . . . . . . . . . . . . 1,000 Barrels
ICE WTI Crude . . . . . . . . . . . . . . . . . . . . . . . . . . . . . . . . . . . . . . . . . . 1,000 Barrels
ICE Gas Oil . . . . . . . . . . . . . . . . . . . . . . . . . . . . . . . . . . . . . . . . . . . . . 1,000 Metric Tonnes
Sugar . . . . . . . . . . . . . . . . . . . . . . . . . . . . . . . . . . . . . . . . . . . . . . . . . . 112,000 Pounds
The following table presents, for the periods indicated, trading activity in our futures markets forcommodity type based on the total number of contracts traded:
2007 2006 2005Year Ended December 31,
(In thousands)
Number of futures and option contracts traded:
ICE Brent Crude futures . . . . . . . . . . . . . . . . . . . . . . . . . . . . . . . . . . 59,729 44,346 30,412
ICE WTI Crude futures(1) . . . . . . . . . . . . . . . . . . . . . . . . . . . . . . . . . 51,388 28,673 —
ICE Gas Oil futures. . . . . . . . . . . . . . . . . . . . . . . . . . . . . . . . . . . . . . 24,510 18,290 10,972
Sugar futures(2) . . . . . . . . . . . . . . . . . . . . . . . . . . . . . . . . . . . . . . . . 20,811 — —
Other futures and options(3) . . . . . . . . . . . . . . . . . . . . . . . . . . . . . . . 35,560 1,412 671
Total . . . . . . . . . . . . . . . . . . . . . . . . . . . . . . . . . . . . . . . . . . . . . . . . . 191,998 92,721 42,055
(1) A fee waiver applied to trade execution for ICE WTI Crude futures contracts from the launch date ofFebruary 3, 2006 through March 31, 2006.
(2) Sugar futures began trading on January 12, 2007 in connection with the ICE Futures U.S. acquisition.
(3) The increase in the other futures and options contracts primarily relates to the trading of the coffee futuresand options, cotton futures and options, cocoa futures and options and sugar options, which began tradingon January 12, 2007 in connection with the ICE Futures U.S. acquisition.
68

The following chart presents the futures transaction fee revenues by contract traded in our futures marketsfor the periods presented:
$-
$10,000,000
$20,000,000
$30,000,000
$40,000,000
$50,000,000
$60,000,000
$70,000,000
$80,000,000
Q105 Q205 Q305 Q405 Q106(1) Q206 Q306 Q406 Q107(2) Q207 Q307 Q407
Quarterly Futures Transaction Fee Revenues by Commodity
Brent Crude futures WTI Futures Gas Oil futuresSugar futures and options Cotton futures and options Other
(1) A fee waiver applied to trade execution for the ICE WTI Crude futures contracts from the launch date ofFebruary 3, 2006 through March 31, 2006.
(2) Sugar futures began trading on January 12, 2007 in connection with the ICE Futures U.S. acquisition.
The following table presents our average daily open interest for our futures contracts. Open interest is thenumber of contracts (long or short) that a member holds either for its own account or on behalf of its clients.Open interest refers to the total number of contracts that are currently open — in other words, contracts thathave been traded but not yet liquidated by either an offsetting trade, exercise, expiration or assignment. Openinterest is also a measure of the future activity remaining to be closed out in terms of the number of contractsthat members and their clients continue to hold in the particular contract and by the number of contracts heldfor each contract month listed by the exchange.
2007 2006 2005Year Ended December 31,
(In thousands)
Open interest — futures and options contracts:
ICE Brent Crude futures . . . . . . . . . . . . . . . . . . . . . . . . . . . . . . . . . . . . . . . 628 471 351
ICE WTI Crude futures. . . . . . . . . . . . . . . . . . . . . . . . . . . . . . . . . . . . . . . . 561 261 —
ICE Gas Oil futures . . . . . . . . . . . . . . . . . . . . . . . . . . . . . . . . . . . . . . . . . . 329 254 200
Sugar futures and options(1) . . . . . . . . . . . . . . . . . . . . . . . . . . . . . . . . . . . . 1,423 — —
Cotton futures and options(1) . . . . . . . . . . . . . . . . . . . . . . . . . . . . . . . . . . . 579 — —
Coffee futures and options(1) . . . . . . . . . . . . . . . . . . . . . . . . . . . . . . . . . . . 339 — —
Cocoa futures and options(1) . . . . . . . . . . . . . . . . . . . . . . . . . . . . . . . . . . . . 188 — —
Other futures and options . . . . . . . . . . . . . . . . . . . . . . . . . . . . . . . . . . . . . . 86 98 42
Total . . . . . . . . . . . . . . . . . . . . . . . . . . . . . . . . . . . . . . . . . . . . . . . . . . . . . 4,133 1,084 593
(1) Sugar, cotton, coffee and cocoa futures and options began trading on January 12, 2007 in connection withthe ICE Futures U.S. acquisition.
We charge transaction fees to the clearing members of ICE Futures Europe, ICE Futures U.S. and ICEFutures Canada for contracts traded for their own account and for contracts traded on behalf of their customersor local traders.
69

Our OTC Business Segment
The following table presents, for the years indicated, selected statement of income data in dollars and as apercentage of revenues for our OTC business segment:
2007 % 2006 % 2005 %Year Ended December 31,
(Dollar amounts in thousands)
Revenues(1):
Transaction fees, net(2):
North American natural gas . . . . . . . . . . . . . . . . $155,533 56.6% $117,302 60.0% $59,911 62.9%
North American power . . . . . . . . . . . . . . . . . . . 43,349 15.8 27,223 13.9 16,444 17.3
Other commodities markets . . . . . . . . . . . . . . . . 6,873 2.6 2,175 1.1 1,851 1.9
Electronic trade confirmation . . . . . . . . . . . . . . . 6,010 2.2 3,509 1.8 1,580 1.7
Intersegment fees . . . . . . . . . . . . . . . . . . . . . . . . . 32,311 11.8 26,704 13.7 11,034 11.6
Market data fees . . . . . . . . . . . . . . . . . . . . . . . . . . 27,256 9.9 16,168 8.3 2,649 2.8
Other . . . . . . . . . . . . . . . . . . . . . . . . . . . . . . . . . . 2,782 1.1 2,366 1.2 1,744 1.8
Total revenues . . . . . . . . . . . . . . . . . . . . . . . . . . . . . 274,114 100.0 195,447 100.0 95,213 100.0
Operating expenses:
Selling, general and administrative expenses(3) . . . 94,350 34.4 67,451 34.5 40,808 42.9
Intersegment expenses . . . . . . . . . . . . . . . . . . . . . . 19,405 7.1 11,221 5.7 1,352 1.4CBOT merger-related transaction costs(4) . . . . . . . 11,121 4.1 — — — —
Settlement expense(5) . . . . . . . . . . . . . . . . . . . . . . — — — — 15,000 15.8
Depreciation and amortization . . . . . . . . . . . . . . . . 26,286 9.6 11,671 6.0 12,609 13.2
Total operating expenses . . . . . . . . . . . . . . . . . . . . . . 151,162 55.1 90,343 46.2 69,769 73.3
Operating income . . . . . . . . . . . . . . . . . . . . . . . . . . . 122,952 44.9 105,104 53.8 25,444 26.7
Other income (expense), net . . . . . . . . . . . . . . . . . . . (9,846) (3.6) 6,248 3.2 589 0.6
Income tax expense . . . . . . . . . . . . . . . . . . . . . . . . . 33,907 12.4 33,858 17.3 7,698 8.0
Net income(4)(5) . . . . . . . . . . . . . . . . . . . . . . . . . . . $ 79,199 28.9% $ 77,494 39.7% $18,335 19.3%
(1) Revenues attributable to related parties were $1.3 million, $3.2 million and $6.0 million for the yearsended December 31, 2007, 2006 and 2005, respectively. For a discussion of our related parties, see note 13to our consolidated financial statements, which are included elsewhere in this Annual Report onForm 10-K.
(2) Our transaction fees are presented net of rebates. For a discussion of these rebates, see “— Sources ofRevenues — Transaction Fees”.
(3) Includes compensation and benefits expenses, professional services expenses and patent royalty expenses.
(4) The financial results for the year ended December 31, 2007 include $11.1 million in CBOT merger-relatedtransaction costs. Excluding these costs, net of taxes, our OTC business net income for the year endedDecember 31, 2007 would have been $86.4 million. See “— Non-GAAP Financial Measures”.
(5) The financial results for the year ended December 31, 2005 include a $15.0 million settlement expenserelated to the payment made to EBS to settle litigation. Excluding this expense, net of taxes, our OTCbusiness net income for the year ended December 31, 2005 would have been $27.9 million. See “— Non-GAAP Financial Measures”.
Revenues in our OTC business segment are generated primarily through transaction fees earned fromtrades. While we charge a monthly data access fee for access to our electronic platform, we derive asubstantial portion of our OTC revenues from transaction fees paid by participants for each trade that theyexecute or clear based on the underlying commodity volume. Transaction fees are payable by each
70

counterparty to a trade and, for bilateral trades, are generally due within 30 days of the invoice date. Wederived transaction fees for OTC trades executed on our electronic platform of $205.8 million, $146.7 millionand $78.2 million for the years ended December 31, 2007, 2006 and 2005, respectively, representing 35.8%,46.7% and 50.2%, respectively, of our consolidated revenues. Our OTC commission rates vary by product andare based on the volume of the commodity underlying the contract that is traded.
In addition to our transaction fees, a participant that chooses to clear a trade must currently pay a fee toLCH.Clearnet for the benefit of clearing and another for the services of the relevant member clearing firm, orFCMs. Consistent with our ICE Futures U.S. business, we currently do not derive any direct revenues from theclearing process and participants pay the clearing fees directly to LCH.Clearnet and the FCMs. However, wehave announced plans to launch ICE Clear Europe in the third quarter of 2008. For the years endedDecember 31, 2007, 2006 and 2005, transaction fees related to cleared trades represented 69.3%, 71.8% and69.3% of our total OTC revenues, respectively, net of intersegment fees. We intend to continue to support theintroduction of these products in response to the requirements of our participants.
The following tables present, for the periods indicated, the total volume of the underlying commodity andnumber of contracts traded in our OTC markets, measured in the units indicated in the footnotes:
2007 2006 2005Year Ended December 31,
(In millions)
Total volume — OTC:
North American natural gas(1) . . . . . . . . . . . . . . . . . . . . . . . . . . . . 394,880 302,591 138,809
North American power(2) . . . . . . . . . . . . . . . . . . . . . . . . . . . . . . . 5,492 4,000 2,140
Global oil and refined products(3) . . . . . . . . . . . . . . . . . . . . . . . . . 907 576 981
2007 2006 2005Year Ended December 31,
(In thousands)
Number of OTC contracts traded(4):
North American natural gas . . . . . . . . . . . . . . . . . . . . . . . . . . . . . . . 157,956 121,047 55,524
North American power . . . . . . . . . . . . . . . . . . . . . . . . . . . . . . . . . . 8,331 6,014 3,145
Global oil . . . . . . . . . . . . . . . . . . . . . . . . . . . . . . . . . . . . . . . . . . . . 8,471 3,771 3,320
Other . . . . . . . . . . . . . . . . . . . . . . . . . . . . . . . . . . . . . . . . . . . . . . . 100 — 10
Total . . . . . . . . . . . . . . . . . . . . . . . . . . . . . . . . . . . . . . . . . . . . . . . . 174,858 130,832 61,999
(1) Measured in million British thermal units, or MMBtu.
(2) Measured in megawatt hours.
(3) Measured in equivalent barrels of oil.
(4) These OTC market volumes are converted into contracts based on the conversion ratios in the table below.
The following table presents the underlying commodity size for selected OTC contracts traded in ourOTC markets as well as the relevant standard of measure for such contracts:
OTC Contract Size Measure
Financial gas . . . . . . . . . . . . . . . . . . . . . . . . . . . . . . . . . . . . . . 2,500 MMBtu
Physical gas . . . . . . . . . . . . . . . . . . . . . . . . . . . . . . . . . . . . . . 2,500 MMBtu
European gas . . . . . . . . . . . . . . . . . . . . . . . . . . . . . . . . . . . . . . 25,000 Therms per day
East power. . . . . . . . . . . . . . . . . . . . . . . . . . . . . . . . . . . . . . . . 800 Megawatt Hours per day
West power . . . . . . . . . . . . . . . . . . . . . . . . . . . . . . . . . . . . . . . 400 Megawatt Hours per day
Crude oil . . . . . . . . . . . . . . . . . . . . . . . . . . . . . . . . . . . . . . . . . 1,000 Barrels
Refined oil . . . . . . . . . . . . . . . . . . . . . . . . . . . . . . . . . . . . . . . 100 Barrels
71

The following chart presents the OTC transaction fee revenues by commodity traded in our markets forthe periods presented:
$-
$10,000,000
$20,000,000
$30,000,000
$40,000,000
$50,000,000
$60,000,000
$70,000,000
Q105 Q205 Q305 Q405 Q106 Q206 Q306 Q406 Q107 Q207 Q307 Q407
Quarterly OTC Transaction Fee Revenues by Commodity
Natural Gas Power Other
The following table presents our average monthly open interest for our cleared OTC contracts:
2007 2006 2005Year Ended December 31,
(In thousands)
Open interest — cleared OTC contracts:
North American natural gas . . . . . . . . . . . . . . . . . . . . . . . . . . . . . . . . . . . 4,566 2,910 981
North American power . . . . . . . . . . . . . . . . . . . . . . . . . . . . . . . . . . . . . . . 961 569 273
Global oil and refined products . . . . . . . . . . . . . . . . . . . . . . . . . . . . . . . . . 26 20 44
Total . . . . . . . . . . . . . . . . . . . . . . . . . . . . . . . . . . . . . . . . . . . . . . . . . . . . 5,553 3,499 1,298
Our Market Data Business Segment
The following table presents, for the years indicated, selected statement of income data in dollars and as apercentage of revenues for our market data business segment:
2007 % 2006 % 2005 %Year Ended December 31,
(Dollar amounts in thousands)
Revenues(1):Market data fees . . . . . . . . . . . . . . . . . . . . . . . $43,140 69.3% $18,032 61.8% $11,604 86.2%Intersegment fees. . . . . . . . . . . . . . . . . . . . . . . 19,079 30.7 11,123 38.2 1,864 13.8Other. . . . . . . . . . . . . . . . . . . . . . . . . . . . . . . . 17 — — — — —
Total revenues . . . . . . . . . . . . . . . . . . . . . . . . . . . 62,236 100.0 29,155 100.0 13,468 100.0
Operating expenses:Selling, general and administrative
expenses(2) . . . . . . . . . . . . . . . . . . . . . . . . . 2,505 4.0 2,060 7.1 1,090 8.0Intersegment expenses . . . . . . . . . . . . . . . . . . . 4,903 7.9 6,118 21.0 6,365 47.3Depreciation and amortization . . . . . . . . . . . . . 29 — 12 — 10 0.1
Total operating expenses . . . . . . . . . . . . . . . . . . . 7,437 11.9 8,190 28.1 7,465 55.4
Operating income . . . . . . . . . . . . . . . . . . . . . . . . 54,799 88.1 20,965 71.9 6,003 44.6Other income (expense), net . . . . . . . . . . . . . . . . 500 0.8 (27) (0.1) 515 3.8Income tax expense . . . . . . . . . . . . . . . . . . . . . . . 19,910 32.0 7,328 25.1 2,281 16.9
Net income . . . . . . . . . . . . . . . . . . . . . . . . . . . . . $35,389 56.9% $13,610 46.7% $ 4,237 31.5%
72

(1) Revenues attributable to related parties were $157,000 and $198,000 for the years ended December 31,2006 and 2005, respectively. For a discussion of our related parties, see note 13 to our consolidated finan-cial statements, which are included elsewhere in this Annual Report on Form 10-K.
(2) Includes compensation and benefits expenses and professional services expenses.
We earn terminal and license fee revenues that we receive from data vendors through the distribution ofreal-time and historical futures prices and other futures market data derived from trading in our futuresmarkets. We also earn subscription fee revenues from OTC daily indices, view only access to the OTC marketsand OTC and futures end of day reports. In addition, we manage the market price validation curves wherebyparticipant companies subscribe to receive consensus market valuations.
Intersegment Fees
Our OTC business segment provides and supports the platform for electronic trading in our futuresbusiness segment. Intersegment fees include charges for developing, operating, managing and supporting theplatform for electronic trading in our futures business segment. Our futures business segment and our OTCbusiness segment provide access to trading volumes to our market data business segment. Our market databusiness segment provides marketing and other promotional services to our OTC business segment. Wedetermine the intercompany or intersegment fees to be paid by the business segments based on transfer pricingstandards and independent documentation. These intersegment fees have no impact on our consolidatedoperating results. We expect the structure of these intersegment fees to remain unchanged and expect that theywill continue to have no impact on our consolidated operating results.
Sources of Revenues
Our revenues are comprised of transaction fees, market data fees and other revenues.
Transaction Fees
Transaction fees have accounted for, and are expected to continue to account for, a substantial portion ofour revenues. Transaction fees consist of exchange fees earned on futures transactions, commission fees earnedon OTC transactions, electronic confirmation fees and, for transactions executed on ICE Futures U.S. and ICEFutures Canada, clearing fees. We charge commission fees or exchange fees to both the buyer and the seller ineach transaction executed on our platform. Commission fees and exchange fees are based on the number ofcontracts traded during each month multiplied by the commission rate. A change to either our commission rateor to the volume of contracts we execute directly affects our revenues. We also accept transactions thatparticipants execute off-platform but wish to have processed for clearing. We do not risk our own capital byengaging in any trading activities.
Transaction fees are presented net of rebates. We recorded rebates in our OTC business segment of$3.5 million, $203,000 and $376,000 for the years ended December 31, 2007, 2006 and 2005, respectively. Werecorded rebates in ICE Futures Europe of $30.1 million, $7.2 million and $200,000 for the years endedDecember 31, 2007, 2006 and 2005, respectively. The rebate program has reduced ICE Futures Europe’saverage rate per contract by $0.21, $0.08 and $0.01 for the years ended December 31, 2007, 2006 and 2005,respectively. The increase in the rebates at ICE Futures Europe is primarily related to the rebates offered onthe ICE WTI Crude futures contract. We recorded rebates in ICE Futures U.S. of $3.5 million during the yearended December 31, 2007. The rebate program has reduced the ICE Futures U.S. average rate per contract by$0.07 for the year ended December 31, 2007. We recorded rebates in ICE Futures Canada of $149,000 duringthe year ended December 31, 2007. We offer rebates in certain of our markets primarily to help generatemarket liquidity and trading volumes by providing customers trading in those markets a full or partial discountto the applicable commission rate. Typically, we offer these rebates until we believe the market has generatedsufficient liquidity and volume so that the rebates are no longer needed to sustain and promote liquidity. Theserebates reduce revenue that we would have generated had we charged full commissions and had we generatedthe same volume without the rebate program.
73
Market Data Fees
Market data fees consist of terminal fees and license fees that we receive from data vendors in exchangefor the provision of real-time price information generated from our futures markets through ICE Data. Weinvoice these data vendors monthly for terminal fees based on the number of terminals that carry our futuresmarket data. Each data vendor also pays an annual license fee which is deferred and recognized as revenueratably over the period for which services are provided.
Market data fees consist of data access fees that we have historically charged to participants or customersthat were not active traders who were registered to trade or view OTC natural gas and power products on ourelectronic platform. The data access fees were based on their historical trading activity and the number ofusers the participant firm had registered to trade on our platform. We recognized the difference between themonthly data access fee for a given participant and the actual amount of commission fees generated by suchparticipant for trading activity in that month as data access revenues. Beginning in March 2006, we changedthe methodology for charging OTC data access fees. The OTC data access fees are charged on a per-user basisto those accessing our platform (both trading and view only access). We also began to charge data access feesin our energy futures business segment beginning in February 2006, at the individual user level. The futuresdata access fees replaced the futures system user fees that were previously charged to our energy futuresexchange members.
Market data fees also consist of subscription fees that we receive from market participants who subscribeto our OTC market data services through ICE Data. ICE Data has an exclusive license to use our OTC marketdata and publishes the ICE Data end of day report, ICE daily indices, as well as market price validationcurves, which are available to subscribers for a monthly subscription fee. ICE Data also markets real-timeview only screen access to OTC markets and charges subscribers a fee that varies depending on the number ofusers and the markets accessed at each subscribing company. The revenues we receive from market data feesare deferred and recognized as revenue ratably over the period for which services are provided.
Other Revenues
Other revenues primarily include revenues generated from membership fees, training seminars, traderegistration system fees, eCOPS documentation fees, initiation fees, booth fees, broker telephone fees, gradingfees, certification fees and licensing fees charged to the Chicago Climate Exchange, or CCX, and the EuropeanClimate Exchange, or ECX, among others.
Other revenues include fees charged to CCX, a self-regulated marketplace that administers a voluntarymulti-sector greenhouse gas reduction and trading program for North America. We, through our OTC businesssegment, have been contracted to provide, design and service CCX’s electronic markets on our tradingplatform in the United States. We charge licensing and service fees in advance to CCX on a monthly basis andthese fees are recognized as services are provided. We also have an agreement, through our energy futuresbusiness, with CCX and its wholly-owned subsidiary, ECX, to list certain European emissions contracts on ourplatform. Under this agreement, we have charged ECX certain operating costs, which represented 27.5% ofthe net European emissions membership fees and 27.5% of the net transaction fees earned from the Europeanemissions contracts traded on our platform.
Components of Expenses
Compensation and Benefits
Compensation and benefits expenses primarily consist of salaries, non-cash stock based compensation,bonuses, payroll taxes, employer-provided medical and other benefit plan costs and recruiting costs. Substan-tially all of our employees are full-time employees. We capitalized and recorded as property and equipment aportion of our compensation and benefits costs for technology employees engaged in software developmentand the enhancement of our electronic platform.
74

Professional Services
Professional services expenses primarily consist of outside legal, accounting and other professional andconsulting services expenses. We capitalize and record as property and equipment a portion of the costsassociated with fees for technology consultants engaged in software development and enhancements to ourelectronic platform. We expensed the remaining portion of these fees in the month in which they wereincurred.
Patent Royalty
We entered into a long-term, non-exclusive licensing agreement with a third party, which granted us theuse of the third party’s patent. Under the agreement, we were required to pay minimum annual license feesthrough the expiration date of the patent on February 20, 2007 along with additional royalty paymentscalculated quarterly based upon the volume of certain futures transactions executed on our platform. Thislicensing agreement ended on February 20, 2007 and no payments are required after this date.
CBOT Merger-Related Transaction Costs
We incurred transaction costs directly relating to our proposed merger with CBOT. We did not succeedwith our proposed merger with CBOT, and CME completed its acquisition of CBOT on July 13, 2007. Themerger-related transaction costs include investment banking advisors, legal advisors, accounting advisors,proxy advisors, public relation services and other external costs directly related to the proposed transaction.These costs were recorded primarily during the three months ended June 30, 2007.
Selling, General and Administrative
The major expense categories within selling, general and administrative expenses include hostingexpenses, hardware and software support expenses, rent and occupancy expenses, and marketing expenses.Cost of hosting expenses primarily consist of the amounts we pay for the physical facilities, and maintenanceand other variable costs associated with securely housing the hardware used to operate our electronic platform,as well as our redundant disaster recovery facility. Cost of hosting also includes participant network expenseswe pay to provide participants with direct connectivity to our platform. Hardware and software supportexpenses primarily consist of external hardware and software maintenance and support costs and traderegistration system costs. We currently lease office space in Atlanta, New York, Houston, Chicago, London,Singapore, Dublin, Winnipeg and Calgary. Our rent costs consist primarily of rent expense for these properties.Our occupancy expenses primarily relate to the use of electricity, telephone lines and other miscellaneousoperating costs. Marketing expenses primarily consist of advertising, public relations and product promotionand brand awareness campaigns, as well as for new and existing products and services. These expenses alsoinclude our participation in seminars, trade shows, conferences and other industry events. Other selling,general and administrative costs primarily consist of telephone and communications expense, corporateinsurance expense, travel expense, meals and entertainment expense and dues, subscriptions and registrationexpense.
Depreciation and Amortization
We depreciate and/or amortize costs related to our property and equipment, including computer andnetwork equipment, software and internally developed software, office furniture and equipment and leaseholdimprovements. We compute depreciation expense using the straight-line method based on estimated usefullives of the assets, or in the case of leasehold improvements, the shorter of the lease term or the estimateduseful life of the assets, which range from three to seven years. Gains on disposal of property and equipmentare included in other income, losses on disposals of property and equipment are included in depreciationexpense and maintenance and repairs are expensed as incurred. We do not amortize goodwill and intangibleassets with indefinite lives. We amortize intangible assets with contractual or finite useful lives, in each caseover the estimated useful lives of the intangible assets.
75

We capitalize costs, both internal and external, direct and incremental, related to software developed orobtained for internal use in accordance with AICPA Statement of Position 98-1, Accounting for Costs ofComputer Software Developed or Obtained for Internal Use. Costs incurred in the application developmentphase are capitalized and amortized over the useful life of the software, for a period not to exceed three years.
Other Income (Expense)
Other income (expense) consists primarily of interest income and expense, as well as gains and losses onforeign currency transactions. We generate interest income from the investment of our cash and cashequivalents, short-term investments and restricted cash. We incur interest expense on our interest onoutstanding indebtedness, the unused fee calculated under our revolving credit facility and interest on theRussell license agreement. We also recognized a gain during the year ended December 31, 2007 for the sale ofour former open-outcry disaster recovery site in London.
Provision for Income Taxes
Our provision for income taxes consists of current and deferred tax provisions relating to federal, stateand local taxes, as well as taxes related to foreign subsidiaries. We file a consolidated United States federalincome tax return and file state income tax returns on a separate, combined or consolidated basis inaccordance with relevant state laws and regulations. Our foreign subsidiaries are based in the United Kingdom,the Netherlands and Canada and we file separate local country income tax returns and take advantage of theUnited Kingdom’s group relief provisions when applicable. The difference between the statutory income taxrate and our effective tax rate for a given fiscal period is primarily a reflection of the tax effects of our foreignoperations, general business and tax credits, tax exempt income, state income taxes and the non-deductibilityof certain expenses.
We recorded a tax benefit of $3.6 million in the second quarter of 2007 related to the recognition of theindefinite reinvestment provision of Accounting Principles Board, or APB, Opinion No. 23, Accounting forIncome Taxes — Special Areas. The indefinite reinvestment provision of APB Opinion No. 23 specifies thatU.S. income taxes should not be accrued on the undistributed earnings of a foreign subsidiary if those earningshave been or will be indefinitely invested outside the U.S. We had previously accrued U.S. income taxes on aportion of the undistributed earnings of our foreign subsidiaries.
Year Ended December 31, 2007 Compared to Year Ended December 31, 2006
Overview
Consolidated net income increased $97.3 million, or 67.9%, to $240.6 million for the year endedDecember 31, 2007 from $143.3 million for the comparable period in 2006. Net income from our futuresbusiness segment increased $73.9 million, or 141.6%, to $126.0 million for the year ended December 31, 2007from $52.2 million for the comparable period in 2006, primarily due to higher transaction fee revenues, whichbenefited from our acquisition of ICE Futures U.S. and ICE Futures Canada in 2007. Net income from ourOTC business segment increased $1.7 million, or 2.2%, to $79.2 million for the year ended December 31,2007 from $77.5 million for the comparable period in 2006. Net income in our OTC business segmentincreased primarily due to higher transaction fee revenues, offset by $11.1 million in CBOT merger-relatedtransaction costs incurred during the year ended December 31, 2007 and $15.7 million in interest expenseincurred during the year ended December 31, 2007. Net income from our market data business segmentincreased $21.8 million, or 160.0%, to $35.4 million for the year ended December 31, 2007 from $13.6 millionfor the comparable period in 2006. Net income in our market data business segment increased primarily due toincreased market data sales in our futures business. Consolidated operating income, as a percentage ofconsolidated revenues, decreased to 61.6% for the year ended December 31, 2007 from 65.2% for thecomparable period in 2006. Consolidated net income, as a percentage of consolidated revenues, decreased to41.9% for the year ended December 31, 2007 from 45.7% for the comparable period in 2006.
Our consolidated revenues increased $260.5 million, or 83.0%, to $574.3 million for the year endedDecember 31, 2007 from $313.8 million for the comparable period in 2006. This increase is primarily
76

attributable to increased trading volumes on our electronic trading platform, revenues derived from ICEFutures U.S. and ICE Futures Canada following their acquisition, and increased non-transaction revenues,primarily market data fees. A significant factor driving our revenues and volume growth during this periodwas the continued growth in trading volume of our energy futures and cleared OTC contracts as a result ofincreasing participation in these markets and demand to risk management within the energy sector.
Consolidated operating expenses increased $111.6 million, or 102.2%, to $220.7 million for the yearended December 31, 2007 from $109.2 million for the comparable period in 2006. This increase is primarilyattributable to $55.7 million in ICE Futures U.S. operating expenses during the year ended December 31,2007, amortization expenses on the ICE Futures U.S. intangibles of $8.2 million during year endedDecember 31, 2007, $11.1 million in CBOT merger-related transaction costs being incurred during the yearended December 31, 2007, and higher compensation expenses during the year ended December 31, 2007 dueto non-cash compensation expenses recognized under the Statement of Financial Accounting Standards, orSFAS No. 123(R), and an increase in our employee headcount.
Revenues
Transaction Fees
Consolidated transaction fees increased $216.7 million, or 79.2%, to $490.4 million for the year endedDecember 31, 2007 from $273.6 million for the comparable period in 2006. Transaction fees, as a percentageof consolidated revenues, decreased to 85.4% for the year ended December 31, 2007 from 87.2% for thecomparable period in 2006.
Transaction fees generated in our futures business segment increased $155.2 million, or 125.7%, to$278.6 million for the year ended December 31, 2007 from $123.4 million for the comparable period in 2006,while increasing as a percentage of consolidated revenues to 48.5% for the year ended December 31, 2007from 39.3% for the comparable period in 2006. The increase in transaction fees was primarily due to ouracquisitions of ICE Futures U.S. and ICE Futures Canada on January 12, 2007 and August 27, 2007,respectively, an increase in our energy futures contract volumes and a transaction fee increase effective July 1,2007 for ICE Futures Europe, partially offset by an increase in the transaction fee rebates for certain futurescontracts. Futures contract volumes increased for ICE Futures Europe primarily due to increased liquiditybrought by new market participants due to electronic trading and increased trading of the ICE WTI Crudefutures contract, which was launched in February 2006. Volumes at ICE Futures Europe increased 49.3% to138.5 million contracts traded during the year ended December 31, 2007 from 92.7 million contracts tradedduring the comparable period in 2006. ICE Futures U.S. adjusted its exchange fee rates effective August 1,2007, including adding a surcharge on certain electronic trading products. Average transaction fees per tradingday for our futures business segment increased 132.7% to $1.1 million per trading day for the year endedDecember 31, 2007 from $482,000 per trading day for the comparable period in 2006.
Transaction fees generated in our OTC business segment increased $61.6 million, or 41.0%, to $211.8 millionfor the year ended December 31, 2007 from $150.2 million for the comparable period in 2006, primarily due toincreased trading volumes. Transaction fees in this segment, as a percentage of consolidated revenues, decreased to36.9% for the year ended December 31, 2007 from 47.9% for the comparable period in 2006. The decline in thepercentage of consolidated revenues is due to the inclusion of the ICE Futures U.S. and ICE Futures Canadarevenues in 2007 after their acquisitions. The number of transactions or trades executed in our OTC businesssegment increased by 55.8% to 5.9 million trades for the year ended December 31, 2007 from 3.8 million tradesfor the comparable period in 2006. Average transaction fees per trading day for our OTC business segmentincreased 43.5% to $845,000 per trading day for the year ended December 31, 2007 from $589,000 per trading dayfor the comparable period in 2006.
Increased volumes in our OTC business segment were primarily due to increased trading activity inNorth American natural gas and power markets as a result of the availability of cleared OTC contracts, as wellas increased liquidity brought by new market participants and increased volatility relating to geopolitical events,real and perceived supply and demand imbalances and weather. Transaction fees generated by trading inNorth American natural gas contracts increased $37.9 million, or 32.3%, to $155.2 million for year ended
77

December 31, 2007 from $117.3 million for the comparable period in 2006. In addition, transaction feesgenerated by trading in North American power contracts increased $16.1 million, or 59.2%, to $43.3 million forthe year ended December 31, 2007 from $27.2 million for the comparable period in 2006. The continued growthin trading volumes in OTC contracts can be attributed in part to the continued introduction and use of clearedOTC contracts, which eliminates the need for a counterparty to post capital against each trade and also reducesrequirements for entering into multiple negotiated bilateral settlement agreements to enable trading with othercounterparties.
Revenues derived from electronic trade confirmation fees in our OTC business segment increased$2.5 million, or 71.3%, to $6.0 million for the year ended December 31, 2007 from $3.5 million for thecomparable period in 2006. Consolidated electronic trade confirmation fees, as a percentage of consolidatedrevenues, decreased to 1.0% for the year ended December 31, 2007 from 1.1% for the comparable period in2006.
Market Data Fees
Consolidated market data fees increased $36.2 million, or 105.6%, to $70.4 million for the year endedDecember 31, 2007 from $34.2 million for the comparable period in 2006. This increase was primarily due tothe new terminal fees and license fees that we receive from data vendors derived from ICE FuturesU.S. following our acquisition, increased data access fees in our OTC markets and increased terminal fees andlicense fees that we receive from data vendors in exchange for the provision of real-time price informationgenerated from ICE Futures Europe. During the year ended December 31, 2007 and 2006, we recognized$28.9 million and $17.6 million, respectively, in data access fees and terminal fees in our energy futures andOTC businesses. During the year ended December 31, 2007 and 2006, we recognized $13.5 million and$11.5 million, respectively, in terminal and license fees from data vendors in our energy futures business. Theincrease in the market data fees received from data vendors in our energy futures business was due to both anincrease in the average fee per terminal and an increase in the number of terminals. We recognized$20.9 million in terminal and license fees from data vendors of ICE Futures U.S. during the year endedDecember 31, 2007. ICE Futures U.S. adjusted its market data rates effective June 1, 2007. Consolidatedmarket data fees, as a percentage of consolidated revenues, increased to 12.3% for the year endedDecember 31, 2007 from 10.9% for the comparable period in 2006.
Other Revenues
Consolidated other revenues increased $7.6 million to $13.5 million for the year ended December 31,2007 from $5.9 million for the comparable period in 2006. This increase was primarily due to traderegistration system fees of $2.0 million recognized during the year ended December 31, 2007 and $6.0 millionin other revenues relating to ICE Futures U.S. Other revenues for ICE Futures U.S. include certification fees,grading fees, booth fees and broker telephone billing fees. Consolidated other revenues, as a percentage ofconsolidated revenues, increased to 2.4% for the year ended December 31, 2007 from 1.9% for the comparableperiod in 2006.
Expenses
Compensation and Benefits
Consolidated compensation and benefits expenses increased $51.6 million, or 103.8%, to $101.4 millionfor the year ended December 31, 2007 from $49.8 million for the comparable period in 2006. This increasewas primarily due to the inclusion of $25.9 million in compensation and benefits expenses relating to ICEFutures U.S. in our consolidated results for the year ended December 31, 2007, an increase in non-cashcompensation expenses and an increase in our employee headcount. The non-cash compensation expensesrecognized in our consolidated financial statements for our stock options and restricted stock were $23.6 mil-lion for the year ended December 31, 2007 as compared to $8.8 million for the comparable period in 2006.This increase was primarily due to non-cash compensation costs recognized for the performance-basedrestricted stock that was granted in December 2006. Our employee headcount increased from 226 employees
78

as of December 31, 2006 to 277 employees as of December 31, 2007 (excluding the employees acquired as aresult of our acquisitions). ICE Futures U.S. employee headcount decreased from 282 employees as ofJanuary 12, 2007, the acquisition date, to 198 employees as of December 31, 2007. We had an additional31 employees as of December 31, 2007 relating to the other four acquisitions.
We expect that our compensation and benefits expenses will vary from year to year as a percentage oftotal revenues due to additional employees associated with the growth of our business, accrual of bonuses, anddue to non-cash compensation expenses recognized in accordance with SFAS No. 123(R). Over the next year,we expect compensation and benefits expenses to increase from current levels. Consolidated compensation andbenefits expenses, as a percentage of consolidated revenues, increased to 17.7% for year ended December 31,2007 from 15.9% for the comparable period in 2006.
Professional Services
Consolidated professional services expenses increased $11.7 million, or 102.3%, to $23.0 million for theyear ended December 31, 2007 from $11.4 million for the comparable period in 2006. This increase wasprimarily due to the inclusion of $6.0 million in ICE Futures U.S. professional services expenses in ourconsolidated results for the year ended December 31, 2007 and $3.5 million in professional services expensesincurred relating to the establishment of ICE Clear Europe, our European clearing house we are in the processof establishing.
We expect our professional services expenses to increase in absolute terms in future periods in connectionwith the growth of our business. As a percentage of total revenues, our professional services expenses maydecrease in future periods. Consolidated professional services expenses, as a percentage of consolidatedrevenues, increased to 4.0% for the year ended December 31, 2007 from 3.6% for the comparable period in2006.
Patent Royalty
Patent royalty expenses decreased $7.3 million to $1.7 million for the year ended December 31, 2007from $9.0 million for the comparable period in 2006. Consolidated patent royalty expenses, as a percentage ofconsolidated revenues, decreased to 0.3% for the year ended December 31, 2007 from 2.9% for thecomparable period in 2006. The patent licensing agreement terminated on February 20, 2007 and there wereno patent royalty expenses after this date.
CBOT Merger-Related Transaction Costs
CBOT merger-related transaction costs were $11.1 million for the year ended December 31, 2007.Consolidated CBOT merger-related transaction costs, as a percentage of consolidated revenues, were 1.9% forthe year ended December 31, 2007. We did not incur any CBOT merger-related transaction costs during theyear ended December 31, 2006.
Selling, General and Administrative
Consolidated selling, general and administrative expenses increased $25.5 million, or 100.9%, to$50.8 million for the year ended December 31, 2007 from $25.3 million for the comparable period in 2006.This increase was primarily due to $19.1 million of selling, general and administrative expenses related to thebusiness of ICE Futures U.S. and increased costs of hosting expenses, hardware and software support,marketing expenses and rent expense that resulted from the growth of our business. We have begun to relocateour technology operations and our support systems, including our primary data center and our disasterrecovery site, to Chicago. Our disaster recovery site was relocated from London to Chicago in June 2007. Theprimary data center migrated from Atlanta to Chicago in January 2008. Therefore, we have incurred someredundant costs at our technology facilities in Atlanta, London and Chicago during this transition period.
We expect our selling, general and administrative expenses to increase in absolute terms in future periodsin connection with the growth of our business. As a percentage of total revenues, our selling, general and
79

administrative expenses may decrease in future periods due to anticipated revenue growth in excess of theselling, general and administrative expenses growth. Consolidated selling, general and administrative expenses,as a percentage of consolidated revenues, increased to 8.8% for the year ended December 31, 2007 from 8.1%for the comparable period in 2006.
Depreciation and Amortization
Consolidated depreciation and amortization expenses increased $19.0 million, or 138.5%, to $32.7 millionfor the year ended December 31, 2007 from $13.7 million for the comparable period in 2006. This increasewas primarily due to the amortization on the acquired ICE Futures U.S. intangibles of $8.2 million for theyear ended December 31, 2007, the depreciation on the $43.3 million in fixed asset additions incurred duringthe year ended December 31, 2007 and the inclusion of $4.5 million in ICE Futures U.S. depreciationexpenses in our consolidated results for the year ended December 31, 2007.
We anticipate that depreciation and amortization expenses will increase in future periods due to theamortization of acquired intangible assets and the increase in our capital expenditures in 2007 and in theforeseeable future. Consolidated depreciation and amortization expenses, as a percentage of consolidatedrevenues, increased to 5.7% for the year ended December 31, 2007 from 4.4% for the comparable period in2006.
Other Income (Expense)
Consolidated other income decreased $3.0 million to $4.9 million for the year ended December 31, 2007from $7.9 million for the comparable period in 2006. This decrease primarily related to the increase in interestexpense, partially offset by the gain recognized on the sale of an asset and an increase in interest income.Interest expense increased $18.4 million to $18.6 million for the year ended December 31, 2007 from$231,000 for the comparable period in 2006 primarily due to $15.1 million in interest expense andamortization associated with our $500.0 million credit facility and interest expense of $3.1 million relating tothe Russell License. We recognized a gain of $9.3 million during the year ended December 31, 2007 on thesale of our former disaster recovery site used for our former open-outcry physical trading floor in London.Interest income increased $3.3 million to $11.9 million for the year ended December 31, 2007 from$8.6 million for the comparable period in 2006 primarily due to an increase in our cash balances from the netcash provided by operations.
Income Taxes
Consolidated tax expense increased $48.5 million to $117.8 million for the year ended December 31,2007 from $69.3 million for the comparable period in 2006, primarily due to the increase in our pre-taxincome. Our effective tax rate increased to 32.9% for the year ended December 31, 2007 from 32.6% for thecomparable period in 2006, primarily due to higher New York State and City tax rates associated with theoperations of ICE Futures U.S., which were partially offset by a decrease in the amount of U.S. taxes accruedon foreign earnings and an increase in tax credits generated.
Year Ended December 31, 2006 Compared to Year Ended December 31, 2005
Overview
Consolidated net income increased $102.9 million, or 254.5%, to $143.3 million for the year endedDecember 31, 2006 from $40.4 million for the comparable period in 2005. Net income from our futuresbusiness segment increased $34.3 million, or 192.4%, to $52.2 million for the year ended December 31, 2006from $17.8 million for the comparable period in 2005, primarily due to higher transaction fees revenues duringthe year ended December 31, 2006 and due to the $4.8 million in floor closure costs incurred during the yearended December 31, 2005. Net income from our OTC business segment increased $59.2 million, or 322.7%,to $77.5 million for the year ended December 31, 2006 from $18.3 million for the comparable period in 2005.Net income in our OTC business segment increased primarily due to significantly higher transaction feesrevenues during the year ended December 31, 2006 and due to the $15.0 million settlement expense incurred
80

during the year ended December 31, 2005. Net income from our market data business segment increased$9.4 million, or 221.2%, to $13.6 million for the year ended December 31, 2006 from $4.2 million for thecomparable period in 2005. Net income in our market data business segment increased primarily due toincreased market data sales and data access fees in our OTC business during the year ended December 31,2006. Consolidated operating income, as a percentage of consolidated revenues, increased to 65.2% for theyear ended December 31, 2006 from 36.1% for the comparable period in 2005. Consolidated net income, as apercentage of consolidated revenues, increased to 45.7% for the year ended December 31, 2006 from 25.9%for the comparable period in 2005.
Our consolidated revenues increased $157.9 million, or 101.3%, to $313.8 million for the year endedDecember 31, 2006 from $155.9 million for the comparable period in 2005. This increase is primarilyattributable to increased trading volumes on our electronic platform and increased market data fees. Asignificant factor driving our revenues and volume growth during this period was the continued growth intrading volumes of our cleared OTC contracts and the launch of the ICE WTI Crude futures contract.
Consolidated operating expenses increased to $109.2 million for the year ended December 31, 2006 from$99.7 million for the comparable period in 2005, representing an increase of 9.5%. This increase is primarilyattributable to higher compensation expenses during the year ended December 31, 2006 due to an increase inour discretionary bonus accrual and an increase in our employee headcount, an increase in the non-cashcompensation expenses relating to the adoption of SFAS No. 123(R) in 2006 and an increase in the patentroyalty fees paid in 2006. These increases were partially offset by floor closure costs of $4.8 million incurredin 2005 in connection with our decision to close our open-outcry trading floor in London, and the $15.0 millionlitigation settlement payment made to EBS in 2005.
Revenues
Transaction Fees
Consolidated transaction fees increased $136.7 million, or 99.8%, to $273.6 million for the year endedDecember 31, 2006 from $137.0 million for the comparable period in 2005. Transaction fees, as a percentageof consolidated revenues, decreased to 87.2% for the year ended December 31, 2006 from 87.9% for thecomparable period in 2005.
Transaction fees generated in our futures business segment increased $66.2 million, or 115.8%, to$123.4 million for the year ended December 31, 2006 from $57.2 million for the comparable period in 2005,while increasing as a percentage of consolidated revenues to 39.3% for the year ended December 31, 2006from 36.7% for the comparable period in 2005. The increase in transaction fees was primarily due to anincrease in our futures contract volumes. Futures contract volumes increased primarily due to increasedliquidity brought by new market participants due to electronic trading, the launch of the ICE WTI Crudefutures contract in February 2006 and increased volatility relating to geopolitical events and real and perceivedsupply and demand imbalances. Volumes in our futures business segment increased 120.5% to 92.7 millioncontracts traded during the year ended December 31, 2006 from 42.1 million contracts traded during thecomparable period in 2005. Average transaction fees per trading day increased 113.3% to $482,000 per tradingday for the year ended December 31, 2006 from $226,000 per trading day for the comparable period in 2005.
Transaction fees generated in our OTC business segment increased $70.4 million, or 88.3%, to $150.2 mil-lion for the year ended December 31, 2006 from $79.8 million for the comparable period in 2005, primarily dueto increased trading volumes. Transaction fees in this segment, as a percentage of consolidated revenues,decreased to 47.9% for the year ended December 31, 2006 from 51.2% for the comparable period in 2005. Thenumber of transactions or trades executed in our OTC business segment increased by 63.0% to 3.8 million tradesfor the year ended December 31, 2006 from 2.3 million trades for the comparable period in 2005. Averagetransaction fees per trading day increased 89.1% to $589,000 per trading day for the year ended December 31,2006 from $312,000 per trading day for the comparable period in 2005. The average revenues per transactionincreased 15.1% for the year ended December 31, 2006 as compared to the comparable period in 2005. Theincrease in average revenues per transaction was due in part to an increased number of higher volumetransactions, primarily as a result of market participants generally trading in larger transaction sizes, and a
81
change in the mix of contracts traded, with a larger number of contracts traded related to commodities withhigher commission rates.
Increased volumes in our OTC business segment were primarily due to increased trading activity inNorth American natural gas and power markets as a result of the availability of cleared OTC contracts, thelaunch of new cleared OTC contracts in 2006, increased liquidity brought by new market participants andincreased volatility relating to geopolitical events and real and perceived supply and demand imbalances.Cleared OTC contracts eliminates the need for a counterparty to post capital against each trade and alsoreduces requirements for entering into multiple negotiated bilateral settlement agreements to enable tradingwith other counterparties. Transaction fees generated by trading in North American natural gas contractsincreased $57.4 million, or 95.8%, to $117.3 million for the year ended December 31, 2006 from $59.9 millionfor the comparable period in 2005. In addition, transaction fees generated by trading in North American powercontracts increased $10.8 million, or 65.5%, to $27.2 million for the year ended December 31, 2006 from$16.4 million for the comparable period in 2005.
Revenues derived from electronic trade confirmation fees in our OTC business segment increased$1.9 million to $3.5 million for the year ended December 31, 2006 from $1.6 million for the comparableperiod in 2005. During the year ended December 31, 2006, 585,009 trades were matched through ourelectronic trade confirmation service, compared to 409,024 trades during the comparable period in 2005.Consolidated electronic trade confirmation fees, as a percentage of consolidated revenues, increased to 1.1%for the year ended December 31, 2006 from 1.0% for the comparable period in 2005.
Market Data Fees
Consolidated market data fees increased $19.6 million, or 133.8%, to $34.2 million for the year endedDecember 31, 2006 from $14.6 million for the comparable period in 2005. This increase was primarily due toincreased data access fees in our OTC and energy futures markets, increased terminal fees and license feesthat we receive from data vendors in exchange for the provision of real-time price information generated fromour energy futures markets, increased market data fees in our OTC markets from the market price validationservice, and increased fees from view only screen access and end of day reports. During the years endedDecember 31, 2006 and 2005, we recognized $17.6 million and $3.0 million, respectively, in data access feesand terminal fees in our energy futures and OTC business segments. During the year ended December 31,2006 and 2005, we recognized $11.5 million and $7.5 million, respectively, in terminal and license fees fromdata vendors. The increase in the market data fees received from data vendors were due to both an increase inthe average charge per terminal and an increase in the number of terminals. We also continued to enroll newindividual monthly subscribers for our market price validation service and our view only screen access service.Consolidated market data fees, as a percentage of consolidated revenues, increased to 10.9% for the yearended December 31, 2006 from 9.4% for the comparable period in 2005.
Other Revenues
Consolidated other revenues increased $1.7 million, or 39.7%, to $5.9 million for the year endedDecember 31, 2006 from $4.2 million for the comparable period in 2005. This increase was primarily due to$1.5 million in trade registration system fees which we recognized during the year ended December 31, 2006.Consolidated other revenues, as a percentage of consolidated revenues, decreased to 1.9% for the year endedDecember 31, 2006 from 2.7% for the comparable period in 2005.
Expenses
Compensation and Benefits
Consolidated compensation and benefits expenses increased $14.0 million, or 39.2%, to $49.8 million forthe year ended December 31, 2006 from $35.8 million for the comparable period in 2005. This increase wasprimarily due to an increase in the non-cash compensation expenses in accordance with the adoption ofSFAS No. 123(R) on January 1, 2006, an increase in our discretionary bonus accrual for the year endedDecember 31, 2006 as compared to the year ended December 31, 2005, and an increase in our employee
82

headcount. The non-cash compensation expenses recognized in our consolidated financial statements for ourstock options and restricted stock were $8.8 million for the year ended December 31, 2006 as compared to$1.7 million for the year ended December 31, 2005. Our discretionary bonus expense increased due to anincrease in bonus eligible employees and operating results substantially exceeding budgets for the year endedDecember 31, 2006. Our employee headcount increased from 203 employees as of December 31, 2005 to226 employees as of December 31, 2006. Consolidated compensation and benefits expenses, as a percentageof consolidated revenues, decreased to 15.9% for the year ended December 31, 2006 from 22.9% for thecomparable period in 2005 primarily due to our increased revenues.
Professional Services
Consolidated professional services expenses increased $1.3 million, or 12.6%, to $11.4 million for theyear ended December 31, 2006 from $10.1 million for the comparable period in 2005. This increase wasprimarily due to costs that we incurred to comply with the Sarbanes-Oxley Act of 2002 and other costsassociated with being a public company, partially offset by an aggregate decrease in legal fees related tolitigation with NYMEX and EBS, the former of which was dismissed by a ruling in our favor on a motion forsummary judgment in the third quarter of 2005, which is currently on appeal by NYMEX, and the latter ofwhich was settled in the second quarter of 2005. Consolidated professional services expenses, as a percentageof consolidated revenues, decreased to 3.6% for the year ended December 31, 2006 from 6.5% for thecomparable period in 2005.
Patent Royalty
Patent royalty expenses increased $7.5 million to $9.0 million for the year ended December 31, 2006from $1.5 million for the comparable period in 2005. The royalty payments under the patent licensingagreement increased due to increased energy futures volumes following the launch of exclusive electronictrading during 2005 and due to the launch of the ICE WTI Crude futures contract during February 2006.Consolidated patent royalty expenses, as a percentage of consolidated revenues, increased to 2.9% for the yearended December 31, 2006 from 1.0% for the comparable period in 2005.
Selling, General and Administrative
Consolidated selling, general and administrative expenses increased $7.9 million, or 45.3%, to $25.3 millionfor the year ended December 31, 2006 from $17.4 million for the comparable period in 2005. This increase wasprimarily due to increased costs of hosting expenses, hardware and software support expenses, bad debtexpenses, insurance expenses and travel and entertainment expenses and resulted from the growth of ourbusiness. Consolidated selling, general and administrative expenses, as a percentage of consolidated revenues,decreased to 8.1% for the year ended December 31, 2006 from 11.2% for the comparable period in 2005.
Floor Closure Costs
Consolidated floor closure costs were $4.8 million for the year ended December 31, 2005, due to theclosure of our open-outcry trading floor in London in April 2005. Consolidated floor closure costs, as apercentage of consolidated revenues, were 3.1% for the year ended December 31, 2005. We did not have floorclosure costs in the comparable period in 2006.
Settlement Expense
Consolidated settlement expense was $15.0 million for the year ended December 31, 2005, due to thepayment made to settle litigation with EBS. Consolidated settlement expense, as a percentage of consolidatedrevenues, was 9.6% for the year ended December 31, 2005. We did not have settlement expenses in thecomparable period in 2006.
83

Depreciation and Amortization
Consolidated depreciation and amortization expenses decreased $1.4 million, or 9.1%, to $13.7 millionfor the year ended December 31, 2006 from $15.1 million for the comparable period in 2005. This decreasewas due to certain property and equipment purchased in 2002 and 2003 with estimated useful lives of threeyears becoming fully depreciated over the course of 2005 and 2006. The amortization of the eSpeed patentlicense fee, included in depreciation and amortization expense, totaled $2.2 million for the year endedDecember 31, 2006 and $2.0 million for the year ended December 31, 2005. Consolidated depreciation andamortization expenses, as a percentage of consolidated revenues, decreased to 4.4% for the year endedDecember 31, 2006 from 9.7% for the comparable period in 2005.
Other Income
Consolidated other income increased $4.1 million, or 108.7%, to $7.9 million for the year endedDecember 31, 2006 from $3.8 million for the comparable period in 2005. The increase in other income wasprimarily due to an increase in interest and investment income and a decrease in interest expense. Interest andinvestment income increased $5.5 million from the prior year primarily due to an increase in our cash balancesfrom the net proceeds received from our initial public offering of common stock in November 2005 and fromthe cash flows generated from operations during the year ended December 31, 2006. The level of interest ratesin the United States increased throughout 2006 and this had an impact on our interest and investment income.Our investments during the year ended December 31, 2006 also included more taxable investments whichgenerally earn a higher pre-tax interest rate than the tax exempt investments that we primarily invested induring the year ended December 31, 2005. Also, in connection with the change in our functional currency ofthe majority of the U.K. subsidiaries to the U.S. dollar on June 30, 2006, we converted the majority of ourcash in the U.K. from pounds sterling denominated investments to U.S. dollar denominated investments. Themajority of our U.K. pounds sterling investments had lower interest rates commensurate with the lower U.K.interest rates over the last year. Interest expense decreased $382,000 from the prior year primarily due to theremaining $13.0 million outstanding balance under the Wachovia revolving credit agreement being paid offwith a portion of the proceeds from our initial public offering of common stock in November 2005.
The increase in other income was partially offset by foreign currency transaction losses recognized duringthe year ended December 31, 2006. ICE recognized net foreign currency transaction losses of $288,000 for theyear ended December 31, 2006 as compared to net foreign currency transaction gains of $1.5 million for theyear ended December 31, 2005. The foreign currency transaction gains and losses primarily related to thesettlement of foreign currency assets, liabilities and payables that occur through our foreign operations whichare received in or paid in pounds sterling due to the increase or decrease in the period-end foreign currencyexchange rates between periods. Through June 30, 2006, the functional currency of our foreign subsidiarieswas pounds sterling. The average exchange rate of pounds sterling to the U.S. dollar increased from 1.8128for the year ended December 31, 2005 to 1.8543 for the year ended December 31, 2006.
Income Taxes
Consolidated tax expense increased $49.7 million to $69.3 million for the year ended December 31, 2006from $19.6 million for the comparable period in 2005, primarily due to the increase in our pre-tax income.Our effective tax rate was 32.6% for both the years ended December 31, 2006 and 2005. The effective tax ratefor the year ended December 31, 2006 is lower than the statutory rate primarily due to our decision to reinvest$51.0 million in undistributed overseas earnings of our foreign subsidiaries during 2006, tax exempt incomeand favorable state rates. The effective tax rate for the year ended December 31, 2005 is lower than thestatutory rate primarily due to an increase in federal and state research and development tax credits.
84

Quarterly Results of Operations
The following table sets forth quarterly unaudited condensed consolidated statements of income for theperiods presented. We believe that this data has been prepared on substantially the same basis as our auditedconsolidated financial statements and includes all adjustments, consisting only of normal recurring adjust-ments, necessary for the fair presentation of our consolidated results of operations for the quarters presented.This unaudited condensed consolidated quarterly data should be read together with our consolidated financialstatements and related notes included elsewhere in this Annual Report on Form 10-K. The historical results forany quarter do not necessarily indicate the results expected for any future period.
December 31,2007
September 30,2007
June 30,2007(1)
March 31,2007(2)
December 31,2006
September 30,2006
June 30,2006
March 31,2006
Three Months Ended,
(In thousands)
Revenues:Transaction fees, net:Futures:
ICE Brent Crude futures . . $ 21,320 $ 22,071 $ 21,796 $ 22,121 $18,003 $17,357 $15,290 $13,476ICE WTI Crude futures . . 12,592 12,791 11,889 12,670 10,964 11,425 8,294 —Sugar futures . . . . . . . . . 12,160 12,829 14,823 8,835 — — — —Other futures products and
options . . . . . . . . . . . . 26,328 25,642 22,277 18,449 8,733 8,407 5,988 5,483OTC:
North American naturalgas . . . . . . . . . . . . . . 43,410 41,665 34,275 36,183 35,655 36,955 26,369 18,323
North American power . . . 12,627 12,212 9,713 8,797 7,891 8,088 6,411 4,833Other commodities
markets . . . . . . . . . . . 2,393 2,199 1,237 1,044 610 717 410 438Electronic trade
confirmation services . . 1,725 1,681 1,362 1,242 943 989 895 682Market data fees . . . . . . . . . 23,306 17,225 15,846 14,019 9,647 9,748 8,819 6,022Other . . . . . . . . . . . . . . . . 3,435 3,420 3,436 3,248 2,818 976 1,115 1,025
Total revenues . . . . . . . . . . . . 159,296 151,735 136,654 126,608 95,264 94,662 73,591 50,282
Operating expenses:Compensation and benefits . . 34,913 23,009 21,717 21,758 14,214 12,987 11,932 10,617Professional services . . . . . . 4,820 6,650 6,714 4,863 2,671 2,799 3,235 2,690Patent royalty . . . . . . . . . . . — — — 1,705 2,676 3,151 2,198 1,014CBOT merger-related
transaction costs(1) . . . . . 33 144 10,944 — — — — —Selling, general and
administrative . . . . . . . . . 13,457 12,170 13,002 12,130 7,629 7,016 5,501 5,120Depreciation and
amortization . . . . . . . . . . 9,546 8,898 7,748 6,509 3,890 3,327 3,309 3,188
Total operating expenses . . 62,769 50,871 60,125 46,965 31,080 29,280 26,175 22,629
Operating income. . . . . . . . . . 96,527 100,864 76,529 79,643 64,184 65,382 47,416 27,653Other income (expense),
net(2) . . . . . . . . . . . . . . . . (438) (1,590) (1,322) 8,221 3,216 2,731 853 1,108Income tax expense . . . . . . . . 31,437 32,593 21,514 32,278 18,408 24,468 17,302 9,097
Net income . . . . . . . . . . . . . . $ 64,652 $ 66,681 $ 53,693 $ 55,586 $48,992 $43,645 $30,967 $19,664
(1) The financial results for the three months ended June 30, 2007 include $10.9 million in CBOT merger-related transaction costs, or $7.1 million after tax. Excluding these costs, net of taxes, our OTC business
85

net income for the three months ended June 30, 2007 would have been $60.7 million. See “— Non-GAAP Financial Measures”.
(2) The financial results for the three months ended March 31, 2007 include the results of ICE Futures U.S.for the period from January 13, 2007 to March 31, 2007 and also include a gain of $9.3 million, or$5.8 million after tax, relating to the sale our former open-outcry disaster recovery site in London.
Liquidity and Capital Resources
Since our inception, we have financed our operations, growth and cash needs primarily through incomefrom operations and borrowings under our credit facilities. Our principal liquidity and capital requirementshave been to fund capital expenditures, working capital, strategic acquisitions, and marketing and developmentof our electronic trading platform. We may need to incur additional debt or issue additional equity to makestrategic acquisitions or investments in the future. We financed the cash portion of the merger with ICEFutures U.S. with cash on hand and borrowings under a senior unsecured credit facility discussed below. Wefinanced the other acquisitions we made in 2007 with cash on hand.
Cash and Cash Equivalents, Short-Term Investments, Restricted Cash and Restricted Short-TermInvestments
We had consolidated cash and cash equivalents of $119.6 million and $204.3 million as of December 31,2007 and 2006, respectively. We had $141.0 million and $77.4 million in short-term investments as ofDecember 31, 2007 and 2006, respectively and $19.6 million and $16.2 million in restricted cash as ofDecember 31, 2007 and 2006, respectively. We consider all short-term, highly liquid investments withremaining maturity dates of three months or less at the time of purchase to be cash equivalents. We classify allinvestments with remaining maturity dates in excess of three months and with maturities less than one yearand investments that we intend to hold for less than one year as short-term investments. We classify allinvestments that we intend to hold for more than one year as long-term investments. We classify all cash thatis not available for general use, either due to FSA requirements or through restrictions in specific agreements,as restricted cash. The decrease in the cash and cash equivalents and in short-term investments was primarilydue to the cash we used in connection with the acquisitions that we completed in 2007 offset by cash flowsgenerated from operations.
We invest a portion of our cash in excess of short-term operating needs in investment-grade marketabledebt securities and municipal bonds through a third party asset management company. We classify theseinvestments as available-for-sale in accordance with SFAS 115, Accounting for Certain Investments in Debtand Equity Securities. Available-for-sale investments are carried at their fair values with unrealized gains andlosses, net of deferred income taxes, reported as a component of accumulated other comprehensive income.Realized gains and losses, and declines in value deemed to be other-than-temporary on available-for-saleinvestments, are recognized currently in earnings. We do not have any investments classified as held-to-maturity or trading.
We have entered into an agreement with a third party asset management company to manage our cashover a predetermined operating cash threshold for an agreed upon fee. The agreement specifies our investmentobjectives, as well as guidelines for and restrictions on investments. The investment objectives are to maximizeincome, preserve principal value, invest in high-quality investment grade securities and to maintain adequateliquidity to meet account demands. The investments guidelines limit the types of investments that the thirdparty asset management company can enter into based on pre-approved guidelines relating to types ofsecurities, amount of investments and maturity.
86

Cash Flow
The following tables present, for the periods indicated, the major components of net increases (decreases)in cash and cash equivalents:
2007 2006 2005Year Ended December 31,
(In thousands)
Net cash provided by (used in):
Operating activities . . . . . . . . . . . . . . . . . . . . . . . . . . . . . . . . $ 287,781 $150,689 $ 49,812Investing activities . . . . . . . . . . . . . . . . . . . . . . . . . . . . . . . . . (637,388) (27,628) (117,120)
Financing activities . . . . . . . . . . . . . . . . . . . . . . . . . . . . . . . . 264,759 58,339 30,329
Effect of exchange rate changes . . . . . . . . . . . . . . . . . . . . . . . 188 2,855 (4,218)
Net increase (decrease) in cash and cash equivalents . . . . . . . . $ (84,660) $184,255 $ (41,197)
Operating Activities
Consolidated net cash provided by operating activities was $287.8 million, $150.7 million and $49.8 millionfor the years ended December 31, 2007, 2006 and 2005, respectively. Net cash provided by operating activitiesprimarily consists of net income adjusted for certain non-cash items, including depreciation and amortization andthe effects of changes in working capital. Fluctuations in net cash provided by operating activities are primarilyattributable to increases and decreases in our net income between periods and, to a lesser extent, due to fluctuationsin working capital. The $137.1 million increase in net cash provided by operating activities for the year endedDecember 31, 2007 from the comparable period in 2006 is primarily due to the $21.8 million increase in themarket data business segment’s net income and the $73.9 million increase in the futures business segment’s netincome for the year ended December 31, 2007 from the comparable period in 2006. The $100.9 million increase innet cash provided by operating activities for the year ended December 31, 2006 from the comparable period in2005 is primarily due to the $59.2 million increase in the OTC business segment’s net income and the $34.3 millionincrease in the futures business segment’s net income for the year ended December 31, 2006 from the comparableperiod in 2005. These amounts were partially offset by $60.8 million and $41.0 million in excess tax benefits fromstock-based compensation for the year ended December 31, 2007 and 2006.
Investing Activities
Consolidated net cash used in investing activities was $637.4 million, $27.6 million and $117.1 million for theyears ended December 31, 2007, 2006 and 2005, respectively. These activities primarily relate to cash paid foracquisitions and other intangibles, sales and purchases of available-for-sale investments, capital expenditures in eachperiod for software, including internally developed software, and for computer and network equipment. The cashpaid for acquisitions, net of cash acquired, for the year ended December 31, 2007 was $480.1 million and we paid$52.7 million for the purchase of the Russell licensing agreement. We had a net decrease (increase) in investmentsclassified as available-for-sale of ($59.6 million), $36.9 million and ($107.8 million) for the years endedDecember 31, 2007, 2006 and 2005, respectively, and a net (increase) decrease in restricted cash of ($6.4 million),($3.6 million) and $4.4 million, respectively, due to changes in the restricted cash balances between periods. Weincurred capitalized software development costs of $12.3 million, $7.4 million and $5.1 million for the years endedDecember 31, 2007, 2006 and 2005, respectively. Capital expenditures totaled $31.0 million, $12.4 million and$8.6 million for the years ended December 31, 2007, 2006 and 2005, respectively. These capital expendituresprimarily relate to hardware purchases to continue the development and expansion of our electronic platform andphysical relocation of our primary data center and disaster recovery site.
Financing Activities
Consolidated net cash provided by financing activities was $264.8 million, $58.3 million and $30.3 millionfor the years ended December 31, 2007, 2006 and 2005, respectively. Consolidated net cash provided byfinancing activities for the year ended December 31, 2007 primarily relates to the $250.0 million in proceeds
87

received from borrowings under the credit agreement and $60.8 million in excess tax benefits generated fromstock-based compensation, partially offset by $25.5 million in cash payments related to treasury shares receivedfor restricted stock and stock option tax payments as well as $28.1 million in repayments under the creditagreement. Consolidated net cash provided by financing activities for the year ended December 31, 2006primarily relates to the $41.0 million excess tax benefits from stock-based compensation and $21.8 million inproceeds from the exercise of common stock options. Consolidated net cash provided by financing activities forthe year ended December 31, 2005 primarily relates to the $55.1 million in net proceeds received from theissuance of our common stock in the initial public offering in November 2005, partially offset by the repaymentof our $25.0 million revolving credit facility.
Loan Agreements
We financed the cash portion of the ICE Futures U.S. acquisition with cash on hand and borrowingsunder a senior unsecured credit facility, or the Credit Agreement, dated January 12, 2007, as amended onAugust 24, 2007, that we entered into with Wachovia, as Administrative Agent, Bank of America, N.A., asSyndication Agent, and the lenders named therein. In connection with the Credit Agreement, we terminatedour previous $50.0 million credit facility with Wachovia, under which no borrowings were outstanding. TheCredit Agreement provides for a term loan facility in the aggregate principal amount of $250.0 million and arevolving credit facility in the aggregate principal amount of $250.0 million, which we collectively refer to asthe Credit Facilities. In connection with the acquisition, we used the proceeds of the $250.0 million term loanalong with $166.8 million of cash on hand to finance the $416.8 million cash component of the ICE FuturesU.S. acquisition. Under the terms of the Credit Agreement, we can borrow an aggregate principal amount ofup to $250.0 million under the revolving credit facility at any time from the closing date of the CreditAgreement through the third anniversary of the closing date of the merger with ICE Futures U.S., which isJanuary 12, 2010. We have agreed to reserve $50.0 million of the $250.0 million available under the revolvingcredit facility for use by ICE Clear U.S. to provide liquidity in the event of a default by a clearing member.The remaining amount under the revolving credit facility can be used by us for general corporate purposes.
Loans under the Credit Facilities shall, at our option, bear interest on the principal amount outstanding ateither: (i) LIBOR plus an applicable margin rate or (ii) a “base rate” plus an applicable margin rate. The “baserate” will be equal to the higher of (i) Wachovia’s prime rate or (ii) the federal funds rate plus 0.5%. Theapplicable margin rate ranges from 0.50% to 1.125% on the LIBOR loans and from 0.00% to 0.125% for thebase rate loans based on our total leverage ratio calculated on a trailing twelve month period. Interest on eachloan is payable quarterly. As of December 31, 2007, we have a $221.9 million three month LIBOR loanoutstanding with a stated interest rate of 5.46%, including the applicable margin rate of 0.625%. For theborrowings under the term loan facility, we began making payments on June 30, 2007, and will makepayments quarterly thereafter until the fifth anniversary of the closing date of the merger with ICE FuturesU.S., which will be January 12, 2012. The Credit Agreement includes an unutilized revolving creditcommitment that is equal to the unused maximum revolver amount multiplied by an applicable margin rateand is payable in arrears on a quarterly basis. The applicable margin rate ranges from 0.10% to 0.20% basedon our total leverage ratio calculated on a trailing twelve month period. Based on this calculation, theapplicable margin rate was 0.125% at December 31, 2007.
The Credit Agreement requires us to use 100% of the net cash proceeds raised from debt issuances orasset dispositions, with certain limited exceptions, to prepay outstanding loans under the Credit Facilities. Withlimited exceptions, we may prepay the outstanding loans under the Credit Facilities, in whole or in part,without premium or penalty upon written notice to the Administrative Agent. The Credit Agreement containsaffirmative and negative covenants, including, but not limited to, leverage and interest coverage ratios, as wellas limitations or required approvals for acquisitions, dispositions of assets and certain investments, theincurrence of additional debt or the creation of liens and other fundamental changes to our business. We havebeen and are currently in compliance with all applicable covenants under the Credit Agreement.
ICE Clear Canada (formerly WCE Clearing Corporation) has arranged a total of $3.0 million in arevolving standby credit facility with the Royal Bank of Canada to provide liquidity in the event of default bya clearing participant. Borrowings under the revolving standby credit facility, which are required to be
88
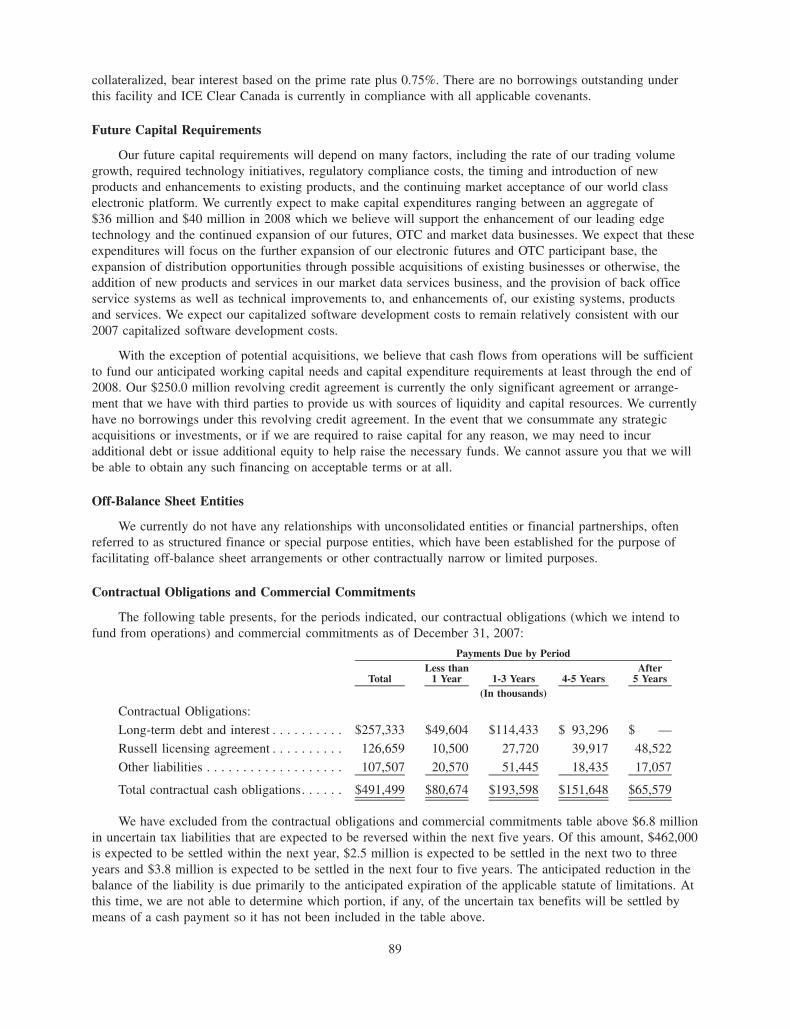
collateralized, bear interest based on the prime rate plus 0.75%. There are no borrowings outstanding underthis facility and ICE Clear Canada is currently in compliance with all applicable covenants.
Future Capital Requirements
Our future capital requirements will depend on many factors, including the rate of our trading volumegrowth, required technology initiatives, regulatory compliance costs, the timing and introduction of newproducts and enhancements to existing products, and the continuing market acceptance of our world classelectronic platform. We currently expect to make capital expenditures ranging between an aggregate of$36 million and $40 million in 2008 which we believe will support the enhancement of our leading edgetechnology and the continued expansion of our futures, OTC and market data businesses. We expect that theseexpenditures will focus on the further expansion of our electronic futures and OTC participant base, theexpansion of distribution opportunities through possible acquisitions of existing businesses or otherwise, theaddition of new products and services in our market data services business, and the provision of back officeservice systems as well as technical improvements to, and enhancements of, our existing systems, productsand services. We expect our capitalized software development costs to remain relatively consistent with our2007 capitalized software development costs.
With the exception of potential acquisitions, we believe that cash flows from operations will be sufficientto fund our anticipated working capital needs and capital expenditure requirements at least through the end of2008. Our $250.0 million revolving credit agreement is currently the only significant agreement or arrange-ment that we have with third parties to provide us with sources of liquidity and capital resources. We currentlyhave no borrowings under this revolving credit agreement. In the event that we consummate any strategicacquisitions or investments, or if we are required to raise capital for any reason, we may need to incuradditional debt or issue additional equity to help raise the necessary funds. We cannot assure you that we willbe able to obtain any such financing on acceptable terms or at all.
Off-Balance Sheet Entities
We currently do not have any relationships with unconsolidated entities or financial partnerships, oftenreferred to as structured finance or special purpose entities, which have been established for the purpose offacilitating off-balance sheet arrangements or other contractually narrow or limited purposes.
Contractual Obligations and Commercial Commitments
The following table presents, for the periods indicated, our contractual obligations (which we intend tofund from operations) and commercial commitments as of December 31, 2007:
TotalLess than
1 Year 1-3 Years 4-5 YearsAfter
5 Years
Payments Due by Period
(In thousands)
Contractual Obligations:
Long-term debt and interest . . . . . . . . . . $257,333 $49,604 $114,433 $ 93,296 $ —
Russell licensing agreement . . . . . . . . . . 126,659 10,500 27,720 39,917 48,522
Other liabilities . . . . . . . . . . . . . . . . . . . 107,507 20,570 51,445 18,435 17,057
Total contractual cash obligations. . . . . . $491,499 $80,674 $193,598 $151,648 $65,579
We have excluded from the contractual obligations and commercial commitments table above $6.8 millionin uncertain tax liabilities that are expected to be reversed within the next five years. Of this amount, $462,000is expected to be settled within the next year, $2.5 million is expected to be settled in the next two to threeyears and $3.8 million is expected to be settled in the next four to five years. The anticipated reduction in thebalance of the liability is due primarily to the anticipated expiration of the applicable statute of limitations. Atthis time, we are not able to determine which portion, if any, of the uncertain tax benefits will be settled bymeans of a cash payment so it has not been included in the table above.
89

Non-GAAP Financial Measures
We provide adjusted net income, adjusted earnings per common share on adjusted net income andadjusted earnings per common share on net income as additional information regarding our operating results.We use these non-GAAP measures internally to evaluate our performance and in making financial andoperational decisions. We believe that our presentation of these measures provides investors with greatertransparency and supplemental data relating to our financial condition and results of operations. In addition,we believe the presentation of these measures is useful for period-to-period comparison of results because theCBOT merger-related transaction costs, floor closure costs and the settlement expense described below do notreflect historical operating performance. While adjustments to the redeemable stock put described below havebeen recorded in prior years, they were recorded while the redeemable stock put remained outstanding. Theredeemable stock put was terminated in November 2005. These measures are not in accordance with, or analternative to, U.S. generally accepted accounting principles or GAAP, and may be different from non-GAAPmeasures used by other companies. Investors should not rely on any single financial measure when evaluatingour business. We strongly recommend that investors review the GAAP financial measures included in thisAnnual Report on Form 10-K, including our consolidated financial statements and the notes thereto.
When viewed in conjunction with our GAAP results and the accompanying reconciliation, we believeadjusted net income and adjusted earnings per share provides a more complete understanding of factorsaffecting our business than GAAP measures alone. Our management uses adjusted net income and adjustedearnings per share to evaluate operating performance and management decisions made during the reportingperiod by excluding certain items that we believe have less significance on the day-to-day performance of ourbusiness. Our internal budgets are based on adjusted net income and adjusted earnings per share, and we reportour adjusted net income and adjusted earnings per share to our board of directors. In addition, adjusted netincome and adjusted earnings per share are among the criteria used in determining performance-basedcompensation. We understand that analysts and investors regularly rely on non-GAAP financial measures, suchas adjusted net income and adjusted earnings per share, to assess operating performance. We use adjusted netincome and adjusted earnings per share because they more clearly highlight trends in our business that maynot otherwise be apparent when relying solely on GAAP financial measures, since adjusted net income andadjusted earnings per share eliminates from our results specific financial items that have less bearing on ouroperating performance.
Adjusted Net Income
Adjusted net income for the 2007 periods below is calculated by adding the CBOT merger-relatedtransaction costs to net income, and it is presented net of tax. We incurred incremental direct merger-relatedtransaction costs of $10.9 million during the three months ended June 30, 2007 and $11.1 million during theyear ended December 31, 2007 relating to our proposed merger with CBOT. We did not succeed in ourproposed merger with CBOT and the CME completed its acquisition of CBOT on July 13, 2007. The merger-related transaction costs include investment banking advisors, legal advisors, accounting advisors, proxyadvisors, public relation services and other external costs directly related to the proposed transaction. Despiteour plans to continue to explore and pursue acquisition opportunities, we do not believe that this item isrepresentative of our past or future operating performance given that the magnitude of the expense was welloutside of our historical expenses. We believe that the CBOT merger-related transaction costs are infrequentand unusual and are not representative of our historical operating performance because we have not incurredsimilar significant merger-related costs within the prior periods and do not expect to incur such costs againwithin the next several years.
Adjusted net income for the 2005 periods below is calculated by adding net income and two nonrecurringitems, floor closure costs and settlement expense, presented net of tax. We do not believe these items arerepresentative of our future operating performance since both costs were incurred for specific reasons outsideof historical operations. We believe that the floor closure costs and the settlement expense are unusualexpenses and they are not representative of historical operating performance.
90

Adjusted Earnings Per Share— Redeemable Stock Put
Adjusted earnings per common share are calculated as (i) net income divided by the weighted averagecommon shares outstanding and (ii) adjusted net income divided by the weighted average common sharesoutstanding. These calculations for the 2005 periods below exclude the redemption adjustments relating to theredeemable stock put, which are used to determine the net income available to common shareholders. Whilethe redemption adjustments to retained earnings have been recorded in prior periods, no further adjustmentswill be recorded following the termination of the redeemable stock put in connection with our initial publicoffering. As a result, we believe that it is appropriate to exclude this non-cash item to provide shareholderswith an adjusted earnings per share calculation. We have no plans to issue a redeemable stock put in thefuture.
The impact of outstanding stock options are considered to be antidilutive in the calculation of dilutedearnings per share when a net loss available to common shareholders is reported. Our outstanding stockoptions have not been included in the computation of diluted earnings per share in 2005 due to the$20.9 million net loss available to common shareholders as a result of the $61.3 million charged to retainedearnings related to the redeemable stock put adjustments. Therefore, our diluted earnings per share arecomputed in the same manner as basic earnings per share in 2005. When the redeemable stock put adjustmentsare excluded from the calculation of earnings per share, the dilutive stock options need to be included in thecalculation of dilutive earnings per share due to the resulting net income of $40.4 million in 2005.
The following table reconciles our 2007 net income to adjusted net income and calculates adjustedearnings per common share on adjusted net income.
Year EndedDecember 31,
2007
Three MonthsEnded
June 30, 2007
Year EndedDecember 31,
2007
ConsolidatedOTC
Segment
(In thousands, except per share amounts)
Net income . . . . . . . . . . . . . . . . . . . . . . . . . . . . . . . . . . . . . . . . . $240,612 $53,693 $79,199
Add: CBOT merger-related transaction costs . . . . . . . . . . . . . . . . 11,121 10,944 11,121
Less: Effective tax rate benefit of CBOT merger-relatedtransaction costs . . . . . . . . . . . . . . . . . . . . . . . . . . . . . . . . . . . (3,949) (3,906) (3,949)
Adjusted net income . . . . . . . . . . . . . . . . . . . . . . . . . . . . . . . . $247,784 $60,731 $86,371
Earnings per common share on net income:
Basic. . . . . . . . . . . . . . . . . . . . . . . . . . . . . . . . . . . . . . . . . . . . $ 3.49 $ 0.78
Diluted . . . . . . . . . . . . . . . . . . . . . . . . . . . . . . . . . . . . . . . . . . $ 3.39 $ 0.75
Adjusted earnings per common share on adjusted net income:
Adjusted basic . . . . . . . . . . . . . . . . . . . . . . . . . . . . . . . . . . . . . $ 3.59 $ 0.88
Adjusted diluted . . . . . . . . . . . . . . . . . . . . . . . . . . . . . . . . . . . $ 3.49 $ 0.85
Weighted average common shares outstanding:
Basic. . . . . . . . . . . . . . . . . . . . . . . . . . . . . . . . . . . . . . . . . . . . 68,985 69,205
Diluted . . . . . . . . . . . . . . . . . . . . . . . . . . . . . . . . . . . . . . . . . . 70,980 71,228
The presentation below compares our 2005 operating performance for the current periods, as adjusted, toour normal operating performance in the comparable prior periods. The following table reconciles net income(loss) to adjusted net income, net loss available to common shareholders to net income and diluted weighted
91

average common shares outstanding to adjusted diluted weighted average common shares outstanding, andcalculates adjusted earnings per common share.
Year EndedDecember 31,
2005
Three MonthsEnded
June 30, 2005
Year EndedDecember 31,
2005
Year EndedDecember 31,
2005
ConsolidatedOTC
SegmentFuturesSegment
(In thousands, except per share amounts)
Net income (loss) . . . . . . . . . . . . . . . . . . . . . . . . . $ 40,410 $ (141) $17,838 $18,335Add: Floor closure costs . . . . . . . . . . . . . . . . . . . . 4,814 4,814 4,814 —Add: Settlement expense . . . . . . . . . . . . . . . . . . . . 15,000 15,000 — 15,000Less: Effective tax rate benefit of floor closure
costs and settlement expense . . . . . . . . . . . . . . . (7,119) (7,119) (1,685) (5,434)
Adjusted net income . . . . . . . . . . . . . . . . . . . . . . . $ 53,105 $12,554 $20,967 $27,901
Net income (loss) available to commonshareholders . . . . . . . . . . . . . . . . . . . . . . . . . . . $(20,909)
Add: Redemption adjustments to redeemable stockput . . . . . . . . . . . . . . . . . . . . . . . . . . . . . . . . . . 61,319
Adjusted Net income available to commonshareholders . . . . . . . . . . . . . . . . . . . . . . . . . . . $ 40,410
Diluted weighted average common sharesoutstanding . . . . . . . . . . . . . . . . . . . . . . . . . . . . 53,218
Effect of dilutive stock options . . . . . . . . . . . . . . . 1,230
Adjusted diluted weighted average common sharesoutstanding . . . . . . . . . . . . . . . . . . . . . . . . . . . . 54,448
Adjusted earnings per common share on adjustednet income:Adjusted basic . . . . . . . . . . . . . . . . . . . . . . . . . $ 1.00
Adjusted diluted . . . . . . . . . . . . . . . . . . . . . . . . $ 0.98
Adjusted earnings per common share on netincome:Adjusted basic . . . . . . . . . . . . . . . . . . . . . . . . . $ 0.76
Adjusted diluted . . . . . . . . . . . . . . . . . . . . . . . . $ 0.74
Adjusted weighted average common sharesoutstanding:Adjusted basic . . . . . . . . . . . . . . . . . . . . . . . . . 53,218
Adjusted diluted . . . . . . . . . . . . . . . . . . . . . . . . 54,448
Recently Adopted Accounting Pronouncements
In June 2006, FASB, issued Interpretation No. 48, or FIN 48, Accounting for Uncertainty in IncomeTaxes- an Interpretation of FASB Statement No. 109. FIN 48 clarifies the accounting for uncertainty in incometaxes recognized in an enterprise’s financial statements in accordance with SFAS No. 109, Accounting forIncome Taxes. This interpretation prescribes a recognition threshold and measurement attribute for the financialstatement recognition and measurement of a tax position taken or expected to be taken in a tax return. FIN 48also provides guidance on de-recognition of tax benefits, classification on the balance sheet, interest andpenalties, accounting in interim periods, disclosure and transition. We adopted the provisions of FIN 48 onJanuary 1, 2007. As a result of the adoption, we recognized a charge of $83,000 to the January 1, 2007retained earnings balance. As of the adoption date, we had unrecognized tax benefits of $13.2 million ofwhich $5.0 million, if recognized, would affect our effective tax rate. We recorded a decrease to unrecognizedtax benefits of $1.2 million as of December 31, 2007, of which $2.4 million increased income tax expense forthe year ended December 31, 2007. We recognize interest accruals related to income tax uncertainties as a
92

component of interest expense. Any related penalties, if incurred, would be included in selling, general andadministrative expenses. Interest expense related to the unrecognized tax benefits totaled $478,000 for the yearended December 31, 2007. Accrued interest and penalties were $1.5 million and $1.9 million as of January 1,2007 and December 31, 2007, respectively.
New Accounting Pronouncements
In September 2006, the FASB issued SFAS No. 157, Fair Value Measurements. SFAS No. 157 definesfair value, establishes a framework for measuring fair value and expands fair value measurement disclosures.SFAS No. 157 is effective for us beginning in fiscal year 2008. We are currently evaluating the impact of thepending adoption of SFAS No. 157 on our consolidated financial statements.
In February 2007, the FASB issued SFAS No. 159, The Fair Value Option for Financial Assets andFinancial Liabilities — including an Amendment of FASB Statement No. 115, which permits entities to chooseto measure certain financial assets and financial liabilities at fair value. Unrealized gains and losses on itemsfor which the fair value option has been elected are reported in earnings. SFAS No. 159 will be effective forus beginning in fiscal year 2008. We do not expect that we will elect the fair value option under SFAS No. 159,and we do not expect SFAS No. 159 to have a material impact on our consolidated financial statements.
Critical Accounting Policies
We have identified the policies below as critical to our business operations and the understanding of ourresults of operations. The impact of, and any associated risks related to, these policies on our businessoperations is discussed throughout “Management’s Discussion and Analysis of Financial Condition and Resultsof Operations”. For a detailed discussion on the application of these and other accounting policies, see note 2to our consolidated financial statements and related notes included elsewhere in this Annual Report onForm 10-K. Our discussion and analysis of our financial condition and results of operations are based uponour consolidated financial statements, which have been prepared in accordance with GAAP. The preparation offinancial statements in conformity with these accounting principles requires us to make estimates andassumptions that affect the reported amount of assets and liabilities, and the disclosure of contingent assetsand liabilities, at the date of our financial statements and the reported amounts of revenues and expensesduring the reporting period.
We evaluate our estimates and judgments on an ongoing basis, including those related to the accountingmatters described below. We base our estimates and judgments on our historical experience and other factorsthat we believe to be reasonable under the circumstances when we make these estimates and judgments. Basedon these factors, we make estimates and judgments about, among other things, the carrying values of assetsand liabilities that are not readily apparent from market prices or other independent sources and about therecognition and characterization of our revenues and expenses. The values and results based on these estimatesand judgments could differ significantly under different assumptions or conditions and could change materiallyin the future.
We believe that the following critical accounting policies, among others, affect our more significantjudgments and estimates used in the preparation of our consolidated financial statements and could materiallyincrease or decrease our reported results, assets and liabilities.
Goodwill and Other Identifiable Intangible Assets
We have significant intangible assets related to goodwill and other acquired intangibles. Our determina-tion of the fair value of the intangible assets, related estimated useful lives of intangible assets and whether ornot these assets are impaired requires us to make significant judgments. If we change our strategy or if marketconditions shift, our judgments may change, which may result in adjustments to recorded asset balances. As ofDecember 31, 2007, we had goodwill of $1,009.7 million and net other intangible assets of $537.7 millionrelating to our acquisitions, our purchase of trademarks and Internet domain names from various third parties,and the Russell licensing agreement. Under the provisions of SFAS No. 142, Goodwill and Other IntangibleAssets, we do not amortize goodwill or other intangible assets with indefinite useful lives. Intangible assetswith finite useful lives are amortized over the lesser of their contractual or estimated useful lives.
In connection with our acquisitions, assets acquired and liabilities assumed are recorded at their estimatedfair values. We have recorded goodwill for the excess of the purchase price of our acquisitions over the fair
93

value of identifiable net assets acquired, including other identified intangible assets. We recognize specificallyidentifiable intangibles when a specific right or contract is acquired. Our fair value assumptions are based onmanagement’s judgment and require the use of significant estimates and assumptions regarding estimatedfuture cash flows. In performing the purchase price allocation, we consider, among other factors, the intendedfuture use of acquired assets, analyses of historical financial performance and estimates of future performanceof the acquired business.
At the acquisition date, a preliminary allocation of the purchase price is recorded based upon apreliminary valuation. We continue to review and validate estimates, assumptions and valuation methodologiesunderlying the preliminary valuation during the purchase price allocation period. Accordingly, these estimatesand assumptions are subject to change, which could have a material impact on our financial statements. Thepurchase price allocation period ends when we have obtained all of the information and that is known to beobtainable, which usually does not exceed one year from the date of acquisition.
We test goodwill in each of our reporting units for impairment at least annually in accordance with theprovisions of SFAS No. 142 by comparing the carrying value of the reporting unit with its estimated fairvalue. If the carrying value of the reporting unit exceeds its estimated fair value, then an impairment loss isrecorded if and to the extent that the carrying value of the goodwill is in excess of the implied fair value ofthe goodwill in accordance with the two-step process in SFAS No. 142. Other finite-lived intangible assets areevaluated for impairment under SFAS No. 144, Accounting for the Impairment or Disposal of Long-LivedAssets. Under SFAS No. 144, we are required to evaluate whether events or changes in circumstances indicatethat the carrying value of our depreciable assets to be held and used may not be recoverable. An estimate ofundiscounted future cash flows produced by these long-lived assets is then compared to the carrying value ofthose assets to determine if the asset is recoverable. If an asset is not recoverable, the loss is measured as thedifference between fair value and carrying value of the impaired asset. Fair value of an asset is based onvarious valuation techniques, including discounted cash flow analyses.
In assessing whether goodwill and other intangible assets are impaired, we must make assumptionsregarding estimated future cash flows, estimated long-term growth rates of our business, the period over whichcash flows will occur, and other factors to determine the fair value of our assets. These estimates andassumptions require management’s judgment, and changes to these estimates and assumptions could materiallyaffect the determination of fair value and/or impairment for each reporting unit. Future events could cause usto conclude that indications of goodwill or intangible asset impairment exist. Impairment may result from,among other things, deterioration in the performance of our business, adverse market conditions, adversechanges in applicable laws and regulations, competition, or the sale or disposition of a reporting unit. Anyresulting impairment loss could have a material adverse impact on our financial condition and results ofoperations.
Our goodwill and other indefinite lived intangible assets are evaluated for impairment annually in ourfiscal fourth quarter or more often if events or changes in circumstances indicate that value may be impaired.The reporting unit levels for our impairment testing of goodwill are the OTC reporting unit, the ICE FuturesU.S. reporting unit, the ICE Futures Europe reporting unit and the ICE Futures Canada reporting unit and themarket date reporting unit. This analysis has not resulted in impairment through December 2007.
Capitalized Software Development Costs
We capitalize costs related to software developed or obtained for internal use in accordance with AICPAStatement of Position 98-1, Accounting for the Costs of Computer Software Developed or Obtained forInternal Use. Costs incurred during the preliminary project work stage or conceptual stage, such asdetermining the performance requirements, system requirements and data conversion, are expensed as incurred.Costs incurred in the application development phase, such as coding, testing for new software and upgradesthat result in additional functionality, are capitalized and are amortized using the straight-line method over theuseful life of the software, not to exceed three years. Amortization of these capitalized costs begins only whenthe software becomes ready for its intended use. Costs incurred during the post-implementation/operationstage, including training costs and maintenance costs, are expensed as incurred. We capitalized internallydeveloped software costs of $12.3 million, $7.4 million and $5.1 million during the years ended December 31,2007, 2006 and 2005, respectively. Determining whether particular costs incurred are more properly attribut-able to the preliminary or conceptual stage, and thus expensed, or to the application development phase, andthus capitalized and amortized, depends on subjective judgments about the nature of the development work,
94

and our judgments in this regard may differ from those made by other companies. General and administrativecosts related to developing or obtaining such software are expensed as incurred.
We review our capitalized software development costs and our other long-lived assets for impairment ateach quarterly balance sheet date and whenever events or changes in circumstances indicate that the carryingamount of our long-lived assets should be assessed. Our judgments about impairment are based in part onsubjective assessments of the usefulness of the relevant software and may differ from comparable assessmentsmade by others. We have not recorded any impairment charges since our formation. To analyze recoverability,we estimate undiscounted net future cash flows over the remaining life of such assets. If these projected cashflows are less than the carrying amount, impairment would be recognized, resulting in a write-down of assetsto their estimated fair value with a corresponding charge to earnings. We believe that our capitalized softwaredevelopment costs are appropriately valued in our consolidated financial statements and related notes includedelsewhere in this Annual Report on Form 10-K.
ITEM 7(A). QUANTITATIVE AND QUALITATIVE DISCLOSURES ABOUT MARKET RISK
We are exposed to market risk in the ordinary course of business. This market risk consists primarily ofinterest rate risk associated with our cash and cash equivalents, short-term investments, restricted cash, long-term investments, current and long-term debt and foreign currency exchange rate risk.
Interest Rate Risk
We have exposure to market risk for changes in interest rates relating to our cash and cash equivalents,short-term investments, current and noncurrent restricted cash and indebtedness. As of December 31, 2007 and2006, our cash and cash equivalents, short-term investments and current and noncurrent restricted cash were$283.2 million and $297.8 million, respectively, of which $16.0 million and $23.5 million, respectively, weredenominated in pounds sterling and Canadian dollars. The remaining investments are denominated inU.S. dollars. We would not expect our operating results or cash flows to be significantly affected by changesin market interest rates. We do not use our investment portfolio for trading or other speculative purposes.
At December 31, 2007, we had outstanding a $221.9 million term loan under our Credit Facilities whichis subject to interest rate risk. A hypothetical 100 basis point increase in long-term interest rates woulddecrease annual pre-tax earnings by $2.2 million, assuming no change in the volume or composition of ourdebt.
Foreign Currency Exchange Rate Risk
We have foreign currency transaction risk related to the settlement of foreign currency denominatedassets, liabilities and payables that occur through our foreign operations which are received in or paid inpounds sterling due to the increase or decrease in the period-end foreign currency exchange rates betweenperiods. We had foreign currency transaction gains (losses) of $842,000, ($288,000) and $1.5 million for theyears ended December 31, 2007, 2006 and 2005, respectively, primarily attributable to the fluctuations ofpounds sterling relative to the U.S. dollar. The average exchange rate of pounds sterling to the U.S. dollarincreased from 1.8128 for the year ended December 31, 2005 to 1.8434 for the year ended December 31, 2006and then increased to 2.0020 for the year ended December 31, 2007.
We have historically generated a significant portion of our revenues from sales to participants locatedoutside of the United States, principally in the United Kingdom. Of our consolidated revenues, 1.2%, 7.2%and 38.3% were denominated in pounds sterling or Canadian dollars for the years ended December 31, 2007,2006 and 2005, respectively. Of our consolidated operating expenses, 15.9%, 29.8% and 48.1% weredenominated in pounds sterling or Canadian dollars for the years ended December 31, 2007, 2006 and 2005,respectively. As the pounds sterling or Canadian dollar exchange rate changes, the U.S. equivalent of revenuesand expenses denominated in foreign currencies changes accordingly. Our operating expenses, certain of whichare denominated in pounds sterling, increased $2.7 million for the year ended December 31, 2007 as comparedto the same period in the prior year due to the 8.6% increase in the average exchange rate of pounds sterlingto the U.S. dollar for the year ended December 31, 2007 as compared to the same period in 2006. A 10%adverse change in the underlying foreign currency exchange rates would not be significant to our financialcondition or results of operations.
95

As of the second quarter of 2006, we began charging exchange fees in U.S. dollars rather than in poundssterling in our key U.K. futures contracts, including crude oil and heating oil contracts. All sales in ourbusiness are now denominated in U.S. dollars, except for some small futures contracts at ICE Futures Europeand sales through ICE Futures Canada. We may experience substantial gains or losses from foreign currencytransactions in the future given there are still net assets or net liabilities and expenses of our U.K. andCanadian subsidiaries financial statements that are denominated in pounds sterling or Canadian dollars. OurU.K. operations in some instances function as a natural hedge because we generally hold an equal amount ofmonetary assets and liabilities that are denominated in pounds sterling.
The revenues, expenses and financial results of ICE Futures Europe and the other U.K. subsidiaries havehistorically been denominated in pounds sterling, the functional currency of our U.K. subsidiaries. We hadforeign currency translation risk equal to our net investment in our U.K. subsidiaries. The financial statementsof our U.K. subsidiaries were translated into U.S. dollars using current rates of exchange, with gains or lossesincluded in the cumulative translation adjustment account, a component of shareholders’ equity. Effective as ofJuly 1, 2006, the functional currency of the majority of our U.K. subsidiaries became the U.S. dollar. Thefunctional currency of an entity is the currency of the primary economic environment in which the entityoperates. Normally, it is the currency of the environment in which an entity primarily generates and expendscash. Once the functional currency of a foreign entity is determined, that determination should be usedconsistently unless significant changes in economic facts and circumstances indicate clearly that the functionalcurrency has changed. A change in functional currency should be accounted for prospectively, and previouslyissued financial statements should not be restated for a change in functional currency. In addition, if thefunctional currency changes from a foreign currency to the reporting currency, as is the case with us,translation adjustments for prior periods should not be removed from equity and the translated amounts fornon-monetary assets as the end of the prior period become the accounting basis for those assets in the periodof the change and subsequent periods. The functional currency switched based on various economic factorsand circumstances, including the fact that beginning in the second quarter of 2006, ICE Futures Europe beganto charge and collect exchange fees in U.S. dollars rather than pounds sterling in its key futures contracts,including crude oil and heating oil contracts. We will no longer recognize any translation adjustments in theconsolidated financial statements subsequent to June 30, 2006 for those U.K. subsidiaries that have switchedtheir functional currency to the U.S. dollar.
In connection with our acquisition of ICE Futures Canada in August 2007, we now have foreign currencytranslation risk equal to our net investment in certain Canadian subsidiaries. The revenues, expenses andfinancial results of these Canadian subsidiaries are denominated in Canadian dollars, which is the functionalcurrency of these subsidiaries. The financial statements of these subsidiaries are translated into U.S. dollarsusing current rate of exchange, with gains or losses included in the cumulative translation adjustment account,a component of shareholders’ equity. As of December 31, 2007, the portion of our shareholders’ equityattributable to accumulated other comprehensive income from foreign currency translation was $33.0 million.The period-end foreign currency exchange rate for pounds sterling to the U.S. dollar increased from 1.7188 asof December 31, 2005 to 1.9586 as of December 31, 2006 and further increased to 1.9843 as of December 31,2007. The period-end foreign currency exchange rate for Canadian dollar to the U.S. dollar decreased from1.0515 as of August 27, 2007, the acquisition date of ICE Futures Canada, to 0.9881 as of December 31,2007.
Impact of Inflation
We have not been adversely affected by inflation as technological advances and competition havegenerally caused prices for the hardware and software that we use for our electronic platform to remainconstant or to decline. In the event of inflation, we believe that we will be able to pass on any price increasesto our participants, as the prices that we charge are not governed by long-term contracts.
96

ITEM 8. FINANCIAL STATEMENTS AND SUPPLEMENTARY DATA
INDEX TO CONSOLIDATED FINANCIAL STATEMENTSPage
IntercontinentalExchange, Inc. and Subsidiaries:Report of Management on Internal Control over Financial Reporting . . . . . . . . . . . . . . . . . . . . . . . . . . . 98
Report of Independent Registered Public Accounting Firm on Internal Control over FinancialReporting . . . . . . . . . . . . . . . . . . . . . . . . . . . . . . . . . . . . . . . . . . . . . . . . . . . . . . . . . . . . . . . . . . . . . 99
Report of Independent Registered Public Accounting Firm on Financial Statements . . . . . . . . . . . . . . . . 101
Consolidated Balance Sheets as of December 31, 2007 and 2006 . . . . . . . . . . . . . . . . . . . . . . . . . . . . . . 102
Consolidated Statements of Income for the years ended December 31, 2007, 2006 and 2005. . . . . . . . . . 103
Consolidated Statements of Changes in Shareholders’ Equity for the years ended December 31, 2007,2006 and 2005 . . . . . . . . . . . . . . . . . . . . . . . . . . . . . . . . . . . . . . . . . . . . . . . . . . . . . . . . . . . . . . . . . 104
Consolidated Statements of Comprehensive Income for the years ended December 31, 2007, 2006 and2005. . . . . . . . . . . . . . . . . . . . . . . . . . . . . . . . . . . . . . . . . . . . . . . . . . . . . . . . . . . . . . . . . . . . . . . . . 105
Consolidated Statements of Cash Flows for the years ended December 31, 2007, 2006 and 2005 . . . . . . 106
Notes to Consolidated Financial Statements . . . . . . . . . . . . . . . . . . . . . . . . . . . . . . . . . . . . . . . . . . . . . . 107
97

REPORT OF MANAGEMENT ON INTERNAL CONTROL OVER FINANCIAL REPORTING
Our management is responsible for the preparation and integrity of the consolidated financial statementsappearing in our Annual Report on Form 10-K. The financial statements were prepared in conformity withgenerally accepted accounting principles appropriate in the circumstances and, accordingly, include certainamounts based on our best judgments and estimates. Financial information in this Annual Report on Form 10-Kis consistent with that in the financial statements.
Our management is responsible for establishing and maintaining adequate internal control over financialreporting as such term is defined in Rule 13a-15(f) under the Securities Exchange Act of 1934 (“ExchangeAct”). Our internal control over financial reporting is designed to provide reasonable assurance regarding thereliability of financial reporting and the preparation of the consolidated financial statements. Our internalcontrol over financial reporting is supported by a program of internal audits and appropriate reviews bymanagement, written policies and guidelines, careful selection and training of qualified personnel and a writtenCode of Business Conduct adopted by our Board of Directors, applicable to all Company Directors and allofficers and employees of our Company and subsidiaries.
Because of its inherent limitations, internal control over financial reporting may not prevent or detectmisstatements and even when determined to be effective, can only provide reasonable assurance with respectto financial statement preparation and presentation. Also, projections of any evaluation of effectiveness tofuture periods are subject to the risk that controls may become inadequate because of changes in conditions, orthat the degree of compliance with the policies or procedures may deteriorate.
The Audit Committee of our Board of Directors, comprised solely of directors who are independent inaccordance with the requirements of the New York Stock Exchange listing standards, the Exchange Act andour Board of Director Governance Principles, meets with the independent auditors, management and internalauditors periodically to discuss internal control over financial reporting and auditing and financial reportingmatters. The Audit Committee reviews with the independent auditors the scope and results of the audit effort.The Audit Committee also meets periodically with the independent auditors and the internal auditors withoutmanagement present to ensure that the independent auditors and the internal auditors have free access to theAudit Committee. Our Audit Committee’s Report will be included in our 2008 Proxy Statement.
Management assessed the effectiveness of our internal control over financial reporting as of December 31,2007. In making this assessment, management used the criteria set forth by the Committee of SponsoringOrganizations of the Treadway Commission (“COSO”) in Internal Control — Integrated Framework. Based onour assessment, management believes that we maintained effective internal control over financial reporting asof December 31, 2007.
As permitted by SEC regulations, our management has excluded ICE Futures U.S., Inc. and ICE FuturesCanada, Inc. from its assessment of internal control over financial reporting as of December 31, 2007 sincethey were acquired in purchase business combinations in 2007. ICE Futures U.S., Inc. and ICE FuturesCanada, Inc. are wholly-owned subsidiaries with total assets of $988.4 million as of December 31, 2007 andtotal revenues of $127.1 million since the dates of acquisition.
Our independent auditors, Ernst & Young LLP, a registered public accounting firm, are appointed by theAudit Committee, subject to ratification by our shareholders. Ernst & Young LLP has audited and reported onour consolidated financial statements and the effectiveness of our internal control over financial reporting. Thereports of the independent auditors are contained in this Annual Report.
/s/ Jeffrey C. Sprecher /s/ Scott A. HillJeffrey C. SprecherChairman of the Board andChief Executive Officer
Scott A. HillSenior Vice President,Chief Financial Officer
February 11, 2008 February 11, 2008
98

REPORT OF INDEPENDENT REGISTERED PUBLIC ACCOUNTING FIRM ON INTERNALCONTROL OVER FINANCIAL REPORTING
Board of Directors and ShareholdersIntercontinentalExchange, Inc.
We have audited IntercontinentalExchange, Inc.’s internal control over financial reporting as of December 31,2007, based on criteria established in Internal Control — Integrated Framework issued by the Committee ofSponsoring Organizations of the Treadway Commission (the COSO criteria). IntercontinentalExchange, Inc.’smanagement is responsible for maintaining effective internal control over financial reporting, and for itsassessment of the effectiveness of internal control over financial reporting included in the accompanying “Reportof Management on Internal Control over Financial Reporting”. Our responsibility is to express an opinion on theCompany’s internal control over financial reporting based on our audit.
We conducted our audit in accordance with the standards of the Public Company Accounting OversightBoard (United States). Those standards require that we plan and perform the audit to obtain reasonableassurance about whether effective internal control over financial reporting was maintained in all materialrespects. Our audit included obtaining an understanding of internal control over financial reporting, assessingthe risk that a material weakness exists, testing and evaluating the design and operating effectiveness ofinternal control based on the assessed risk, and performing such other procedures as we considered necessaryin the circumstances. We believe that our audit provides a reasonable basis for our opinion.
A company’s internal control over financial reporting is a process designed to provide reasonableassurance regarding the reliability of financial reporting and the preparation of financial statements for externalpurposes in accordance with generally accepted accounting principles. A company’s internal control overfinancial reporting includes those policies and procedures that (1) pertain to the maintenance of records that,in reasonable detail, accurately and fairly reflect the transactions and dispositions of the assets of the company;(2) provide reasonable assurance that transactions are recorded as necessary to permit preparation of financialstatements in accordance with generally accepted accounting principles, and that receipts and expenditures ofthe company are being made only in accordance with authorizations of management and directors of thecompany; and (3) provide reasonable assurance regarding prevention or timely detection of unauthorizedacquisition, use, or disposition of the company’s assets that could have a material effect on the financialstatements.
Because of its inherent limitations, internal control over financial reporting may not prevent or detectmisstatements. Also, projections of any evaluation of effectiveness to future periods are subject to the risk thatcontrols may become inadequate because of changes in conditions, or that the degree of compliance with thepolicies or procedures may deteriorate.
As indicated in the accompanying “Report of Management on Internal Control over Financial Reporting”,management’s assessment of and conclusion on the effectiveness of internal control over financial reportingdid not include the internal controls of ICE Futures U.S., which is included in the 2007 consolidated financialstatements of IntercontinentalExchange, Inc. and constituted $976.8 million and $52.7 million of total and netassets, respectively, as of December 31, 2007 and $124.8 million and $41.8 million of revenues and netincome, excluding intercompany charges, respectively, for the year then ended. Additionally, management’sassessment of and conclusion on the effectiveness of internal control over financial reporting did not includethe internal controls of ICE Futures Canada, which is included in the 2007 consolidated financial statementsof IntercontinentalExchange, Inc. and constituted $11.6 million and $2.2 million of total and net assets,respectively, as of December 31, 2007 and $2.3 million and $0.6 million of revenues and net income,respectively, for the year then ended. Our audit of internal control over financial reporting of Intercontinenta-lExchange, Inc. also did not include an evaluation of the internal control over financial reporting of ICEFutures U.S. and ICE Futures Canada.
In our opinion, IntercontinentalExchange, Inc. maintained, in all material respects, effective internalcontrol over financial reporting as of December 31, 2007, based on the COSO criteria.
99

We have also audited, in accordance with the standards of the Public Company Accounting OversightBoard (United States), the consolidated balance sheets of IntercontinentalExchange, Inc. and Subsidiaries as ofDecember 31, 2007 and 2006, and the related consolidated statements of income, changes in shareholders’equity, comprehensive income, and cash flows for each of the three years in the period ended December 31,2007, of IntercontinentalExchange, Inc. and Subsidiaries and our report dated February 11, 2008 expressed anunqualified opinion thereon.
/s/ Ernst & Young LLP
Atlanta, GeorgiaFebruary 11, 2008
100

REPORT OF INDEPENDENT REGISTERED PUBLIC ACCOUNTING FIRM ONFINANCIAL STATEMENTS
Board of Directors and ShareholdersIntercontinentalExchange, Inc.
We have audited the accompanying consolidated balance sheets of IntercontinentalExchange, Inc. andSubsidiaries as of December 31, 2007 and 2006, and the related consolidated statements of income, changes inshareholders’ equity, comprehensive income, and cash flows for each of the three years in the period endedDecember 31, 2007. Our audits also included the financial statement schedule listed in the Index at Item 15(a).These financial statements and schedule are the responsibility of the Company’s management. Our responsibil-ity is to express an opinion on these financial statements and schedule based on our audits.
We conducted our audits in accordance with the standards of the Public Company Accounting OversightBoard (United States). Those standards require that we plan and perform the audit to obtain reasonableassurance about whether the financial statements are free of material misstatement. An audit includesexamining, on a test basis, evidence supporting the amounts and disclosures in the financial statements. Anaudit also includes assessing the accounting principles used and significant estimates made by management, aswell as evaluating the overall financial statement presentation. We believe that our audits provide a reasonablebasis for our opinion.
In our opinion, the consolidated financial statements referred to above present fairly, in all materialrespects, the consolidated financial position of IntercontinentalExchange, Inc. and Subsidiaries at December 31,2007 and 2006, and the consolidated results of their operations and their cash flows for each of the three yearsin the period ended December 31, 2007, in conformity with U.S. generally accepted accounting principles.Also, in our opinion, the related financial statement schedule, when considered in relation to the basicfinancial statements taken as a whole, presents fairly in all material respects the information set forth therein.
As discussed in Notes 2, 11, and 12 to the consolidated financial statements, the Company adoptedStatement of Financial Accounting Standards No. 123(R), “Share-Based Payment”, effective January 1, 2006and Financial Accounting Standards Board Interpretation No. 48, “Accounting for Uncertainty in IncomeTaxes — an Interpretation of FASB Statement No. 109”, effective January 1, 2007.
We also have audited, in accordance with the standards of the Public Company Accounting Oversight Board(United States), IntercontinentalExchange, Inc.’s internal control over financial reporting as of December 31, 2007,based on criteria established in Internal Control — Integrated Framework issued by the Committee of SponsoringOrganizations of the Treadway Commission and our report dated February 11, 2008 expressed an unqualifiedopinion thereon.
/s/ Ernst & Young LLP
Atlanta, GeorgiaFebruary 11, 2008
101

IntercontinentalExchange, Inc. and Subsidiaries
Consolidated Balance Sheets(In thousands, except per share amounts)
2007 2006December 31,
ASSETSCurrent assets:
Cash and cash equivalents . . . . . . . . . . . . . . . . . . . . . . . . . . . . . . . . . . . . . . . . . . . . . . . . . . . . . . . $ 119,597 $204,257Restricted cash. . . . . . . . . . . . . . . . . . . . . . . . . . . . . . . . . . . . . . . . . . . . . . . . . . . . . . . . . . . . . . . 19,624 16,193Short-term investments . . . . . . . . . . . . . . . . . . . . . . . . . . . . . . . . . . . . . . . . . . . . . . . . . . . . . . . . . 140,955 77,354Customer accounts receivable:
Trade, net of allowance for doubtful accounts of $370 and $985 at December 31, 2007 and 2006,respectively . . . . . . . . . . . . . . . . . . . . . . . . . . . . . . . . . . . . . . . . . . . . . . . . . . . . . . . . . . . . . . 51,241 31,673
Related-parties . . . . . . . . . . . . . . . . . . . . . . . . . . . . . . . . . . . . . . . . . . . . . . . . . . . . . . . . . . . . . 777 448Asset held for sale . . . . . . . . . . . . . . . . . . . . . . . . . . . . . . . . . . . . . . . . . . . . . . . . . . . . . . . . . . . . — 3,698Current deferred tax asset, net . . . . . . . . . . . . . . . . . . . . . . . . . . . . . . . . . . . . . . . . . . . . . . . . . . . . . 4,908 —Margin deposits and guaranty funds . . . . . . . . . . . . . . . . . . . . . . . . . . . . . . . . . . . . . . . . . . . . . . . . . 792,052 —Prepaid expenses and other current assets . . . . . . . . . . . . . . . . . . . . . . . . . . . . . . . . . . . . . . . . . . . . . 12,940 7,294
Total current assets . . . . . . . . . . . . . . . . . . . . . . . . . . . . . . . . . . . . . . . . . . . . . . . . . . . . . . . . . . . . . 1,142,094 340,917Property and equipment, net . . . . . . . . . . . . . . . . . . . . . . . . . . . . . . . . . . . . . . . . . . . . . . . . . . . . . . . 63,524 26,280Other noncurrent assets:
Goodwill . . . . . . . . . . . . . . . . . . . . . . . . . . . . . . . . . . . . . . . . . . . . . . . . . . . . . . . . . . . . . . . . . . 1,009,687 79,575Other intangible assets, net . . . . . . . . . . . . . . . . . . . . . . . . . . . . . . . . . . . . . . . . . . . . . . . . . . . . . . . 537,722 1,551Cost method investments . . . . . . . . . . . . . . . . . . . . . . . . . . . . . . . . . . . . . . . . . . . . . . . . . . . . . . . . 38,778 38,738Other noncurrent assets . . . . . . . . . . . . . . . . . . . . . . . . . . . . . . . . . . . . . . . . . . . . . . . . . . . . . . . . . 4,540 6,150
Total other noncurrent assets . . . . . . . . . . . . . . . . . . . . . . . . . . . . . . . . . . . . . . . . . . . . . . . . . . . . . . . 1,590,727 126,014Total assets . . . . . . . . . . . . . . . . . . . . . . . . . . . . . . . . . . . . . . . . . . . . . . . . . . . . . . . . . . . . . . . . . . $2,796,345 $493,211
LIABILITIES AND SHAREHOLDERS’ EQUITYCurrent liabilities:
Accounts payable and accrued liabilities . . . . . . . . . . . . . . . . . . . . . . . . . . . . . . . . . . . . . . . . . . . . . . $ 27,811 $ 13,228Accrued salaries and benefits . . . . . . . . . . . . . . . . . . . . . . . . . . . . . . . . . . . . . . . . . . . . . . . . . . . . . 23,878 18,135Current portion of licensing agreement . . . . . . . . . . . . . . . . . . . . . . . . . . . . . . . . . . . . . . . . . . . . . . . 10,572 —Current portion of long-term debt . . . . . . . . . . . . . . . . . . . . . . . . . . . . . . . . . . . . . . . . . . . . . . . . . . 37,500 —Income taxes payable . . . . . . . . . . . . . . . . . . . . . . . . . . . . . . . . . . . . . . . . . . . . . . . . . . . . . . . . . . 11,687 2,991Margin deposits and guaranty funds . . . . . . . . . . . . . . . . . . . . . . . . . . . . . . . . . . . . . . . . . . . . . . . . . 792,052 —Other current liabilities . . . . . . . . . . . . . . . . . . . . . . . . . . . . . . . . . . . . . . . . . . . . . . . . . . . . . . . . . 7,461 3,545
Total current liabilities . . . . . . . . . . . . . . . . . . . . . . . . . . . . . . . . . . . . . . . . . . . . . . . . . . . . . . . . . . . 910,961 37,899Noncurrent liabilities:
Noncurrent deferred tax liability, net . . . . . . . . . . . . . . . . . . . . . . . . . . . . . . . . . . . . . . . . . . . . . . . . 108,739 —Long-term debt . . . . . . . . . . . . . . . . . . . . . . . . . . . . . . . . . . . . . . . . . . . . . . . . . . . . . . . . . . . . . . 184,375 —Noncurrent portion of licensing agreement . . . . . . . . . . . . . . . . . . . . . . . . . . . . . . . . . . . . . . . . . . . . . 89,645 —Unearned government grant . . . . . . . . . . . . . . . . . . . . . . . . . . . . . . . . . . . . . . . . . . . . . . . . . . . . . . 8,737 —Other noncurrent liabilities . . . . . . . . . . . . . . . . . . . . . . . . . . . . . . . . . . . . . . . . . . . . . . . . . . . . . . . 17,032 844
Total noncurrent liabilities . . . . . . . . . . . . . . . . . . . . . . . . . . . . . . . . . . . . . . . . . . . . . . . . . . . . . . . . . 408,528 844Total liabilities . . . . . . . . . . . . . . . . . . . . . . . . . . . . . . . . . . . . . . . . . . . . . . . . . . . . . . . . . . . . . . . . 1,319,489 38,743Commitments and contingenciesSHAREHOLDERS’ EQUITY:
Preferred stock, $0.01 par value; 25,000 shares authorized; no shares issued or outstanding at December 31,2007 and 2006 . . . . . . . . . . . . . . . . . . . . . . . . . . . . . . . . . . . . . . . . . . . . . . . . . . . . . . . . . . . . . — —
Common stock, $0.01 par value; 194,275 shares authorized; 70,963 and 59,596 shares issued at December 31,2007 and 2006, respectively; 69,711 and 58,125 shares outstanding at December 31, 2007 and 2006,respectively . . . . . . . . . . . . . . . . . . . . . . . . . . . . . . . . . . . . . . . . . . . . . . . . . . . . . . . . . . . . . . . 710 596
Treasury stock, at cost; 1,252 and 1,471 shares at December 31, 2007 and 2006, respectively . . . . . . . . . . . . (30,188) (9,748)Additional paid-in capital . . . . . . . . . . . . . . . . . . . . . . . . . . . . . . . . . . . . . . . . . . . . . . . . . . . . . . . . 1,043,971 245,030Retained earnings . . . . . . . . . . . . . . . . . . . . . . . . . . . . . . . . . . . . . . . . . . . . . . . . . . . . . . . . . . . . . 431,708 191,179Accumulated other comprehensive income . . . . . . . . . . . . . . . . . . . . . . . . . . . . . . . . . . . . . . . . . . . . . 30,655 27,411
Total shareholders’ equity . . . . . . . . . . . . . . . . . . . . . . . . . . . . . . . . . . . . . . . . . . . . . . . . . . . . . . . . . 1,476,856 454,468Total liabilities and shareholders’ equity . . . . . . . . . . . . . . . . . . . . . . . . . . . . . . . . . . . . . . . . . . . . . . . . $2,796,345 $493,211
See accompanying notes.
102

IntercontinentalExchange, Inc. and SubsidiariesConsolidated Statements of Income
(In thousands, except per share amounts)
2007 2006 2005Year Ended December 31,
Revenues:Transaction fees, net (including $13,657 and $15,411 with related-parties in
2006 and 2005, respectively) . . . . . . . . . . . . . . . . . . . . . . . . . . . . . . . . . $ 490,358 $273,629 $ 136,976
Market data fees (including $412 and $198 with related-parties in 2006 and2005, respectively) . . . . . . . . . . . . . . . . . . . . . . . . . . . . . . . . . . . . . . . . 70,396 34,236 14,642
Other (including $1,729, $1,984 and $1,934 with related-parties in 2007,2006 and 2005, respectively) . . . . . . . . . . . . . . . . . . . . . . . . . . . . . . . . . 13,539 5,934 4,247
Total revenues . . . . . . . . . . . . . . . . . . . . . . . . . . . . . . . . . . . . . . . . . . . . . . . 574,293 313,799 155,865
Operating expenses:Compensation and benefits . . . . . . . . . . . . . . . . . . . . . . . . . . . . . . . . . . . . 101,397 49,750 35,753
Professional services . . . . . . . . . . . . . . . . . . . . . . . . . . . . . . . . . . . . . . . . 23,047 11,395 10,124
Patent royalty . . . . . . . . . . . . . . . . . . . . . . . . . . . . . . . . . . . . . . . . . . . . . . 1,705 9,039 1,491
CBOT merger-related transaction costs . . . . . . . . . . . . . . . . . . . . . . . . . . . 11,121 — —
Selling, general and administrative . . . . . . . . . . . . . . . . . . . . . . . . . . . . . . 50,759 25,266 17,395
Floor closure costs . . . . . . . . . . . . . . . . . . . . . . . . . . . . . . . . . . . . . . . . . . — — 4,814
Settlement expense . . . . . . . . . . . . . . . . . . . . . . . . . . . . . . . . . . . . . . . . . . — — 15,000
Depreciation and amortization . . . . . . . . . . . . . . . . . . . . . . . . . . . . . . . . . . 32,701 13,714 15,083
Total operating expenses . . . . . . . . . . . . . . . . . . . . . . . . . . . . . . . . . . . . . . . 220,730 109,164 99,660
Operating income . . . . . . . . . . . . . . . . . . . . . . . . . . . . . . . . . . . . . . . . . . . . 353,563 204,635 56,205
Other income (expense):
Interest and investment income . . . . . . . . . . . . . . . . . . . . . . . . . . . . . . . . . 11,865 8,565 3,090
Interest expense . . . . . . . . . . . . . . . . . . . . . . . . . . . . . . . . . . . . . . . . . . . . (18,641) (231) (613)
Other income (expense), net . . . . . . . . . . . . . . . . . . . . . . . . . . . . . . . . . . . 11,647 (426) 1,313
Total other income, net . . . . . . . . . . . . . . . . . . . . . . . . . . . . . . . . . . . . . . . . 4,871 7,908 3,790
Income before income taxes . . . . . . . . . . . . . . . . . . . . . . . . . . . . . . . . . . . . . 358,434 212,543 59,995
Income tax expense . . . . . . . . . . . . . . . . . . . . . . . . . . . . . . . . . . . . . . . . . . . 117,822 69,275 19,585
Net income . . . . . . . . . . . . . . . . . . . . . . . . . . . . . . . . . . . . . . . . . . . . . . . . . $ 240,612 $143,268 $ 40,410
Redemption adjustments to redeemable stock put . . . . . . . . . . . . . . . . . . . . . . — — (61,319)
Net income (loss) available to common shareholders . . . . . . . . . . . . . . . . . . . $ 240,612 $143,268 $(20,909)
Earnings (loss) per common share:
Basic. . . . . . . . . . . . . . . . . . . . . . . . . . . . . . . . . . . . . . . . . . . . . . . . . . . . $ 3.49 $ 2.54 $ (0.39)
Diluted . . . . . . . . . . . . . . . . . . . . . . . . . . . . . . . . . . . . . . . . . . . . . . . . . . $ 3.39 $ 2.40 $ (0.39)
Weighted average common shares outstanding:
Basic. . . . . . . . . . . . . . . . . . . . . . . . . . . . . . . . . . . . . . . . . . . . . . . . . . . . 68,985 56,474 53,218
Diluted . . . . . . . . . . . . . . . . . . . . . . . . . . . . . . . . . . . . . . . . . . . . . . . . . . 70,980 59,599 53,218
See accompanying notes.
103

IntercontinentalExchange, Inc. and SubsidiariesConsolidated Statements of Changes in Shareholders’ Equity
(In thousands)
Shares Value Shares Value Shares Value Shares Value
AdditionalPaid-inCapital
DeferredStock
CompensationRetainedEarnings
ForeignCurrency
Translation
Available-For-Sale
Securities
NetInvestment
Hedges
TotalShareholders’
Equity
CommonStock
Class ACommon
Stock,Series 1
Class ACommon
Stock,Series 2 Treasury Stock
Accumulated OtherComprehensive Income
Net Unrealized Gain (Loss) from
Balance, January 1, 2005 . . — $ — 2,863 $ 29 51,537 $ 515 (1,534) $ (5,541) $ 39,886 $(6,087) $ 68,820 $ 37,043 $ — $(2,516) $ 132,149Other comprehensive income
(loss) . . . . . . . . . . . . — — — — — — — — — — — (15,705) 91 66 (15,548)Exercise of common stock
options . . . . . . . . . . . — — — — 145 2 — — 864 — — — — — 866Issuance of restricted
stock . . . . . . . . . . . . — — — — — — — — 2,837 (2,467) — — — — 370Amortization of deferred
compensation . . . . . . . — — — — — — — — — 1,655 — — — — 1,655Redemption adjustments to
redeemable stock put . . . — — — — — — — — — — (61,319) — — — (61,319)Cancellation of redeemable
stock put . . . . . . . . . . — — — — — — — — 78,901 — — — — — 78,901Issuance of common stock . . 2,500 25 — — — — — — 55,114 — — — — — 55,139Conversion of Class A
common stock, Series 2into common stock . . . . 15,900 159 — — (15,900) (159) — — — — — — — — —
Net income . . . . . . . . . . — — — — — — — — — — 40,410 — — — 40,410
Balance, December 31,2005 . . . . . . . . . . . . 18,400 184 2,863 29 35,782 358 (1,534) (5,541) 177,602 (6,899) 47,911 21,338 91 (2,450) 232,623
Other comprehensive income(loss) . . . . . . . . . . . . — — — — — — — — — — — 8,525 (93) — 8,432
Exercise of common stockoptions . . . . . . . . . . . 2,407 24 — — 103 1 (3) (188) 21,981 — — — — — 21,818
Reversal of deferred stockcompensation inconnection with adoptionof SFAS No. 123(R) . . . . — — — — — — — — (6,899) 6,899 — — — — —
Conversion of Class Acommon stock, Series 1and Series 2 into commonstock . . . . . . . . . . . . 38,748 388 (2,863) (29) (35,885) (359) — — — — — — — — —
Treasury shares received forrestricted stock and stockoption tax payment . . . . — — — — — — (69) (4,765) — — — — — — (4,765)
Stock-based compensation . . — — — — — — — — 9,489 — — — — — 9,489Issuance of restricted
stock . . . . . . . . . . . . 16 — — — — — 135 746 (746) — — — — — —Tax benefits from stock
option plans . . . . . . . . — — — — — — — — 43,313 — — — — — 43,313Issuance of common stock . . 25 — — — — — — — 290 — — — — — 290Net income . . . . . . . . . . — — — — — — — — — — 143,268 — — — 143,268
Balance, December 31,2006 . . . . . . . . . . . . 59,596 596 — — — — (1,471) (9,748) 245,030 — 191,179 29,863 (2) (2,450) 454,468
Other comprehensiveincome . . . . . . . . . . . — — — — — — — — — — — 3,183 61 — 3,244
Exercise of common stockoptions . . . . . . . . . . . 1,044 11 — — — — (4) (472) 9,920 — — — — — 9,459
Issuance of shares foracquisitions . . . . . . . . 10,303 103 — — — — — — 707,560 — — — — — 707,663
Treasury shares receivedduring acquisition . . . . . — — — — — — (1) (197) — — — — — — (197)
Treasury shares received forrestricted stock and stockoption tax payment . . . . — — — — — — (181) (24,814) — — — — — — (24,814)
Stock-based compensation . . — — — — — — — — 25,415 — — — — — 25,415Issuance of restricted
stock . . . . . . . . . . . . 20 — — — — — 405 5,043 (5,043) — — — — — —Tax benefits from stock
option plans . . . . . . . . — — — — — — — — 61,089 — — — — — 61,089Cumulative effect of
adoption of FIN 48 . . . . — — — — — — — — — — (83)) — — — (83)Net income . . . . . . . . . . — — — — — — — — — — 240,612 — — — 240,612
Balance, December 31,2007 . . . . . . . . . . . . 70,963 $710 — $ — — $ — (1,252) $(30,188) $1,043,971 $ — $ 431,708 $ 33,046 $ 59 $(2,450) $1,476,856
See accompanying notes.
104

IntercontinentalExchange, Inc. and Subsidiaries
Consolidated Statements of Comprehensive Income(In thousands)
2007 2006 2005Year Ended December 31,
Net income . . . . . . . . . . . . . . . . . . . . . . . . . . . . . . . . . . . . . . . . . . . . . . . $240,612 $143,268 $ 40,410
Other comprehensive income:
Foreign currency translation adjustments, net of tax of $655, $830 and($476) for the years ended December 31, 2007, 2006 and 2005,respectively . . . . . . . . . . . . . . . . . . . . . . . . . . . . . . . . . . . . . . . . . . . . . 3,183 8,525 (15,705)
Change in available-for-sale securities, net of tax of $22, ($34) and $34for the years ended December 31, 2007, 2006 and 2005, respectively . . 61 (93) 91
Change in fair value of net investment hedges, net of tax of $40 for theyear ended December 31, 2005 . . . . . . . . . . . . . . . . . . . . . . . . . . . . . . — — 66
Comprehensive income . . . . . . . . . . . . . . . . . . . . . . . . . . . . . . . . . . . . . . $243,856 $151,700 $ 24,862
See accompanying notes.
105

IntercontinentalExchange, Inc. and Subsidiaries
Consolidated Statements of Cash Flows(In thousands)
2007 2006 2005Year Ended December 31,
Operating activitiesNet income . . . . . . . . . . . . . . . . . . . . . . . . . . . . . . . . . . . . . . . . . . . . . . . . . . . . . . . . $ 240,612 $ 143,268 $ 40,410Adjustments to reconcile net income to net cash provided by operating activities:Depreciation and amortization . . . . . . . . . . . . . . . . . . . . . . . . . . . . . . . . . . . . . . . . . . . . 32,701 13,714 15,083Gain on disposal of assets. . . . . . . . . . . . . . . . . . . . . . . . . . . . . . . . . . . . . . . . . . . . . . . (9,268) — —Amortization of debt issuance costs . . . . . . . . . . . . . . . . . . . . . . . . . . . . . . . . . . . . . . . . 698 147 108Allowance for doubtful accounts . . . . . . . . . . . . . . . . . . . . . . . . . . . . . . . . . . . . . . . . . . (615) 724 (27)Net realized gains on sales of available-for-sale investments . . . . . . . . . . . . . . . . . . . . . . . . (171) (882) (770)Stock-based compensation . . . . . . . . . . . . . . . . . . . . . . . . . . . . . . . . . . . . . . . . . . . . . . 23,595 8,825 1,655Issuance of vested restricted stock . . . . . . . . . . . . . . . . . . . . . . . . . . . . . . . . . . . . . . . . . — — 370Deferred taxes . . . . . . . . . . . . . . . . . . . . . . . . . . . . . . . . . . . . . . . . . . . . . . . . . . . . . . (3,222) (5,345) (2,356)Excess tax benefits from stock-based compensation . . . . . . . . . . . . . . . . . . . . . . . . . . . . . . (60,812) (40,996) —Non-cash floor closure costs . . . . . . . . . . . . . . . . . . . . . . . . . . . . . . . . . . . . . . . . . . . . . — — 560Changes in assets and liabilities:
Customer accounts receivable:Trade, net . . . . . . . . . . . . . . . . . . . . . . . . . . . . . . . . . . . . . . . . . . . . . . . . . . . . . . (4,919) (19,397) (5,447)Related-parties . . . . . . . . . . . . . . . . . . . . . . . . . . . . . . . . . . . . . . . . . . . . . . . . . . . (329) 1,325 (288)
Prepaid expenses and other current assets . . . . . . . . . . . . . . . . . . . . . . . . . . . . . . . . . . . (2,359) (4,310) (2,778)Noncurrent assets . . . . . . . . . . . . . . . . . . . . . . . . . . . . . . . . . . . . . . . . . . . . . . . . . . 1,267 (510) (1,320)Income taxes payable . . . . . . . . . . . . . . . . . . . . . . . . . . . . . . . . . . . . . . . . . . . . . . . . 74,003 37,791 2,994Accounts payable, accrued salaries and benefits, and other accrued liabilities . . . . . . . . . . . . (3,400) 16,335 1,618
Total adjustments . . . . . . . . . . . . . . . . . . . . . . . . . . . . . . . . . . . . . . . . . . . . . . . . . . . . 47,169 7,421 9,402Net cash provided by operating activities . . . . . . . . . . . . . . . . . . . . . . . . . . . . . . . . . . . . . 287,781 150,689 49,812Investing activitiesCapital expenditures . . . . . . . . . . . . . . . . . . . . . . . . . . . . . . . . . . . . . . . . . . . . . . . . . . (30,999) (12,377) (8,610)Capitalized software development costs . . . . . . . . . . . . . . . . . . . . . . . . . . . . . . . . . . . . . . (12,267) (7,438) (5,123)Cash paid for acquisitions, net of cash acquired . . . . . . . . . . . . . . . . . . . . . . . . . . . . . . . . (480,114) — —Purchase of intangible assets . . . . . . . . . . . . . . . . . . . . . . . . . . . . . . . . . . . . . . . . . . . . . (61,099) — —Proceeds from sale of assets . . . . . . . . . . . . . . . . . . . . . . . . . . . . . . . . . . . . . . . . . . . . . 13,269 — —Cost method investment . . . . . . . . . . . . . . . . . . . . . . . . . . . . . . . . . . . . . . . . . . . . . . . . (40) (36,937) —Proceeds from sales of available-for-sale investments . . . . . . . . . . . . . . . . . . . . . . . . . . . . . 272,771 346,090 58,755Purchases of available-for-sale investments. . . . . . . . . . . . . . . . . . . . . . . . . . . . . . . . . . . . (332,357) (309,227) (166,575)Capitalized acquisition costs . . . . . . . . . . . . . . . . . . . . . . . . . . . . . . . . . . . . . . . . . . . . . (121) (4,124) —(Increase) decrease in restricted cash. . . . . . . . . . . . . . . . . . . . . . . . . . . . . . . . . . . . . . . . (6,431) (3,615) 4,433Net cash used in investing activities . . . . . . . . . . . . . . . . . . . . . . . . . . . . . . . . . . . . . . . . (637,388) (27,628) (117,120)Financing activitiesExcess tax benefits from stock-based compensation . . . . . . . . . . . . . . . . . . . . . . . . . . . . . . 60,812 40,996 —Payments on capital lease obligations . . . . . . . . . . . . . . . . . . . . . . . . . . . . . . . . . . . . . . . — — (482)Net proceeds from issuance of common stock . . . . . . . . . . . . . . . . . . . . . . . . . . . . . . . . . . — 290 55,139Proceeds from credit facility . . . . . . . . . . . . . . . . . . . . . . . . . . . . . . . . . . . . . . . . . . . . . 250,000 — —Repayments of credit facilities . . . . . . . . . . . . . . . . . . . . . . . . . . . . . . . . . . . . . . . . . . . . (28,125) — (25,000)Issuance costs for credit facilities . . . . . . . . . . . . . . . . . . . . . . . . . . . . . . . . . . . . . . . . . . (2,375) — (194)Payments relating to treasury shares received for restricted stock and stock option tax payments
and exercises . . . . . . . . . . . . . . . . . . . . . . . . . . . . . . . . . . . . . . . . . . . . . . . . . . . . . (25,484) (4,953) —Proceeds from exercise of common stock options . . . . . . . . . . . . . . . . . . . . . . . . . . . . . . . 9,931 22,006 866Net cash provided by financing activities . . . . . . . . . . . . . . . . . . . . . . . . . . . . . . . . . . . . . 264,759 58,339 30,329Effect of exchange rate changes on cash and cash equivalents . . . . . . . . . . . . . . . . . . . . . . . 188 2,855 (4,218)Net increase (decrease) in cash and cash equivalents . . . . . . . . . . . . . . . . . . . . . . . . . . . . . (84,660) 184,255 (41,197)Cash and cash equivalents, beginning of year . . . . . . . . . . . . . . . . . . . . . . . . . . . . . . . . . . 204,257 20,002 61,199Cash and cash equivalents, end of year . . . . . . . . . . . . . . . . . . . . . . . . . . . . . . . . . . . . . . $ 119,597 $ 204,257 $ 20,002
Supplemental cash flow disclosureCash paid for income taxes . . . . . . . . . . . . . . . . . . . . . . . . . . . . . . . . . . . . . . . . . . . . . . $ 54,255 $ 38,279 $ 19,058
Cash paid for interest . . . . . . . . . . . . . . . . . . . . . . . . . . . . . . . . . . . . . . . . . . . . . . . . . $ 14,586 $ 86 $ 543
Supplemental noncash investing and financing activitiesRedemption adjustments to redeemable stock put . . . . . . . . . . . . . . . . . . . . . . . . . . . . . . . $ — $ — $ (61,319)
Cancellation of redeemable stock put . . . . . . . . . . . . . . . . . . . . . . . . . . . . . . . . . . . . . . . $ — $ — $ 78,901
See accompanying notes.
106

IntercontinentalExchange, Inc. and Subsidiaries
Notes to Consolidated Financial Statements
1. Nature of Business and Organization
IntercontinentalExchange, Inc. (the “Company”) owns and operates an Internet-based, global electronicmarketplace for facilitating trading in futures and over-the-counter (“OTC”) commodities and derivativefinancial products (the “Platform”). The Company owns 100% of ICE Futures Europe (formerly known as ICEFutures), which operates as a United Kingdom (“U.K.”) Recognized Investment Exchange for the purpose oftrading energy commodity futures and options contracts. The Company also owns 100% of the Board of Tradeof the City of New York, Inc., or NYBOT, which, effective September 3, 2007, changed its name to ICEFutures U.S., Inc. (“ICE Futures U.S.”). The Company acquired ICE Futures U.S. on January 12, 2007 and itoperates as a United States (“U.S.”) Designated Contract Market for the purpose of trading soft commodityand financial futures and options contracts. Headquartered in Atlanta, Georgia, the Company also has officesin London, New York, Chicago, Houston, Calgary, Winnipeg, Dublin and Singapore.
The Company currently operates the OTC markets as an exempt commercial market (“ECM”) pursuant tothe Commodity Exchange Act (“CEA”) and regulations of the Commodity Futures Trading Commission(“CFTC”). As an ECM, the Company is required to file a notice with the CFTC, provide the CFTC withaccess to its trading system and certain trading reports and respond to requests for information or records fromthe CFTC.
ICE Futures Europe is subject to extensive regulation in the U.K. by the Financial Services Authority, orFSA, in accordance with the Financial Services and Markets Act 2000. ICE Futures Europe is responsible formaintaining financial resources sufficient for the proper performance of its functions as a RecognizedInvestment Exchange, and, in order to satisfy this requirement, is obligated to maintain a minimum amount ofliquid financial assets at all times.
ICE Futures U.S. is subject to extensive regulation in the U.S. by the CFTC under the CEA. The CEAgenerally requires that futures trading conducted in the U.S. be conducted on a commodity exchangedesignated as a contract market by the CFTC. It also establishes non-financial criteria for an exchange to bedesignated to list futures and options contracts. Designation as a contract market for the trading of specifiedfutures contracts is non-exclusive. This means that the CFTC may designate additional exchanges as contractmarkets for trading in the same or similar contracts. As a designated contract market, ICE Futures U.S. is aself-regulatory organization that has instituted detailed rules and procedures to comply with the “coreprinciples” applicable to it under the CEA. ICE Futures U.S. also has surveillance and compliance operationsand procedures to monitor and enforce compliance with its rules, and ICE Futures U.S. is periodically auditedby the CFTC with respect to the fulfillment of ICE Futures U.S.’s self-regulatory programs in these areas.
The Company does not risk its own capital by engaging in any trading activities or by extending credit tomarket participants.
2. Summary of Significant Accounting Policies
Basis of Presentation
The accompanying consolidated financial statements are presented in accordance with U.S. generallyaccepted accounting principles. The consolidated financial statements include the accounts of the Companyand its wholly-owned subsidiaries. All intercompany balances and transactions between the Company and itswholly-owned subsidiaries have been eliminated in consolidation. As discussed in Note 3, the Companycompleted several acquisitions in 2007 and has included the financial results of these companies in itsconsolidated financial statements effective from the respective acquisition dates forward.
107

Use of Estimates
The preparation of financial statements in conformity with U.S. generally accepted accounting principlesrequires the Company’s management to make estimates and assumptions that affect the reported amounts ofassets and liabilities and disclosure of contingent assets and liabilities at the date of the financial statements.Estimates also affect the reported amounts of expenses during the reporting period. Actual amounts coulddiffer from those estimates.
Segment and Geographic Information
The Company currently has three reportable operating segments: its OTC business segment, its futuresbusiness segment, and its market data business segment. All three operate across domestic and internationalmarkets. Substantially all of the Company’s identifiable assets are located in the U.S., the U.K. and Canada.
Cash and Cash Equivalents
The Company considers all short-term, highly liquid investments with remaining maturities at thepurchase date of three months or less at the time of purchase to be cash equivalents.
Restricted Cash
The Company classifies all cash and cash equivalents that are not available for general use by theCompany, either due to Financial Services Authority requirements or through restrictions in specificagreements, as restricted in the accompanying consolidated balance sheets (Note 4).
Short-Term and Long-Term Investments
The Company invests a portion of its cash in excess of short-term operating needs in investment-grademarketable debt securities and municipal bonds (Note 5). These investments are classified as available-for-salein accordance with Statement of Financial Accounting Standards (“SFAS”) No. 115, Accounting for CertainInvestments in Debt and Equity Securities. The Company does not have any investments classified as held-to-maturity or trading. Available-for-sale investments are carried at their fair value, with unrealized gains andlosses, net of deferred income taxes, reported as a component of accumulated other comprehensive income.Realized gains and losses, and declines in value deemed to be other-than-temporary on available-for-saleinvestments, are recognized currently in earnings.
The Company determines the appropriate classification of its investments in marketable debt securitiesand municipal bonds at the time of purchase and reevaluates such designation at each balance sheet date. TheCompany may or may not hold securities with stated maturities greater than twelve months until maturity. Inresponse to changes in the availability of and the yield on alternative investments as well as liquidityrequirements, the Company occasionally sells these securities prior to their stated maturities. As thesesecurities are viewed by the Company as available to support current operations and requirements, certainmarketable debt securities and municipal bonds with maturities beyond 12 months are classified as currentassets in the accompanying consolidated balance sheets. Investments that the Company intends to hold formore than one year are classified as long-term investments in the accompanying consolidated balance sheets.
Cost Method Investments
The Company uses the cost method to account for investments in companies that the Company does notcontrol and for which the Company does not have the ability to exercise significant influence over operatingand financial policies (Note 6).
108
IntercontinentalExchange, Inc. and Subsidiaries
Notes to Consolidated Financial Statements — (Continued)

Margin Deposits and Guaranty Funds
Original margin, variation margin and guaranty fund deposits held by the Company’s clearing houses forclearing members may be in the form of cash, money market mutual fund shares, U.S. Governmentobligations, Canadian Government obligations, or letters of credit. Cash original margin, variation margin andguaranty fund deposits are reflected in the accompanying consolidated balance sheets as a current asset and acurrent liability. Cash received is invested by the Company’s clearing houses, primarily in overnighttransactions in money market mutual funds. Any interest earned on the guaranty fund cash deposits accrues tothe Company and is included in interest and investment income in the consolidated statements of income andany interest earned on the cash original margin deposits accrues to the clearing members. The amount ofmargin deposits on hand will fluctuate over time as a result of, among other things, the extent of openpositions held at any point in time by market participants in contracts and the margin rates then in effect forsuch contracts.
Non-cash original margin and guaranty fund deposits are not reflected in the accompanying consolidatedbalance sheets. These securities are held in safekeeping and are only pledged to the Company’s clearinghouses and the Company’s clearing houses do not take legal ownership. Interest and gain or loss on securitiesdeposited to satisfy original margin or guaranty fund requirements accrues to the clearing members.
Property and Equipment
Property and equipment are recorded at cost, reduced by accumulated depreciation (Note 7). Depreciationand amortization expense related to property and equipment is computed using the straight-line method basedon estimated useful lives of the assets, or in the case of leasehold improvements, the shorter of the initial leaseterm or the estimated useful life of the asset. The Company reviews the remaining estimated useful lives of itsproperty and equipment at each balance sheet date and will make adjustments to the estimated remaininguseful lives whenever events or changes in circumstances indicate that the remaining useful lives havechanged. Gains on disposals of property and equipment are included in other income and losses on disposalsof property and equipment are included in depreciation expense. Maintenance and repairs are expensed asincurred.
Software Development Costs
The Company capitalizes costs, both internal and external direct and incremental costs, related to softwaredeveloped or obtained for internal use in accordance with AICPA Statement of Position 98-1, Accounting forCosts of Computer Software Developed or Obtained for Internal Use. Software development costs incurredduring the preliminary or maintenance project stage are expensed as incurred, while costs incurred during theapplication development stage are capitalized and are amortized using the straight-line method over the usefullife of the software, not to exceed three years. Amortization of these capitalized costs begins only when thesoftware becomes ready for its intended use. General and administrative costs related to developing orobtaining such software are expensed as incurred.
Goodwill and Indefinite-Lived Intangible Assets
The Company has recorded goodwill for the excess of the purchase price for its acquisitions over the fairvalue of identifiable net assets acquired, including other identified intangible assets (Note 8). The Companyrecognizes specifically identifiable intangibles when a specific right or contract is acquired. Goodwill has beenallocated to reporting units for purposes of impairment testing based on the portion of synergy, cost savingsand other expected future cash flows expected to benefit the reporting units at the time of the acquisition.
The Company tests its goodwill for impairment at the reporting unit level, which in some cases isdifferent than the operating segment level where the goodwill is reported under SFAS No. 131, Disclosures
109
IntercontinentalExchange, Inc. and Subsidiaries
Notes to Consolidated Financial Statements — (Continued)

about Segments of an Enterprise and Related Information. The reporting unit levels for the Company’sgoodwill and its other intangible assets are the OTC, ICE Futures U.S, ICE Futures Europe, ICE FuturesCanada and market data reporting units. Impairment testing at the reporting unit level is performed utilizing atwo-step methodology in accordance with the provisions of SFAS No. 142, Goodwill and Other IntangibleAssets. The initial step requires the Company to determine the fair value of each reporting unit and compare itto the carrying value, including goodwill and other intangible assets, of such reporting unit. If the fair valueexceeds the carrying value, no impairment loss is recognized and the second step, which is a calculation of theimpairment, is not performed. However, if the carrying value of the reporting unit exceeds its fair value, animpairment charge is recorded equal to the extent that the carrying amount of goodwill exceeds its impliedfair value.
The Company’s indefinite-lived intangible assets are evaluated for impairment annually in its fiscal fourthquarter or more often if events or changes in circumstances indicate that the asset may be impaired. Suchevaluation includes comparing the fair value of the asset with its carrying value. If the fair value of theindefinite-lived intangible asset is less than its carrying value, an impairment loss is recognized in an amountequal to the difference. This analysis did not result in an impairment charge during the years endedDecember 31, 2007, 2006 or 2005.
Intellectual Property
All costs related to internally developed patents and trademarks are expensed as incurred. All costsrelated to purchased patents, trademarks and Internet domain names are recorded as other intangible assets andare amortized on a straight-line basis over their estimated useful lives. All costs related to licensed patents arecapitalized and amortized on a straight-line basis over the term of the license.
Impairment of Long-Lived Assets and Finite-Lived Intangible Assets
The Company reviews its property and equipment and finite-lived intangible assets for impairmentwhenever events or changes in circumstances indicate that the carrying amount may not be fully recoverable.To analyze recoverability, the Company projects undiscounted net future cash flows over the remaining life ofsuch assets. If these projected cash flows are less than the carrying amount, an impairment would berecognized, resulting in a write-down of assets with a corresponding charge to earnings. The impairment lossis measured based upon the difference between the carrying amount and the fair value of the assets. Finite-lived intangible assets are generally amortized on a straight-line basis or using an accelerated method over thelesser of their contractual or estimated useful lives.
Income Taxes
The Company and its U.S. subsidiaries file a consolidated U.S. federal income tax return. State incometax returns are filed on a separate, combined or consolidated basis in accordance with relevant state laws andregulations. The majority of the Company’s foreign subsidiaries are based in the U.K. and they file separatelocal country income tax returns and take advantage of the U.K.’s group relief provisions when applicable.Deferred tax expenses and benefits are recognized for changes in deferred tax assets and liabilities. Thedifference between the statutory income tax rate and our effective tax rate for a given period is primarily areflection of the tax effects of our foreign operations, general business and tax credits, tax-exempt income,state income taxes and the non-deductibility of certain expenses.
Revenue Recognition
The Company’s revenues primarily consist of transaction fee revenues for OTC and futures transactionsexecuted over the Platform or through the open-outcry exchange and are recognized on the date thetransactions occur. The Company calculates the transaction fee revenues based on the volume of each
110
IntercontinentalExchange, Inc. and Subsidiaries
Notes to Consolidated Financial Statements — (Continued)

commodity traded multiplied by the transaction rate for each commodity type. The futures transaction feerevenues are determined on the basis of the transaction fee charged for each contract traded on the exchange.Cleared transaction fees are currently remitted by LCH.Clearnet to ICE Futures Europe on a monthly basis.LCH.Clearnet, which is a clearing house based in London, also collects fees for cleared OTC contracts tradedon the Platform.
Transaction fees are recorded net of rebates of $37.3 million, $7.4 million and $543,000 for the yearsended December 31, 2007, 2006 and 2005, respectively. The Company offers rebates in certain of its marketsprimarily to help generate market liquidity and trading volumes by providing customers trading in thosemarkets a full or partial discount to the applicable commission rate. Typically, the Company offers theserebates until it believes the market has generated sufficient liquidity and volume so that the rebates are nolonger needed to sustain and promote liquidity. These rebates reduce revenue that the Company would havegenerated had it charged full transaction fees and had it generated the same volume without the rebateprogram.
Market data fee revenues primarily include terminal and license fees received from data vendors inexchange for the provision of real-time futures price information and data access fees. Market data fees arecharged to data vendors on a monthly basis based on the number and type of terminals they have carryingfutures data. Each data vendor also pays an annual license fee, which is deferred and recognized as revenueratably over the period of the annual license. Market data fee revenues also include monthly data access feescharged to customers that are signed up to trade on the OTC Platform. The monthly data access amount foreach company is based on the number of users at each company signed up to trade on the Platform. Thedifference between the monthly data access fee total for each company and the actual amount of commissionspaid that month for trading activity is recognized as monthly data access revenues. The actual amount ofcommissions paid that month for trading activity is recognized as transaction fee revenues.
Other revenues are recognized as services are provided or they are deferred and amortized ratably overthe periods to which they relate.
Sources of Supplies
The Company uses 13 primary vendors for equipment used in the Platform and its network. If thesevendors were unable to meet the Company’s needs, management believes that the Company could obtain thisequipment from other vendors on comparable terms and that its operating results would not be materiallyadversely affected.
Credit Risk and Significant Customers
The Company’s accounts receivable related to its OTC business segment and its market data businesssegment subjects the Company to credit risk, as the Company does not require its customers to post collateralfor bilateral trades or for market data services. The Company does not risk its own capital in transactions orextend credit to market participants in any commodities markets. The Company limits its risk of loss byallowing trading access to the Platform to companies that qualify as eligible commercial entities, as defined inthe CEA, and by terminating access to the Platform by entities with delinquent accounts.
The launch and growth of cleared OTC products also limits the Company’s risk of loss in its OTCbusiness as the LCH.Clearnet collects cleared transaction fees on the date the transactions occur and transfersthese fees to the Company on a monthly basis. The LCH.Clearnet serves as the central counterparty to alltrades executed by its members. During the year ended December 31, 2007, 81.4% of the OTC businesssegment commission fee revenues were from cleared trades. The futures businesses have minimal credit risk asall of their transaction revenues are cleared through the LCH.Clearnet, ICE Clear U.S. or ICE Clear Canada.
111
IntercontinentalExchange, Inc. and Subsidiaries
Notes to Consolidated Financial Statements — (Continued)

There were no accounts receivable balances greater than 10% of total consolidated accounts receivable asof December 31, 2007 or December 31, 2006. No single customer accounted for more than 10% of totalconsolidated revenues during any of the years ended December 31, 2007, 2006 or 2005.
Stock-Based Compensation
The Company currently sponsors employee stock option and restricted stock plans. On January 1, 2006,the Company adopted SFAS No. 123(R), Share-Based Payment, which is a revision of SFAS No. 123,Accounting for Stock-Based Compensation. SFAS No. 123(R) requires the measurement and recognition ofcompensation expenses for all share-based payment awards made to employees and directors includingemployee stock options and restricted stock based on estimated fair values. SFAS No. 123(R) supersedes theCompany’s previous accounting under Accounting Principles Board (“APB”) Opinion No. 25, Accounting forStock Issued to Employees, for periods beginning in fiscal 2006.
The Company adopted SFAS No. 123(R) using the modified prospective method. Under the modifiedprospective method, compensation costs are recognized beginning on the adoption date based on therequirements of SFAS No. 123(R) for all share-based payments granted after the effective date and based onthe requirements of SFAS No. 123 for all awards granted to employees prior to the effective date ofSFAS No. 123(R) that remain unvested on the effective date. The Company’s consolidated financial statementsfor the years ended December 31, 2007 and 2006 reflect the impact of SFAS No. 123(R). In accordance withthe modified prospective transition method, the Company’s consolidated financial statements for the priorperiods have not been restated to reflect, and do not include, the impact of SFAS No. 123(R).
SFAS No. 123(R) requires companies to estimate the fair value of stock option awards on the date ofgrant using an option-pricing model. The value of the portion of the award that is ultimately expected to vestis recognized as stock-based compensation expenses over the requisite service period in the Company’sconsolidated financial statements. Prior to the adoption of SFAS No. 123(R), the Company accounted forstock-based awards to employees and directors using the intrinsic value method in accordance with APBOpinion No. 25 as allowed under SFAS No. 123. Under the intrinsic value method, no stock-basedcompensation expenses have been recognized in the Company’s consolidated statements of income for stockoptions because the exercise price of the Company’s stock options granted to employees and directors equaledthe fair market value of the underlying stock at the date of grant.
Under SFAS No. 123(R), a Company is required to calculate its historical additional paid-in capital pool(“APIC Pool”). Prior to January 1, 2006, the Company had not deducted in its tax returns any compensationrelated to the share-based awards. Accordingly, the Company has no tax benefits available to credit toward itshistorical APIC Pool calculation. As of January 1, 2006, the APIC Pool of the Company was zero. During theyears ended December 31, 2007 and 2006, excess tax benefits of $61.1 million and $43.3 million, respectively,were recognized as an increase to the additional paid-in capital balance. Of that amount, $60.8 million and$41.0 million for the years ended December 31, 2007 and 2006, respectively, were qualifying excess taxbenefits that increased the APIC Pool eligible to absorb future write-offs, if any, of unrealized deferred taxassets related to stock options. In accordance with SFAS No. 123(R), the $60.8 million and $41.0 million isreported as a financing cash flow in the accompanying consolidated statement of cash flows for the yearsended December 31, 2007 and 2006, respectively.
Regarding the ordering of tax benefits to determine whether an excess tax benefit was realized, as well asto measure that excess tax benefit, the Company follows applicable tax laws and ignores indirect effects of theexcess tax benefit.
No unearned compensation is included in stockholders’ equity under SFAS No. 123(R) for stock optionsand restricted stock awards granted. Rather, such stock options and restricted stock awards and units areincluded in stockholders’ equity under SFAS No. 123(R) when services required from employees and directors
112
IntercontinentalExchange, Inc. and Subsidiaries
Notes to Consolidated Financial Statements — (Continued)

in exchange for the awards are rendered and expensed. Upon the adoption of SFAS No. 123(R) on January 1,2006, the Company reversed the December 31, 2005 deferred stock compensation balance of $6.9 million by acharge to additional paid-in capital.
Employee and director stock-based compensation expenses and the related income tax benefit recognizedfor both stock options and restricted stock in the accompanying consolidated statement of income for the yearended December 31, 2007 was $23.6 million and $7.4 million, respectively, and was $8.8 million and$2.8 million, respectively, for the year ended December 31, 2006. The amount expensed for the years endedDecember 31, 2007 and 2006 is net of $1.8 million and $664,000, respectively, of stock-based compensationthat was capitalized as software development costs. Employee and director stock-based compensation expensesand the related income tax benefit recognized on the restricted stock in the accompanying consolidatedstatement of income was $1.7 million and $631,000 respectively, for the year ended December 31, 2005.
Prior to the adoption of SFAS No 123(R), the Company had adopted the disclosure-only provisions underSFAS No. 123 as amended by SFAS No. 148, Accounting for Stock-Based Compensation — Transaction andDisclosure. Had the Company elected to adopt the fair value recognition provisions of SFAS No. 123 for itsstock options granted prior to the adoption of SFAS No. 123(R), pro forma net loss available to commonshareholders and loss per common share for the year ended December 31, 2005 would be as follows:
Year EndedDecember 31,
2005(In thousands, exceptper share amounts)
Net loss available to common shareholders, as reported . . . . . . . . . . . . . . . . . . . $(20,909)
Add: Stock-based compensation expense included in reported net loss, net oftax . . . . . . . . . . . . . . . . . . . . . . . . . . . . . . . . . . . . . . . . . . . . . . . . . . . . . . . . 1,358
Deduct: Total stock-based compensation expense determined under the fair valuemethod for all awards, net of tax . . . . . . . . . . . . . . . . . . . . . . . . . . . . . . . . . . (7,218)
Net loss available to common shareholders, pro forma . . . . . . . . . . . . . . . . . . . . $(26,769)
Loss per common share:
Basic — as reported . . . . . . . . . . . . . . . . . . . . . . . . . . . . . . . . . . . . . . . . . . . . $ (0.39)
Diluted — as reported . . . . . . . . . . . . . . . . . . . . . . . . . . . . . . . . . . . . . . . . . . $ (0.39)
Basic — pro forma . . . . . . . . . . . . . . . . . . . . . . . . . . . . . . . . . . . . . . . . . . . . $ (0.50)
Diluted — pro forma . . . . . . . . . . . . . . . . . . . . . . . . . . . . . . . . . . . . . . . . . . . $ (0.50)
The Company will continue to use the Black-Scholes option pricing model for purposes of valuing stockoption awards. The Company’s determination of fair value of stock option awards on the date of grant usingthe Black-Scholes option pricing model is affected by the Company’s stock price as well as assumptionsregarding a number of highly complex and subjective variables. These variables include, but are not limited to,the Company’s expected share price volatility over the term of the awards and actual and projected employeestock option exercise behavior. Option-pricing models were developed for use in estimating the value of tradedoptions that have no vesting or hedging restrictions and are fully transferable. Because the Company’semployee stock options have certain characteristics that are significantly different from traded options, andbecause changes in the subjective assumptions can materially affect the estimated value, in management’sopinion, the existing valuation models may not provide an accurate measure of the fair value of the Company’semployee stock options. Although the fair value of employee stock options is determined in accordance withSFAS No. 123(R) using an option pricing model, that value may not be indicative of the fair value observed ina willing buyer/willing seller market transaction, if one was to exist.
113
IntercontinentalExchange, Inc. and Subsidiaries
Notes to Consolidated Financial Statements — (Continued)

Earnings Per Common Share
Basic earnings per common share is calculated using the weighted average common shares outstandingduring the year. Common equivalent shares from stock options and restricted stock awards, using the treasurystock method, are also included in the diluted per share calculations unless their effect of inclusion would beantidilutive (Note 22).
Treasury Stock
The Company records treasury stock activities under the cost method whereby the cost of the acquiredstock is recorded as treasury stock (Note 11).
Fair Value of Financial Instruments
SFAS No. 107, Disclosure about the Fair Value of Financial Instruments, requires the disclosure of thefair value of financial instruments, including assets and liabilities recognized in the consolidated balancesheets. The Company’s financial instruments include cash and cash equivalents, restricted cash, short-terminvestments, customer accounts receivable, margin deposits and guaranty funds, cost method investments,short-term and long-term debt and other short-term assets and liabilities. Based on the short-term nature ofthese financial instruments or their market rates, the estimated fair values of the Company’s financialinstruments approximate their carrying values as of December 31, 2007 and 2006.
We carry our cost method investments at cost, or if a decline in the value of the investment is deemed tobe other than temporary, at fair value. Estimates of fair value are generally based on discounted cash flowanalysis.
Foreign Currency Translation Adjustments and Foreign Currency Transaction Gains and Losses
In accordance with SFAS No. 52, Foreign Currency Translation, the functional currency of the Company’sU.K. subsidiaries had historically been U.K. pounds sterling. The Company translated the assets and liabilitiesof its U.K. subsidiaries into U.S. dollars using period-end exchange rates and the revenues and expenses ofthese entities were translated using the average exchange rates for the reporting period. Translation adjustmentswere recorded in accumulated other comprehensive income, a separate component of shareholders’ equity inthe accompanying consolidated balance sheets and in the consolidated statements of comprehensive income.
Effective July 1, 2006, the functional currency of the majority of the Company’s U.K. subsidiaries,including ICE Futures Europe, became the U.S. dollar. SFAS No. 52 states that the functional currency of anentity is the currency of the primary economic environment in which the entity operates. Normally, it is thecurrency of the environment in which an entity primarily generates and expends cash. Once the functionalcurrency of a foreign entity is determined, that determination should be used consistently unless significantchanges in economic facts and circumstances indicate clearly that the functional currency has changed. Achange in functional currency should be accounted for prospectively, and previously issued financial statementsshould not be restated for a change in functional currency. In addition, if the functional currency changes froma foreign currency to the reporting currency, as is the case with the Company, translation adjustments for priorperiods should not be removed from equity and the translated amounts for non-monetary assets at the end ofthe prior period become the accounting basis for those assets in the period of the change and subsequentperiods. The functional currency changed based on various economic factors and circumstances, including thefact that during the second quarter of 2006, ICE Futures Europe began to charge and collect exchange fees inU.S. dollars rather than pounds sterling in its key futures contracts, including crude oil and heating oilcontracts. The Company no longer recognizes any translation adjustments in the accompanying consolidatedfinancial statements subsequent to June 30, 2006 for those U.K. subsidiaries that have switched their functionalcurrency to the U.S. dollar.
114
IntercontinentalExchange, Inc. and Subsidiaries
Notes to Consolidated Financial Statements — (Continued)

In connection with the Company’s acquisition of ICE Futures Canada in August 2007 (Note 3), theCompany now has foreign currency translation risk equal to its net investment in certain Canadian subsidiaries.The revenues, expenses and financial results of these Canadian subsidiaries are denominated in Canadiandollars, which is the functional currency of these subsidiaries. The financial statements of these subsidiariesare translated into U.S. dollars using current rate of exchange, with gains or losses included in the cumulativetranslation adjustment account, a component of shareholders’ equity.
The Company has foreign currency transaction gains and losses related to the settlement of foreigncurrency denominated assets, liabilities and payables that occur through its foreign operations which arereceived in or paid in pounds sterling due to the increase or decrease in the period-end foreign currencyexchange rates between periods. Gains and losses from foreign currency transactions are included in otherincome (expense) in the accompanying consolidated statements of income and resulted in net gains (losses) of$842,000, ($288,000) and $1.5 million for the years ended December 31, 2007, 2006 and 2005, respectively.
Marketing and Promotional Fees
Advertising costs, including print advertising and production costs, product promotion campaigns andseminar, conference and convention costs related to trade shows and other industry events, are expensed asincurred. The Company incurred advertising costs of $4.1 million, $1.8 million and $1.7 million for the yearsended December 31, 2007, 2006 and 2005, respectively.
New Accounting Pronouncements
In June 2006, the Financial Accounting Standard Board (“FASB”) issued Interpretation No. 48 (“FIN 48”),Accounting for Uncertainty in Income Taxes- an Interpretation of FASB Statement No. 109. FIN 48 clarifiesthe accounting for uncertainty in income taxes recognized in an enterprise’s financial statements in accordancewith SFAS No. 109, Accounting for Income Taxes. This interpretation prescribes a recognition threshold andmeasurement attribute for the financial statement recognition and measurement of a tax position taken orexpected to be taken in a tax return. FIN 48 also provides guidance on de-recognition of tax benefits,classification on the balance sheet, interest and penalties, accounting in interim periods, disclosure andtransition. The Company adopted the provisions of FIN 48 on January 1, 2007. As a result of the adoption, theCompany recognized a charge of $83,000 in its January 1, 2007 retained earnings balance.
In September 2006, the FASB, issued SFAS No. 157, Fair Value Measurements. SFAS No. 157 definesfair value, establishes a framework for measuring fair value and expands fair value measurement disclosures.SFAS No. 157 is effective for the Company beginning in fiscal year 2008. The Company is currentlyevaluating the impact of the pending adoption of SFAS No. 157 on its consolidated financial statements.
In February 2007, the FASB issued SFAS No. 159, The Fair Value Option for Financial Assets and FinancialLiabilities — including an Amendment of FASB Statement No. 115, which permits entities to choose to measurecertain financial assets and financial liabilities at fair value. Unrealized gains and losses on items for which the fairvalue option has been elected are reported in earnings. SFAS No. 159 will be effective for the Company beginningin fiscal year 2008. The Company does not expect that it will elect the fair value option under SFAS No. 159, anddoes not expect SFAS No. 159 to have a material impact on the Company’s consolidated financial statements.
3. Acquisitions
The Company completed its acquisition of ICE Futures U.S. on January 12, 2007 (the “AcquisitionDate”). In the acquisition, each outstanding ICE Futures U.S. membership interest was converted into, at theelection of each ICE Futures U.S. member, either (i) cash equal to $1,074,719, (ii) 17,025 shares of theCompany’s common stock or (iii) a combination of cash consideration and stock consideration, in each casesubject to proration in accordance with the merger agreement (the “merger consideration”). In addition, each
115
IntercontinentalExchange, Inc. and Subsidiaries
Notes to Consolidated Financial Statements — (Continued)

outstanding ICE Futures U.S. membership interest was converted into the right to receive a pro rata share ofany “bonus pool” amounts not paid to ICE Futures U.S. officers and governors and a pro rata share of ICEFutures U.S.’s excess working capital as of the Acquisition Date. The Company determined that ICE FuturesU.S.’s excess working capital as of the Acquisition Date was $2.1 million and this amount was paid in cash tothe ICE Futures U.S. members that received the merger consideration. Under terms of the merger agreement,the maximum amount of cash payable by the Company as merger consideration, excluding the excess workingcapital and including any cash payable in respect of the bonus pool, was $400 million. In accordance with themerger agreement, the Company paid the remainder of the merger consideration, excluding the excess workingcapital and the cash portion of the bonus pool, in shares of the Company’s common stock.
The acquisition provided the Company with the potential for clearing, revenue and expense synergies, aswell as the opportunity to expand the Company’s electronic trading platform into soft commodities and financialproducts offered by ICE Futures U.S. The acquisition has been accounted for as a purchase businesscombination. Assets acquired and liabilities assumed were recorded at their estimated fair values as of January 12,2007. The total purchase price was $1.1 billion, and was comprised of the following (in thousands):
Cash paid to ICE Futures U.S. members . . . . . . . . . . . . . . . . . . . . . . . . . . . . . . . . . . . . $ 400,000Fair value of the Company’s common stock issued . . . . . . . . . . . . . . . . . . . . . . . . . . . . 706,663Excess working capital . . . . . . . . . . . . . . . . . . . . . . . . . . . . . . . . . . . . . . . . . . . . . . . . 2,109Transaction costs . . . . . . . . . . . . . . . . . . . . . . . . . . . . . . . . . . . . . . . . . . . . . . . . . . . . . 14,670
Total purchase price . . . . . . . . . . . . . . . . . . . . . . . . . . . . . . . . . . . . . . . . . . . . . . . . . $1,123,442
In connection with the acquisition, the Company issued 10.3 million shares of its common stock to ICEFutures U.S. members. The fair value of the Company’s common stock was determined for accountingpurposes to be $68.63 per share, which represented the average closing price of the Company’s common stockfor the five business day period commencing two business days prior to the public announcement of theacquisition on September 14, 2006. Acquisition-related transaction costs include investment banking, legal andaccounting fees, valuation, printing and other external costs directly related to the acquisition.
Purchase Price Allocation for ICE Futures U.S. Acquisition
Under purchase accounting, the total purchase price was allocated to ICE Futures U.S.’s net tangible andidentifiable intangible assets based on the estimated fair values of these assets as of January 12, 2007, as setforth below. The excess of the purchase price over the net tangible and identifiable intangible assets wasrecorded as goodwill. The purchase price allocation is as follows (in thousands):
Cash and cash equivalents and short-term investments . . . . . . . . . . . . . . . . . . . . . . . . . $ 39,945Margin deposits and guaranty funds . . . . . . . . . . . . . . . . . . . . . . . . . . . . . . . . . . . . . . . 784,385Other current assets . . . . . . . . . . . . . . . . . . . . . . . . . . . . . . . . . . . . . . . . . . . . . . . . . . . 14,993Property and equipment . . . . . . . . . . . . . . . . . . . . . . . . . . . . . . . . . . . . . . . . . . . . . . . . 16,149Goodwill . . . . . . . . . . . . . . . . . . . . . . . . . . . . . . . . . . . . . . . . . . . . . . . . . . . . . . . . . . . 890,466Identifiable intangible assets . . . . . . . . . . . . . . . . . . . . . . . . . . . . . . . . . . . . . . . . . . . . 327,500Other noncurrent assets . . . . . . . . . . . . . . . . . . . . . . . . . . . . . . . . . . . . . . . . . . . . . . . . 24,587Accounts payable and other accrued liabilities . . . . . . . . . . . . . . . . . . . . . . . . . . . . . . . (37,985)Accrued restructuring costs . . . . . . . . . . . . . . . . . . . . . . . . . . . . . . . . . . . . . . . . . . . . . (14,366)Margin deposits and guaranty funds . . . . . . . . . . . . . . . . . . . . . . . . . . . . . . . . . . . . . . . (784,385)Deferred tax liabilities . . . . . . . . . . . . . . . . . . . . . . . . . . . . . . . . . . . . . . . . . . . . . . . . . (113,930)Other long-term liabilities . . . . . . . . . . . . . . . . . . . . . . . . . . . . . . . . . . . . . . . . . . . . . . (11,741)Unearned government grant . . . . . . . . . . . . . . . . . . . . . . . . . . . . . . . . . . . . . . . . . . . . . (12,176)
Total purchase price allocation . . . . . . . . . . . . . . . . . . . . . . . . . . . . . . . . . . . . . . . . . $1,123,442
116
IntercontinentalExchange, Inc. and Subsidiaries
Notes to Consolidated Financial Statements — (Continued)

The accounts payable and accrued liabilities amount above includes $17.4 million related to investmentbanking services performed for ICE Futures U.S. in connection with the acquisition, which was paidsubsequent to the Acquisition Date. This amount has been included as a component of cash paid foracquisitions, net of cash acquired, in the accompanying consolidated statement of cash flows for the yearended December 31, 2007. The entire goodwill amount above will be included in the OTC business segmentfor purposes of segment reporting under SFAS No. 131, Disclosures about Segments of an Enterprise andRelated Information, because this is consistent with how it is reported internally to the Company’s chiefoperating decision maker. Of the ICE Futures U.S. goodwill balance above, $443.5 million was allocated tothe OTC reporting unit, $266.1 million was allocated to the ICE Futures Europe reporting unit, $19.7 millionwas allocated to the market data reporting unit and the remaining $161.2 million was allocated to the ICEFutures U.S. reporting unit for purposes of impairment testing as required by SFAS No. 142, Goodwill andOther Intangible Assets. The goodwill from the ICE Futures U.S. acquisition was allocated based on theportion of the synergy, costs savings and other expected future cash flows expected to benefit the reportingunits at the time of the acquisition.
Identifiable Intangible Assets for ICE Futures U.S. Acquisition
In performing the purchase price allocation, the Company considered, among other factors, the intendedfuture use of acquired assets, analyses of historical financial performance and estimates of future performanceof ICE Futures U.S.’s business. The estimate of the fair value of intangible assets is based, in part, on avaluation using an income approach, market approach or a cost approach, as appropriate. The rates utilized todiscount net cash flows to their present values were based on the Company’s weighted average cost of equityand ranged from 13.0% to 14.8%. These discount rates were determined after consideration of the Company’srate of return on debt and equity and the weighted average return on invested capital. The following table setsforth the components of intangible assets associated with the acquisition as of December 31, 2007 (inthousands, except years):
Intangible Asset Fair ValueAccumulatedAmortization
Net BookValue Useful Life
Agriculture and soft commodity tradingproducts . . . . . . . . . . . . . . . . . . . . . . . . . . . $195,200 $ — $195,200 Indefinite
Financial trading products. . . . . . . . . . . . . . . . 14,400 389 14,011 20 years
Customer relationships . . . . . . . . . . . . . . . . . . 29,700 1,857 27,843 17-20 years
Technology . . . . . . . . . . . . . . . . . . . . . . . . . . 7,900 2,546 5,354 3 years
Non-compete agreements . . . . . . . . . . . . . . . . 12,000 3,400 8,600 2-5 years
DCM/DCO designation . . . . . . . . . . . . . . . . . 68,300 — 68,300 Indefinite
Total . . . . . . . . . . . . . . . . . . . . . . . . . . . . . . . $327,500 $8,192 $319,308
The agriculture and soft commodity trading products identifiable intangible asset relates to the coretrading product rights and privileges relating to the agriculture and soft commodity trading products. Anindefinite life was used for the agriculture and soft commodity trading products as these products have tradedfor many years at ICE Futures U.S., ICE Futures U.S. is allowed to trade these products without requiring alicense from any third party and authorizations by the CFTC to trade these products are perpetual. Thefinancial trading products have been assigned a 20 year useful life as they do not have a long trading history,are not unique to ICE Futures U.S. and in some cases are dependent on licenses with third parties. Customerrelationships represent the underlying relationships with ICE Futures U.S.’s existing customers. Technologyrepresents both internally and externally developed software related to clearing operations, back office, eCOPS,floor operations and general operations. Non-compete agreements represent the estimated fair value ofagreements with ICE Futures U.S.’s former management team. DCM/DCO designation represents DesignatedContract Market (“DCM”) and Derivatives Clearing Organization (“DCO”) designations available from the
117
IntercontinentalExchange, Inc. and Subsidiaries
Notes to Consolidated Financial Statements — (Continued)

CFTC under the CEA when certain standards are met. The customer relationships intangible asset and thefinancial trading products intangible asset are being amortized using an accelerated method and the otherfinite-lived intangible assets are being amortized using the straight-line method.
Accrued Restructuring Costs for ICE Futures U.S. Acquisition
As a part of the acquisition of ICE Futures U.S., the Company formed a plan to restructure the ICEFutures U.S. duplicative employee functions to align them with the Company’s existing business functions andto streamline ICE Futures U.S.’s operations. Consequently, the Company included an accrual for severancebenefit costs of $14.4 million in the purchase price allocation to account for the planned reduction inworkforce. The original amount of the liability was $11.0 million and it was increased to $14.4 million as ofDecember 31, 2007. The Company has completed its assessment of which employees of ICE FuturesU.S. would be involuntarily terminated and increased the reserve by $3.3 million based on this finalized plan.This amount and the related payments are documented in the following table (in thousands):
Reserve balance, January 12, 2007 . . . . . . . . . . . . . . . . . . . . . . . . . . . . . . . . . . . . . . . . . $ 11,040
Increase in reserve . . . . . . . . . . . . . . . . . . . . . . . . . . . . . . . . . . . . . . . . . . . . . . . . . . . . . 3,326
Cost applied against the reserve. . . . . . . . . . . . . . . . . . . . . . . . . . . . . . . . . . . . . . . . . . . . (11,761)
Reserve balance, December 31, 2007 . . . . . . . . . . . . . . . . . . . . . . . . . . . . . . . . . . . . . . . . $ 2,605
Pro Forma Financial Information for ICE Futures U.S. Acquisition
The financial information in the table below summarizes the combined results of operations of theCompany and ICE Futures U.S., on a pro forma basis, as though the companies had been combined as of thebeginning of the periods presented. The pro forma financial information is presented for informationalpurposes only and is not indicative of the results of operations that would have been achieved if the acquisitionhad taken place at the beginning of the periods presented. Such pro forma financial information is based onthe historical financial statements of the Company and ICE Futures U.S.
This pro forma financial information is based on estimates and assumptions that have been made solelyfor purposes of developing such pro forma information, including, without limitation, purchase accountingadjustments. The pro forma financial information presented below also includes depreciation and amortizationbased on the valuation of ICE Futures U.S.’s tangible assets and identifiable intangible assets resulting fromthe transaction and interest expense related to the debt issued to complete the acquisition. The pro formafinancial information does not reflect any synergies or operating cost reductions that may be achieved from thecombined operations. The pro forma financial information combines the historical results for the Company andICE Futures U.S. for the year ended December 31, 2006 (in thousands, except per share data).
Year EndedDecember 31,
2006
Revenues . . . . . . . . . . . . . . . . . . . . . . . . . . . . . . . . . . . . . . . . . . . . . . . . . . . . . . . . . . $409,568
Net Income . . . . . . . . . . . . . . . . . . . . . . . . . . . . . . . . . . . . . . . . . . . . . . . . . . . . . . . . $139,817Earnings per common share — Basic . . . . . . . . . . . . . . . . . . . . . . . . . . . . . . . . . . . . . . $ 2.09
Earnings per common share — Diluted . . . . . . . . . . . . . . . . . . . . . . . . . . . . . . . . . . . . $ 2.00
Other Acquisitions
On February 28, 2007, the Company acquired all the assets of Commoditrack, Inc. for a combination ofcash and the Company’s common stock. The acquisition enables the Company to provide its customers a real-time risk management program as well as the ability to download trades and access profit and loss detail on
118
IntercontinentalExchange, Inc. and Subsidiaries
Notes to Consolidated Financial Statements — (Continued)

the Platform. The acquisition has been accounted for as a purchase business combination. The financial resultshave been included in the OTC business segment from the date of acquisition.
On July 9, 2007, the Company acquired certain assets of ChemConnect Inc. for cash. ChemConnect is anelectronic marketplace for the trading of OTC natural gas liquids and chemical products, including propane,ethane, ethylene, propylene and benzene. On the closing date of the acquisition, the Company transitioned thetrading of these products to the Company’s Platform. The acquisition has been accounted for as a purchasebusiness combination. The financial results have been included in the OTC business segment from the date ofacquisition.
On August 27, 2007, the Company acquired 100% of ICE Futures Canada and its clearing house, ICEClear Canada, Inc. (formerly known as the Winnipeg Commodity Exchange, Inc. and the WCE ClearingCorporation, respectively), for cash. ICE Futures Canada is the leading agricultural futures exchange in Canadaand it offers futures and options contracts on canola, domestic feed wheat and western barley. In connectionwith the acquisition, the Company transitioned the trading of the ICE Futures Canada products to theCompany’s Platform in December 2007. The acquisition has been accounted for as a purchase businesscombination. The financial results have been included in the futures business segment from the date ofacquisition.
On October 1, 2007, the Company acquired certain assets of Chatham Energy Partners, LLC (“Chatham”)for cash. Chatham is a leading OTC brokerage firm that specializes in structuring and facilitating transactionsin the natural gas markets for energy options. Chatham supports the execution of the Company’s strategicplans to develop the leading electronic marketplace for the execution of OTC energy options. The acquisitionhas been accounted for as a purchase business combination. The financial results of Chatham have beenincluded in the OTC business segment from the date of acquisition.
The aggregate cost of these other acquisitions was $90.5 million, which was paid in cash. Under purchaseaccounting, the total purchase price was allocated to net tangible and identifiable intangible assets based onpreliminary estimated fair values of these assets. The purchase price allocations for these other acquisitions arepreliminary and are subject to change during the allocation period. The primary area of purchase priceallocation that is not yet finalized relates to identified intangible assets.
The Company will make additional payments in cash or stock contingent upon the achievement of certainrevenue targets by certain of the acquisition companies or contingent upon the acquisition companies meetingcertain other criteria. The maximum annual contingent payments to be made are $14.0 million, $16.2 millionand $19.2 million in 2008, 2009 and 2010, respectively.
4. Restricted Cash
As a Recognized Investment Exchange, the FSA requires ICE Futures Europe to restrict the use of theequivalent of six months of operating expenditures in cash or cash equivalents at all times. As of December 31,2007 and 2006, this amount was equal to $13.1 million and $12.4 million, respectively, and is reflected asrestricted cash in the accompanying consolidated balance sheets.
The Company owns 100% of ICE Markets Limited. ICE Markets Limited, which is based in London,supports trading of European energy commodities, performs helpdesk functions and is authorized by the FSAto act as an arranger of deals in investments. The FSA requires ICE Markets Limited to maintain a minimumlevel of financial resources, which is calculated annually on the basis of 25% of the relevant annualexpenditures, adjusted for any illiquid assets. As of December 31, 2007 and 2006, the resource requirementwas equal to $2.7 million and $2.5 million, respectively, and is reflected as restricted cash in the accompany-ing consolidated balance sheets.
119
IntercontinentalExchange, Inc. and Subsidiaries
Notes to Consolidated Financial Statements — (Continued)
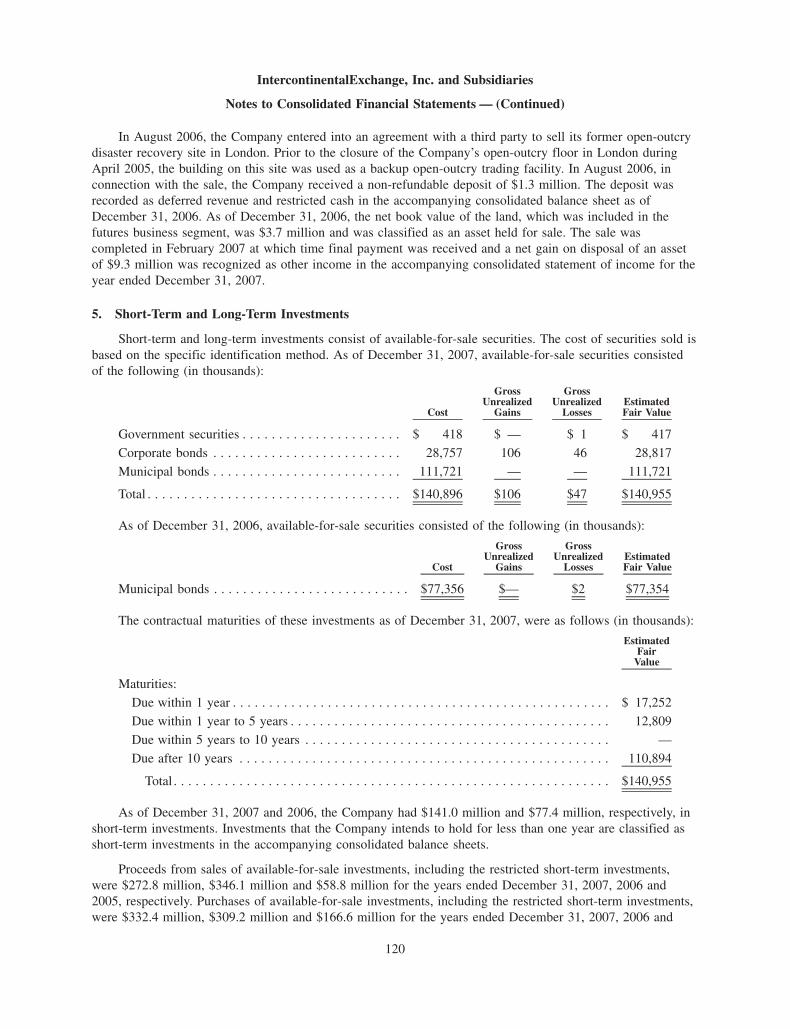
In August 2006, the Company entered into an agreement with a third party to sell its former open-outcrydisaster recovery site in London. Prior to the closure of the Company’s open-outcry floor in London duringApril 2005, the building on this site was used as a backup open-outcry trading facility. In August 2006, inconnection with the sale, the Company received a non-refundable deposit of $1.3 million. The deposit wasrecorded as deferred revenue and restricted cash in the accompanying consolidated balance sheet as ofDecember 31, 2006. As of December 31, 2006, the net book value of the land, which was included in thefutures business segment, was $3.7 million and was classified as an asset held for sale. The sale wascompleted in February 2007 at which time final payment was received and a net gain on disposal of an assetof $9.3 million was recognized as other income in the accompanying consolidated statement of income for theyear ended December 31, 2007.
5. Short-Term and Long-Term Investments
Short-term and long-term investments consist of available-for-sale securities. The cost of securities sold isbased on the specific identification method. As of December 31, 2007, available-for-sale securities consistedof the following (in thousands):
Cost
GrossUnrealized
Gains
GrossUnrealized
LossesEstimatedFair Value
Government securities . . . . . . . . . . . . . . . . . . . . . . $ 418 $ — $ 1 $ 417
Corporate bonds . . . . . . . . . . . . . . . . . . . . . . . . . . 28,757 106 46 28,817
Municipal bonds . . . . . . . . . . . . . . . . . . . . . . . . . . 111,721 — — 111,721
Total . . . . . . . . . . . . . . . . . . . . . . . . . . . . . . . . . . . $140,896 $106 $47 $140,955
As of December 31, 2006, available-for-sale securities consisted of the following (in thousands):
Cost
GrossUnrealized
Gains
GrossUnrealized
LossesEstimatedFair Value
Municipal bonds . . . . . . . . . . . . . . . . . . . . . . . . . . . $77,356 $— $2 $77,354
The contractual maturities of these investments as of December 31, 2007, were as follows (in thousands):
EstimatedFair
Value
Maturities:
Due within 1 year . . . . . . . . . . . . . . . . . . . . . . . . . . . . . . . . . . . . . . . . . . . . . . . . . . . . $ 17,252
Due within 1 year to 5 years . . . . . . . . . . . . . . . . . . . . . . . . . . . . . . . . . . . . . . . . . . . . 12,809
Due within 5 years to 10 years . . . . . . . . . . . . . . . . . . . . . . . . . . . . . . . . . . . . . . . . . . —
Due after 10 years . . . . . . . . . . . . . . . . . . . . . . . . . . . . . . . . . . . . . . . . . . . . . . . . . . . 110,894
Total . . . . . . . . . . . . . . . . . . . . . . . . . . . . . . . . . . . . . . . . . . . . . . . . . . . . . . . . . . . . $140,955
As of December 31, 2007 and 2006, the Company had $141.0 million and $77.4 million, respectively, inshort-term investments. Investments that the Company intends to hold for less than one year are classified asshort-term investments in the accompanying consolidated balance sheets.
Proceeds from sales of available-for-sale investments, including the restricted short-term investments,were $272.8 million, $346.1 million and $58.8 million for the years ended December 31, 2007, 2006 and2005, respectively. Purchases of available-for-sale investments, including the restricted short-term investments,were $332.4 million, $309.2 million and $166.6 million for the years ended December 31, 2007, 2006 and
120
IntercontinentalExchange, Inc. and Subsidiaries
Notes to Consolidated Financial Statements — (Continued)

2005, respectively. Net realized gains on the available-for-sale investments, including the restricted short-terminvestments, were $171,000, $882,000 and $770,000 for the years ended December 31, 2007, 2006 and 2005,respectively, and have been classified as interest and investment income in the accompanying consolidatedstatements of income.
6. Cost Method Investments
In December 2006, the Company acquired an 8% equity stake in the National Commodity and DerivativesExchange, Ltd (“NCDEX”), a derivatives exchange located in Mumbai, India, for $36.3 million. The Companymay be required to sell 3% of its 8% NCDEX stake as a result of recent Indian regulatory limitations onforeign investments in Indian Exchanges. The Company currently believes there will be sufficient demand forits shares such that it will at least recover its carrying value if it is required to sell the 3% stake. In addition,the Company has a 1.1% equity share investment in LCH.Clearnet, a third party clearing house that currentlyclears the Company’s OTC and energy futures contracts. The Company uses the cost method to account forthese investments as the Company does not control and does not have the ability to exercise significantinfluence over the investment companies operating and financial policies.
7. Property and Equipment
Property and equipment consisted of the following as of December 31, 2007 and 2006:
2007 2006Depreciation
PeriodDecember 31,
(In thousands) (In years)
Computer and network equipment . . . . . . . . . . . . . . . . . . . . . . $ 46,393 $ 25,786 3
Software and internally developed software . . . . . . . . . . . . . . . 70,336 52,629 3
Office furniture and equipment . . . . . . . . . . . . . . . . . . . . . . . . 11,707 4,168 5
Leasehold improvements . . . . . . . . . . . . . . . . . . . . . . . . . . . . 14,492 2,906 7
142,928 85,489
Less accumulated depreciation and amortization . . . . . . . . . . . (79,404) (59,209)
Property and equipment, net . . . . . . . . . . . . . . . . . . . . . . . . . . $ 63,524 $ 26,280
For the years ended December 31, 2007, 2006 and 2005, amortization of software and internallydeveloped software was $8.1 million, $6.1 million and $7.1 million, respectively, and depreciation of all otherproperty and equipment was $15.1 million, $4.7 million and $4.7 million, respectively. The unamortizedsoftware and internally developed software balances were $21.5 million and $12.4 million as of December 31,2007 and 2006, respectively.
8. Goodwill and Other Intangible Assets
Goodwill consisted of the following as of December 31, 2007 and 2006 (in thousands):
Goodwill balance at January 1, 2006 . . . . . . . . . . . . . . . . . . . . . . . . . . . . . . . . . . . . . . $ 73,967
Other activity . . . . . . . . . . . . . . . . . . . . . . . . . . . . . . . . . . . . . . . . . . . . . . . . . . . . . . 5,608
Goodwill balance at December 31, 2006 . . . . . . . . . . . . . . . . . . . . . . . . . . . . . . . . . . . 79,575
Acquisition of ICE Futures U.S. . . . . . . . . . . . . . . . . . . . . . . . . . . . . . . . . . . . . . . . 890,466
Other acquisitions . . . . . . . . . . . . . . . . . . . . . . . . . . . . . . . . . . . . . . . . . . . . . . . . . . 37,801
Other activity . . . . . . . . . . . . . . . . . . . . . . . . . . . . . . . . . . . . . . . . . . . . . . . . . . . . . . 1,845
Goodwill balance at December 31, 2007 . . . . . . . . . . . . . . . . . . . . . . . . . . . . . . . . . . . $1,009,687
121
IntercontinentalExchange, Inc. and Subsidiaries
Notes to Consolidated Financial Statements — (Continued)

The Company completed the ICE Futures U.S. acquisition during the year ended December 31, 2007,which resulted in goodwill of $890.5 million (Note 3). The Company also completed the acquisitions ofCommoditrack, ChemConnect, ICE Futures Canada and Chatham during the year ended December 31, 2007(Note 3), which resulted in additional goodwill of $37.8 million. The total amount of goodwill expected to bedeductible for tax purposes is $10.1 million. The other activity in the goodwill balance relates to foreigncurrency translation adjustments. The Company did not recognize any amortization expense or impairmentlosses on goodwill during the years ended December 31, 2007, 2006 and 2005.
Other intangible assets and the related accumulated amortization consisted of the following as ofDecember 31, 2007 and 2006:
2007 2006 Useful LifeDecember 31,
(In thousands) (In years)
Customer relationships . . . . . . . . . . . . . . . . . . . . . . . . . . . . . . . . $ 62,709 $ 5,769 4 to 20
Russell licensing rights . . . . . . . . . . . . . . . . . . . . . . . . . . . . . . . . 149,796 — 7
Trading products with finite lives . . . . . . . . . . . . . . . . . . . . . . . . 14,400 — 20
Non-compete agreements . . . . . . . . . . . . . . . . . . . . . . . . . . . . . . 15,502 — 2 to 5
Technology . . . . . . . . . . . . . . . . . . . . . . . . . . . . . . . . . . . . . . . . 9,383 — 3
Other . . . . . . . . . . . . . . . . . . . . . . . . . . . . . . . . . . . . . . . . . . . . . 665 665 5
252,455 6,434
Less accumulated amortization . . . . . . . . . . . . . . . . . . . . . . . . . . (15,754) (6,267)
Total finite-lived intangible assets, net . . . . . . . . . . . . . . . . . . . 236,701 167
Trading products with indefinite-lives . . . . . . . . . . . . . . . . . . . . . 216,858 —
DCM/DCO designation for ICE Futures U.S. . . . . . . . . . . . . . . . 68,300 —
Other . . . . . . . . . . . . . . . . . . . . . . . . . . . . . . . . . . . . . . . . . . . . . 15,863 1,384
Total other indefinite-lived intangible assets . . . . . . . . . . . . . . . 301,021 1,384
Total other intangible assets, net . . . . . . . . . . . . . . . . . . . . . $537,722 $ 1,551
See note 3 for a discussion of the $327.5 million in other intangible assets relating to the ICE FuturesU.S. acquisition and Note 16 for a discussion of the $149.8 million in Russell licensing rights. The remaining$68.4 million in other intangibles assets increase during the year ended December 31, 2007 relate to the otheracquisitions completed in 2007.
For the years ended December 31, 2007, 2006 and 2005, amortization of other intangible assets was$9.5 million, $648,000 and $1.3 million, respectively. Collectively, the remaining weighted average useful livesof the finite-lived intangible assets is 9.6 years. The Company expects future amortization expense from otherintangible assets as of December 31, 2007 to be as follows (in thousands):
2008 . . . . . . . . . . . . . . . . . . . . . . . . . . . . . . . . . . . . . . . . . . . . . . . . . . . . . . . . . . . . . . . $ 25,734
2009 . . . . . . . . . . . . . . . . . . . . . . . . . . . . . . . . . . . . . . . . . . . . . . . . . . . . . . . . . . . . . . . 36,123
2010 . . . . . . . . . . . . . . . . . . . . . . . . . . . . . . . . . . . . . . . . . . . . . . . . . . . . . . . . . . . . . . . 32,294
2011 . . . . . . . . . . . . . . . . . . . . . . . . . . . . . . . . . . . . . . . . . . . . . . . . . . . . . . . . . . . . . . . 31,858
2012 . . . . . . . . . . . . . . . . . . . . . . . . . . . . . . . . . . . . . . . . . . . . . . . . . . . . . . . . . . . . . . . 30,461
Thereafter . . . . . . . . . . . . . . . . . . . . . . . . . . . . . . . . . . . . . . . . . . . . . . . . . . . . . . . . . . . 80,231
$236,701
122
IntercontinentalExchange, Inc. and Subsidiaries
Notes to Consolidated Financial Statements — (Continued)

9. Credit Facility
The Company financed the cash portion of the ICE Futures U.S. acquisition with cash on hand andborrowings under a senior unsecured credit facility (the “Credit Agreement”) dated January 12, 2007, asamended on August 24, 2007, that the Company entered into with Wachovia Bank, National Association(“Wachovia”), as Administrative Agent, Bank of America, N.A., as Syndication Agent, and the lenders namedtherein. In connection with the Credit Agreement, the Company terminated its previous $50.0 million creditfacility with Wachovia, under which no borrowings were outstanding. The Credit Agreement provides for aterm loan facility in the aggregate principal amount of $250.0 million and a revolving credit facility in theaggregate principal amount of $250.0 million (collectively, the “Credit Facilities”). In connection with theacquisition, the Company used the proceeds of the $250.0 million term loan along with $166.8 million of cashon hand to finance the $416.8 million cash component of the ICE Futures U.S. acquisition. Under the terms ofthe Credit Agreement, the Company may borrow an aggregate principal amount of up to $250.0 million underthe revolving credit facility at any time from the closing date of the Credit Agreement through the thirdanniversary of the closing date of the merger with ICE Futures U.S., which is January 12, 2010. The Companyhas agreed to reserve $50.0 million of the $250.0 million available under the revolving credit facility for useby ICE Clear U.S., ICE Futures U.S.’s clearing organization, to provide liquidity in the event of default by aclearing participant. The remaining amount under the revolving credit facility can be used by the Company forgeneral corporate purposes.
Loans under the Credit Facilities shall, at the option of the Company, bear interest on the principalamount outstanding at either (i) LIBOR plus an applicable margin rate or (ii) a “base rate” plus an applicablemargin rate. The “base rate” will be equal to the higher of (i) Wachovia’s prime rate or (ii) the federal fundsrate plus 0.5%. The applicable margin rate ranges from 0.50% to 1.125% on the LIBOR loans and from0.00% to 0.125% for the base rate loans based on the Company’s total leverage ratio calculated on a trailingtwelve month period. Interest on each loan is payable quarterly. As December 31, 2007, the Company has a$221.9 million three-month LIBOR loan outstanding with a stated interest rate of 5.46%, including theapplicable margin rate at December 31, 2007 of 0.625% on the LIBOR loan. For the borrowings under theterm loan facility, the Company began making payments on June 30, 2007, and will make payments quarterlythereafter until the fifth anniversary of the closing date of the merger with ICE Futures U.S., which will beJanuary 12, 2012. Aggregate principal maturities on this note over each of the next five years are $37.5 million,$46.9 million, $50.0 million, $68.8 million and $18.7 million in 2008, 2009, 2010, 2011 and 2012,respectively. The Credit Agreement includes an unutilized revolving credit commitment fee that is equal to theunused maximum revolver amount multiplied by an applicable margin rate and is payable in arrears on aquarterly basis. The applicable margin rate ranges from 0.10% to 0.20% based on the Company’s totalleverage ratio calculated on a trailing twelve month period. Based on this calculation, the applicable marginrate was 0.125% at December 31, 2007.
The Credit Agreement requires the Company to use 100% of the net cash proceeds raised from debtissuances or asset dispositions, with certain limited exceptions, to prepay outstanding loans under the CreditFacilities. With limited exceptions, the Company may prepay the outstanding loans under the Credit Facilities,in whole or in part, without premium or penalty upon written notice to the Administrative Agent. The CreditAgreement contains affirmative and negative covenants, including, but not limited to, leverage and interestcoverage ratios, as well as limitations or required approvals for acquisitions, dispositions of assets and certaininvestments, the incurrence of additional debt or the creation of liens and other fundamental changes to theCompany’s business. The Company has been and is currently in compliance with all applicable covenantsunder the Credit Agreement.
ICE Clear Canada has arranged a total of $3.0 million in a revolving standby credit facility with theRoyal Bank of Canada to provide liquidity in the event of default by a clearing member. Borrowings under therevolving standby credit facility, which are required to be collateralized, bear interest based on the prime rate
123
IntercontinentalExchange, Inc. and Subsidiaries
Notes to Consolidated Financial Statements — (Continued)

plus 0.75%. There are no borrowings outstanding under this facility, and ICE Clear Canada is currently incompliance with all applicable covenants.
On November 17, 2004, the Company entered into a $25.0 million revolving credit agreement (the“Facility”) with Wachovia. The Facility was amended on October 18, 2005 to increase the amount up to$50.0 million. Under the terms of the Facility, the Company could borrow an aggregate principal amount of upto the maximum available under the Facility at any time from the closing date of the Facility through thetermination date of the Facility. The Facility was scheduled to terminate on November 17, 2007. The Companyborrowed $25.0 million under the Facility on November 23, 2004. These funds were used for a portion of the$67.5 million redemption of the Company’s Class B redeemable common stock that occurred in November 2004(Note 11). The Company repaid $12.0 million in January 2005 with excess cash and the remaining $13.0 millionin November 2005, using a portion of the proceeds from the Company’s November 2005 initial public offeringof common stock. In connection with the closing of the acquisition of ICE Futures U.S., on January 12, 2007,the Company terminated the $50.0 million Facility, under which no borrowings were outstanding.
10. Redeemable Stock Put
Continental Power Exchange, Inc. is the Company’s predecessor company and was owned by the chiefexecutive officer of the Company. The Company had a put agreement (the “Redeemable Stock Put”) withContinental Power Exchange, Inc. under which, in certain circumstances, Continental Power Exchange, Inc.had the right to require the Company to purchase a portion of the Company’s common stock held byContinental Power Exchange, Inc. for an amount equal to the greater of fair market value at the date the putwas exercised, or $5.0 million. Continental Power Exchange, Inc. had the right to exercise the put option uponthe termination, retirement, death or disability of the chief executive officer, exercisable at any time within sixmonths of such an event.
The Company initially recorded the Redeemable Stock Put at the minimum $5.0 million redemptionthreshold and had adjusted the Redeemable Stock Put to its redemption amount at each subsequent balancesheet date. The adjustment to the redemption amount had been recorded directly to retained earnings or, in theabsence of positive retained earnings, by charges against additional paid-in capital.
In October 2005, the Company entered into an agreement with Continental Power Exchange, Inc. (“thePut Termination Agreement”) to cancel the Redeemable Stock Put contingent upon the closing of theCompany’s initial public offering of common stock. The Company increased the Redeemable Stock Put by$61.3 million during the year ended December 31, 2005 resulting from an increase in the estimated fair valueof the Company’s common stock from $8.00 per share as of December 31, 2004 to $35.90 per share as ofNovember 21, 2005, the closing date of the Company’s initial public offering of common stock and thetermination date of the Redeemable Stock Put. The balance of the Redeemable Stock Put on November 21,2005 was $78.9 million and was reclassifed to additional paid-in capital upon its termination.
As part of the Put Termination Agreement, the Company amended Continental Power Exchange, Inc.’sregistration rights with respect to its shares of the Company’s common stock. In addition to extendingcustomary demand and piggy-back registration rights for a twelve-month period from a six-month periodfollowing the termination of the senior officer’s employment with the Company, the Company has agreed topay all underwriting discounts, broker’s fees and selling commissions incurred by Continental PowerExchange, Inc. in connection with selling its shares pursuant to the registration rights granted under theagreement. In no event will the aggregate amount payable by the Company for these underwriting fees exceed$4.5 million. The Company has not accrued for these fees because the payment of any amount is not currentlyprobable.
124
IntercontinentalExchange, Inc. and Subsidiaries
Notes to Consolidated Financial Statements — (Continued)
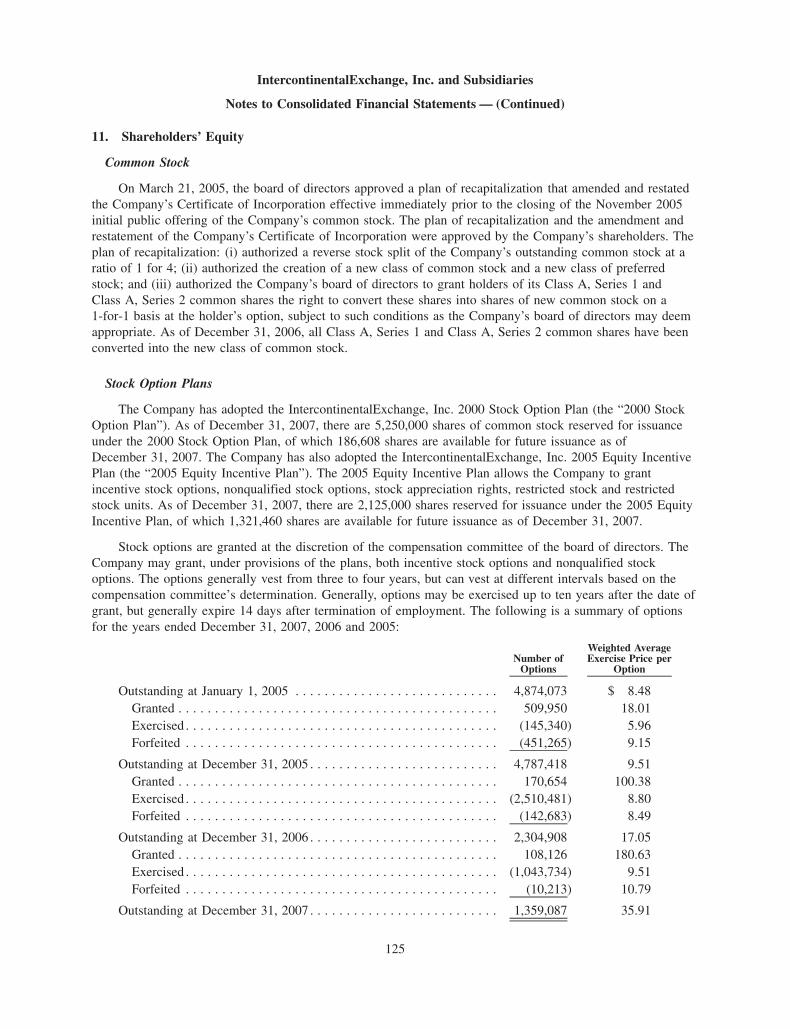
11. Shareholders’ Equity
Common Stock
On March 21, 2005, the board of directors approved a plan of recapitalization that amended and restatedthe Company’s Certificate of Incorporation effective immediately prior to the closing of the November 2005initial public offering of the Company’s common stock. The plan of recapitalization and the amendment andrestatement of the Company’s Certificate of Incorporation were approved by the Company’s shareholders. Theplan of recapitalization: (i) authorized a reverse stock split of the Company’s outstanding common stock at aratio of 1 for 4; (ii) authorized the creation of a new class of common stock and a new class of preferredstock; and (iii) authorized the Company’s board of directors to grant holders of its Class A, Series 1 andClass A, Series 2 common shares the right to convert these shares into shares of new common stock on a1-for-1 basis at the holder’s option, subject to such conditions as the Company’s board of directors may deemappropriate. As of December 31, 2006, all Class A, Series 1 and Class A, Series 2 common shares have beenconverted into the new class of common stock.
Stock Option Plans
The Company has adopted the IntercontinentalExchange, Inc. 2000 Stock Option Plan (the “2000 StockOption Plan”). As of December 31, 2007, there are 5,250,000 shares of common stock reserved for issuanceunder the 2000 Stock Option Plan, of which 186,608 shares are available for future issuance as ofDecember 31, 2007. The Company has also adopted the IntercontinentalExchange, Inc. 2005 Equity IncentivePlan (the “2005 Equity Incentive Plan”). The 2005 Equity Incentive Plan allows the Company to grantincentive stock options, nonqualified stock options, stock appreciation rights, restricted stock and restrictedstock units. As of December 31, 2007, there are 2,125,000 shares reserved for issuance under the 2005 EquityIncentive Plan, of which 1,321,460 shares are available for future issuance as of December 31, 2007.
Stock options are granted at the discretion of the compensation committee of the board of directors. TheCompany may grant, under provisions of the plans, both incentive stock options and nonqualified stockoptions. The options generally vest from three to four years, but can vest at different intervals based on thecompensation committee’s determination. Generally, options may be exercised up to ten years after the date ofgrant, but generally expire 14 days after termination of employment. The following is a summary of optionsfor the years ended December 31, 2007, 2006 and 2005:
Number ofOptions
Weighted AverageExercise Price per
Option
Outstanding at January 1, 2005 . . . . . . . . . . . . . . . . . . . . . . . . . . . . 4,874,073 $ 8.48Granted . . . . . . . . . . . . . . . . . . . . . . . . . . . . . . . . . . . . . . . . . . . . 509,950 18.01Exercised . . . . . . . . . . . . . . . . . . . . . . . . . . . . . . . . . . . . . . . . . . . (145,340) 5.96Forfeited . . . . . . . . . . . . . . . . . . . . . . . . . . . . . . . . . . . . . . . . . . . (451,265) 9.15
Outstanding at December 31, 2005 . . . . . . . . . . . . . . . . . . . . . . . . . . 4,787,418 9.51Granted . . . . . . . . . . . . . . . . . . . . . . . . . . . . . . . . . . . . . . . . . . . . 170,654 100.38Exercised . . . . . . . . . . . . . . . . . . . . . . . . . . . . . . . . . . . . . . . . . . . (2,510,481) 8.80Forfeited . . . . . . . . . . . . . . . . . . . . . . . . . . . . . . . . . . . . . . . . . . . (142,683) 8.49
Outstanding at December 31, 2006 . . . . . . . . . . . . . . . . . . . . . . . . . . 2,304,908 17.05Granted . . . . . . . . . . . . . . . . . . . . . . . . . . . . . . . . . . . . . . . . . . . . 108,126 180.63Exercised . . . . . . . . . . . . . . . . . . . . . . . . . . . . . . . . . . . . . . . . . . . (1,043,734) 9.51Forfeited . . . . . . . . . . . . . . . . . . . . . . . . . . . . . . . . . . . . . . . . . . . (10,213) 10.79
Outstanding at December 31, 2007 . . . . . . . . . . . . . . . . . . . . . . . . . . 1,359,087 35.91
125
IntercontinentalExchange, Inc. and Subsidiaries
Notes to Consolidated Financial Statements — (Continued)

Details of stock options outstanding as of December 31, 2007 are as follows:
Number of OptionsWeighted Average
Exercise Price
Weighted AverageRemaining
Contractual Life
AggregateIntrinsic
Value(Years) (In thousands)
Vested or expected to vest . . 1,311,920 $32.57 7.07 $209,821
Exercisable . . . . . . . . . . . . . 936,690 $15.59 6.58 $165,707
The total intrinsic value of stock options exercised during the years ended December 31, 2007, 2006 and2005 were $143.6 million, $157.7 million and $1.1 million, respectively. As of December 31, 2007, there were$15.3 million in total unrecognized compensation costs related to stock options. These costs are expected to berecognized over a weighted average period of 2.4 years as the stock options vest. During the years endedDecember 31, 2007 and 2006, the total fair value of options vested was $119.4 million and $60.3 million.
Details of options outstanding as of December 31, 2007 are as follows:
Exercise PriceOptions
Outstanding
Weighted AverageRemaining
Contractual LifeOptions
Exercisable(Years)
$ 4.20 - 7.04. . . . . . . . . . . . . . . . . . . . . . . . . . . . . . 22,953 3.1 22,9538.00 - 12.00. . . . . . . . . . . . . . . . . . . . . . . . . . . . . . 916,214 6.5 785,841
26.00 - 35.08. . . . . . . . . . . . . . . . . . . . . . . . . . . . . . 144,140 8.0 73,07881.25 - 104.23. . . . . . . . . . . . . . . . . . . . . . . . . . . . . . 167,654 9.0 54,818
115.72 - 138.80. . . . . . . . . . . . . . . . . . . . . . . . . . . . . . 11,049 9.3 —156.78 - 160.58. . . . . . . . . . . . . . . . . . . . . . . . . . . . . . 7,992 9.2 —170.25 - 189.43. . . . . . . . . . . . . . . . . . . . . . . . . . . . . . 89,085 10.0 —
Total . . . . . . . . . . . . . . . . . . . . . . . . . . . . . . . . . . . . 1,359,087 936,690
Of the options outstanding at December 31, 2007, 936,690 were exercisable at a weighted-averageexercise price of $15.59. Of the options outstanding at December 31, 2006, 1,346,834 were exercisable at aweighted-average exercise price of $9.17. Of the options outstanding at December 31, 2005, 2,425,705 wereexercisable at a weighted-average exercise price of $8.77.
All stock options are granted at an exercise price equal to the fair value of the common stock on the dateof grant. The grant date fair value is based on the closing stock price on the date of grant. Prior to theCompany’s initial public offering of common stock in November 2005, this determination was made by theCompany’s compensation committee, primarily based on annual valuations performed by an independent thirdparty. The fair value of the stock options on the date of the grant is recognized as expense ratably over thevesting period, net of estimated forfeitures.
The Company uses the Black-Scholes option pricing model for purposes of valuing stock option awards,both under SFAS 123(R) for the years ended December 31, 2007 and 2006 and for pro forma purposes underSFAS No. 123 for the year ended December 31, 2005. Pro forma information regarding net income andearnings per share, as presented in Note 2 for the year ended December 31, 2005 is required by SFAS No. 123,as amended by SFAS No. 148, and has been determined as if the Company has accounted for its employeestock options under the fair value method of SFAS No. 123 as of its effective date. The Company has used the
126
IntercontinentalExchange, Inc. and Subsidiaries
Notes to Consolidated Financial Statements — (Continued)

Black-Scholes option pricing model weighted-average assumptions in the table below to compute the value ofall options for shares of common stock granted to employees:
Assumptions 2007 2006 2005Year Ended December 31,
Risk-free interest rate . . . . . . . . . . . . . . . . . . . . . . . . . . . . . . . . . . . . . . 3.8% 4.6% 4.0%
Expected life in years . . . . . . . . . . . . . . . . . . . . . . . . . . . . . . . . . . . . . . 6 6 5
Expected volatility . . . . . . . . . . . . . . . . . . . . . . . . . . . . . . . . . . . . . . . . 49% 49% 43%
Expected dividend yield . . . . . . . . . . . . . . . . . . . . . . . . . . . . . . . . . . . . 0% 0% 0%
Estimated weighted-average fair value of options granted per share . . . . $92.58 $53.06 $7.36
The risk-free interest rate is based on the U.S. Treasury yield curve in effect at the time of grant. Theexpected life computation is derived from historical exercise patterns and anticipated future patterns. Expectedvolatilities are based on historical volatility of the Company’s stock as well as stock of certain of theCompany’s peers within its industry group.
Restricted Stock Plans
The Company granted a maximum of 398,013, 407,661 and 63,750 time- and performance-basedrestricted stock units under the 2005 Equity Incentive Plan during the years ended December 31, 2007, 2006and 2005, respectively, including 85,460, 141,111 and 63,750 time-based restricted stock units in 2007, 2006and 2005, respectively. The grant date fair value of each award is based on the closing stock price at the dateof grant. The fair value of the time-based restricted stock units on the date of the grant is recognized asexpense ratably over the vesting period, net of forfeitures. Granted but unvested shares would be forfeitedupon termination of employment. When restricted stock is forfeited, compensation costs previously recognizedfor unvested shares are reversed. Until the shares vest and are issued, the participants have no voting ordividend rights and the shares may not be sold, assigned, transferred, pledged or otherwise encumbered.
As of December 31, 2007, there are 1,475,000 shares of common stock reserved for issuance underIntercontinentalExchange, Inc. 2004 Restricted Stock Plan (the “Restricted Plan”). Under the Restricted Plan,the compensation committee reserved a number of the Company’s common stock treasury shares sufficient tocover the current obligations under the Restricted Plan for issuance to the employees and board of directors ofthe Company. As of December 31, 2007, 1,446,674 restricted shares under the Restricted Plan were subject tooutstanding awards of restricted stock units made to senior officers of the Company and members of the boardof directors. Of these shares, 800,212 were granted in 2004 as time-based restricted shares and vest based on afour-year vesting schedule. As of December 31, 2007, 531,178 of the time-based restricted treasury sharesunder the Restricted Plan have been issued.
During the year ended December 31, 2005, deferred stock compensation of $2.5 million was recorded on therestricted stock grants issued during the year based on the fair value of the shares on the date of grant and was beingamortized over four years. The unamortized balance of deferred stock compensation on the restricted stock wasincluded as a separate component of shareholders’ equity. The unamortized deferred stock compensation balance wasreversed by a charge to additional paid-in capital upon adoption of SFAS No. 123(R) on January 1, 2006.
Under SFAS No. 123(R), the Company recognizes compensation costs, net of forfeitures, over the vestingperiod for awards with performance conditions only if it is probable that the condition will be satisfied. If theCompany initially determines that it is not probable that the performance condition will be satisfied and laterdetermines that it is probable that the performance condition will be satisfied, or vice versa, the effect of thechange in estimate will be accounted for in the period of change by recording a cumulative catch-upadjustment to retroactively apply the new estimate. The Company would recognize the remaining compensa-tion costs over the remaining vesting period. The Company’s compensation committee, pursuant to the terms
127
IntercontinentalExchange, Inc. and Subsidiaries
Notes to Consolidated Financial Statements — (Continued)

of the 2005 Equity Incentive Plan and the authority delegated to it by the Company’s board of directors, canmake equitable adjustments to the performance condition in recognition of unusual or non-recurring events.
Under the 2005 Equity Incentive Plan, 61,983 to 309,913 restricted shares have been reserved for potentialissuance as performance-based restricted shares for certain Company employees. These restricted shares are alsosubject to a market condition that may reduce the number of shares that are issued if the 2008 Company totalshareholder return falls below that of the S&P 500 Index. The reduction in the number of shares that could beissued if total shareholder return is below the return of the S&P 500 Index will be either a 10% or 20%reduction. These shares were granted in December 2007 and vest over a three-year period based on theCompany’s financial performance targets set by the Company’s compensation committee for the year endingDecember 31, 2008. The potential compensation expenses to be recognized under these performance-basedrestricted shares would be $10.0 million if the Threshold Performance Target is met and 61,983 shares vest,$20.0 million if the Target Performance Target is met and 123,965 shares vest, $34.9 million if the Above TargetPerformance Target is met and 216,939 shares vest, and $49.9 million if the Maximum Performance Target ismet and 309,913 shares vest. Shares to be issued will be prorated on a straight-line basis between performancelevel targets. Under SFAS No. 123(R), the Company will recognize compensation costs, net of forfeitures, usingan accelerated amortization method over the vesting period for awards with performance conditions only if it isprobable that the condition will be satisfied. As of December 31, 2007, no compensation costs have beenrecorded in the accompanying consolidated financial statements related to these shares.
In 2006, the Company granted a maximum of 269,190 performance-based restricted shares for certainCompany employees. These shares vest over a three-year period based on the Company’s financialperformance targets set by the Company’s compensation committee for the year ending December 31, 2007.The potential compensation expenses to be recognized under these performance-based restricted shares wouldbe $4.8 million if the Threshold Performance Target is met and 53,824 shares vest, $9.6 million if the TargetPerformance Target is met and 107,683 shares vest, $16.7 million if the Above Target Performance Target ismet and 188,420 shares vest, and $23.9 million if the Maximum Performance Target is met and 269,190 sharesvest. Shares to be issued was prorated on a straight-line basis between performance level targets. During thethree months ended March 31, 2007, the Company determined that it was probable that the TargetPerformance Target would be met and the Company recorded a cumulative catch-up adjustment of $787,000in non-cash compensation expenses. During the three months ended September 30, 2007, the Companydetermined that it was probable that a performance target level between the Target Performance Target and theAbove Target Performance Target would be met and the Company recorded a cumulative catch-up adjustmentof $944,000 in non-cash compensation expenses. An additional $6.5 million cumulative catch-up adjustmentwas recorded during the three months ended December 31, 2007 to reflect actual 2007 performance. TheCompany uses an accelerated attribution method to record compensation costs related to this award. Total2007 non-cash compensation expenses related to this award were $11.2 million. The remaining $7.1 million innon-cash compensation expenses will be expensed over the remaining two year vesting period.
In September 2004, the Company granted 625,212 performance-based restricted shares for the Company’ssenior officers under the Restricted Plan. These shares vest based on Company financial performance relative tothree-year cumulative performance targets set by the Company’s Compensation Committee for the period fromJanuary 1, 2005 to December 31, 2007. The potential compensation expenses to be recognized under theperformance-based restricted shares would be $1.4 million if the Minimum Performance Target is met and208,404 restricted shares vest, $2.8 million if the Target Performance Target is met and 416,807 restricted sharesvest or $4.2 million if the Maximum Performance Target is met and 625,212 restricted shares vest. During thethree months ended March 31, 2006, the Company determined that it was probable that the Target PerformanceTarget would be met and the Company recorded a cumulative catch-up adjustment to non-cash compensationexpenses of $1.2 million. During the three months ended June 30, 2006, the Company determined that it wasprobable that the Maximum Performance Target would be met and the Company recorded a cumulative catch-upadjustment to non-cash compensation expenses of $943,000. The remaining $2.1 million in non-cash
128
IntercontinentalExchange, Inc. and Subsidiaries
Notes to Consolidated Financial Statements — (Continued)

compensation expenses under the Maximum Performance Target were expensed ratably over the remainingrequisite service period from June 30, 2006 through December 31, 2007. The Company met the MaximumPerformance Target for the period from January 1, 2005 to December 31, 2007 and the company issued the625,212 shares in January 2008 following the completion of the performance period.
The Company has adopted the IntercontinentalExchange, Inc. 2003 Restricted Stock Deferral Plan for OutsideDirectors (the “Director Plan”). Directors can elect to receive up to 100% of their board compensation in restrictedstock or restricted stock units. The restricted stock generally vests over a three-year period. As of December 31, 2007,there are 250,000 shares of common stock reserved for issuance under the Director Plan. Under the Director Plan, thecompensation committee reserved a number of the Company’s common stock treasury shares sufficient to cover thecurrent obligations under the Director Plan for issuance to the board of directors in lieu of fees otherwise payable incash. During the years ended December 31, 2007, 2006 and 2005, 947, 5,043 and 16,799 shares, respectively, ofrestricted stock and restricted stock units were granted to members of the board of directors under the Director Plan.
Restricted shares are used as an incentive to attract and retain qualified senior officers and to increaseshareholder returns with actual performance-based awards based on enhanced shareholder value. The restrictedplans include a change in control provision that may accelerate vesting on both the time-based andperformance-based restricted shares if employment is terminated or if the individual resigns for “good reason”within 12 months after the effective date of a change in control. The following is a summary of the nonvestedrestricted shares under all plans discussed above for the years ended December 31, 2007, 2006 and 2005:
Number ofRestricted
Stock Shares
Weighted AverageGrant-Date FairValue per Share
Nonvested at January 1, 2005 . . . . . . . . . . . . . . . . . . . . . . . . . . . . . 1,430,183 $ 7.80Granted . . . . . . . . . . . . . . . . . . . . . . . . . . . . . . . . . . . . . . . . . . . . 101,799 27.86Vested . . . . . . . . . . . . . . . . . . . . . . . . . . . . . . . . . . . . . . . . . . . . . (260,508) (8.36)
Nonvested at December 31, 2005 . . . . . . . . . . . . . . . . . . . . . . . . . . . 1,271,474 9.01Granted . . . . . . . . . . . . . . . . . . . . . . . . . . . . . . . . . . . . . . . . . . . . 349,521 89.29Vested . . . . . . . . . . . . . . . . . . . . . . . . . . . . . . . . . . . . . . . . . . . . . (213,391) (9.78)Forfeited . . . . . . . . . . . . . . . . . . . . . . . . . . . . . . . . . . . . . . . . . . . (68,535) (8.31)
Nonvested at December 31, 2006 . . . . . . . . . . . . . . . . . . . . . . . . . . . 1,339,069 29.87Granted . . . . . . . . . . . . . . . . . . . . . . . . . . . . . . . . . . . . . . . . . . . . 398,334 182.66Vested . . . . . . . . . . . . . . . . . . . . . . . . . . . . . . . . . . . . . . . . . . . . . (268,998) (21.91)Forfeited . . . . . . . . . . . . . . . . . . . . . . . . . . . . . . . . . . . . . . . . . . . (32,276) (38.09)
Nonvested at December 31, 2007 . . . . . . . . . . . . . . . . . . . . . . . . . . . 1,436,129 73.56
Restricted stock shares granted in the table above include both time-based and performance-based grants.Performance based shares awarded in prior years have been adjusted to reflect the actual shares to be issuedbased on the achievement of past performance targets. Unvested performance-based restricted shares grantedare presented in the table above at the maximum number of restricted shares that would vest if the maximumperformance targets are met. As of December 31, 2007, there were $23.5 million in total unrecognizedcompensation costs related to the time-based restricted stock and the performance-based restricted stock. Thesecosts are expected to be recognized over a weighted average period of 2.2 years as the restricted stock vests.During the years ended December 31, 2007 and 2006, the total fair value of restricted stock vested under allrestricted stock plans was $41.0 million and $14.5 million, respectively.
Treasury Stock
During the years ended December 31, 2007 and 2006, the Company received 180,601 and 68,654 shares,respectively, of common stock from certain employees of the Company related to tax withholdings made bythe Company on the employee’s behalf. The Company recorded the receipt of the shares as treasury stock. The
129
IntercontinentalExchange, Inc. and Subsidiaries
Notes to Consolidated Financial Statements — (Continued)

Company also issued 404,740 and 135,370 shares of treasury stock during the years ended December 31, 2007and 2006, respectively, under the Director Plan and the Restricted Plan. During the year ended December 31,2005, the Company’s compensation committee reserved 21,250 treasury shares for potential issuance under theRestricted Plan. During the years ended December 31, 2007, 2006 and 2005, the Company’s compensationcommittee reserved 947, 5,043 and 16,799 treasury shares, respectively, for potential issuance under theDirector Plan. Treasury stock activity is presented in the accompanying consolidated statements of changes inshareholders’ equity.
12. Income Taxes
For the years ended December 31, 2007, 2006 and 2005, income before income taxes from domesticoperations was $192.3 million, $144.2 million and $27.3 million, respectively, and income before income taxesfrom foreign operations was $166.1 million, $68.3 million and $32.7 million, respectively. Details of theincome tax provision in the accompanying consolidated statements of income for the years ended December 31,2007, 2006 and 2005, are as follows:
2007 2006 2005Year Ended December 31,
(In thousands)
Current tax expense:Domestic . . . . . . . . . . . . . . . . . . . . . . . . . . . . . . . . . . . . . . . . . $ 72,623 $44,576 $11,787
Foreign . . . . . . . . . . . . . . . . . . . . . . . . . . . . . . . . . . . . . . . . . . 48,144 30,359 10,464
120,767 74,935 22,251
Deferred tax expense (benefit):
Domestic . . . . . . . . . . . . . . . . . . . . . . . . . . . . . . . . . . . . . . . . . (4,393) (2,370) (2,361)
Foreign . . . . . . . . . . . . . . . . . . . . . . . . . . . . . . . . . . . . . . . . . . 1,448 (3,290) (305)
(2,945) (5,660) (2,666)
Total tax expense . . . . . . . . . . . . . . . . . . . . . . . . . . . . . . . . . . . . . $117,822 $69,275 $19,585
130
IntercontinentalExchange, Inc. and Subsidiaries
Notes to Consolidated Financial Statements — (Continued)

The tax effects of temporary differences between the carrying amount of assets and liabilities in theconsolidated financial statements and their respective tax bases which give rise to deferred tax assets(liabilities) as of December 31, 2007 and 2006 are as follows:
2007 2006December 31,
(In thousands)
Deferred tax assets:Deferred and stock-based compensation . . . . . . . . . . . . . . . . . . . . . . . . . . . $ 7,478 $ 3,189Accrued expenses . . . . . . . . . . . . . . . . . . . . . . . . . . . . . . . . . . . . . . . . . . . 9,904 202Tax credits . . . . . . . . . . . . . . . . . . . . . . . . . . . . . . . . . . . . . . . . . . . . . . . . 8,446 453NOL carryforward . . . . . . . . . . . . . . . . . . . . . . . . . . . . . . . . . . . . . . . . . . 1,888 —Other . . . . . . . . . . . . . . . . . . . . . . . . . . . . . . . . . . . . . . . . . . . . . . . . . . . . 3,398 161
Total . . . . . . . . . . . . . . . . . . . . . . . . . . . . . . . . . . . . . . . . . . . . . . . . . . . . 31,114 4,005Valuation allowance . . . . . . . . . . . . . . . . . . . . . . . . . . . . . . . . . . . . . . . . . (2,718) —
Total deferred tax assets, net of valuation allowance . . . . . . . . . . . . . . . . . . . 28,396 4,005
Deferred tax liabilities:Property and equipment . . . . . . . . . . . . . . . . . . . . . . . . . . . . . . . . . . . . . . (6,772) (34)Acquired intangibles . . . . . . . . . . . . . . . . . . . . . . . . . . . . . . . . . . . . . . . . . (122,642) —Tax accrued on undistributed earnings of foreign subsidiaries . . . . . . . . . . . — (3,369)Other . . . . . . . . . . . . . . . . . . . . . . . . . . . . . . . . . . . . . . . . . . . . . . . . . . . . (2,813) (1,383)
Total deferred tax liabilities . . . . . . . . . . . . . . . . . . . . . . . . . . . . . . . . . . . . . (132,227) (4,786)
Net deferred tax liabilities . . . . . . . . . . . . . . . . . . . . . . . . . . . . . . . . . . . . . . (103,831) (781)Net current deferred tax assets (liabilities) . . . . . . . . . . . . . . . . . . . . . . . . . . . 4,908 (908)
Net noncurrent deferred tax assets (liabilities) . . . . . . . . . . . . . . . . . . . . . . . . $(108,739) $ 127
As of December 31, 2007, the Company has excess foreign tax credits of $1.2 million for tax purposeswhich are expected to offset prior tax liabilities. As of December 31, 2007, the Company has net operatingloss carryforwards of $13.0 million for state tax purposes, which will be available to offset future taxableincome. If not used, these carryforwards will expire in 2026. The Company recognized a valuation allowancefor deferred tax assets of $2.7 million as of December 31, 2007. The valuation allowance is due to excess statetax credits that are available to offset future taxes.
A reconciliation of the statutory U.S. federal income tax rate to the Company’s effective income tax ratefor the years ended December 31, 2007, 2006 and 2005 is as follows:
2007 2006 2005
Year EndedDecember 31,
Statutory federal income tax rate . . . . . . . . . . . . . . . . . . . . . . . . . . . . . . . . . . 35.0% 35.0% 35.0%State income taxes, net of federal benefit . . . . . . . . . . . . . . . . . . . . . . . . . . . . 2.0 1.1 0.8Tax credits . . . . . . . . . . . . . . . . . . . . . . . . . . . . . . . . . . . . . . . . . . . . . . . . . . . (2.2) (0.2) (2.7)Jobs Act repatriation . . . . . . . . . . . . . . . . . . . . . . . . . . . . . . . . . . . . . . . . . . . — — (3.4)Foreign tax rate differential . . . . . . . . . . . . . . . . . . . . . . . . . . . . . . . . . . . . . . (2.3) (3.2) 3.3Other . . . . . . . . . . . . . . . . . . . . . . . . . . . . . . . . . . . . . . . . . . . . . . . . . . . . . . . 0.4 (0.1) (0.4)
Total provision for income taxes . . . . . . . . . . . . . . . . . . . . . . . . . . . . . . . . . . . 32.9% 32.6% 32.6%
The effective tax rate for the year ended December 31, 2007 is lower than the federal statutory rateprimarily due to a decrease in the amount of U.S. taxes accrued on foreign earnings, tax exempt interestincome and tax credits, which are partially offset by state taxes and non-deductible expenses.
131
IntercontinentalExchange, Inc. and Subsidiaries
Notes to Consolidated Financial Statements — (Continued)

The undistributed earnings of the Company’s foreign subsidiaries that have not been remitted to theU.S. totaled $209.5 million and $82.9 million as of December 31, 2007 and 2006. These earnings are notsubject to U.S. income tax until they are distributed to the U.S. Historically, the Company has provided fordeferred U.S. federal income taxes on these undistributed earnings in the accompanying consolidatedstatements of income as they were determined not to be indefinitely reinvested. However, during the yearended December 31, 2006, the Company determined in accordance with APB No. 23, Accounting for IncomeTaxes-Special Areas, that $51.0 million of the undistributed earnings are indefinitely reinvested, primarilyrelated to the cost method investment made during the fourth quarter of 2006 (Note 6). Also during the threemonths ended March 31, 2007, the Company determined that $31.2 million of the undistributed earnings willbe indefinitely reinvested, primarily relating to the cash required to establish and to fund the new Europeanclearing house that the Company will operate beginning in the second half of 2008. The undistributed earningsthat had been indefinitely reinvested total $82.3 million and $51.0 million as of March 31, 2007 andDecember 31, 2006, respectively. During the three months ended June 30, 2007, the Company furtherdetermined that all prior undistributed earnings of its foreign subsidiaries will be indefinitely reinvested. TheCompany made this determination on the basis of sufficient evidence that demonstrates that it will invest theundistributed earnings overseas indefinitely. Under APB Opinion No. 23, when it becomes apparent that someor all of the undistributed earnings of a foreign subsidiary on which income taxes have been accrued in thepast will not be remitted in the foreseeable future, then the parent company should adjust income tax expenseof the current period to reflect this change. The Company reduced tax expense by $3.6 million and $4.8 millionfor the years ended December 31, 2007 and 2006, respectively, to reflect the decision to indefinitely reinvestthese prior undistributed earnings. Determination of the amount of unrecognized deferred U.S. income taxliability on the undistributed earnings of the Company’s foreign subsidiaries is not practicable.
On October 22, 2004, the American Jobs Creation Act of 2004 (the “Jobs Act”) introduced a special one-time dividends received deduction on the repatriation of certain foreign earnings in 2004 or 2005, providedcertain criteria are met. The deduction resulted in an approximate 5.25% federal tax rate on repatriatedearnings. To qualify for the deduction, the earnings must be reinvested in the U.S. pursuant to a domesticreinvestment plan established by the Company’s chief executive officer and approved by the Company’s boardof directors. Certain other criteria in the Jobs Act must be satisfied as well. In 2005, the Company completedits evaluation of the repatriation provision and repatriated $35.0 million of foreign earnings in accordance withthe requirements of the Jobs Act. As a result, the Company recognized a tax benefit of $2.0 million, net ofavailable foreign tax credits.
The Jobs Act tax benefit was offset by tax expense of $2.0 million recorded for the year endedDecember 31, 2005 related to an increase to the estimate of U.S. residual taxes due on the remainingundistributed earnings of the Company’s foreign subsidiaries. The impact of this $2.0 million increase in theU.S. residual taxes decreased earnings per share by $0.04 during the year ended December 31, 2005.
A reconciliation of the beginning and ending amount of unrecognized tax benefits is as follows (inthousands):
Balance at January 1, 2007 . . . . . . . . . . . . . . . . . . . . . . . . . . . . . . . . . . . . . . . . . . . . . . . . $13,173
Additions based on tax positions related to current year . . . . . . . . . . . . . . . . . . . . . . . . . 2,570
Additions based on tax positions in prior years . . . . . . . . . . . . . . . . . . . . . . . . . . . . . . . 1,659
Reductions based on tax positions related to current year . . . . . . . . . . . . . . . . . . . . . . . . (3,365)
Reductions based on tax positions of prior years . . . . . . . . . . . . . . . . . . . . . . . . . . . . . . (80)
Reductions resulting from statute of limitation lapses. . . . . . . . . . . . . . . . . . . . . . . . . . . (1,894)
Settlements. . . . . . . . . . . . . . . . . . . . . . . . . . . . . . . . . . . . . . . . . . . . . . . . . . . . . . . . . . (100)
Balance at December 31, 2007 . . . . . . . . . . . . . . . . . . . . . . . . . . . . . . . . . . . . . . . . . . . . . $11,963
132
IntercontinentalExchange, Inc. and Subsidiaries
Notes to Consolidated Financial Statements — (Continued)

As of the adoption date of FIN 48, the Company had unrecognized tax benefits of $13.2 million of which$5.0 million, if recognized, would affect the effective tax rate. The Company recorded a decrease tounrecognized tax benefits of $1.2 million as of December 31, 2007, of which approximately $2.4 million and$1.6 million increased income tax expense for the year and three months ended December 31, 2007,respectively. As of December 31, 2007, the Company had unrecognized tax benefits of $12.0 million, of which$4.6 million, if recognized, would affect the effective tax rate. The Company recognizes interest accruedrelated to income tax uncertainties as a component of interest expense. Any related penalties, if incurred,would be included in selling, general and administrative expenses. Interest expense related to the unrecognizedtax benefits totaled $478,000 for the year ended December 31, 2007. Accrued interest and penalties were$1.5 million and $1.9 million as of January 1, 2007 and December 31, 2007, respectively.
The Company currently anticipates the amount of unrecognized tax benefits to decrease by $462,000 byDecember 31, 2008. The unrecognized tax benefit, related to research and development and investment taxcredits claimed, nexus and the classification of income, would decrease due to the closing of the related statueof limitations of the jurisdiction where reported and the filing of tax returns. The Company or one of itssubsidiaries files income tax returns in the U.S. federal jurisdiction, and various state and foreign jurisdictions.With few exceptions, the Company is no longer subject to U.S. federal, state, local or foreign examinations bytax authorities for years before 2004.
13. Related-Parties
Related-parties include principal owners of the Company and other parties that control or can significantlyinfluence the management or operating policies of the Company. Principal owners include any party that ownsmore than 10% of the voting interest in or common stock of the Company. During the year endedDecember 31, 2005, the Company had two shareholders who held more than 10% of the common stock of theCompany and are considered related-parties. In connection with the Company’s secondary offering of commonstock on July 21, 2006, the voting interest of the two shareholders of the Company who previously held morethan 10% of the common stock of the Company fell below the 10% threshold. Therefore, beginning on July 21,2006, these two shareholders are no longer considered related-parties for disclosure purposes. The Companyhas classified all companies that had board of director participation as a related-party due to their significantinfluence over the Company. Revenues earned from related-parties of the Company totaled $1.7 million,$16.1 million and $17.5 million for the years ended December 31, 2007, 2006 and 2005, respectively. As ofDecember 31, 2007 and 2006, the Company had $777,000 and $448,000, respectively, in accounts receivablefrom related-parties.
The Company had a stock put agreement with Continental Power Exchange, Inc., which is the Company’spredecessor company and which is owned by the chief executive officer of the Company. The stock put wascanceled in November 2005. See note 10 for more detail on this related-party stock put agreement.
14. Unearned Government Grant
In November 2002, ICE Futures U.S. entered into a ten-year agreement with the New York State UrbanDevelopment Corporation d/b/a Empire State Development Corporation (“ESDC”). As a result of the terroristattacks on the World Trade Center on September 11, 2001, the ESDC, in cooperation with the New York CityEconomic Development Corporation d/b/a New York City Industrial Development Agency, determined that ICEFutures U.S. was eligible for assistance under the World Trade Center Job Creation and Retention Program. InNovember 2002, ICE Futures U.S. received a cash grant of $23.3 million for fixed asset investment. Thisagreement requires ICE Futures U.S. to maintain certain annual employment levels in a certain geographic areaof New York City and the grant is subject to recapture amounts on a declining scale over a ten year term if ICEFutures U.S. employment levels fall below the minimum level. The grant is recognized in the income statementratably in accordance with the ten-year recapture schedule as a credit to depreciation and amortization expense.
133
IntercontinentalExchange, Inc. and Subsidiaries
Notes to Consolidated Financial Statements — (Continued)

As of December 31, 2007, the potential recapture amount had decreased to $10.5 million and is scheduled todecrease by $1.7 million at the end of each fiscal year going forward. The following is a schedule of future grantamortization as of December 31, 2007 of each year (in thousands):
Year ending December 31:
2008 . . . . . . . . . . . . . . . . . . . . . . . . . . . . . . . . . . . . . . . . . . . . . . . . . . . . . . . . . . . . . . $ 1,748
2009 . . . . . . . . . . . . . . . . . . . . . . . . . . . . . . . . . . . . . . . . . . . . . . . . . . . . . . . . . . . . . . 1,748
2010 . . . . . . . . . . . . . . . . . . . . . . . . . . . . . . . . . . . . . . . . . . . . . . . . . . . . . . . . . . . . . . 1,748
2011 . . . . . . . . . . . . . . . . . . . . . . . . . . . . . . . . . . . . . . . . . . . . . . . . . . . . . . . . . . . . . . 1,748
Thereafter. . . . . . . . . . . . . . . . . . . . . . . . . . . . . . . . . . . . . . . . . . . . . . . . . . . . . . . . . . . 3,493
Total . . . . . . . . . . . . . . . . . . . . . . . . . . . . . . . . . . . . . . . . . . . . . . . . . . . . . . . . . . . . . . . . $10,485
15. Clearing Organizations
ICE Clear U.S. (formerly known as the New York Clearing Corporation or NYCC), the clearing organizationfor ICE Futures U.S., performs the clearing and settlement of every futures and options on futures contract tradedthrough ICE Futures U.S. ICE Clear Canada (formerly known as the WCE Clearing Corporation), the clearingorganization for ICE Futures Canada, performs the clearing and settlement of every futures and options on futurescontract traded through ICE Futures Canada. ICE Clear U.S. is a wholly-owned subsidiary of ICE Futures U.S. andICE Clear Canada is a wholly-owned subsidiary of ICE Futures Canada (ICE Clear U.S. and ICE Clear Canada arereferred to herein collectively as the “ICE Clearing Houses”). Each of the ICE Clearing Houses have equal andoffsetting claims to and from their respective clearing members on opposite sides of each contract, standing as anintermediary on every contract cleared. ICE Clear U.S. serves as the intermediary for any cleared futures contractor option until the first to occur of: (i) the liquidation of such futures contract or option by the holder through anoffsetting trade, (ii) the exercise or assignment of any option (after which ICE Clear U.S. continues as intermediaryfor the futures contract issued pursuant to such exercise), (iii) final cash settlement of the futures contract, or(iv) issuance of a delivery notice by ICE Clear U.S. to the receiver with respect to a futures contract of a deliverer.ICE Clear Canada also performs as the intermediary for any cleared futures contract or option until the same eventsabove occur with the exception of event (iii) since cash settlement is not an option at ICE Futures Canada. To theextent that funds are not otherwise available to satisfy an obligation under an applicable contract, the ICE ClearingHouses bear counterparty credit risk in the event that future market movements create conditions that could lead toclearing members failing to meet their obligations to the clearing organization. The ICE Clearing Houses reducetheir exposure through a risk management program that includes initial and ongoing financial standards foradmission as a clearing member, original and variation margin requirements, mandatory deposits to a guaranty fundand the ability to assess clearing members.
Each of the ICE Clearing Houses require all clearing members to maintain on deposit with it cash, moneymarket mutual fund shares, U.S. Government obligations (with respect to ICE Clear U.S.), CanadianGovernment obligations (with respect to ICE Clear Canada) or letters of credit to secure payment of variationmargin as may become due from the clearing members, and such deposits in total are known as originalmargin. ICE Clear U.S. marks all outstanding futures contracts to market at least twice daily and pay andcollect option premium daily. ICE Clear Canada marks all outstanding positions to market once per day.Clearing members that experience net losses from future and option positions at the end of the trading day arerequired to pay the relevant ICE Clearing House the amount of those net losses in cash by 9:00 am thefollowing morning. Likewise, clearing members that experience net collects are paid those net profits by therelevant ICE Clearing House in cash. For the intra-day mark to market, ICE Clear U.S. clearing members arerequired to deposit all losses in excess of $100,000 within 60 minutes of notice and ICE Clear Canada clearingmembers are required to make any required payment exceeding $10,000 within 60 minutes of notice. Clearingmembers with collects greater than $250,000 will be paid those profits by the relevant ICE Clearing House in
134
IntercontinentalExchange, Inc. and Subsidiaries
Notes to Consolidated Financial Statements — (Continued)
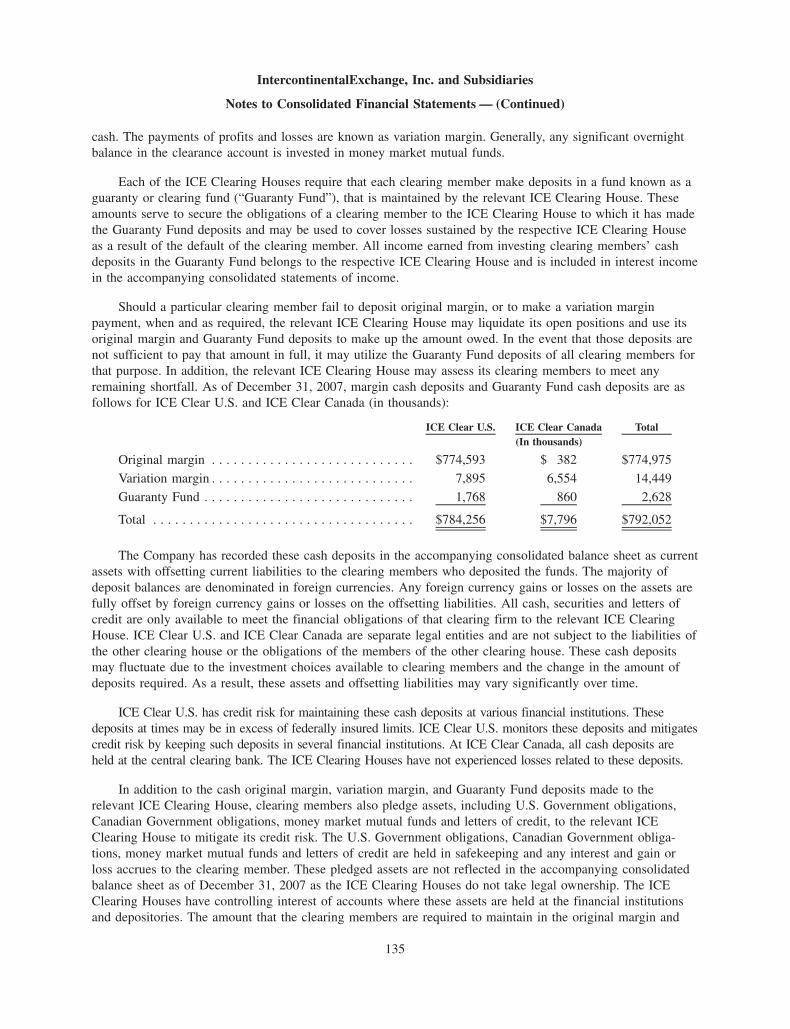
cash. The payments of profits and losses are known as variation margin. Generally, any significant overnightbalance in the clearance account is invested in money market mutual funds.
Each of the ICE Clearing Houses require that each clearing member make deposits in a fund known as aguaranty or clearing fund (“Guaranty Fund”), that is maintained by the relevant ICE Clearing House. Theseamounts serve to secure the obligations of a clearing member to the ICE Clearing House to which it has madethe Guaranty Fund deposits and may be used to cover losses sustained by the respective ICE Clearing Houseas a result of the default of the clearing member. All income earned from investing clearing members’ cashdeposits in the Guaranty Fund belongs to the respective ICE Clearing House and is included in interest incomein the accompanying consolidated statements of income.
Should a particular clearing member fail to deposit original margin, or to make a variation marginpayment, when and as required, the relevant ICE Clearing House may liquidate its open positions and use itsoriginal margin and Guaranty Fund deposits to make up the amount owed. In the event that those deposits arenot sufficient to pay that amount in full, it may utilize the Guaranty Fund deposits of all clearing members forthat purpose. In addition, the relevant ICE Clearing House may assess its clearing members to meet anyremaining shortfall. As of December 31, 2007, margin cash deposits and Guaranty Fund cash deposits are asfollows for ICE Clear U.S. and ICE Clear Canada (in thousands):
ICE Clear U.S. ICE Clear Canada Total(In thousands)
Original margin . . . . . . . . . . . . . . . . . . . . . . . . . . . . $774,593 $ 382 $774,975
Variation margin . . . . . . . . . . . . . . . . . . . . . . . . . . . . 7,895 6,554 14,449
Guaranty Fund . . . . . . . . . . . . . . . . . . . . . . . . . . . . . 1,768 860 2,628
Total . . . . . . . . . . . . . . . . . . . . . . . . . . . . . . . . . . . . $784,256 $7,796 $792,052
The Company has recorded these cash deposits in the accompanying consolidated balance sheet as currentassets with offsetting current liabilities to the clearing members who deposited the funds. The majority ofdeposit balances are denominated in foreign currencies. Any foreign currency gains or losses on the assets arefully offset by foreign currency gains or losses on the offsetting liabilities. All cash, securities and letters ofcredit are only available to meet the financial obligations of that clearing firm to the relevant ICE ClearingHouse. ICE Clear U.S. and ICE Clear Canada are separate legal entities and are not subject to the liabilities ofthe other clearing house or the obligations of the members of the other clearing house. These cash depositsmay fluctuate due to the investment choices available to clearing members and the change in the amount ofdeposits required. As a result, these assets and offsetting liabilities may vary significantly over time.
ICE Clear U.S. has credit risk for maintaining these cash deposits at various financial institutions. Thesedeposits at times may be in excess of federally insured limits. ICE Clear U.S. monitors these deposits and mitigatescredit risk by keeping such deposits in several financial institutions. At ICE Clear Canada, all cash deposits areheld at the central clearing bank. The ICE Clearing Houses have not experienced losses related to these deposits.
In addition to the cash original margin, variation margin, and Guaranty Fund deposits made to therelevant ICE Clearing House, clearing members also pledge assets, including U.S. Government obligations,Canadian Government obligations, money market mutual funds and letters of credit, to the relevant ICEClearing House to mitigate its credit risk. The U.S. Government obligations, Canadian Government obliga-tions, money market mutual funds and letters of credit are held in safekeeping and any interest and gain orloss accrues to the clearing member. These pledged assets are not reflected in the accompanying consolidatedbalance sheet as of December 31, 2007 as the ICE Clearing Houses do not take legal ownership. The ICEClearing Houses have controlling interest of accounts where these assets are held at the financial institutionsand depositories. The amount that the clearing members are required to maintain in the original margin and
135
IntercontinentalExchange, Inc. and Subsidiaries
Notes to Consolidated Financial Statements — (Continued)

Guaranty Fund accounts is determined by parameters established by the risk management department and theBoard of the ICE Clearing Houses and may fluctuate over time.
As of December 31, 2007, the U.S. Government obligations and money market mutual funds pledged bythe clearing members as original margin and Guaranty Fund deposits for ICE Clear U.S. are detailed below:
U.S.GovernmentSecurities atFace Value
MoneyMarket
Mutual Fund(In thousands)
Original margin . . . . . . . . . . . . . . . . . . . . . . . . . . . . . . . . . . . . . . . . . . . $3,139,010 $834,310Guaranty Fund . . . . . . . . . . . . . . . . . . . . . . . . . . . . . . . . . . . . . . . . . . . 94,443 —
Total . . . . . . . . . . . . . . . . . . . . . . . . . . . . . . . . . . . . . . . . . . . . . . . . . . . $3,233,453 $834,310
As of December 31, 2007, the Canadian Government obligations and letters of credit pledged by theclearing members as original margin and Guaranty Fund deposits for ICE Clear Canada are detailed below:
CanadianGovernmentSecurities atFace Value
Lettersof Credit
(In thousands)
Original margin . . . . . . . . . . . . . . . . . . . . . . . . . . . . . . . . . . . . . . . . . . . . . $40,897 $18,925Guaranty Fund . . . . . . . . . . . . . . . . . . . . . . . . . . . . . . . . . . . . . . . . . . . . . . 17,751 —
Total . . . . . . . . . . . . . . . . . . . . . . . . . . . . . . . . . . . . . . . . . . . . . . . . . . . . . . $58,648 $18,925
The Company has agreed to reserve $50.0 million of the $250.0 million available under the revolvingcredit facility for use by ICE Clear U.S. to provide liquidity in the event of default by a clearing participant(Note 9). ICE Clear Canada has also arranged a total of $3.0 million in revolving standby credit facilities withthe Royal Bank of Canada to provide liquidity in the event of default by a clearing participant (Note 9).
ICE Futures Canada receives cash and non-cash deposits relating to deliveries of commodity futures contractsby certain participants. The Company has recorded the delivery performance cash deposits in the accompanyingconsolidated balance sheet as current assets with offsetting current liabilities. As of December 31, 2007, the amountof delivery performance cash deposits held by ICE Futures Canada was $1.1 million and is reflected in prepaidexpenses and other current assets and in other current liabilities in the accompanying consolidated balance sheet.The letters of credit held by ICE Futures Canada as non-cash delivery performance deposits as of December 31,2007, and not reflected in the accompanying consolidated balance sheet, were $11.6 million.
16. Commitments and Contingencies
Leases
The Company leases office space, equipment facilities, and certain computer equipment. As of December 31,2007, future minimum lease payments under these noncancelable operating agreements are as follows (in thousands):
2008 . . . . . . . . . . . . . . . . . . . . . . . . . . . . . . . . . . . . . . . . . . . . . . . . . . . . . . . . . . . . . . . . $10,7212009 . . . . . . . . . . . . . . . . . . . . . . . . . . . . . . . . . . . . . . . . . . . . . . . . . . . . . . . . . . . . . . . . 9,5592010 . . . . . . . . . . . . . . . . . . . . . . . . . . . . . . . . . . . . . . . . . . . . . . . . . . . . . . . . . . . . . . . . 9,3852011 . . . . . . . . . . . . . . . . . . . . . . . . . . . . . . . . . . . . . . . . . . . . . . . . . . . . . . . . . . . . . . . . 9,1812012 . . . . . . . . . . . . . . . . . . . . . . . . . . . . . . . . . . . . . . . . . . . . . . . . . . . . . . . . . . . . . . . . 7,254Thereafter . . . . . . . . . . . . . . . . . . . . . . . . . . . . . . . . . . . . . . . . . . . . . . . . . . . . . . . . . . . . 12,057
$58,157
136
IntercontinentalExchange, Inc. and Subsidiaries
Notes to Consolidated Financial Statements — (Continued)

The Company had no capital lease obligations as of December 31, 2007 and 2006. Rental expenseamounted to $11.8 million, $4.0 million and $3.2 million for the years ended December 31, 2007, 2006 and2005, respectively.
Russell Licensing Agreement
On June 15, 2007, the Company entered into an exclusive licensing agreement (the “LicensingAgreement”) with the Frank Russell Company (“Russell”) to offer futures and options on futures contractsbased on the full range of Russell’s industry-leading benchmark U.S. equity indexes, including the Russell1000» Index, Russell 2000» Index and Russell 3000» Index, as well as the related value and growth indexesoffered by Russell. Under the Licensing Agreement, the Company and its affiliates will have exclusive rightsto list futures contracts and options on futures contracts based on the full range of Russell’s benchmarkU.S. equity indexes. Prior to this Licensing Agreement, ICE Futures U.S. had the ability to trade futures andoptions on futures on the Russell 1000», Russell 2000» and Russell 3000», including certain “mini” and full-size contracts, as well as the Russell 1000 Growth» and Russell 1000 Value» Indexes and the Russell 2000Growth» and Russell 2000 Value» Indexes.
The Licensing Agreement will result in the termination of all other valid licenses on futures and optionson futures based on the Russell indexes. Due to the wind down provisions of existing Russell contracts, duringthe first year of the Licensing Agreement, the Company has the ability to offer the Russell licenses on a non-exclusive basis. These rights will become exclusive starting in the third quarter of 2008, and will remainexclusive throughout the remainder of the agreement. The term of the Licensing Agreement is seven years(through July 1, 2014), after which time it will be automatically renewed for successive one-year terms unlesseither party provides a written notice to the other party to not renew the Licensing Agreement. Beginningthree years after the effective date of the Licensing Agreement, the Company will be required to maintain aminimum level of average trading volume per quarter to preserve the exclusive rights granted to it under theLicensing Agreement.
In exchange for the license rights, the Company paid Russell $50.0 million in July 2007 and will alsomake annual royalty payments based on the annual contract trade volumes, subject to certain minimum annualroyalty payments. The Company has recorded the purchased license rights as intangible assets, which werevalued based on the net present value of all minimum annual royalty payments that the Company is requiredto make to Russell throughout the term of the agreement. As of December 31, 2007, the assets related to theLicensing Agreement are $149.7 million and are included in other intangible assets in the accompanyingconsolidated balance sheet. The intangible assets will be amortized based on the Company’s valuations of thenon-exclusive and the exclusive periods of the Licensing Agreement. For the year ended December 31, 2007,amortization expense related to the Licensing Agreement was $83,000, which reflects amortization on the non-exclusive portion of the intangible asset as the exclusive period has not commenced.
Since the Company is required to pay minimum annual royalty payments in order to maintain the Russelllicense rights, the Company has also recorded a liability based on the net present value of the total requiredpayments as of the effective date of the Licensing Agreement. As of December 31, 2007, the current andnoncurrent liabilities relating to the minimum annual royalty payments of the Licensing Agreement are$10.6 million and $89.6 million, respectively, and are reflected as licensing agreement liabilities in theaccompanying consolidated balance sheet. The difference between the present value of the payments and theactual payments is recorded as interest expense using the effective interest method over the term of theLicensing Agreement. For the year ended December 31, 2007, interest expense related to the LicensingAgreement was $3.1 million.
137
IntercontinentalExchange, Inc. and Subsidiaries
Notes to Consolidated Financial Statements — (Continued)

Patent Licensing Agreement
In March 2002, the Company entered into a long-term, non-exclusive licensing agreement with eSpeed,Inc. (“eSpeed”), which granted the use of eSpeed’s patent to the Company and its majority-owned andcontrolled affiliates. Under the agreement, the Company was required to pay minimum annual license fees of$2.0 million beginning in April 2002 through the expiration date of the patent in February 2007 along withadditional royalty payments calculated quarterly based upon the volume of certain futures transactionsexecuted on the Platform. The Company recorded amortization expense of $283,000, $2.2 million and$2.0 million during the years ended December 31, 2007, 2006 and 2005, respectively, relating to the licensingagreement. The Company paid royalty payments of $1.7 million, $9.0 million and $1.5 million during theyears ended December 31, 2007, 2006 and 2005, respectively, which were recorded as patent royalty expensesin the accompanying consolidated statements of income. The licensing agreement and related patent expired inFebruary 2007 and no future payments are required.
ICE Futures U.S. eSpeed Agreement
In 2004, ICE Futures U.S. entered into an agreement with eSpeed that terminated a previous agreementwith eSpeed which had provided for the establishment of an electronic marketplace, in exchange for a one-time cash payment in 2004 and a commitment to make variable cash payments to eSpeed based on the numberof electronic contracts traded on ICE Futures U.S. through September 2017. The variable payment has a capof $1.0 million per year. These payments may be adjusted annually for changes in the Consumer Price Index.ICE Futures U.S. began executing electronic trades on February 2, 2007. Based on the electronic tradingvolumes for the year ended December 31, 2007, ICE Futures U.S. triggered the cap on the variable paymentand expensed $1.0 million as selling, general and administrative expenses in the accompanying consolidatedstatements of income for the year ended December 31, 2007.
Middle East Sour Crude Oil Futures Contract Liquidity Provider Program
On May 21, 2007, the Company listed for trading the ICE Middle East Sour Crude futures contractthrough ICE Futures Europe. The contract was offered free of trading fees for an initial three-month period forall customers (which has been extended to an initial nine-month period), except for those trades that occur offexchange. An incentive program for liquidity providers was promoted in conjunction with the launch of thecontract. ICE Futures Europe notified participants in the initial program of its termination on October 19, 2007at which point it was replaced with a revised program.
Under the terms of the revised program, five liquidity providers will trade without charge for anadditional period as long as they meet certain market making obligations under the Middle East Sour Crudefutures liquidity provider program until April 15, 2008. The market making obligations require the liquidityproviders to maintain two-sided markets consisting of a simultaneous bid and offer during certain times andbased on certain prices. In addition to free trading, the liquidity providers will also receive (i) a monthlystipend of $30,000 per liquidity provider each month and (ii) a share in a liquidity provider pool program (the“Liquidity Provider Pool”), that is to be established in each year beginning in 2008 through 2015 (the“Measurement Period”).
The Liquidity Provider Pool will be valued at 50% of the overall transaction fees received by ICE FuturesEurope in relation to trading in the ICE Middle East Sour Crude futures contract in each calendar year of theMeasurement Period, net of certain expenses and taxes. The Liquidity Provider Pool will be allocated betweenthe eligible liquidity providers based on the following: (i) 20% allocated equally among the eligible liquidityproviders, (ii) 40% allocated on the basis of the extent of their market making obligations, and (iii) 40%allocated on the basis of contract volumes traded by the liquidity providers during that calendar year of theMeasurement Period. However, there is a 40% cap on the share in the annual Liquidity Provider Pool that anyone liquidity provider can receive in any calendar year in the Measurement Period. Payments under the
138
IntercontinentalExchange, Inc. and Subsidiaries
Notes to Consolidated Financial Statements — (Continued)

provisions of the Liquidity Provider Pool will be in the first quarter of the subsequent calendar year during theMeasurement Period.
Employment Agreements
The Company has entered into employment agreements with all of its corporate officers. If the corporateofficers are terminated without cause, the employment agreements result in separation payments ranging fromsix months to three years of the corporate officer’s annual base salary. In some cases, the employmentagreements also stipulate an additional payment for bonus compensation for the balance of the term of theemployment agreement. Also, certain employment agreements have provisions that provide for terminationpayments following a change of control and corresponding loss of employment, which generally provide forbase salary, bonus payment, benefits continuation for the full term of the employment agreement (rangingfrom one to three years), gross up payment for any excise taxes due under Section 4999 of the InternalRevenue Code of 1986 and the acceleration of vesting of any stock options granted after the execution of theemployment agreements.
The Company’s U.K. subsidiaries, in accordance with normal U.K. practice, have entered into employ-ment agreements with all of its employees. The employment agreements require a severance notice rangingfrom one to six months.
Legal Proceedings
On September 29, 2005, the U.S. District Court for the Southern District of New York granted theCompany’s motion for summary judgment dismissing all claims brought by the New York MercantileExchange, Inc. (“NYMEX”) against the Company in an action commenced in November 2002. NYMEX’scomplaint alleged copyright infringement by the Company on the basis of its use of NYMEX’s publiclyavailable settlement prices in two of the Company’s cleared OTC contracts. The complaint also alleged thatthe Company infringe and dilute NYMEX’s trademark rights by referring to NYMEX trademarks in certainswap contract specifications and that the Company tortiously interfered with a contract between NYMEX andthe data provider that provides the Company with the NYMEX settlement prices pursuant to a license. Indismissing all of NYMEX’s claims, the court found that NYMEX’s settlement prices were not copyrightableworks as a matter of law, and the Company had not engaged in copyright or trademark infringement inreferencing NYMEX’s publicly available settlement prices. The trademark dilution and tortious interferenceclaims, which are state law claims, were dismissed on jurisdictional grounds. While the court granted summaryjudgment in the Company’s favor on all claims, NYMEX appealed the decision regarding the copyright claimsand state law claims in the Second Circuit Court of Appeals. On August 1, 2007, the Second Circuit Court ofAppeals affirmed the District Court’s grant of motion for summary judgment in the Company’s favor. OnAugust 15, 2007, NYMEX filed a Combined Petition for Panel Rehearing and Rehearing En Banc, requestingthat the case be reheard before the Second Circuit Court of Appeals. On October 25, 2007, the Second CircuitCourt of Appeals denied NYMEX’s Combined Petition for a rehearing. On January 16, 2008, NYMEX filed awrit of certiorari with the U.S. Supreme Court seeking discretionary review of the case, and the U.S. SupremeCourt has not yet decided whether to hear the case. Should NYMEX be successful in its appeal to theSupreme Court and the Company is subsequently found to have infringed NYMEX’s intellectual propertyrights, the Company may incur substantial monetary damages and may be enjoined from using or referring toone or more types of NYMEX settlement prices.
As described below, a series of legal actions have existed between the Company and Klein & Co. Futures,Inc. (“Klein”). In December 2007, the parties mutually agreed to settle all claims and disputes between theparties with respect to the matters described below.
On July 26, 2000, Klein commenced a civil action, referred to as the Klein Action, in the United StatesDistrict Court for the Southern District of New York against numerous defendants, including ICE Futures U.S.,
139
IntercontinentalExchange, Inc. and Subsidiaries
Notes to Consolidated Financial Statements — (Continued)

various affiliates of ICE Futures U.S. and officials of ICE Futures U.S. and/or its affiliates. Klein’s claimsarose out of its collapse in the wake of the recalculation of settlement prices for futures and options on thePacific Stock Exchange Technology Index (an index of technology stocks) in May 2000.
Klein purported to allege federal claims arising under the CEA and various state law claims. OnFebruary 18, 2005, the District Court dismissed Klein’s CEA claims with prejudice in accordance withSection 22(b) of the CEA for lack of standing and declined to exercise supplemental jurisdiction over Klein’sstate law claims. That decision was affirmed on September 18, 2006, by a panel of the United States Court ofAppeals for the Second Circuit, and a subsequent motion for rehearing insomuch as the panel affirmed theDistrict Court’s dismissal of its CEA claims against ICE Futures U.S. and certain of its affiliates was denied.Klein then filed a petition in the United States Supreme Court seeking to appeal the decision of theUnited States Circuit Court on March 14, 2007. The petition was granted and the appeal was heard before theUnited States Supreme Court on October 29, 2007.
In March 2007, Klein filed a parallel action in the Supreme Court of the State of New York, New YorkCounty, against certain defendants, including ICE Futures U.S. and its former president. The action alleged aclaim of slander and libel against ICE Futures U.S. and its former president relating to certain statementsmade in connection with Klein’s collapse. In May 2007, ICE Futures U.S. filed a motion to dismiss onmultiple grounds. Oral argument was held in August 2007 but the motion was not decided by the court.
Also, on May 14, 2001, ICE Futures U.S. and ICE Clear U.S. commenced an action, referred to as ICEFutures U.S.’s Action, in the United States District Court for the Southern District of New York against Klein.ICE Futures U.S. and ICE Clear U.S. commenced this action in their capacity as the assignees of certainclaims that were held against Klein by its former customers. ICE Futures U.S.’s Action sought to recovermoney owed by Klein to those customers in the wake of Klein’s collapse. In the same decision that dismissedthe Klein action, the District Court dismissed all of Klein’s counterclaims against ICE Futures U.S., deniedICE Futures U.S.’s motion for judgment on the pleadings and found that the complaint in ICE Futures U.S.’sAction did not state a claim for which relief could be granted. However, the District Court granted ICEFutures U.S. leave to replead. On April 14, 2005, ICE Futures U.S. and ICE Clear U.S. filed an amendedcomplaint, which Klein subsequently moved to dismiss. ICE Futures U.S. and ICE Clear U.S. opposed thatmotion which was briefed on August 5, 2005, but was never decided by the court.
As stated above, in December 2007 and prior to the Supreme Court’s ruling, the parties mutually agreedto settle all claims and disputes between the parties through entry of an omnibus settlement agreementwhereby all claims and disputes between them were released and all actions dismissed, with prejudice, uponpayment of an undisclosed amount by ICE Futures U.S. to Klein. The payment under the settlement agreementwas a pre-acquisition contingency that existed as the time of the ICE Futures U.S. acquisition. Therefore, thepayment to Klein was accrued as a liability in the purchase price allocation and had no income statementimpact.
On April 6, 2007, the Supreme Court of the State of New York, County of New York, granted ICEFutures U.S.’s motion to dismiss all claims brought against it in an action commenced on December 8, 2006,by certain holders of non-equity trading permits (“Permit Holders”), of ICE Futures U.S. seeking declaratory,monetary and injunctive relief with respect to the acquisition by the Company. Plaintiffs alleged that, inviolation of contract rights and/or rights under New York’s Not-For-Profit Corporation Law, ICE FuturesU.S.’s Permit Holders, including plaintiffs, were not permitted to vote with respect to the merger and wouldnot receive any part of the merger consideration. Plaintiffs sought (i) to enjoin consummation of the merger,(ii) declaratory relief regarding their past and future rights as Permit Holders, and (iii) an award of unspecifieddamages on claims for breach of fiduciary duty, breach of contract, unjust enrichment, estoppel and fraud. Thecourt also denied the plaintiffs’ motion for a preliminary injunction. On February 4, 2008, the Permit Holdersperfected their appeal from the lower court’s ruling dismissing their complaint. The Permit Holders did not
140
IntercontinentalExchange, Inc. and Subsidiaries
Notes to Consolidated Financial Statements — (Continued)

pursue an appeal of the lower court’s denial of their request for an order enjoining the merger. ICE FuturesU.S. will oppose the appeal and seek affirmance of the lower court’s decision.
The Company is subject to legal proceedings and claims that arise in the ordinary course of business.However, the Company does not believe that the resolution of these matters, including those specificallydiscussed above, will have a material adverse effect on the Company’s consolidated financial condition, resultsof operations, or liquidity. It is possible, however, that future results of operations for any particular quarterlyor annual period could be materially and adversely affected by any new developments relating to theseproceedings and claims.
17. Employee Benefit Plans
The Company’s U.K.-based subsidiaries have a defined contribution pension plan for eligible employees.The Company contributes a percentage of the employee’s base salary to the plan each month and employeesare also able to make additional voluntary contributions, subject to plan and statutory limits. The Company’scontribution ranges from 10% to 20% of the employee’s base salary. Total pension contributions made by theCompany for the years ended December 31, 2007, 2006 and 2005 were $982,000, $832,000 and $879,000,respectively.
The Company’s ICE Futures U.S. employees are eligible to participate in ICE Futures U.S.’s 401(k) andProfit Sharing Plan (the “NY 401(k) Plan”). The Company offers a match of 50% of the first 4% of theeligible employee’s compensation contributed to the NY 401(k) Plan, subject to plan and statutory limits, andan annual discretionary contribution. Total matching contributions and discretionary contributions under theNY 401(k) Plan for the year ended December 31, 2007 was $1.6 million.
The remaining employees of the Company’s U.S. operations are eligible to participate in the Company’s401(k) and Profit Sharing Plan (the “401(k) Plan”). The Company offers a match of 100% of the first 5% ofthe eligible employee’s compensation contributed to the 401(k) Plan, subject to plan and statutory limits. Totalmatching contributions under the Company’s 401(k) Plan for the years ended December 31, 2007, 2006 and2005 were $1.1 million, $860,000 and $669,000, respectively. No discretionary or profit sharing contributionswere made during the years ended December 31, 2007, 2006 or 2005.
18. CBOT Merger-Related Transaction Costs
The Company incurred incremental direct merger-related transaction costs of $11.1 million during theyear ended December 31, 2007 relating to the proposed merger with CBOT Holdings, Inc. (“CBOT”).Ultimately, CBOT’s board of directors did not accept the Company’s proposal to merge with CBOT, andinstead accepted an improved proposal from the Chicago Mercantile Exchange Holdings, Inc. (“CME”), whichresulted in a completed transaction between CME and CBOT on July 13, 2007. The $11.1 million in merger-related transaction costs included investment banking advisors, legal, accounting, proxy advisor, public relationservices and other external costs directly related to the proposed transaction. These costs have been recordedas CBOT merger-related transaction costs in the accompanying consolidated statements of income for the yearended December 31, 2007.
19. Settlement Expense
In January 2004, EBS Dealing Resources, Inc. (“EBS”), filed a complaint against the Company inUnited States District Court, Southern District of New York, alleging that the Company infringed upon twopatents held by EBS related to credit filter technology for electronic brokerage systems. In September 2005,the Company settled the legal action brought by EBS related to the alleged patent infringement. Under thesettlement agreement, the Company made a payment of $15.0 million to EBS, and was released from the legal
141
IntercontinentalExchange, Inc. and Subsidiaries
Notes to Consolidated Financial Statements — (Continued)

claims brought against it without admitting liability. The payment was classified as “Settlement expense” inthe accompanying consolidated statements of income for the year ended December 31, 2005.
20. Floor Closure Costs
On April 7, 2005, the Company closed its open-outcry trading floor in London. This was done to takeadvantage of the increasing acceptance and adoption of electronic trading, and to maintain and enhance theCompany’s competitive position. All energy futures trading is now conducted exclusively on the Company’selectronic platform. The Company recorded floor closure costs of $4.8 million during the year endedDecember 31, 2005 in connection with the closure of the open-outcry trading floor. These costs include leaseterminations for the building where the floor was located, payments made to 18 employees who wereterminated as a result of the closure, contract terminations, and other associated costs, including legal costsand asset impairment charges. This expense was classified as “Floor closure costs” in the accompanyingconsolidated statements of income, and recorded in accordance with SFAS No. 146, Accounting for CostsAssociated with Exit or Disposal Activities, and SFAS No. 112, Employer’s Accounting for PostemploymentBenefits. The following table reflects the components of the floor closure cost charge.
Floor Closure CostExpense-Year
EndedDecember 31,
2005(In thousands)
Lease termination costs . . . . . . . . . . . . . . . . . . . . . . . . . . . . . . . . . . . . . . . . . . . . $2,572
Employee termination benefits . . . . . . . . . . . . . . . . . . . . . . . . . . . . . . . . . . . . . . . 1,262
Other contract termination costs . . . . . . . . . . . . . . . . . . . . . . . . . . . . . . . . . . . . . . 273
Other associated costs . . . . . . . . . . . . . . . . . . . . . . . . . . . . . . . . . . . . . . . . . . . . . 707
Total floor closure costs . . . . . . . . . . . . . . . . . . . . . . . . . . . . . . . . . . . . . . . . . . . . $4,814
Payments of floor closure costs for the years ended December 31, 2007, 2006 and 2005 were $14,000,$1.5 million and $2.7 million, respectively. All of the Company’s floor closure costs are attributable to thefutures business segment.
21. Segment Reporting
As of December 31, 2007 and 2006 and for the years ended December 31, 2007, 2006 and 2005, theCompany’s principal business segments consist of its OTC business segment, its futures business segment andits market data business segment. The operations of ICE Futures Europe, ICE Futures U.S. and ICE FuturesCanada make up the futures business segment and the operations of ICE Data make up the market databusiness segment. The remaining companies, including the acquisitions of ChemConnect, Chatham andCommoditrack, have been included in the OTC business segment as they primarily support the Company’sOTC business operations. In the prior quarters in 2007 only, the Company reported four business segments; itsOTC business segment, its U.K. futures business segment, its U.S. futures business segment and its marketdata business segment. As of December 31, 2007, the Company combined the U.K. futures business segmentand the U.S. futures business segment into one futures business segment in accordance with SFAS 131,Disclosures about Segments of an Enterprise and Related Information, as this is how it was reported internallyand provided to the Company’s chief operating decision maker.
142
IntercontinentalExchange, Inc. and Subsidiaries
Notes to Consolidated Financial Statements — (Continued)

Intersegment revenues and transactions attributable to the performance of services are recorded at costplus an agreed market percentage intercompany profit. Intersegment revenues attributable to licensingtransactions have been priced in accordance with comparable third party agreements. The accounting policiesof the business segments are the same as those described in the summary of significant accounting policies.Financial data for the Company’s business segments and geographic areas are as follows:
OTCBusinessSegment
FuturesBusinessSegment
MarketData
BusinessSegment Total
(In thousands)
Year ended December 31, 2007:
Revenues from external customers . . . . . . . . $ 241,803 $ 289,333 $43,157 $ 574,293
Intersegment revenues . . . . . . . . . . . . . . . . . 32,311 3,754 19,079 55,144
Depreciation and amortization . . . . . . . . . . . 26,286 6,386 29 32,701
Interest and investment income . . . . . . . . . . 5,589 5,747 529 11,865
Interest expense . . . . . . . . . . . . . . . . . . . . . 15,658 2,983 — 18,641
Income tax expense . . . . . . . . . . . . . . . . . . . 33,907 64,005 19,910 117,822
Net income . . . . . . . . . . . . . . . . . . . . . . . . . 79,199 126,024 35,389 240,612
Total assets . . . . . . . . . . . . . . . . . . . . . . . . . 1,654,133 1,122,279 19,933 2,796,345Capital expenditures and software
development costs . . . . . . . . . . . . . . . . . . 38,044 5,051 171 43,266Goodwill and other intangibles, net . . . . . . . 1,397,696 149,713 — 1,547,409
Net cash provided by operating activities . . . 115,541 120,249 51,991 287,781
Geographic areas:
United States
EuropeanUnion and
Canada Total(In thousands)
Year ended December 31, 2007:
Revenues . . . . . . . . . . . . . . . . . . . . . . . . . . . . . . . . . . . . $ 376,012 $198,281 $ 574,293
As of December 31, 2007:
Property and equipment, net . . . . . . . . . . . . . . . . . . . . . . 60,874 2,650 63,524
Goodwill and other intangibles, net . . . . . . . . . . . . . . . . . 1,547,409 — 1,547,409
143
IntercontinentalExchange, Inc. and Subsidiaries
Notes to Consolidated Financial Statements — (Continued)

Revenues from one customer of the futures business segment comprised 11.5% of the Company’s futuresrevenues for the year ended December 31, 2007. No additional customers accounted for more than 10% of theCompany’s segment revenues or consolidated revenues during the year ended December 31, 2007.
OTCBusinessSegment
FuturesBusinessSegment
MarketData
BusinessSegment Total
(In thousands)
Year ended December 31, 2006:
Revenues from external customers . . . . . . . . . . . . $168,743 $127,024 $18,032 $313,799
Intersegment revenues . . . . . . . . . . . . . . . . . . . . . 26,704 4,404 11,123 42,231
Depreciation and amortization . . . . . . . . . . . . . . . 11,671 2,031 12 13,714
Interest and investment income . . . . . . . . . . . . . . 6,067 2,402 96 8,565
Interest expense . . . . . . . . . . . . . . . . . . . . . . . . . 231 — — 231
Income tax expense . . . . . . . . . . . . . . . . . . . . . . . 33,858 28,089 7,328 69,275
Net income . . . . . . . . . . . . . . . . . . . . . . . . . . . . . 77,494 52,164 13,610 143,268
Total assets . . . . . . . . . . . . . . . . . . . . . . . . . . . . . 414,193 71,972 7,046 493,211
Capital expenditures and software developmentcosts . . . . . . . . . . . . . . . . . . . . . . . . . . . . . . . . 18,068 1,678 69 19,815
Goodwill and other intangibles, net . . . . . . . . . . . 81,126 — — 81,126
Net cash provided by operating activities . . . . . . . 68,884 64,730 17,075 150,689
Geographic areas:
United StatesEuropean
Union Total(In thousands)
Year ended December 31, 2006:
Revenues . . . . . . . . . . . . . . . . . . . . . . . . . . . . . . . . . . . . . $178,100 $135,699 $313,799As of December 31, 2006:
Property and equipment, net . . . . . . . . . . . . . . . . . . . . . . . 21,820 4,460 26,280
Goodwill and other intangibles, net . . . . . . . . . . . . . . . . . . 81,126 — 81,126
144
IntercontinentalExchange, Inc. and Subsidiaries
Notes to Consolidated Financial Statements — (Continued)

Revenues from two customers of the futures business segment comprised 15.4% and 12.1% of the Company’sfutures revenues for the year ended December 31, 2006. No additional customers accounted for more than 10% ofthe Company’s segment revenues or consolidated revenues during the year ended December 31, 2006.
OTCBusinessSegment
FuturesBusinessSegment
MarketData
BusinessSegment Total
(In thousands)
Year ended December 31, 2005:
Revenues from external customers . . . . . . . . . . . . . $ 84,179 $60,082 $11,604 $155,865
Intersegment revenues . . . . . . . . . . . . . . . . . . . . . . 11,034 5,108 1,864 18,006
Floor closure costs . . . . . . . . . . . . . . . . . . . . . . . . — 4,814 — 4,814
Settlement expense . . . . . . . . . . . . . . . . . . . . . . . . 15,000 — — 15,000
Depreciation and amortization . . . . . . . . . . . . . . . . 12,609 2,464 10 15,083
Interest and investment income . . . . . . . . . . . . . . . 1,076 2,013 1 3,090
Interest expense . . . . . . . . . . . . . . . . . . . . . . . . . . 613 — — 613
Income tax expense . . . . . . . . . . . . . . . . . . . . . . . . 7,698 9,606 2,281 19,585
Net income . . . . . . . . . . . . . . . . . . . . . . . . . . . . . . 18,335 17,838 4,237 40,410
Total assets . . . . . . . . . . . . . . . . . . . . . . . . . . . . . . 213,518 47,473 4,779 265,770
Capital expenditures and software developmentcosts . . . . . . . . . . . . . . . . . . . . . . . . . . . . . . . . . 9,557 4,150 26 13,733
Goodwill and other intangibles, net . . . . . . . . . . . . 76,054 — — 76,054
Net cash provided by operating activities . . . . . . . . 20,459 23,719 5,634 49,812
Geographic areas:
United StatesEuropean
Union Total(In thousands)
Year ended December 31, 2005:
Revenues . . . . . . . . . . . . . . . . . . . . . . . . . . . . . . . . . . . . . . $90,202 $65,663 $155,865
As of December 31, 2005:
Property and equipment, net . . . . . . . . . . . . . . . . . . . . . . . . 11,974 8,374 20,348
Goodwill and other intangibles, net . . . . . . . . . . . . . . . . . . . 76,054 — 76,054
Revenues from one customer of the futures business segment comprised 13.3% of the Company’s futuresrevenues for the year ended December 31, 2005. No additional customers accounted for more than 10% of theCompany’s segment revenues or consolidated revenues during the year ended December 31, 2005.
145
IntercontinentalExchange, Inc. and Subsidiaries
Notes to Consolidated Financial Statements — (Continued)

22. Earnings Per Common Share
The following is a reconciliation of the numerators and denominators of the basic and diluted earningsper common share computations for the years ended December 31, 2007, 2006 and 2005:
2007 2006 2005Years Ended December 31,
(In thousands, except per share amounts)
Basic:
Net income (loss) available to common shareholders . . . . . . . $240,612 $143,268 $(20,909)
Weighted average common shares outstanding . . . . . . . . . . . . 68,985 56,474 53,218
Basic earnings (loss) per common share . . . . . . . . . . . . . . . . . $ 3.49 $ 2.54 $ (0.39)
Diluted:
Weighted average common shares outstanding . . . . . . . . . . . . 68,985 56,474 53,218
Effect of dilutive securities:
Stock options and restricted stock . . . . . . . . . . . . . . . . . . . 1,995 3,125 —
Diluted weighted average common shares outstanding . . . . . . 70,980 59,599 53,218
Diluted earnings (loss) per common share . . . . . . . . . . . . . . . $ 3.39 $ 2.40 $ (0.39)
The impact of outstanding stock options is considered to be antidilutive in the calculation of dilutedearnings per share when a net loss available to common shareholders is reported. The Company’s outstandingstock options have not been included in the computation of diluted earnings per share during the year endedDecember 31, 2005 due to the $20.9 million net loss available to common shareholders as a result of the$61.3 million charged to retained earnings related to the redeemable stock put adjustments. Therefore, theCompany’s diluted earnings per share is computed in the same manner as basic earnings per share during theyear ended December 31, 2005. If the Company had reported net income available to common shareholdersduring the year ended December 31, 2005, the diluted earnings per share would have been based on54.4 million in adjusted diluted weighted average common shares outstanding, which includes 1.2 millionstock options and restricted stock having a dilutive effect for the year ended December 31, 2005.
146
IntercontinentalExchange, Inc. and Subsidiaries
Notes to Consolidated Financial Statements — (Continued)

23. Quarterly Financial Data (Unaudited)
The following table has been prepared from the financial records of the Company, and reflects alladjustments that are, in the opinion of management, necessary for a fair presentation of the results ofoperations for the interim periods presented.
1st Qtr(a) 2nd Qtr(b) 3rd Qtr 4th Qtr(In thousands, except per share amounts)
Year Ended December 31, 2007Revenues . . . . . . . . . . . . . . . . . . . . . . . . . . . . . . . $126,608 $136,654 $151,735 $159,296
Operating income . . . . . . . . . . . . . . . . . . . . . . . . . 79,643 76,529 100,864 96,527
Net income available to common shareholders . . . . 55,586 53,693 66,681 64,652Earnings per common share(c):
Basic . . . . . . . . . . . . . . . . . . . . . . . . . . . . . . . . . . $ 0.82 $ 0.78 $ 0.96 $ 0.93
Diluted . . . . . . . . . . . . . . . . . . . . . . . . . . . . . . . . . $ 0.80 $ 0.75 $ 0.93 $ 0.90
Year Ended December 31, 2006Revenues . . . . . . . . . . . . . . . . . . . . . . . . . . . . . . . $ 50,282 $ 73,591 $ 94,662 $ 95,264
Operating income . . . . . . . . . . . . . . . . . . . . . . . . . 27,653 47,416 65,382 64,184
Net income available to common shareholders . . . . 19,664 30,967 43,645 48,992
Earnings per common share(c):
Basic . . . . . . . . . . . . . . . . . . . . . . . . . . . . . . . . . . $ 0.35 $ 0.55 $ 0.77 $ 0.85
Diluted . . . . . . . . . . . . . . . . . . . . . . . . . . . . . . . . . $ 0.33 $ 0.52 $ 0.73 $ 0.81
(a) The Company recognized a net gain on disposal of an asset of $9.3 million during the first quarter of2007. (Note 4).
(b) The Company recognized $11.1 million in CBOT merger-related transaction costs during the second quar-ter of 2007 (Note 18).
(c) The annual earnings per common share may not equal the sum of the individual quarter’s earnings percommon share due to rounding.
147
IntercontinentalExchange, Inc. and Subsidiaries
Notes to Consolidated Financial Statements — (Continued)

ITEM 9. CHANGES IN AND DISAGREEMENTS WITH ACCOUNTANTS ON ACCOUNTING ANDFINANCIAL DISCLOSURE
None.
ITEM 9(A). CONTROLS AND PROCEDURES.
(a) Evaluation of Disclosure Controls and Procedures. As of the end of the period covered by thisreport, an evaluation was carried out by our management, with the participation of our Chief Executive Officerand Chief Financial Officer, of the effectiveness of our disclosure controls and procedures (as defined inRule 13a-15(e) under the Securities Exchange Act of 1934). Based upon that evaluation, our Chief ExecutiveOfficer and Chief Financial Officer concluded that these disclosure controls and procedures were effective asof the end of the period covered by this report.
(b) Changes in Internal Controls over Financial Reporting. There were no changes in our internalcontrols over financial reporting that occurred during our most recent fiscal quarter that have materiallyaffected, or are reasonably likely to materially affect, our internal controls over financial reporting. As a result,no corrective actions were taken.
(c) Management’s Annual Report on Internal Control over Financial Reporting and the AttestationReport of the Independent Registered Public Accounting Firm. Management’s report on its assessment of theeffectiveness of our internal control over financial reporting as of December 31, 2007 and the attestation reportof Ernst & Young LLP on our internal control over financial reporting are set forth in Part II, Item 8 of thisAnnual Report on Form 10-K.
ITEM 9(B). OTHER INFORMATION.
Not applicable.
PART III
ITEM 10. DIRECTORS, EXECUTIVE OFFICERS AND CORPORATE GOVERNANCE
Information relating to our Board of Directors set forth under the captions “Proposal 1 — Election ofDirectors — Nominees for Election as Directors at the 2008 Annual Meeting” and “Proposal 1 — Election ofDirectors — Continuing Directors” in our Proxy Statement for our 2008 Annual Meeting of Stockholders(“2008 Proxy Statement”) is incorporated herein by reference. Information relating to our executive officers is,pursuant to Instruction 3 of Item 401(b) of Regulation S-K and General Instruction G(3) of Form 10-K, setforth at Part I, Item 4(A) of this Annual Report on Form 10-K under the caption “Executive Officers ofIntercontinentalExchange, Inc.” Information regarding compliance by our directors and executive officers andowners of more than ten percent of our Common Stock with the reporting requirements of Section 16(a) of theSecurities Exchange Act of 1934, as amended, set forth under the caption “Section 16(a) of the SecuritiesExchange Act Beneficial Ownership Reporting Compliance” in the 2008 Proxy Statement is incorporatedherein by reference. Information relating to our financial expert serving on our Audit Committee(Item 407(d)(5) of Regulation S-K), our Nominating and Corporate Governance Committee (Item 407(c)(3) ofRegulation S-K), our Audit Committee (Item 407(d)(4) of Regulation S-K) and compliance with Section 16(a)of the Exchange Act (Item 405 of Regulation S-K), is set forth under the caption “Meetings and Committeesof the Board” in our 2008 Proxy Statement and is incorporated herein by reference.
Code of Ethics
We have adopted a Code of Ethics and Business Conduct, which applies to all of our employees, officersand directors. Our Code of Ethics and Business Conduct meets the requirements of a “code of ethics” asdefined by Item 406 of Regulation S-K, and applies to our Chief Executive Officer and Chief Financial Officer(who is the principal financial and principal accounting officer), as well as all other employees, as indicatedabove. Our Code of Ethics and Business Conduct also meets the requirements of a code of ethics and business
148

conduct under the New York Stock Exchange listing standards. Our Code of Ethics and Business Conduct isavailable on our website at www.theice.com under the heading “Investor Resources.” We will also provide acopy of the Code of Ethics and Business Conduct to stockholders at no charge upon written request.
ITEM 11. EXECUTIVE COMPENSATION
Information relating to executive compensation set forth under the captions “Proposal 1 — Election ofDirectors — Directors Compensation”, “Executive Compensation” and “Compensation Committee Interlocksand Insider Participation” in our 2008 Proxy Statement is incorporated herein by reference, except for theinformation set forth in the section entitled “Executive Compensation — Report of the Compensation Commit-tee of the Board of Directors on Executive Compensation”, which specifically is not so incorporated byreference.
ITEM 12. SECURITY OWNERSHIP OF CERTAIN BENEFICIAL OWNERS AND MANAGEMENTAND RELATED STOCKHOLDER MATTERS
Information regarding ownership of our common stock by certain persons as set forth under the caption“Security Ownership of Certain Beneficial Owners and Management” in our 2008 Proxy Statement isincorporated herein by reference. In addition, information in tabular form relating to securities authorized forissuance under our equity compensation plans is set forth under the caption “Equity Compensation PlanInformation” and is incorporated herein by reference.
ITEM 13. CERTAIN RELATIONSHIPS AND RELATED TRANSACTIONS, AND DIRECTORINDEPENDENCE
Information regarding certain relationships and transactions between our company and certain of ouraffiliates as set forth under the caption “Certain Relationships and Related Transactions” in our 2008 ProxyStatement is incorporated herein by reference. In addition, information regarding our directors’ independence(Item 407(a) of Regulation S-K) as set forth under the caption “Proposal 1 — Election of Directors —Nominees for Election as Directors as the 2008 Annual Meeting” in our 2008 Proxy Statement is incorporatedherein by reference.
ITEM 14. PRINCIPAL ACCOUNTANT FEES AND SERVICES
Information regarding principal accountant fees and services of our independent registered publicaccounting firm, Ernst & Young LLP, is set forth under the caption “Principal Accountant Fees and Services”in our 2008 Proxy Statement and is incorporated herein by reference.
PART IV
ITEM 15. EXHIBITS, FINANCIAL STATEMENT SCHEDULES
(a) Documents Filed as Part of this Report.
(1) Financial Statements
Our consolidated financial statements and the related reports of management and independent registeredpublic accounting firm which are required to be filed as part of this Report are included in this Annual Reporton Form 10-K. These consolidated financial statements are as follows:
• Consolidated Balance Sheets as of December 31, 2007 and 2006.
• Consolidated Statements of Income for the years ended December 31, 2007, 2006 and 2005.
• Consolidated Statements of Changes in Shareholders’ Equity for the years ended December 31, 2007,2006 and 2005.
149

• Consolidated Statements of Comprehensive Income for the years ended December 31, 2007, 2006 and2005.
• Consolidated Statements of Cash Flows for the years ended December 31, 2007, 2006 and 2005.
• Notes to Consolidated Financial Statements.
(2) Financial Statement Schedules
“Schedule II — Consolidated Valuation and Qualifying Accounts” is included as a schedule herein.Schedules not listed have been omitted because they are not applicable or the required information is includedin the consolidated financial statements or notes, thereto.
(3) Exhibits
See (b) below.
(b) Exhibits
The exhibits listed below under “Index to Exhibits” are filed with or incorporated by reference in thisReport. Where such filing is made by incorporation by reference to a previously filed registration statement orreport, such registration statement or report is identified in parentheses. We will furnish any exhibit uponrequest to Investor Relations, 2100 RiverEdge Parkway, Suite 500, Atlanta, Georgia 30328.
150

SIGNATURES
Pursuant to the requirements of Section 13 or 15(d) of the Securities Exchange Act of 1934, theRegistrant has duly caused this Report to be signed on its behalf by the undersigned, thereunto dulyauthorized.
INTERCONTINENTALEXCHANGE, INC.(Registrant)
Date: February 13, 2008 By: /s/ Jeffrey C. Sprecher
Jeffrey C. SprecherChief Executive Officer
KNOW ALL MEN BY THESE PRESENTS, that each person whose signature appears below constitutesand appoints Jeffrey C. Sprecher and Scott A. Hill, and each of them his or her true and lawful attorneys-in-fact and agents, with full power of substitution and resubstitution, for him or her and in his or her name, placeand stead, in any and all capacities, to sign any and all amendments to this Annual Report on Form 10-K forthe calendar year ended December 31, 2007, and to file the same, with all exhibits thereto and otherdocuments in connection therewith, with the Securities and Exchange Commission, granting unto saidattorneys-in-fact and agents, and each of them, full power and authority to do and perform each and every actand thing requisite or necessary to be done, as fully to all intents and purposes as he might or could do inperson, hereby ratifying and confirming all that said attorneys-in-fact and agents or any of them, or their or hissubstitute or substitutes, may lawfully do or cause to be done by virtue hereof.
Pursuant to the requirements of the Securities Exchange Act of 1934, this Report has been signed belowby the following persons on behalf of the Registrant and in the capacities indicated as of the date indicated.
Signatures Title Date
/s/ Jeffrey C. Sprecher
Jeffrey C. Sprecher
Chairman of the Board and ChiefExecutive Officer
(principal executive officer)
February 13, 2008
/s/ Scott A. Hill
Scott A. Hill
Senior Vice President,Chief Financial Officer
(principal financialand accounting officer)
February 13, 2008
/s/ Charles R. Crisp
Charles R. Crisp
Director February 13, 2008
/s/ Fredrick W. Hatfield
Fredrick W. Hatfield
Director February 13, 2008
/s/ Jean-Marc Forneri
Jean-Marc Forneri
Director February 13, 2008
/s/ Terrence F. Martell
Terrence F. Martell
Director February 13, 2008
/s/ Sir Robert Reid
Sir Robert Reid
Director February 13, 2008
151

Signatures Title Date
/s/ Frederic V. Salerno
Frederic V. Salerno
Director February 13, 2008
/s/ Richard L. Sandor
Richard L. Sandor, Ph.D.
Director February 13, 2008
/s/ Fred W. Schoenhut
Fred W. Schoenhut
Director February 13, 2008
/s/ Judith A. Sprieser
Judith A. Sprieser
Director February 13, 2008
/s/ Vincent Tese
Vincent Tese
Director February 13, 2008
152

FINANCIAL STATEMENT SCHEDULE
INTERCONTINENTALEXCHANGE, INC. AND SUBSIDIARIES
SCHEDULE II — CONSOLIDATED VALUATION AND QUALIFYING ACCOUNTSYears Ended December 31, 2007, 2006 and 2005
Description
Balance atBeginning of
Year
AdditionsCharged toCosts and
Expenses(1) Deductions(2)Balance at
End of Year(In thousands)
Year Ended December 31, 2007:
Allowance for doubtful accounts . . . . . . . . $985 $ 199 $(814) $ 370
Deferred income tax valuation allowance. . $ — $2,718 $ — $2,718
Year Ended December 31, 2006:
Allowance for doubtful accounts . . . . . . . . $261 $1,034 $(310) $ 985
Year Ended December 31, 2005:
Allowance for doubtful accounts . . . . . . . . $171 $ 189 $ (99) $ 261
(1) Additions charged to costs and expenses for the allowance for doubtful accounts are based on our histori-cal collection experiences and management’s assessment of the collectibility of specific accounts. Addi-tions to the deferred income tax valuation allowance relate to state research and development tax creditswhich the Company does not expect to realize. This column also includes the foreign currency translationadjustments.
(2) Deductions represent the write-off of uncollectible receivables, net of recoveries.
153

INDEX TO EXHIBITS
The following exhibits are filed with this Report. We will furnish any exhibit upon request toIntercontinentalExchange, Inc., Investor Relations, 2100 RiverEdge Parkway, Suite 500, Atlanta, Georgia30328.
ExhibitNumber Description of Document
2.1 — Merger Agreement, dated September 14, 2006, among IntercontinentalExchange, Inc., Board ofTrade of the City of New York, Inc., and CFC Acquisition Co., including the forms of certificate ofincorporation and bylaws of the surviving corporation which are Exhibits A and B to the MergerAgreement (incorporated by reference to Exhibit 2.1 to ICE’s registration statement on Form S-4,filed with the SEC on November 16, 2006, File No. 333-138312).
2.2 — First Amendment to Merger Agreement, dated as of October 30, 2006, amongIntercontinentalExchange, Inc., Board of Trade of the City of New York, Inc., and CFC AcquisitionCo. (incorporated by reference to Exhibit 2.2 to ICE’s registration statement on Form S-4, filed withthe SEC on November 16, 2006, File No. 333-138312).
3.1 — Fourth Amended and Restated Certificate of Incorporation of IntercontinentalExchange, Inc.(incorporated by reference to Exhibit 3.1 to ICE’s Annual Report on Form 10-K, filed with the SECon March 10, 2006, File No. 001-32671).
3.2 — Amended and Restated Bylaws of IntercontinentalExchange, Inc. (incorporated by reference toExhibit 3.2 to ICE’s Annual Report on Form 10-K, filed with the SEC on March 10, 2006, FileNo. 001-32671).
10.1 — Employment Agreement, dated as of September 27, 2004, between IntercontinentalExchange, Inc.and Jeffrey C. Sprecher (incorporated by reference to Exhibit 10.1 to ICE’s registration statementon Form S-1, filed with the SEC on October 25, 2005, File No. 333-123500).
10.2 — Employment Agreement, dated as of April 14, 2003, between IntercontinentalExchange, Inc. andCharles A. Vice (incorporated by reference to Exhibit 10.2 to ICE’s registration statement onForm S-1, filed with the SEC on October 25, 2005, File No. 333-123500).
10.3 — Employment Agreement, dated as of April 14, 2003, between IntercontinentalExchange, Inc. andRichard V. Spencer (incorporated by reference to Exhibit 10.3 to ICE’s registration statement onForm S-1, filed with the SEC on October 25, 2005, File No. 333-123500).
10.4 — Employment Agreement, dated as of May 12, 2006, between IntercontinentalExchange, Inc. andDavid S. Goone (incorporated by reference to Exhibit 10.1 to ICE’s Current Report on Form 8-K,filed with the SEC on May 17, 2006, File No. 001-32671).
10.5 — Employment Agreement, dated as of May 9, 2003, between IntercontinentalExchange, Inc. andEdwin D. Marcial (incorporated by reference to Exhibit 10.5 to ICE’s registration statement onForm S-1, filed with the SEC on October 25, 2005, File No. 333-123500).
10.6 — Employment Agreement, dated as of May 24, 2004, between IntercontinentalExchange, Inc. andJohnathan H. Short (incorporated by reference to Exhibit 10.6 to ICE’s registration statement onForm S-1, filed with the SEC on October 25, 2005, File No. 333-123500).
10.7 — IntercontinentalExchange, Inc. 2000 Stock Option Plan (incorporated by reference to Exhibit 10.1 toICE’s Quarterly Report on Form 10-Q, filed with the SEC on May 21, 2007, File No. 001-32671).
10.8 — IntercontinentalExchange, Inc. 2003 Restricted Stock Deferral Plan for Outside Directors(incorporated by reference to Exhibit 10.8 to ICE’s Annual Report on Form 10-K, filed with theSEC on March 10, 2006, File No. 001-32671).
10.9 — IntercontinentalExchange, Inc. 2004 Restricted Stock Plan (incorporated by reference to Exhibit 10.9to ICE’s Annual Report on Form 10-K, filed with the SEC on March 10, 2006, File No. 001-32671).
10.10 — IntercontinentalExchange, Inc. 2005 Equity Incentive Plan (incorporated by reference to Exhibit 10.2to ICE’s Quarterly Report on Form 10-Q, filed with the SEC on May 21, 2007, File No. 001-32671).
10.11 — Amendment and Restatement Agreement, dated as of October 9, 2003, between The LondonClearing House Limited and IntercontinentalExchange, Inc. (incorporated by reference toExhibit 10.12 to ICE’s registration statement on Form S-1, filed with the SEC on October 14, 2005,File No. 333-123500).*
154

ExhibitNumber Description of Document
10.12 — Clearing Services Agreement, dated as of October 2003, between The International PetroleumExchange of London Limited and The London Clearing House Limited (incorporated by referenceto Exhibit 10.13 to ICE’s registration statement on Form S-1, filed with the SEC on October 14,2005, File No. 333-123500).*
10.13 — TRS — Application Services Agreement, dated as of April 25, 2001, between The InternationalPetroleum Exchange of London Limited and LIFFE Services Company Limited (incorporated byreference to Exhibit 10.14 to ICE’s registration statement on Form S-1, filed with the SEC onOctober 14, 2005, File No. 333-123500).*
10.14 — Credit Agreement, dated as of January 12, 2007, among IntercontinentalExchange, Inc. WachoviaBank, National Association, as Administrative Agent, Bank of America, N.A., as SyndicationAgent, and other Lenders named therein (incorporated by reference to Exhibit 10.1 to ICE’s CurrentReport on Form 8-K, filed with the SEC on January 12, 2007, File No. 001-32671).
10.15 — First Amendment to Credit Agreement among IntercontinentalExchange, Inc. and Wachovia Bank,National Association, as Administrative Agent, Bank of America, N.A., as Syndication Agent, andthe Lenders named therein dated as of August 24, 2007 (incorporated by reference to Exhibit 10.1to our Current Report on Form 8-K, filed with the SEC on August 30, 2007, File No. 001-32671).
10.16 — Patent License Agreement, dated as of March 29, 2002, between eSpeed, Inc. andIntercontinentalExchange, Inc. (incorporated by reference to Exhibit 10.16 to ICE’s registrationstatement on Form S-1, filed with the SEC on June 6, 2005, File No. 333-123500).
10.17 — Office Lease, dated as of June 8, 2000, as amended, between CMD Realty Investment Fund IV, L.P.and IntercontinentalExchange, LLC (incorporated by reference to Exhibit 10.17 to ICE’s registrationstatement on Form S-1, filed with the SEC on June 6, 2005, File No. 333-123500).*
10.18 — AT&T Master Agreement (MA Reference No. MA 35708) and Addendum to Master Agreement,dated as of April 8, 2002, between AT&T Corporation and IntercontinentalExchange, Inc.(incorporated by reference to Exhibit 10.19 to ICE’s registration statement on Form S-1, filed withthe SEC on June 13, 2005, File No. 333-123500).
10.19 — Lease of Part (Offices) (WTC/Q/W (Part): 2.18.1, dated April 24, 1996, between ClipperInvestments Limited and The International Petroleum Exchange of London Limited (incorporatedby reference to Exhibit 10.20 to ICE’s registration statement on Form S-1, filed with the SEC onJune 6, 2005, File No. 333-123500).*
10.20 — Resident Member’s Agreement, dated as of December 2, 1983, between St. Katharine-By-The-Tower Limited and Aegis Insurance Services Group Limited (incorporated by reference toExhibit 10.21 to ICE’s registration statement on Form S-1, filed with the SEC on June 6, 2005, FileNo. 333-123500).*
10.21 — Resident Member’s Agreement, dated as of November 28, 1991, between St. Katharine-By-The-Tower Limited and The International Petroleum Exchange of London Limited (incorporated byreference to Exhibit 10.22 to ICE’s registration statement on Form S-1, filed with the SEC onJune 6, 2005, File No. 333-123500).*
10.22 — Lease of Part (Offices) (Suite Ref. 2.17), dated as of April 28, 2003, between Inter One Limited andInter Two Limited and The International Petroleum Exchange of London Limited (incorporated byreference to Exhibit 10.23 to ICE’s registration statement on Form S-1, filed with the SEC onJune 6, 2005, File No. 333-123500).*
10.23 — Deed of Novation, dated July 22, 2005, between The International Petroleum Exchange of LondonLimited, LIFFE Services Limited, Atos Euronext Market Solutions Limited, and LIFFEAdministration and Management (incorporated by reference to Exhibit 10.25 to ICE’s registrationstatement on Form S-1, filed with the SEC on October 14, 2005, File No. 333-123500).
10.24 — Settlement Agreement, dated as of September 1, 2005, by and between EBS Group Limited andIntercontinentalExchange, Inc. (incorporated by reference to Exhibit 10.26 to ICE’s registrationstatement on Form S-1, filed with the SEC on October 14, 2005, File No. 333-123500).
155

ExhibitNumber Description of Document
10.25 — Lease Amendment Six, dated as of October 12, 2005, by and between CMD Realty InvestmentFund IV, L.P. and IntercontinentalExchange, Inc. (incorporated by reference to Exhibit 10.27 toICE’s registration statement on Form S-1, filed with the SEC on October 14, 2005, FileNo. 333-123500).*
10.26 — Form of Registration Rights Agreement by and among IntercontinentalExchange, Inc. and theparties listed in Annex A thereto (incorporated by reference to Exhibit 10.30 to ICE’s registrationstatement on Form S-1, filed with the SEC on October 25, 2005, File No. 333-123500).
10.27 — Contribution and Asset Transfer Agreement, dated as of May 11, 2000, by and betweenIntercontinentalExchange, LLC, Continental Power Exchange, Inc., and Jeffrey C. Sprecher(incorporated by reference to Exhibit 10.31 to ICE’s registration statement on Form S-1, filed withthe SEC on October 25, 2005, File No. 333-123500).
10.28 — First Amendment to Contribution and Asset Transfer Agreement, dated as of May 17, 2000, by andamong IntercontinentalExchange, LLC, Continental Power Exchange, Inc., and Jeffrey C. Sprecher(incorporated by reference to Exhibit 10.32 to ICE’s registration statement on Form S-1, filed withthe SEC on October 25, 2005, File No. 333-123500).
10.29 — Second Amendment to Contribution and Asset Transfer Agreement, dated as of October 24, 2005,by and among IntercontinentalExchange, Inc., Continental Power Exchange, Inc., and Jeffrey C.Sprecher (incorporated by reference to Exhibit 10.33 to ICE’s registration statement on Form S-1,filed with the SEC on October 25, 2005, File No. 333-123500).
10.30 — Lease Amendment Seven, dated as of May 12, 2006, by and between CMD Realty InvestmentFund IV, L.P. and IntercontinentalExchange, Inc. (incorporated by reference to Exhibit 10.2 to ICE’sCurrent Report on Form 8-K, filed with the SEC on May 17, 2006, File No. 001-32671).*
10.31 — Employment Agreement dated as of April 30, 2007, between IntercontinentalExchange, Inc. andScott A. Hill (incorporated by reference to Exhibit 10.1 to ICE’s Current Report on Form 8-K, filedwith the SEC on May 2, 2007, File No. 001-32671).
10.32 — License Agreement For Index-Related Derivative Products dated as of June 15, 2007 betweenIntercontinentalExchange, Inc. and Frank Russell Company (incorporated by reference toExhibit 10.1 to ICE’s Current Report on Form 8-K, filed with the SEC on June 20, 2007, FileNo. 001-32671).*
21.1 — Subsidiaries of IntercontinentalExchange, Inc.
23.1 — Consent of Ernst & Young LLP, Independent Registered Public Accounting Firm.24.1 — Power of Attorney (included with signature page hereto).
31.1 — Rule 13a - 14(a)/15d - 14(a) Certification of Chief Executive Officer.
31.2 — Rule 13a - 14(a)/15d - 14(a) Certification of Chief Financial Officer.
32.1 — Section 1350 Certification of Chief Executive Officer.
32.2 — Section 1350 Certification of Chief Financial Officer.
* Confidential treatment has been previously requested or granted to portions of this exhibit by the SEC.
156


