2007 annual report - sierra wireless
TRANSCRIPT

2 0 0 7 A N N U A L R E P O R T
U N I T E D S T A T E S G A A P
swi_annual_artwork07:sierra wireless 3/13/08 2:43 PM Page 1

swi_annual_artwork07:sierra wireless 3/13/08 2:43 PM Page 2

Consolidated Statements of Operations Data(Expressed in thousands of United States dollars, except per share amounts)(Prepared in accordance with United States generally accepted accounting principles (“GAAP”))
Years ended December 31, 2005 2006 2007
Revenue $ 107,144 $ 221,285 $ 439,903Gross margin 25,296 69,177 123,142Gross margin percentage 23.6% 31.3% 28.0%Gross margin percentage, 35.4% 31.3% 28.0%
excluding restructuring costs and inventory writedownsTotal expenses 64,986 63,589 84,566 Net earnings (loss) (36,468) 9,796 32,459 Diluted earnings (loss) per share (1.44) 0.38 1.16
Revenue by productAirCards 70% 71% 71%Embedded modules 13% 24% 21%Mobile and M2M 13% 3% 6%Other 4% 2% 2%
100% 100% 100%
Revenue by geographic regionAmericas 69% 64% 69%Europe, Middle East and Africa ("EMEA") 12% 17% 12%Asia-Pacific 19% 19% 19%
100% 100% 100%
Consolidated Balance Sheets Data(Expressed in thousands of United States dollars, except number of shares)(Prepared in accordance with United States GAAP)
December 31, 2006 2007
Cash, including short-term and long-term investments $ 86,992 $ 196,361Working capital 111,841 211,728Long-term liabilities 1,992 858Total shareholders' equity 152,832 295,324Number of common shares outstanding 25,708,331 31,334,617
Financial Highlights
Financial Highlights 01
swi_annual_artwork07:sierra wireless 3/13/08 2:43 PM Page 3
While driving significantly improved operating results, we also diversified our business with the acquisition of AirLink Communi-cations and bolstered our strategic transaction capacity with a new equity issue. We believe that our business momentum,combined with a diversified product line up and fortified balancesheet, has set the stage for continued growth in 2008.
New Products And New TechnologiesDrive our Business Our revenue growth was driven by the launch of nine new productsfor both UMTS/HSPA and CDMA EV-DO Rev A networks. We beganshipping our next generation HSUPA PC cards, ExpressCards and embedded modules and also introduced our HSUPA USBmodems, all of which offer significant speed advantages over our earlier HSDPA AirCards. New HSUPA networks and productsmake it easier for users to send email attachments, upload information and transmit data from mobile computing devices.We also expanded our CDMA EV-DO Rev A product portfolio with the addition of Rev A ExpressCards and USB modems.
AirCards Revenue from our AirCard products more than doubled in 2007on the strength of our next generation AirCard sales and thelaunch of successful new form factors. In particular, sales of ournew USB modems, which began shipping commercially in the firstquarter, significantly exceeded our expectations. Plugging directlyinto the USB port of a laptop or PC, these user-friendly, wirelessmodems received wide spread customer acceptance and furtherincreased our penetration into mainstream retail channels. Our USB modems went on to capture approximately 45% of our total AirCard sales in 2007.
Embedded ModulesSales of our embedded modules also expanded in 2007, growing76% year-over-year as we introduced next-generation productsand secured new design wins. We have embedded module design wins with several PC original equipment manufacturer(OEM) customers including HP, Fujitsu and NEC across multiple
generations of both CDMA EV-DO and HSPA technologies. We also continue to have a strong position with our vertical OEMcustomers that include Cisco Systems, Ericsson, Digi and othersfor fixed wireless terminal and router solutions. While competitionin the PC OEM market has intensified, we believe there are manycustomer and segment opportunities to help us continue to drive growth in our OEM business.
Mobile and M2M ProductsOver a decade ago, Sierra Wireless got its start developing mobile solutions for industrial and public safety applications. In 2007, we increased our focus on this high-margin segmentwith our acquisition of AirLink Communications.
AirLink not only brought us an expanded line of high-value fixedand mobile wireless data solutions for industrial and public safetyapplications, it also provided entry into the compelling machine-to-machine (M2M) market. The acquisition was instrumental in boosting sales from our Mobile and M2M segment by 263% year over year, and following a smooth integration, was quicklyaccretive to earnings.
Going forward, we plan to continue investing in the Mobile andM2M segment. We believe this market offers fertile ground forprofitable growth due to its fragmented nature, and we see opportunities to expand via new products and segments, geographical diversification and potential M&A transactions.
Worldwide GrowthOur momentum with new products and technologies led the way to record revenue in each of our three geographic regions in 2007. In the Americas, we increased sales by 114% to $302.6 million, as we launched next generation products andform factors with carrier partners like AT&T, Sprint and Verizon. In Europe, sales grew 40% year over year to $53.7 million dueprimarily to increased sales of our HSPA AirCard products to carriers like Telefonica, O2 and Bouygues. We also achieved significant growth in the Asia-Pacific region, more than doublingrevenue to $83.6 million. Important milestones in this region included strong growth in Australia with Telstra and the launch of our first commercial products in Japan.
Report to Shareholders
2007 was a year of continued strong revenue growth and improving profitability for Sierra Wireless. Building on our very strong 2006 performance, in 2007 we grew revenue by 99% to a record $439.9 million and increased net earnings by 231% to $32.5 million.
02 Report to Shareholders
swi_annual_artwork07:sierra wireless 3/13/08 2:43 PM Page 4

Profitable Growth in a Competitive EnvironmentOur industry is in the midst of a transition from a niche, low-volumebusiness focused primarily on corporate and industrial users, to amainstream, high-volume segment increasingly serving consumers,in addition to traditional business users. This new environment offers the potential for strong revenue growth, but it also bringsadded competition and the challenge of maintaining solid margins.In recent months we have faced the added pressure of a challenging component supply environment.
Despite these challenges, we held our gross margin percentageat a solid 28.0% in 2007. Disciplined selling prices, the balancingof our product mix with higher-margin products and solid productcost reductions were all key contributors to this achievement.Paired with strong revenue growth and disciplined operating expense management, our solid gross margin performance resulted in a record, seven-fold increase in earnings from operationsin 2007 compared to 2006 and an improved operating marginfrom 2.5% in 2006 to 8.8% in 2007.
Looking ForwardAt the close of a successful year, I thank our employees for theirpassion for making superb products and their commitment to excellent business execution. It is these qualities that keep us out in front of the competition. I also thank our customers, share-holders and board of directors for their continued confidence in,and support of, Sierra Wireless.
As we look forward to 2008, we are encouraged by the stronggrowth in our market segments, our proven ability to execute in a competitive environment and the strategic opportunities that lay ahead. Overall, our expectations for 2008 are for continuedrevenue growth, improving profitability and further business diversification.
Jason W. CohenourPresident and Chief Executive Officer
Certain statements in this report that are not based on historical facts constitute forward-looking statements or forward-looking information within the meaning of applicable securities laws (“forward-looking statements”). These forward-looking statements are not promises or guarantees of future performance but are only predictions that relate to future events, conditions or circumstances or our future results, performance, achievements or develop-ments and are subject to substantial known and unknown risks, assumptions,uncertainties and other factors that could cause our actual results, performance,achievements or developments in our business or in our industry to differ materially from those expressed, anticipated or implied by such forward-lookingstatements. Forward-looking statements include all disclosure regarding possibleevents, conditions, circumstances or results of operations that are based on assumptions about future economic conditions, courses of action and other future events. We caution you not to place undue reliance upon any such forward-looking statements, which speak only as of the date they are made.These forward-looking statements appear in a number of different places in thisreport and can be identified by words such as “may”, “estimates”, “projects”,“expects”, “intends”, “believes”, “plans”, “anticipates”, or their negatives orother comparable words. Forward-looking statements include statements regarding the outlook for our future operations, plans and timing for the intro-duction or enhancement of our services and products, statements concerningstrategies or developments, statements about future market conditions, supply conditions, end customer demand conditions, channel inventory and sell through, revenue, gross margin, operating expenses, profits, forecasts offuture costs and expenditures, the outcome of legal proceedings, and other expectations, intentions and plans that are not historical fact. The risk factorsand uncertainties that may affect our actual results, performance, achieve-ments or developments are many and include, amongst others, our ability todevelop, manufacture, supply and market new products that we do not producetoday that meet the needs of customers and gain commercial acceptance, our reliance on the deployment of next generation networks by major wirelessoperators, the continuous commitment of our customers, and increased competition. These risk factors and others are discussed in our Annual Information Form, which may be found on SEDAR at www.sedar.com and in our other regulatory filings with the Securities and Exchange Commission in the United States and the Provincial Securities Commissions in Canada. Many of these factors and uncertainties are beyond the control of the Company.Consequently, all forward-looking statements in this report are qualified by this cautionary statement and there can be no assurance that actual results,performance, achievements or developments anticipated by the Company willbe realized. Forward-looking statements are based on management’s currentplans, estimates, projections, beliefs and opinions and the Company does notundertake any obligation to update forward-looking statements should the assumptions related to these plans, estimates, projections, beliefs and opinions change.
Report to Shareholders 03
swi_annual_artwork07:sierra wireless 3/13/08 2:43 PM Page 5

The following discussion of our consolidated financial condition and results of operations, as of March 24, 2008, has been prepared in accordance with accounting principles generally accepted in the United States (“GAAP”) and, except where otherwise specifically indicated, all amounts are expressed inUnited States dollars.
Additional information related to Sierra Wireless, Inc., including our Annual Information Form, may be found on SEDAR at www.sedar.com and on EDGAR at www.sec.gov.
OverviewWe provide leading edge wireless wide area modem solutions for the mobile computing, rugged mobile and machine-to-machine(“M2M”) markets. We develop and market a range of productsthat include wireless modems for mobile computers, embeddedmodules for original equipment manufacturers, or OEMs, and high value fixed and mobile wireless data solutions for industrial,commercial and public safety applications. We also offer professional services to OEM customers during their product development, leveraging our expertise in wireless design and integration to provide built-in wireless connectivity for notebookcomputers and other mobile computing devices. Our productsand solutions connect people, their mobile computers and fixedterminals to wireless voice and mobile broadband networksaround the world.
We believe that wide area wireless for mobile computing and wireless M2M are both rapidly growing markets. We believe thatthe key growth enablers for these markets include the continueddeployment of mobile broadband networks around the world, aggressive promotion of mobile broadband services by wirelessoperators, attractive mobile broadband rate plans, growing customer awareness of mobile broadband and compelling returnon investment rationale for users.
Our mobile computing products are used by businesses, consumers and government organizations to enable high speedwireless access to a wide range of applications, including the Internet, e-mail, corporate intranet, remote databases and corporate applications. Our rugged mobile and M2M products are primarily used in the public safety, oil & gas, utility, mobiledata, transportation and transaction processing markets. We sell our products primarily through indirect channels, including wireless operators, value added resellers and OEMs.
During 2006, we launched eight new products, including ourUMTS/HSPA AirCard® 875, UMTS/HSPA MC8775 embeddedmodule, EV-DO Revision A AirCard 595 and EV-DO Revision AMC5725 embedded module. These new product launches contributed significantly to our annual revenue of $221.3 millionfor 2006. We also expanded our global channels of distribution,
adding important wireless operator channels like Orange, O2,Telefonica and Telstra, while solidifying our position with key existing customers such as AT&T (formerly Cingular Wireless),Sprint and Verizon. We also expanded our OEM channels and bythe end of 2006 had design wins with twelve PC OEM customersacross multiple airlinks.
In 2007, we achieved record annual revenue of $439.9 million,driven by the launch of nine new products for both UMTS/HSPAand CDMA EV-DO Rev A networks across all of our product lines.We expanded our product footprint with key existing customerssuch as AT&T, Sprint and Verizon and significantly grew our European and Asia Pacific business, while maintaining profitability.Specific product development and business development initiatives of 2007 are described in more detail on pages 5 and 6.
On May 25, 2007, we completed the acquisition of AirLink Communications, Inc. (“AirLink”), a privately held developer andsupplier of high value fixed and mobile wireless data solutions.The acquisition is consistent with our strategy of renewing andstrengthening our emphasis on higher gross margin products and solutions. The acquisition of AirLink also strengthens our position in the rugged mobile and M2M segments, both of whichrepresent potentially high growth opportunities. We paid cash consideration of $12.0 million and issued approximately 1.3 million common shares of Sierra Wireless to the shareholdersof AirLink. Our fourth quarter 2007 consolidated results includemobile and M2M revenue of $11.2 million, of which $9.5 millioncame from the acquired AirLink business.
On October 2, 2007, we closed our bought deal common shareoffering (the “Offering”) of 3,500,000 common shares at a priceof US$22.40 per share. Under the Offering, which included300,000 shares issuable upon the exercise by the underwritersof the over-allotment option, we sold 3,800,000 common sharesfrom treasury. Gross proceeds of this Offering were $85.1 millionand net proceeds were $80.9 million. We expect to use the netproceeds from the Offering for general corporate purposes,working capital and potential future acquisitions.
In 2007, our revenue increased 99% to $439.9 million, comparedto $221.3 million in 2006. Gross margin in 2007 was 28.0%,compared to 31.3% in 2006. Earnings from operations in 2007were $38.6 million, or 8.8% of revenue, compared to $5.6 million,or 2.5% of revenue in 2006. Net earnings increased 231% to$32.5 million, or diluted earnings per share of $1.16 in 2007,compared to net earnings of $9.8 million, or diluted earnings per share of $0.38 in 2006. Net earnings for 2007 include stock-based compensation expense of $5.2 million, compared to $3.8 million in 2006.
Management’s Discussion and Analysis of Financial Condition and Results of Operations
04 Management’s Discussion and Analysis
swi_annual_artwork07:sierra wireless 3/13/08 2:43 PM Page 6

Our balance sheet remains strong, with $196.4 million of cash,cash equivalents and short and long-term investments at December 31, 2007, compared to $87.0 million at December31, 2006. For the year ended December 31, 2007, cash of$48.8 million was provided by operations, compared to cashused by operations of $8.1 million in the same period of 2006.
Key factors that we expect will affect our revenue in the nearterm are the availability of components from key suppliers, timing of deployment of mobile broadband networks by wirelessoperators, technology transitions in both CDMA EV-DO andUMTS/HSPA, the relative competitive position our products havewithin the wireless operators’ sales channels in any given period,the rate of adoption by end-users, the timely launch and ramp upof sales of our new products currently under development, thelevel of success OEMs achieve with sales of embedded solutionsto end customers and our ability to secure future design wins withboth existing and new OEM customers. We expect that productand price competition from other wireless communications devicemanufacturers will continue to be intense. As a result of these factors, we may experience volatility in our results on a quarter-to-quarter basis.
We launched many new products during 2006 and 2007. Our rejuvenated product line, expanded roster of sales channels, the addition of AirLink and strong market growth underpin our expectation of solid revenue growth and continued profitability in2008. Specific product development and business developmentinitiatives of 2007 include:
AIRCARD PRODUCTS
PC Cards: In North America, we continued to have a strong position with AT&T with shipments of our UMTS/HSDPA AirCard 875 and with the launch of our HSUPA AirCard 881 in the third quarter of 2007. HSUPA AirCards offer significant speedadvantages over our HSDPA AirCards with a maximum theoreticaldownlink speed of up to 7.2 Mbps and uplink speed of up to 2 Mbps. During 2007, we maintained a solid position at Sprintwith sales of our CDMA EV-DO Rev A AirCard 595, continued shipping the AirCard 595 to Verizon and commenced shipmentsof this product to Telus in Canada in the first quarter of 2007. We also began shipping our new CDMA EV-DO Rev A ExpressCards, built for notebook computers with ExpressCard expansion slots, to Sprint during the second quarter of 2007 and to Telus in the third quarter of 2007.
In Europe, we continued to supply our UMTS/HSPA PC cards toseveral wireless operators in the UK, France, Switzerland, Spainand to several other operators in the EMEA region. We launchedour HSUPA ExpressCards with Bouygues Telecom in France in the fourth quarter of 2007.
In the Asia-Pacific region, we began shipments of our CDMA EV-DO Rev A ExpressCards to Telecom New Zealand in the second quarter of 2007 and began shipments of our HSUPA ExpressCard to Telstra in the third quarter of 2007.
USB Wireless Modems: Our USB wireless modems plug intothe USB ports of both notebook and desktop computers. Late inthe first quarter of 2007, we began commercial shipments of our AirCard 875U for HSDPA networks. In the second quarter of2007, we began commercial shipments of our AirCard 595U forEV-DO Rev A networks to Sprint and our AirCard 875U for HSDPAnetworks to AT&T and to O2 in the UK. We also launched our AirCard 595U with Telecom New Zealand and Telus. In the thirdquarter of 2007, we began commercial shipments of our AirCard595U to Verizon Wireless. We also introduced our USB modemsfor HSUPA networks and commenced commercial shipments toTelstra in the third quarter of 2007. In the fourth quarter of 2007,we began shipping our HSUPA USB modem to AT&T. We also introduced our new HSUPA USB modem, the Apex 880, which is smaller than previous models, has an innovative new designand features, and is expected to be available for shipping in thesecond quarter of 2008. We believe that form factor design is an important differentiator among USB products. We expect that thetiming of the introduction of new USB form factors by ourselvesand our competitors may lead to volatility in our revenue on aquarterly basis, as new form factors enter the market at differenttimes.
In 2007, sales of our AirCard products increased 102% to$315.9 million, compared to $156.5 million in 2006. The majorityof this growth came from the sale of USB wireless modems,which generated $141.0 million of revenue in 2007. Continuedsuccess with our AirCard products will depend in part on our ability to develop AirCard products that meet our customers’evolving design, schedule and price requirements.
EMBEDDED MODULES
We have two types of embedded module customers, notebookcomputer manufacturers (“PC OEM”) and non-PC OEM customerswho provide solutions for a variety of applications, including fixedwireless terminal solutions (“vertical OEM”).
We currently have embedded module design wins with twelve PC OEM customers, including Lenovo, HP, Panasonic, Fujitsu-Siemens Computers, ASUSTeK Computers, Dialogue TechnologyCorp., Flipstart Labs and Itronix, a division of General Dynamics.Our design wins span multiple generations of both CDMA EV-DOand HSDPA/HSUPA technologies. Ten of our PC OEM customerscurrently have commercially available products featuring our embedded mobile broadband solutions. PC OEM customersaward design wins for the integration of wide area wireless embedded modules on a platform by platform basis. While wehave been successful securing many design wins, we are notguaranteed future design wins. We expect that the PC OEM market will become more competitive in 2008 with the entranceof both Ericsson and Qualcomm Gobi solutions for PC OEMs.
Management’s Discussion and Analysis 05
swi_annual_artwork07:sierra wireless 3/13/08 2:43 PM Page 7

We believe that the Gobi solution could lower the barriers to market entry for new competitors, including potential price leaders.Our ability to secure new design wins will depend on being successful in developing products and offering services that meetour customers’ design, schedule and price requirements.
We introduced our MC8780/8781 embedded modules for HSUPAnetworks during the first quarter of 2007 and began commercialshipments in the third quarter of 2007. During the fourth quarterof 2007, Fujitsu launched notebook platforms incorporating ournew HSUPA modules in Hong Kong on SmarTone-Vodafone and in Japan on the NTT DoCoMo network. Our launch with Fujitsu on NTT DoCoMo marks our initial commercial entry into theJapanese market.
We continue to have a solid position with our vertical OEM customers. In the first quarter of 2007, we announced that CiscoSystems selected our embedded modules for its Integrated Service Routers for enterprise disaster recovery and rapid deployment applications. We also have design wins with Ericsson,Digi and others for fixed wireless terminal and router solutions.We believe that there are good growth opportunities in the vertical OEM market and are investing to expand our position.
In 2007, sales of our embedded module products increased 76% to $91.2 million, compared to $51.9 million in 2006. Of the$91.2 million, approximately $53.3 million was from sales to PC OEMs and $37.9 million was from sales to vertical OEMs.
RUGGED MOBILE AND M2M PRODUCTS
Our rugged mobile products are sold to public safety and fieldservice organizations and are among our highest gross marginproducts. We experienced a decline in sales of products in this segment in 2006 as a result of not offering 3G products to our customers. Late in the first quarter of 2007, we began initial commercial shipments of both our MP 595 for EV-DO Rev Anetworks and MP 875 for UMTS/HSPA 3.6 Mbps networks. The MP 595 is now certified for use on the Sprint Mobile Broad-band Network and Verizon network and the MP 875 is certifiedfor use on AT&T’s BroadbandConnect network. We completed the acquisition of AirLink on May 25, 2007. During the secondquarter of 2007, AirLink introduced the PinPoint X and Raven X, a new line of intelligent modems. Both of these products havebeen certified and are commercially available for use on the Verizon Wireless and Bell Mobility EV-DO Rev A networks. Duringthe fourth quarter, we introduced the Raven XT, a more compactmodel with increased processing power that is expected to begin commercial shipments in the first quarter of 2008.
With the launch of our new rugged mobile products and the addition of AirLink’s high value fixed and mobile wireless data solutions for industrial and public safety applications, we expectthe rugged mobile and M2M segments of our business to growand positively impact our financial results.
Results of OperationsThe following table sets forth our operating results for the threeyears ended December 31, 2007, expressed as a percentage ofrevenue:
Years ended December 31, 2005 2006 2007
Revenue 100.0% 100.0% 100.0%Cost of goods sold 76.4 68.7 72.0Gross margin 23.6 31.3 28.0Expenses
Sales and marketing 14.5 6.2 5.0Research and development 28.3 15.4 9.8Administration 10.1 5.8 3.5Restructuring and other charges 4.9 — —Amortization 2.8 1.4 0.9
60.6 28.8 19.2Earnings (loss) from operations (37.0) 2.5 8.8
Other income 2.1 2.4 1.1Net earnings (loss) before
income taxes (34.9) 4.9 9.9
Income tax expense (recovery) (0.9) 0.5 2.5Net earnings (loss) (34.0)% 4.4% 7.4%
Our revenue by product, by distribution channel and by geographi-cal region is as follows:
Years ended December 31, 2005 2006 2007
Revenue by productAirCards 70% 71% 71%Embedded modules 13 24 21Mobile and M2M 13 3 6Other 4 2 2
100% 100% 100%Revenue by distribution channel
Wireless carriers 47% 49% 60%PC OEM 6 13 12Other OEM 8 12 8Resellers 38 25 20Direct and other 1 1 —
100% 100% 100%
Revenue by geographical region
Americas 69% 64% 69%Europe, Middle East and Africa (“EMEA”) 12 17 12Asia-Pacific 19 19 19
100% 100% 100%
06 Management’s Discussion and Analysis
swi_annual_artwork07:sierra wireless 3/13/08 2:43 PM Page 8
Results of Operations – Year Ended December 31, 2007 Compared to Year Ended December 31, 2006RevenueRevenue amounted to a record $439.9 million for the year ended December 31, 2007, compared to $221.3 million in thesame period of 2006, an increase of 99%. The increase in yearover year revenue was primarily a result of the launch of our new mobile broadband USB modems, an increase in sales of embedded modules and the addition of mobile and M2M productrevenue from the AirLink acquisition.
Our revenue from customers in the Americas, EMEA and the Asia-Pacific region comprised 69%, 12% and 19%, respectively,of our total revenue in 2007, compared to 64%, 17% and 19%,respectively, in 2006. Our North American business increased by114% compared to 2006 primarily as a result of an increase insales of our UMTS/HSPA and CDMA EV-DO Rev A PC cards andUSB modems and sales of our M2M products from the AirLink acquisition. In Europe, revenue increased by 40% compared to2006 primarily as a result of higher sales of our UMTS/HSPA PCcards and USB modems and sales of embedded modules to OEMcustomers. Our business in the Asia-Pacific region has increased103% in 2007, compared to 2006, due primarily to an increasein sales of our UMTS/HSPA USB modems and PC cards andsales of embedded modules to PC OEM customers.
In 2007, AT&T (formerly Cingular Wireless) and Sprint each accounted for more than 10% of our revenue and, in the aggregate, these two customers represented approximately 44% of our revenue. In 2006, AT&T and Sprint each accountedfor more than 10% of our revenue and, in the aggregate, thesetwo customers represented approximately 40% of our revenue.
Recent product launches, combined with a growing market, furtherchannel expansion, the addition of AirLink and new productlaunches underpin our expectation of revenue growth in 2008.
Gross marginGross margin amounted to $123.1 million for the year ended December 31, 2007, or 28.0% of revenue, compared to $69.2 million, or 31.3% of revenue, in the same period of 2006.The decline in gross margin percentage resulted from sales oflower margin USB modems and generally lower margins for ourmobile computing products. This decrease is partially offset bythe mobile and M2M products acquired from AirLink that yieldhigher margins. Gross margin included $0.5 million of stock-based compensation expense in 2007, compared to $0.4 millionin 2006. The overall financial impact of lower percentage grossmargin is more than offset by an increase in the volume of sales.
During 2008, we expect that our gross margin percentage willfluctuate from quarter to quarter depending on product mix, competitive selling prices, our ability to reduce product costs and increased sales volumes.
Sales and marketingSales and marketing expenses were $22.2 million for the yearended December 31, 2007, compared to $13.7 million in thesame period of 2006, an increase of 62%. The increase in salesand marketing costs is due primarily to the costs associated with new product launches, as well as the addition of staff andcosts from the AirLink acquisition. Sales and marketing expenseincluded $0.9 million of stock-based compensation expense in2007, compared to $0.5 million in 2006. Sales and marketingexpenses as a percentage of revenue decreased to 5.0% in2007, compared to 6.2% in 2006, due primarily to the increasein revenue in 2007. While managing sales and marketing expenses relative to revenue, we expect to continue to make selected investments in sales and marketing as we introduce new products, market existing products, expand our distributionchannels and focus on key customers around the world.
Research and developmentResearch and development expenses amounted to $43.0 million for the year ended December 31, 2007, compared to$34.1 million in the same period of 2006, an increase of 26%.The increase is due to the significant investment in new productsbeing developed and launched in both CDMA EV-DO and HSDPA/HSUPA technologies, the addition of staff from the AirLink acquisition, the writedown in carrying value of a software licenseand an increase in repayments of repayable government researchand development funding. Included in research and developmentexpense was $0.9 million of stock-based compensation expensein 2007, compared to $0.7 million in 2006.
Research and development expenses, excluding government research and development funding repayments, were $38.9 million, or 8.8% of revenue for the year ended December 31, 2007,compared to $32.1 million, or 14.5% of revenue in the same period of 2006. The decrease in research and developmentcosts as a percentage of revenue is primarily due to the increasein revenue in 2007.
We expect research and development expenses to grow during2008 as we continue to invest in new product development.
AdministrationAdministration expenses amounted to $15.4 million, or 3.5% ofrevenue, for the year ended December 31, 2007, compared to$12.9 million, or 5.8% of revenue, in the same period of 2006.The increase in administration costs is primarily due to an increasein costs to support our corporate growth, the addition of stafffrom the AirLink acquisition and $2.9 million of stock-based compensation in 2007, compared to $2.2 million in 2006. This increase is partially offset by the recovery of legal costs of $0.6 million in the second quarter of 2007.
Management’s Discussion and Analysis 07
swi_annual_artwork07:sierra wireless 3/13/08 2:44 PM Page 9

Other income Other income was $4.8 million in 2007, compared to $5.3 millionin 2006. Other income includes interest income, interest expenseand foreign exchange gains and losses. The decrease is primarilydue to a foreign exchange loss of $0.4 million in 2007, comparedto a gain of $0.9 million in 2006. This decrease was partially off-set by an increase in interest income resulting from an increaseduring 2007 in our cash and short and long-term investments.
Income tax expense Income tax expense was $10.9 million in 2007, compared to$1.0 million in 2006. The increase in income tax expense is dueto an increase in taxable income in 2007 and the reduction ofavailable loss carry forwards.
Net earningsOur net earnings amounted to $32.5 million, or diluted earningsper share of $1.16, for the year ended December 31, 2007,compared to net earnings of $9.8 million, or diluted earnings per share of $0.38, in the same period of 2006. Included in netearnings is $5.2 million of stock-based compensation in 2007,compared to $3.8 million in 2006.
The weighted average diluted number of shares outstanding increased to 28.0 million for the year ended December 31, 2007,compared to 25.9 million in 2006. The increase is primarily dueto the issuance of 1.3 million shares for the acquisition of AirLinkCommunications, Inc. on May 25, 2007 and the issuance of 3.8 million shares for our October 2, 2007 public offering.
Results of Operations – Three MonthsEnded December 31, 2007 Compared toThree Months Ended December 31, 2006Revenue amounted to $135.6 million for the three months endedDecember 31, 2007, compared to $68.3 million in the same period of 2006, an increase of 98%. The increase in revenue wasdue primarily to an increase in sales of our UMTS/HSPA andCDMA EV-DO Rev A AirCards, including our new USB modems,sales of embedded modules and the addition of mobile and M2Mrevenue resulting from the AirLink acquisition.
Our revenue from customers in the Americas, EMEA and the Asia-Pacific region comprised 65%, 12% and 23%, respectively,of our total revenue in the fourth quarter of 2007, compared to54%, 24% and 22%, respectively, in the same period of 2006.Our North American business increased by 136% in the fourthquarter of 2007 compared to the prior year primarily as a resultof sales of our UMTS/HSPA and CDMA EV-DO Rev A USBmodems, as well as sales of our M2M products from the AirLinkacquisition. In Europe, revenue increased by 2% in the fourthquarter of 2007, compared to the same period of 2006, primarily as a result of higher sales of our UMTS/HSPA embedded
modules to PC OEM customers. Our business in the Asia-Pacificregion increased 109% in the fourth quarter of 2007, comparedto the same period of 2006, due primarily to an increase in salesof our UMTS/HSPA AirCards and sales of embedded modules to PC OEM customers.
In the fourth quarter of 2007, AT&T and Sprint each accountedfor more than 10% of our revenue and, in the aggregate, thesetwo customers represented approximately 45% of our revenue. In the fourth quarter of 2006, AT&T and Verizon each accountedfor more than 10% of our revenue and, in the aggregate, thesetwo customers represented approximately 37% of our revenue.
Gross margin amounted to $37.8 million in the fourth quarter of 2007, or 27.9% of revenue, compared to $17.8 million, or26.0% of revenue, in the fourth quarter of 2006. Our gross margin increased compared to the prior year mainly as a result of product cost reductions and the addition of the higher marginAirLink products. Stock-based compensation expense included ingross margin for each of the fourth quarters of 2007 and 2006was $0.1 million. We expect that our gross margin percentagewill fluctuate from quarter to quarter depending on product mix,competitive selling prices, our ability to reduce product costs and increased sales volumes.
Operating expenses were $24.5 million in the fourth quarter of2007, compared to $16.4 million in the same period of 2006.This increase reflects the significant research and development investment being made to develop new products as well as $1.4 million of stock-based compensation expense included inthe fourth quarter of 2007, compared to $0.9 million in the same period of 2006.
Net earnings for the fourth quarter increased to $11.5 million in2007, or $0.37 per diluted share, compared to $2.4 million in2006, or $0.09 per diluted share in 2006.
Results of Operations – Year Ended December 31, 2006 Compared to YearEnded December 31, 2005RevenueRevenue was $221.3 million for the year ended December 31,2006, compared to $107.1 million in 2005, an increase of 107%.The increase in revenue was due primarily to increased sales of our UMTS/HSDPA and EV-DO PC Cards through expandedchannels, as well as an increase in sales of our CDMA EV-DO and recently launched UMTS/HSDPA embedded modules to both our PC OEM and traditional OEM customers.
Our revenue from customers in the Americas, EMEA and the Asia-Pacific region comprised 64%, 17% and 19%, respectively,of our total revenue in 2006 and 69%, 12% and 19%, respectively,in 2005. Our North American business increased by 91%
08 Management’s Discussion and Analysis
swi_annual_artwork07:sierra wireless 3/13/08 2:44 PM Page 10

compared to the prior year as a result of sales of our UMTS/HSDPA PC cards, the AirCard 860 and the AirCard 875, andsales of our CDMA EV-DO Rev A AirCard 595. In Europe, revenueincreased by 209%, compared to 2005, as a result of sales ofour UMTS/HSDPA PC cards and embedded modules. In Europe,we launched our AirCard 850 and AirCard 875 with a number ofoperators and resellers. By the end of 2006, we were supplyingUMTS/HSDPA AirCards to debitel in Germany, Bouygues Telecomand Orange in France, O2 and Orange in the UK, Swisscom Mobile and sunrise in Switzerland, Telefonica in Spain and to otheroperators in the region. Our business in the Asia-Pacific region increased 100% in 2006, compared to 2005, due primarily to anincrease in sales to PC OEM customers, as well as AirCard salesto Telstra in Australia.
In 2006, AT&T and Sprint each accounted for more than 10% of our revenue and, in the aggregate, these two customers represented approximately 40% of our revenue. In 2005, thesesame two customers each accounted for more than 10% of ourrevenue and, in the aggregate, these two customers representedapproximately 36% of our revenue.
Gross marginGross margin amounted to $69.2 million, or 31.3% of revenue in 2006, compared to $25.3 million, or 23.6% of revenue in2005. Included in gross margin for 2005 was $12.7 million in restructuring charges. Excluding this amount, gross margin for 2005 amounted to $38.0 million, or 35.4% of revenue. The decline in gross margin percentage resulted primarily from increased product costs of our newer, lower gross margin AirCard products, increased sales of lower margin embeddedmodule products and a reduction in sales of higher marginrugged mobile and legacy AirCard products. Included in grossmargin for 2006 is $0.4 million of stock-based compensation expense, compared to nil in 2005. During 2006, the gross margin on the sale of previously written down Voq product wasnil, compared to $0.5 million in 2005.
Sales and marketingSales and marketing expenses were $13.7 million in 2006, compared to $15.6 million in 2005, a decrease of 11.8%. Sales and marketing expenses declined despite the inclusion of $0.5 million of stock-based compensation expense in 2006 as compared to nil in 2005. Sales and marketing expenses as apercentage of revenue decreased to 6.2% in 2006, compared to 14.5% in 2005, due primarily to the increase in revenue for fiscal 2006, combined with reduced costs resulting from the2005 restructuring and continued cost containment.
Research and development, netResearch and development expenses, net of conditionally repayable government research and development funding,amounted to $34.1 million in 2006, compared to $30.4 million
in 2005, an increase of 12.3%. The increase was due to the significant investment in new products being developed in bothCDMA EV-DO and UMTS/HSDPA technologies. In 2006, eight newproducts were launched compared to four in 2005. In addition,there was an increase in repayments of repayable government research and development funding and the inclusion of $0.7 million of stock-based compensation expense in 2006, comparedto nil in 2005.
Gross research and development expenses, excluding the government research and development funding and repayments,were $32.1 million or 14.5% of revenue in 2006, compared to$30.4 million, or 28.4% of revenue, in the same period of 2005.With the termination of the Voq professional phone initiative inJune 2005, no further government research and developmentfunding is anticipated in the near future.
AdministrationAdministration expenses amounted to $12.9 million, or 5.8% of revenue, in 2006, compared to $10.8 million, or 10.1% of revenue, in 2005. The increase of $2.1 million was primarily due to the inclusion of $2.2 million of stock-based compensation expense in 2006, compared to nil in 2005. In 2005, administration expenses included the provision of $1.0 million for future legal costs related to litigation matters.
Restructuring and other chargesRestructuring and other charges were nil during 2006, comparedto $5.3 million in 2005. During the second quarter of 2005, we exited the Voq professional phone initiative and implementedcertain non-Voq related reductions to our operating expenses andassets. In 2005, we recorded restructuring and other charges of $18.5 million, consisting of inventory writedowns, severancecosts, impairment of fixed, intangible and deferred tax assets,provisions for facilities restructuring, commitments and othercosts related to the restructuring. Of the total amount of $18.5million, $5.3 million was charged to restructuring and othercharges, $12.7 million to cost of goods sold and $0.5 million to income tax expense.
Other incomeOther income increased to $5.3 million in 2006, compared to$2.3 million in 2005. Other income includes interest income, interest expense and foreign exchange gains and losses. This increase was due to an increase in interest income from rising interest rates that was partially offset by a smaller investment balance and an increase in foreign exchange gains. Our foreignexchange gain in 2006 was $0.9 million, compared to a foreignexchange loss of $1.0 million in 2005.
Management’s Discussion and Analysis 09
swi_annual_artwork07:sierra wireless 3/13/08 2:44 PM Page 11

Income tax expense (recovery)Income tax expense was $1.0 million during 2006, compared to an income tax recovery of $0.9 million in 2005. The 2005 income tax recovery, excluding the increase in our deferred tax asset valuation allowance of $0.5 million recognized on therestructuring, was $1.4 million. The income tax expense in 2006was due to an increase in taxable income in 2006, whereas theincome tax recovery in 2005 was a result of the utilization of loss carrybacks to recover income taxes previously paid.
Net earnings (loss)Our net earnings amounted to $9.8 million, or diluted earningsper share of $0.38, in 2006, compared to a net loss of $36.5million, or loss per share of $1.44, in 2005. Our net loss in 2005included restructuring and other charges of $18.5 million and aprovision for future legal costs of $1.0 million. Net earnings for2006 include $3.8 million of stock-based compensation expense,compared to nil in 2005.
The weighted average diluted number of shares outstanding increased to 25.9 million in 2006, compared to 25.4 million in2005 because dilutive securities, such as stock options, are included in the total when we are in a profitable position, as is the case in 2006, but are not included when we are in a loss position, as was the case in 2005.
Acquisition of AirLink Communications,Inc. On May 25, 2007, we acquired 100 percent of the outstandingsecurities of AirLink Communications, Inc. (“AirLink”), a privatelyheld supplier of high value fixed and mobile wireless data solutions for industrial and public safety applications. The resultsof AirLink’s operations have been included in our consolidated financial statements since that date.
The acquisition combined AirLink, a leading provider of fixed,portable and mobile wireless connectivity devices, embeddedsoftware and remote device management software, with SierraWireless, a leading provider of wide area wireless solutions formobile computing. The acquisition was consistent with our strategy of renewing and strengthening our emphasis on highergross margin products and solutions and we believe positions thecombined entity to be a leader in mobile computing as well asrugged, intelligent mobile and M2M connectivity solutions.
The aggregate purchase price was $31.2 million, including cash consideration of $12.0 million, 1,309,880 common sharesvalued at $17.6 million and costs related to the acquisition of$1.6 million. The value of the common shares issued was determined based on the average market price of our commonshares over the two-day period before and after March 6, 2007,which was the date the terms of the acquisition were agreed toand announced.
Income TaxEffective January 1, 2007, we adopted the Financial AccountingStandards Board (“FASB”) Interpretation No. 48, entitled “Accounting for Uncertainty in Income Taxes—An Interpretation of FASB Statement No. 109” (“FIN 48”). This interpretation provides specific guidance on how income tax uncertaintiesshould be reflected in the financial statements. FIN 48 prescribesa recognition threshold and measurement method for the recognition of a tax position taken or expected to be taken in a tax return. Additionally, FIN 48 provides guidance on the derecognition, measurement (according to the more likely thannot criterion), classification, interest and penalties, accounting in interim periods and disclosure requirements for uncertain taxpositions. See discussion in “Critical Accounting Estimates”below.
Upon the adoption of FIN 48, only tax positions that meet themore likely than not recognition threshold at the effective datemay be recognized. We have analyzed our tax positions in accordance with FIN 48 and have concluded that there is no impact to our opening deficit.
Stock-Based CompensationIn 2005, the Board of Directors approved the accelerated vesting of certain “out-of-the-money” stock options previouslygranted under the our stock option plan to participants other than board members and executive officers of the Company. The accelerated vesting of these options had the positive effectof rewarding those eligible participants during a challenging yearas well as reducing the future expense associated with those options as a result of a change in United States GAAP. EffectiveJanuary 1, 2006, we are required to expense the fair value of allstock-based compensation arrangements, including employeestock options, in our financial statements. Prior to January 1,2006, we were only required to provide pro forma disclosure inthe notes to the financial statements of our net income (loss)after the effect of employee stock-based compensation expense.
In aggregate, the vesting of stock options to purchase 175,650common shares, with an exercise price of US$14.25 per shareor greater, were accelerated. The exercise price of the optionswas 25% higher than the market price at the time the Board of Directors approved the accelerated vesting. The options becameexercisable as of November 2005, but would otherwise havevested over time up to December 2008. The term, exercise priceand number of common shares issuable upon exercise remainedunchanged.
Accelerating the vesting of these stock options resulted in expensing approximately $2.3 million in our pro forma note disclosure in 2005.
10 Management’s Discussion and Analysis
swi_annual_artwork07:sierra wireless 3/13/08 2:44 PM Page 12

Contingent Liabilities Sierra Wireless America, Inc., as successor to AirPrime, Inc., was named as a defendant in a class action complaint, filed in theU.S. District Court for the Central District of California, for allegedviolations of federal and state securities laws allegedly occurringprior to the time AirPrime, Inc. was acquired by the Company. The settlement of this litigation was approved by the court in February 2007 and the appeal period, in respect of such decision,has expired. The settlement was recorded in the first quarter of2007 and had no net effect on our income statement.
The Company and certain of its current and former officers were named as defendants in several class action complaints for alleged violations of federal securities laws which were consolidated for pre-trial purposes in the U.S. District Court forthe Southern District of New York. The defendants filed a motionto dismiss on April 7, 2006 and on May 15, 2007 the court dismissed the complaints in their entirety. The appeal period, inrespect of such decision, has expired. This litigation is concluded.During 2005, we determined that it was probable that the legalcosts related to these complaints might exceed our policy retention amount of $1.0 million. Accordingly, we expensed $1.0 million in 2005. Our legal costs totaled approximately $0.4 million, therefore we recorded $0.6 million as a recovery of administration costs in the second quarter of 2007.
We are engaged in other legal actions in the ordinary course ofbusiness and believe that the ultimate outcome of these actionswill not have a material adverse effect on our operating results,liquidity or financial position.
Critical Accounting EstimatesWe prepare our consolidated financial statements in accordancewith accounting principles generally accepted in the United Statesand we make estimates and assumptions that affect the reportedamounts of assets, liabilities, revenue, expenses and the relateddisclosure of contingent liabilities. On an ongoing basis, we evaluate our estimates and judgments, including those related to revenue recognition, adequacy of allowance for doubtful accounts, adequacy of inventory reserve, valuation of goodwilland intangible assets, income taxes, adequacy of warranty reserve, royalty obligations, lease provision, contingencies andstock-based compensation. We base our estimates on historicalexperience, anticipated results and trends and on various other assumptions that we believe are reasonable under the circumstances. By their nature, estimates are subject to an inherent degree of uncertainty. Actual results may differ from our estimates. Senior management has discussed with our audit committee the development, selection and disclosure of accounting estimates used in the preparation of our consolidatedfinancial statements.
Other than the adoption of FIN 48 related to accounting for uncertainty in income taxes disclosed earlier, during the yearended December 31, 2007, we did not adopt any new account-ing policies or make changes to existing accounting policies thathad a material impact on our consolidated financial statements.
The following critical accounting policies affect our more significant estimates and assumptions used in preparing our consolidated financial statements:
– We recognize revenue from sales of products and services upon the later of transfer of title or upon shipment of the product to the customer or rendering of the service, so long as collectibility is reasonably assured. Customers include resellers, original equipment manufacturers, wireless operators and end-users. We record deferred revenue when we receive cash in advance of the revenue recognition criteria being met.
A significant portion of our revenue is generated from sales to resellers. We recognize revenue on the portion of sales to certain resellers that are subject to contract provisions allowing various rights of return and stock rotation, upon the earlier of when the rights have expired or the products have been reported as sold by the resellers.
Revenues from contracts with multiple-element arrangements, such as those including technical support services, are recognized as each element is earned based on the relative fair value of each element and only when there are no undelivered elements that are essential to the functionality of the delivered elements.
Revenue from licensed software is recognized at the inception of the license term and in accordance with Statement of Position 97-2, “Software Revenue Recognition”. Revenue from software maintenance, unspecified upgrades and technical support contracts is recognized over the period such items are delivered or services are provided. Technical support contracts extending beyond the current period are recorded as deferred revenue.
Funding from research and development agreements, other than government research and development arrangements, is recognized as revenue when certain criteria stipulated under the terms of those funding agreements have been met and when there is reasonable assurance the funding will be received. Certain research and development funding will be repayable only on the occurrence of specified future events. If such events do not occur, no repayment would be required. We recognize the liability to repay research and development
Management’s Discussion and Analysis 11
swi_annual_artwork07:sierra wireless 3/13/08 2:44 PM Page 13
funding in the period in which conditions arise that would cause research and development funding to be repayable. Government research and development arrangements are recognized as a reduction of the related expense when the criteria stipulated under the terms of the agreements have been met and when there is reasonable assurance the funding will be received.
– We maintain an allowance for doubtful accounts for estimated losses that may arise if any of our customers are unable to make required payments. We consider the following factors when determining whether collection is reasonably assured: customer credit-worthiness, past transaction history with the customer, insured amounts, if any, current economic industry trends and changes in customer payment terms. If we have no previous experience with the customer, we typically obtain reports from credit organizations to ensure that the customer has a history of paying its creditors. We may also request financial information, including financial statements, to ensure that the customer has the means of making payment. If these factors indicate collection is not reasonably assured, revenue is deferred until collection becomes reasonably assured, which is generally upon receipt of cash. If the financial condition of any of our customers deteriorates, we may increase our allowance.
– We value our inventory at the lower of cost, determined on a first-in-first-out basis, and estimated net realizable value. We assess the need for an inventory writedown and/or an accrual for estimated losses on inventory purchase commitments based on our assessment of estimated market value using assumptions about future demand and market conditions. Our reserve requirements generally increase as our projected demand requirements decrease, due to market conditions, technological and product life cycle changes and longer than previously expected usage periods. If market conditions are worse than our projections, we may further writedown the value of our inventory or increase the accrual for estimated losses on inventory purchase commitments.
– We currently have intangible assets of $17.4 million and goodwill of $32.5 million generated from our acquisition of AirLink in May 2007 and AirPrime in August 2003. Goodwill and intangible assets are assessed for impairment annually, or more often, if an event or circumstance indicates that an impairment loss may have been incurred.
We assessed the realizability of goodwill related to the AirLink reporting unit during the fourth quarter of 2007 and determined that the fair value did not have to be re-computed because the components of the reporting unit had not changed since the fair value computation completed at May 25, 2007, the date of acquisition, the previous fair value amount exceeded the carrying amount of the reporting unit by a substantial margin and no evidence exists to indicate that the current fair value of the reporting unit would be less than its current carrying amount.
We assessed the realizability of goodwill related to the AirPrime reporting unit during the fourth quarter of 2007 and determined that the fair value exceeded the carrying amount of the reporting unit by a substantial margin. Therefore, the second step of the impairment test that measures the amount of an impairment loss by comparing the implied fair market value of the reporting unit goodwill with the carrying amount of the goodwill was not required. There was no impairment of goodwill during 2007 or 2006.
– Effective January 1, 2007, we have adopted the provisions of FIN 48 to account for and report income tax uncertainties. Accordingly, we recognize and measure each tax position related to income tax positions subject to FASB Statement No. 109, “Accounting for Income Taxes” taken or expected to be taken in a tax return. We have reviewed our tax positions to determine which should be recognized and measured them according to the more likely than not threshold requirement in FIN 48. The tax benefits recognized in the financial statements are measured based on the largest benefit that has a greater than fifty percent likelihood of being realized upon ultimate resolution.
If the realization of a tax position is not considered more likely than not, we provide for a valuation allowance. The ultimate realization of our deferred tax assets is dependent upon the generation of future taxable income during the periods in which temporary differences become deductible. We consider projected future taxable income and tax planning strategies in making our assessment. If our assessment of our ability to realize our deferred tax assets changes, we may make an adjustment to our deferred tax assets that would be charged to income.
– We accrue product warranty costs in accrued liabilities to provide for the repair or replacement of defective products. Our accrual is based on an assessment of historical experience and management’s estimates. If there is a change in the quality of our products, we will adjust our accrual accordingly.
– Under license agreements, we are committed to royalty payments based on the sales of products using certain technologies. We recognize royalty obligations as determinable in accordance with agreement terms. Where agreements are
12 Management’s Discussion and Analysis
swi_annual_artwork07:sierra wireless 3/13/08 3:00 PM Page 14

not finalized, we have recognized our current best estimate of the obligation in accrued liabilities. When the agreements are finalized, the estimate will be revised accordingly.
– We recorded a lease provision during 2002 that has been subsequently adjusted as a result of changes in our assumptions used to estimate the net present value of the future cash outflows over the remaining lease period. The estimate was based on various assumptions, including the obtainable sublease rates and the time it would take to find a suitable tenant or for us to use the space. These assumptions are influenced by market conditions and the availability of similar space nearby. As market conditions change, we will adjust our provision accordingly.
– If we are engaged in legal actions, we estimate the range of liability related to pending litigation where the amount and range of loss can be reasonably estimated. We record our best estimate of a loss when the loss is considered probable. As additional information becomes available, we assess the potential liability relating to our pending litigation and revise our estimates.
– Effective January 1, 2006, we recognize stock-based compensation expense for all stock-based compensation awards based on the grant date fair value estimated in accordance with the provisions of FASB Statement No. 123R “Share-Based Payments” (“FAS No. 123R”). Under the fair value recognition provisions of FAS No. 123R, we recognize stock-based compensation expense for those shares expected to vest on a straight-line basis over the requisite service period of the award.
Determining the appropriate fair value model and calculating the fair value of share-based payment awards requires the input of subjective assumptions. The assumptions used in calculating the fair value of share-based payment awards represent management’s best estimates, but these estimates involve inherent uncertainties and the application of manage-ment’s judgment. As a result, if factors change and we use different assumptions, our stock-based compensation expense could be materially different in the future.
Liquidity and Capital ResourcesOperating ActivitiesCash provided by operating activities was $48.8 million in 2007,compared to cash used by operating activities of $8.1 million in2006. The source of cash in operating activities in 2007 primarilyresulted from net earnings of $32.5 million adjusted for non-cashitems of $21.2 million and offset by changes in other operatingassets and liabilities of $4.9 million.
Investing ActivitiesCash used by investing activities was $96.0 million in 2007, compared to $10.3 million in 2006. Cash used by investing activities in 2007 was due primarily to the net cash used in theacquisition of AirLink of $12.1 million. There was also a net useof cash to purchase short and long-term investments, net of maturities, of $72.4 million, compared to $0.4 million in the sameperiod of 2006. Expenditures on fixed and intangible assets were$10.3 million and $1.3 million, respectively, for the year endedDecember 31, 2007, compared to $9.1 million and $1.6 million,respectively, in the same period of 2006. Capital expenditureswere primarily for production and tooling equipment, researchand development equipment, computer equipment and software,while intangible assets were primarily for patents and software licenses.
We do not have any trading activities that involve any type of commodity contracts that are accounted for at fair value but forwhich a lack of market price quotations necessitate the use offair value estimation techniques.
Financing ActivitiesCash provided by financing activities was $84.4 million in 2007,compared to $0.2 million in 2006. The primary source of cash in2007 was from the completion of our bought deal common shareoffering in the United States and Canada on October 2, 2007 that raised gross proceeds of $85.1 million from the sale of 3.8 million common shares at a price of US$22.40 per commonshare. Our net proceeds after commissions and expenses of the offering amounted to approximately $80.9 million. We also received cash from the proceeds on the exercise of stock optionsof $4.6 million in 2007, compared to $1.4 million in 2006, offsetby repayments of long-term debt of $1.1 million in each of 2007and 2006.
As of December 31, 2007, we did not have any off-balance sheet finance or special purpose entities.
Cash RequirementsOur near-term cash requirements are primarily related to fundingour operations, capital expenditures and other obligations discussed below. We believe our cash, cash equivalents andshort and long-term investments of $196.4 million and cash generated from operations will be sufficient to fund our expectedworking capital requirements for at least the next twelve monthsbased on current business plans. Our capital expenditures duringthe first quarter of 2008 are expected to be primarily for research and development equipment, tooling, software licensesand patents. However, we cannot assure that our actual cash requirements will not be greater than we currently expect.
Management’s Discussion and Analysis 13
swi_annual_artwork07:sierra wireless 3/13/08 2:44 PM Page 15

The following table quantifies our future contractual obligations as of December 31, 2007:
Payments due in fiscal Operating Leases
2008 $ 3,6392009 2,9242010 2,9182011 1,4942012 114Total $ 11,089
As of December 31, 2007, we had tax obligations for uncertaintax positions of $4.1 million.
We have entered into purchase commitments totaling approxi-mately $166.1 million with certain contract manufacturers underwhich we have committed to buy a minimum amount of designatedproducts. In certain of these agreements, we may be required toacquire and pay for such products up to the prescribed minimumor forecasted purchases. The terms of the commitment may require us to purchase approximately $166.1 million of productfrom certain contract manufacturers between January 2008 and March 2008.
Sources and Uses of CashWe have an unsecured revolving demand facility for $10.0 millionthat bears interest at prime per annum. The balance at December31, 2007 was nil (2006 — nil).
We have obtained letters of credit to ensure the performance of a third party in accordance with specified terms and conditions.At December 31, 2007, we had $6.0 million outstanding underthese letters of credit. Our obligations under these financial instruments expire in February 2008 and will be replaced by astandby irrevocable letter of credit.
Our business continues to be driven predominantly by short leadtime purchase orders from channels and end customers ratherthan by long-term, large volume commitments. Our customerstypically are under no contractual obligation to purchase our products. If they do not make such purchases, our future operating cash flow will be negatively impacted. We may have arisk of impairment to our liquidity should there be any significantinterruption to our business operations.
The source of funds for our future capital expenditures and commitments includes cash, short and long-term investments, accounts receivable, borrowings and cash from operations, as follows:
– Net cash and short and long-term investments amounted to $196.4 million at December 31, 2007, compared to $87.0 million at December 31, 2006.
– Accounts receivable amounted to $83.0 million at December 31, 2007, compared to $57.4 million at December 31, 2006.
– We have a $10.0 million unsecured revolving demand facility with a Canadian chartered bank that bears interest at prime per annum. At December 31, 2007, there were no borrowings under this facility.
– On October 2, 2007 we closed a bought deal that raised gross proceeds of $85.1 million from the sale of 3.8 million common shares at a price of US$22.40 per share.
Market Risk DisclosureOur risk from currency fluctuations between the Canadian andU.S. dollar is reduced by purchasing inventory, other costs ofsales and many of our services in U.S. dollars. We are exposed toforeign currency fluctuations because a significant amount of ourresearch and development, marketing, and administration costsare incurred in Canada. We monitor our exposure to fluctuationsbetween the Canadian and U.S. dollars.
With respect to operations in Europe and the Asia-Pacific region,we transact business in additional foreign currencies and the potential for currency fluctuations is increasing. As our businessexpands in Europe, we expect that we will be increasingly exposed to risks associated with the Euro. To date we have not entered into any futures contracts. To manage our foreigncurrency risks, we may enter into such contracts should we consider it to be advisable to reduce our exposure to future foreign exchange fluctuations.
Currently, we do not have any hedging activities or derivative instruments.
We have available funds and very little debt, accordingly, we havenot been materially adversely affected by significant interest ratefluctuations.
Related Party TransactionsDuring the year ended December 31, 2007, there were no material related party transactions.
Disclosure ControlsThe Company’s management is responsible for establishing andmaintaining adequate disclosure controls and procedures for theCompany. Our disclosure controls and procedures are designedto ensure that information required to be disclosed in our reportsfiled with securities regulatory authorities is recorded, processed,summarized and reported within prescribed time periods and isaccumulated and communicated to our management, includingour Chief Executive Officer and our Chief Financial Officer, as appropriate, to allow timely decisions regarding required disclosure.
14 Management’s Discussion and Analysis
swi_annual_artwork07:sierra wireless 3/13/08 2:44 PM Page 16
An evaluation was carried out under the supervision of, and with the participation of, our management, including our Chief Executive Officer and our Chief Financial Officer, of the effective-ness of our disclosure controls and procedures as of December31, 2007. Based on that evaluation, our Chief Executive Officerand our Chief Financial Officer have concluded that our disclosurecontrols and procedures were effective to ensure that informationrequired to be disclosed by the Company in the reports it files or submits under applicable securities laws and regulations isrecorded, processed, summarized, and reported within the timeperiods specified thereby.
The Company does not expect that its disclosure controls andprocedures will prevent all error and all fraud, if any. A control procedure, no matter how well conceived and operated, can provide only reasonable, not absolute, assurance that the objectives of the control procedure are met. Because of the inherent limitations in all control procedures, no evaluation of controls can provide absolute assurance that all control issuesand instances of fraud, if any, within the Company have been detected. These inherent limitations include the realities that judgments in decision-making can be faulty, and that breakdownscan occur because of simple error or mistake. Additionally, controls can be circumvented by the individual acts of some persons, by collusion of two or more people, or by managementoverride of the control. The Company considered these limitationsduring the development of its disclosure controls and proceduresand will periodically re-evaluate them to ensure they provide reasonable assurance that such controls and procedures are effective.
Internal Control Over Financial ReportingManagement’s Annual Report on Internal Control Over Financial Reporting
Our management is responsible for establishing and maintainingadequate internal control over financial reporting, as such term isdefined in Rules 13a-15(f) and 15d-15(f) under the U.S. SecuritiesExchange Act of 1934.
Our internal control over financial reporting includes those policies and procedures that: (1) pertain to the maintenance ofrecords that, in reasonable detail, accurately and fairly reflect thetransactions and dispositions of our assets; (2) provide reason-able assurance that transactions are recorded as necessary topermit preparation of financial statements in accordance withgenerally accepted accounting principles, and that our receiptsand expenditures are being made only in accordance with authorizations of our management and directors; and (3) provide
reasonable assurance regarding prevention or timely detection of unauthorized acquisition, use or disposition of our assets that could have a material effect on the financial statements.
Because of its inherent limitations, internal control over financialreporting may not prevent or detect misstatements. Also, projec-tions of any evaluation of effectiveness to future periods are subject to the risk that controls may become inadequate becauseof changes in conditions, or that the degree of compliance withthe policies or procedures may deteriorate.
Under the supervision and with the participation of our Chief Executive Officer and our Chief Financial Officer, managementconducted an evaluation of the effectiveness of our internal control over financial reporting, as of December 31, 2007, based on the framework set forth in Internal Control-IntegratedFramework issued by the Committee of Sponsoring Organizationsof the Treadway Commission (COSO). Based on its evaluationunder this framework, management concluded that our internalcontrol over financial reporting was effective as of that date.
KPMG LLP (“KPMG”), an independent registered public accountingfirm, who audited and reported on our financial statements has issued an attestation report on the effectiveness of our internalcontrol over financial reporting as of December 31, 2007. The attestation report is included on page 26.
Changes in Internal Controls Over Financial Reporting
There have been no changes in our internal controls over financialreporting during 2007 that have materially affected, or are reasonably likely to materially affect, our internal controls over financial reporting. The design of any system of controls and procedures is based in part upon certain assumptions about thelikelihood of certain events. There can be no assurance that any design will succeed in achieving its stated goals under all potential future conditions, regardless of how remote.
Quarterly Results of OperationsThe following tables set forth certain unaudited consolidatedstatements of operations data for each of the eight most recentquarters that, in management’s opinion, have been prepared on a basis consistent with the audited consolidated financial statements contained in our fiscal 2007 Annual Report. The unaudited consolidated statements of operations data presentedbelow reflects all adjustments, consisting primarily of normal recurring adjustments, which are, in the opinion of management,necessary for a fair presentation of results for the interim periods. These operating results are not necessarily indicative of results for any future period. You should not rely on them to predict our future performance.
Management’s Discussion and Analysis 15
swi_annual_artwork07:sierra wireless 3/13/08 2:44 PM Page 17
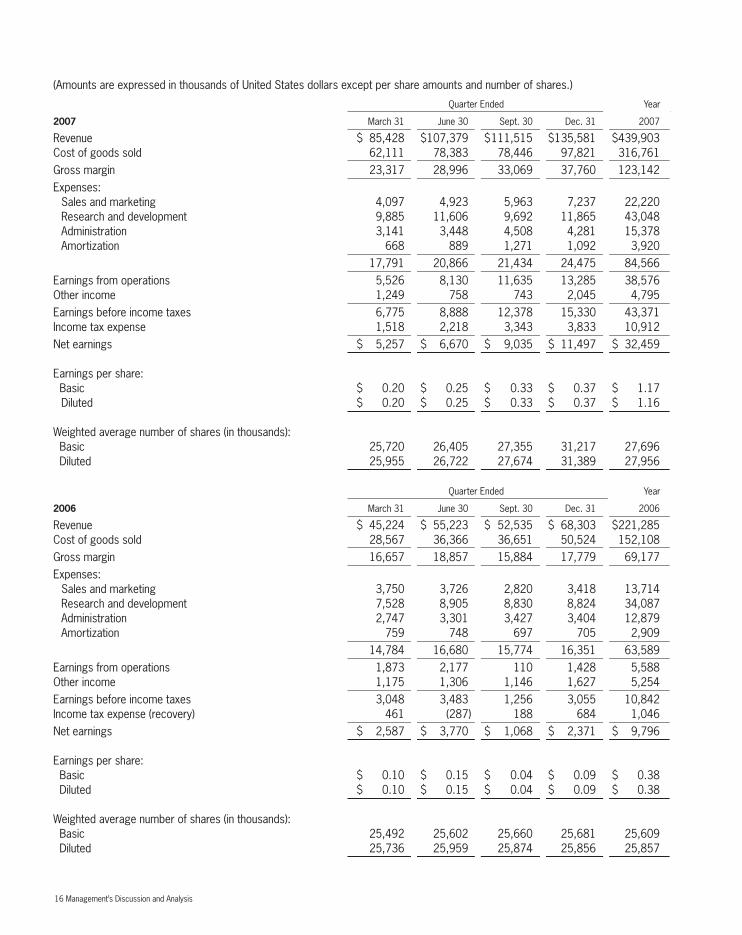
(Amounts are expressed in thousands of United States dollars except per share amounts and number of shares.)
Quarter Ended Year
2007 March 31 June 30 Sept. 30 Dec. 31 2007
Revenue $ 85,428 $107,379 $111,515 $135,581 $439,903Cost of goods sold 62,111 78,383 78,446 97,821 316,761Gross margin 23,317 28,996 33,069 37,760 123,142Expenses:
Sales and marketing 4,097 4,923 5,963 7,237 22,220Research and development 9,885 11,606 9,692 11,865 43,048Administration 3,141 3,448 4,508 4,281 15,378Amortization 668 889 1,271 1,092 3,920
17,791 20,866 21,434 24,475 84,566Earnings from operations 5,526 8,130 11,635 13,285 38,576Other income 1,249 758 743 2,045 4,795Earnings before income taxes 6,775 8,888 12,378 15,330 43,371Income tax expense 1,518 2,218 3,343 3,833 10,912Net earnings $ 5,257 $ 6,670 $ 9,035 $ 11,497 $ 32,459
Earnings per share:Basic $ 0.20 $ 0.25 $ 0.33 $ 0.37 $ 1.17Diluted $ 0.20 $ 0.25 $ 0.33 $ 0.37 $ 1.16
Weighted average number of shares (in thousands):Basic 25,720 26,405 27,355 31,217 27,696Diluted 25,955 26,722 27,674 31,389 27,956
Quarter Ended Year
2006 March 31 June 30 Sept. 30 Dec. 31 2006
Revenue $ 45,224 $ 55,223 $ 52,535 $ 68,303 $221,285Cost of goods sold 28,567 36,366 36,651 50,524 152,108Gross margin 16,657 18,857 15,884 17,779 69,177Expenses:
Sales and marketing 3,750 3,726 2,820 3,418 13,714Research and development 7,528 8,905 8,830 8,824 34,087Administration 2,747 3,301 3,427 3,404 12,879Amortization 759 748 697 705 2,909
14,784 16,680 15,774 16,351 63,589Earnings from operations 1,873 2,177 110 1,428 5,588Other income 1,175 1,306 1,146 1,627 5,254Earnings before income taxes 3,048 3,483 1,256 3,055 10,842Income tax expense (recovery) 461 (287) 188 684 1,046Net earnings $ 2,587 $ 3,770 $ 1,068 $ 2,371 $ 9,796
Earnings per share:Basic $ 0.10 $ 0.15 $ 0.04 $ 0.09 $ 0.38Diluted $ 0.10 $ 0.15 $ 0.04 $ 0.09 $ 0.38
Weighted average number of shares (in thousands):Basic 25,492 25,602 25,660 25,681 25,609Diluted 25,736 25,959 25,874 25,856 25,857
16 Management’s Discussion and Analysis
swi_annual_artwork07:sierra wireless 3/13/08 2:44 PM Page 18

Our quarterly results may fluctuate from quarter to quarter because our operating expenses are determined based on anticipated sales, are generally fixed and are incurred throughouteach fiscal quarter. The impact of significant items incurred during the first three interim periods of each fiscal year are discussed in more detail and disclosed in our quarterly reports on Form 6-K. Items affecting our annual results were as follows:
– Revenue for the year ended 2007 increased significantly compared to the same period of 2006 primarily as a result of the launch of our new mobile broadband USB modems for UMTS/HSPA and CDMA EV-DO Rev A networks, an increase in sales of embedded modules and the addition of mobile and M2M product revenue from the AirLink acquisition. During 2007, gross margin declined primarily as a result of sales of lower margin USB modems and generally lower margins for our mobile computing products. This decrease was partially offset by the mobile and M2M products acquired from AirLink that yield higher margins. The overall financial impact of lower percentage gross margin is more than offset by an increase in the volume of sales. Net earnings in 2007 increased primarily due to increased revenue and continued cost control relative to revenue.
– We completed the acquisition of AirLink on May 25, 2007, the results of which are included in our consolidated financial results from that date forward. During the period from May 25, 2007 to December 31, 2007, AirLink contributed $22.5 million to revenue, at a 51.4% gross margin.
– Revenue in 2006 increased significantly compared to 2005 primarily as a result of several new AirCard and embedded module product introductions and the expansion of our sales channels. During 2006, gross margin declined primarily as a result of increased product cost for our newer AirCard products,higher sales of lower margin embedded module products and lower sales of higher margin rugged mobile products.
– Revenues were lower during the four quarters of 2005 due mainly to a reduction in our embedded module business volumes as a result of the completion of embedded module shipments to palmOne at the end of 2004, reported channel inventory that was already sufficient to meet customer demand in the first quarter of 2005, and increased competition in CDMA EV-DO and EDGE PC cards, including a loss of market share at Verizon Wireless.
– Restructuring and other charges of $18.2 million were incurred in the second quarter of 2005. Included in these charges are inventory writedowns, severance costs, impairment of fixed, intangible and deferred tax assets, provisions for facilities restructuring, commitments and other costs related to restructuring. We also recorded a provision of $1.0 million for future legal costs associated with litigation matters.
Selected Annual InformationYears ended December 31, 2005 2006 2007
Revenue $107,144 $221,285 $439,903Net earnings (loss) (36,468) 9,796 32,459Diluted earnings (loss)
per share (1.44) 0.38 1.16Total assets 173,980 211,608 385,021Total current and long-term
portions of long-term liabilities and obligations under capital lease 3,128 1,992 858
Forward-looking StatementsCertain statements in this report that are not based on historicalfacts constitute forward-looking statements or forward-looking information within the meaning of applicable securities laws (‘forward-looking statements”). These forward-looking statementsare not promises or guarantees of future performance but areonly predictions that relate to future events, conditions or circum-stances or our future results, performance, achievements or developments and are subject to substantial known and unknownrisks, assumptions, uncertainties and other factors that couldcause our actual results, performance, achievements or develop-ments in our business or in our industry to differ materially fromthose expressed, anticipated or implied by such forward-lookingstatements. Forward-looking statements include disclosure regarding possible events, conditions circumstances or results ofoperations that are based on assumptions about future economicconditions, courses of action and other future events. We cautionyou not to place undue reliance upon any such forward-lookingstatements, which speak only as of the date they are made.These forward-looking statements appear in a number of differentplaces in this report and can be identified by words such as“may”, “estimates”, “projects”, “expects”, “intends”, “believes”,“plans”, “anticipates”, or their negatives or other comparablewords. Forward-looking statements include statements regardingthe outlook for our future operations, plans and timing for the introduction or enhancement of our services and products, statements concerning strategies or developments, statementsabout future market conditions, supply conditions, end customerdemand conditions, channel inventory and sell through, revenue,gross margin, operating expenses, profits, forecasts of futurecosts and expenditures, the outcome of legal proceedings, andother expectations, intentions and plans that are not historicalfact. The risk factors and uncertainties that may affect our actual
Management’s Discussion and Analysis 17
swi_annual_artwork07:sierra wireless 3/13/08 2:44 PM Page 19
results, performance, achievements or developments are manyand include, amongst others, our ability to develop, manufacture,supply and market new products that we do not produce todayand that meet the needs of customers and gain commercial acceptance, our reliance on the deployment of next generationnetworks by major wireless operators, the continuous commit-ment of our customers and increased competition. These riskfactors and others are discussed in our Annual Information Form,which may be found, on SEDAR at www.sedar.com and EDGAR at www.sec.gov and in our other regulatory filings with the Securities and Exchange Commission in the United States andthe Provincial Securities Commissions in Canada. Many of thesefactors are beyond the control of the Company. Consequently, all forward-looking statements in this report are qualified by thiscautionary statement and there can be no assurance that actualresults, performance, achievements or developments anticipatedby the Company will be realized. Forward-looking statements arebased on management’s current plans, estimates, projections,beliefs and opinions and the Company does not undertake anyobligation to update forward-looking statements should the assumptions related to these plans, estimates, projections, beliefs and opinions change.
Risk Factors Our business is subject to significant risks and uncertainties and past performance is no guarantee of future performance.The risks and uncertainties described are those which we currently believe to be material, and do not represent all of therisks that we face. Other risks and uncertainties may become material in the future or ones we currently believe to be immate-rial may become material in the future. If any of the following risksactually occurs, our business, financial condition and results ofoperation could be materially adversely affected as well as themarket price of our common shares.
Our quarterly financial results are subject to fluctuationsthat could affect the market price of our common shares.
Our revenue, gross margin, operating earnings and net earningsmay vary from quarter to quarter and could be significantly impacted by a number of factors, including:
– Possible delays or shortages in component supplies;
– Price and product competition, which may result in lower selling prices for some of our products or lost market share;
– Transition periods associated with the migration of new technologies;
– The development and timing of the introduction of our new products;
– The securing of channel slots for new products and the timing of sales orders and OEM and carrier customer sell through;
– Design win cycles in our embedded module business;
– Product mix of our sales. Our products have different gross margins – for example the embedded module product line has lower gross margins than the higher margin rugged mobile product line;
– The amount of inventory held by our channel partners;
– Possible cyclical fluctuations related to the evolution of wireless technologies;
– Possible delays in the manufacture or shipment of current or new products;
– Possible product quality or factory yield issues that may increase our cost of goods sold;
– Possible increased inventory levels;
– Concentration in our customer base; and
– The achievement of milestones related to our professional services contracts.
Because our operating expenses are determined based on anticipated sales, are generally fixed and are incurred throughouteach fiscal quarter, any of the factors listed above could causesignificant variations in our revenues, gross margin and earningsin any given quarter. Therefore, our quarterly results are not necessarily indicative of our overall business, results of operations and financial condition.
Quarterly variations in operating results or any of the other factors listed above, changes in financial estimates by securitiesanalysts, or other events or factors may result in wide fluctuationsin the market price of our stock price. In addition, the financialmarkets have experienced significant price and volume fluctuationsthat have particularly affected the market prices of equity securities of many technology companies and that often havebeen unrelated to the operating performance of these companiesor have resulted from the failure of the operating results of suchcompanies to meet market expectations in a particular quarter.Broad market fluctuations or any failure of the Company’s operat-ing results in a particular quarter to meet market expectationsmay adversely affect the market price of our common shares.
18 Management’s Discussion and Analysis
swi_annual_artwork07:sierra wireless 3/13/08 2:44 PM Page 20

Competition from new or established wireless communica-tion companies or from those with greater resources mayprevent us from increasing or maintaining our marketshare and could result in price reductions and/or loss of business with resulting reduced revenues and grossmargins.
The wireless communications industry is highly competitive andwe expect competition to increase and intensify. More establishedand larger companies with greater financial, technical and marketing resources sell products that compete with ours and we expect this competition to intensify. We also may introducenew products that will put us in direct competition with major new competitors. Existing or future competitors may be able torespond more quickly to technological developments andchanges and introduce new products before we do, or may independently develop and patent technologies and products that are superior to ours or achieve greater acceptance due tofactors such as more favorable pricing, more desired or betterquality features or more efficient sales channels. If we are unableto compete effectively with our competitors’ pricing strategies,technological advances and other initiatives, we may lose customer orders and market share and we may need to reducethe price of our products, resulting in reduced revenue and reduced gross margins.
Acquisitions of companies or technologies, including our acquisition of AirLink, may result in disruptions to our business or may not achieve the anticipated benefits.
As part of our business strategy, we have acquired and may continue to acquire additional assets and businesses principallyrelating to or complementary to our current operations. On May 25, 2007, we completed our acquisition of AirLink. Any acquisitions and/or mergers by us will be accompanied bythe risks commonly encountered in acquisitions of companies.These risks include, among other things:
– Exposure to unknown liabilities of acquired companies, including unknown litigation related to acts or omissions of our acquired company and/or its directors and officers prior to the acquisition;
– Higher than anticipated acquisition and integration costs and expenses;
– Effects of costs and expenses of acquiring and integrating new businesses on our operating results and financial condition;
– The difficulty and expense of integrating the operations and personnel of the companies;
– Disruption of our ongoing business;
– Diversion of management’s time and attention away from our remaining business during the integration process;
– Failure to maximize our financial and strategic position by the successful incorporation of acquired technology;
– The inability to implement uniform standards, controls, procedures and policies;
– The loss of key employees and customers as a result of changes in management;
– The incurrence of amortization expenses;
– As a result of the growth of our company, we may seek to raise additional capital through an offering of common shares, preference shares or debt, which may result in dilution and/or the issuance of securities. As a result, our share price may decline; and
– Possible dilution to our shareholders if the purchase price is paid in common shares or securities convertible into common shares.
In addition, geographic distances may make integration of businesses more difficult. We may not be successful in overcoming these risks or any other problems encountered in connection with any acquisitions. If realized, these risks could reduce shareholder value.
The loss of any of our significant customers could adversely affect our revenue and profitability, and therefore shareholder value.
We sell our products through network carriers, resellers and OEMsand we are dependent on a limited number of customers for asignificant portion of our revenues. Most of these network carriers,resellers and OEMs also sell products of our competitors. Accordingly, our business and future success depends on ourability to maintain and build on existing relationships and developnew relationships with network carriers, resellers and OEMs. If any of these customers, for any reason, discontinues their relationship with us or reduces or postpones current or expectedpurchase orders for products, or suffers from business failure,our revenues and profitability could decline, perhaps materially.We expect that a limited number of customers will account for a significant portion of our revenues for the foreseeable future.
In the year ended December 31, 2007, two customers individu-ally accounted for more than 10% of our revenue and, in the aggregate, these two customers represented approximately
Management’s Discussion and Analysis 19
swi_annual_artwork07:sierra wireless 3/13/08 2:44 PM Page 21

44% of our revenue. In the year ended December 31, 2006, two customers individually accounted for more than 10% of ourrevenue and, in the aggregate, these two customers representedapproximately 40% of our revenue. In the last three fiscal years,there have been four different customers that individually accounted for more than 10% of our revenues.
In addition, our current customers purchase our products underpurchase orders. Our customers have no contractual obligationto continue to purchase our products following our fulfillment ofcurrent purchase orders and if they do not continue to make purchases, our revenue and our profitability could decline, perhaps materially.
We depend on single source suppliers for some components used in our products and if these suppliersare unable to meet our demand the availability of ourproducts may be materially adversely affected.
Our products are comprised of components some of which are procured from single source suppliers, including where the Company has licensed certain software embedded in a component. From time to time, certain components used in ourproducts have been, and may be, in short supply worldwide andshortages in allocation of components may result in delay in fillingorders from our customers, which may adversely affect our business. In addition, our single source suppliers may experiencedamage or interruption in their operations, become insolvent orbankrupt, or experience claims of infringement, all of which coulddelay or stop their shipment of components to us, which may adversely affect our business. Alternate sources of componentsmay not be available. If there is a shortage of any such components and we cannot obtain an appropriate substitute, we may not be able to deliver sufficient quantities of our products, we may lose business or customers and our revenuemay be materially adversely affected.
We depend on a limited number of third parties to manufacture our products. If they do not manufacture ourproducts properly or cannot meet our needs in a timelymanner, we may be unable to fulfill our product deliveryobligations and our costs may increase, and our revenueand margins could decrease.
We outsource the manufacturing of our products to a limited number of third parties and depend heavily on the ability of thesemanufacturers to meet our needs in a timely and satisfactorymanner at a reasonable cost. We currently rely on two manufac-
turers, either of whom may terminate the manufacturing contractwith us at the end of any contract year. Our reliance on third partymanufacturers subjects us to a number of risks, including the following:
– The absence of guaranteed or adequate manufacturing capacity;
– Reduced control over delivery schedules, production levels, manufacturing yields and costs;
– Their inability to secure adequate volumes of components in a timely manner at a reasonable cost; and
– Unexpected increases in manufacturing costs.
If we are unable to successfully manage any of these risks or tolocate alternative or additional manufacturers or suppliers in atimely and cost-effective manner, we may not be able to deliverproducts in a timely manner. In addition, our results of operationscould be harmed by increased costs, reduced revenues and reduced margins.
Under our manufacturing agreements, in many cases we are required to place binding purchase orders with our manufacturerswell in advance of our receipt of binding purchase orders fromour customers. In this situation, we consider our customers’ goodfaith non-binding forecasts of demand for our products. As a result, if the number of actual products ordered by our customersis materially different from the number of products we have instructed our manufacturer to build (and purchase componentsin respect of), then, if too many components have been purchasedby our manufacturer, we may be required to purchase such excess component inventory, or, if an insufficient number of components have been purchased by our manufacturer, we maynot be in a position to meet all of our customers’ requirements. If we are unable to successfully manage our inventory levels and respond to our customers’ purchase orders based on theirforecasted quantities, our business could be adversely affected.
We may have difficulty responding to changing technology,industry standards and customer requirements, whichcould cause us to be unable to recover our research anddevelopment expenses and our revenue could decline.
The wireless communications industry is subject to rapid technological change. Our business and future success will depend, in part, on our ability to accurately predict and anticipateevolving wireless technology standards and develop products that keep pace with the continuing changes in technology, evolving industry standards and changing customer and end-userpreferences and requirements. Our products embody complextechnology that may not meet those standards, preferences andrequirements. Our ability to design, develop and commerciallylaunch new products depends on a number of factors, including,
20 Management’s Discussion and Analysis
swi_annual_artwork07:sierra wireless 3/13/08 2:44 PM Page 22

but not limited to the following:
– Our ability to attract and retain skilled technical employees;
– The availability of critical components from third parties;
– Our ability to successfully complete the development of products in a timely manner;
– The ability of third parties to complete and deliver on outsourced product development engagements; and
– Our ability to manufacture products at an acceptable price and quality.
A failure by us, or our suppliers, in any of these areas, or a failureof new products to obtain commercial acceptance, could meanwe receive less revenue than we anticipate and we are unable torecover our research and development expenses, and may resultin a decrease in the market price for our shares.
We develop products to meet our customers’ requirements. Original equipment manufacturer customers award design winsfor the integration of wide area wireless embedded modules on aplatform by platform basis. Current design wins do not guaranteefuture design wins. If we are unable or choose not to meet ourcustomers’ future needs, we may not win their future businessand our revenue and profitability may decrease.
In addition, wireless communications service providers requirethat wireless data systems deployed on their networks complywith their own standards, which may differ from the standards ofother providers. We may be unable to successfully address thesedevelopments in a timely basis or at all. Our failure to respondquickly and cost-effectively to new developments through the development of new products or enhancements to existing products could cause us to be unable to recover significant re-search and development expenses and reduce our revenues.
We may infringe on the intellectual property rights of others.
The industry in which we operate has many participants that own,or claim to own, proprietary intellectual property. In the past wehave received, and in the future may receive assertions or claimsfrom third parties alleging that our products violate or infringetheir intellectual property rights. The Company may be subject tothese claims directly or through indemnities against these claimswhich the Company has provided to certain customers. Activity inthis area by third parties, particularly those with tenuous claims,is increasing, resulting in the Company taking a more aggressiveapproach, which may result in increased litigation. Rights to intellectual property can be difficult to verify and litigation may be necessary to establish whether or not we have infringed the
intellectual property rights of others. In many cases, these thirdparties are companies with substantially greater resources thanus, and they may be able to, and may choose to, pursue complexlitigation to a greater degree than we could. Regardless ofwhether these infringement claims have merit or not, we may be subject to the following:
– We may be liable for potentially substantial damages, liabilities and litigation costs, including attorneys’ fees;
– We may be prohibited from further use of the intellectual property and may be required to cease selling our products that are subject to the claim;
– We may have to license the third party intellectual property, incurring royalty fees that may or may not be on commercially reasonable terms. In addition, there is no assurance that we will be able to successfully negotiate and obtain such a license from the third party;
– We may have to develop a non-infringing alternative, which could be costly and delay or result in the loss of sales. In addition, there is no assurance that we will be able to develop such a non-infringing alternative;
– The diversion of management’s attention and resources;
– Our relationships with customers may be adversely affected; and
– We may be required to indemnify our customers for certain costs and damages they incur in such a claim.
In the event of an unfavourable outcome in such a claim and ourinability to either obtain a license from the third party or develop anon-infringing alternative, then our business, operating results andfinancial condition may be materially adversely affected and wemay have to restructure our business.
We license technology, intellectual property and software fromthird parties for use in our products and from time to time may be required to license additional intellectual property. In somecases, these licenses provide us with certain pass-through rightsfor the use of other third party intellectual property. There is noassurance that we will be able to maintain our third party licensesor obtain new licenses when required and this inability could materially adversely affect our business and operating results and the quality and functionality of our products. In addition, there is no assurance that third party licenses we execute will be on commercially reasonable terms.
Management’s Discussion and Analysis 21
swi_annual_artwork07:sierra wireless 3/13/08 2:44 PM Page 23

Under purchase orders and contracts for the sale of our productswe may provide indemnification to our customers for potential intellectual property infringement claims for which we may haveno corresponding recourse against our third party licensors. This potential liability, if realized, could materially adversely affectour business, operating results and financial condition.
Misappropriation of our intellectual property could placeus at a competitive disadvantage.
Our intellectual property is important to our success. We rely on a combination of patent protection, copyrights, trademarks, trade secrets, licenses, non-disclosure agreements and othercontractual agreements to protect our intellectual property. Third parties may attempt to copy aspects of our products andtechnology or obtain information we regard as proprietary withoutour authorization. If we are unable to protect our intellectual property against unauthorized use by others it could have an adverse effect on our competitive position.
Our strategies to deter misappropriation could be inadequate due to the following risks:
– Non-recognition of the proprietary nature or inadequate protection of our methodologies in the United States, Canada or foreign countries;
– Undetected misappropriation of our intellectual property;
– The substantial legal and other costs of protecting and enforcing our rights in our intellectual property; and
– Development of similar technologies by our competitors.
In addition, we could be required to spend significant funds andour managerial resources could be diverted in order to defendour rights, which could disrupt our operations.
Fluctuations in exchange rates between the United Statesdollar and other currencies, including the Canadian dollarmay affect our operating results.
We are exposed to fluctuations in the exchange rate between the United States dollar and the Canadian dollar through our operations in Canada. To reduce our risk because of currencyfluctuations, we purchase inventory, other cost of sales items andmany of our services in United States dollars, however, some ofour operating costs are still incurred in Canadian dollars, primarilythose relating to marketing, administration and a portion of ourresearch and development. Given the rise in the Canadian dollarrelative to the United States dollar, our operating results may continue to be negatively impacted. To date, we have not enteredinto any foreign currency futures contracts as part of a hedgingpolicy. We expect that as our business expands in Europe and theAsia-Pacific region, we will also be exposed to additional foreigncurrency transactions and to the associated currency risk.
We depend on wireless network carriers to offer acceptable wireless data and voice communications services for our products to operate.
Our products can only be used over wireless data and voice networks operated by third parties. Our business and futuregrowth depends, in part, on the successful deployment by network carriers of next generation wireless data and voice networks and the network carriers’ ability to grow their subscriberbase. If these network carriers delay the deployment or expansionof next generation networks or fail to offer effective and reliableservice, or fail to price and market their services effectively, salesof our products will decline and our revenues will decrease.
We do not have fixed-term employment agreements withour key personnel and the loss of any key personnel mayharm our ability to compete effectively.
None of our executive officers or other key employees has entered into a fixed-term employment agreement. Our successdepends in large part on the abilities and experience of our executive officers and other key employees. Competition forhighly skilled management, technical, research and developmentand other key employees is intense in the wireless communica-tions industry. We may not be able to retain our current executiveofficers or key employees and may not be able to hire and transi-tion in a timely manner experienced and highly qualified additionalexecutive officers and key employees as needed to achieve our business objectives. The loss of executive officers and keyemployees could disrupt our operations and our ability to compete effectively could be adversely affected.
As our business expands internationally, we will be exposed to additional risks relating to international operations.
Our expansion into international operations exposes us to additional risks unique to such international markets, including the following:
– Increased credit management risks and greater difficulties in collecting accounts receivable;
– Unexpected changes in regulatory requirements, wireless communications standards, exchange rates, trading policies, tariffs and other barriers;
– Uncertainties of laws and enforcement relating to the protection of intellectual property;
– Language barriers; and
– Potential adverse tax consequences.
Furthermore, if we are unable to further develop distribution channels in Europe and the Asia-Pacific region we may not beable to grow our international operations and our ability to increase our revenue will be negatively impacted.
22 Management’s Discussion and Analysis
swi_annual_artwork07:sierra wireless 3/13/08 2:44 PM Page 24

We have been subject to, and may in the future be subjectto, certain class action lawsuits, which if decided againstus, could require us to pay substantial judgments, settlements or other penalties.
In addition to being subject to litigation in the ordinary course of business, in the future, we may be subject to class actions and other securities litigation and investigations. We expect thatthis type of litigation will be time consuming, expensive and distracting from the conduct of our daily business. It is possiblethat we will be required to pay substantial judgments, settlementsor other penalties and incur expenses that could have a materialadverse effect on our operating results, liquidity or financial position. Expenses incurred in connection with these lawsuits,which include substantial fees of lawyers and other professionaladvisors and our obligations to indemnify officers and directorswho may be parties to such actions, could materially adversely affect our cash position. We do not know if any of this type of litigation and resulting expenses will be covered by insurance. In addition, these lawsuits may cause our insurance premiums to increase in future periods.
Government regulation could result in increased costs and inability to sell our products.
Our products are subject to certain mandatory regulatory approvals in the United States, Canada, the European Union andother regions in which we operate. In the United States, the Federal Communications Commission regulates many aspects of communications devices. In Canada, similar regulations are administered by the Ministry of Industry, through Industry Canada.European Union directives provide comparable regulatory guidance in Europe. Although we have obtained all the necessaryFederal Communications Commission, Industry Canada and otherrequired approvals for the products we currently sell, we may notobtain approvals for future products on a timely basis, or at all. In addition, regulatory requirements may change or we may notbe able to obtain regulatory approvals from countries other thanthe United States and Canada in which we may desire to sellproducts in the future.
We have incurred net losses and if our efforts to restorethe business to sustained profitability are not successful,we may be required to restructure or take other actionsand our share price may decline.
During 2006 and 2007, our net earnings were $9.8 million and$32.5 million, respectively. However, as a result of the reductionin our business in 2005, we incurred a loss of $36.5 million inthat year. Our accumulated deficit at December 31, 2007 was$40.6 million. While we had earnings from operations for each ofthe two years ended December 31, 2004 and 2003, we incurreda loss from operations in each of the three fiscal years ended December 31, 2000, 2001 and 2002. Our ability to achieve andmaintain profitability in the future will depend on, among otherthings, the continued sales of our current products and the successful development and commercialization of new products.While we have been profitable for nine sequential quarters, if wecannot sustain profitability, our total losses will increase and wemay be required to restructure our operations or raise additionalcapital. Additional financing may not be available, and even ifavailable, may not be on acceptable terms. We may seek to raise additional capital through an offering of common shares,preference shares or debt, which may result in dilution, and/orthe issuance of securities with rights senior to the rights, of theholders of common shares. As a result, our share price may decline.
Management’s Discussion and Analysis 23
swi_annual_artwork07:sierra wireless 3/13/08 2:44 PM Page 25
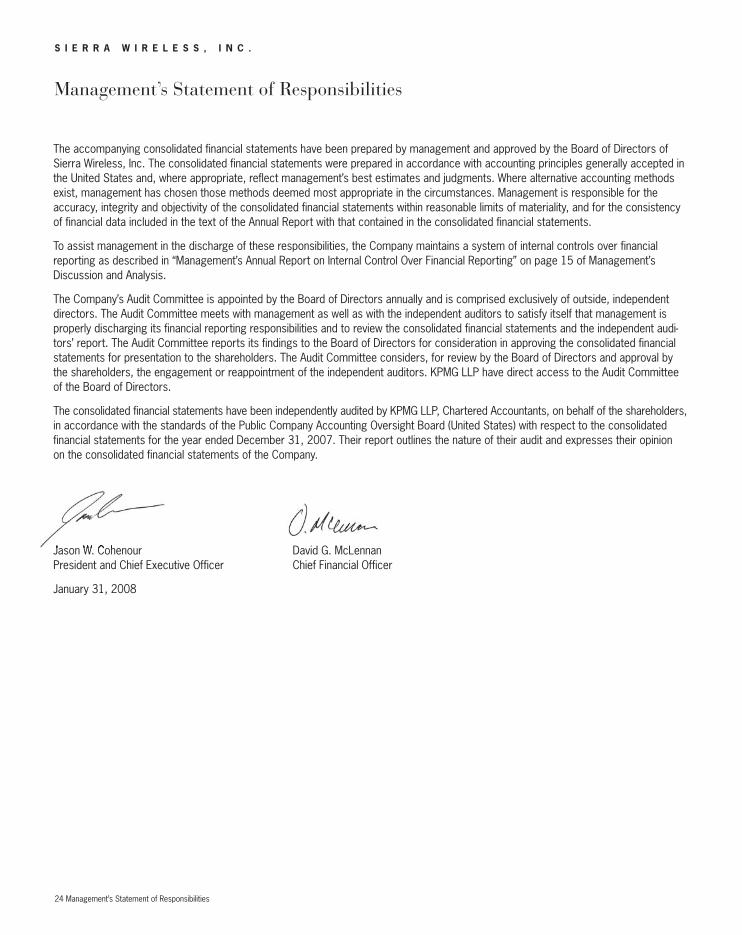
The accompanying consolidated financial statements have been prepared by management and approved by the Board of Directors ofSierra Wireless, Inc. The consolidated financial statements were prepared in accordance with accounting principles generally accepted inthe United States and, where appropriate, reflect management’s best estimates and judgments. Where alternative accounting methodsexist, management has chosen those methods deemed most appropriate in the circumstances. Management is responsible for the accuracy, integrity and objectivity of the consolidated financial statements within reasonable limits of materiality, and for the consistency of financial data included in the text of the Annual Report with that contained in the consolidated financial statements.
To assist management in the discharge of these responsibilities, the Company maintains a system of internal controls over financial reporting as described in “Management’s Annual Report on Internal Control Over Financial Reporting” on page 15 of Management’s Discussion and Analysis.
The Company’s Audit Committee is appointed by the Board of Directors annually and is comprised exclusively of outside, independent directors. The Audit Committee meets with management as well as with the independent auditors to satisfy itself that management is properly discharging its financial reporting responsibilities and to review the consolidated financial statements and the independent audi-tors’ report. The Audit Committee reports its findings to the Board of Directors for consideration in approving the consolidated financialstatements for presentation to the shareholders. The Audit Committee considers, for review by the Board of Directors and approval by the shareholders, the engagement or reappointment of the independent auditors. KPMG LLP have direct access to the Audit Committee of the Board of Directors.
The consolidated financial statements have been independently audited by KPMG LLP, Chartered Accountants, on behalf of the shareholders,in accordance with the standards of the Public Company Accounting Oversight Board (United States) with respect to the consolidated financial statements for the year ended December 31, 2007. Their report outlines the nature of their audit and expresses their opinion on the consolidated financial statements of the Company.
Jason W. Cohenour David G. McLennanPresident and Chief Executive Officer Chief Financial Officer
January 31, 2008
S I E R R A W I R E L E S S , I N C .
Management’s Statement of Responsibilities
24 Management’s Statement of Responsibilities
swi_annual_artwork07:sierra wireless 3/13/08 2:44 PM Page 26

To the Shareholders and Board of Directors of Sierra Wireless, Inc.
We have audited the accompanying consolidated balance sheets of Sierra Wireless, Inc. (“the Company”) and subsidiaries as of December 31, 2007 and 2006, and the related consolidated statements of operations, shareholders’ equity, and cash flows for each of the years in the three-year period ended December 31, 2007. These consolidated financial statements are the responsibility of theCompany’s management. Our responsibility is to express an opinion on these consolidated financial statements based on our audits.
We conducted our audits in accordance with the standards of the Public Company Accounting Oversight Board (United States). Those standards require that we plan and perform the audit to obtain reasonable assurance about whether the financial statements are free ofmaterial misstatement. An audit includes examining, on a test basis, evidence supporting the amounts and disclosures in the financialstatements. An audit also includes assessing the accounting principles used and significant estimates made by management, as well as evaluating the overall financial statement presentation. We believe that our audits provide a reasonable basis for our opinion.
In our opinion, the consolidated financial statements referred to above present fairly, in all material respects, the financial position of the Company and subsidiaries as of December 31, 2007 and 2006, and the results of its operations and its cash flows for each of theyears in the three-year period ended December 31, 2007, in conformity with United States generally accepted accounting principles.
We also have audited, in accordance with the standards of the Public Company Accounting Oversight Board (United States), the Company’sinternal control over financial reporting as of December 31, 2007, based on criteria established in Internal Control - Integrated Frameworkissued by the Committee of Sponsoring Organizations of the Treadway Commission (COSO), and our report dated January 31, 2008 expressed an unqualified opinion on the effectiveness of the Company’s internal control over financial reporting.
Chartered AccountantsVancouver, CanadaJanuary 31, 2008
S I E R R A W I R E L E S S , I N C .
Report of Independent Registered Public Accounting Firm
Report of Independent Registered Public Accounting Firm 25
swi_annual_artwork07:sierra wireless 3/13/08 2:44 PM Page 27

To the Shareholders and Board of Directors of Sierra Wireless, Inc.
We have audited Sierra Wireless, Inc.’s (“the Company”) internal control over financial reporting as of December 31, 2007, based on criteria established in Internal Control - Integrated Framework issued by the Committee of Sponsoring Organizations of the TreadwayCommission (COSO). The Company’s management is responsible for maintaining effective internal control over financial reporting and forits assessment of the effectiveness of internal control over financial reporting, included in the accompanying Management’s Annual Reporton Internal Control Over Financial Reporting. Our responsibility is to express an opinion on the Company’s internal control over financial reporting based on our audit.
We conducted our audit in accordance with the standards of the Public Company Accounting Oversight Board (United States). Those standards require that we plan and perform the audit to obtain reasonable assurance about whether effective internal control over financialreporting was maintained in all material respects. Our audit included obtaining an understanding of internal control over financial reporting,assessing the risk that a material weakness exists, and testing and evaluating the design and operating effectiveness of internal controlbased on the assessed risk. Our audit also included performing such other procedures as we considered necessary in the circumstances.We believe that our audit provides a reasonable basis for our opinion.
A company’s internal control over financial reporting is a process designed to provide reasonable assurance regarding the reliability of financial reporting and the preparation of financial statements for external purposes in accordance with generally accepted accountingprinciples. A company’s internal control over financial reporting includes those policies and procedures that (1) pertain to the maintenanceof records that, in reasonable detail, accurately and fairly reflect the transactions and dispositions of the assets of the company; (2) provide reasonable assurance that transactions are recorded as necessary to permit preparation of financial statements in accordancewith generally accepted accounting principles, and that receipts and expenditures of the company are being made only in accordance with authorizations of management and directors of the company; and (3) provide reasonable assurance regarding prevention or timely detection of unauthorized acquisition, use, or disposition of the company’s assets that could have a material effect on the financial statements.
Because of its inherent limitations, internal control over financial reporting may not prevent or detect misstatements. Also, projections of any evaluation of effectiveness to future periods are subject to the risk that controls may become inadequate because of changes inconditions, or that the degree of compliance with the policies or procedures may deteriorate.
In our opinion, the Company maintained, in all material respects, effective internal control over financial reporting as of December 31, 2007,based on criteria established in Internal Control - Integrated Framework issued by the Committee of Sponsoring Organizations of theTreadway Commission (COSO).
We also have audited, in accordance with the standards of the Public Company Accounting Oversight Board (United States), the consolidatedbalance sheets of the Company and subsidiaries as of December 31, 2007 and 2006, and the related consolidated statements of opera-tions, shareholders’ equity and cash flows for each of the years in the three-year period ended December 31, 2007, and our report datedJanuary 31, 2008 expressed an unqualified opinion on those consolidated financial statements.
Chartered AccountantsVancouver, CanadaJanuary 31, 2008
S I E R R A W I R E L E S S , I N C .
Report of Independent Registered Public Accounting Firm
26 Report of Independent Registered Public Accounting Firm
swi_annual_artwork07:sierra wireless 3/13/08 2:44 PM Page 28
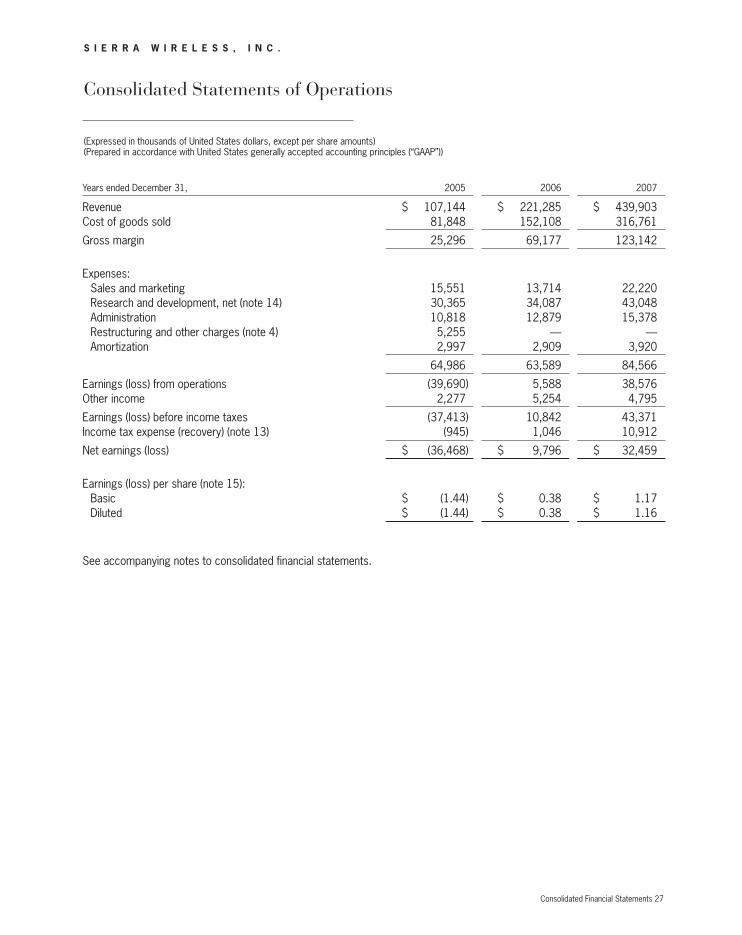
Years ended December 31, 2005 2006 2007
Revenue $ 107,144 $ 221,285 $ 439,903Cost of goods sold 81,848 152,108 316,761
Gross margin 25,296 69,177 123,142
Expenses:Sales and marketing 15,551 13,714 22,220Research and development, net (note 14) 30,365 34,087 43,048Administration 10,818 12,879 15,378Restructuring and other charges (note 4) 5,255 — —Amortization 2,997 2,909 3,920
64,986 63,589 84,566
Earnings (loss) from operations (39,690) 5,588 38,576Other income 2,277 5,254 4,795
Earnings (loss) before income taxes (37,413) 10,842 43,371Income tax expense (recovery) (note 13) (945) 1,046 10,912
Net earnings (loss) $ (36,468) $ 9,796 $ 32,459
Earnings (loss) per share (note 15):Basic $ (1.44) $ 0.38 $ 1.17Diluted $ (1.44) $ 0.38 $ 1.16
See accompanying notes to consolidated financial statements.
Consolidated Statements of Operations
(Expressed in thousands of United States dollars, except per share amounts)(Prepared in accordance with United States generally accepted accounting principles (“GAAP”))
S I E R R A W I R E L E S S , I N C .
Consolidated Financial Statements 27
swi_annual_artwork07:sierra wireless 3/13/08 2:44 PM Page 29

December 31, 2006 2007
AssetsCurrent assets:
Cash and cash equivalents $ 46,438 $ 83,624Short-term investments (note 5) 40,554 92,980Accounts receivable, net of allowance for doubtful
accounts of $1,939 (2006 – $1,867) 57,441 83,015Inventories (note 6) 18,889 24,989Deferred income taxes (note 13) 118 3,556Prepaid expenses 6,032 9,229
169,472 297,393
Long-term investments (note 5) — 19,757Fixed assets (note 7) 13,400 15,274Intangible assets (note 8) 9,892 17,418Goodwill (note 8) 18,409 32,541Deferred income taxes (note 13) — 1,156Other assets 435 1,482
$ 211,608 $ 385,021Liabilities and Shareholders’ EquityCurrent liabilities:
Accounts payable $ 16,608 $ 31,163Accrued liabilities 39,543 53,691Deferred revenue and credits 633 534Current portion of long-term liabilities (note 9) 847 277
57,631 85,665
Long-term liabilities (note 9) 1,145 581Deferred income taxes (note 13) — 3,451
Shareholders’ equity:Share capital (note 10)
AuthorizedUnlimited number of common and preference shares with no par valueCommon shares, 31,334,617 (2006 – 25,708,331) issued and outstanding 221,861 328,323
Additional paid-in capital 3,240 6,374Warrants 1,538 1,538Deficit (73,061) (40,602)Accumulated other comprehensive loss (746) (309)
152,832 295,324
$ 211,608 $ 385,021
Commitments and contingencies (note 16)See accompanying notes to consolidated financial statements.
JASON W. COHENOUR PAUL G. CATAFORDDirector Director
Consolidated Balance Sheets
(Expressed in thousands of United States dollars, except number of shares)(Prepared in accordance with United States GAAP)
S I E R R A W I R E L E S S , I N C .
28 Consolidated Financial Statements
swi_annual_artwork07:sierra wireless 3/13/08 2:45 PM Page 30

Common Shares WarrantsNumber Amount Capital Number Amount Deficit (Loss) Total
Balance December 31, 2004 25,357,231 $218,805 $ 440 138,696 $ 1,538 $(46,389) $ (729) $ 173,665
Net loss — — — — — (36,468) — (36,468)Unrealized loss on short
and long-term investments — — — — — — (91) (91)
Comprehensive loss (36,559)
Stock option tax benefit — — 116 — — — — 116Stock option exercises 119,216 593 — — — — — 593
Balance December 31, 2005 25,476,447 219,398 556 138,696 1,538 (82,857) (820) 137,815
Net income — — — — — 9,796 — 9,796Net unrealized gain on
short-term investments — — — — — — 6 6Reclassification adjustment for
realized losses on investments — — — — — — 68 68
Comprehensive income 9,870
Stock option exercises 231,884 2,463 (1,112) — — — — 1,351Stock-based compensation — — 3,796 — — — — 3,796
Balance December 31, 2006 25,708,331 221,861 3,240 138,696 1,538 (73,061) (746) 152,832
Net income — — — — — 32,459 — 32,459Net unrealized gain on short
and long-term investments — — — — — — 419 419Reclassification adjustment for
net realized losses oninvestments — — — — — — 18 18
Comprehensive income 32,896
Issued for acquisition (note 3) 1,309,880 17,597 — — — — — 17,597Issued for cash (note 10) 3,800,000 85,120 — — — — — 85,120Share issue costs (note 10) — (4,194) — — — — — (4,194)Stock option tax benefit related
to U.S. employees — — 1,292 — — — — 1,292Stock option exercises 516,406 7,939 (3,340) — — — — 4,599Stock-based
compensation (note 11) — — 5,182 — — — — 5,182
Balance December 31, 2007 31,334,617 $328,323 $6,374 138,696 $ 1,538 $(40,602) $ (309) $ 295,324
See accompanying notes to consolidated financial statements.
Consolidated Statements of Shareholders’ Equity
(Expressed in thousands of United States dollars, except number of shares)(Prepared in accordance with United States GAAP)
S I E R R A W I R E L E S S , I N C .
AdditionalPaid-in
AccumulatedOther
ComprehensiveIncome
Consolidated Financial Statements 29
swi_annual_artwork07:sierra wireless 3/13/08 2:45 PM Page 31

Years ended December 31, 2005 2006 2007
Cash flows from operating activities:Net earnings (loss) $ (36,468) $ 9,796 $ 32,459Adjustments to reconcile net earnings (loss) to
net cash provided by (used in) operating activitiesAmortization 9,012 9,665 13,791Stock-based compensation (note 11) — 3,796 5,182Tax benefit related to stock option deduction 116 — 1,292Utilization of pre-acquisition tax losses — 818 802Deferred income tax — (118) 178Non-cash restructuring and other charges 12,329 — —Gain on disposal (41) (35) (13)
Changes in operating assets and liabilitiesAccounts receivable 1,967 (38,196) (21,067)Inventories 219 (15,573) (2,493)Prepaid expenses and other assets 891 (2,007) (4,212)Accounts payable (151) 12,637 11,347Accrued liabilities (5,149) 10,899 11,816Deferred revenue and credits 75 211 (244)
Net cash provided by (used in) operating activities (17,200) (8,107) 48,838
Cash flows from investing activities:Business acquisition, net of cash acquired of $1,510 (note 3) — — (12,093)Proceeds on disposal 48 92 52Purchase of fixed assets (8,292) (9,102) (10,286)Increase in intangible assets (2,138) (1,646) (1,307)Purchase of long-term investments (14,851) — (28,053)Purchase of short-term investments (88,320) (71,943) (171,182)Proceeds on maturity of short-term investments 63,593 72,318 126,826
Net cash used in investing activities (49,960) (10,281) (96,043)
Cash flows from financing activities:Issue of common shares, net of share issue costs 592 1,351 85,525Repayment of long-term liabilities (667) (1,136) (1,134)
Net cash provided by (used in) financing activities (75) 215 84,391
Net increase (decrease) in cash and cash equivalents (67,235) (18,173) 37,186Cash and cash equivalents, beginning of year 131,846 64,611 46,438
Cash and cash equivalents, end of year $ 64,611 $ 46,438 $ 83,624
Supplementary information (note 17)
See accompanying notes to consolidated financial statements.
Consolidated Statements of Cash Flows
(Expressed in thousands of United States dollars)(Prepared in accordance with United States GAAP)
S I E R R A W I R E L E S S , I N C .
30 Consolidated Financial Statements
swi_annual_artwork07:sierra wireless 3/13/08 2:45 PM Page 32

1. Nature of operations We were incorporated under the Canada Business Corporations Act on May 31, 1993. We provide leading edge wireless wide areamodem solutions for mobile computing, rugged mobile and machine-to-machine (“M2M”) markets. We develop and market a range of prod-ucts that include wireless modems for mobile computers, embedded modules for original equipment manufacturers, or OEMs, rugged vehicle-mounted modems and high value fixed and mobile wireless data solutions for industrial, commercial and public safety applications. We also offer professional services to OEM customers during their product development, leveraging our expertise in wirelessdesign and integration. Our products and solutions connect people, their mobile computers and fixed terminals to wireless voice and mobile broadband networks around the world.
2. Significant accounting policiesManagement has prepared these consolidated financial statements in accordance with accounting principles generally accepted in theUnited States.
(a) Principles of consolidationOur consolidated financial statements include the accounts of Sierra Wireless, Inc. and its wholly-owned subsidiaries Sierra Wireless America, Inc. (including its predecessors AirPrime, Inc., Sierra Wireless Data, Inc. and Sierra Wireless AirLink Solutions, Inc.), Sierra Wireless (UK) Limited, Sierra Wireless (Asia Pacific) Limited, Sierra Wireless SRL (dissolved June 12, 2006) and Sierra Wireless ULC from their respective dates of formation or acquisition. We have eliminated all significant intercompany balances and transactions.
(b) Foreign currency translationOur functional or primary operating currency is the United States (“U.S.”) dollar. We translate transactions in currencies other than the U.S. dollar at the exchange rate in effect on the transaction date. Monetary assets and liabilities denominated in a currency other than the U.S. dollar are translated at the exchange rates in effect at the balance sheet date. The resulting exchange rate gains and losses arerecognized in earnings.
(c) Use of estimatesIn preparing the financial statements in conformity with United States generally accepted accounting principles (“U.S. GAAP”), managementmakes estimates and assumptions that affect the reported amounts of assets, particularly the recoverability of accounts receivable, inventory, fixed assets, intangible assets, goodwill and deferred income taxes, royalty and warranty accruals, other liabilities, stock-basedcompensation, and disclosures of contingent liabilities at the date of the financial statements and the reported amounts of revenues andexpenses during the reporting period. Actual results could differ from the estimates.
(d) Cash equivalentsCash equivalents include short-term deposits, which are all highly liquid securities having a term to maturity of three months or less whenacquired. We value our short-term deposits at amortized cost.
(e) Short-term investmentsShort-term investments, all of which we categorize as available-for-sale, are carried at quoted market value. We reflect unrealized holdinggains (losses) related to available-for-sale investments, after deducting amounts allocable to income taxes, as part of accumulated othercomprehensive income (loss), a separate component of shareholders’ equity. These gains (losses) are removed from comprehensive income (loss) when the investments mature or are sold on an item-by-item basis.
We regularly evaluate the realizable value of short-term investments, and if circumstances indicate that a decline in value is other-than-temporary, we recognize an impairment charge. To determine whether to recognize an impairment charge, we consider various factors,such as the significance of the decline in value, how long the investment has been below market value, changes that would impact the financial condition of the investee, and the likelihood that the investment will recover its value before it matures or is disposed of.
(f) InventoriesInventories consist of electronic components and finished goods and are valued at the lower of cost, determined on a first-in-first-out basis, and estimated net realizable value.
Notes to Consolidated Financial Statements
Years ended December 31, 2005, 2006 and 2007(Expressed in thousands of United States dollars, except per share amounts and number of shares)(Prepared in accordance with United States GAAP)
S I E R R A W I R E L E S S , I N C .
Notes to Consolidated Financial Statements 31
swi_annual_artwork07:sierra wireless 3/13/08 2:45 PM Page 33

(g) Research and developmentWe expense research and development costs as they are incurred. To date we have had no significant software development costs thatwould be required to be capitalized pursuant to Financial Accounting Standards (“FAS”) No. 86, “Accounting for the Costs of ComputerSoftware to Be Sold, Leased or Otherwise Marketed”.
We follow the cost reduction method of accounting for government research and development funding, whereby the benefit of the funding is recognized as a reduction in the cost of the related expenditure when certain criteria stipulated under the terms of those fundingagreements have been met, and there is reasonable assurance the research and development funding will be received. Certain researchand development funding is repayable only on the occurrence of specified future events. If such events do not occur, no repayment is required. We recognize the liability to repay research and development funding in the period in which conditions arise that will cause research and development funding to be repayable.
(h) Long-term investmentsLong-term investments are categorized as available-for-sale and are carried at quoted market value. We reflect unrealized holding gains(losses) related to available-for-sale investments, after deducting amounts allocable to income taxes, as part of accumulated other comprehensive income (loss), a separate component of shareholders’ equity. These gains (losses) are removed from comprehensive income (loss) when the investments mature or are sold on an item-by-item basis.
We regularly evaluate the realizable value of long-term investments, and if circumstances indicate that a decline in value is other-than-temporary, we recognize an impairment charge, as described in note 2(e) above.
(i) Fixed assetsWe initially record fixed assets at cost. We subsequently provide amortization on a straight-line basis over the following periods:Furniture and fixtures 5 yearsResearch and development equipment 3 yearsTooling 3 yearsComputer equipment 3 yearsSoftware 3-5 yearsOffice equipment 5 yearsWe amortize leasehold improvements on a straight-line basis over the shorter of the initial lease term or their useful lives.
(j) Intangible assets
Patents and trademarks
Consideration paid for patents and trademarks is amortized on a straight-line basis over three to five years commencing with the date thepatents or trademarks are granted.
License fees
Consideration paid for license fees is amortized on a straight-line basis over the shorter of the term of the license or an estimate of theiruseful life, ranging from three to ten years.
Intellectual property, customer relationships and databases
Consideration paid for intellectual property, customer relationships and databases is amortized on a straight-line basis over three to fiveyears.
Backlog
Consideration paid for backlog is amortized on a straight-line basis over one year.
(k) GoodwillGoodwill represents the excess of the purchase price of an acquired enterprise over the fair value assigned to assets acquired and liabilities assumed in a business combination. Goodwill is allocated as of the date of the business combination to the reporting units thatare expected to benefit from the synergies of the business combination.
Years ended December 31, 2005, 2006 and 2007(Expressed in thousands of United States dollars, except per share amounts and number of shares)(Prepared in accordance with United States GAAP)
S I E R R A W I R E L E S S , I N C .
32 Notes to Consolidated Financial Statements
swi_annual_artwork07:sierra wireless 3/13/08 2:45 PM Page 34

Goodwill has an indefinite life, is not amortized and at least annually is subject to a two-step impairment test. The first step compares the fair value of the reporting unit to its carrying amount, which includes the goodwill. When the fair value of a reporting unit exceeds its carrying amount, goodwill of the reporting unit is considered not to be impaired and the second step of the impairment test is unnecessary. If the carrying amount exceeds the fair value, the second part of the test is performed to measure the amount of the impairment loss. The second step compares the implied fair value of the reporting unit goodwill with the carrying amount of the goodwill. If the carrying amount exceeds the fair value of the goodwill, an impairment loss is recognized equal to that excess.
(l) Impairment of long-lived assetsWe monitor the recoverability of long-lived assets, which includes fixed assets and intangible assets, other than goodwill, based on factorssuch as future asset utilization and the future undiscounted cash flows expected to result from the use of the related assets. Our policy isto record an impairment loss in the period when we determine that the carrying amount of the asset will not be recoverable. At that timethe carrying amount is written down to fair value.
(m) Income taxesEffective January 1, 2007, we account for income tax uncertainties in accordance with Financial Accounting Standards Board (“FASB”) Interpretation No. 48, “Accounting for Uncertainty in Income Taxes—An Interpretation of FASB Statement No. 109” (“FIN 48”). This interpretation prescribes a recognition threshold and measurement method for the recognition of a tax position taken or expected to betaken in a tax return. FIN 48 also provides guidance related to uncertain tax positions on the derecognition, measurement (according tothe more likely than not criterion), classification, interest and penalties, accounting in interim periods and disclosure. We have evaluated all tax positions in accordance with FIN 48, and have concluded that there is no impact to our opening deficit.
Upon the adoption of the FASB revised Statement No. 123R, “Share-Based Payments” (“FAS No. 123R”), on January 1, 2006, we recognizethe excess tax benefits associated with the exercise of stock options by U.S. employees to additional paid-in capital (“APIC”) when realized.This tax benefit is not recognized until the deduction reduces U.S. taxes payable and all U.S. loss carryforwards have been utilized.
(n) Stock-based compensationEffective January 1, 2006, we adopted FAS No. 123R. Accordingly, we measure share-based compensation at the grant date based onthe estimated fair value of the award using the Black-Scholes valuation model and recognize this cost over the employee’s requisite serviceperiod. We adopted the provisions of FAS No. 123R using the modified prospective transition method, under which prior periods are notrestated. The valuation provisions of FAS No. 123R apply to new awards and to awards that are outstanding on the date of adoption that are subsequently modified or cancelled. Compensation expense for unvested stock options and awards that were outstanding on January 1, 2006 are being recognized over the remaining service period based on the grant date fair value of those options and awardsas previously calculated under the pro-forma disclosures of FASB Statement No. 123, “Accounting for Stock-Based Compensation” (“FAS No. 123”).
Prior to the adoption of FAS No. 123R, we used the intrinsic value method under Accounting Principles Board Opinion No. 25, “Accountingfor Stock Issued to Employees” (“APB 25”), and related Interpretations and provided the disclosure-only provisions of FAS No. 123. Underthe intrinsic value method, no stock-based compensation had been recognized in our Consolidated Statements of Operations prior to January 1, 2006 because the exercise price of our stock options granted to employees and directors was equal to the market value of the underlying common shares at the date of grant.
(o) Revenue recognitionWe recognize revenue from sales of products and services upon the later of transfer of title or upon shipment of the product to the customer or rendering of the service, so long as persuasive evidence of an arrangement exists, delivery has occurred, the fee is fixed ordeterminable, and collectibility is reasonably assured. Customers include resellers, original equipment manufacturers, wireless serviceproviders and end-users. We record deferred revenue when we receive cash in advance of the revenue recognition criteria being met.
We recognize revenue on the portion of sales to certain resellers that are subject to contract provisions allowing various rights of returnand stock rotation when the rights have expired or the products have been reported as sold by the resellers.
Revenues from contracts with multiple-element arrangements, such as those including technical support services, are recognized as eachelement is earned based on the relative fair value of each element and only when there are no undelivered elements that are essential tothe functionality of the delivered elements.
Years ended December 31, 2005, 2006 and 2007(Expressed in thousands of United States dollars, except per share amounts and number of shares)(Prepared in accordance with United States GAAP)
S I E R R A W I R E L E S S , I N C .
Notes to Consolidated Financial Statements 33
swi_annual_artwork07:sierra wireless 3/13/08 2:45 PM Page 35
Revenue from licensed software is recognized at the inception of the license term and in accordance with Statement of Position (“SOP”)97-2, “Software Revenue Recognition”, as amended by SOP 98-9, Modification of SOP 97-2, “Software Revenue Recognition, With Respectto Certain Transactions”. Revenue from software maintenance, unspecified upgrades and technical support contracts is recognized overthe period such items are delivered or services are provided. Technical support contracts extending beyond the current period arerecorded as deferred revenue.
Funding from research and development agreements, other than government research and development arrangements, is recognized as revenue when certain criteria stipulated under the terms of those funding agreements have been met, and when there is reasonable assurance the funding will be received. Certain research and development funding will be repayable only on the occurrence of specified future events. If such events do not occur, no repayment would be required. We will recognize the liability to repay research and development funding in the period in which conditions arise that would cause research and development funding to be repayable.
(p) Warranty costsWe accrue warranty costs upon the recognition of related revenue, based on our best estimates, with reference to past and expected future experience. If there is a change in these estimates, we adjust our accrual accordingly.
(q) Market development costsWe accrue for co-op advertising costs upon the later of the recognition date of the related revenue or the date at which the co-op advertising is available. Market development costs are recorded as marketing expense in accordance with the criteria in Emerging IssuesTask Force 01-9, “Accounting for Consideration Given by a Vendor to a Customer (Including a Reseller of Vendor’s Products)”.
(r) Share issue costsWe reduce the value of consideration assigned to shares issued by the direct costs, net of income tax recoveries, of issuing the shares.
(s) Earnings (loss) per common shareWe calculate basic earnings (loss) per share based on the weighted-average number of common shares outstanding for the year. If, in a reporting period, we have had in-the-money outstanding dilutive stock options and warrants, we calculate diluted earnings (loss) per shareusing the treasury stock method. Under the treasury stock method, the number of dilutive shares, if any, are determined by the proceedsfrom the exercise price of the options, the amount of unrecognized stock-based compensation, the estimated tax benefit that would berecognized when the options by U.S. employees are exercised, and the average market price of the shares for the period, that could beused to repurchase stock during the reporting period.
(t) Comprehensive income (loss)Under FAS No. 130, “Reporting Comprehensive Income”, we are required to report comprehensive income (loss), which includes our net earnings (loss) as well as changes in equity from other non-owner sources. In our case, the other changes in equity included in comprehensive income (loss) are comprised of the foreign currency cumulative translation adjustments and unrealized gains or losses on available-for-sale investments. Comprehensive income (loss) is presented in the consolidated statements of shareholders’ equity.
(u) Investment tax creditsInvestment tax credits are accounted for using the flow-through method whereby such credits are accounted for as a reduction of incometax expense in the period in which the credit arises.
(v) Comparative figuresWe have reclassified certain of the figures presented for comparative purposes to conform to the financial statement presentation weadopted for the current year.
(w) Recent accounting pronouncements In February 2007, FASB issued FAS No. 159 entitled “The Fair Value Option for Financial Assets and Financial Liabilities—Including anamendment of FASB Statement No. 115” (“FAS No. 159”). FAS No. 159 permits companies to choose to measure many financial instruments and certain other items at fair value that are not currently required to be measured at fair value and establishes presentationand disclosure requirements. Unrealized gains and losses on items for which the fair value option has been elected will be reported in earnings. FAS No. 159 is effective for fiscal years beginning after November 15, 2007. We will adopt FAS No. 159 as of January 1, 2008.The impact, if any, that FAS No. 159 will have on our consolidated financial statements is not yet determinable.
In September 2006, FASB issued FAS No. 157 entitled “Fair Value Measurements” (“FAS No. 157”). This statement clarifies the definitionof fair value to provide greater consistency and clarity on existing accounting pronouncements that require fair value measurements, provides a framework for using fair value to measure assets and liabilities and expands disclosures about fair value measurements.
Years ended December 31, 2005, 2006 and 2007(Expressed in thousands of United States dollars, except per share amounts and number of shares)(Prepared in accordance with United States GAAP)
S I E R R A W I R E L E S S , I N C .
34 Notes to Consolidated Financial Statements
swi_annual_artwork07:sierra wireless 3/13/08 2:45 PM Page 36
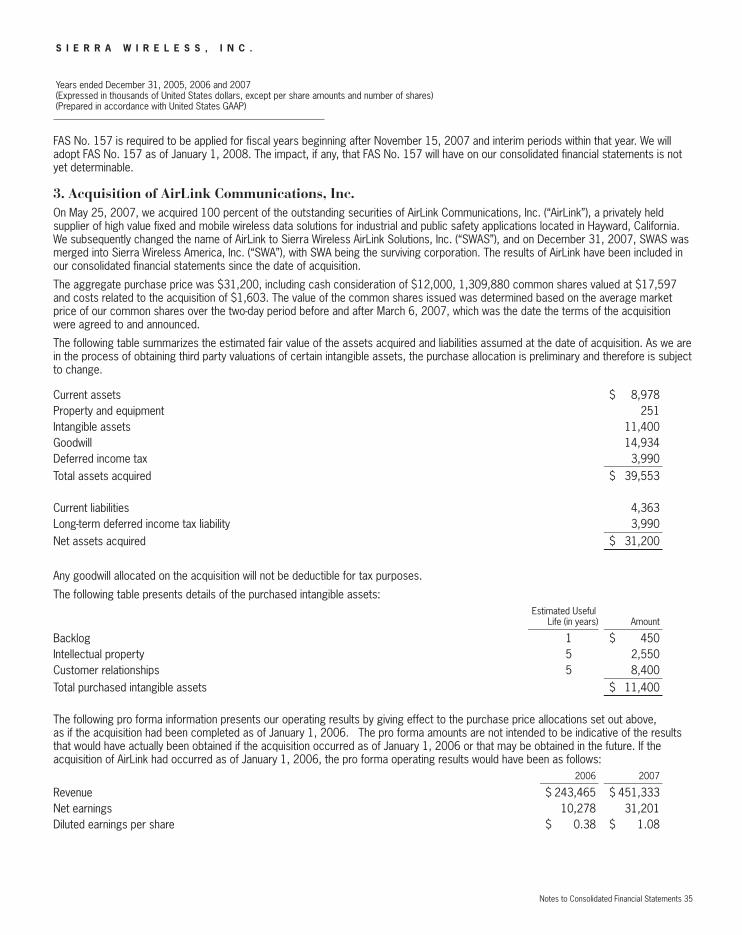
FAS No. 157 is required to be applied for fiscal years beginning after November 15, 2007 and interim periods within that year. We willadopt FAS No. 157 as of January 1, 2008. The impact, if any, that FAS No. 157 will have on our consolidated financial statements is notyet determinable.
3. Acquisition of AirLink Communications, Inc.On May 25, 2007, we acquired 100 percent of the outstanding securities of AirLink Communications, Inc. (“AirLink”), a privately held supplier of high value fixed and mobile wireless data solutions for industrial and public safety applications located in Hayward, California.We subsequently changed the name of AirLink to Sierra Wireless AirLink Solutions, Inc. (“SWAS”), and on December 31, 2007, SWAS wasmerged into Sierra Wireless America, Inc. (“SWA”), with SWA being the surviving corporation. The results of AirLink have been included inour consolidated financial statements since the date of acquisition.
The aggregate purchase price was $31,200, including cash consideration of $12,000, 1,309,880 common shares valued at $17,597and costs related to the acquisition of $1,603. The value of the common shares issued was determined based on the average marketprice of our common shares over the two-day period before and after March 6, 2007, which was the date the terms of the acquisitionwere agreed to and announced.
The following table summarizes the estimated fair value of the assets acquired and liabilities assumed at the date of acquisition. As we arein the process of obtaining third party valuations of certain intangible assets, the purchase allocation is preliminary and therefore is subjectto change.
Current assets $ 8,978Property and equipment 251Intangible assets 11,400Goodwill 14,934Deferred income tax 3,990Total assets acquired $ 39,553
Current liabilities 4,363Long-term deferred income tax liability 3,990Net assets acquired $ 31,200
Any goodwill allocated on the acquisition will not be deductible for tax purposes.
The following table presents details of the purchased intangible assets:Estimated Useful
Life (in years) Amount
Backlog 1 $ 450Intellectual property 5 2,550Customer relationships 5 8,400Total purchased intangible assets $ 11,400
The following pro forma information presents our operating results by giving effect to the purchase price allocations set out above, as if the acquisition had been completed as of January 1, 2006. The pro forma amounts are not intended to be indicative of the resultsthat would have actually been obtained if the acquisition occurred as of January 1, 2006 or that may be obtained in the future. If the acquisition of AirLink had occurred as of January 1, 2006, the pro forma operating results would have been as follows:
2006 2007
Revenue $ 243,465 $ 451,333Net earnings 10,278 31,201Diluted earnings per share $ 0.38 $ 1.08
Years ended December 31, 2005, 2006 and 2007(Expressed in thousands of United States dollars, except per share amounts and number of shares)(Prepared in accordance with United States GAAP)
S I E R R A W I R E L E S S , I N C .
Notes to Consolidated Financial Statements 35
swi_annual_artwork07:sierra wireless 3/13/08 2:45 PM Page 37
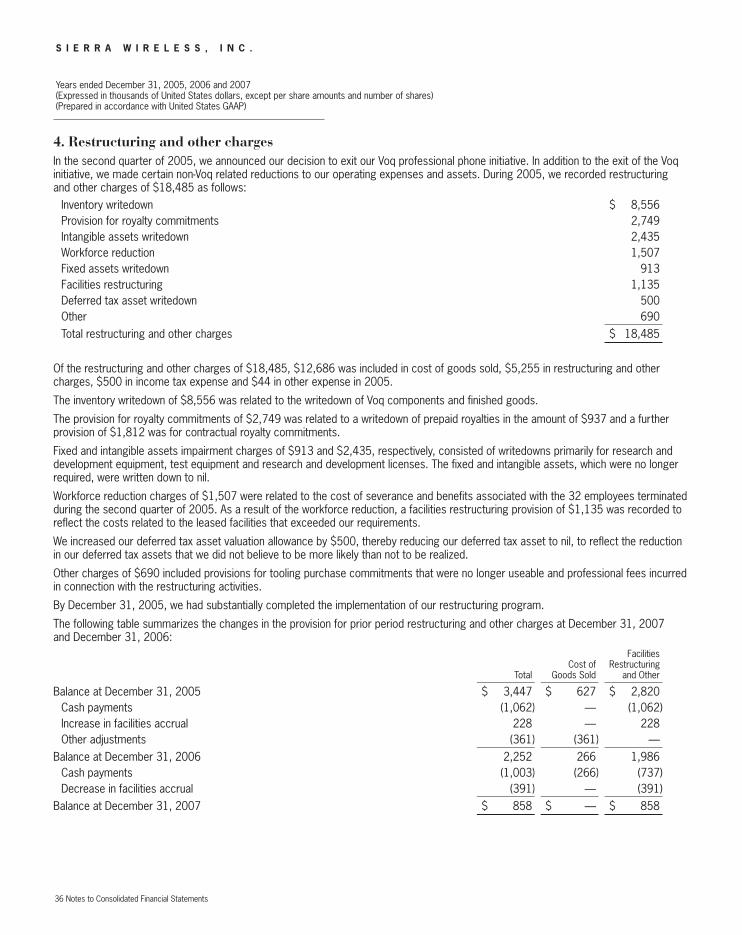
4. Restructuring and other chargesIn the second quarter of 2005, we announced our decision to exit our Voq professional phone initiative. In addition to the exit of the Voq initiative, we made certain non-Voq related reductions to our operating expenses and assets. During 2005, we recorded restructuring and other charges of $18,485 as follows:
Inventory writedown $ 8,556Provision for royalty commitments 2,749Intangible assets writedown 2,435Workforce reduction 1,507Fixed assets writedown 913Facilities restructuring 1,135Deferred tax asset writedown 500Other 690Total restructuring and other charges $ 18,485
Of the restructuring and other charges of $18,485, $12,686 was included in cost of goods sold, $5,255 in restructuring and othercharges, $500 in income tax expense and $44 in other expense in 2005.
The inventory writedown of $8,556 was related to the writedown of Voq components and finished goods.
The provision for royalty commitments of $2,749 was related to a writedown of prepaid royalties in the amount of $937 and a further provision of $1,812 was for contractual royalty commitments.
Fixed and intangible assets impairment charges of $913 and $2,435, respectively, consisted of writedowns primarily for research and development equipment, test equipment and research and development licenses. The fixed and intangible assets, which were no longer required, were written down to nil.
Workforce reduction charges of $1,507 were related to the cost of severance and benefits associated with the 32 employees terminatedduring the second quarter of 2005. As a result of the workforce reduction, a facilities restructuring provision of $1,135 was recorded toreflect the costs related to the leased facilities that exceeded our requirements.
We increased our deferred tax asset valuation allowance by $500, thereby reducing our deferred tax asset to nil, to reflect the reduction in our deferred tax assets that we did not believe to be more likely than not to be realized.
Other charges of $690 included provisions for tooling purchase commitments that were no longer useable and professional fees incurredin connection with the restructuring activities.
By December 31, 2005, we had substantially completed the implementation of our restructuring program.
The following table summarizes the changes in the provision for prior period restructuring and other charges at December 31, 2007 and December 31, 2006:
FacilitiesCost of Restructuring
Total Goods Sold and Other
Balance at December 31, 2005 $ 3,447 $ 627 $ 2,820Cash payments (1,062) — (1,062)Increase in facilities accrual 228 — 228Other adjustments (361) (361) —
Balance at December 31, 2006 2,252 266 1,986Cash payments (1,003) (266) (737)Decrease in facilities accrual (391) — (391)
Balance at December 31, 2007 $ 858 $ — $ 858
Years ended December 31, 2005, 2006 and 2007(Expressed in thousands of United States dollars, except per share amounts and number of shares)(Prepared in accordance with United States GAAP)
S I E R R A W I R E L E S S , I N C .
36 Notes to Consolidated Financial Statements
swi_annual_artwork07:sierra wireless 3/13/08 2:45 PM Page 38

5. InvestmentsInvestments, all of which are classified as available-for-sale, were comprised as follows:
Short-term Long-term
2006 2007 2006 2007
Government treasury bills and securities $ 19,995 $ 70,249 $ — $ —Government bonds 2,522 22,731 — 19,757Commercial paper 18,037 — — —
$ 40,554 $ 92,980 $ — $ 19,757
Our short-term investments have contractual maturities ranging from three to twelve months from the date of purchase. Our long-term investments have contractual maturities of over one year.
There were no investments that had been in an unrealized loss position for more than 12 months at December 31, 2007. We had one government security investment that has been in a temporary unrealized loss position for less than 12 months at December 31, 2007 witha fair value of $5,006 and a gross unrealized loss of $1. The duration and severity of the loss is not significant and we have the ability andintent to hold this investment until the market value recovers, which may be when it matures, therefore we do not consider the investmentto be other-than-temporarily impaired at December 31, 2007.
6. Inventories2006 2007
Electronic components $ 7,511 $ 9,904Finished goods 11,378 15,085
$ 18,889 $ 24,989
7. Fixed assets2007
Accumulated Net BookCost Amortization Value
Furniture and fixtures $ 3,066 $ 2,638 $ 428Research and development equipment 14,793 10,461 4,332Tooling 19,857 11,623 8,234Computer equipment 3,718 2,597 1,121Software 4,781 4,156 625Leasehold improvements 2,584 2,313 271Office equipment 779 516 263
$ 49,578 $ 34,304 $ 15,274
2006
Accumulated Net BookCost Amortization Value
Furniture and fixtures $ 2,982 $ 2,482 $ 500Research and development equipment 12,003 7,622 4,381Tooling 13,742 7,933 5,809Computer equipment 2,817 1,818 999Software 4,373 3,392 981Leasehold improvements 2,537 2,114 423Office equipment 735 428 307
$ 39,189 $ 25,789 $ 13,400
Years ended December 31, 2005, 2006 and 2007(Expressed in thousands of United States dollars, except per share amounts and number of shares)(Prepared in accordance with United States GAAP)
S I E R R A W I R E L E S S , I N C .
Notes to Consolidated Financial Statements 37
swi_annual_artwork07:sierra wireless 3/13/08 2:45 PM Page 39
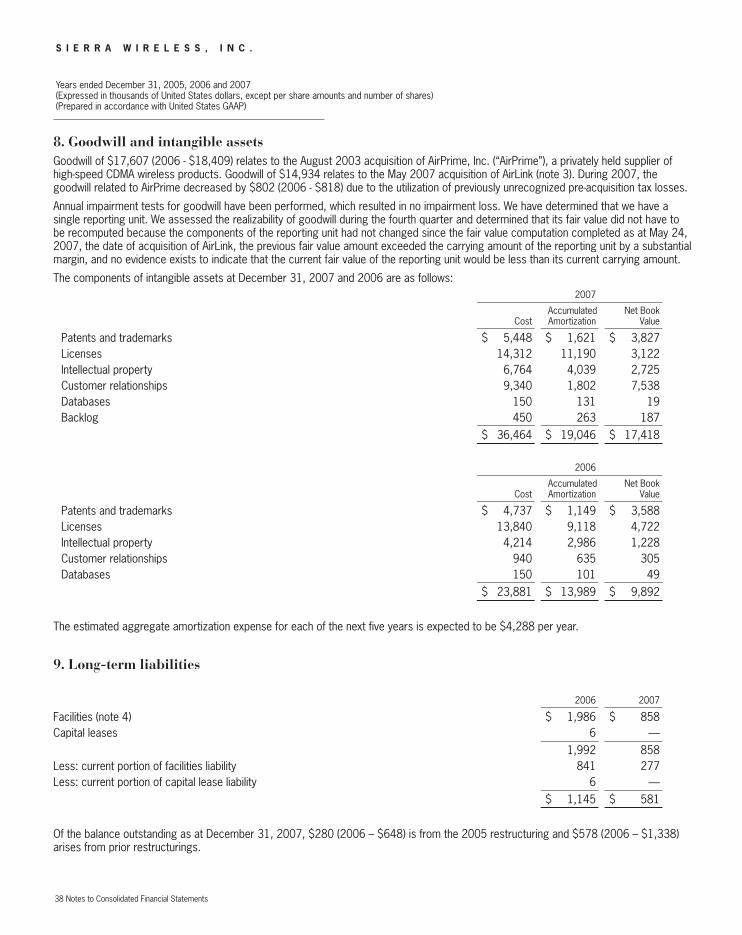
8. Goodwill and intangible assetsGoodwill of $17,607 (2006 - $18,409) relates to the August 2003 acquisition of AirPrime, Inc. (“AirPrime”), a privately held supplier ofhigh-speed CDMA wireless products. Goodwill of $14,934 relates to the May 2007 acquisition of AirLink (note 3). During 2007, the goodwill related to AirPrime decreased by $802 (2006 - $818) due to the utilization of previously unrecognized pre-acquisition tax losses.
Annual impairment tests for goodwill have been performed, which resulted in no impairment loss. We have determined that we have a single reporting unit. We assessed the realizability of goodwill during the fourth quarter and determined that its fair value did not have to be recomputed because the components of the reporting unit had not changed since the fair value computation completed as at May 24,2007, the date of acquisition of AirLink, the previous fair value amount exceeded the carrying amount of the reporting unit by a substantialmargin, and no evidence exists to indicate that the current fair value of the reporting unit would be less than its current carrying amount.
The components of intangible assets at December 31, 2007 and 2006 are as follows:2007
Accumulated Net BookCost Amortization Value
Patents and trademarks $ 5,448 $ 1,621 $ 3,827Licenses 14,312 11,190 3,122Intellectual property 6,764 4,039 2,725Customer relationships 9,340 1,802 7,538Databases 150 131 19Backlog 450 263 187
$ 36,464 $ 19,046 $ 17,418
2006
Accumulated Net BookCost Amortization Value
Patents and trademarks $ 4,737 $ 1,149 $ 3,588Licenses 13,840 9,118 4,722Intellectual property 4,214 2,986 1,228Customer relationships 940 635 305Databases 150 101 49
$ 23,881 $ 13,989 $ 9,892
The estimated aggregate amortization expense for each of the next five years is expected to be $4,288 per year.
9. Long-term liabilities
2006 2007
Facilities (note 4) $ 1,986 $ 858Capital leases 6 —
1,992 858Less: current portion of facilities liability 841 277Less: current portion of capital lease liability 6 —
$ 1,145 $ 581
Of the balance outstanding as at December 31, 2007, $280 (2006 – $648) is from the 2005 restructuring and $578 (2006 – $1,338)arises from prior restructurings.
Years ended December 31, 2005, 2006 and 2007(Expressed in thousands of United States dollars, except per share amounts and number of shares)(Prepared in accordance with United States GAAP)
S I E R R A W I R E L E S S , I N C .
38 Notes to Consolidated Financial Statements
swi_annual_artwork07:sierra wireless 3/13/08 2:45 PM Page 40

10. Share capitalPublic offering
On October 2, 2007, we closed our bought deal common share offering (the “Offering”) of 3,500,000 common shares at a price ofUS$22.40 per share. Under the Offering, which included 300,000 shares issuable upon the exercise by the underwriters of the over-allotment option, we sold 3,800,000 common shares from treasury. Gross proceeds of this Offering were $85,120 and share issue costs were $4,194, for net proceeds of $80,926.
Stock option plan
Under the terms of our employee Stock Option Plan (the “Plan”), our Board of Directors may grant options to employees, officers and directors. In April 2005, shareholders approved an amendment to the Plan whereby the maximum number of shares available for issueunder the Plan is a rolling number equal to 10% of the number of issued and outstanding common shares from time to time, provided thatafter April 2005 no more than 1,600,000 common shares will be added to the number of common shares currently available for issueunder the Plan without the Company first obtaining shareholder approval. Prior to this amendment, the number of shares available for issuance was a specified, fixed amount. Based on the number of shares outstanding as at December 31, 2007, stock options exercisableinto 1,206,142 common shares are available for future allocation under the Plan. Since the amendment to the Plan, 949,910 commonshares have been added to the number of common shares currently available for issue under the Plan, which are to be applied against thelimit of 1,600,000 common shares. The Plan provides for granting of options at the fair market value of our stock at the grant date. Options generally vest over four years, with the first 25% vesting at the first anniversary date of the grant and the balance vesting in equalamounts at the end of each month thereafter. We determine the term of each option at the time it is granted, with options having a five-year or a ten-year term. Since February 1999, options have only been granted with a five-year term.
Stock option activity since December 31, 2004 is presented below:Number of Weighted Average
Shares Exercise Price
Cdn.$ U.S.$Outstanding, December 31, 2004 1,705,571 20.71 17.12Granted 575,422 10.70 9.18Exercised (119,216) 5.34 4.58Forfeited (362,344) 31.71 27.21Outstanding, December 31, 2005 1,799,433 18.48 15.86Granted 567,750 14.59 12.95Exercised (231,884) 6.57 5.84Forfeited (163,527) 18.85 16.73Outstanding, December 31, 2006 1,971,772 16.64 14.22Granted 586,650 20.72 19.16Exercised (516,406) 9.53 8.81Forfeited (114,696) 25.17 23.27Outstanding, December 31, 2007 1,927,320 18.01 18.19
Exercisable,December 31, end of year
2005 959,7172006 1,023,2462007 877,198
Years ended December 31, 2005, 2006 and 2007(Expressed in thousands of United States dollars, except per share amounts and number of shares)(Prepared in accordance with United States GAAP)
S I E R R A W I R E L E S S , I N C .
Notes to Consolidated Financial Statements 39
swi_annual_artwork07:sierra wireless 3/13/08 2:45 PM Page 41

The following table summarizes the stock options outstanding at December 31, 2007:Options Outstanding Options Exercisable
WeightedAverage
RemainingNumber Contractual Weighted Average Number Weighted Average
Range of Exercise Prices of Options Life Exercise Price Exercisable Exercise Price
In years Cdn.$ U.S.$ Cdn.$ U.S.$
$1.52 - $3.54 (Cdn.$1.50 – Cdn.$3.50) 2,500 0.3 $ 3.38 $ 3.41 2,500 $ 3.38 $ 3.41$3.55 - $12.12 (Cdn.$3.51 – Cdn.$12.00) 351,693 2.0 9.75 9.85 211,733 9.57 9.67$12.13 - $20.20 (Cdn.$12.01 – Cdn.$20.00) 969,374 3.5 16.08 16.24 249,953 14.44 14.59$20.21 - $30.30 (Cdn.$20.01 - Cdn.$30.00) 428,853 2.5 22.41 22.63 244,466 23.33 23.56$30.31 - $39.61 (Cdn.$30.01 - Cdn.$39.21) 174,900 1.1 34.77 35.12 168,546 34.75 35.10
1,927,320 2.8 18.01 18.19 877,198 19.61 19.81
The options outstanding at December 31, 2007 expire between February 7, 2008 and December 14, 2012.
The aggregate intrinsic value of stock options outstanding and exercisable at December 31, 2007 was $2,385 and $1,372, respectively.The intrinsic value of outstanding and exercisable stock options is calculated as the quoted market price of the stock at the balance sheetdate less the exercise price of the option. The aggregate intrinsic value of options exercised in the year ended December 31, 2007 was$5,871 (2006 – $2,465; 2005 – $777).
Employee stock purchase plan
During 2005 we established employee stock purchase plans for U.S. and Canadian and other non-U.S employees (together, the “ESPPPlans”) to enable eligible employees and directors to acquire common shares over the facilities of the Toronto Stock Exchange (“TSX”) and The Nasdaq Stock Market (“Nasdaq”). The ESPP Plans do not allow the issuance of common shares from treasury. Eligible employeesand directors may contribute up to 10% of base compensation to purchase common shares on the public markets. Under the U.S. plan, the purchase price to be paid by an eligible employee is 85% of the fair market value of the common shares, with the Company contributing the other 15%, plus any applicable commissions or transactional costs. The maximum number of common shares that can be purchased under the U.S. plan is 50,000 common shares. Under the non-U.S. plan we contribute an amount equal to 20% of the employee’s contribution, plus any applicable commissions or transactional costs. The ESPP Plans purchase shares at certain plan-defineddates. In 2007, participants purchased at total of 16,806 (2006 – 15,639) common shares at a weighted-average price of U.S.$18.00(2006 – U.S.$13.36) per share.
Restricted stock plans
During the second quarter of 2007, we established non-vested restricted stock plans for U.S. and non-U.S. employees (together, the“RSPs”) to provide long-term incentives to certain executives and other key employees and to support the objective of employee shareownership through the granting of restricted share units (“RSUs”). There is no exercise price and no monetary payment is required fromthe employees to the Company upon receipt of the RSUs or upon the subsequent issuance of shares to settle the award. Under the RSPs, independent trustees will purchase the common shares over the facilities of the TSX and Nasdaq. As at December 31, 2007, the purchase of 160,500 shares related to the RSUs granted during 2007 was outstanding. In accordance with FASB Interpretation No. 46, “Consolidation of Variable Interest Entities”,the trust funds are determined to be variable interest entities and will be included in our consolidated financial statements in fiscal 2008.
RSUs vest over three years, in equal amounts on the anniversary date of the date of the grant. Vested RSUs will be settled annually upon vesting by delivery of a common share of Sierra Wireless, Inc. for each vested unit. At December 31, 2007 the RSUs had an intrinsic value of nil. The weighted average remaining contractual life of the RSUs is 2.43 years.
Number of Weighted AverageRSUs Grant Date Fair Value
Cdn.$ U.S.$Outstanding, December 31, 2006 — $ — $ —Granted 160,500 21.07 19.50Outstanding, December 31, 2007 160,500 $ 21.07 $ 19.50
Years ended December 31, 2005, 2006 and 2007(Expressed in thousands of United States dollars, except per share amounts and number of shares)(Prepared in accordance with United States GAAP)
S I E R R A W I R E L E S S , I N C .
40 Notes to Consolidated Financial Statements
swi_annual_artwork07:sierra wireless 3/13/08 2:45 PM Page 42

Warrants
There are outstanding warrants to purchase 138,696 of our common shares at Cdn. $20.49 per share. The warrants are exercisable for a term of five years from December 30, 2003. The warrants were issued under our agreement with the Government of Canada’s Technology Partnerships Canada (“TPC”) program (see note 16(b)(iv)).
11. Stock-based compensationThe following table summarizes the classification of the stock-based compensation expense recognized in the Consolidated Statements of Operations for the non-vested share awards related to the stock option and restricted stock plans as follows:
2006 2007
Cost of goods sold $ 377 $ 488Sales and marketing 493 906Research and development 746 920Administration 2,180 2,868Stock-based compensation expense $ 3,796 $ 5,182
As of December 31, 2007, the unrecognized stock-based compensation costs related to non-vested stock options and RSUs were$8,688 and $2,372, respectively, (2006 - $6,587 and nil) which are expected to be recognized over a weighted average period of 1.4 and 1.3 years, respectively (2006 – 1.3 years and nil).
RSUs are valued at the grant date market price of the underlying securities and the compensation expense is recognized on a straight-linebasis over the three-year vesting period based on the estimated number of awards expected to vest. Accordingly, the weighted-averagefair value of RSUs granted during the year ended December 31, 2007 was $19.50 per unit. The expense recognized in our consolidatedstatement of operations for the year ended December 31, 2007 was $585.
We calculate the fair value of stock options granted under the provisions of FAS No. 123R using the Black-Scholes valuation model. Under this method, the weighted average fair value of stock options granted in 2007 was $10.10 (2006 - $7.98) using the following assumptions:
2006 2007
Expected dividend yield 0 0Expected stock price volatility 75% 63%Risk-free interest rate 4.19% 4.20%Expected life of options 4 years 4 years
There is no dividend yield because we do not pay, and do not plan to pay, cash dividends on our common shares. The expected stockprice volatility is based on the historical volatility of our average monthly stock closing prices over a period equal to the expected life ofeach option grant. The risk-free interest rate is based on yields from Canadian Government Bond yields with a term equal to the expectedterm of the options being valued. The expected life of options represents the period of time that the options are expected to be outstandingbased on historical data of option holder exercise and termination behaviour.
Under FAS No.123R, stock-based compensation is recognized based on awards expected to vest and is reduced for estimated forfeitures.We estimate forfeitures at the time of grant and, if necessary, revise that estimate if actual forfeitures differ. Prior to 2006, forfeitureswere accounted for as they occurred.
The following table summarizes the pro-forma effect of stock-based compensation for fiscal 2005 as if the fair value method of accountingfor stock compensation had been applied. Due to the adoption of FAS No. 123R on January 1, 2006, pro-forma disclosure is not requiredfor 2007 and 2006.
Years ended December 31, 2005, 2006 and 2007(Expressed in thousands of United States dollars, except per share amounts and number of shares)(Prepared in accordance with United States GAAP)
S I E R R A W I R E L E S S , I N C .
Notes to Consolidated Financial Statements 41
swi_annual_artwork07:sierra wireless 3/13/08 2:45 PM Page 43

2005
Net loss:As reported ... $ (36,468)Less: Total stock-based employee compensation expense
determined under fair value based method for all awards (7,615)Pro-forma $ (44,083)
Loss per share:As reported $ (1.44)Pro-forma (1.74)
In 2005, the Board of Directors approved the accelerated vesting of certain “out-of-the-money” stock options previously granted under the Plan to participants in the Plan other than board members and executive officers of the Company. In aggregate, the vesting of stockoptions to purchase a total of 175,650 common shares with an exercise price of US$14.25 (Cdn.$16.82) per share or higher, being 25%above the trading price at the time of the Board of Directors’ approved this initiative, was accelerated and these became fully exercisablein November 2005. These options would otherwise have vested over time periods ranging up to December 2008. Accelerating the vestingof certain stock options resulted in the inclusion of approximately $2,300 in the pro-forma stock-based compensation expense.
The weighted average fair value of stock options granted during the year ended December 31, 2005 was $5.94 using the Black-Scholesoption-pricing model with the following assumptions:
2005
Expected dividend yield 0Expected stock price volatility 85%Risk-free interest rate 3.43%Expected life of options 4 years
12. Financial instrumentsFair value of financial instruments
The carrying amounts of certain of our financial instruments, including cash and cash equivalents, accounts receivable, accounts payable,accrued liabilities and current portions of long-term liabilities, approximate their fair value due to their short maturities. Short and long-terminvestments are carried at fair market value; their book values for December 31, 2007 were $92,861 (2006 – $40,571) and $19,457(2006 – nil), respectively. Based on borrowing rates currently available to us for loans with similar terms, the carrying value of our obligations under capital lease and long-term liabilities approximates their fair value.
Concentrations of business risk
We depend on a small number of customers for a significant portion of our revenue. In 2007, two customers accounted individually formore than 10% of our revenue and, in aggregate, these customers represented 44% of our revenue. In the years ended 2006 and 2005,these same two customers individually accounted for more than 10% of our revenue and, in aggregate, represented 40% and 36% of our revenue, respectively.
We maintain substantially all of our cash and cash equivalents with major financial institutions or government instruments. Corporate paper,if any, is uninsured. Our deposits with banks may exceed the amount of insurance provided on such deposits.
We outsource manufacturing of our products to third parties and, accordingly, we are dependent upon the development and deploymentby third parties of their manufacturing abilities. The inability of any supplier or manufacturer to fulfill our supply requirements could impactfuture results. We have supply commitments to our contract manufacturers based on our estimates of customer and market demand.Where actual results vary from our estimates, whether due to execution on our part or market conditions, we are at risk.
Financial instruments that potentially subject us to concentrations of credit risk are primarily accounts receivable. We perform on-goingcredit evaluations of our customer’s financial condition and require letters of credit or other guarantees whenever deemed appropriate.
Although substantially all of our revenues are received in U.S. dollars, we incur operating costs and have obligations related to our facilitiesrestructuring that are denominated in Cdn. dollars. Fluctuations in the exchange rates between these currencies could have a material
Years ended December 31, 2005, 2006 and 2007(Expressed in thousands of United States dollars, except per share amounts and number of shares)(Prepared in accordance with United States GAAP)
S I E R R A W I R E L E S S , I N C .
42 Notes to Consolidated Financial Statements
swi_annual_artwork07:sierra wireless 3/13/08 2:45 PM Page 44

effect on our business, financial condition and results of operations. We mitigate this risk by denominating many of our payment obligations in U.S. dollars.
Letters of credit
During 2007, we obtained letters of credit to ensure the performance of a third party in accordance with specified terms and conditions.At December 31, 2007, we had $6,028 (2006 - $3,237) outstanding under the letters of credit. Our obligations under these financial instruments expire in February 2008 and will be replaced by a standby irrevocable letter of credit.
Line of credit
During 2007, we had an unsecured revolving demand facility for $10,000, which bears interest at prime per annum. The balance at December 31, 2007 and 2006 was nil and this facility was not utilized during either fiscal 2007 or fiscal 2006.
13. Income taxes The composition of our deferred tax assets at December 31 is as follows:
2006 2007
Deferred tax assetsFixed assets $ 1,063 $ 2,745Loss carryforwards 15,044 16,383Capital loss carryforwards 4,618 5,544Scientific research and development expenses 15,134 19,250Share issue costs 332 909Reserves and other 2,611 6,091
Total gross deferred tax assets 38,802 50,922
Deferred tax liabilityAcquired intangibles — 3,451
Total net deferred tax assets 38,802 47,471Less valuation allowance 38,684 46,210Net deferred tax assets $ 118 $ 1,261
In assessing the realizability of our deferred tax assets, we considered whether it is more likely than not that some portion or all of our deferred tax assets will not be realized. The ultimate realization of our deferred tax assets is dependent upon the generation of future taxable income during the periods in which temporary differences become deductible. We considered projected future taxable income and tax planning strategies in making our assessment.
At December 31, 2007, we had approximately $33,216 of non-capital loss carryforwards for Canadian tax purposes that, if unutilized, will expire at various dates beginning in fiscal 2009 and ending in fiscal 2015. Also, we have approximately $17,372 of capital loss carryforwards for Canadian tax purposes that are available, indefinitely, to be deducted against future Canadian taxable capital gains. We have $353 of charitable donations available to deduct against Canadian income which expires between 2009 and 2011. As well, we have approximately $61,524 of scientific research and development expenditures available to be deducted against future Canadian taxable income that may be carried forward indefinitely and investment tax credits of approximately $28,798 available to offset futureCanadian federal and provincial income taxes payable. The investment tax credits expire commencing in 2010 until 2027.
In addition, at December 31, 2007, net operating loss carryforwards for our foreign subsidiaries were $11,911 for U.S. income tax purposes that expire in various amounts commencing in 2020 through 2027. Our foreign subsidiaries may be limited in their ability to use foreign net operating losses in any single year depending on their ability to generate significant taxable income. We also have approximately $432 of research and development credits available to be deducted against future United States taxable income. The research and development credits expire commencing in 2010 until 2027.
We adopted the provisions of FIN 48 on January 1, 2007. In accordance with FIN 48, we have evaluated all uncertain tax positions andhave determined that the unrecognized tax benefits at December 31, 2007 were $4,085. Of this total, $2,789 (January 1, 2007 - $623)represents the total amount of unrecognized tax benefits that, if recognized, would affect the effective tax rate. We recognize potential
Years ended December 31, 2005, 2006 and 2007(Expressed in thousands of United States dollars, except per share amounts and number of shares)(Prepared in accordance with United States GAAP)
S I E R R A W I R E L E S S , I N C .
Notes to Consolidated Financial Statements 43
swi_annual_artwork07:sierra wireless 3/13/08 2:45 PM Page 45

interest and penalties related to income tax matters in income tax expense. As at December 31, 2007, we have accrued $188 for interest and penalties. Tax years ranging from 2003 to 2007 remain subject to examination in Canada, the United States, the United Kingdom and Hong Kong.
Effective tax rate
Our income tax expense for the year ended December 31 differs from that calculated by applying statutory rates for the following reasons:
2005 2006 2007
Combined Canadian federal and provincial income taxes at expected rate of 34.12% (2006 – 34.12%, 2005 – 34.85%) $ (13,038) $ 3,699 $ 14,798
Permanent and other differences 468 64 (492)Change in valuation allowance 10,965 (4,324) (7,526)Change in statutory tax rate and foreign tax rate 160 (176) 2,379Stock based compensation expense — 964 951Preacquisition loss not previously recognized — 819 802Writedown of deferred tax asset 500 — —
$ (945) $ 1,046 $ 10,912
Our provisions for income taxes consist of the following: 2005 2006 2007
CurrentCanadian $ (42) $ (91) $ —Foreign (1,403) 1,255 12,096
Total current (1,445) 1,164 12,096Deferred
Canadian 500 — —Foreign — (118) (1,184)
Total deferred 500 (118) (1,184)Income tax expense (recovery) $ (945) $ 1,046 $ 10,912
Reconciliation of Unrecognized Tax Benefits 2007
Unrecognized tax benefits, opening balance $ 2,240Gross increases – tax positions in prior period 1,306Gross increases – tax positions in current period 539Unrecognized tax benefits, ending balance $ 4,085
14. Research and development
2005 2006 2007
Gross research and development $ 30,390 $ 32,094 $ 38,872Government research and development funding (893) — —Government research and development repayments 868 1,993 4,176
$ 30,365 $ 34,087 $ 43,048
Years ended December 31, 2005, 2006 and 2007(Expressed in thousands of United States dollars, except per share amounts and number of shares)(Prepared in accordance with United States GAAP)
S I E R R A W I R E L E S S , I N C .
44 Notes to Consolidated Financial Statements
swi_annual_artwork07:sierra wireless 3/13/08 2:45 PM Page 46

15. Earnings (loss) per shareThe weighted-average numbers of shares outstanding (in thousands) used in the computation of earnings (loss) per share are as follows:
2005 2006 2007
Weighted-average shares used in computation of basic earnings (loss) per share 25,385 25,609 27,696Weighted-average shares from assumed conversion of dilutive options — 248 260Weighted-average shares used in computation of diluted earnings (loss) per share 25,385 25,857 27,956
16. Commitments and contingencies(a) Operating leasesWe lease equipment and premises with minimum future lease payments denominated in Cdn. dollars at December 31, 2007 as follows:
Cdn.$ U.S.$
2008 $ 3,603 $ 3,6392009 2,895 2,9242010 2,889 2,9182011 1,479 1,4942012 113 114
$ 10,979 $ 11,089(b) Contingent liability on sale of products
(i) Under license agreements, we are committed to make royalty payments based on the sales of products using certain technologies. We recognize royalty obligations as determinable in accordance with agreement terms. Where agreements are not finalized, we have recognized our current best estimate of the obligation. When the agreements are finalized, the estimate will be revised accordingly.
(ii) We are a party to a variety of agreements in the ordinary course of business under which we may be obligated to indemnify a third party with respect to certain matters. Typically, these obligations arise as a result of contracts for sale of our products to customers where we provide indemnification against losses arising from matters such as potential intellectual property infringements and product liabilities. The impact on our future financial results is not subject to reasonable estimation because considerable uncertainty exists as to whether claims will be made and the final outcome of potential claims. To date, we have not incurred material costs related to these types of indemnifications.
(iii) Under certain research and development funding agreements, we are contingently liable to repay up to $3,167. Repayment under these agreements is contingent upon reaching certain revenue levels for specified products.
(iv) Under an agreement with the Government of Canada’s Technology Partnerships Canada (“TPC”) program, we have received Cdn. $9,999 to support the development of a range of third generation wireless technologies. Under the terms of the agreement, an amount up to a maximum of Cdn. $13,000 is to be repaid based on annual sales, in excess of certain minimum amounts, of specified products commencing in 2004. All funds available under this program were earned prior to 2004. During the year ended December 31, 2007, we recorded, in research and development expense, the accrued repayment of $4,139 (2006 – $1,977; 2005 – $850). In addition, we issued warrants to TPC to purchase 138,696 common shares on December 30, 2003, valued at Cdn. $2,000 based on the Black-Scholes option pricing model. The warrants are exercisable at Cdn. $20.49 per share for a term of five years from December 30, 2003. As of December 31, 2007, no warrants have been exercised.
In March 2004, we entered into a second agreement with TPC under which we were eligible to receive conditionally repayable research and development funding up to Cdn. $9,540 to support the development of a range of third generation wireless technologies, specifically the Voq professional phone. The agreement was effective April 2003. During the year ended December 31,2007, we claimed nil (2006 – nil; 2005 – $893), which has been recorded as a reduction of research and development expense.
Years ended December 31, 2005, 2006 and 2007(Expressed in thousands of United States dollars, except per share amounts and number of shares)(Prepared in accordance with United States GAAP)
S I E R R A W I R E L E S S , I N C .
Notes to Consolidated Financial Statements 45
swi_annual_artwork07:sierra wireless 3/13/08 2:45 PM Page 47
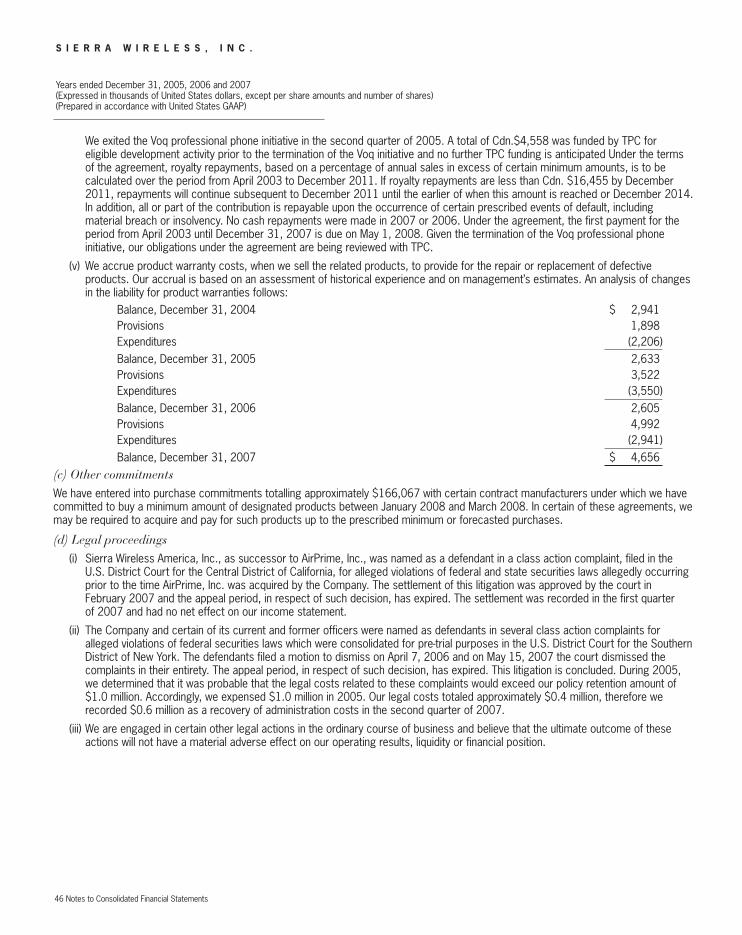
We exited the Voq professional phone initiative in the second quarter of 2005. A total of Cdn.$4,558 was funded by TPC for eligible development activity prior to the termination of the Voq initiative and no further TPC funding is anticipated Under the terms of the agreement, royalty repayments, based on a percentage of annual sales in excess of certain minimum amounts, is to be calculated over the period from April 2003 to December 2011. If royalty repayments are less than Cdn. $16,455 by December 2011, repayments will continue subsequent to December 2011 until the earlier of when this amount is reached or December 2014. In addition, all or part of the contribution is repayable upon the occurrence of certain prescribed events of default, including material breach or insolvency. No cash repayments were made in 2007 or 2006. Under the agreement, the first payment for the period from April 2003 until December 31, 2007 is due on May 1, 2008. Given the termination of the Voq professional phone initiative, our obligations under the agreement are being reviewed with TPC.
(v) We accrue product warranty costs, when we sell the related products, to provide for the repair or replacement of defective products. Our accrual is based on an assessment of historical experience and on management’s estimates. An analysis of changes in the liability for product warranties follows:
Balance, December 31, 2004 $ 2,941Provisions 1,898Expenditures (2,206)Balance, December 31, 2005 2,633Provisions 3,522Expenditures (3,550)Balance, December 31, 2006 2,605Provisions 4,992Expenditures (2,941)Balance, December 31, 2007 $ 4,656
(c) Other commitmentsWe have entered into purchase commitments totalling approximately $166,067 with certain contract manufacturers under which we havecommitted to buy a minimum amount of designated products between January 2008 and March 2008. In certain of these agreements, wemay be required to acquire and pay for such products up to the prescribed minimum or forecasted purchases.
(d) Legal proceedings (i) Sierra Wireless America, Inc., as successor to AirPrime, Inc., was named as a defendant in a class action complaint, filed in the
U.S. District Court for the Central District of California, for alleged violations of federal and state securities laws allegedly occurring prior to the time AirPrime, Inc. was acquired by the Company. The settlement of this litigation was approved by the court in February 2007 and the appeal period, in respect of such decision, has expired. The settlement was recorded in the first quarter of 2007 and had no net effect on our income statement.
(ii) The Company and certain of its current and former officers were named as defendants in several class action complaints for alleged violations of federal securities laws which were consolidated for pre-trial purposes in the U.S. District Court for the Southern District of New York. The defendants filed a motion to dismiss on April 7, 2006 and on May 15, 2007 the court dismissed the complaints in their entirety. The appeal period, in respect of such decision, has expired. This litigation is concluded. During 2005, we determined that it was probable that the legal costs related to these complaints would exceed our policy retention amount of $1.0 million. Accordingly, we expensed $1.0 million in 2005. Our legal costs totaled approximately $0.4 million, therefore we recorded $0.6 million as a recovery of administration costs in the second quarter of 2007.
(iii) We are engaged in certain other legal actions in the ordinary course of business and believe that the ultimate outcome of these actions will not have a material adverse effect on our operating results, liquidity or financial position.
Years ended December 31, 2005, 2006 and 2007(Expressed in thousands of United States dollars, except per share amounts and number of shares)(Prepared in accordance with United States GAAP)
S I E R R A W I R E L E S S , I N C .
46 Notes to Consolidated Financial Statements
swi_annual_artwork07:sierra wireless 3/13/08 2:45 PM Page 48

17. Supplementary information2005 2006 2007
(a) Cash flow information:Cash received
Interest $ 2,792 $ 4,204 $ 5,019Income taxes 1,590 717 10
Cash paid forInterest 59 19 —Income taxes 470 247 5,592
Non-cash financing activitiesPurchase of fixed assets funded by obligations under capital lease 24 — —Issuance of common shares on acquisition (note 3) — — 17,597
(b) Allowance for doubtful accounts:Opening balance $ 2,468 $ 1,561 $ 1,867Bad debt expense (recovery) (36) 315 342Write offs and settlements (871) (9) (270)Closing balance $ 1,561 $ 1,867 $ 1,939
(c) Other:Rent expense $ 2,168 $ 2,334 $ 2,393Foreign exchange gain (loss) (951) 911 (411)
18. Segmented informationWe operate in the wireless communications solutions industry and sales of our products and services are made in two segments within the industry – mobile computing and machine-to-machine. Management makes decisions about allocating resources based on the two operating segments that are aggregated as a result of their similar economic characteristics.
Revenue by product were as follows: 2005 2006 2007
AirCards $ 74,495 $ 156,512 $ 315,906Embedded modules 13,419 51,888 91,243Mobile and M2M 14,154 7,082 25,694Other 5,076 5,803 7,060
$ 107,144 $ 221,285 $ 439,903
As at December 31, 2007, 28% (2006 – 34%) of our fixed assets are in Canada. In the year ended December 31, 2007, product sales in the Americas were 69% (2006 – 64%; 2005 – 69%).
We sell certain products through resellers, original equipment manufacturers, and wireless service providers who sell these products toend-users. The approximate sales to significant customers are as follows:
2005 2006 2007
Customer A $ 20,585 $ 62,747 $ 106,685Customer B 17,545 25,502 87,354
Years ended December 31, 2005, 2006 and 2007(Expressed in thousands of United States dollars, except per share amounts and number of shares)(Prepared in accordance with United States GAAP)
S I E R R A W I R E L E S S , I N C .
Notes to Consolidated Financial Statements 47
swi_annual_artwork07:sierra wireless 3/13/08 2:45 PM Page 49

Head OfficeSierra Wireless, Inc.13811 Wireless WayRichmondBritish Columbia Canada V6V 3A4
Telephone604 231 1100
Facsimile 604 231 1109
Website www.sierrawireless.com
General CounselBlake, Cassels & Graydon LLPVancouver, BC
US CounselDavis Wright Tremaine LLPPortland, Oregon
Intellectual Property LawyersThelen Reid & Priest LLPSan Jose, California
AuditorsKPMG LLPVancouver, BC
Executive Officers
Jason W. CohenourPresident and Chief Executive OfficerDavid G. McLennanChief Financial Officer and SecretaryJames B. KirkpatrickChief Technical OfficerTrent H. PunnettSenior Vice President, Marketing andCorporate Development
Officers
Andrew BermanSenior Vice President and General Manager, Mobile and M2MSteve BlaineSenior Vice President, EngineeringBill G. DodsonSenior Vice President, OperationsDan SchielerSenior Vice President, Worldwide SalesMike ArdelanVice President, North American Enterprise and OEM SalesJim BaichtalVice President, Technology, Mobile and M2M
Steve BurringtonVice President, Worldwide Systems EngineeringJocelyn ChangVice President, FinanceScott DavisVice President, Sales, Mobile and M2MEvan JonesVice President, EngineeringJim LaheyVice President, Europe, Middle East and AfricaMike O’BrienVice President, North American Carrierand Distribution SalesJin PakVice President, Sales, Asia-Pacific and Central and Latin AmericaJustin SchmidVice President, Mobile and M2MGreg SpeakmanVice President, Adapter MarketingPat WatsonVice President, Human ResourcesRich WintersVice President, Supply Chain
S I E R R A W I R E L E S S , I N C .
Transfer AgentComputershare Investor Services Inc.Vancouver, BC
Share InformationThe common shares of Sierra Wireless,Inc. are listed for trading under the symbol SW on The Toronto Stock Exchange and under SWIR on The Nasdaq Global Market.
Annual General MeetingThe Annual General Meeting for the shareholders of Sierra Wireless, Inc. will be held on May 1, 2008 at 2:30 p.m. (Pacific) at the Company’s head office in Richmond, British Columbia.
Directors
Gregory D. Aasen (3)
Corporate DirectorPaul G. Cataford (1) , (2)
President and Chief Executive OfficerUniversity Technologies International, Inc.Peter Ciceri (1) , (3)
PresidentCustom House Global Foreign ExchangeCharles E. Levine (2), (3)
Chairman of the BoardS. Jane Rowe (1)
Corporate DirectorDavid B. Sutcliffe (2)
Corporate DirectorKent Thexton (3)
Executive ChairmanSEVEN Networks, Inc.Jason W. CohenourPresident and Chief Executive OfficerSierra Wireless, Inc.
(1) Audit Committee(2) Governance and Nominating Committee(3) Human Resources Committee
48 Corporate Information
swi_annual_artwork07:sierra wireless 3/13/08 2:45 PM Page 50

swi_annual_artwork07:sierra wireless 3/13/08 2:45 PM Page 51

www.sierrawireless.com
swi_annual_artwork07:sierra wireless 3/13/08 2:45 PM Page 52