2007-09-19 uv disinfection for interactive fountains
TRANSCRIPT
1
October 10, 2003
Jim CosmanGary VanderlaanSeptember 19, 2007
Gaining Enhanced Public Health Protection by Implementing Validated UV Disinfection Systems on Interactive Fountains
2
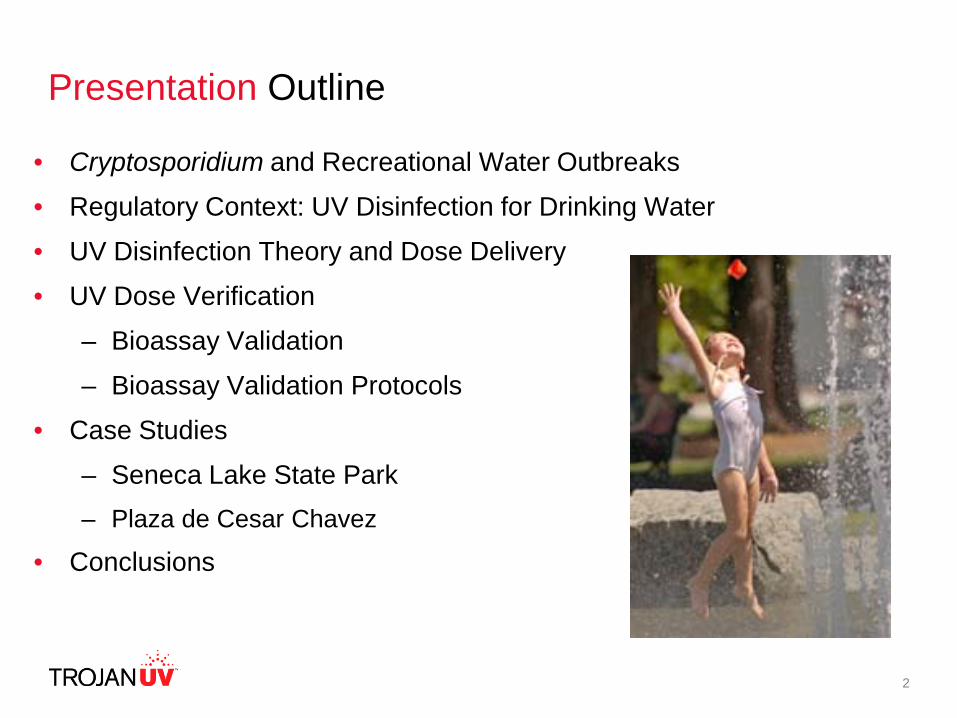
Presentation Outline
• Cryptosporidium and Recreational Water Outbreaks
• Regulatory Context: UV Disinfection for Drinking Water
• UV Disinfection Theory and Dose Delivery
• UV Dose Verification
– Bioassay Validation
– Bioassay Validation Protocols
• Case Studies
– Seneca Lake State Park– Plaza de Cesar Chavez
• Conclusions
3
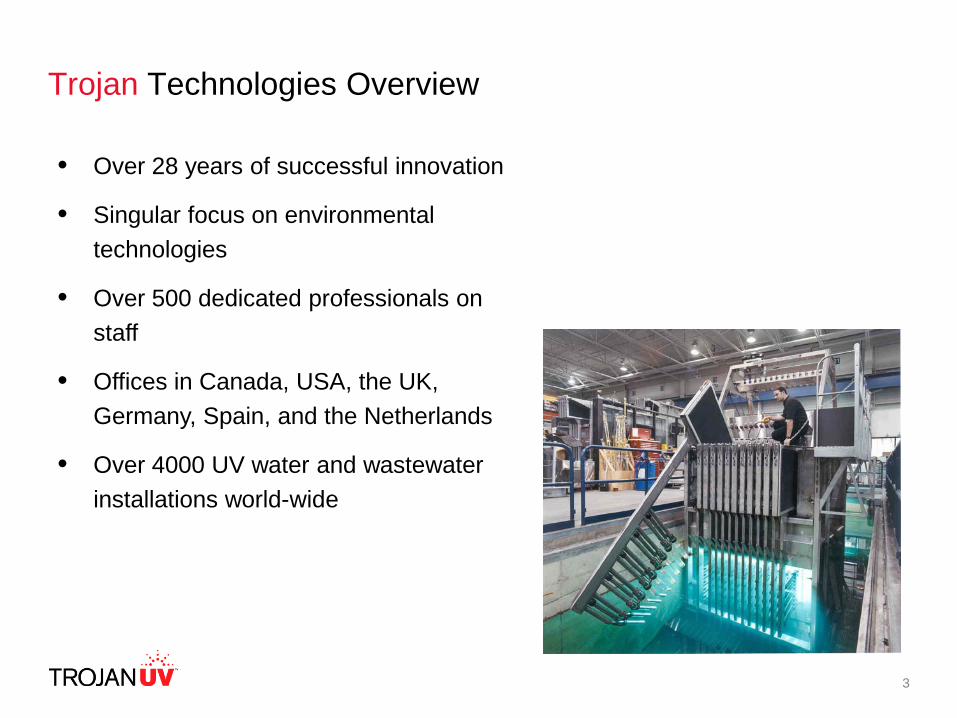
• Over 28 years of successful innovation
• Singular focus on environmental technologies
• Over 500 dedicated professionals on staff
• Offices in Canada, USA, the UK, Germany, Spain, and the Netherlands
• Over 4000 UV water and wastewater installations world-wide
Trojan Technologies Overview
4
Danaher Environmental Business Platform
Cryptosporidium and Recreational Water Outbreaks
6
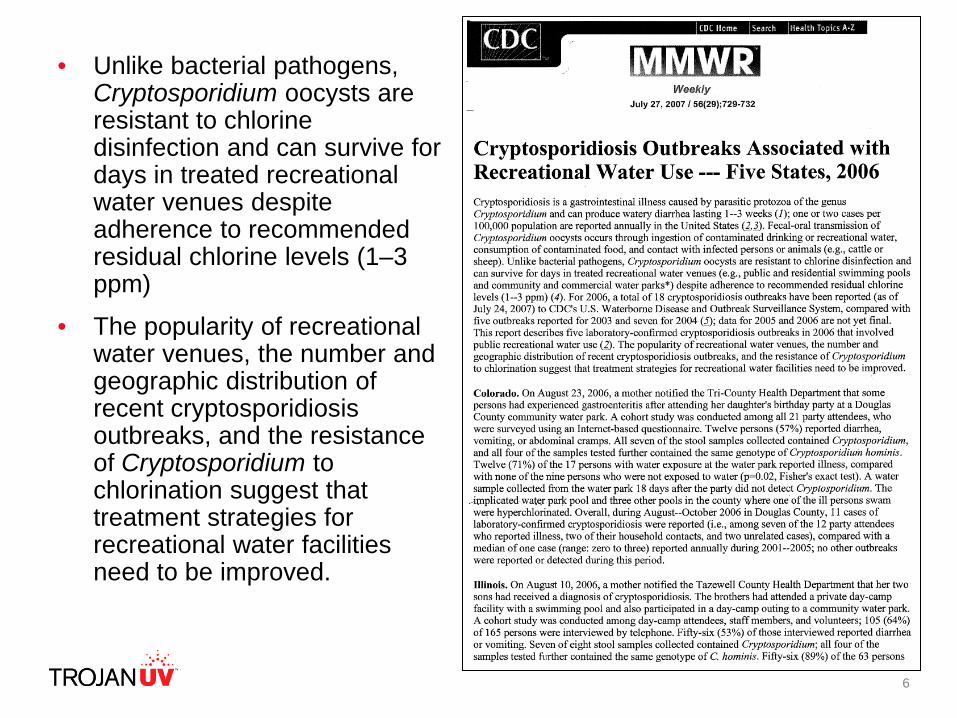
• Unlike bacterial pathogens, Cryptosporidium oocysts are resistant to chlorine disinfection and can survive for days in treated recreational water venues despite adherence to recommended residual chlorine levels (1–3 ppm)
• The popularity of recreational water venues, the number and geographic distribution of recent cryptosporidiosis outbreaks, and the resistance of Cryptosporidium to chlorination suggest that treatment strategies for recreational water facilities need to be improved.
7
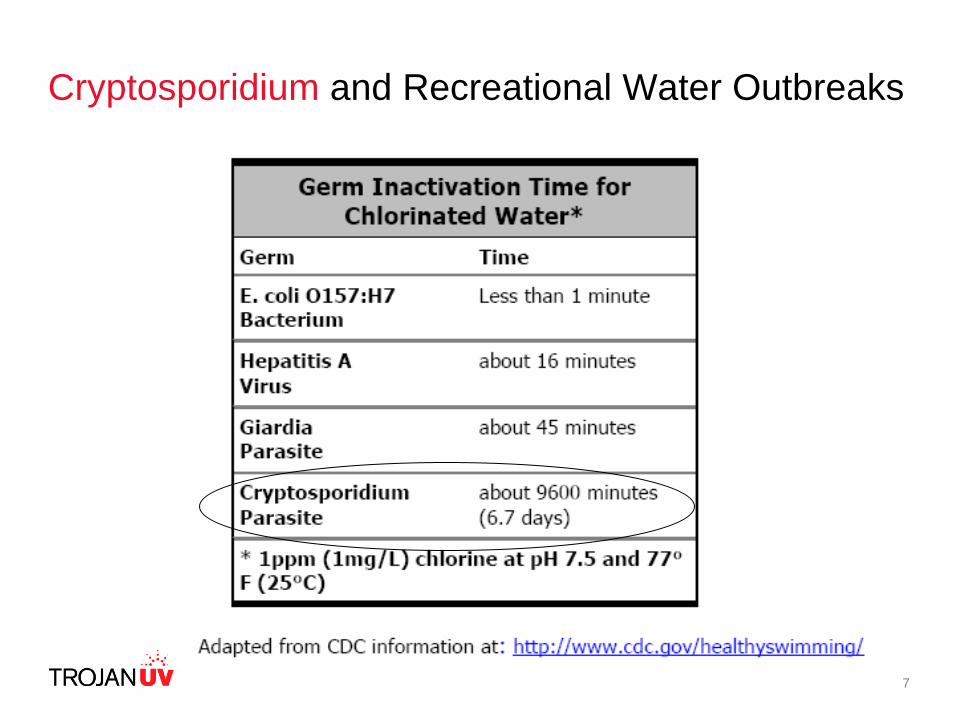
Cryptosporidium and Recreational Water Outbreaks
8
Regulatory Context: UV Disinfection for Drinking Water
10
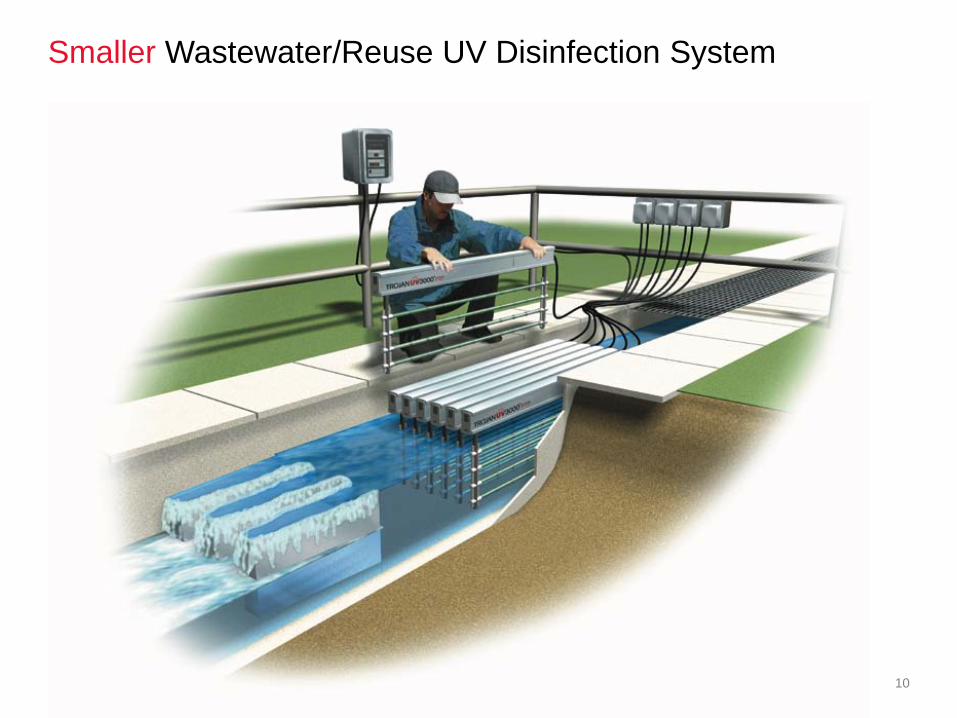
Smaller Wastewater/Reuse UV Disinfection System
11
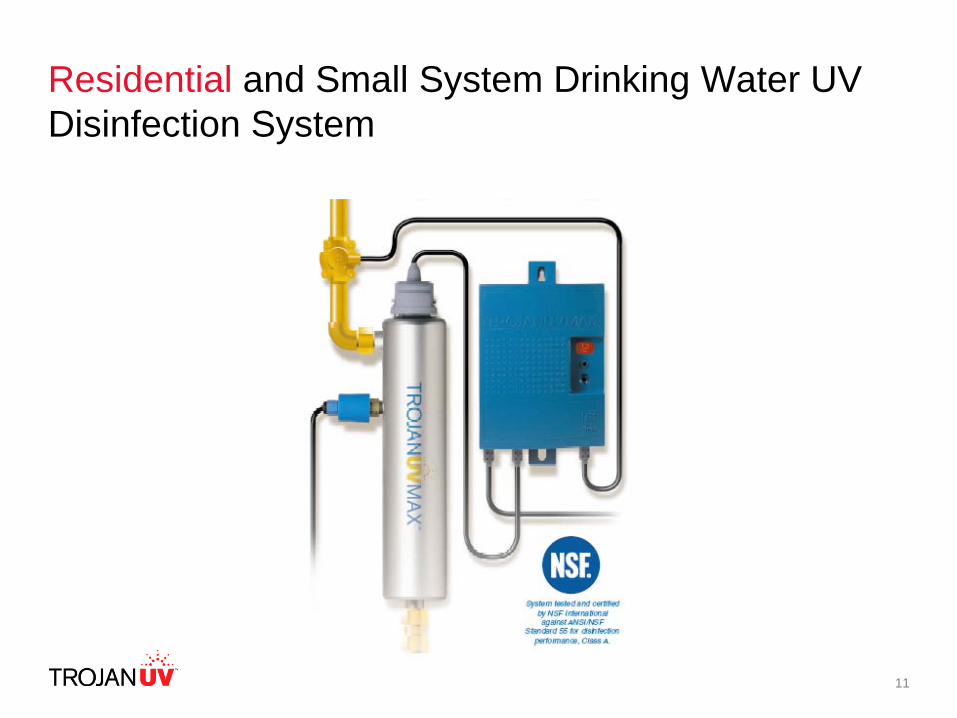
Residential and Small System Drinking Water UV Disinfection System
12
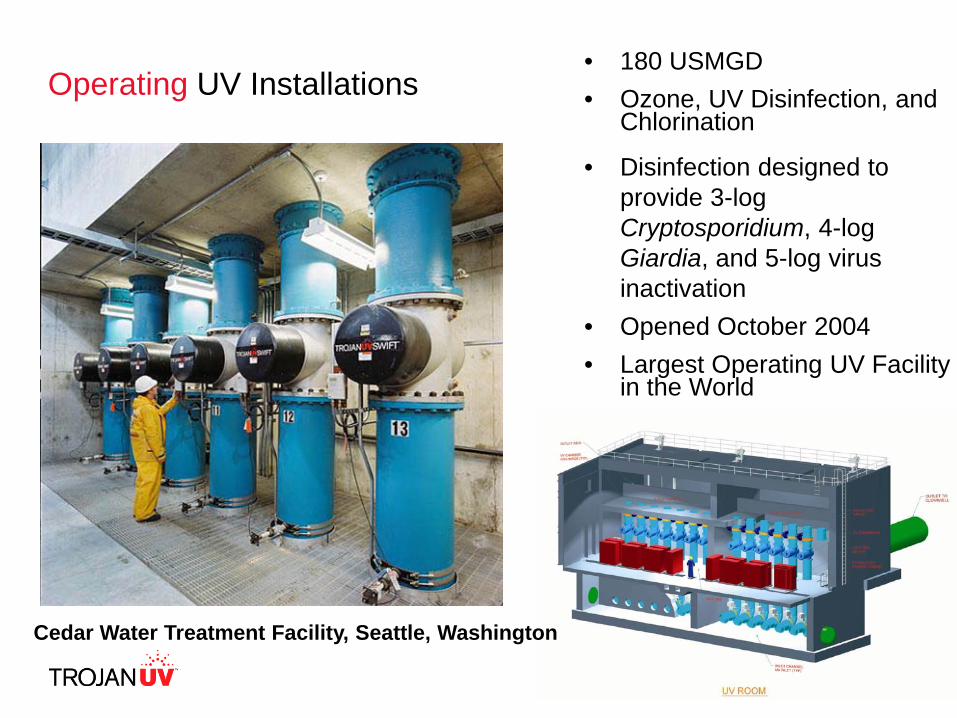
Operating UV Installations
Seattle, Washington, USA
• 180 USMGD• Ozone, UV Disinfection, and
Chlorination
• Disinfection designed to provide 3-log Cryptosporidium, 4-log Giardia, and 5-log virus inactivation
• Opened October 2004• Largest Operating UV Facility
in the World
Cedar Water Treatment Facility, Seattle, Washington
13
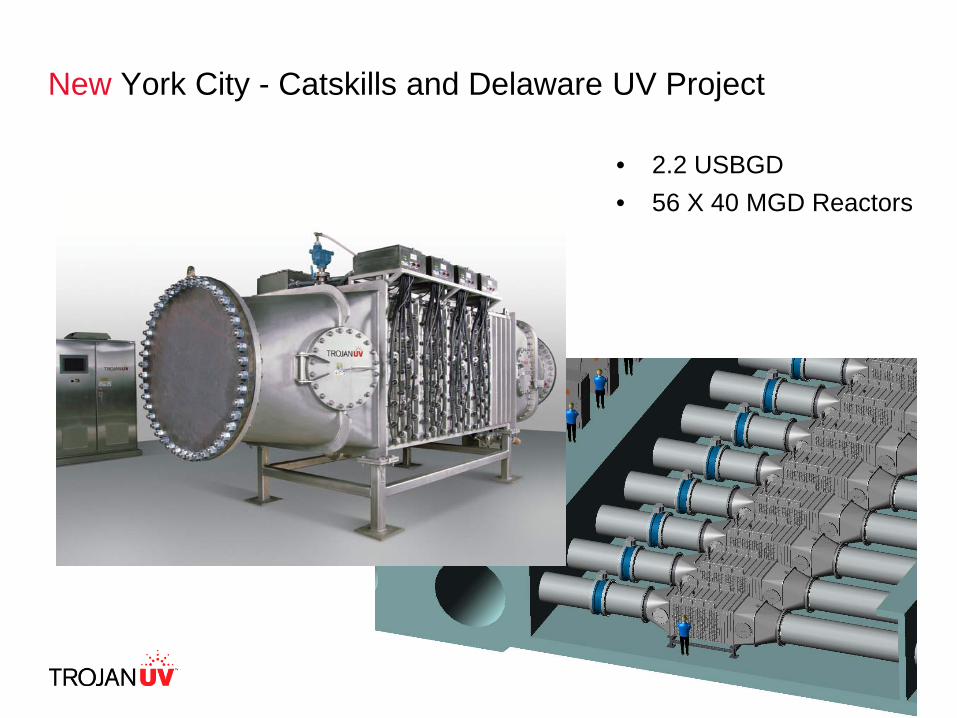
New York City - Catskills and Delaware UV Project
• 2.2 USBGD• 56 X 40 MGD Reactors
14
0
50
100
150
200
250
300
350
400
450
1980
1982
1984
1986
1988
1990
1992
1994
1996
1998
2000Nu
mbe
r of P
WS
usin
g UV
Dis
infe
ctio
n
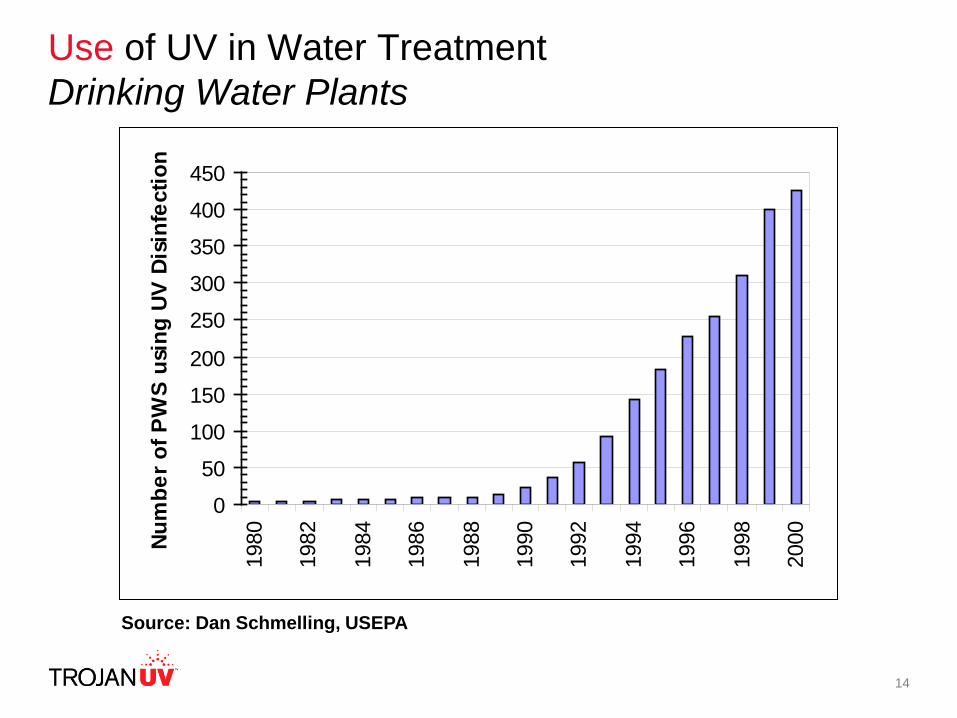
Use of UV in Water TreatmentDrinking Water Plants
Source: Dan Schmelling, USEPA
15
Factors Impacting Growth in UV Disinfection
• Is effective against Giardia cysts and Cryptosporidiumoocysts
• Does not contribute to formation of Disinfection Byproducts
• Synergistically participates in integrated disinfection scenario
• Regulatory change
16
020
4060
80100
120140
Tec
hnol
ogy
cost
(c
ents
/kga
l)
0.6 MGD 6 MGD 60 MGDSystem design flow
MF/UFOzoneUV
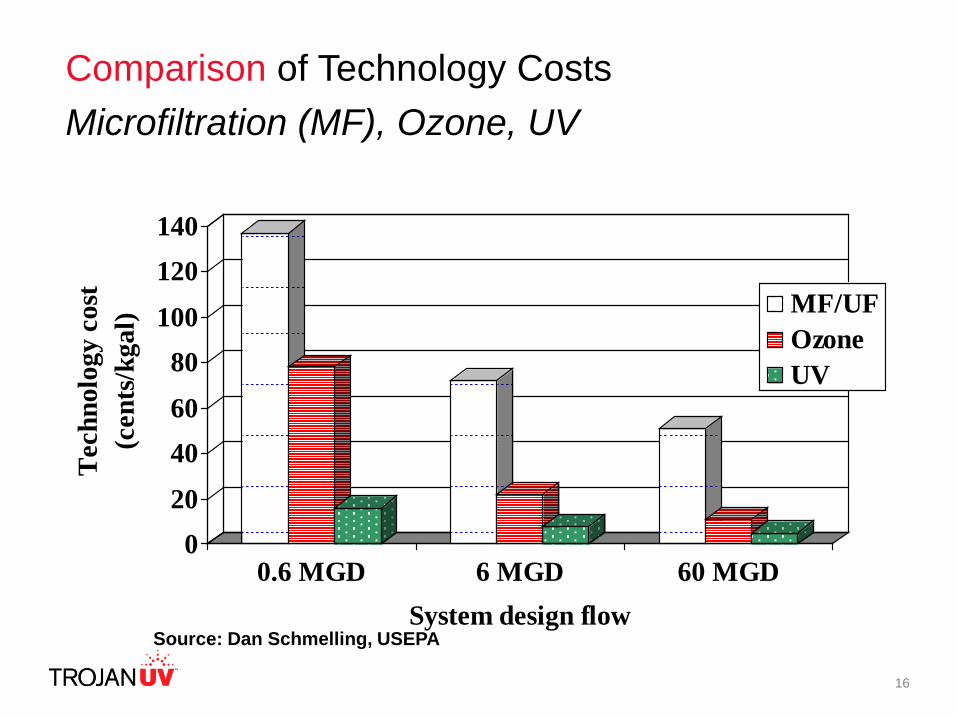
Comparison of Technology CostsMicrofiltration (MF), Ozone, UV
Source: Dan Schmelling, USEPA
17
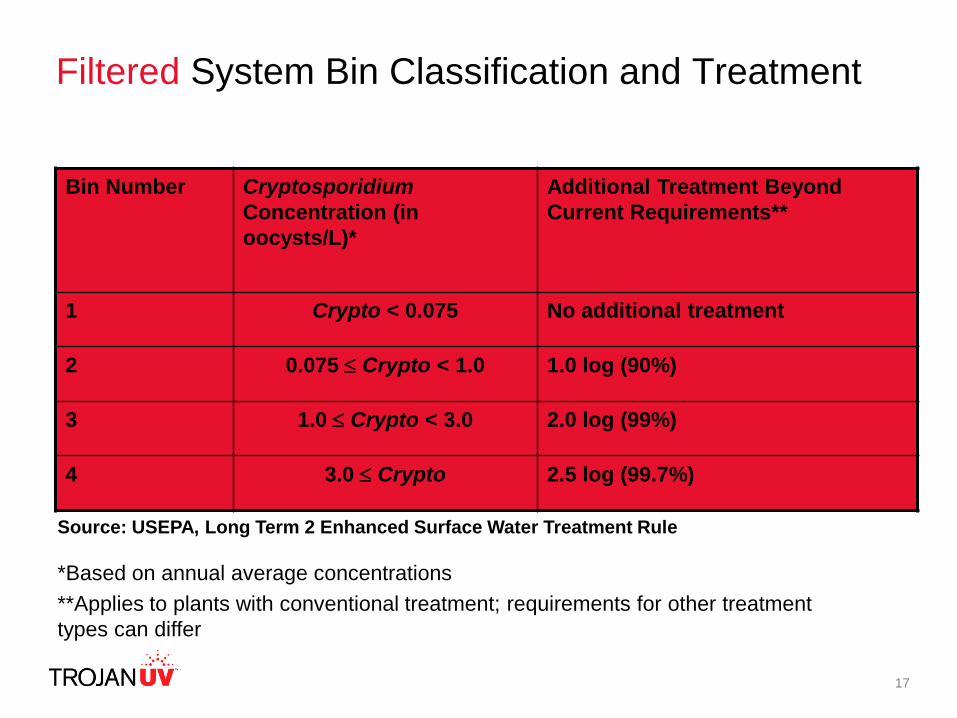
Filtered System Bin Classification and Treatment
Bin Number Cryptosporidium Concentration (in oocysts/L)*
Additional Treatment Beyond Current Requirements**
1 Crypto < 0.075 No additional treatment
2 0.075 ≤ Crypto < 1.0 1.0 log (90%)
3 1.0 ≤ Crypto < 3.0 2.0 log (99%)
4 3.0 ≤ Crypto 2.5 log (99.7%)
*Based on annual average concentrations**Applies to plants with conventional treatment; requirements for other treatment types can differ
Source: USEPA, Long Term 2 Enhanced Surface Water Treatment Rule
18
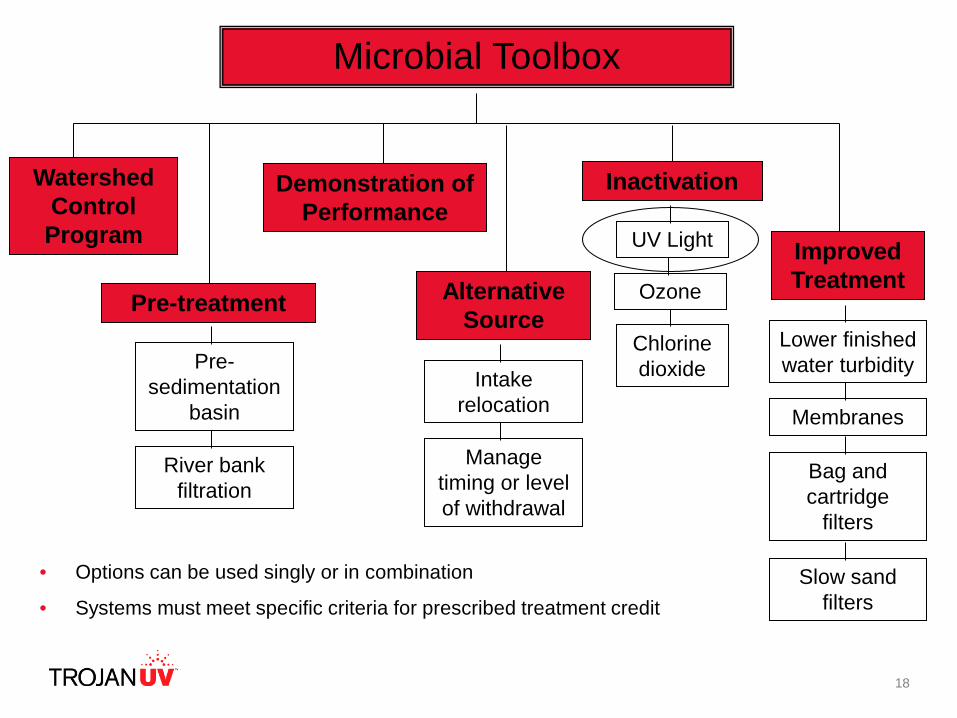
Microbial Toolbox
Watershed Control Program
Inactivation
Improved Treatment
Pre-treatment Alternative Source
Demonstration of Performance
Chlorine dioxide
Ozone
UV Light
Pre-sedimentation
basin
River bank filtration
Intake relocation
Manage timing or level of withdrawal
Lower finished water turbidity
Membranes
Bag and cartridge
filters
Slow sand filters
• Options can be used singly or in combination
• Systems must meet specific criteria for prescribed treatment credit
19
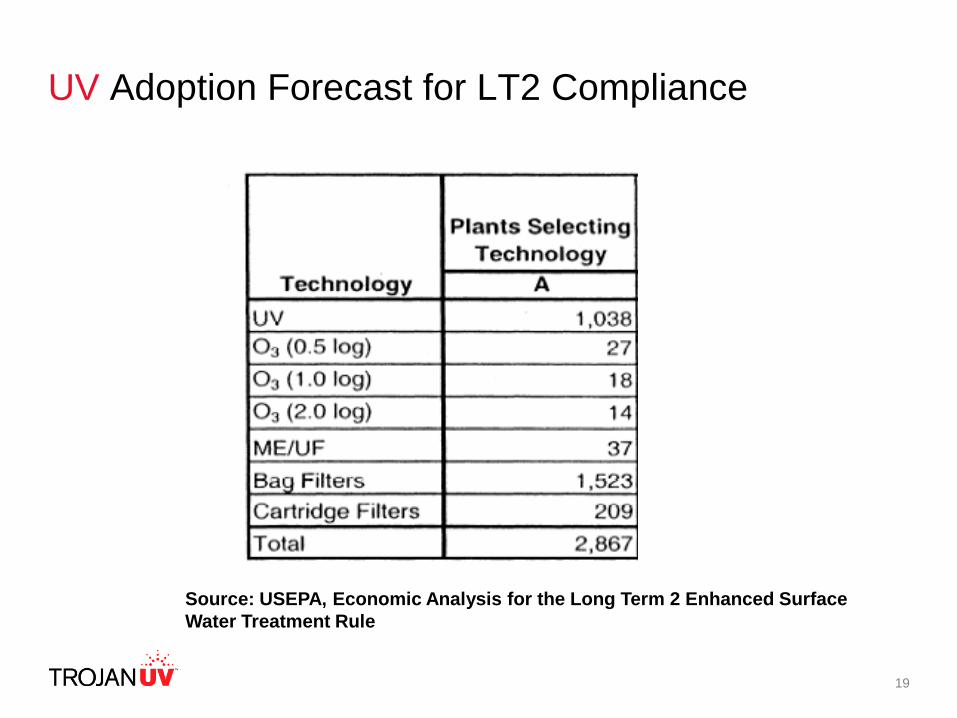
UV Adoption Forecast for LT2 Compliance
Source: USEPA, Economic Analysis for the Long Term 2 Enhanced Surface Water Treatment Rule
20
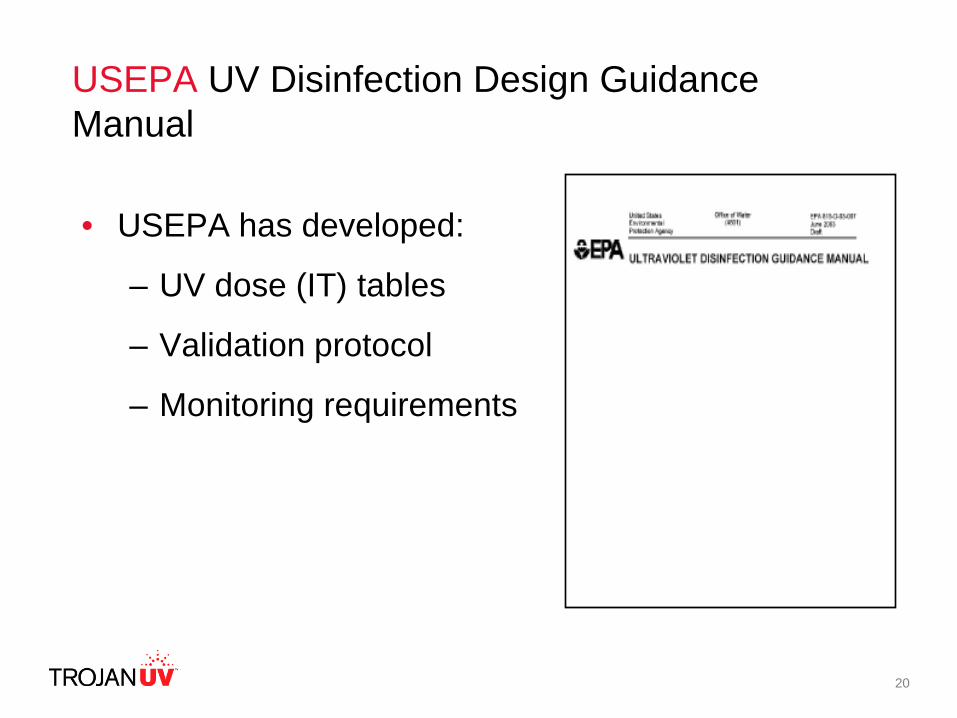
USEPA UV Disinfection Design Guidance Manual
• USEPA has developed:
– UV dose (IT) tables
– Validation protocol
– Monitoring requirements
UV Disinfection Theory and Dose Delivery
22
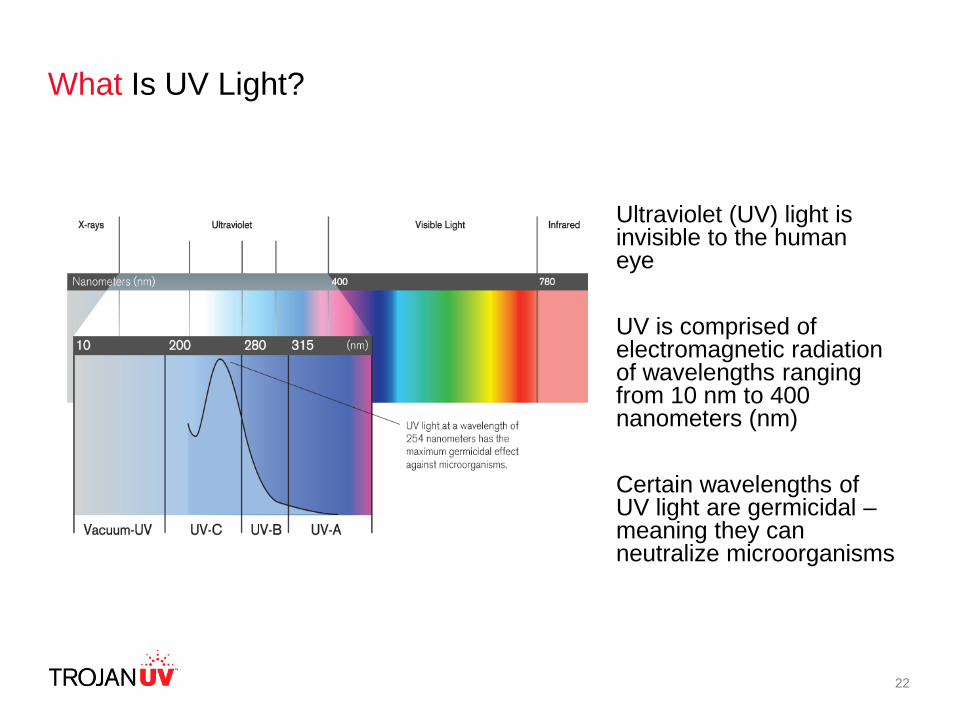
Ultraviolet (UV) light is invisible to the human eye
UV is comprised of electromagnetic radiation of wavelengths ranging from 10 nm to 400 nanometers (nm)
Certain wavelengths of UV light are germicidal –meaning they can neutralize microorganisms
What Is UV Light?
23
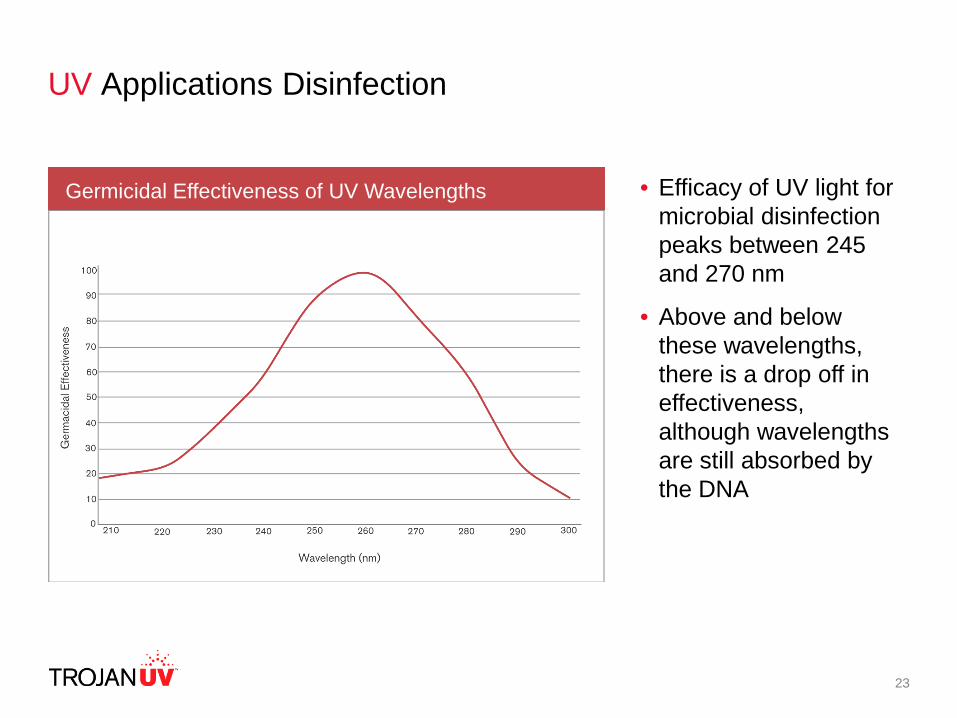
UV Applications Disinfection
Germicidal Effectiveness of UV Wavelengths • Efficacy of UV light for microbial disinfection peaks between 245 and 270 nm
• Above and below these wavelengths, there is a drop off in effectiveness, although wavelengths are still absorbed by the DNA
24
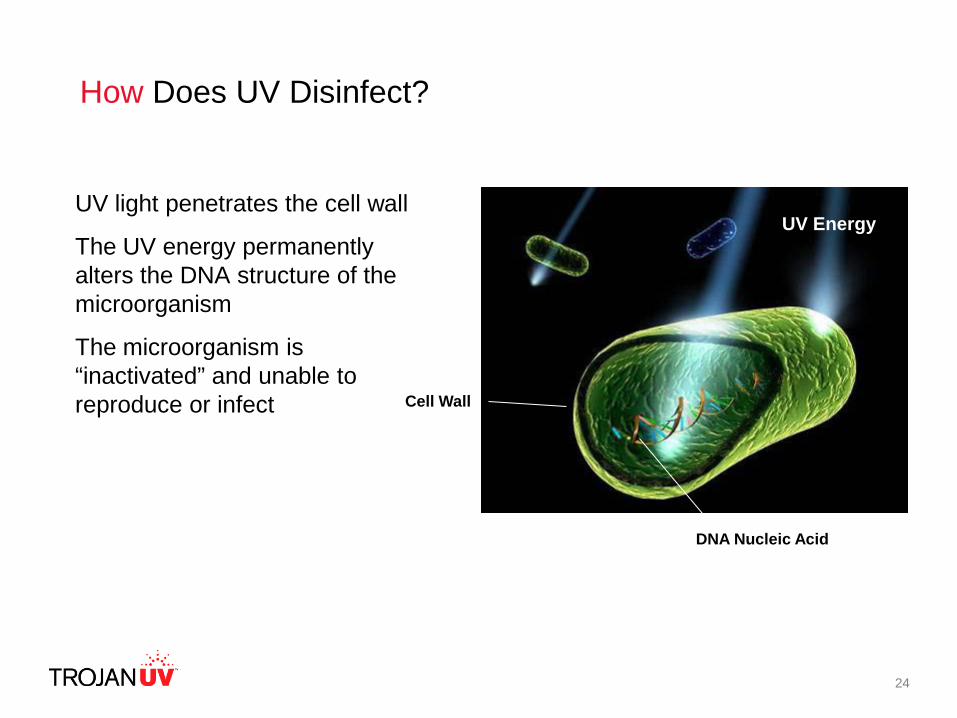
UV light penetrates the cell wall
The UV energy permanently alters the DNA structure of the microorganism
The microorganism is “inactivated” and unable to reproduce or infect
How Does UV Disinfect?
UV Energy
DNA Nucleic Acid
Cell Wall
25
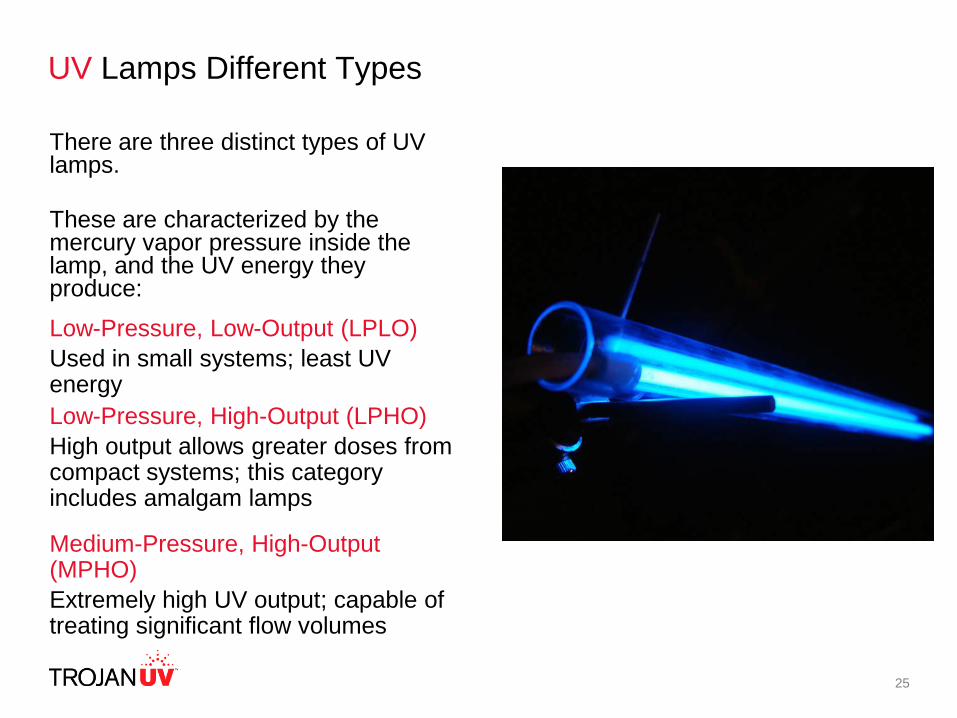
UV Lamps Different Types
There are three distinct types of UV lamps.
These are characterized by the mercury vapor pressure inside the lamp, and the UV energy they produce:
Low-Pressure, Low-Output (LPLO)Used in small systems; least UV energyLow-Pressure, High-Output (LPHO)High output allows greater doses from compact systems; this category includes amalgam lamps
Medium-Pressure, High-Output (MPHO)Extremely high UV output; capable of treating significant flow volumes
26
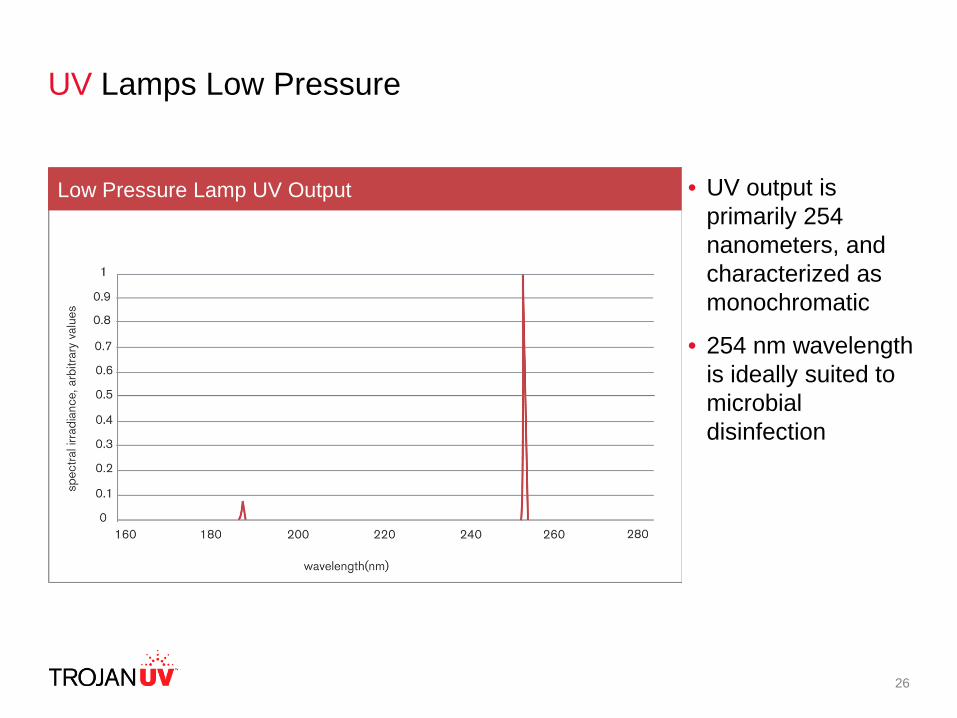
• UV output is primarily 254 nanometers, and characterized as monochromatic
• 254 nm wavelength is ideally suited to microbial disinfection
UV Lamps Low Pressure
Low Pressure Lamp UV Output
27
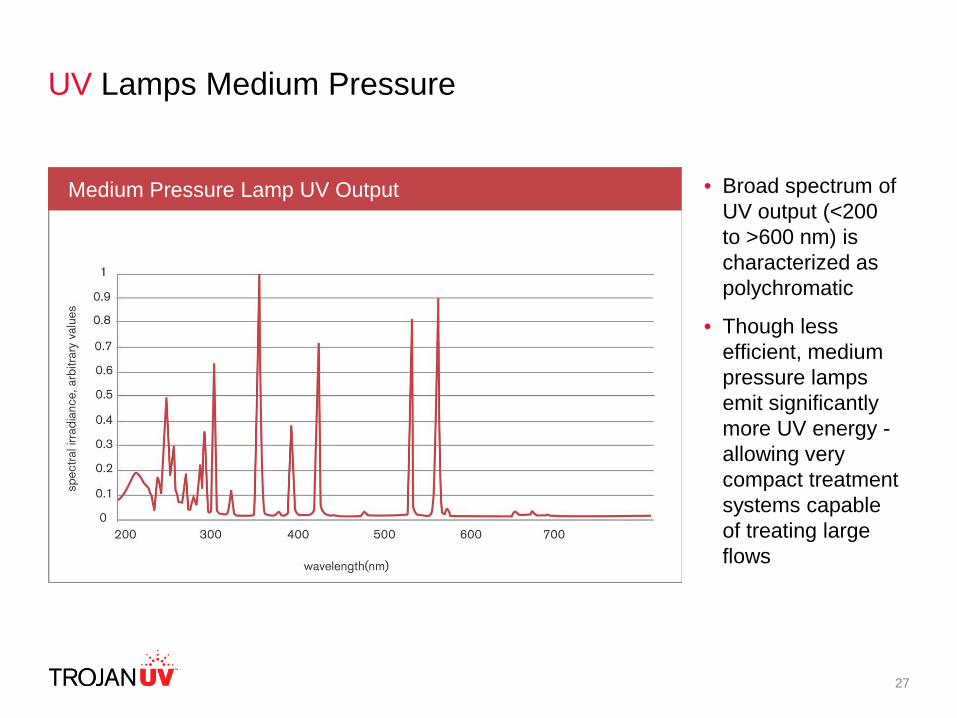
• Broad spectrum of UV output (<200 to >600 nm) is characterized as polychromatic
• Though less efficient, medium pressure lamps emit significantly more UV energy -allowing very compact treatment systems capable of treating large flows
UV Lamps Medium Pressure
Medium Pressure Lamp UV Output
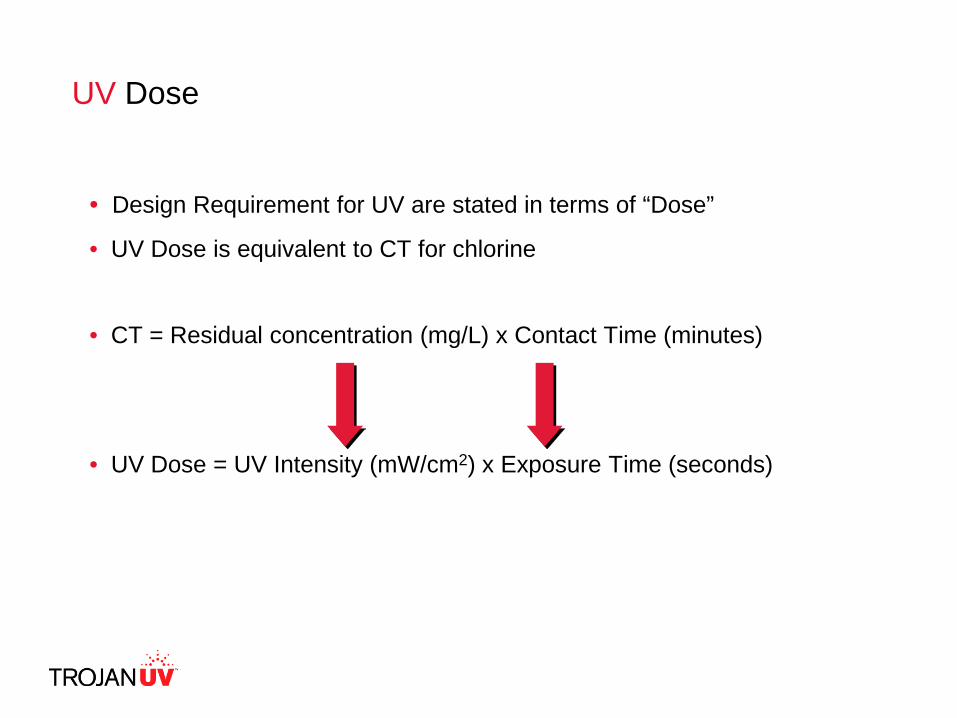
UV Dose
• Design Requirement for UV are stated in terms of “Dose”
• UV Dose is equivalent to CT for chlorine
• CT = Residual concentration (mg/L) x Contact Time (minutes)
• UV Dose = UV Intensity (mW/cm2) x Exposure Time (seconds)
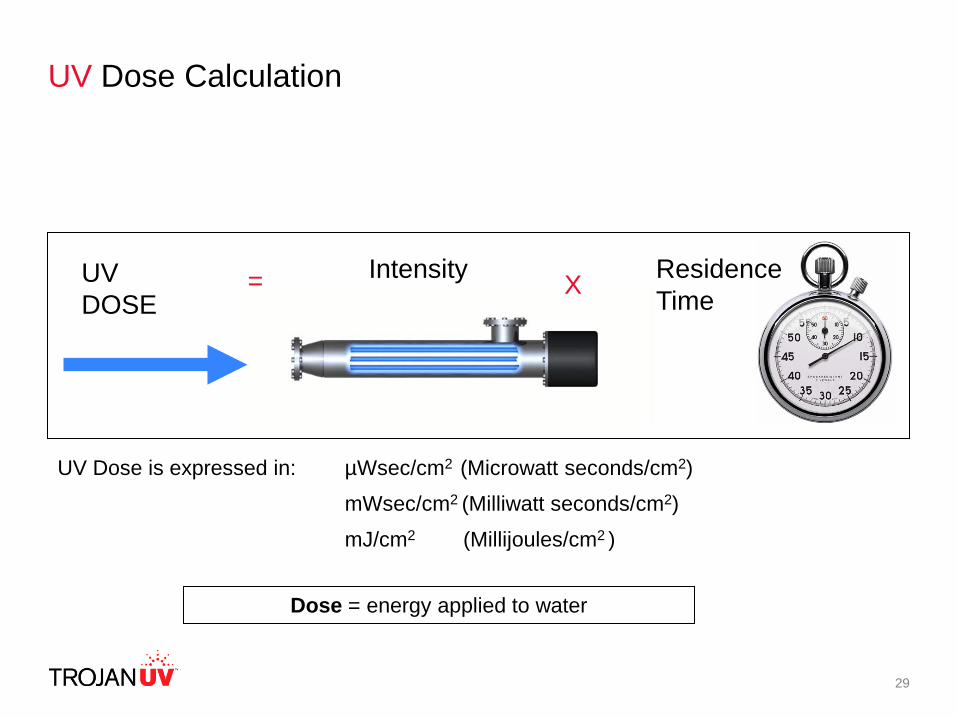
29
Intensity= ResidenceTimeXUV
DOSE
UV Dose is expressed in: µWsec/cm2 (Microwatt seconds/cm2)
mWsec/cm2 (Milliwatt seconds/cm2)
mJ/cm2 (Millijoules/cm2 )
UV Dose Calculation
Dose = energy applied to water
30
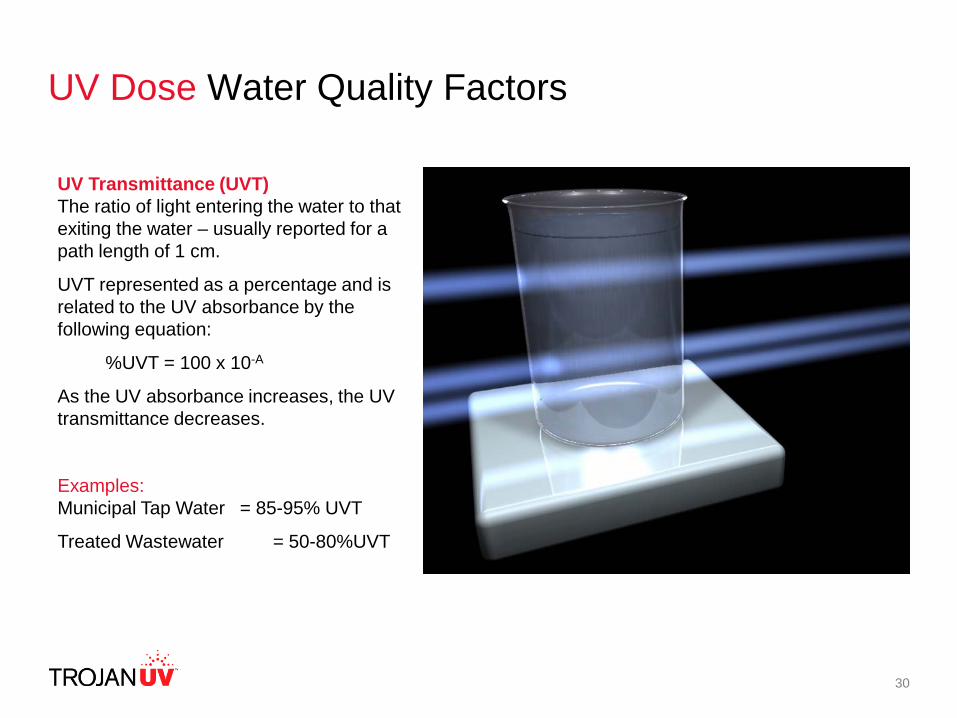
UV Dose Water Quality Factors
UV Transmittance (UVT)The ratio of light entering the water to that exiting the water – usually reported for a path length of 1 cm.
UVT represented as a percentage and is related to the UV absorbance by the following equation:
%UVT = 100 x 10-A
As the UV absorbance increases, the UV transmittance decreases.
Examples:Municipal Tap Water = 85-95% UVT
Treated Wastewater = 50-80%UVT
31
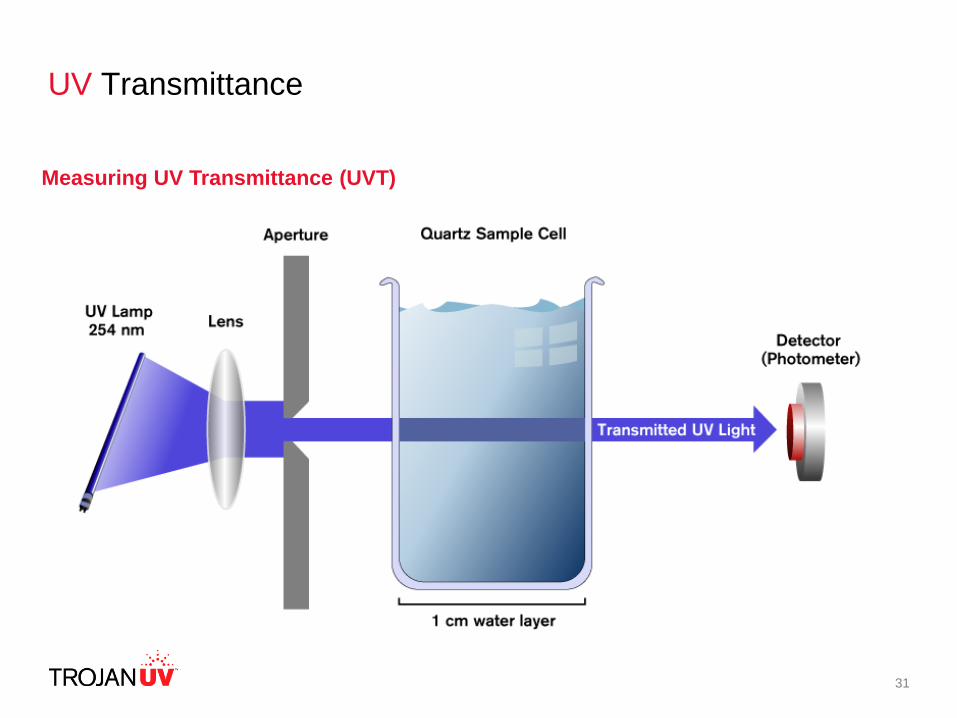
Measuring UV Transmittance (UVT)
UV Transmittance
32
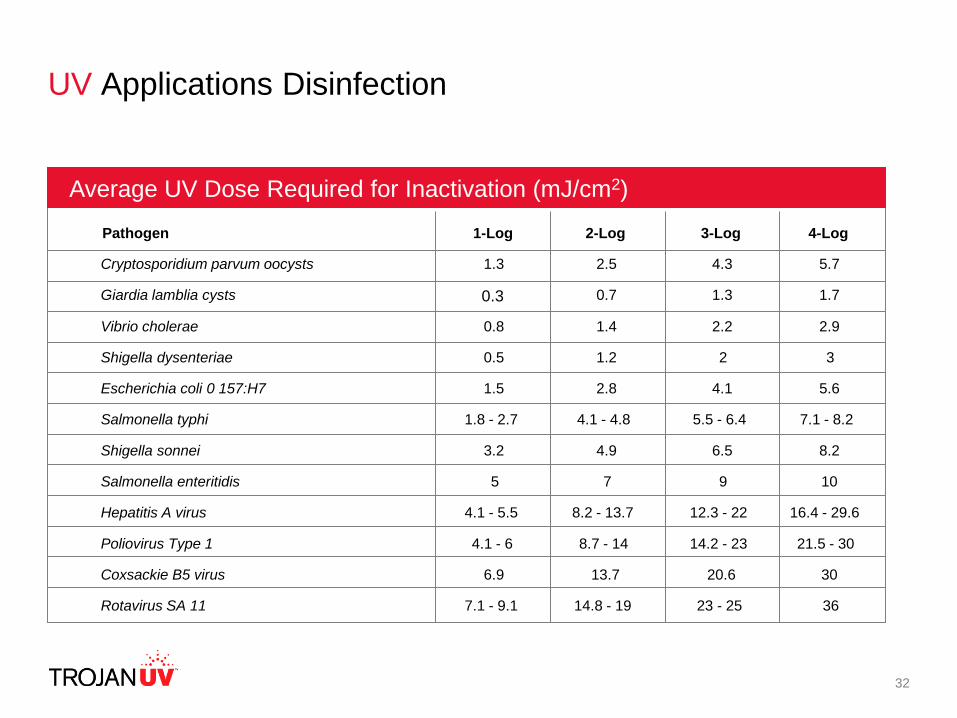
UV Applications Disinfection
Pathogen
1-Log 2-Log 3-Log 4-Log
Cryptosporidium parvum oocysts 1.3 2.5 4.3 5.7
Giardia lamblia cysts 0.7 1.3 1.7
Vibrio cholerae 0.8 1.4 2.2 2.9
Shigella dysenteriae 0.5 1.2 2 3
Escherichia coli 0 157:H7 1.5 2.8 4.1 5.6
Salmonella typhi 1.8 - 2.7 4.1 - 4.8 5.5 - 6.4 7.1 - 8.2
Shigella sonnei 3.2 4.9 6.5 8.2
Salmonella enteritidis 5 7 9 10
Hepatitis A virus 4.1 - 5.5 8.2 - 13.7 12.3 - 22 16.4 - 29.6
Poliovirus Type 1 4.1 - 6 8.7 - 14 14.2 - 23 21.5 - 30
Coxsackie B5 virus 6.9 13.7 20.6 30
Rotavirus SA 11 7.1 - 9.1 14.8 - 19 23 - 25 36
Average UV Dose mJ/cm 2 required to inactivateAverage UV Dose Required for Inactivation (mJ/cm2)
Pathogen
0.3
33
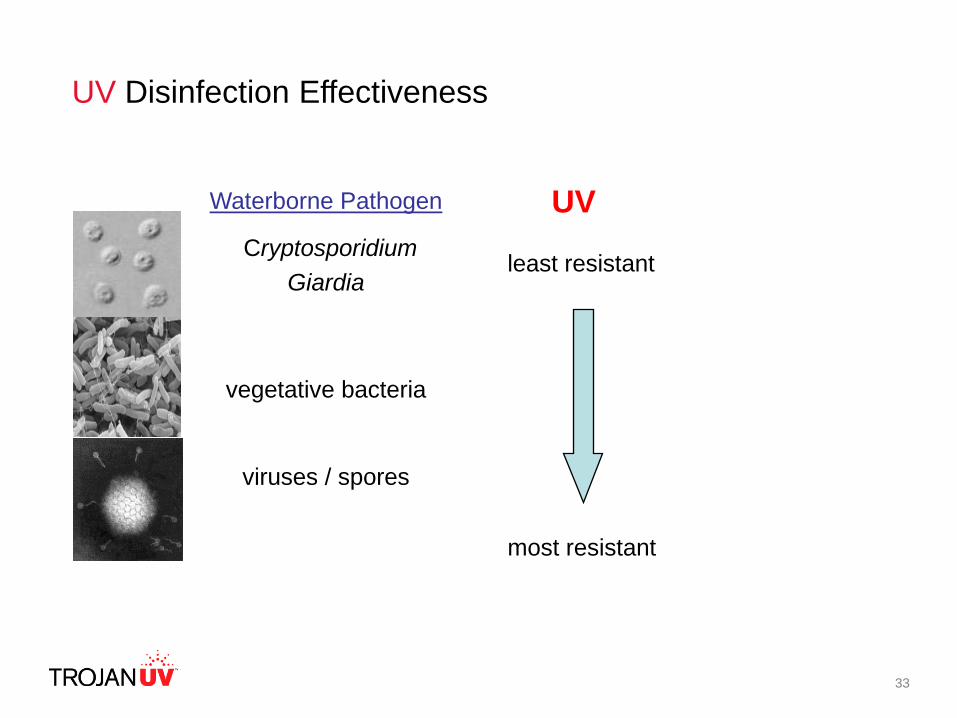
UV Disinfection Effectiveness
least resistant
most resistant
Waterborne Pathogen
Cryptosporidium Giardia
vegetative bacteria
viruses / spores
UV
34
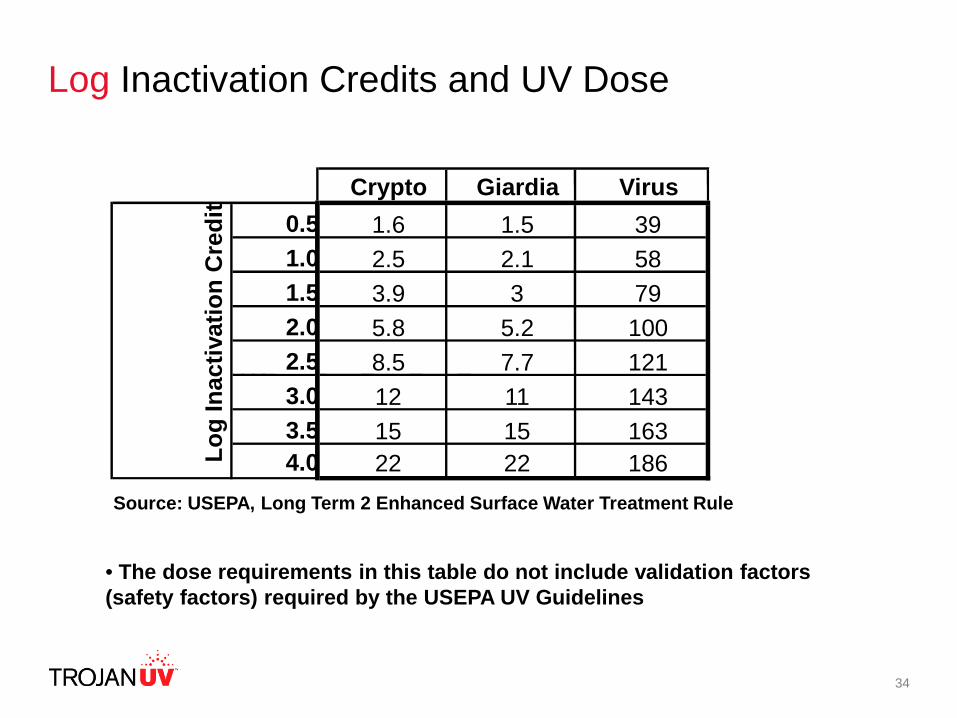
Log Inactivation Credits and UV Dose
Crypto Giardia Virus0.5 1.6 1.5 391.0 2.5 2.1 581.5 3.9 3 792.0 5.8 5.2 1002.5 8.5 7.7 1213.0 12 11 1433.5 15 15 1634.0 22 22 186Log
Inac
tivat
ion
Cre
dit
• The dose requirements in this table do not include validation factors (safety factors) required by the USEPA UV Guidelines
Source: USEPA, Long Term 2 Enhanced Surface Water Treatment Rule
UV Dose Verification
36
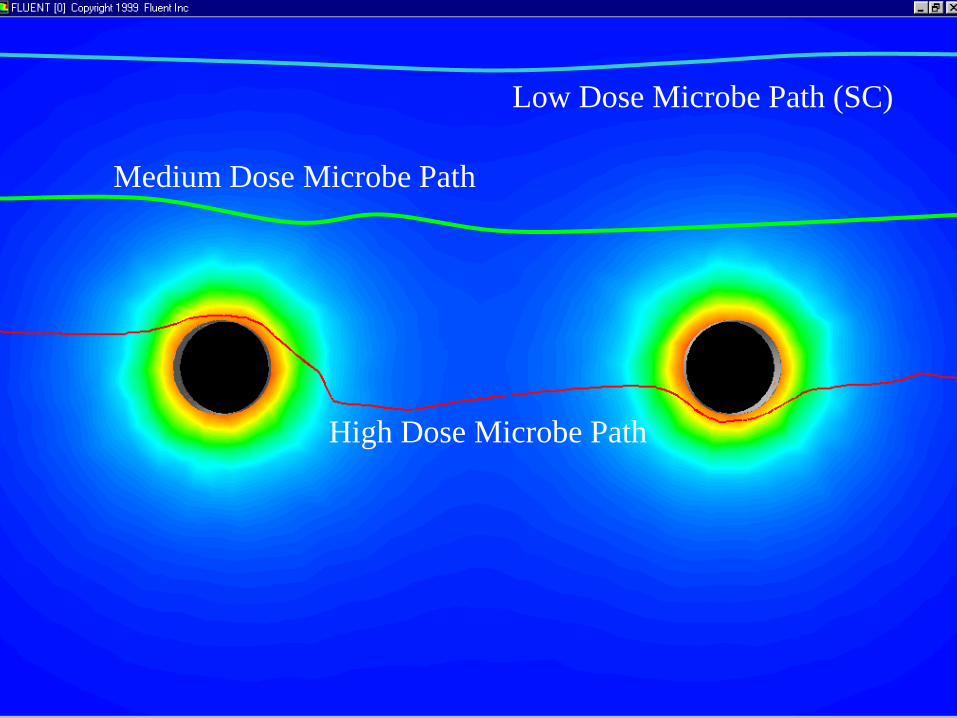
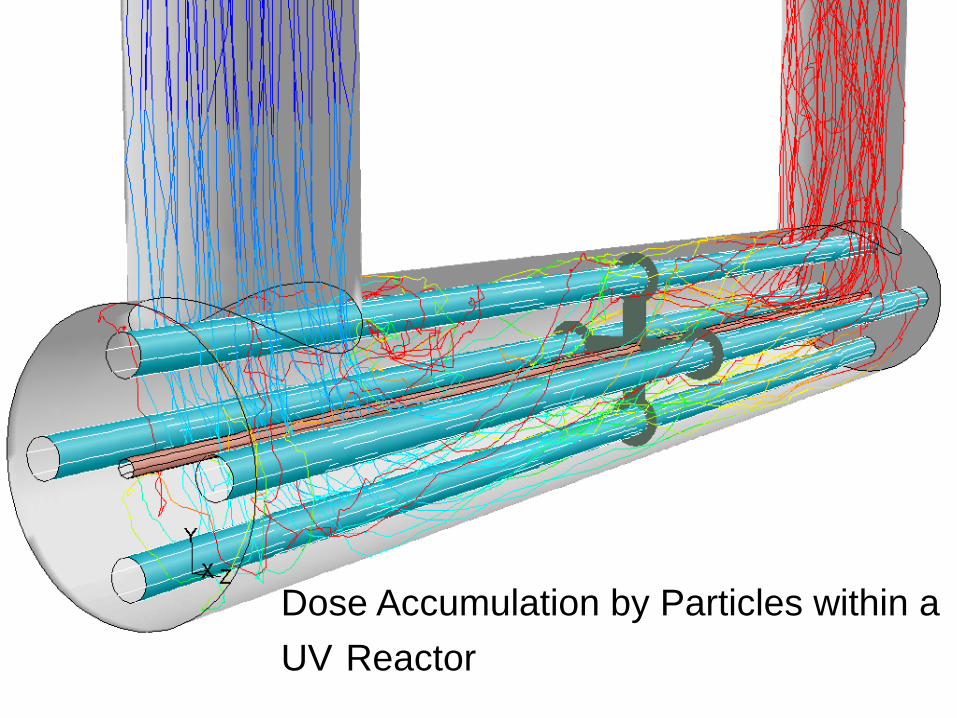
High Dose Microbe Path
Medium Dose Microbe Path
Low Dose Microbe Path (SC)
37
Dose Accumulation by Particles within a UV Reactor
38
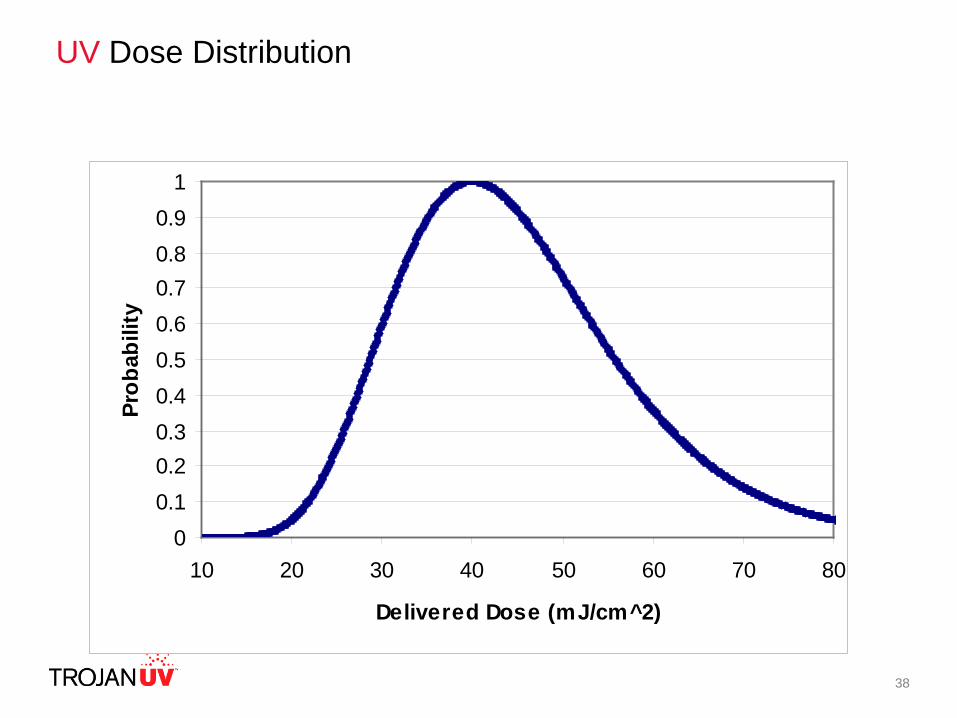
UV Dose Distribution
00.10.20.30.40.50.60.70.80.9
1
10 20 30 40 50 60 70 80
Delivered Dose (mJ/cm^2)
Prob
abili
ty
39
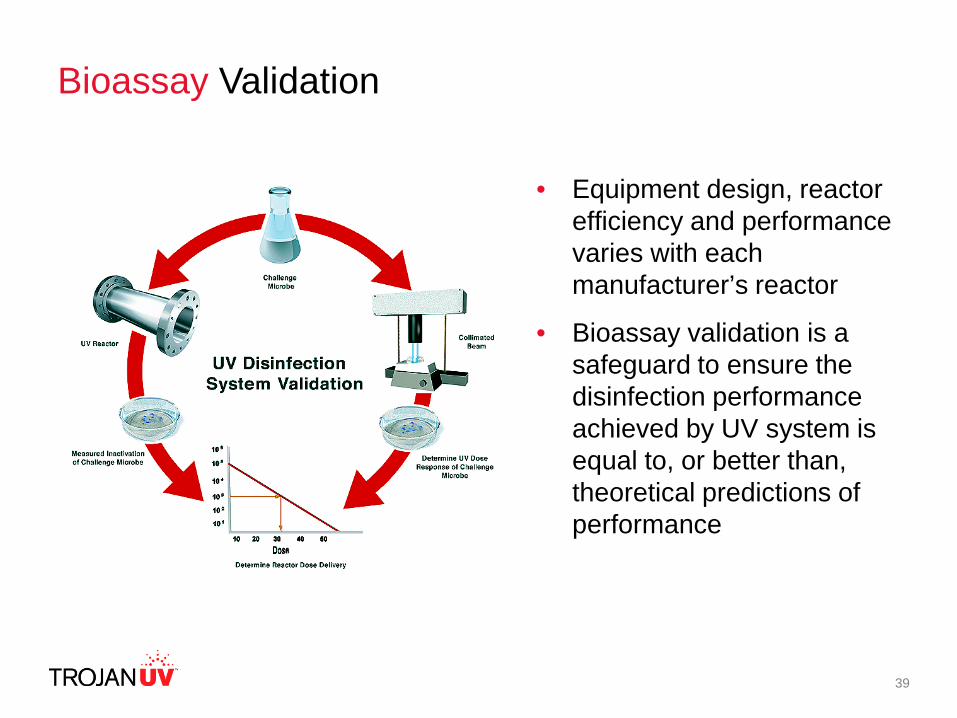
Bioassay Validation
• Equipment design, reactor efficiency and performance varies with each manufacturer’s reactor
• Bioassay validation is a safeguard to ensure the disinfection performance achieved by UV system is equal to, or better than, theoretical predictions of performance
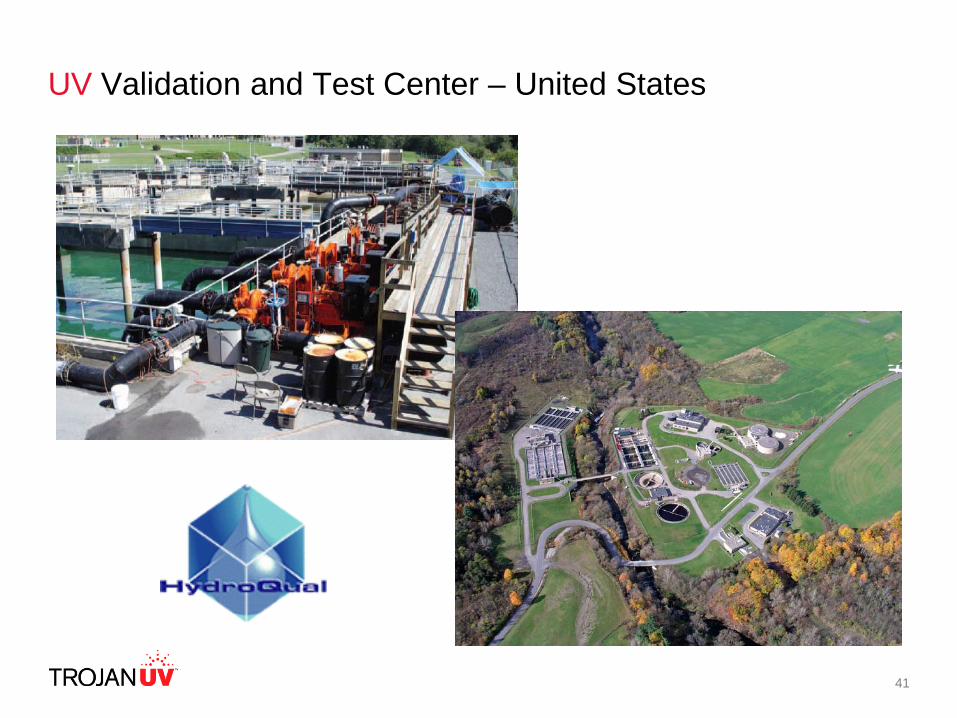
41
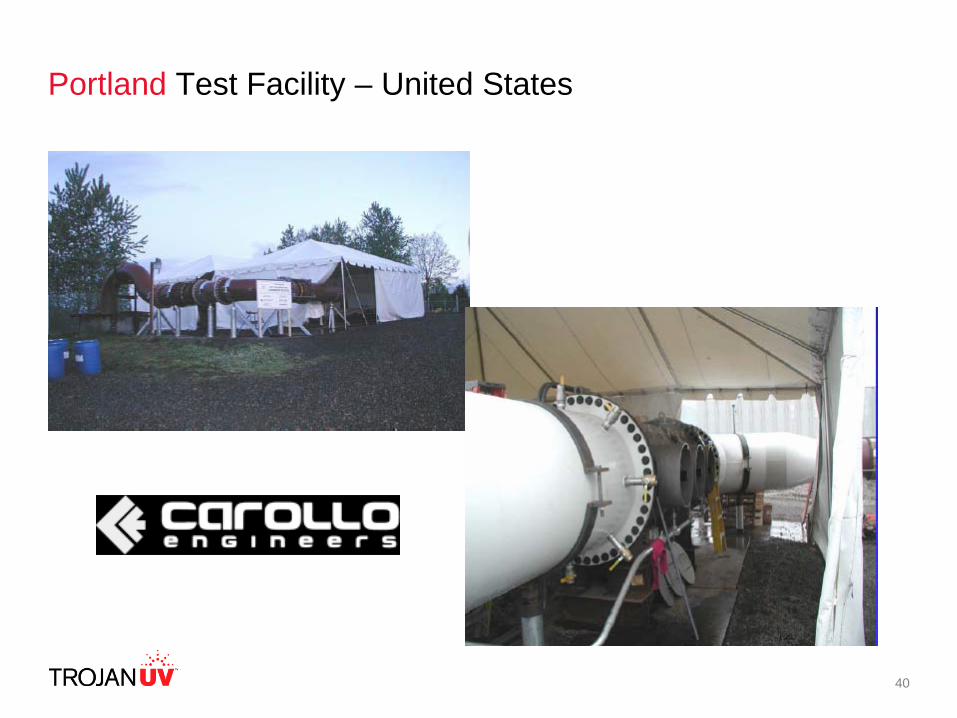
UV Validation and Test Center – United States
42
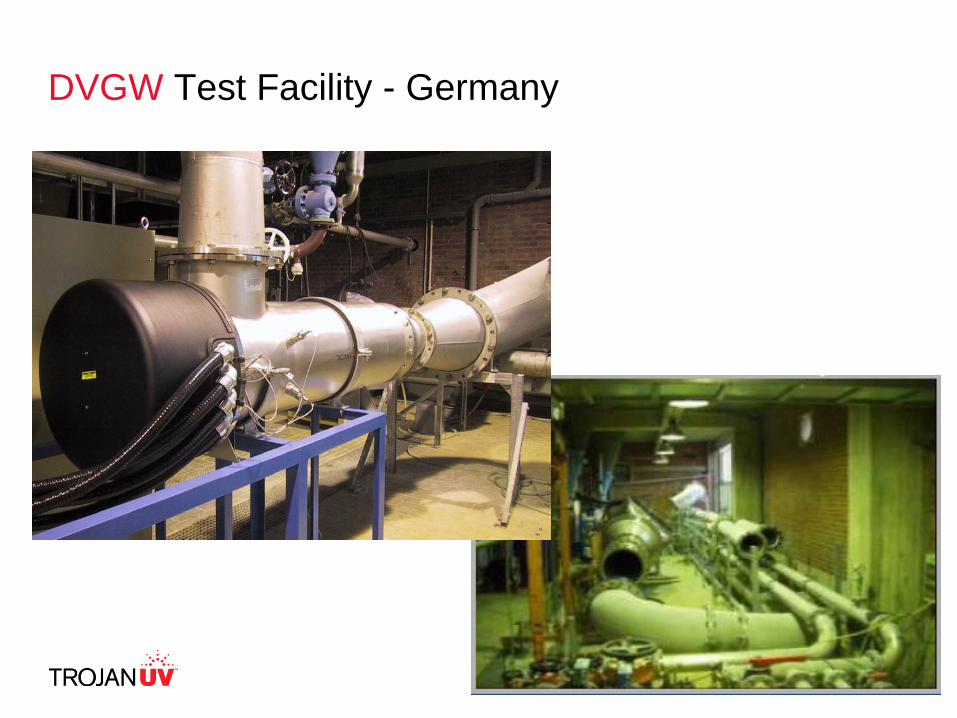
DVGW Test Facility - Germany
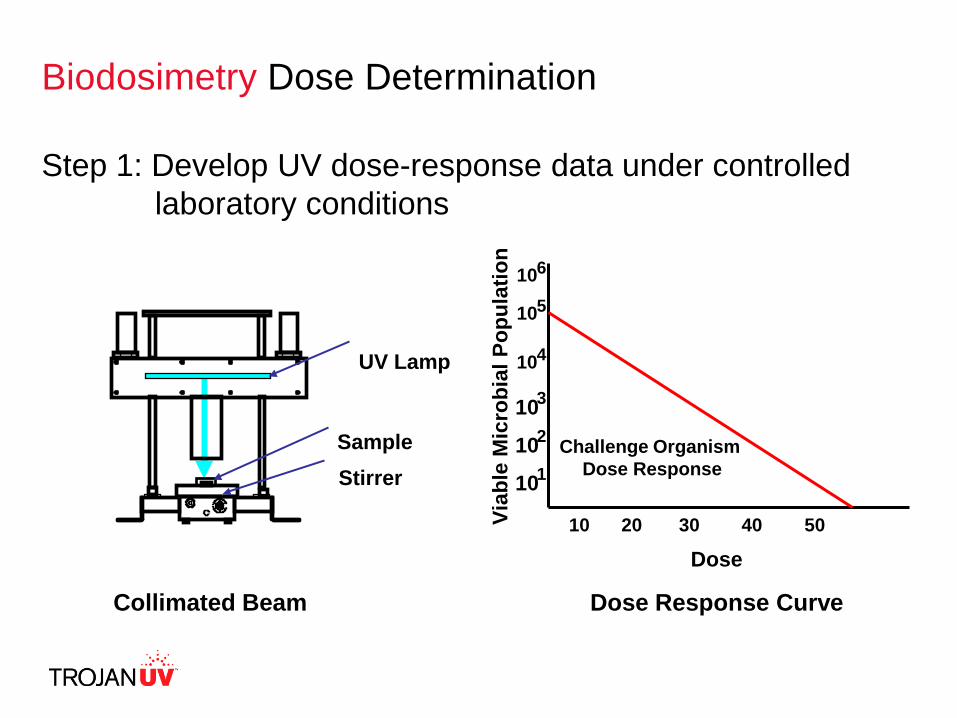
Biodosimetry Dose Determination
Step 1: Develop UV dose-response data under controlled laboratory conditions
Collimated Beam
SampleStirrer
UV Lamp
Viab
le M
icro
bial
Pop
ulat
ion
101102103
105
104
106
Dose
Challenge OrganismDose Response
10 20 30 40 50
Dose Response Curve
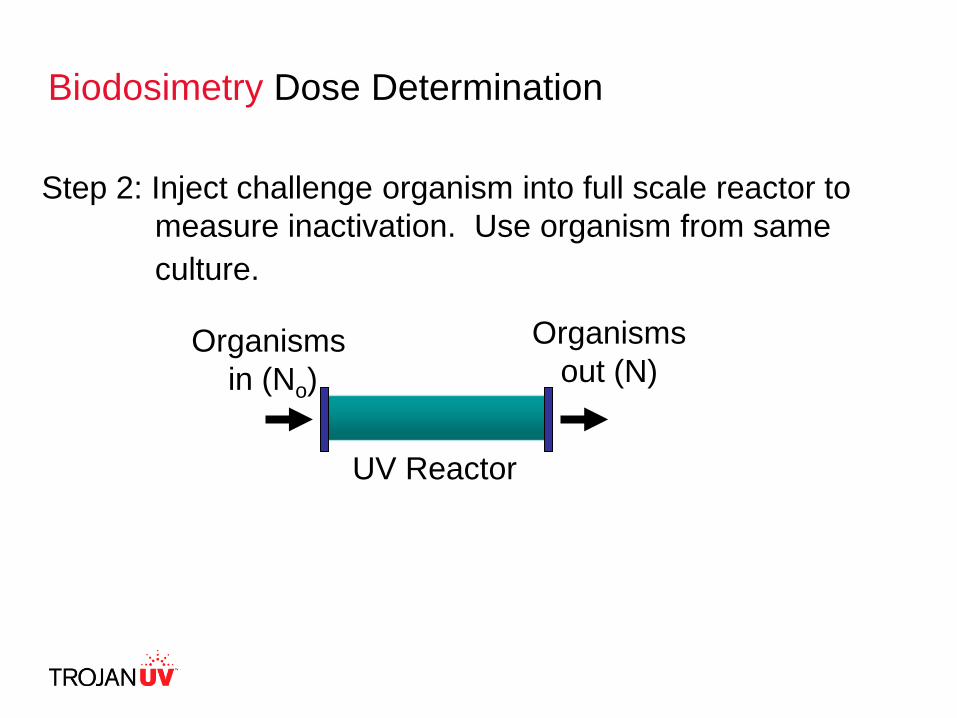
Step 2: Inject challenge organism into full scale reactor to measure inactivation. Use organism from same culture.
Organisms in (No)
Organismsout (N)
UV Reactor
Biodosimetry Dose Determination
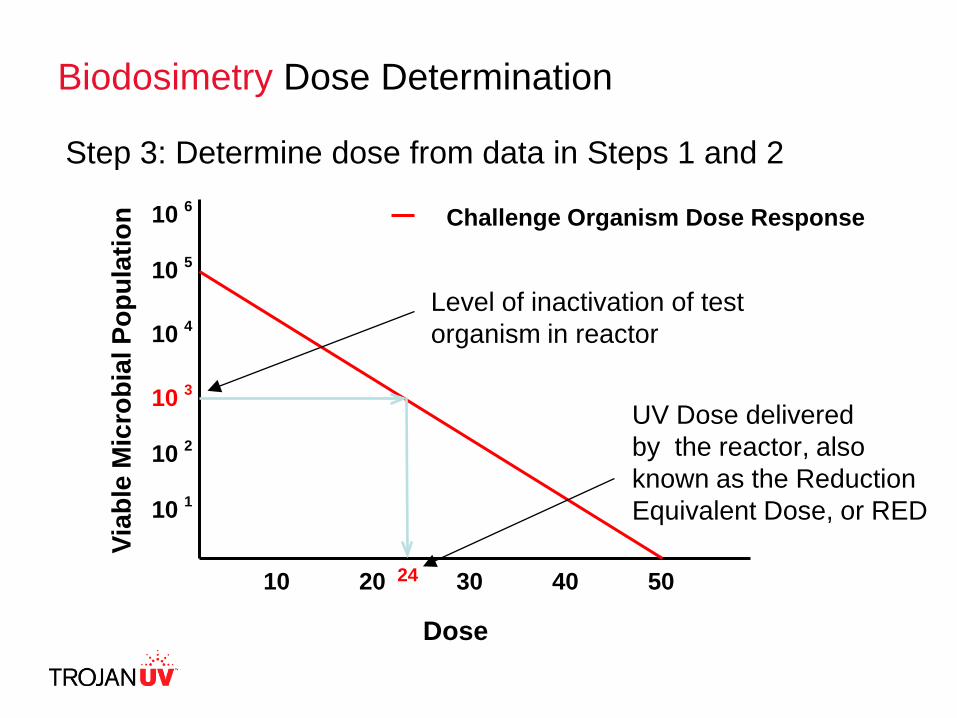
Biodosimetry Dose Determination
Step 3: Determine dose from data in Steps 1 and 2
10 1
10 2
10 3
10 5
10 4
10 6
Dose
10 20 30 40 50
Viab
le M
icro
bial
Pop
ulat
ion Challenge Organism Dose Response
Level of inactivation of test organism in reactor
UV Dose deliveredby the reactor, also known as the Reduction Equivalent Dose, or RED
24
46
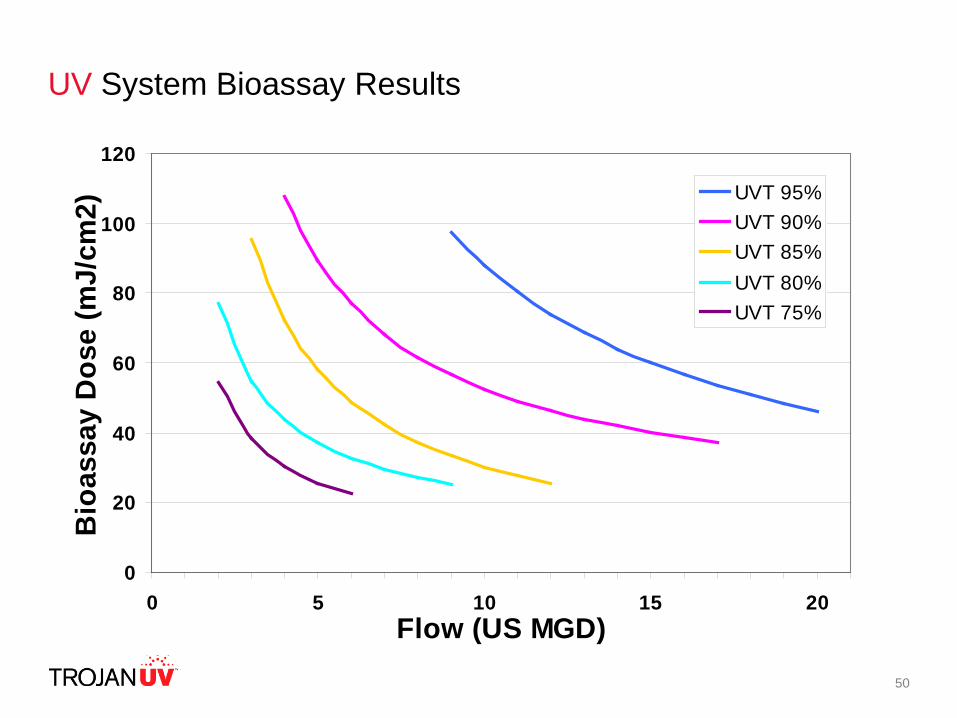
Bioassay Test Conditions
• Vary UV Transmittance
• Vary flow rate
• Vary power levels
• Simulated end of lamp life
47
0
20
40
60
80
100
120
0 5 10 15 20Flow (US MGD)
Bio
assa
y D
ose
(mJ/
cm2)
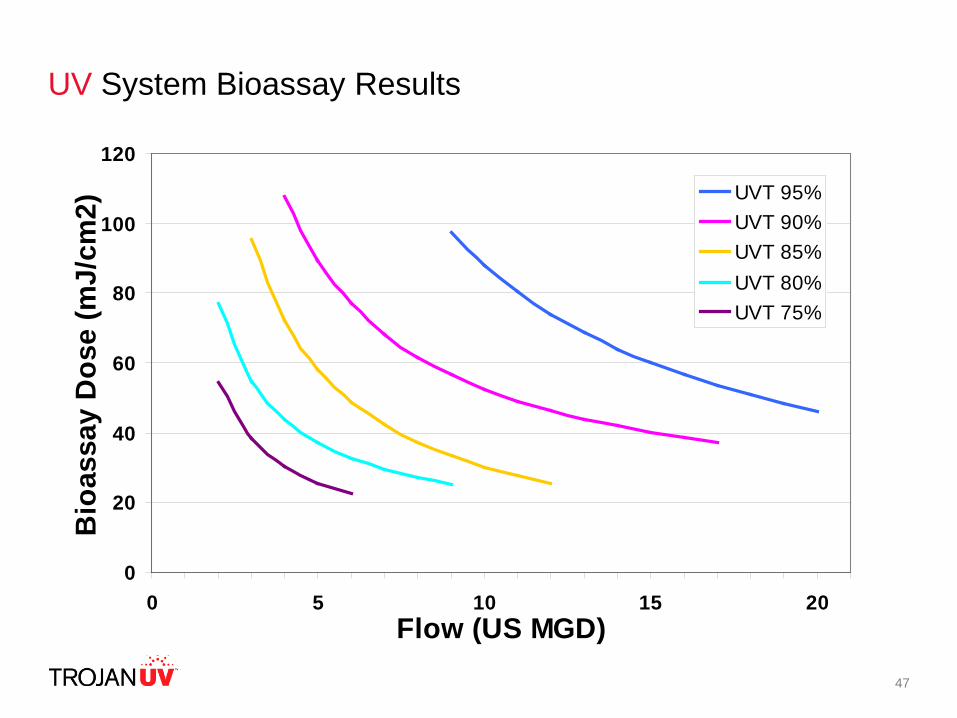
UVT 95%UVT 90%UVT 85%UVT 80%UVT 75%
UV System Bioassay Results
48
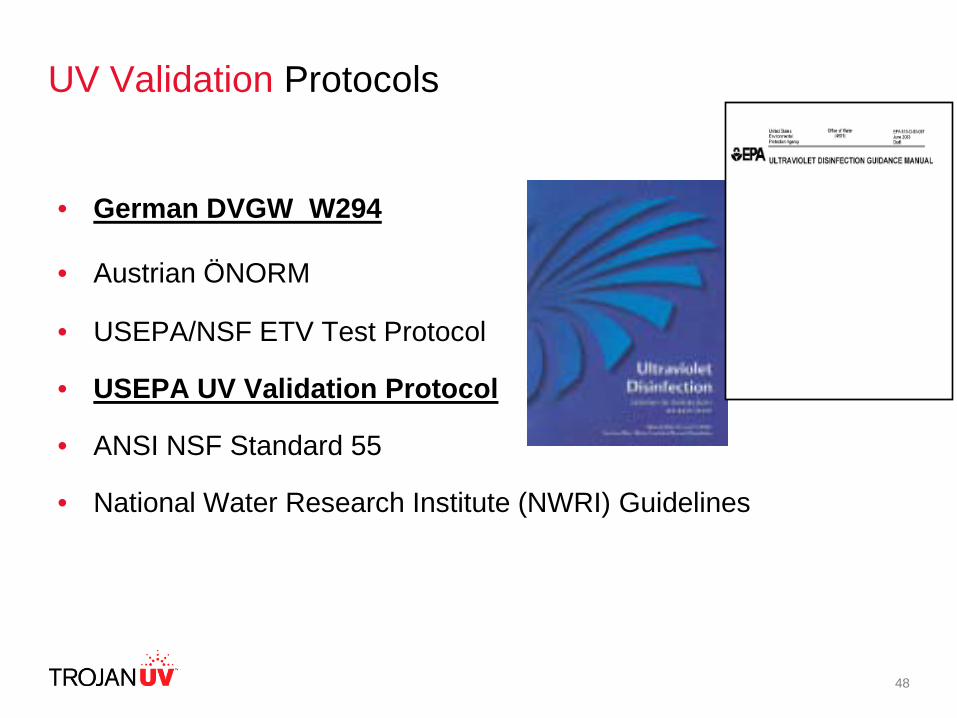
UV Validation Protocols
• German DVGW W294
• Austrian ÖNORM
• USEPA/NSF ETV Test Protocol
• USEPA UV Validation Protocol
• ANSI NSF Standard 55
• National Water Research Institute (NWRI) Guidelines
UV Dose Monitoring
50
0
20
40
60
80
100
120
0 5 10 15 20Flow (US MGD)
Bio
assa
y D
ose
(mJ/
cm2)
UVT 95%UVT 90%UVT 85%UVT 80%UVT 75%
UV System Bioassay Results
51
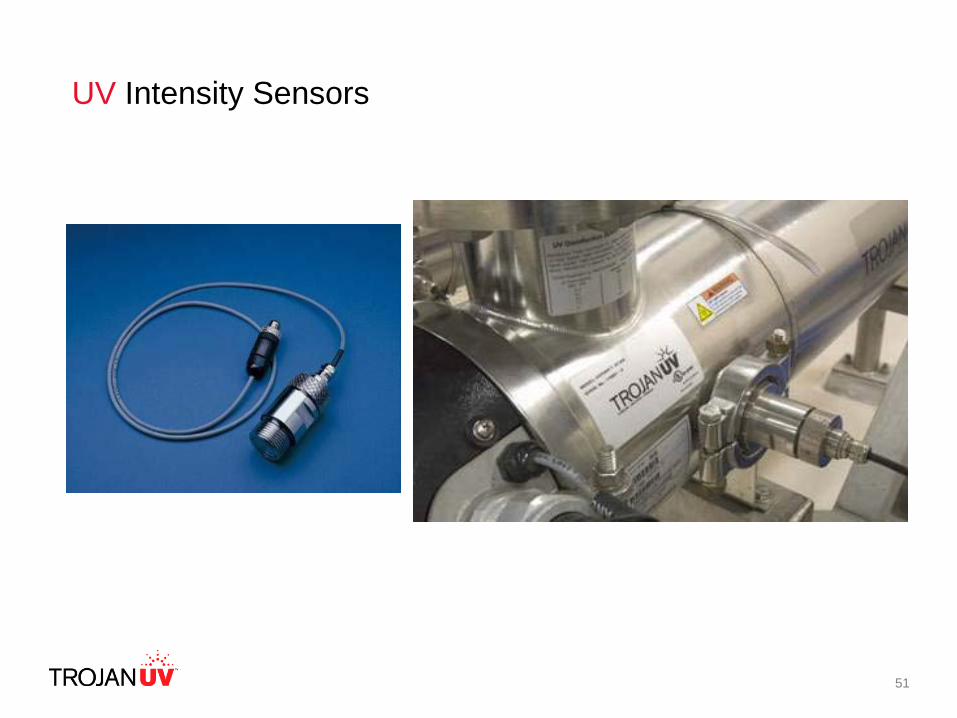
UV Intensity Sensors
52
UV Intensity Monitoring
• Monitor the Intensity of UV light coming from the lamps
• Most important part of the monitoring and control of the UV system
• How do sensors work?
– Sensors are like miniature solar panels
– Photodiode converts UV light into electrical energy
– Measure voltage or current and translate into Intensity
– Systems typically display intensity in mW/cm2
• UV Intensity sensors will see impacts from lamp aging, sleeve fouling, and changes in UVT%
• Sensors can be mounted on the wall of the reactor OR inserted into a quartz sleeve (like a lamp)
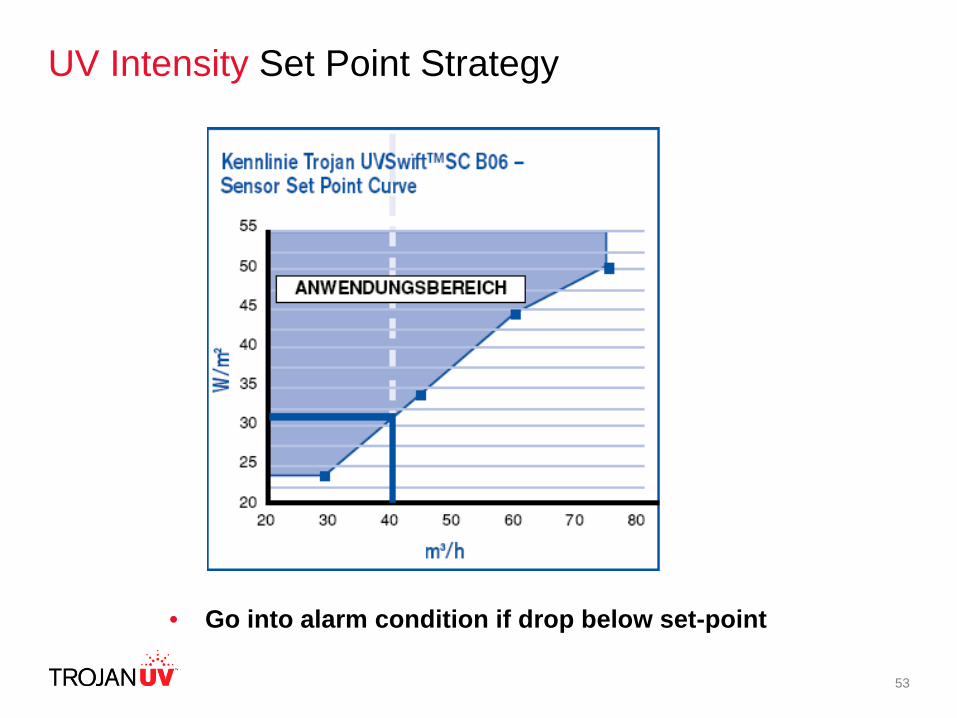
53
• Go into alarm condition if drop below set-point
UV Intensity Set Point Strategy
54
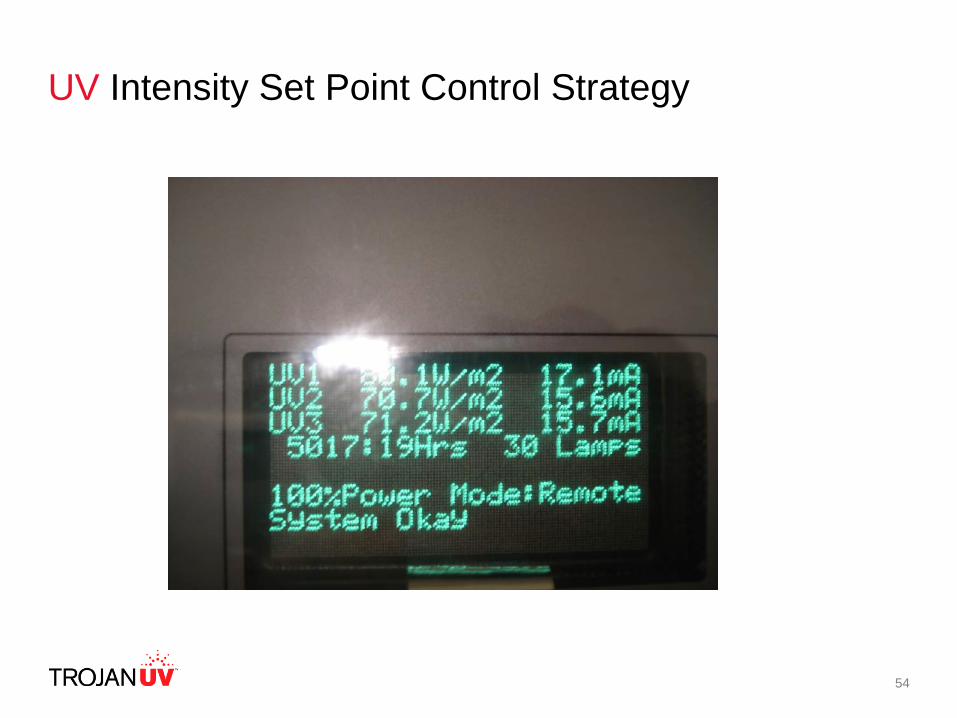
UV Intensity Set Point Control Strategy
55
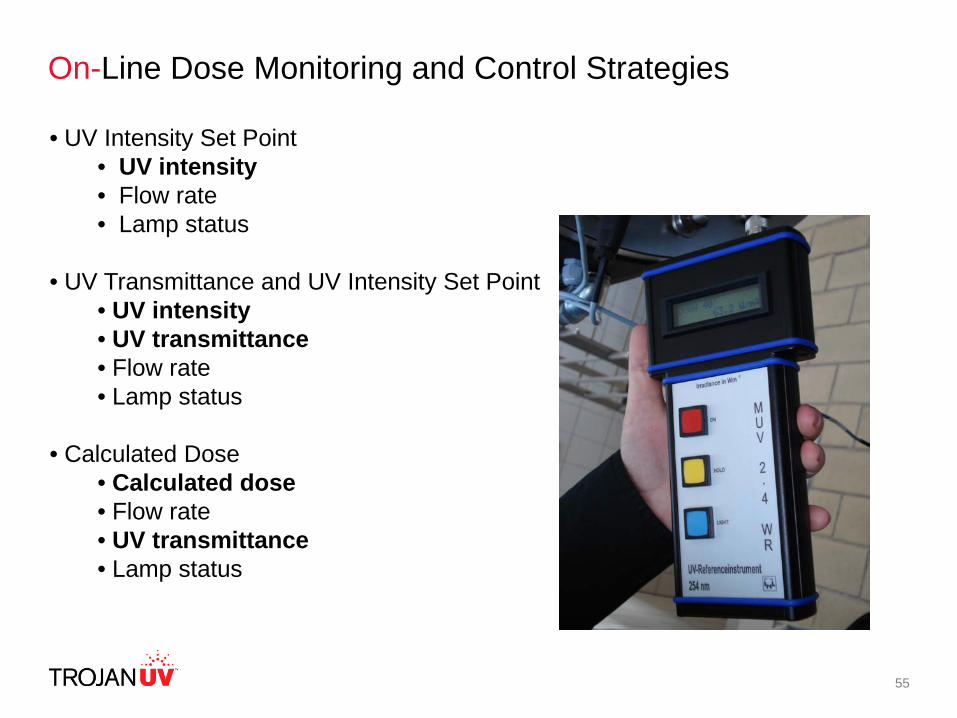
On-Line Dose Monitoring and Control Strategies
• UV Intensity Set Point• UV intensity• Flow rate• Lamp status
• UV Transmittance and UV Intensity Set Point• UV intensity• UV transmittance• Flow rate• Lamp status
• Calculated Dose• Calculated dose• Flow rate• UV transmittance• Lamp status
56
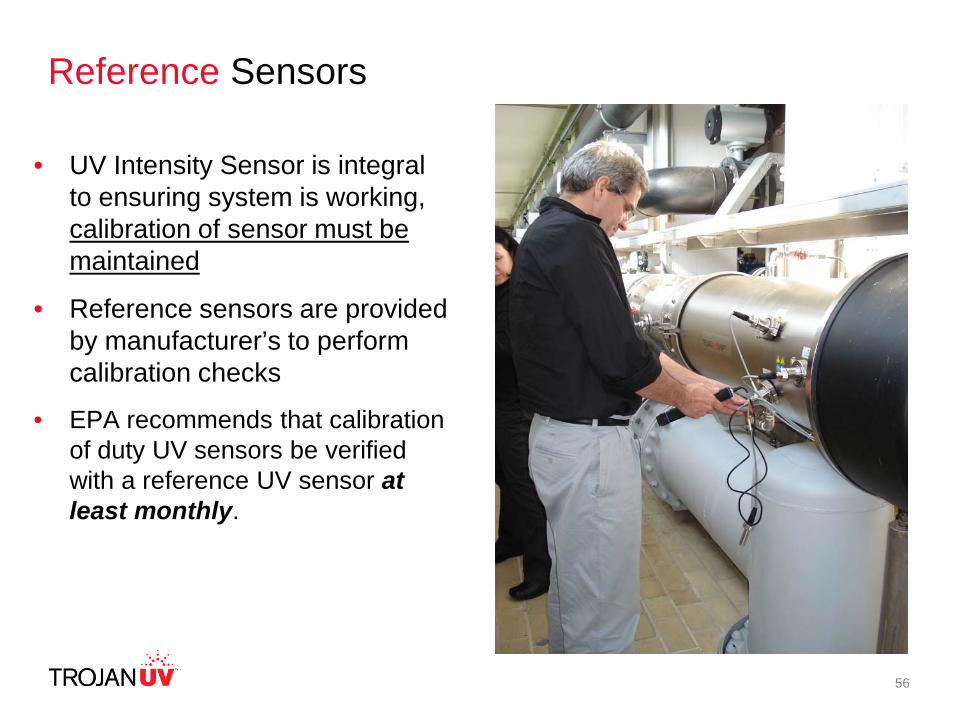
Reference Sensors
• UV Intensity Sensor is integral to ensuring system is working, calibration of sensor must be maintained
• Reference sensors are provided by manufacturer’s to perform calibration checks
• EPA recommends that calibration of duty UV sensors be verified with a reference UV sensor at least monthly.
UV DISINFECTION CASE STUDIES
58
59
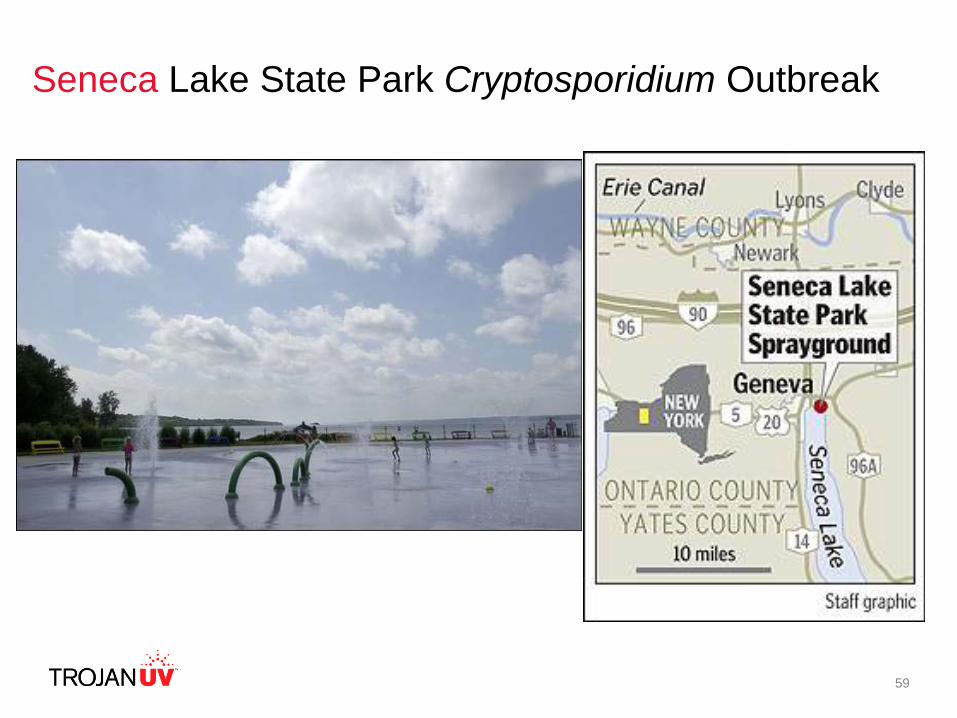
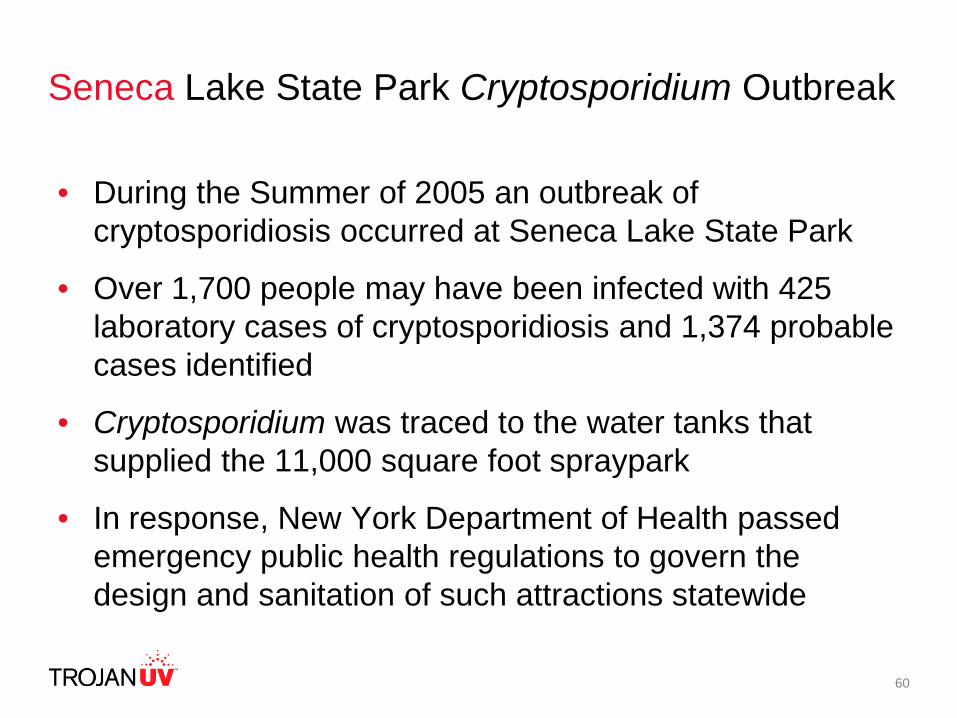
Seneca Lake State Park Cryptosporidium Outbreak
60
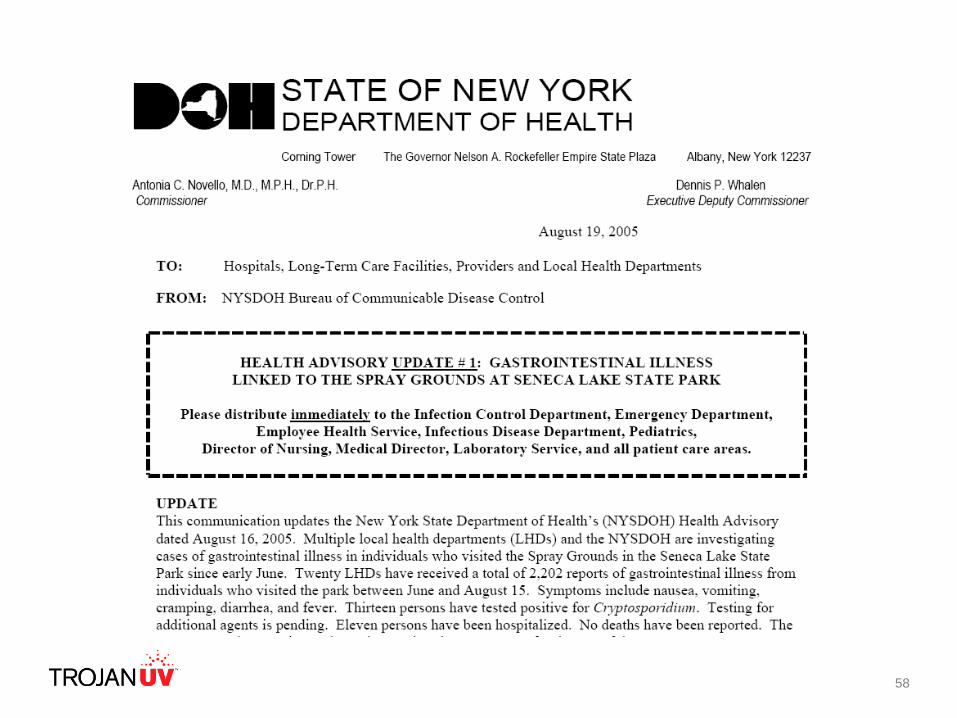
• During the Summer of 2005 an outbreak of cryptosporidiosis occurred at Seneca Lake State Park
• Over 1,700 people may have been infected with 425 laboratory cases of cryptosporidiosis and 1,374 probable cases identified
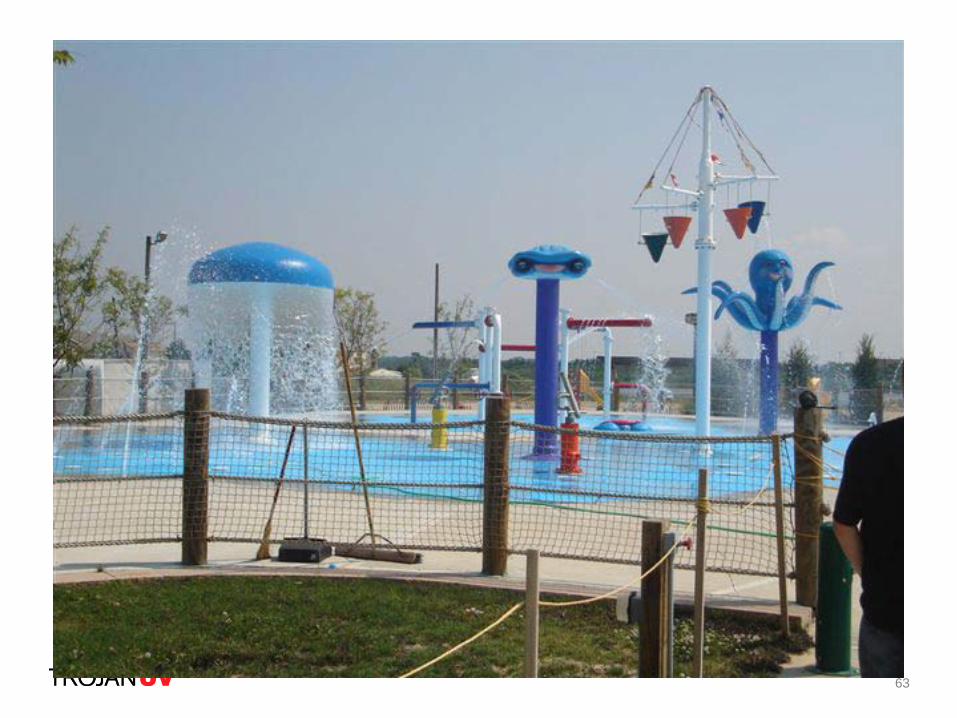
• Cryptosporidium was traced to the water tanks that supplied the 11,000 square foot spraypark
• In response, New York Department of Health passed emergency public health regulations to govern the design and sanitation of such attractions statewide
Seneca Lake State Park Cryptosporidium Outbreak
61
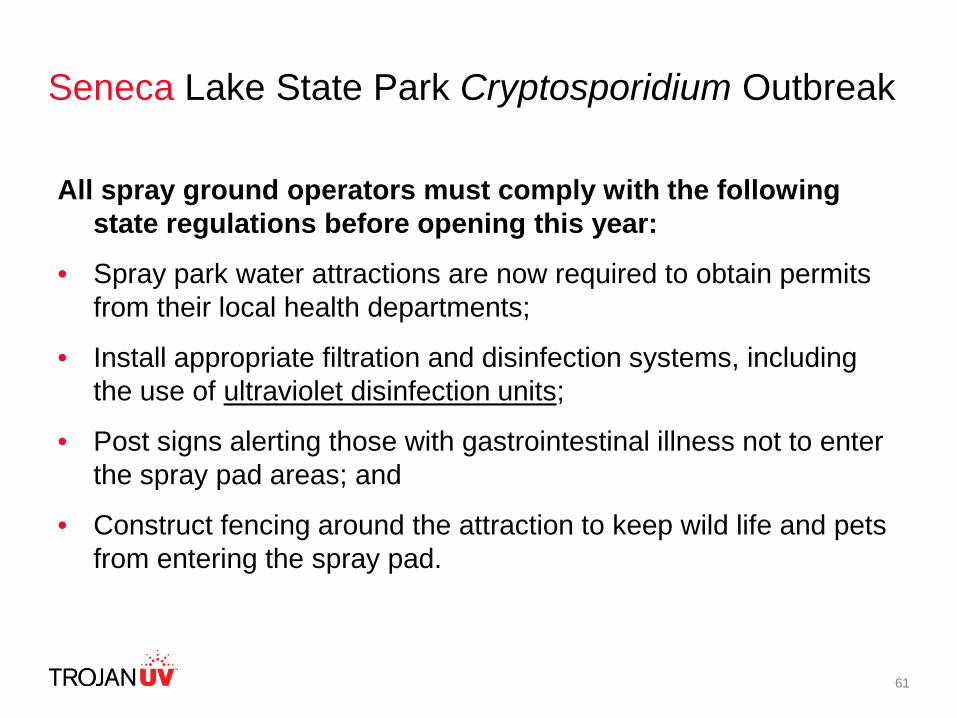
Seneca Lake State Park Cryptosporidium Outbreak
All spray ground operators must comply with the following state regulations before opening this year:
• Spray park water attractions are now required to obtain permits from their local health departments;
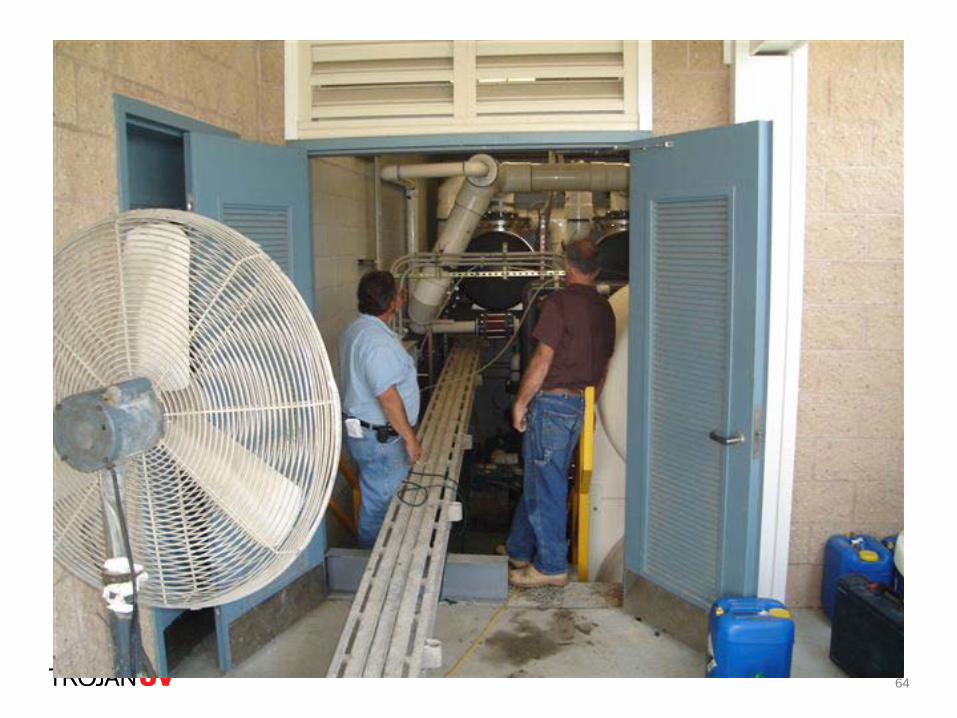
• Install appropriate filtration and disinfection systems, including the use of ultraviolet disinfection units;
• Post signs alerting those with gastrointestinal illness not to enter the spray pad areas; and
• Construct fencing around the attraction to keep wild life and pets from entering the spray pad.
62
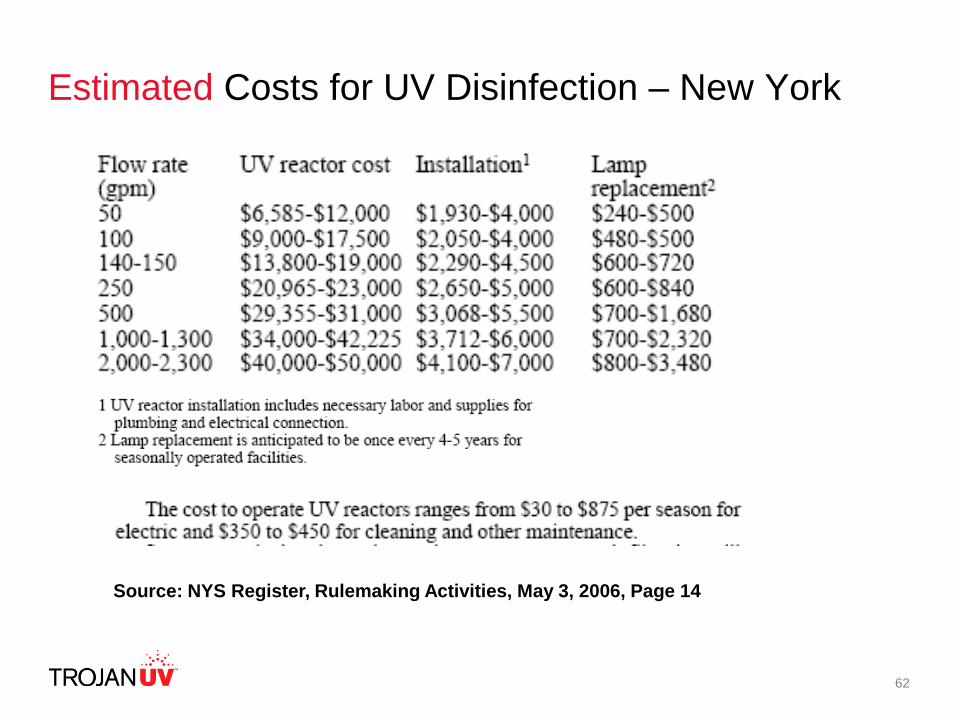
Estimated Costs for UV Disinfection – New York
Source: NYS Register, Rulemaking Activities, May 3, 2006, Page 14
63
64
65
66
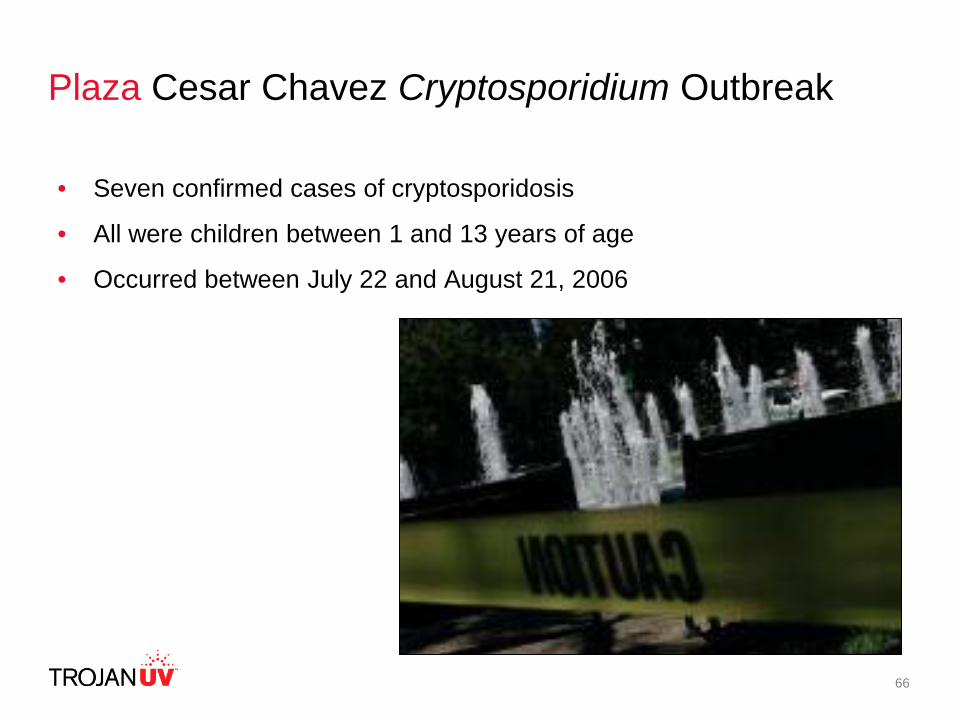
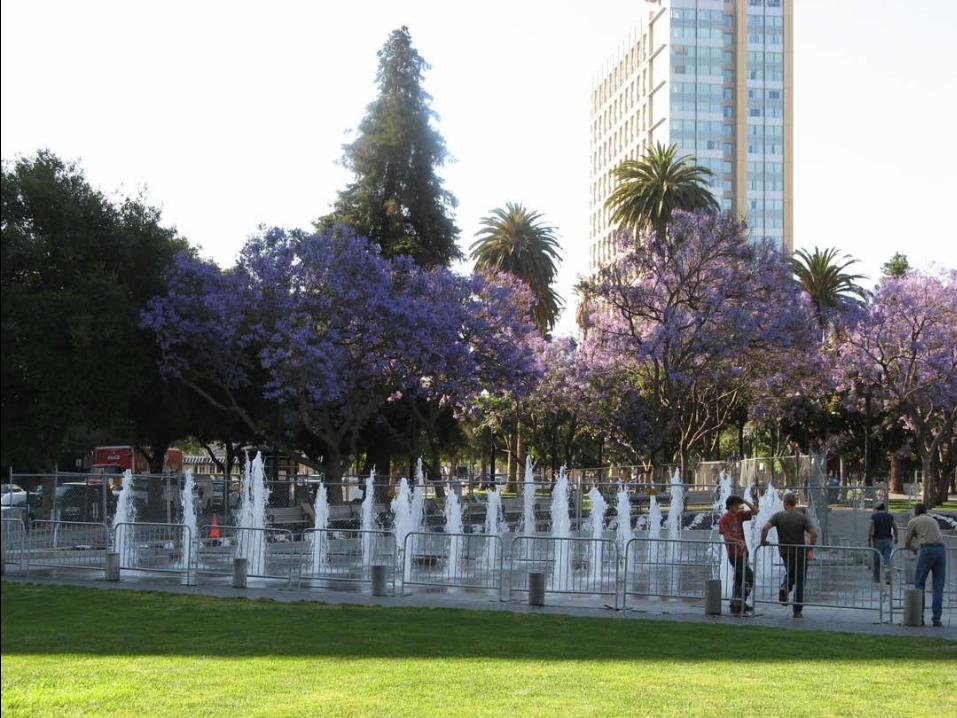
Plaza Cesar Chavez Cryptosporidium Outbreak
• Seven confirmed cases of cryptosporidosis
• All were children between 1 and 13 years of age
• Occurred between July 22 and August 21, 2006
67
68
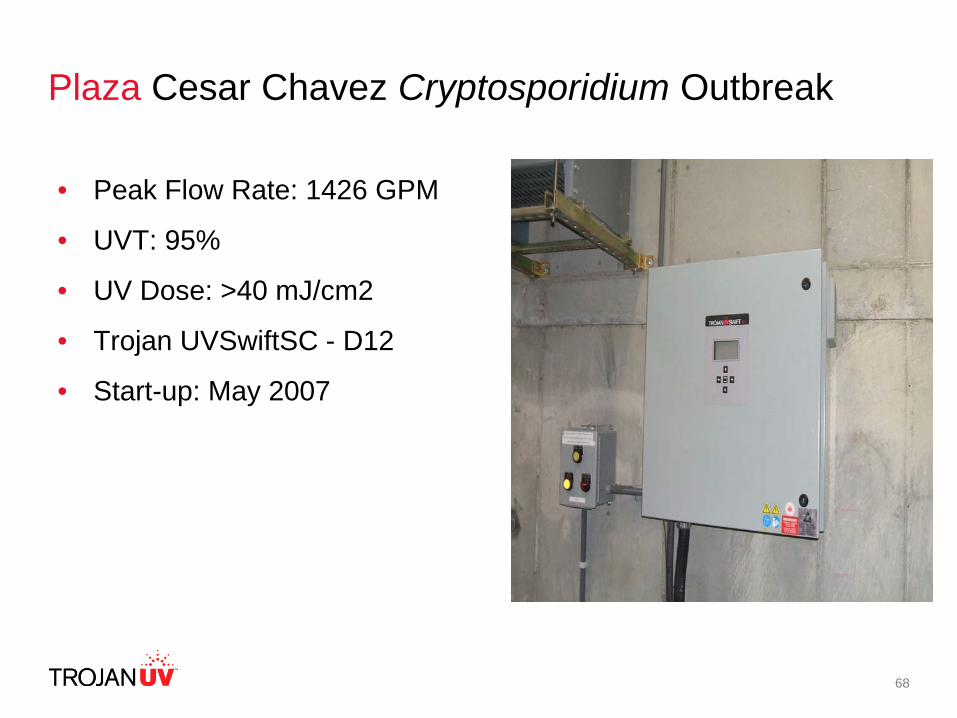
• Peak Flow Rate: 1426 GPM
• UVT: 95%
• UV Dose: >40 mJ/cm2
• Trojan UVSwiftSC - D12
• Start-up: May 2007
Plaza Cesar Chavez Cryptosporidium Outbreak
69
70
Conclusions
• UV Disinfection is very effective at inactivating a wide range of waterborne pathogens
• USEPA Long Term 2 Enhanced Surface Water Treatment Rule has created the framework and tools to effectively implement UV Disinfection for Interactive Fountains
• UV Dose Tables
• UV Validation Guidelines
• Monitoring Requirements
• UV Systems must undergo bioassay validation at multiple operating conditions to ensure public health protection
71
Conclusions
• Understand the strengths and limitations of each Bioassay Protocol
• Pay close attention to dose monitoring strategies
– What dose monitoring strategy is used to control the system?
– Verify calibration of instruments used in dose monitoring strategy
72
Resources – TrojanUV Regulator Portal
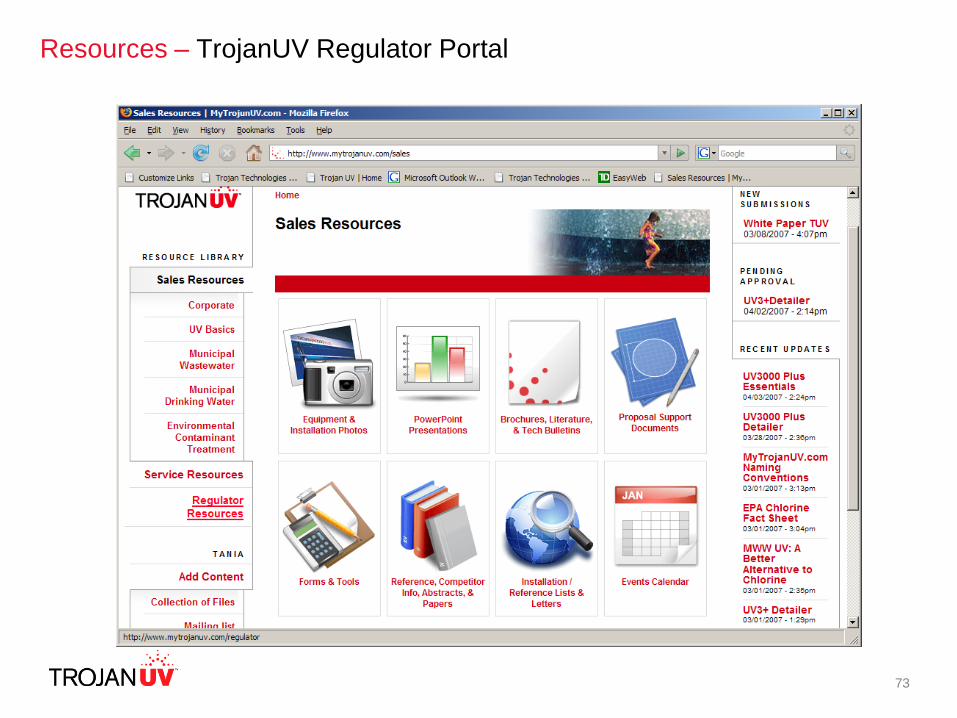
73
Resources – TrojanUV Regulator Portal