2006/3 first-half results - enplas€¦ · first-half results 2006/3 ... eht(s) : enhanced regional...
TRANSCRIPT
25. October. 2005
First-Half Results2006/3
Enplas CorporationPresident Toshiaki Sugimoto
- Contents -
2006/3FY First-Half Result (Consolidated)
2006/3FY Revised Plan (Consolidated)
Market Condition and Next Action in Each Business

First-Half Result (Consolidated)
2006/3

4
2006/3FY Management Policy
Proceed Restructuring of Main Business into High Value / High-Profit Structure
Create Original Products Market with Excellent Intellectual Advantage and Expert Technology
Re-Establish Global Business Strategy
Improve Efficiency in All Business Process
Management Target (Consolidated)Net Sales 40 Billion Yen
Ordinary Profit 4.5 Billion Yen

First-Half Management Overview
2006/3
6
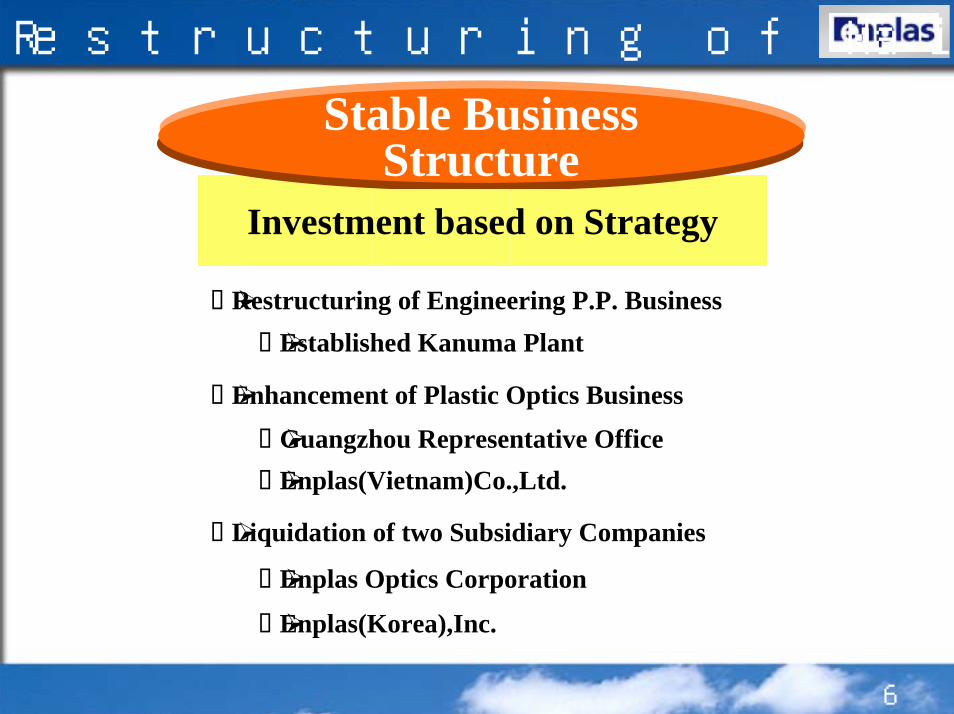
Restructuring of Main Business
Stable Business Structure
Investment based on Strategy
Restructuring of Engineering P.P. BusinessEstablished Kanuma Plant
Enhancement of Plastic Optics Business
Guangzhou Representative OfficeEnplas(Vietnam)Co.,Ltd.
Liquidation of two Subsidiary Companies
Enplas Optics Corporation
Enplas(Korea),Inc.
7
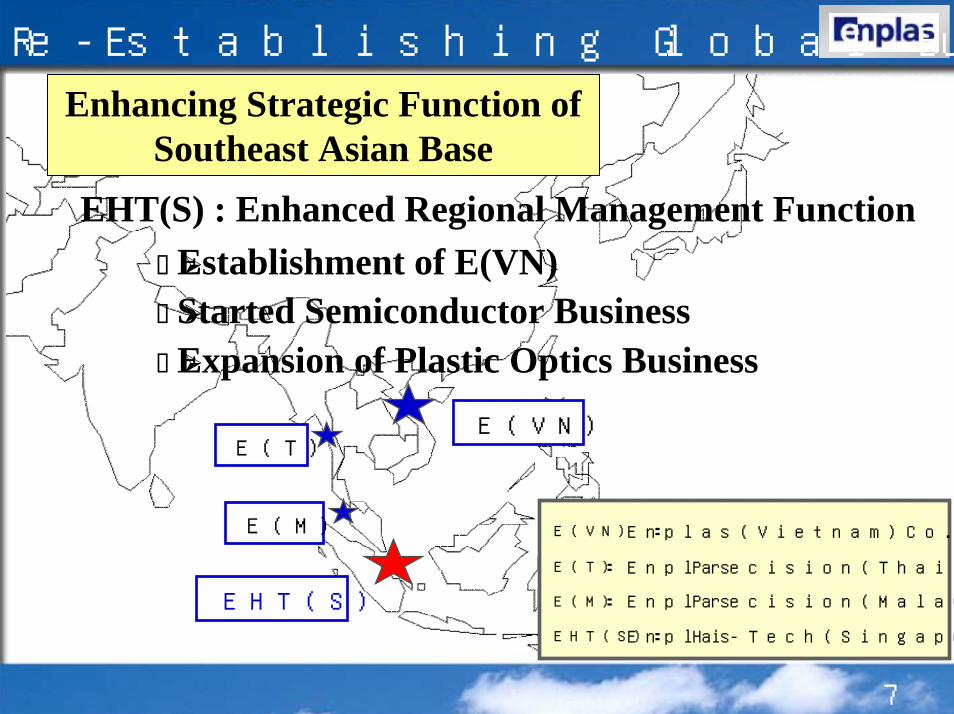
Re-Establishing Global Business Strategy
EHT(S) : Enhanced Regional Management Function
EHT(S)
E(VN)E(T)
E(M)
Establishment of E(VN)Started Semiconductor BusinessExpansion of Plastic Optics Business
Enplas Hi-Tech(Singapore)Pte.Ltd.
Enplas Precision(Malaysia)Sdn.Bhd.
Enplas Precision(Thailand)Co.,Ltd.
Enplas(Vietnam)Co.,Ltd.
EHT(S):
E(M) :
E(T) :
E(VN) :
Enhancing Strategic Function of Southeast Asian Base
8
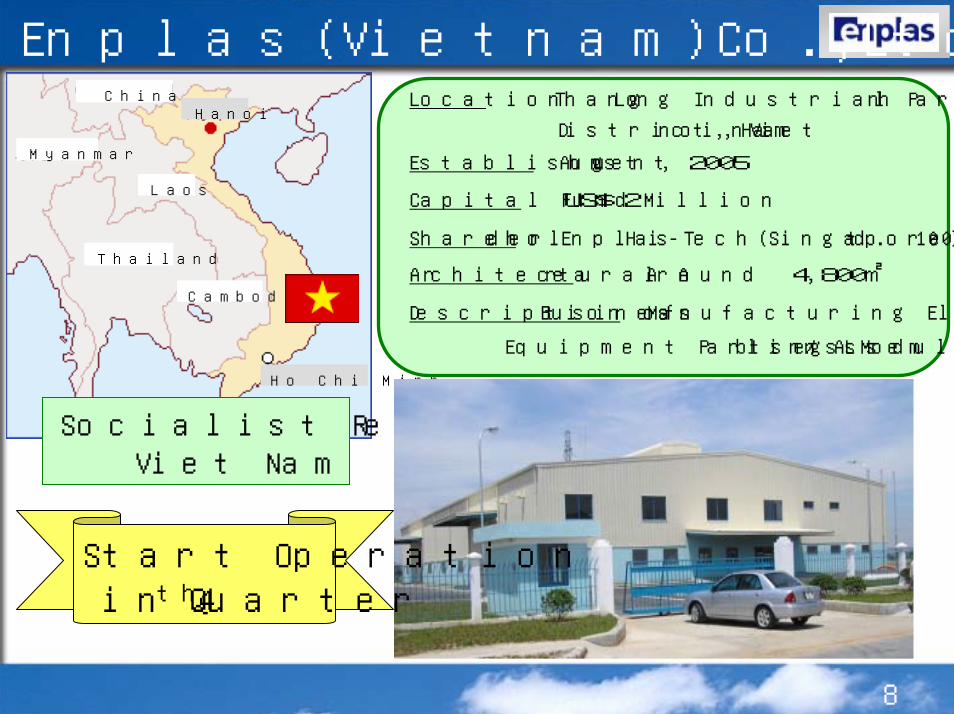
Enplas(Vietnam)Co.,Ltd.China
Myanmar
Thailand
Cambodia
Laos
Hanoi
Ho Chi Minh
Socialist Republic of Viet Nam
Location Thang Long Industrial Park, Dong Anh
District, Hanoi, Vietnam
Establishment August , 2005
Capital Fund US$ 2 Million
Shareholder Enplas Hi-Tech(Singapore)Pte.Ltd. 100%
Architectural Area Around 4,800㎡
Description of Business Manufacturing Electronics
Equipment Parts / Assembling Lens Module
Start Operation in 4th Quarter

First-Half Account Result (Consolidated)
2006/3
10
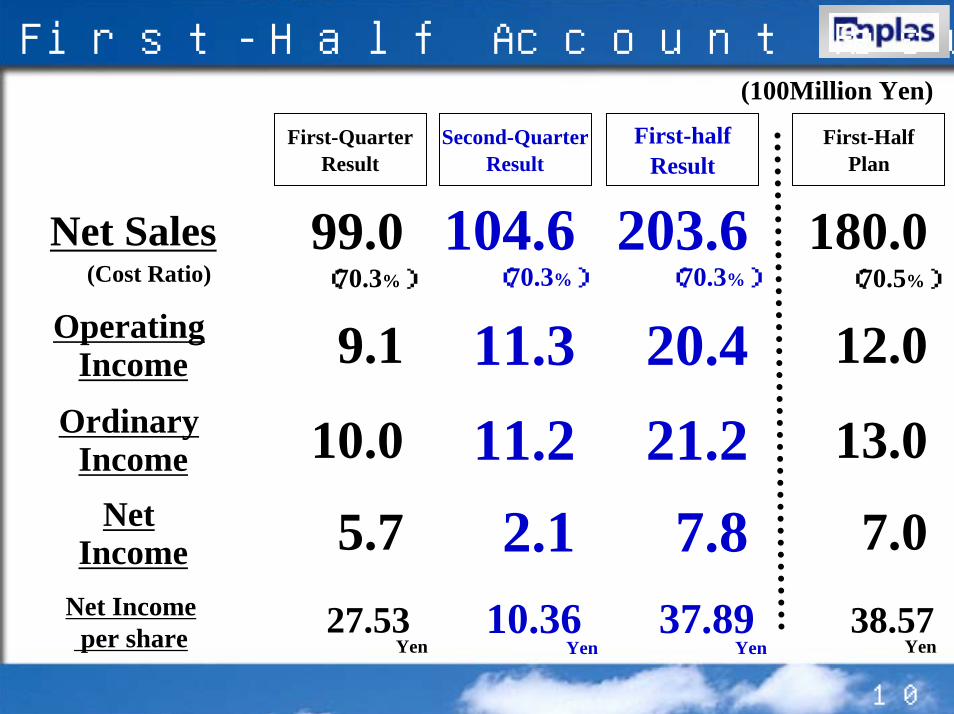
First-Half Account Result and Plan(100Million Yen)
99.0
9.1
10.0
5.7
(70.3%)
27.53
First-halfResult
104.6(70.3%)
10.36
203.6
20.421.2
7.8
(70.3%)
37.89Yen Yen Yen
First-QuarterResult
Second-QuarterResult
First-HalfPlan
180.0Net Sales(Cost Ratio) (70.5%)
Operating Income 11.3 12.0
Ordinary Income 11.2 13.0
Net Income 2.1 7.0
Net Incomeper share 38.57
Yen

11
Segment Result and Plan (100Million Yen)
Engineering P.P.Engineering P.P.
Semiconductor P.Semiconductor P.
Display DeviseDisplay Devise
Imaging OpticsImaging Optics
Digital OpticsDigital Optics
Optical Fiber C.Optical Fiber C.
TotalTotal
First-halfResult
First-HalfPlan
First-QuarterResult
Second-QuarterResult
79.627.243.534.914.93.3
39.914.124.817.1
6.91.6
39.6 73.013.0 27.018.7 28.017.8 30.0
8.0 18.01.6 4.0
203.6104.699.0 180.0
12
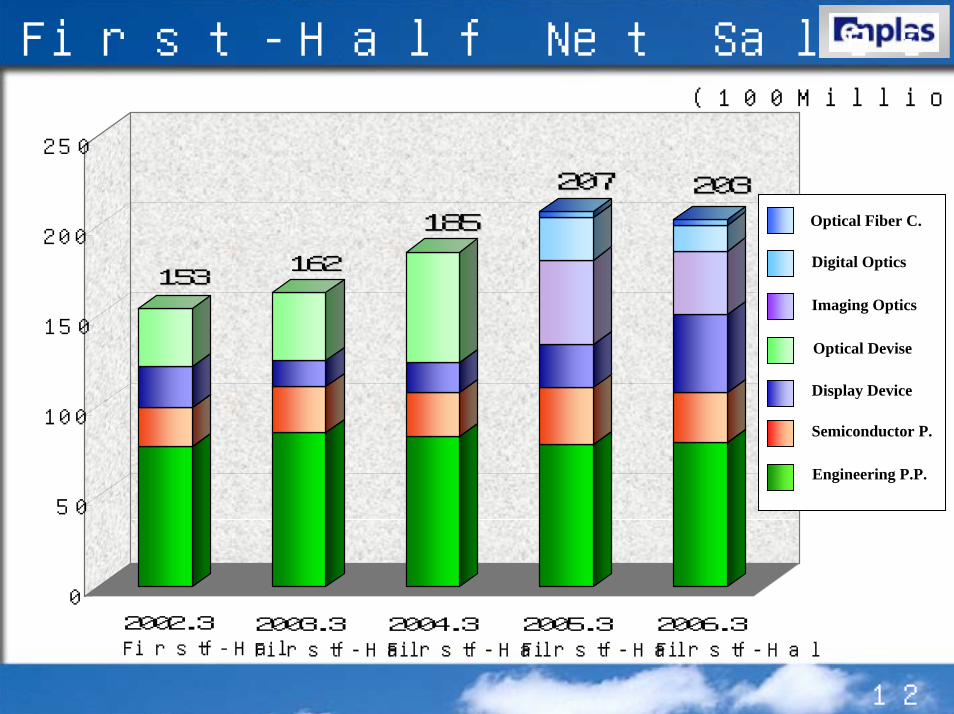
First-Half Net Sales Trend
0
50
100
150
200
250
153153
185185
162162
2002.3First-Half
207207 203203
Engineering P.P.
Semiconductor P.
Display Device
Imaging Optics
Digital Optics
Optical Devise
Optical Fiber C.
(100Million Yen)
2003.3First-Half
2004.3First-Half
2005.3First-Half
2006.3First-Half
13
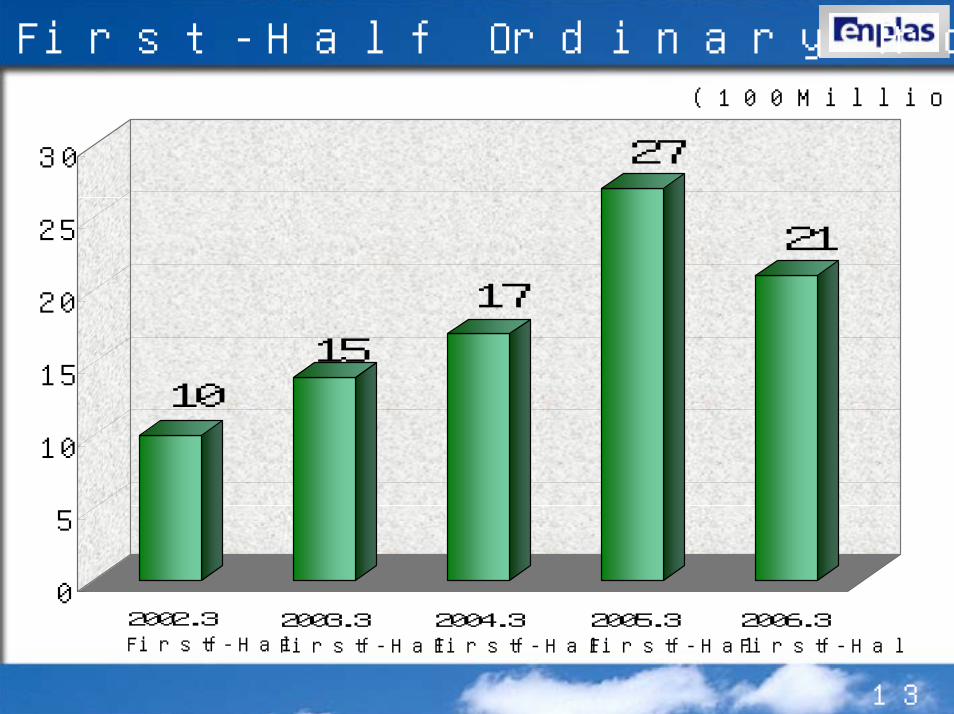
First-Half Ordinary Profit Trend
0
5
10
15
20
25
30
1015
17
27
(100Million Yen)
21
2002.3First-Half
2003.3First-Half
2004.3First-Half
2005.3First-Half
2006.3First-Half
14
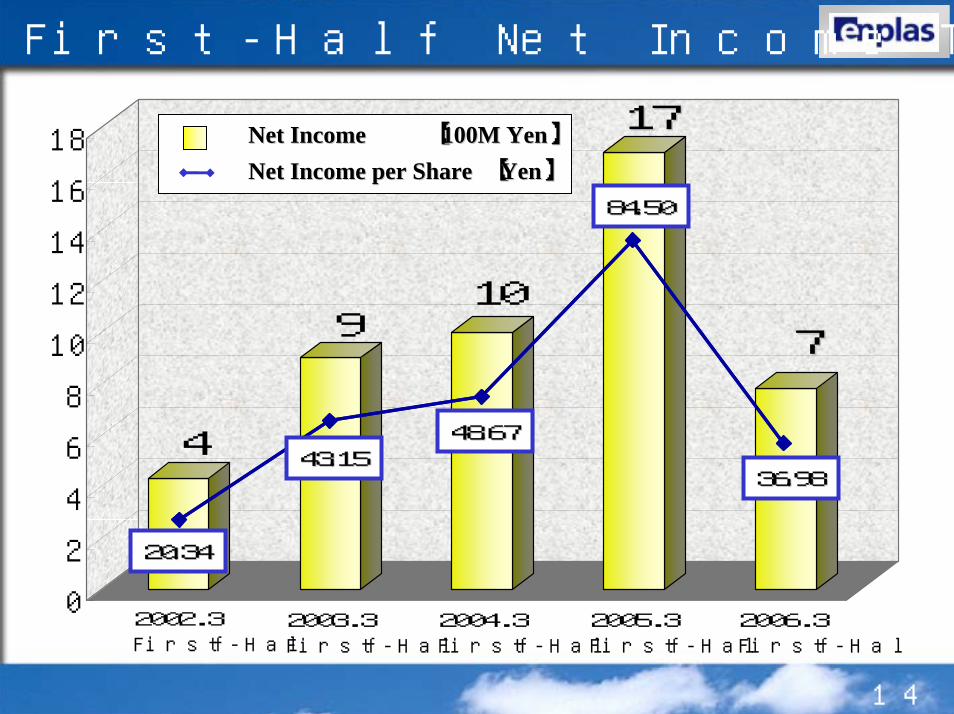
First-Half Net Income Trend
0
2
4
6
8
10
12
14
16
18
4
9
1717
10
2020..3434
4848..6767
Net IncomeNet Income 【【100M Yen100M Yen】】
Net Income per ShareNet Income per Share 【【YenYen】】
4343..1515
8484..5050
3636..9898
77
2002.3First-Half
2003.3First-Half
2004.3First-Half
2005.3First-Half
2006.3First-Half
15
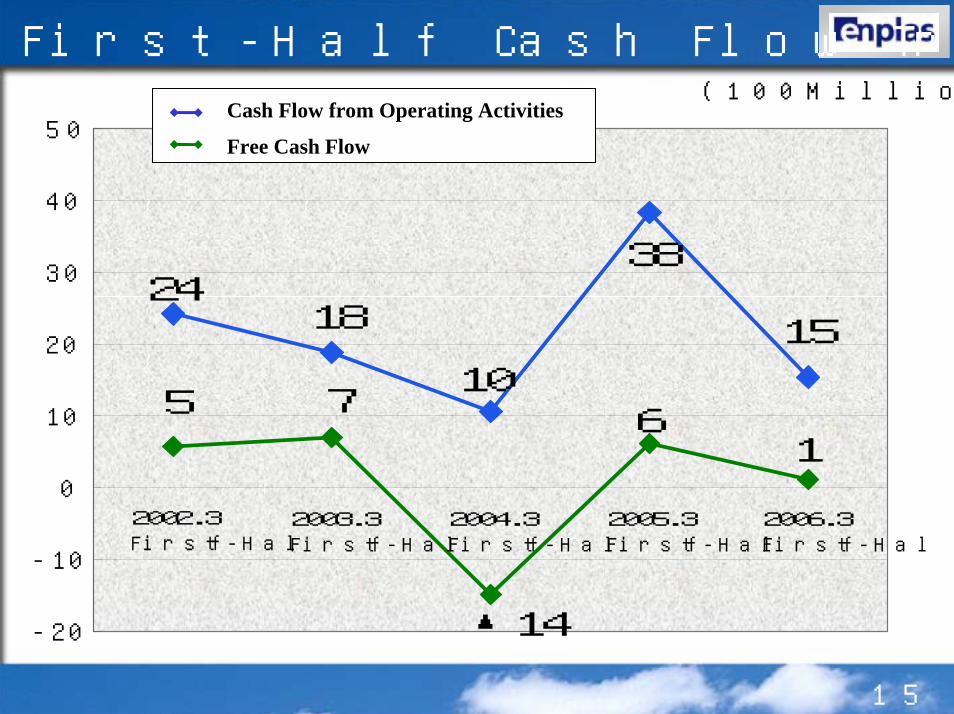
First-Half Cash Flow Trend
-20
-10
0
10
20
30
40
50
2418
105 7
▲14
6
38
Cash Flow from Operating Activities
Free Cash Flow
2002.3First-Half
2003.3First-Half
2004.3First-Half
2005.3First-Half
2006.3First-Half
15
1
(100Million Yen)

16
First-Half Facility Investment and Depreciation Trend
0
5
10
15
20
25
30
151314 13
27
15
InvestmentDepreciation
1815
2002.3First-Half
2003.3First-Half
2004.3First-Half
2005.3First-Half
2006.3First-Half
20
16
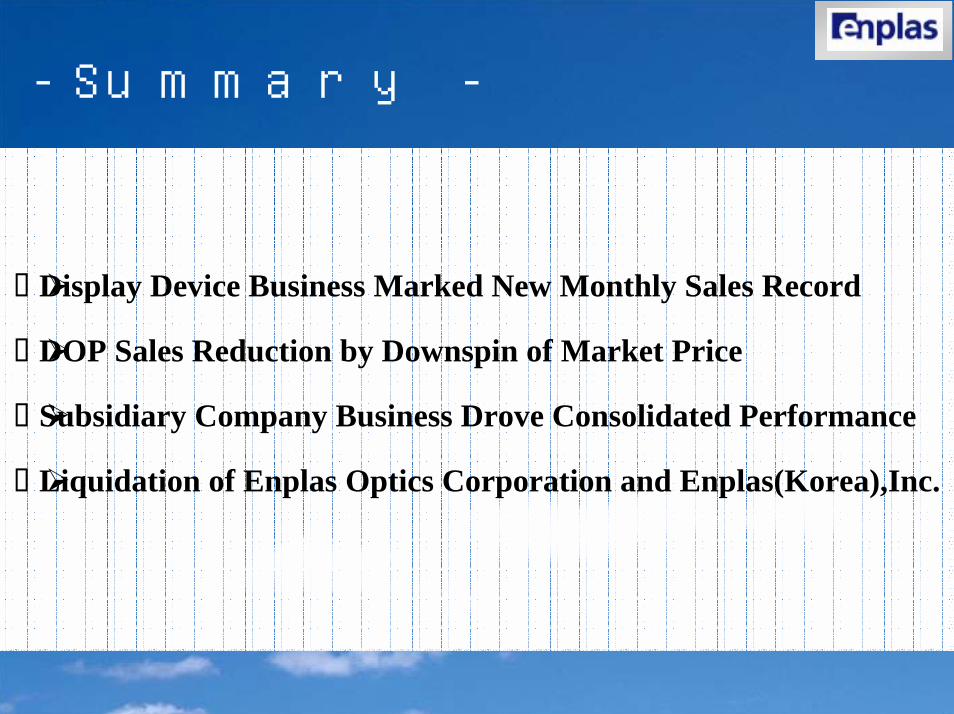
- Summary -
Display Device Business Marked New Monthly Sales Record
DOP Sales Reduction by Downspin of Market Price
Subsidiary Company Business Drove Consolidated Performance
Liquidation of Enplas Optics Corporation and Enplas(Korea),Inc.

Revised Plan (Consolidated)2006/3
19
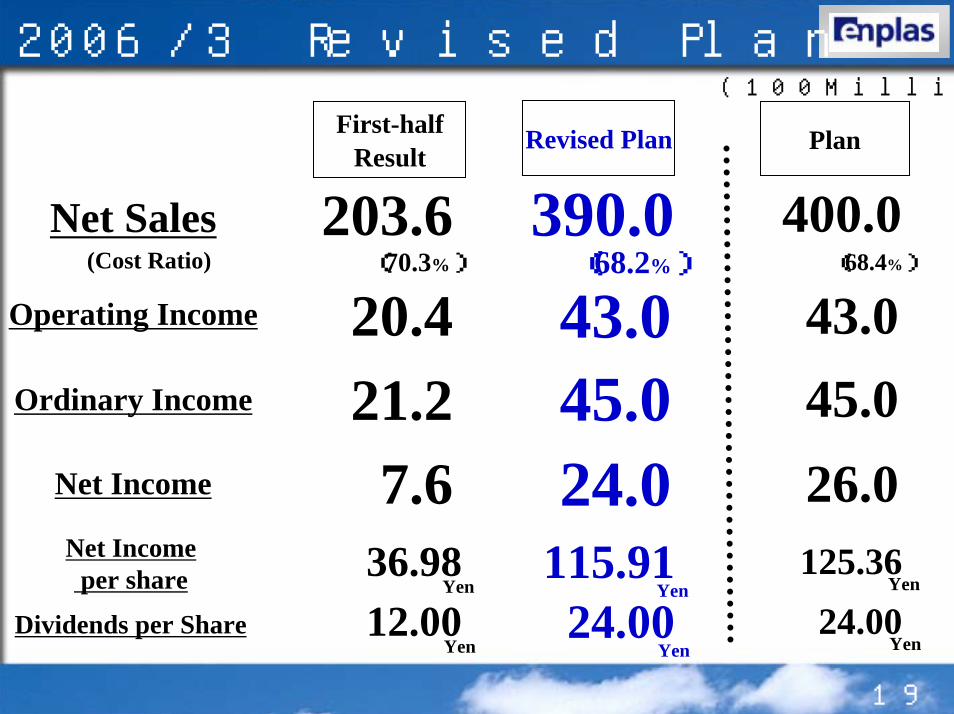
2006/3 Revised Plan(100Million Yen)
390.0(68.2%)
43.045.024.0
115.9124.00
Yen
Yen
203.6
20.4(70.3%)
21.27.6
36.9812.00
Yen
Yen
Plan
400.0
43.045.026.0
(68.4%)
125.3624.00
Yen
Yen
Net Sales
Operating Income
Ordinary Income
Net Income
(Cost Ratio)
Net Incomeper share
Dividends per Share
First-halfResult
Revised Plan
20
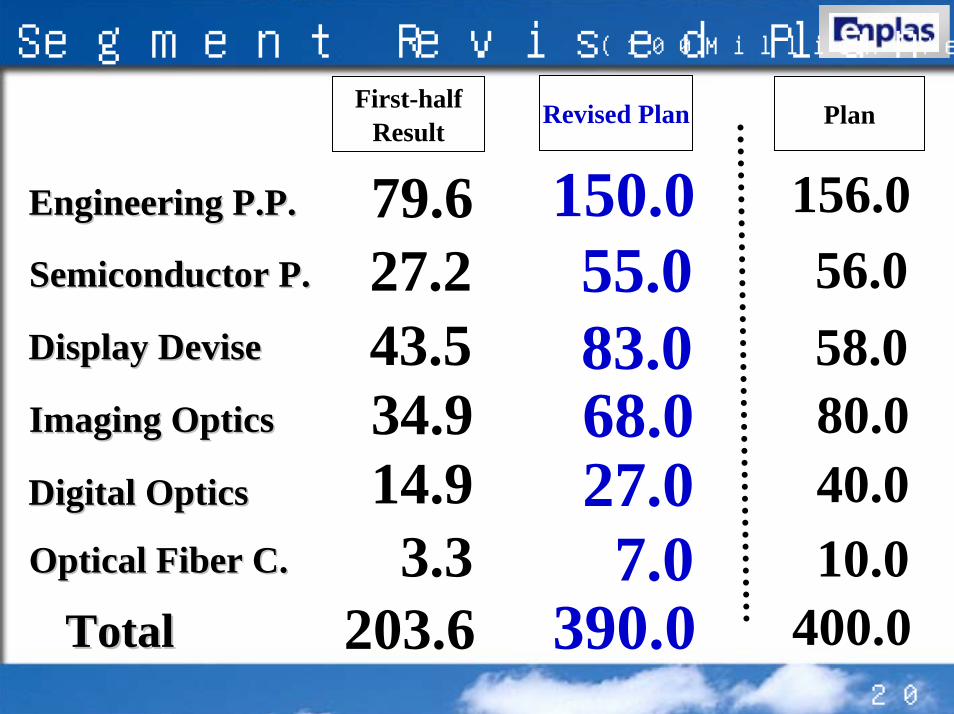
Segment Revised Plan (100Million Yen)
First-halfResult
Revised Plan Plan
150.055.0
79.6 156.0Engineering P.P.Engineering P.P.
27.2 56.0Semiconductor P.Semiconductor P.
83.068.027.0
390.07.0
43.534.914.9
58.0Display DeviseDisplay Devise
80.0Imaging OpticsImaging Optics
40.0Digital OpticsDigital Optics
203.63.3
400.010.0Optical Fiber C.Optical Fiber C.
TotalTotal

21
Other Significant Plan (100Million Yen)
First-halfResult
Revised Plan Plan
40.020.7 60.0Facility InvestmentFacility Investment
16.5 35.0 33.0DepreciationDepreciation
Experiment and Experiment and Research Expenses 10.4 20.0 22.0Research Expenses
(5.2%) (5.1%)(Sales Ratio)(Sales Ratio) (5.5%)

Market Condition and Next Action in Each Business

23
Engineering Plastic Products Business
Improve Business into High Value Structure
Develop Gear-Solution Business
Expand Plastic Gear market
Shift to Profitable Product
Improved Mold Building System
Developed Enplas Original Gear
7079 150(100Million Yen)
Second Half Strategy
First HalfResult
Second HalfRevised Plan Revised Plan
782005/3
First Half
First Half Summary
Kick Off of KANUMA Plant
24
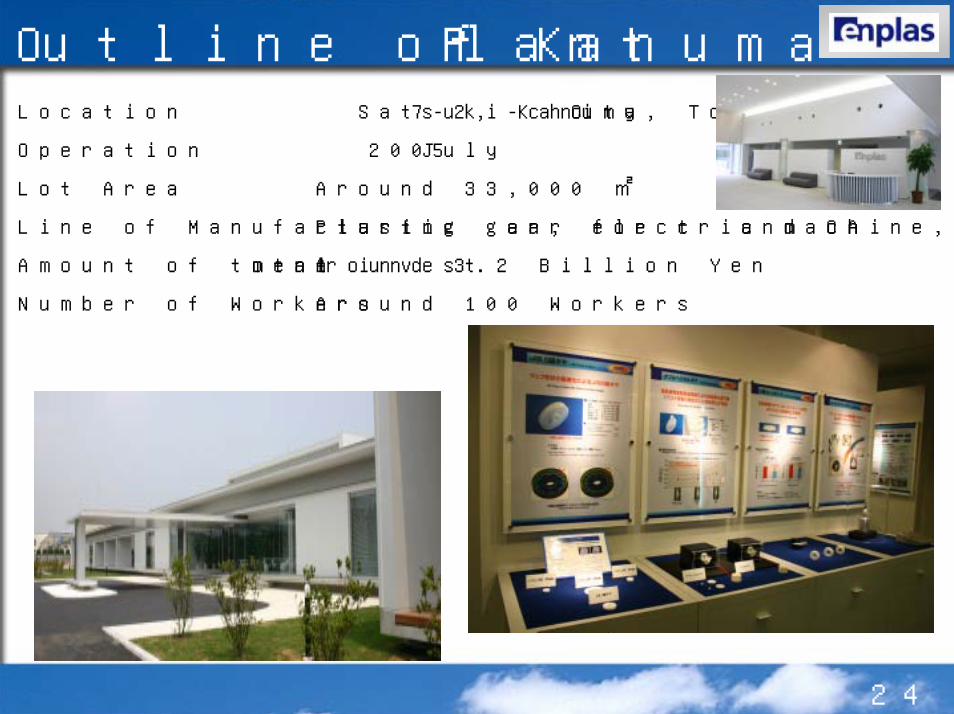
Outline of Kanuma PlantLocation 7-2 Satsuki-cho, Kanuma City, Tochigi
Operation July 2005
Lot Area Around 33,000 ㎡
Line of Manufacturing Plastic gear for car, electric machine, and OA
Amount of total investment Around 3.2 Billion Yen
Number of Workers Around 100 Workers

25
Globally Most Advanced Plastic Gear Plant
Kanuma Plant
Engineering Plastic Products BusinessTurns into Offensive Stage

26
Car Market Vision
Sensor Controlled Brake
Auto-cruise System
Changeable Distribution Light System
Night Vision
Liquid Crystal Control Display
Low-fuel consumption
Low-emission
Safety
Comfort
Low-fuel consumption
Low-emission
Safety
Comfort
Power Saving
High precision Control
Weight Saving
Power Saving
High precision Control
Weight Saving
Increase of Electric Actuator
Increase of Electric Actuator
Plastic Gear Market Growth
27
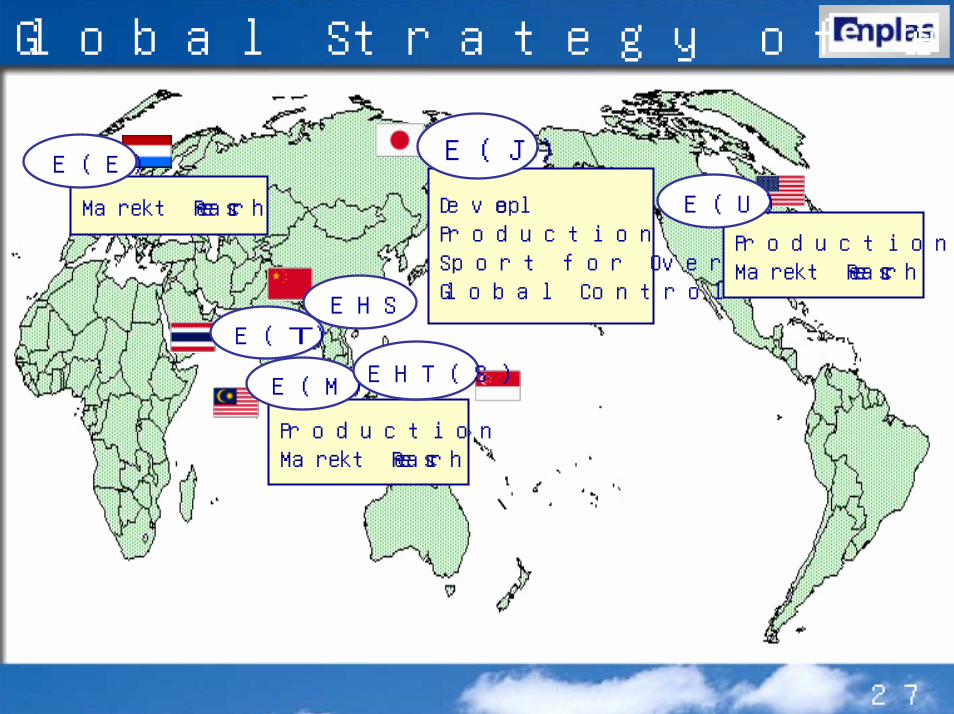
Global Strategy of Gear Business
DevelopProductionSport for OverseasGlobal Control
Market Research
E(E)
ProductionMarket Research
E(U)
EHSE(T)
E(J)
ProductionMarket Research
E(M) EHT(S)
28
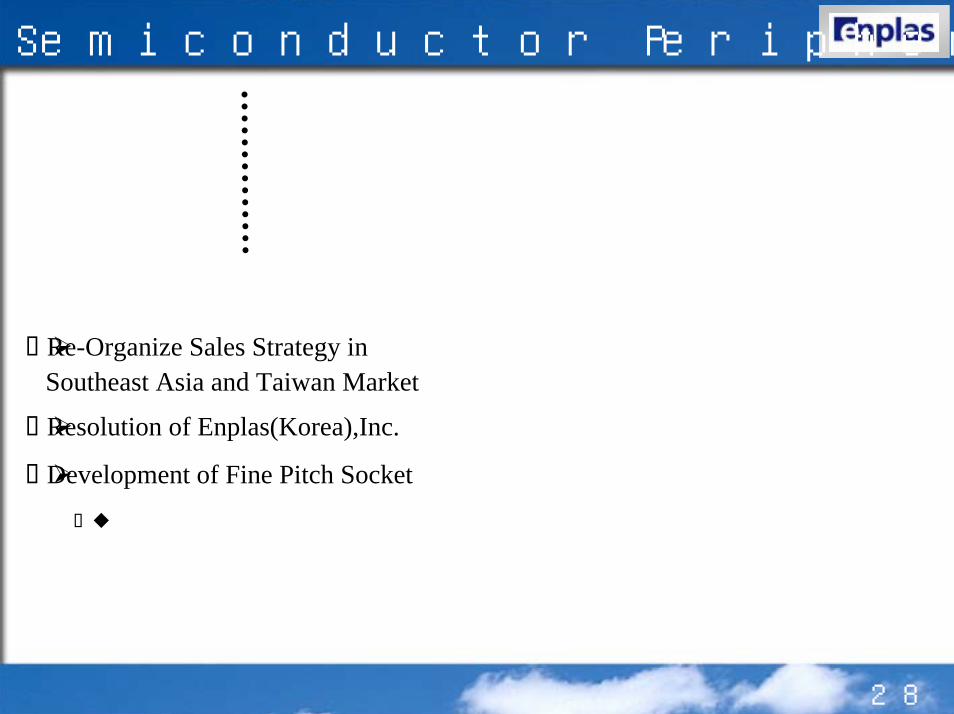
Semiconductor Peripheral Business
Re-Organize Sales Strategy in Southeast Asia and Taiwan Market
Resolution of Enplas(Korea),Inc.
Development of Fine Pitch Socket
Realized 0.3mm Pitch
Develop Advanced Elemental Technology to Satisfy Market Needs
High frequency IC→ Thermal Solution
High Currency DesignFine Pitch Socket
Expand Probe Card Business
2727 55Second Half Strategy
(100Million Yen)
31Second HalfRevised Plan
First HalfResult
2005/3First Half
Revised Plan
First Half Summary
29
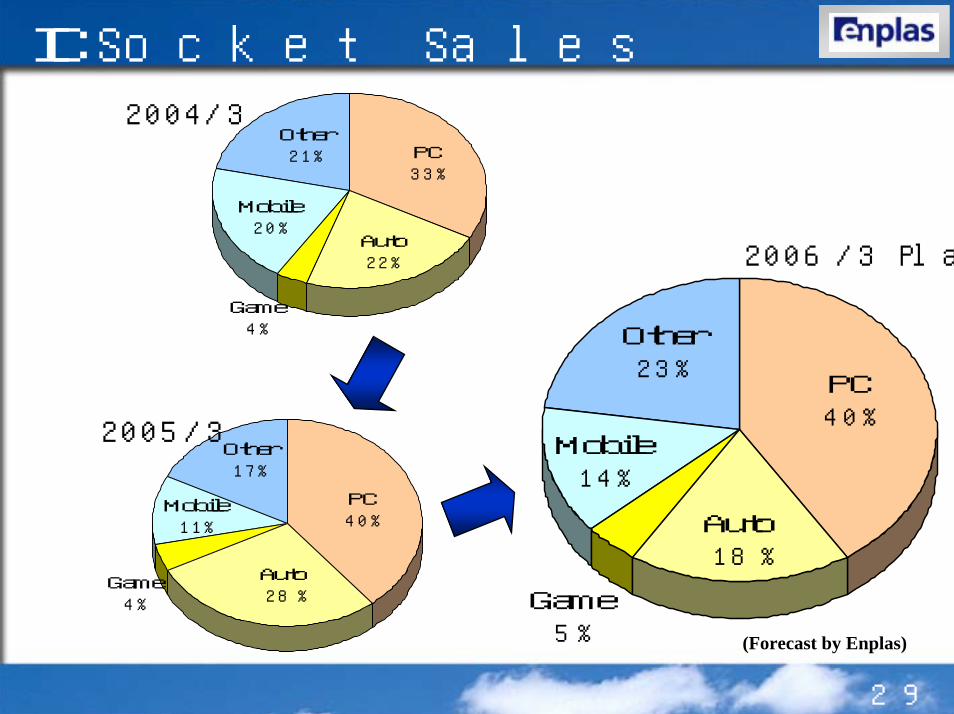
IC Socket Sales
Game5%
Other23%
Mobile14%
Auto18%
PC40%
Game4%
Other21%
Mobile20%
Auto22%
PC33%
Game4%
Mobile11%
Other17%
Auto28%
PC40%
2004/3
2005/3
(Forecast by Enplas)
2006/3 Plan

30
Developed Product
Developed Burn in Socket for 0.3mm Fine Pitch Contact
Developed Burn in Socket for 0.3mm Fine Pitch Contact
PatentPending
Socket 0.3mm PitchUnit
Original Solution of Contact Technology
Hair
31
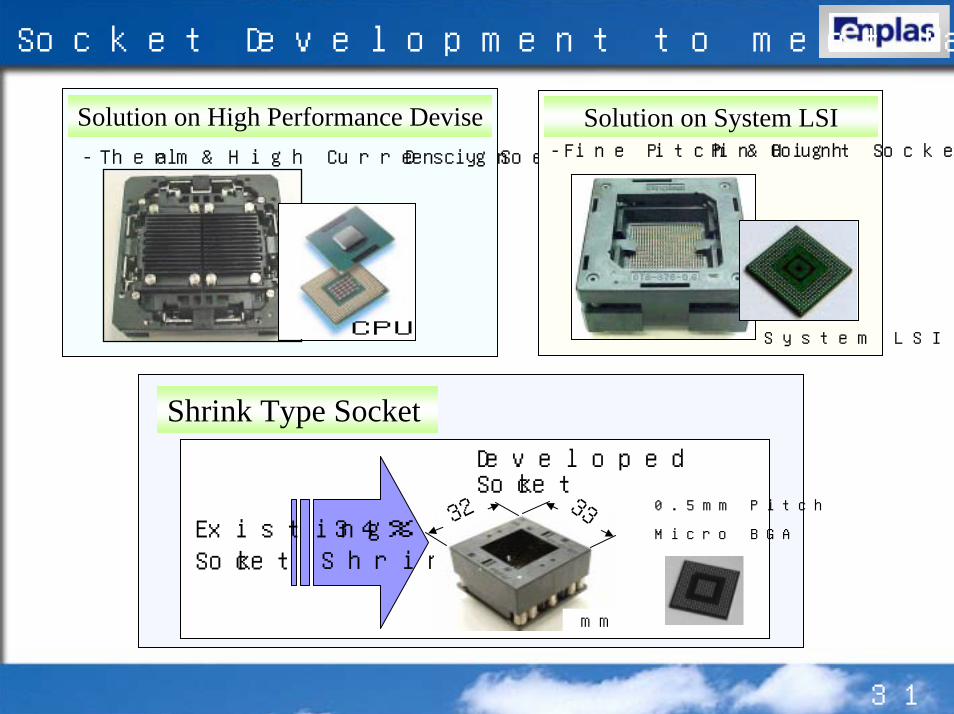
Socket Development to meet Market Requirement
CPU
Solution on High Performance Devise- Thermal & High Currency Socket Design -
System LSI
Solution on System LSI-Fine Pitch & High Pin Count Socket-
0.5mm Pitch
Micro BGA
Shrink Type Socket
Existing Socket
34%Shrink
3332
mm
Developed Socket
32
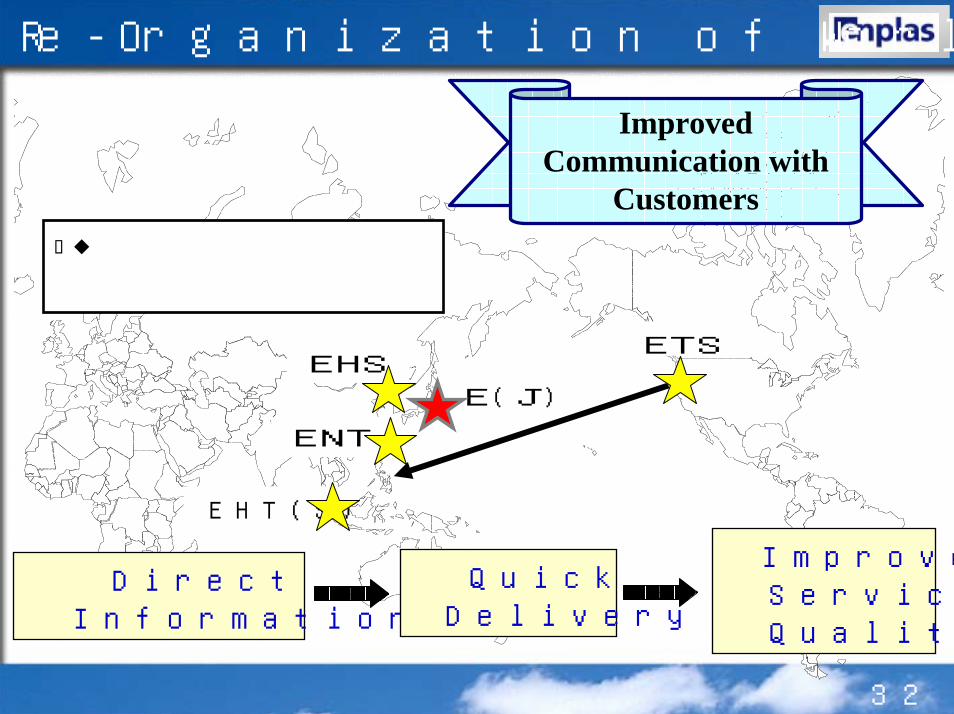
ENT
EHT(S)
ETS
Direct Information
Improved Service Quality
Improved Communication with
Customers
Quick Delivery
EHS
E(J)
Re-Organization of World Wide Sales
Europe / Korea
Covered by Subsidiary

33
Display Devise Business
Buildup development in Small SizeHigh-end Light Guide Panel(Mobile Phone & Digital Camera)
R&D of Next Generation LGP
Sales Marked a New Record
Increased Sales to ExistingCustomers
Growth of Profit Margin thanks toImproved Manufacturing Capability
Technical Advantage based onSeveral Significant Patents
Increase Market Share in High-End Note PC Market
3943 83Second Half Strategy
(100Million Yen)
23Second HalfRevised Plan
First HalfResult
2005/3First Half
Revised Plan
First Half Summary
34
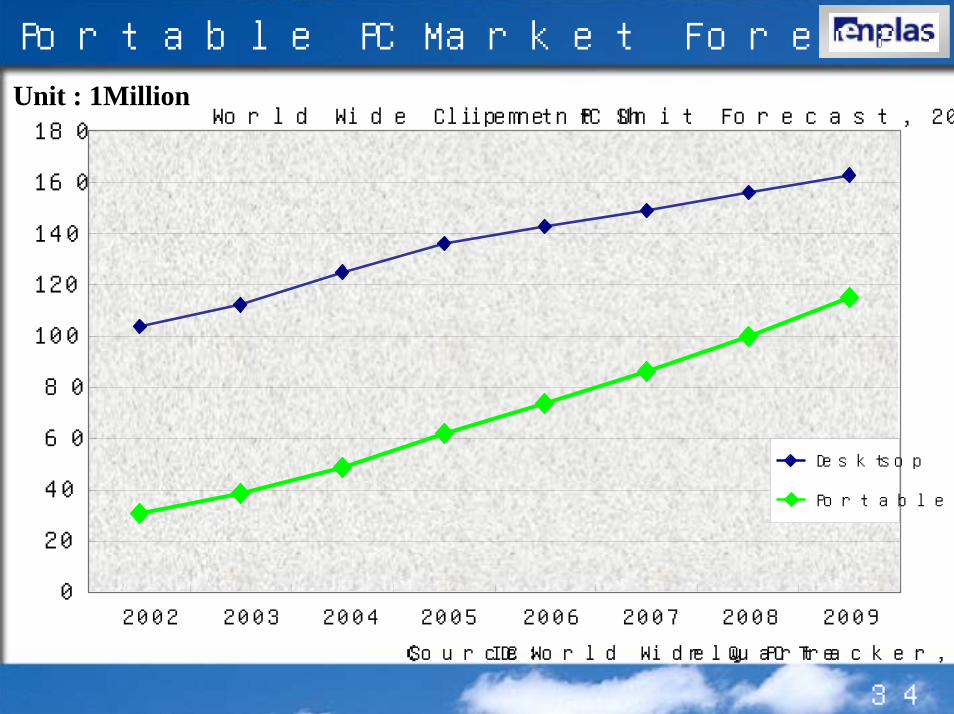
Portable PC Market Forecast
0
20
40
60
80
100
120
140
160
180
2002 2003 2004 2005 2006 2007 2008 2009
Unit : 1MillionWorld Wide Client PC Shipment Unit Forecast, 2002-2009
Desktops
Portable
(Source: IDC World Wide Quarterly PC Tracker, Q2 2005)

35
Portable PC Market & Sales Strategy Unit : 1Million
2002 2003 2004 2005 2006 2007 2008 2009
Portable PC Production
With PSP type LCD
0
20
40
60
80
100
120
140
(Forecast by Enplas)

36
LCD Panel for Note PC Shipping Share
Samsung25%
LG.Philips LCD21%
Quanta Display13%
Au optronics10%
TMDisplay7%
Chi Mei6%
ChunghwaPictureTube
4%
Hitachi3%
SHARP4%
Others4%
BOE Hydis3%
Korea
Taiwan
Japan
(Source : Display Research)
2005年 1Q

37
Small & Medium TFT-LCD Market ForecastUnit : 1Million
2004 2005 2006 2007 2008 2009(Source : Display Research)
Other
Game
DSC
Mobile
0
200
400
600
800
1,000
1,200
38
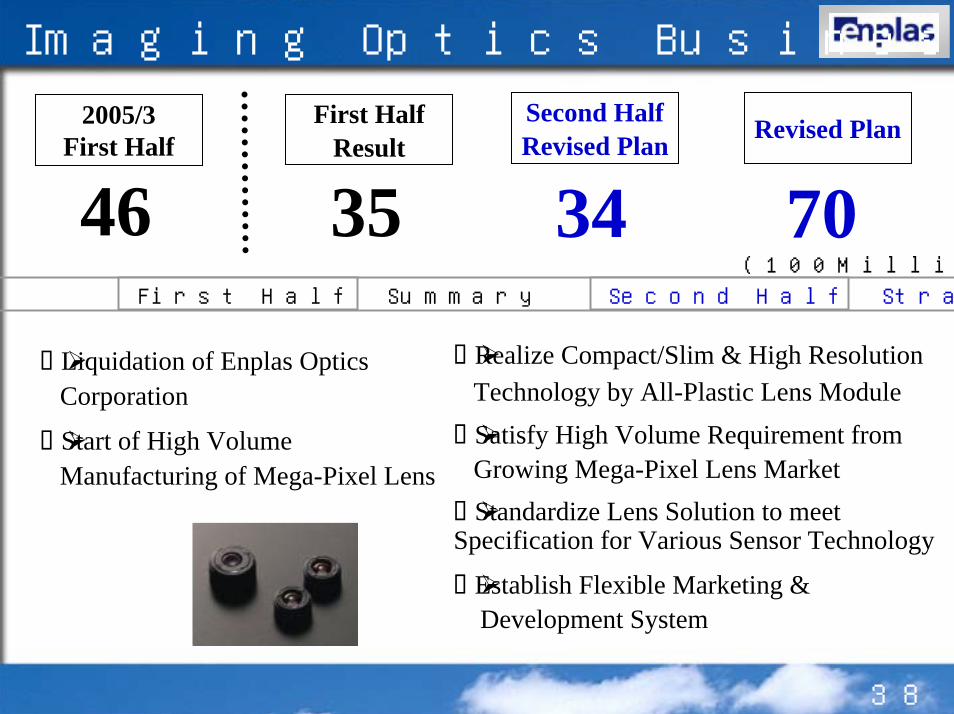
Imaging Optics Business
Realize Compact/Slim & High ResolutionTechnology by All-Plastic Lens ModuleSatisfy High Volume Requirement fromGrowing Mega-Pixel Lens MarketStandardize Lens Solution to meet
Specification for Various Sensor Technology
Establish Flexible Marketing &Development System
Liquidation of Enplas OpticsCorporation
Start of High Volume Manufacturing of Mega-Pixel Lens
3435 70Second Half Strategy
(100Million Yen)
46Second HalfRevised Plan
First HalfResult
2005/3First Half
Revised Plan
First Half Summary

39
Camera Phone Market Forecast
2003 2004 2005 2006 2007 2008
0
100
200
300
400
500
600
700
800
900World Wide Camera Phone Shipments Forecast, 2003-2008
Unit : 1Million
(Source : IDC, 12/2004, World Wide Mobile Phone 2004-2008 Forecast Update and 1H04 Vendor Shares, #32336)

40
Mobile Phone Market Trend and Forecast
Unit : 1Million
660
500
720 750
80
210
340
450
16%32%
47%
60%
0
100
200
300
400
500
600
700
800
2003 2004 2005 2006
With Camera
W/O Camera
Ratio
World Wide
(Forecast by Enplas)

41
Market Share of Sensor Manufacturer
Toshiba23%
Micron14%
Magunachip16%
OmniVision8%
Panasonic4%
SamsungElectronics Co,
7%
SHARP4%
STM14%
Agilent10%
210 Million2004
(Forecast by Enplas)

42
Market Share of Lens Module Manufacturer
SHARP6%
STM13%
Agilent9%
Flextronics8%
Panasonic SCDevice Solutions
7%
Samsung Tech6%
Samsung ElectroMechanics Co,
6%
Hunsung4%
Altus4%
Shinko Electr ic6%
Lite-ON4%
Other15%
LG-Innotek6%
Mitsumi6%
(Forecast by Enplas)
230 Million2004
43
Digital Optics Business
Developed New Product
Dual Wavelength Grating
Deflective Grating for Super-multi
Cost Reduction by Innovative Manufacturing System
Re-Organization of Business System
Appeal High Valued Product to Market
Promote Strategic Development for Next Generation Optical Lens for Pickup System
1514 30Second Half Strategy
(100Million Yen)
23Second HalfRevised Plan
First HalfResult
2005/3First Half
Revised Plan
First Half Summary
Sales Reduction by Downspin in Market Price
44
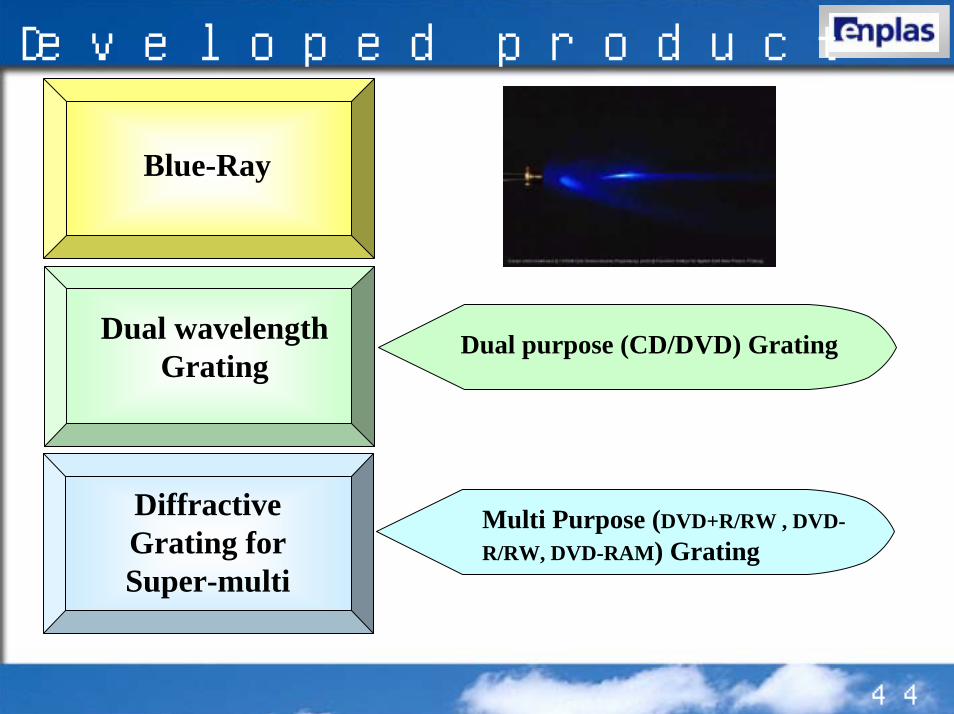
Developed product
Blue-Ray
Dual wavelengthGrating
Dual purpose (CD/DVD) Grating
Diffractive Grating for Super-multi
Multi Purpose (DVD+R/RW , DVD-R/RW, DVD-RAM) Grating
45
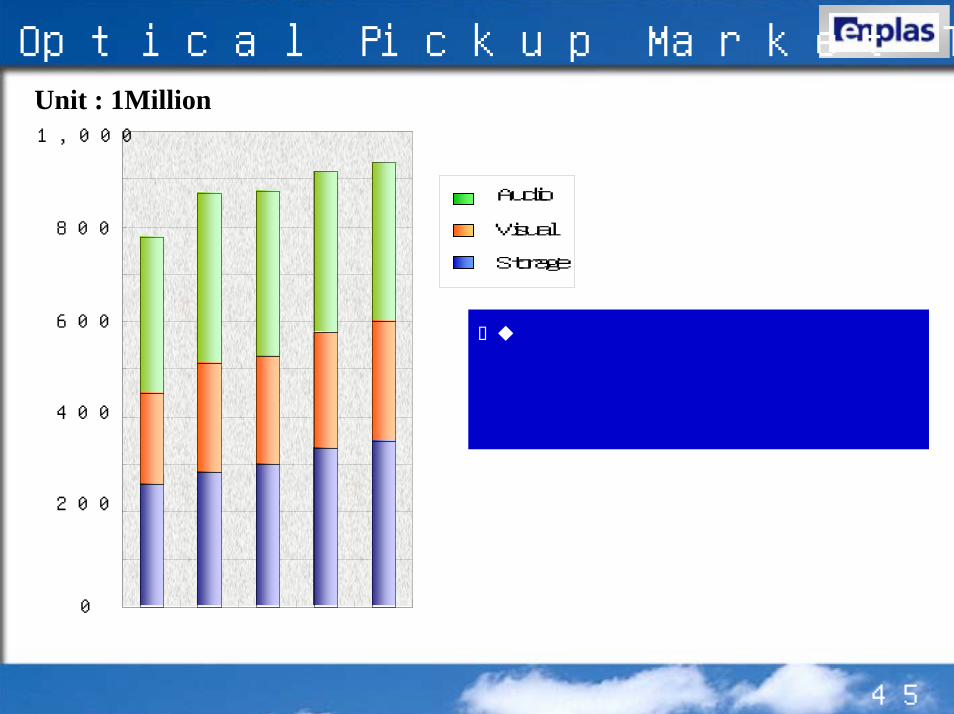
Optical Pickup Market TrendUnit : 1Million
0
600
200
800
400
1,000
Audio
Visual
Storage
Market Growth of
Dual wavelength Laser DVD RW(S-Multi)
Source :TSR03 04 05 06 07

46
DVD RW Market TrendUnit : 1Million DVD RW(S-Multi)
2003 2004 2005 2006 2007
DVD RW H/H
DVD RW Slim
DVD RW U-Slim
0
20
40
60
80
100
140
120
Dual wavelength Laser Load Ratio : 2006→15%・2007→30%Dual wavelength Laser Load Ratio : 2006→15%・2007→30%
Source :TSR
47
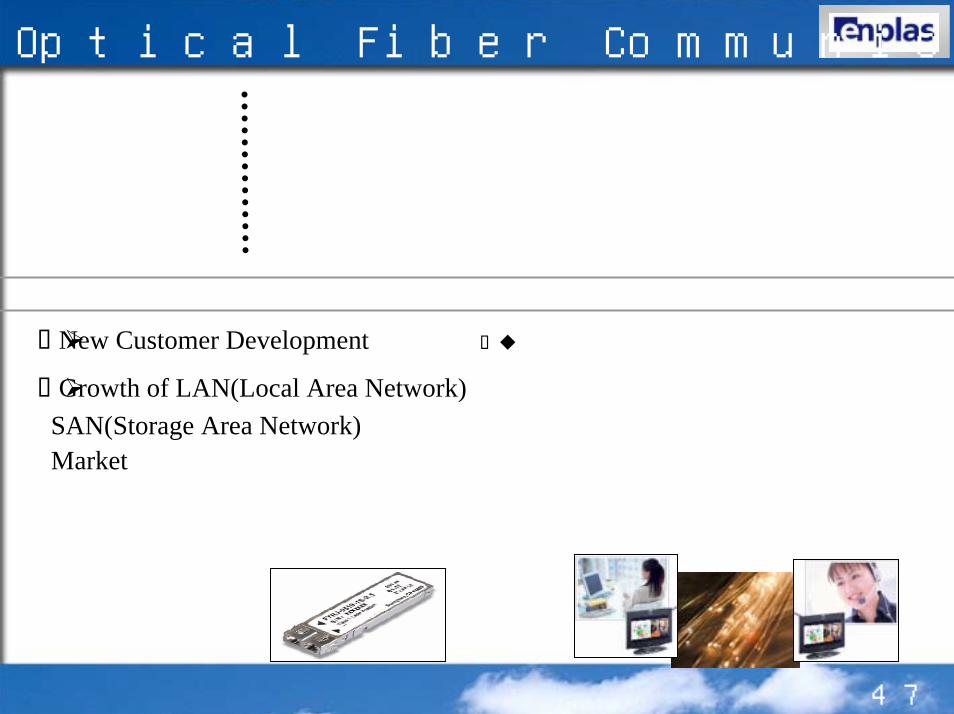
Optical Fiber Communication Business
New Customer Development
Growth of LAN(Local Area Network)SAN(Storage Area Network)Market
Approach Potential Customer
Develop New Optical Interface Module Market
Establish Technical Advantage with Patent and Original Know-How
43 8Second Half Strategy
(100Million Yen)
3Second HalfRevised Plan
First HalfResult
2005/3First Half
Revised Plan
First Half Summary

48
Image of Optical Network
Backbone
Metro
Access Network
Backbone Network
Metro Network
Access Network
MemoryDisc
Switch processor
Switch
Switch
Optical Transceiver
Data COM Network
LANSAN

49
Market Condition and Position of Enplas
EPSON
SONY
Fuji Xerox
Agilent:22%
Finisar:40%JDSU:22%
Others:16%
Expand VCSEL Optical Transceiver Manufacturer
Japanese VCSEL Maker
Matsushita Electric
(Forecast by Enplas)
Forecast of 2005 Global Forecast of 2005 Global VCSEL Market Share ENPLASVCSEL Market Share

50
Approach to OFC New Market
Optical Interface Module MarketKey word to new product “Integration”
Coupling Coupling Plastic Lens Combined BarrelPlastic Lens Combined Barrel
BranchingBranchingOptical InterconnectionOptical InterconnectionWDM Optical Branching filter/ Parallel Communication WDM Optical Branching filter/ Parallel Communication
Attenuation/ Reflection/ TransmissionAttenuation/ Reflection/ Transmission
51
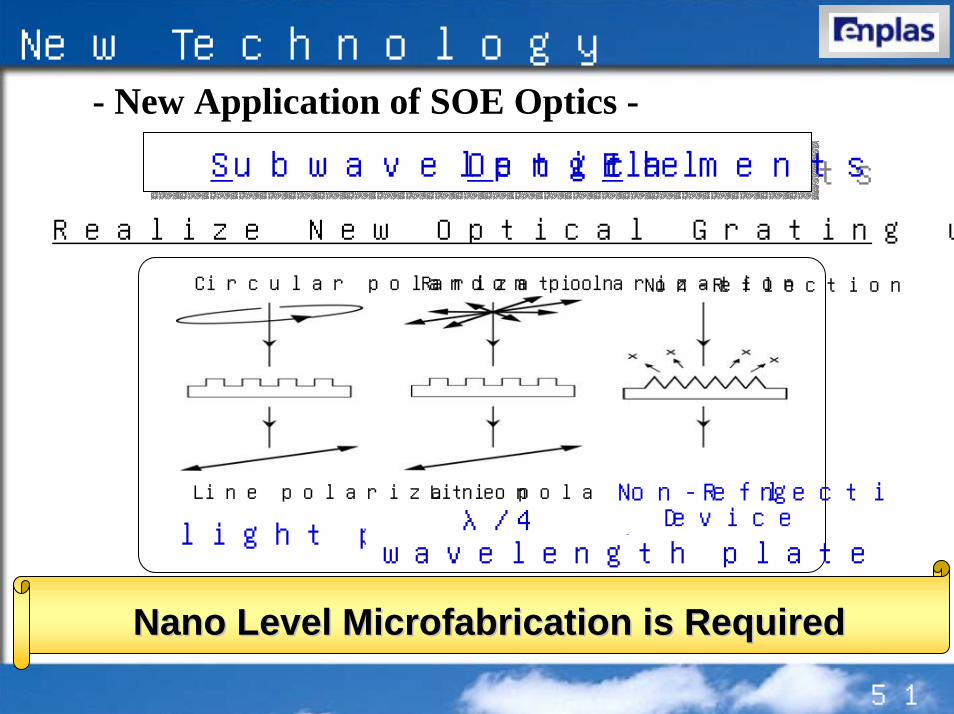
New Technology - New Application of SOE Optics -
Subwavelength Optical ElementsSubwavelength Optical Elements
Realize New Optical Grating with Original Function
NanoNano Level Level MicrofabricationMicrofabrication is Requiredis Required
Circular polarization Non-Reflection
light polarizer λ/4wavelength plate
Random polarization
Line polarization Line polarization Non-Reflecting Device
52
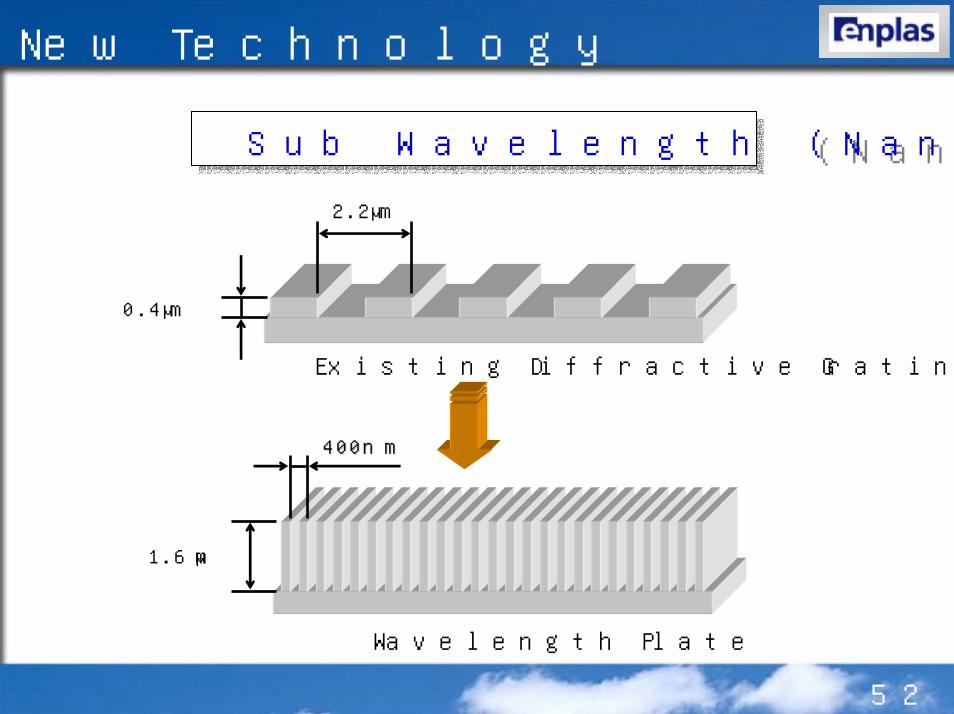
New Technology
Sub Wavelength (Nano)Sub Wavelength (Nano)
400nm400nm
2.2μm
Existing Diffractive Grating
0.4μm
Wavelength Plate
1.6μm

53
New Business
Source : PennWell
White Colored LED Business Market
0
1,000
2,000
3,000
4,000
5,000
6,000
7,000
8,000
2004 2005 2006 2007 2008 2009
電子機器/他
信号機
携帯電話
ディスプレイ
照明用
自動車
Unit : 1K
Electronics devise
Signal
Mobile Phone
Display Devise
Illumination
Auto Mobile
54
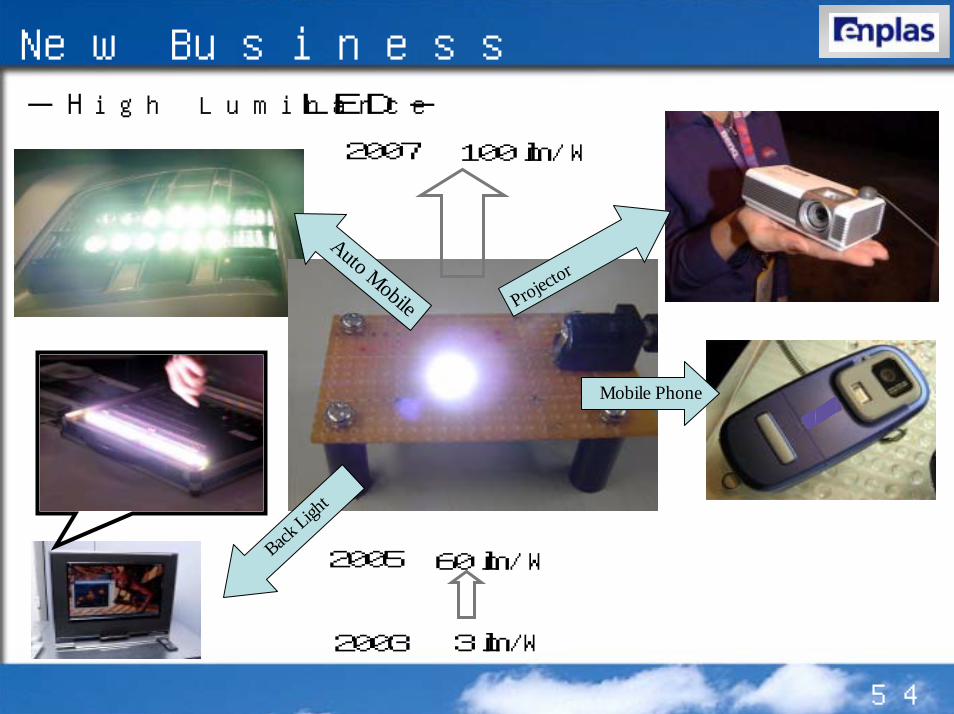
New Business
Back Ligh
t
Auto Mobile Projector
Mobile Phone
60 lm/W2005
100 lm/W
2003
- High Luminance LED -
2007
3 lm/W
by intelligence and vitality
Enplas Corporation