2006.10 j power sources
TRANSCRIPT
8/6/2019 2006.10 J Power Sources
http://slidepdf.com/reader/full/200610-j-power-sources 1/6
Journal of Power Sources 161 (2006) 606–611
Short communication
Effect of titanium substitution in layered LiNiO2 cathodematerial prepared by molten-salt synthesis
Hyung-Wook Ha, Kyung Hee Jeong, Keon Kim ∗
Division of Chemistry and Molecular Engineering, Korea University, Seoul 136-701, South Korea
Received 10 January 2006; accepted 21 March 2006
Available online 5 June 2006
Abstract
LiNi1− xTi xO2 (0≤ x≤ 0.1) compounds have been synthesized by a direct molten-salt method that uses a eutectic mixture of LiNO3 and LiOHsalts. According to X-ray diffraction analysis, these materials have a well-developed layered structure (R3-m) and are an isostructure of LiNiO 2.
The LiNi1− xTi xO2 (0≤ x≤ 0.1) compounds have average particle sizes of 1–5m depending on the amount of Ti salt. Charge–discharge tests
show that a LiNi1− xTi xO2 (0≤ x≤ 0.1) cathode prepared at 700 ◦C has an initial discharge capacity as high as 171 mA h g−1 and excellent capacity
retention in the range 4.3–2.8 V at a current density of 0.2 mA cm−2.
© 2006 Elsevier B.V. All rights reserved.
Keywords: Molten-salt synthesis; Lithium battery; Lithium nickel oxide; Cycling performance; Titanium substitution; Cathode material
1. Introduction
One of the most important power sources is the recharge-
able lithium-ion battery. The compound LiCoO2 is an excellent
positive electrode (cathode) material with good reversibility and
rate capability, but it suffers from high cost and cobalt is toxic.
Therefore, much effort has been made to develop cheaper and
more environmentally friendly cathode materials than LiCoO2.
In recent years, layered LiNiO2 has been studied extensively
[1,2] as a possible alternative to LiCoO2 because of its low cost
and a large theoretical capacity (275 mA h g−1).
Stoichiometric LiNiO2 is known to be difficult to synthe-
size and its multi-phase reactions during electrochemical cycling
lead to structural degradation [3]. During the charge process,
LiNiO2 undergoes a sequential change in crystal structure from
the hexagonal phase to the monoclinic phase, to the hexagonalphase again, then two hexagonal phases, and finally a single
hexagonal phase [4]. There is also concern over the thermal
stability of LiNiO2 in the charged state. To overcome the diffi-
culties of synthesis and structural instability during cycling and
to improve the thermal safety, the nickel ion has been substituted
by various metal ions (e.g., Mg, Al, Mn, Ga) [5–8]. It has been
∗ Corresponding author. Tel.: +82 2 953 1172; fax: +82 2 953 1172.
E-mail address: [email protected] (K. Kim).
reported that the substitution process stabilizes the crystal struc-
ture of the material during the intercalation/deintercalation of
lithium ions, even in an overcharged state, and there by improves
LiNiO2 cycleability.
A molten-salt method has been found to be a simple means
to prepare pure and stoichiometric powders of multi-component
oxides, in which the molten salts are utilized as solvent or react-
ing species [9,10]. Since the diffusion rates of the components in
molten salts are much higher than those in a solid-state reaction,
the various powders, such as LiCoO2, can be prepared at signif-
icantly lower temperatures [11]. Han et al. [11,12] have inves-
tigated the preparation of LiCoO2 and LiCo0.8M0.2O2 (M=Al,
Ni) by molten-salt synthesis.
In this study, stochiometric LiNi1− xTi xO2 (0≤ x≤ 0.1) pow-
ders are prepared by direct molten-salt synthesis using eutectic
mixtures of LiNO3 andLiOH moltensalts. Theeffect of titaniumon the structure and electrochemical properties of LiNi1− xTi xO2
(0≤ x≤ 0.1) compounds has been investigated.
2. Experimental
LiNi1− xTi xO2 (0≤ x≤ 0.1) was prepared by direct molten-
salt synthesis using appropriate amounts of Ni(OH)2 and
(NH4)2TiO(C2O4)2·H2O. A 0.59LiNO3–0.41LiOH flux was
used as the lithium salt and had a melting point of 183 ◦C. A
0378-7753/$ – see front matter © 2006 Elsevier B.V. All rights reserved.
doi:10.1016/j.jpowsour.2006.03.086
8/6/2019 2006.10 J Power Sources
http://slidepdf.com/reader/full/200610-j-power-sources 2/6
H.-W. Ha et al. / Journal of Power Sources 161 (2006) 606–611 607
stoichiometric ratio of Ni(OH)2, (NH4)2TiO(C2O4)2·H2O and
a large excess of 0.59LiNO3–0.41LiOH flux was prepared; the
molar ratios for the metal salts were 1, 5 and 10, respectively.
The Ni–Ti ions to Li-salt flux molar ratio is defined here as F .
The mixture was heated at 600–800 ◦C under an oxygen atmo-
sphere for 30 h. The heating rate was fixed at 200 ◦C h−1 for all
the temperature settings. Afterthe heating, the resulting powders
were cooled to ambient temperature and the residual fluxes were
removed by washing with distilled water and 1 M acetic acid
solution for 30 min. Finally, the powders were dried at 120 ◦C
for 12 h.
To investigate the crystal structure, the prepared powders
were characterized by X-ray diffraction using a Rigaku DMAX-
IIIA diffractometer equipped with a Cu target. The scan data
were collected in the 2θ range of 15–90◦. The step size was
0.020◦ with a counting time of 0.4 s. Rietveld refinement [13]
was performed on the X-ray diffraction profiles to confirm the
crystal structure. The peak shape was described by a pseudo-
Voigt function. The background level was defined by a polyno-
mial function.The valence states of the transition metal ions were inves-
tigated by X-ray photoelectron spectroscopy (XPS). The XPS
spectra were obtained by means of a PHI (Physical Electronics)
5800 spectrometer with an Al K X-ray source (1486.6 eV).
The electrochemical properties of the powders were exam-
ined by usinga two-electrode electrochemicalcell. The cathodes
were prepared by mixing 20 mg of each LiNi1− xTi xO2 ( x = 0,
0.025, 0.05, 0.1) compound with 12 mg of conductive binder
(8 mg of Teflonized acetyleneblack and4 mg of graphite), press-
ing the resulting mixture between two aluminum plates, and
then vacuum drying overnight at 120 ◦C. Lithium metal and
a polypropylene film served as the anode and the separator,respectively. The electrolyte was 1 M LiPF6 in 1:1 mixture by
volume of ethylene carbonate/dimethyl carbonate (EC/DMC).
The entire cell was assembled in a glove box. The electrochem-
ical performances of the various compounds were evaluated by
cycling in the2.8–4.3 V (versus Li/Li+) range at a current density
of 0.2mAcm−2 at room temperature.
Differential scanning calorimetry (DSC) experiments were
conducted on LiNiO2 and LiNi0.9Ti0.1O2 samples charged to
4.5 V for 24h. The data were acquired at a scan rate of
10 ◦Cmin−1 in the temperature range of 50–400 ◦C.
3. Results and discussion
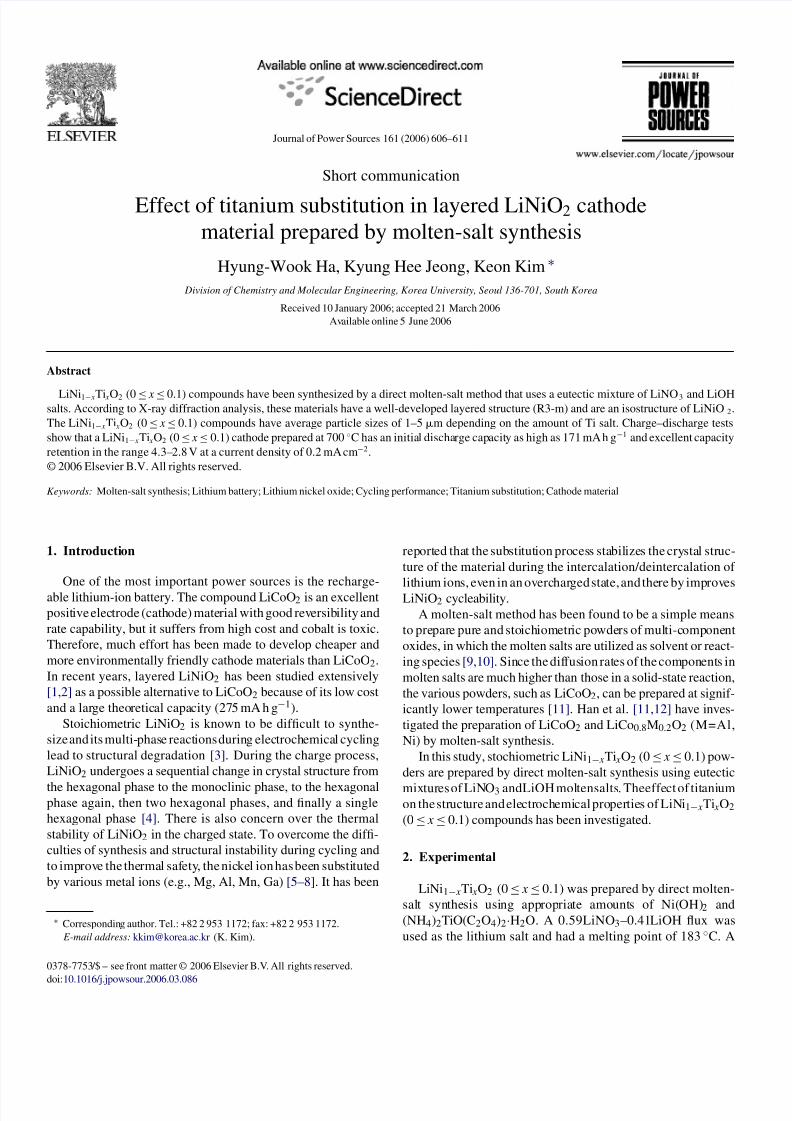
The effect of calcination temperature on the formation of
LiNi0.95Ti0.05O2 is investigated. The XRD patterns recorded
for LiNi0.95Ti0.05O2 calcined at different temperatures for 30 h
using the same amount of LiNO3–LiOH flux, i.e., F = 10, are
shown in Fig. 1. The material calcined at 600 ◦C shows very
broad peaks, which indicates low crystallinity. Although all
the peaks are indexable in the hexagonal lattice, calcination at
600 ◦C is not sufficient to impart any hexagonal lattice ordering
of the lattice. Increasing the calcination temperature to 700 ◦C
results in very sharp diffraction peaks. This suggests, complete
hexagonal lattice ordering. Further increase of the calcination
temperature to 800◦
C causes a clear split of the (0 0 6) and
Fig. 1. X-ray powder diffraction patterns of LiNi0.95Ti0.05O2 powders synthe-
sized at various temperatures for 30 h in F = 10 system: (a) 600 ◦C; (b) 700 ◦C;
and (c) 800 ◦C.
(10 2) peaks and good symmetry of the (10 8) and (11 0) peaks.
Although there is very little difference between the samples cal-
cined at 700 and 800 ◦C, the lower calcination temperature is
more advantageous. From these results, the optimum calcina-
tion temperature is taken as 700 ◦C.
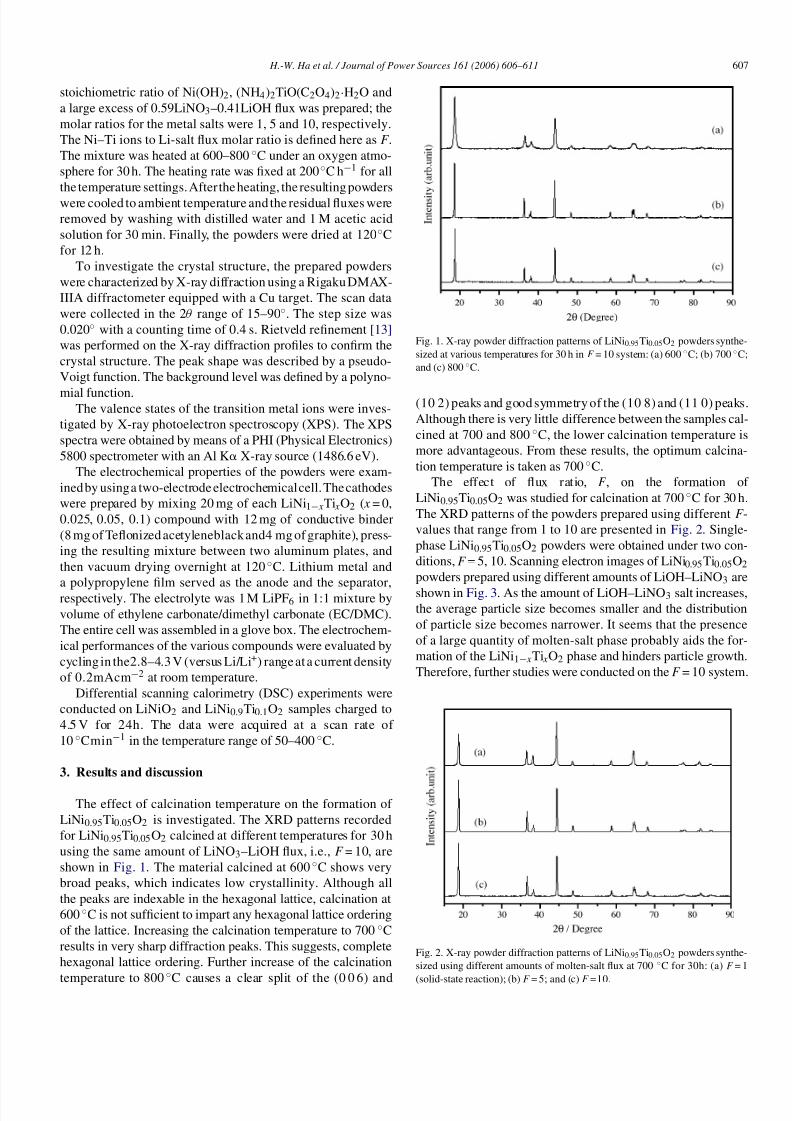
The effect of flux ratio, F , on the formation of
LiNi0.95Ti0.05O2 was studied for calcination at 700 ◦C for 30 h.
The XRD patterns of the powders prepared using different F -
values that range from 1 to 10 are presented in Fig. 2. Single-
phase LiNi0.95Ti0.05O2 powders were obtained under two con-
ditions, F = 5, 10. Scanning electron images of LiNi0.95Ti0.05O2
powders prepared using different amounts of LiOH–LiNO3 are
shown in Fig. 3. As the amount of LiOH–LiNO3 salt increases,the average particle size becomes smaller and the distribution
of particle size becomes narrower. It seems that the presence
of a large quantity of molten-salt phase probably aids the for-
mation of the LiNi1− xTi xO2 phase and hinders particle growth.
Therefore, further studies were conducted on the F = 10 system.
Fig. 2. X-ray powder diffraction patterns of LiNi0.95Ti0.05O2 powders synthe-
sized using different amounts of molten-salt flux at 700 ◦C for 30h: (a) F = 1
(solid-state reaction); (b) F = 5; and (c) F =10.

8/6/2019 2006.10 J Power Sources
http://slidepdf.com/reader/full/200610-j-power-sources 3/6
608 H.-W. Ha et al. / Journal of Power Sources 161 (2006) 606–611
Fig. 3. Scanning electron micrographs of LiNi0.95Ti0.05O2 powders calcined at 700 ◦C for 30 h using various molten-salt flux: (a) F = 1; (b) F = 5; and (c) F =10.
The XRD patterns of LiNi1− xTi xO2 powders synthesized at
700 ◦C for 30 h using the same amount of molten salt as F = 10
are shown in Fig. 4. The XRD lines are quite narrow for all of the
samples, which indicates quite good crystallinity of the materi-
Fig. 4. X-ray powder diffraction patterns of LiNi1− xTi xO2 samples.
als. The intensity ratio of the (0 0 3) peak to the (1 0 4) peak has
a relatively high value of 1.3–1.5. The ratio is generally used to
examine the crystallinity of the LiNiO2 phase [14]. The pattern
also shows a clear split of the (0 0 6) and (1 0 2) peaks and a
good symmetry of the (1 0 8) and (1 1 0) peaks. According to
XRD analysis, the LiNi1− xTi xO2 ( x = 0, 0.025, 0.05, 0.1) com-
pounds are found to be isostructural with LiNiO2, which has the
rhombohedral layered structure ( R3–m). As the titanium content
increases, all of the peaks shift slightly towards lower diffraction
angles because of the titanium ions substituted in the nickel sites
[4].The Rietveld refinement gave factors and the structural
parameters that were in good agreement with those obtained
by Croguennec et al. [15]. Increase in the a and c parameters
with increasing amount of Ti ion is observed. This is because of
the larger size of the titanium ions (Ti4+ = 0.605) compared with
the Ni3+ ions (r = 0.56). The lattice constants a and c, as well as
the c / a, [ I 0 0 6 + I 1 0 2]/ I 1 0 1 and I (003) / I (104) ratios are summa-
rized in Table 1. The R-factor, which was defined by Reimers
et al. [16] as [ I 0 0 6 + I 1 0 2]/ I 1 0 1, should be at a minimum in a
system with good hexagonal ordering.
From XPS analysis, the valence states of the Ti and Ni ions
are found to be Ti4+
and Ni3+
and a small amount of divalent

8/6/2019 2006.10 J Power Sources
http://slidepdf.com/reader/full/200610-j-power-sources 4/6
H.-W. Ha et al. / Journal of Power Sources 161 (2006) 606–611 609
Fig. 5. XPS data of LiNi0.95Ti0.05O2 sample.
nickel ion is detected, as shown in Fig.5. Ti2p3/2 lines with bind-
ing energy (BE) of 457.5 eV correspond to Ti(IV). The major
Ni 2p3/2 line with a binding energy of 855.1 eV and a shoulder
with a binding energy of 854.3 eV correspond to Ni3+ and Ni2+,
respectively. The tetravalent titanium ions substitute for triva-
lent nickel ions in LiNiO2 and induce the presence of an equalamount of Ni2+ ions for charge compensation. The existence of
divalent nickel ions in LiNiO2 causes the formation of lithium
oxide impurities, and results in the presence of nickel ions in
the lithium layer (3b site), that hinder the smooth transport of
lithium ions through the lithium plane.
Scanning electron micrographs of LiNi1− xTi xO2 powders
prepared at 700 ◦C for 30 h are presented in Fig. 6. Obviously,morphological changes occur as the amount of Ti increases. The
Fig. 6. Scanning electron micrographs of LiNi1− xTi xO2 samples (a) x = 0; (b) x = 0.025; (c) x = 0.05; and (d) x = 0.1.

8/6/2019 2006.10 J Power Sources
http://slidepdf.com/reader/full/200610-j-power-sources 5/6
610 H.-W. Ha et al. / Journal of Power Sources 161 (2006) 606–611
Table 1
Lattice parameters, structural parameters of LiNi1− xTi xO2 ( x = 0, 0.025, 0.05,
0.1)
Composition ahex (A) chex (A) c / a [ I 0 0 6 + I 1 0 2]/
I 1 0 1
I 0 0 3 /
I 1 0 4
LiNiO2 2.874 14.187 4.936 0.53 1.452
LiNi0.975Ti0.025O2 2.876 14.213 4.942 0.53 1.323
LiNi0.95Ti0.05O2 2.885 14.239 4.935 0.55 1.232LiNi0.9Ti0.1O2 2.891 14.256 4.931 0.45 1.153
LiNiO2 powders are smooth-edged polyhedral and their average
size is approximately 3–5m. The LiNi1− xTi xO2 ( x = 0.1) sam-
ple, however, has close to spherical morphology and an average
particle size of less than 1m. As the amount of Ti increases,
the average particle size becomes smaller and the distribution of
particle size becomes narrow.
Charge–discharge curves between 2.8 and 4.3 V at a con-
stant current density of 0.2 mA cm−2 are presented in Fig. 7 f or
LiNi1− xTi xO2 cathodes. The LiNi0.975Ti0.025O2 sample has aninitial capacity of 171 mA h g−1 and a value of 164mAh g−1 on
the 30th cycle. Thus, the material displays remarkable capacity
retention. The electrochemical performance of LiNi1− xTi xO2 is
superior, or comparable with that of the LiNiO2 system. Since
Ti4+ is not electrochemically active in the voltage range of
4.3–2.8 V, the capacity decreases almost linearly as the titanium
increases. The existence of divalent nickel ions in the LiNiO 2
system may be responsible for the poor capacity and irreversible
capacity loss of the LiNiO2 system. In fact, good electrochem-
ical performance of LiNi1− xTi xO2 ( x = 0, 0.025, 0.05, 0.1) is
achieved by preventing the migration of impurity Ni2+ ions into
the lithium plane by substituting tetravalent titanium ions into
the structure.The results of differential scanning calorimetry tests are
shown in Fig. 8. These were performed to study the thermal sta-
bility of the LiNi1− xTi xO2 materials, especially in the charged
Fig. 7. Evolution of charge and discharge capacities with number of cycles of
LiNi1− xTi xO2 ( x = 0, 0.025, 0.05, 0.1) cells at current density of 0.2mA cm−2
between 2.8 and 4.3 V.
Fig. 8. Differential scanning calorimetry profiles (10 ◦Cmin−1) of (a) LiNiO2;
and (b) LiNi0.9Ti0.1O2 charged at 4.5 V for 24 h.
state. The DSC profile of LiNiO2 charged to 4.5 V has a sharpexothermic peak at about 220◦C. This peak is obviously of great
safety concern for Li-ion batteries using LiNiO2 as the cathode
material [17]. As shown in Fig. 8(b), LiNi0.9Ti0.1O2 material
has much smaller exothermic reaction at about 230 ◦C. This
indicates that LiNi0.9Ti0.1O2 has better thermal safety charac-
teristics than LiNiO2.
4. Conclusions
LiNi1− xTi xO2 (0≤ x≤ 0.1) powders are synthesized as an
alternative cathode material for lithium batteries by a direct
molten-salt method using a eutectic mixture of LiNO3 and LiOHsalts. The valency states of the transition metals are Ti(IV) and
Ni(III), as determined by XPS studies. The particles of the
LiNi1− xTi xO2 (0≤ x≤ 0.1) powders have spherical morphol-
ogy. A LiNi0.975Ti0.025O2 cathode exhibits an initial discharge
capacity of 171 mAh g−1 and an excellent capacity retention
over 30 cycles. Its electrochemical performance is superior to
that of the LiNiO2 system. Differential scanning calorimetry
experiments revealed that LiNi0.9Ti0.1O2 has better thermal sta-
bility than LiNiO2 cathode material.
Acknowledgement
This research was performed with financial support from the
‘Center for Nanostructured Materials Technology’ under the
‘21st Century Frontier R&D Programs’ of the Ministry of Sci-
ence and Technology, Korea.
References
[1] J.R. Dahn, U. Sacken, M.W. Juzkow, H. AI-Janaby, J. Electrochem. Soc.
138 (1991) 2207.
[2] W. Ebner, D. Fouchard, L. Xie, Solid State Ionics 69 (1994) 238.
[3] M.E. Arroyo y de Dompablo, G. Ceder, J. Power Sources 119–121 (2003)
654.
[4] T. Ohzuku, A. Ueda, M. Nagayama,J. Electrochem.Soc. 140 (1993) 1862.
8/6/2019 2006.10 J Power Sources
http://slidepdf.com/reader/full/200610-j-power-sources 6/6
H.-W. Ha et al. / Journal of Power Sources 161 (2006) 606–611 611
[5] B.V.R. Chowdari, G.V. Subba Rao, S.Y. Chow, Solid State Ionics 140
(2001) 55.
[6] S.H. Park, K.S. Park, Y.K. Sun, K.S. Nahm, Y.S. Lee, M. Yoshio, Elec-
trochim. Acta 46 (2001) 1215.
[7] Y. Makimura, T. Ohzuku, J. Power Sources 119–121 (2003) 156.
[8] Y. Nishida, K. Nakane, T. Satoh, J. Power Sources 68 (1997) 561.
[9] C.C. Chiu, C.C. Li, S.B. Desu, J. Am. Ceram. Soc. 74 (1991) 38.
[10] K.H. Yoon, Y.-S. Cho, D.-H. Lee, D.-H. Kang, J. Am. Ceram. Soc. 76
(1993) 1373.[11] C.H. Han, Y.S. Hong, C.M. Park, K. Kim, J. Power Sources 92 (2001) 95.
[12] C.H. Han, Y.S. Hong, K. Kim, Solid State Ionics 159 (2003) 241.
[13] J. Rodriguez-Carvajal, Program Fullprof, Version 3.2, LLB JRC, January,
1997.
[14] M.Y. Song, R. Lee, J. Power Sources 111 (2002) 97.
[15] L. Croguennec, E. Suard, P. Willmann, C. Delmas, Chem. Mater. 14 (2002)
2149.
[16] J.N. Reimers, E. Rossen, C.D. Jones, J.R. Dahn, Solid State Ionics 61
(1993) 335.
[17] Y. Gao, M.V. Yakovleva, W.B. Ebner, Electrochem. Solid State Lett. 1(1998) 117.