2006 rates package (word - 593kb) · web viewcouncils under pressure to increase rates. 1 july...
TRANSCRIPT

Councils under pressure to increase rates
1 July 2006
Data released today by the Municipal Association of Victoria (MAV) shows council rates will increasean average 6.3% across Victoria, as budgets face a mounting combination of cost pressures.
MAV President, Cr Geoff Lake said local government revenue in Victoria is set to increase by 4.5%to $4.7 billion in the year ahead, while rates are increasing at a faster pace.
“A range of external costs and inadequate funding arrangements have forced many councils tomake difficult decisions to meet the challenge of balancing responsible financial management withcommunity needs and expectations.
“In particular, the total proportion of financial contributions from other levels of government hasfailed to keep pace with local government costs. This has severely undermined the budgetaryposition of councils and forced rates up.
“As a result, a greater proportion of councils’ total revenue is now being generated from rates,increasing from an average of 51% in 2004 to 55% this year.
“In addition, Victorian councils are facing an annual shortfall of $310 million to repair and maintainageing infrastructure such as roads, bridges, footpaths, town halls, recreation facilities, swimmingpools and drains,” he said.
Cr Lake believes sustainable funding streams from other levels of government must be addressedas a matter of priority at the highest level.
“Of the total tax revenue collected by all levels of government, councils collect only three per cent.
“Communities cannot be expected to withstand the kind of rate increases that would be needed tocontinue servicing the expanding range of functions now expected of local government.
“It is time for financial assistance grants from the Commonwealth to increase and othergovernment funding programs to keep pace with the real cost of delivering services.
“Until this happens, councils are faced with few options and will be forced to continue their relianceon rate revenue to meet ongoing community needs,” Cr Lake concluded.
Note: 2006 is a biennial property revaluation year. New property valuations affect how much eachproperty owner contributes towards the rates, but not the total amount collected in rates by a council.
- Ends -
Further information contact MAV President Geoff Lake on 0411 645 281 or MAV Communicationson (03) 9667 5521/0414 396 097.
2006-07 council budget and rates data is on the hotlist of the MAV home page: www.mav.asn.au
Municipal Association of VictoriaLevel 12, 60 Collins Street, Melbourne, 3000.Tel: 9667 5555, Fax: 9667 5550, Email: [email protected]

2006-07 council rates data collated by the MAV has beenprovided in two formats – rates per assessment and ratesper capita.
Rates per assessment
The MAV has used average rates, municipal charges and garbage charges per assessmentto measure rate movements for the past two years.
Average rates per assessment are an estimate of the average rate bill received byhouseholds.
Demographic characteristics and the economic dynamics of the community affect thequantum average rates per assessment. For example, councils with high levels ofcommercial and industrial businesses tend to have higher rates per assessment than othercouncils do, irrespective of the residential rates.
Likewise, councils with little or no commercial and industrial activities and with largehouseholds will also tend to have higher rates per assessment. In addition, a single farmenterprise may include several assessments, which will skew the data.
Rates per capita
The MAV has adopted average rates, municipal charges and garbage charges per head ofpopulation to measure rates for 2006-07.
Average rates per head are a good measure of the comparative tax burden placed on thecommunities with other levels of government. Many of the taxes levied by Commonwealthand state governments are compared on a per head basis so this measure enables a validcomparison with these figures.
It is also a useful measure in gaining a clearer picture of the rate structures of councils thathave little or no industrial activities and large households.
Rates per head is an increasingly useful measure of local government rates as the servicesprovided by councils expand from property-based to human-based services.

2006-07 Victorian Council Budget and Rates Data
All data has been provided by individu al councils and collated by the MAV.
Budgeted totalrevenue for 2006-07
Gross Rates,MunicipalCharges andGarbage Charges2006-07
Rate Revenue asa proportion oftotal revenue 05-06
Rate Revenue asa proportion oftotal revenue 06-07
Per assessment -average rates,municipal chargeand garbagecharge 06-07
Change inaverage rates,municipal chargeand garbagecharge perassessment
Per head ofpopulation -average rates,municipal chargeand garbagecharge 06-07
Change inaverage rates,municipal chargeand garbagecharge per headof population
Alpine (S)Ararat (RC)Ballarat (C)Banyule (C)Bass Coast (S)Baw Baw (S)Bayside (C)Benalla (RC)Boroondara (C)
$19,837,000$18,582,000$93,351,000$82,415,000$40,400,000$46,639,000$69,465,000$16,357,000
$123,900,000
$8,073,584$8,134,000
$47,181,000$46,910,109$23,727,000$22,561,734$46,698,000
$9,509,803$89,437,000
40.7%46.4%45.2%52.4%60.5%47.4%66.2%42.9%66.8%
40.7%43.8%50.5%56.9%58.7%48.4%67.2%58.1%72.2%
$1,037$1,205$1,148
$953$910
$1,153$1,178$1,280$1,313
$45$75$65$67$62
$138$68$93$82
$597$699$536$398$780$577$511$672$562
$23$43$35$28$40$64$29$51$38
Brimbank (C)
Buloke (S)
Yet to consider draft budget
Yet to consider draft budget
Campaspe (S)Cardinia (S)Casey (C)Central Goldfields (S)Colac-Otway (S)Corangamite (S)Darebin (C)East Gippsland (S)Frankston (C)
$48,953,067$51,200,000
$167,302,000$19,173,534$31,673,000$29,560,000$99,204,000$53,114,000
$100,292,000
$20,783,674$27,931,059$84,795,000
$6,584,451$14,736,888$11,574,878$62,869,786$27,073,548$51,897,000
38.4%51.5%47.5%33.2%46.4%36.6%62.4%53.4%52.8%
42.5%54.6%50.7%34.3%46.5%39.2%63.4%51.0%51.7%
$1,066$1,100
$995$827
$1,069$1,228$1,048
$984$980
$38$22$62$60$92$53$62$72$61
$550$436$369$501$672$659$485$655$436
$23$7
$24$41$53$30$22$43$30
Gannawarra (S) Yet to consider draft budget
Glen Eira (C)Glenelg (S)Golden Plains (S)Greater Bendigo (C)Greater Dandenong (C)Greater Geelong (C)
$86,422,942$32,987,874$21,074,380$99,578,000
$107,325,000$177,270,000
$54,917,710$15,907,056
$7,824,540$49,407,696$68,217,749
$105,064,988
62.5%44.7%35.2%50.6%64.6%57.7%
63.5%48.2%37.1%49.6%63.6%59.3%
$952$1,191
$897$1,042$1,235$1,066
$34$100
$82$71$99$70
$446$785$452$503$505$496
$19$71$32$28$41$32
Greater Shepparton (C) Yet to consider draft budget
Hepburn (S)Hindmarsh (S)
$18,250,000$12,815,625
$9,137,023$4,242,274
41.7%33.6%
50.1%33.1%
$934$849
$52$50
$609$668
$39$44

Moreland (C)
Budgeted totalrevenue for 2006-07
Gross Rates,MunicipalCharges andGarbage Charges2006-07
Rate Revenue asa proportion oftotal revenue 05-06
Rate Revenue asa proportion oftotal revenue 06-07
Per assessment -average rates,municipal chargeand garbagecharge 06-07
Change inaverage rates,municipal chargeand garbagecharge perassessment
Per head ofpopulation -average rates,municipal chargeand garbagecharge 06-07
Change inaverage rates,municipal chargeand garbagecharge per headof population
Hobsons Bay (C)
Horsham (RC)Hume (C)Indigo (S)Kingston (C)Knox (C)Latrobe (C)Loddon (S)Macedon Ranges (S)Manningham (C)Mansfield (S)Maribyrnong (C)Maroondah (C)Melbourne (C)Melton (S)Mildura (RC)Mitchell (S)Moira (S)Monash (C)Moonee Valley (C)Moorabool (S)
i
Mornington Peninsula (S)
Mount Alexander (S)
$27,379,413$136,764,000
$20,480,000$114,188,000
$92,235,000$76,999,000$19,985,922$39,049,000$75,932,000$12,721,000$71,586,000$73,499,000
$263,677,000$97,568,221$64,668,000$32,656,000$34,709,350
$111,094,223$87,853,000$29,199,465$95,795,000
$129,718,000$22,825,860
$11,628,514$70,848,808
$7,622,676$67,902,000$55,996,860$42,072,000
$5,903,712$21,683,716$53,840,473
$7,803,966$44,769,000$44,121,399
$135,553,756$40,006,500$35,491,000$15,307,000$18,051,853$59,547,482$56,612,850$14,746,982$66,763,824$85,073,000
$9,578,380
42.3%48.9%31.5%58.4%59.4%54.4%26.9%51.5%70.8%52.7%56.8%57.1%52.2%41.2%50.3%42.5%49.8%49.9%64.2%53.5%67.0%60.8%42.1%
42.5%51.8%37.2%59.5%60.7%54.6%29.5%55.5%70.9%61.3%62.5%60.0%51.4%41.0%54.9%46.9%52.0%53.6%64.4%50.5%69.7%65.6%42.0%
$1,044$1,208
$990$1,048
$944$1,217
$772$1,169$1,239$1,161
$1,005$2,318$1,143$1,360$1,037$1,135
$862$1,134$1,124$1,037
$944$940
$72$87$65$70$32$40$23$63$69$73
$57-$56$39$78
$128$77$71$65$84$70$44$65
$602$407$485$499$371$597$679$470$465
$1,146$704$428
$1,820$446$666$484$645$363$505$567$484$591$545
$40$24$31$34$14$33$23$47$20
$111$32$20$62
$8$38$58$58$29$29$55$26$33$40
Moyne (S)
Murrindindi (S)
Yet to consider draft budget
Yet to consider draft budget
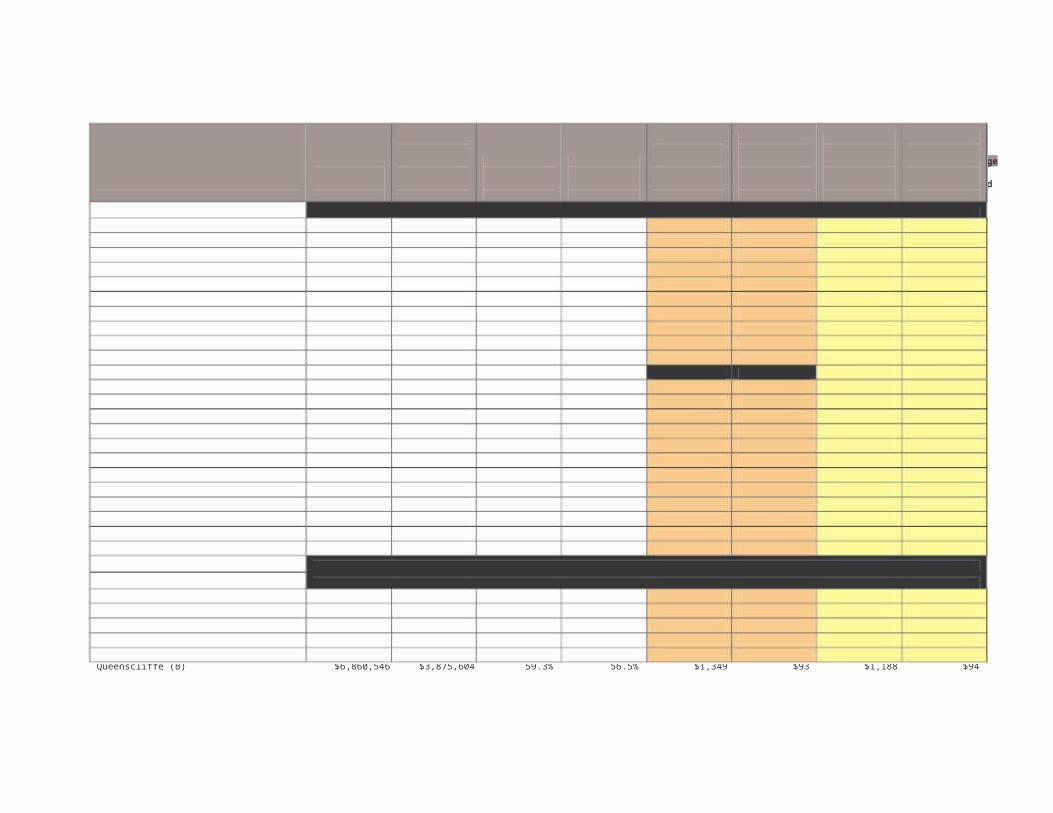
Nillumbik (S)Northern Grampians (S)Port Phillip (C)Pyrenees (S)Queenscliffe (B)
$50,435,241$21,464,500
$118,977,000$15,379,000
$6,860,546
$31,486,093$8,598,298
$67,169,140$4,694,752$3,875,604
56.1%37.3%56.0%33.7%59.3%
62.4%40.1%56.5%30.5%56.5%
$1,456$942
$1,156$843
$1,349
$133$32$81$51$93
$516$653$774$711
$1,188
$54$22$50$46$94
Budgeted totalrevenue for 2006-07
Gross Rates,MunicipalCharges andGarbage Charges2006-07
Rate Revenue asa proportion oftotal revenue 05-06
Rate Revenue asa proportion oftotal revenue 06-07
Per assessment -average rates,municipal chargeand garbagecharge 06-07
Change inaverage rates,municipal chargeand garbagecharge perassessment
Per head ofpopulation -average rates,municipal chargeand garbagecharge 06-07
Change inaverage rates,municipal chargeand garbagecharge per headof population
South Gippsland (S)Southern Grampians (S)Stonnington (C)Strathbogie (S)Surf Coast (S)
$34,861,000$25,278,813
$101,965,000$18,344,751$37,886,788
$20,546,460$10,082,773$56,001,161
$8,178,936$21,888,820
56.8%41.8%55.3%45.8%53.9%
58.9%39.9%54.9%44.6%57.8%
$1,155$991
$1,086$1,228$1,280
$85$54$71
$100$131
$744$597$619$835$907
$49$33$41$71$71
Swan Hill (RC)
Towong (S)
Yet to consider draft budget
Yet to consider draft budget
Wangaratta (RC)Warrnambool (C)Wellington (S)West Wimmera (S)Whitehorse (C)Whittlesea (C)Wodonga (RC)Wyndham (C)Yarra Ranges (S)Yarra (C)Yarriambiack (S)Total
$40,477,000$44,708,000$58,671,151$13,258,786
$115,858,000$142,015,665
$50,762,000$104,400,000$105,711,067
$97,467,922$13,768,000
$4,616,274,106
$15,746,561$17,272,422$28,216,413
$3,725,523$54,997,224$56,242,000$21,937,356$57,299,377$68,202,601$57,323,800
$6,355,575$2,515,964,190
39.6%35.2%49.5%24.4%47.3%37.8%42.3%52.1%64.6%55.7%38.6%52.7%
38.9%38.6%48.1%28.1%47.5%39.6%43.2%54.9%64.5%58.8%46.2%54.5%
$1,154$1,189
$961$829$859
$1,109$1,417$1,151$1,160$1,397
$951$1,135
$79$90$60$27$88$34$58$22$80$65$75$67
$583$540$620$777$368$413$616$463$474$782$782$527
$42$46-$6$25$39$12$28$15$35$42$79$32
Statewide Changes
Change in Budgeted Revenue 2005-06 to 2006-07
Change in Budgeted Rate, Municipal Charge and Garbage Charge Revenue per assessment 2006-07
Change in Budgeted Rate, Municipal Charge and Garbage Charge Revenue per head 2006-07
Change in Budgeted Rate, Municipal Charge and Garbage Charge Revenue
Change in Budgeted Total Revenue (inc government grants, rates, fees, fines and charges) 06-07
4.5%
6.3%
6.4%
$187,092,084
$199,470,677
i Note that these figures do not include $2,400,000 in rate revenue which will be collected from vacant properties . It is anticipated that the revenue will be rebated directly back to these ratepayers.

FACT SHEET
COUNCIL RESPONSIBILITIESRole of Local Government
Local government provides for the peace, order and good government of its municipal area,delivers services and facilities for the community and manages the resources of the district.
Local government must operate in accordance with the Local Government Act 1989 and hasresponsibility for implementing many diverse programs, policies and regulations set by Stateand Federal Government.
As councils have to respond to local community needs they also have powers to set their ownregulations and by-laws and provide a range of discretionary services.
Local laws developed by councils deal with important community safety, peace and order issuessuch as public health, management of council property, environment and amenity. Local lawsoften apply to noise, fire hazards, abandoned vehicles, parking permits, disabled parking,furniture on footpaths, graffiti, burning off, animals in public space and nuisance pets.
Services and Infrastructure
Each Victorian municipality is different – its community may be young or old, established or stilldeveloping, rural or urban, and its population may vary from fewer than 4,000 people to morethan 185,000.
Each council collects rates from residents and businesses in its municipality to help fund itslocal community infrastructure and service obligations.
Victorian councils are responsible for $37 billion worth of infrastructure including roads,bridges, town halls, recreation and leisure facilities, drains, libraries and parks. Theyalso provide over 100 services for local communities from the cradle to the grave. Everytime a person leaves their house they are using services provided by local councils.
From foot and bike paths, public street lighting, litter bins, school crossings, library books,internet services, sporting facilities, community meeting spaces and places, swimming pools,public playgrounds, bus shelters, parking spaces, community banking and public tips to doglitter disposals, removal of dumped rubbish, youth and family counselling, baby capsule hire,childcare programs, preschools & kindergartens, school holiday programs, head lice andimmunisations.
Many council services are also provided to residents in their homes including in-home childcare, parenting and baby health advice by maternal and child health nurses, multilingualtelephone services, recycling and hard waste collections, home maintenance, meals on wheels,gardening services and respite care.

COUNCILSERVICE
PROGRAM EXAMPLE
General publicservices
Emergency prevention & protection Community disaster/emergency plansAnimal management and control Animal shelters, pet registrationTourism Visitor information centres, marketing plansCommerce and industry Local industry networks, incentive programsCommunity information Community directory, websites/online services,
counselling & support groups
Health, Welfareand CommunityServices
Aged care programs Meals on wheels, home careMaternal & child health services Health checks, nutrition and parenting adviceFamily & children’s services School immunisations, childcare, playgroupsYouth services School holiday programs, aerosol art programDisability services Wheelchair access in the communityCultural development Festivals, public art, theatre productionsPublic libraries Interactive media services, free internet accessLeisure and recreation services Swimming pools, sports ovals,Housing Housing diversity through planning schemesPublic health services Food safety inspection, public toiletsEmployment Community jobs program, traineeshipsMigrant and indigenous services Language aides, multilingual phone lines
Planning Statutory planning Land use regulation, planning applicationassessment, zone and overlay controls
Strategic planning Neighbourhood character, heritage overlaysPlanning system reforms Pre-lodgement certificationBuilt form sustainability Energy efficient housing
Land UseManagement
Rural land use management Agricultural production, chemical useForestry/Timber Towns Forest regulation enforcement on private land,
supervising timber harvestingNative title/Indigenous culturalheritage
Recognition of traditional land owners
Environment Waste management Kerbside recycling, landfills, compost binsCatchment management Tree planting, protection of water catchmentsStormwater management Litter traps, flood and litter managementNative vegetation management Retention/conservation of native vegetation,
tree clearance permitsSalinity and water quality Reticulated sewerage, Waterwatch, drainageWater re-use programs Septic tanks, greywater on public parks/gardensWeed management Weed/pest control for roadside reserves,
provision of Weed OfficersSustainability Solar heating for buildings & pools, provision of
walking tracks & paths to reduce car useGreen purchasing programs Recycled asphalt, signage, mulch & compost
Infrastructure &Assets
Asset maintenance and development Town halls, historic buildings,Road construction and maintenance Roads, roundabouts, bridges, speed humpsFootpath constructions &maintenance
Nature strips, bike paths, street cleaning
Traffic and parking management Traffic and parking signsCommunity safety measures Public lighting, fire prevention plansPublic space maintenance Parks & gardens, street cleaning, cemeteriesLeisure facilities Recreation and community centresTelecommunications & broadbandinfrastructure
Wired Development collaborative venture

FACT SHEET
LOCAL GOVERNMENT COST PRESSURES
A range of cost pressures influence the decisions each council makes about its annualbudget and the rates it needs to collect.
1. COST SHIFTING
Cost shifting occurs when governments shift their responsibility for delivering programs andservice on to local government, with no or insufficient funding. This year all spheres ofgovernment signed an intergovernmental agreement establishing a framework for theallocation of responsibilities to local government, including appropriate funding levels. But theagreement only covers future transfers. Cost shifting pressures still faced by councils include:
Maternal and Child Health ServiceThe Maternal and Child Health service is delivered by local government, with sharedresponsibility between State and local government for its funding and policy development.The indexation model applied by the State Government to an agreed hourly cost for theservice has led to a disparity between the proportional contributions of the two spheres ofgovernment over the years, resulting in a funding shortfall of $2.4 million in 2005-06.
Kindergarten infrastructureKindergarten aims to develop children's social, emotional, intellectual, physical and languageabilities in the year before they start primary school. This State Government program oftenoperates out of facilities provided by local government including purpose built kindergartens,long day care centres and community halls. Many of these buildings are between 35 and 50years old and require constant maintenance. Minor capital grants provided by the StateGovernment are falling considerably short of the real costs of maintaining and upgradingfacilities to a standard acceptable for children to learn and flourish.
Childcare costsAs determined by the Australian Industrial Relations Commission, 44 Victorian councils arepaying wage increases of between 5 – 15% to deserving childcare workers but theCommonwealth has not recognised increased costs and the Childcare Benefit remainsunchanged. Councils and parents must fund these additional costs.
Immunisation programsLocal government has been instrumental in Victoria achieving the highest rate of infant/preschool immunisation in the nation, at the lowest cost. Established financial arrangementsexist between the Commonwealth and state governments to fund the delivery of immunisationservices. Despite this, a 2004 study demonstrated that Victorian councils contribute between 61– 83 per cent of the total cost of delivering immunisation services, costing councils andratepayers $3.8 million per year while saving the Commonwealth and Victorian Government$12.5 million per year. The Victorian Government increased funding by $1.3 million per year butFederal Government funding levels remain unchanged two years on.
Home and Community Care servicesCouncils are the largest single providers of home and community care (HACC) services inVictoria. Funding for HACC is the joint responsibility of the Commonwealth and stategovernments. Councils have had to subsidise the costs of providing services as funding hasfailed to keep pace with demand. The Auditor General estimated the cost of councilcontributions to HACC services to be $130 million for the three years from 2000 to 2003. Thisunsustainable trend continues to grow each year.

Public LibrariesThe MAV estimates local government contributed $282 million in funding for public librariesfrom 2000 to 2003, with council contributions growing each year. The State Government’scontribution during this same period was $77.8 million. Over several decades, StateGovernment funding for public libraries has slipped from approximately 50 per cent of the costof the service to less than 20 per cent in 2004-05.
2. AGEING INFRASTRUCTURE
Funding for maintenance of ageing infrastructure and assets is a major cost pressure forcouncils. The Auditor General identified a backlog of $1.5-$2.7 billion for maintenance ofageing infrastructure in 2002 and the MAV recently calculated an annual infrastructurespending shortfall of $310 million for Victorian councils over the next five years. In order toaddress the infrastructure renewal gap and prevent it from further increasing, councils needto significantly increase their capital expenditure. With a limited capacity to raise the revenueneeded to upgrade, replace and maintain ageing infrastructure, local government will need tolook at a range of options including rate rises, service rationalisation, and cost cutting in otherareas to fund vital renewal programs.
3. UNPAID RATES AND FINES
PERINLocal government’s share of infringements awaiting collection by the PERIN Court is in theorder of $140 million for the last five-year period. This amount includes an up-front fee of$39 paid by councils to lodge each fine and an $18 fee for each courtesy letter. These feesare paid regardless of whether the infringement is ever resolved. It is hoped that newenforcement measures that come into effect 1 July 2006 will improve recovery rates.
Unpaid RatesEach year a percentage of council rates remains unpaid, or is waived or deferred forextenuating circumstances. While all outstanding rates are collected over time, services andprograms continue to be delivered and the interim funding gap places additional pressure oncouncils’ financial capacity.
4. TAX COLLECTION OF BEHALF OF OTHER ORGANISATIONS
Fire Services Levy increasesTwenty-five metropolitan councils each contribute 12.5% of all funding for metropolitan fireservices in Victoria. Council contributions have increased 80% since 1999-2000. In 2006-07this amount is predicted to increase again by 4.5% or an additional $1.32 million. Suchsignificant increases in levies are a burden for ratepayers, who already contribute to the fireservices through their own insurance premiums.
5. FUNDING CUTS
Local Government Improvement Incentive ProgramLocal government stands to lose approximately $18 million in 2006-07 following theconclusion of the Local Government Improvement Incentive Program, which providedcouncils with a stream of revenue for compliance with National Competition Policy, assetmanagement and Best Value. Some councils with small populations are expected to facerate rises of approximately 4.5 per cent to recover this loss in revenue.

FACT SHEET
SETTING A COUNCIL BUDGET
Council Plan
Victoria’s 79 councils operate as separate entities with different local issues, costs andservice provision needs.
All councils identify the needs and issues to be dealt with in their municipality through theirCouncil Plan. This Plan is a statutory requirement which describes the strategic objectivesand strategies that will be implemented by a council for the following four years. It includes aStrategic Resources Plan, which sets out the financial, and human resources required toachieve the objectives contained in its Council Plan over four financial years.
A Council Plan must be prepared by 30 June each year. Each council issues a public noticeseeking community input into its draft plan for 14 days, before the plan is finalised andadopted by council for submission to the Minister.
Council Budget
Each council budget is different to reflect local community needs and priorities. However,there is a common legislated framework for setting a budget that each council must follow.
The budget process involves a council setting its priorities, identifying measures andallocating funds that will show how the key strategic objectives outlined in its Council Planare to be achieved in the coming year.
Through the budget process a council also specifies the annual maintenance needs of itsassets and infrastructure, as well as the community services and facilities it will provide in thenext financial year, and how much these will cost.
A council budget also estimates the revenue that will be collected from other sources such asState and Federal Government funding and from loans. By using these estimates a councilcan then determine the amount that needs to be collected in rates to meet its financialresponsibilities for the coming year.
This information is adopted as a draft budget, which is advertised and open to public commentfor a minimum of 14 days.
All councils are required to submit their budget to the Minister before 31 August each year.
Local government is the only level of government that provides an open and transparentbudget-setting process that seeks community discussion and input into the developmentof council spending initiatives and priorities for the coming year.

FACT SHEET
COUNCIL RATING BASES
Each Victorian council chooses one of three valuation bases for their municipality - CapitalImproved Value (CIV), Site Value (SV), or Net Annual Value (NAV).
The common process for calculating each of the three valuation bases is as follows:
Every two years council valuers have a statutory requirement to conduct a review ofproperty values based on market movements and recent sales trendsThe last revaluation is based on levels as at 1 January 2006Council valuers undertake a physical inspection of a sample of propertiesThe total value of property in a municipality is used as the base against which thatcouncil strikes its rate in the dollarThe rate in the dollar is multiplied by the CIV, SV or NAV value of the property todetermine the general rates due on each propertyThe Valuer General is responsible for reviewing the total valuation of eachmunicipality for accuracy before he certifies that the valuations are true and correct.
Capital Improved Value
CIV refers to the total market value of the land plus the improved value of theproperty including the house, other buildings and landscaping
Site Value
SV refers to the unimproved market value of the land
Net Annual Value
NAV is the annual rental a property would render, less the landlord’s outgoings (suchas insurance, land tax and maintenance costs) or 5% of the CIV for residentialproperties and farmsThe value is higher for commercial/industrial and investment properties.

FACT SHEET
COUNCIL RATESProperty Tax
Council rates are a form of property tax. Councils use property values as the basis forcalculating how much each property owner pays in rates.
Seventy-five per cent of the infrastructure and services provided by councils are fundedthrough the collection of rates, user fees, fines and charges.
In Victoria, council rates can comprise up to three components:
municipal chargeswaste management (garbage) chargesrate in the dollar.
Rate Process
A council begins its rate process each year by determining any municipal and garbage(service) charges that may be needed to recover part of its administrative cost and the costof providing waste collection and disposal services respectively.
Once these discretionary charges have been accounted for, a council determines the rate inthe dollar by dividing the balance of the required budget revenue by the total value of allrateable properties in the municipality.
The rate in the dollar is then multiplied by the value of a property (using one of threevaluation bases) to establish the amount to be paid by each property owner. This amount isknown as the general rates.
General rates are added to any municipal and garbage charges set by a council to determinethe total rates payable on a property.
Example: Calculating General Rates
If the total value of rateable properties within a municipality is $10,000,000,000 and councilneeds to collect $40,000,000 in rates, the rate in the dollar would be 0.004 (40,000,00010,000,000,000).
The rates payable on Property A, valued at $200,000, would be $800 ($200,000 x 0.004).
Contrary to popular belief, rising property values have no impact on council revenuecollection. Council budgets are pre-determined to meet expenditure requirements.
Rising property values usually result in the adjustment, by council, of a lower rate inthe dollar to offset the overall increase in property values.

FACT SHEET
PROPERTY VALUATIONS 2006Biennial Property Valuations
Victoria has more than 2.5 million properties. Local government uses property values toapportion the rates payable for each individual property.
As property values change, a council must periodically reassess the valuation of allproperties within its municipality. A valuation determines the market value of a property, at aspecific date and in accordance with relevant legislation and legal precedent.
All Victorian properties have recently undergone valuations at the prescribed date of 1January 2006. To work out how much each property is worth council valuers’ analyse latestproperty sales and rental data, as well as consider other factors such as use of the land,shape, size, location, house value and other site improvements.
Each council will use this valuation data to apportion the amount of rates to be paid by eachproperty owner in the 2006-07 and 2007-08 financial years.
Up-to-date valuations are critical for ensuring property owners pay a fair and equitable shareof rates. Two-yearly revaluations assist in delivering rating equity by redistributing the rateburden within a municipality according to property price movements.
No Financial Windfall for councils
Councils use property valuations to determine how much each ratepayer will pay in ratesCouncils do NOT generate extra revenue as a result of property revaluations.
Increased property values do not increase the total amount of money a councilcollects in rates - it redistributes the amount of rates paid between individualproperties. Some ratepayers will pay more and some will pay less, depending on thenew value of their property relative to other properties in their municipality. A councilbudget determines how much a council collects in rates – not property valuations.
Role of Valuer-General Victoria
While the property valuation and rating process is the responsibility of local government, theValuer-General Victoria (VGV) independently oversees this process to ensure statutoryrequirements and best practice standards have been met.
Only qualified valuers - professionals holding recognised tertiary qualifications and with therequired practical experience - can perform municipal valuations.
Once the VGV certifies that a council’s general valuation meets required standards, theMinister may declare that the valuation is suitable to be adopted and used by council.
Ratepayer Rights
Ratepayers have rights under the Valuation of Land Act 1960 to object to the valuation oftheir property if they are dissatisfied with the determination provided by the council valuer.

Public Sector RevenueCommonwealth Government 70%State Government 27%Local Government 3%
FACT SHEET
FUNDING OF LOCAL GOVERNMENT
Local Government Funding Sources
There are several sources of funding for local government in Australia:
Rates on property
Fees, fines and charges (eg. swimming pool entry fees, waste depotfees, planning permit fees, parking fees and fines)
Borrowings (eg. to pay for large infrastructure projects), asset sales,donations, contributions, reimbursements and interest earned
Specific purpose grants from State and Commonwealth Government, forfunding specific projects or programs
General purpose grants from State and Commonwealth Government thatare not tied to a specific purpose.
* State and Commonwealth Government grants are typically derived from a sharing oftaxation revenue.
The total funding for local government in Victoria in 2004-05 from all sources was $4.35billion. This can be broken down as follows:
$3.17 billion or 72.9% in rates, fees, fines and charges$579 million or 13.3% in specific purpose grants$365 million or 8.4% in untied revenue from general purpose grants$235 million or 5.4% in other sources, for example interest earned
In 2004-05 local government in Australia collected only three cents of every dollarraised through taxes. It is the only level of government that issues a bill seekingpayment for the revenue it collects.