2006 annual report - investor relationsir.voegol.com.br/arquivos/gol_ar_2006 final.pdf · gol’s...
TRANSCRIPT

Rua Tamoios, 246 Jd. AeroportoCEP 04630-000 São Paulo SP BrasilFone: 55. 11. 5033 4200www.voegol.com.br
2006 ANNuAl REPORT
gol’s annual report�
GOl’S 2006 ANNuAl REPORTWE HAVE INTERCONNECTED A COuNTRY;NOW WE ARE INTERCONNECTING A CONTINENT 2006 HIGHlIGHTS
MESSAGE TO SHAREHOlDERS
CORPORATE PROFIlE
SECTOR
OPERATIONS
STRATEGY AND PERSPECTIVES
HuMAN RESOuRCES
CORPORATE GOVERNANCE
CAPITAl MARKETS
RISK MANAGEMENT
SOCIAl RESPONSIBIlITY
FINANCIAl PERFORMANCE
AWARDS
BOARD OF DIRECTORS, EXECuTIVE OFFICERS AND COMMITTEES
CORPORATE INFORMATION
FINANCIAl STATEMENTS
4
6
8
10
12
18
20
22
24
26
27
28
38
39
40
42
gol’s annual report �
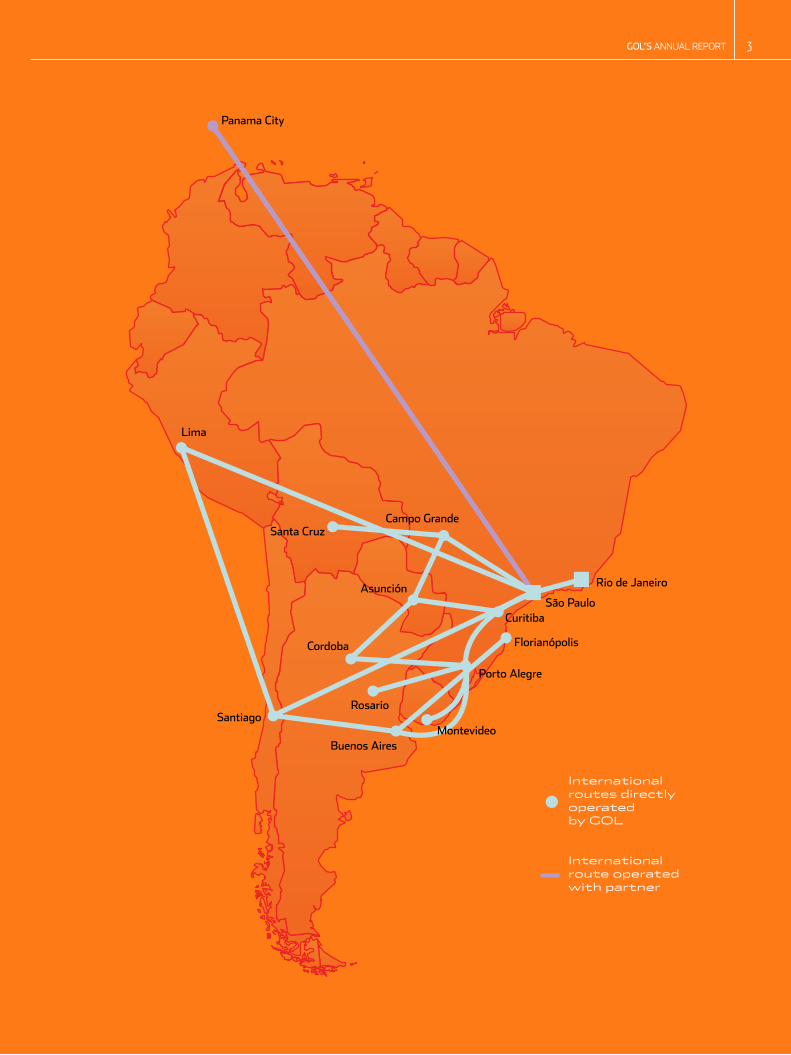
Internationalroutes directlyoperated by GOl
International route operated with partner
Panama City
Rio de Janeiro
São PauloCuritiba
Florianópolis
Porto Alegre
MontevideoBuenos Aires
Rosario
Cordoba
Asunción
Campo GrandeSanta Cruz
Lima
Santiago
GOl’S VISION
2006 HIGHlIGHTS
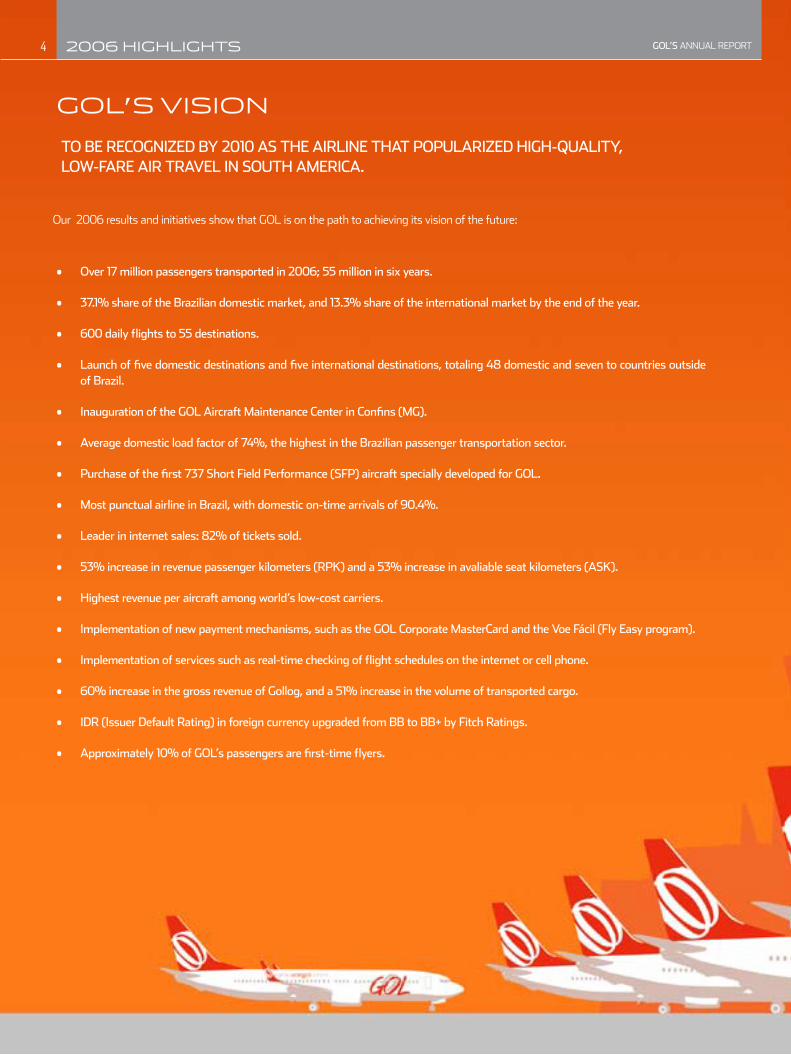
To be recognized by 2010 as The airline ThaT popularized high-qualiTy, low-fare air Travel in souTh america.
over 17 million passengers transported in 2006; 55 million in six years.
37.1% share of the brazilian domestic market, and 13.3% share of the international market by the end of the year.
600 daily flights to 55 destinations.
Launch of five domestic destinations and five international destinations, totaling 48 domestic and seven to countries outside of brazil.
Inauguration of the GOL Aircraft Maintenance Center in Confins (MG).
Average domestic load factor of 74%, the highest in the Brazilian passenger transportation sector.
Purchase of the first 737 Short Field Performance (SFP) aircraft specially developed for GOL.
Most punctual airline in Brazil, with domestic on-time arrivals of 90.4%.
Leader in internet sales: 82% of tickets sold.
53% increase in revenue passenger kilometers (RPK) and a 53% increase in avaliable seat kilometers (ASK).
highest revenue per aircraft among world’s low-cost carriers.
Implementation of new payment mechanisms, such as the GOL Corporate MasterCard and the Voe Fácil (Fly Easy program).
Implementation of services such as real-time checking of flight schedules on the internet or cell phone.
60% increase in the gross revenue of gollog, and a 51% increase in the volume of transported cargo.
IDR (Issuer Default Rating) in foreign currency upgraded from BB to BB+ by Fitch Ratings.
Approximately 10% of GOL’s passengers are first-time flyers.
•
•
•
•
•
•
•
•
•
•
•
•
•
•
•
•
our 2006 results and initiatives show that Gol is on the path to achieving its vision of the future:
gol’s annual report4

gol’s annual report 5
gol’s annual report�
In 2006, we made great progress towards achieving our objective of popularizing air transportation in South america, and we
proved again that our virtuous circle (low costs, low fares, high load factors, state-of-the-art technology, and exemplary customer
service) is very active, always with the goal of offering high-quality services while safely transporting our passengers.
Despite challenges faced during the year, we managed to remain one of the most efficient airlines in the world. It is thanks to
the hard work and dedication of our employees that we were able to minimize the impact of the crisis that has affected the Brazilian
airline industry. Our standardized fleet, streamlined and agile operations and no overbooking policy helped us mitigate flight delays and
cancellations. We are ready to expand our low cost, low fare model in 2007.
throughout the year, we increased our total operating capacity by 53%, and our capacity on international South-american
routes increased by 141%. We started operations to Chile, paraguay and uruguay, and started service to two additional destinations in
Argentina (Cordoba and Rosario). In the domestic market, we commenced service to five new destinations: Chapecó (SC), Imperatriz
(MA), Juazeiro do Norte (CE), Ilhéus (BA) and Santarém (PA), and we increased the frequencies to expanding markets by 31%. We
now fly to 55 destinations, of which seven are international. Our efforts enabled GOL to reach 37.1% and 13.3% share in the expanding
domestic and international markets, respectively by the end of 2006, with an average load factor of 73.1% for the year.
The increase in our fleet enabled the expansion of the Company’s operations. In
2006, we received 23 aircraft, of which 10 were Short Field performance aircraft, developed
for landing and take off on short runways, from the purchase agreement with Boeing,
which provides purchase of up to 121 aircraft (87 firm orders and 34 options). Our fleet
totals 65 aircraft, which enabled us to add 180 new frequencies to our network and end
the year with 600 flights per day. The number of aircraft will increase to 80 by the end of
2007. In September, we opened our own aircraft Maintenance Center at the International
Airport of Confins, in Belo Horizonte (MG), which offers state-of-the-art technology for
the maintenance of GOL’s aircraft and is estimated to generate cost reductions of over
r$ 4.5 million per year.
We are always investing to guarantee our planned and sustainable growth. With the exemplary effort and dedication of our “team
of eagles” of almost nine thousand employees, we achieved the best average punctuality rate among the Brazilian airline companies
during the year. our continuous progress is possible because of our ability to innovate in the way we provide people with access to air
transportation. We continue to focus on strict cost controls, with the aim of providing our clients with the lowest fares possible.
Our history is marked by a succession of performance records in the Brazilian airline industry. The data proves that the “GOL
Effect” has changed the profile of the Brazilian airline industry and is now starting to have an impact on the South American airline
industry. The average fare for domestic flights in Brazil was reduced by approximately 40% (prices indexed by inflation), comparing
2000 to 2006; the average load factors for domestic flights have never been so high (above 71%). The creation of the Agência Nacional
de aviação Civil (anaC) was also an important step in the modernization of this industry.
Over 55 million passengers have already flown GOL, of which 5 million were flying for the first time in their lives.
Unfortunately, on September 29, an accident occurred on GOL’s flight 1907. The aircraft, one of the new Boeing 737-800 NG,
collided in mid-air with an embraer legacy aircraft owned by uS air-taxi company excelair Service. Mourning, we prioritized the
support to the victims’ families, as we kept on going with our basic functions, allowing millions of people to travel safely on our aircraft.
MESSAGE TO SHAREHOlDERS
In 2006 we made great progress towards achieving our objective of popularizing air transportation in South America, opening five new destinations in the region
gol’s annual report �
Furthermore, a troublesome period affected the airline industry during the last quarter of the year. our employees, partners, customers
and friends have been with us, and we are deeply thankful to all of them. We are proud that the “team of eagles” culture is deeply rooted
in our corporate profile.
For the next five years, Boeing estimates an annual growth of 7.4% in air traffic for South America, the second largest regional
growth in the world after China. Thus, in 2007, we expect a positive industry outlook, with encouraging demand prospects. And we are
prepared to benefit from it. GOL will put into practice the benefits of the virtuous cycle and reiterate its commitment to low costs and
low fares, with the vision of popularizing air transportation in South america.
this annual report is a summary of 2006 activity. additional information is available on our website www.voegol.com.br.
Constantino de oliveira JuniorPRESIDENT AND CEO

gol’s annual report�
2002 2003 2004 2005 2006
THE GOL EFFECT
26,8
3,24,8
6,3
9,7
13,525,2
28,2
33,7
39,8Brazilian Industry (billions of RPKs)
GOL (millions of RPKs)
+ 43%
+ 10%
THE FASTEST GROWING AIRlINE IN SOuTH AMERICA
In only six years of existence, GOL Linhas Aéreas Inteligentes saw its fleet expand from 6 to 65 aircraft, thus establishing itself as the fastest
growing low-cost/low fare airline company in the world.
GOL’s business model is based on procedures, systems and controls that privilege service quality, technology and safety, fleet standardization,
team motivation and productivity, while keeping an unwavering focus on cost reductions, allowing the offering of more seats at accessible prices – the
virtuous circle. In this way, GOL was able to democratize the skies of Brazil, a country which, until GOL’s entrance in the market, lacked low-cost air
transportation.
This strategy is based on asset utilization, with aircraft flying 14 block hours per day on average; innovative payment mechanisms; and night
flights. These objectives were designed to attract customers who previously would not consider traveling by air because of price, as well as to maximize
the use of the fleet. By offering low fares, our night flights became popular, with average load factors of over 90%.
This business model which the Company originally implemented in Brazil soon caused a shift in the airline industry. With accessible fares now
available, many travelers migrated from road to air transportation, significantly increasing the number of air passengers. This is the “GOL effect”,
noticeable in all the cities to which GOL operates regular flights.
The Company is expanding the “GOL Effect” throughout South America. With this vision in mind, GOL had the largest fleet expansion to
date in 2006, offering more low fare seats and, in so doing, ensuring a continuous growth in demand. even with this rapid growth, in 2006, on-time
arrivals were the best in the country, averaging 90.4% in the domestic market and 89.9% in the international market, a direct result of outstanding
performance, highly-efficient operations and superior customer service.
CORPORATE PROFIlE
gol’s annual report �
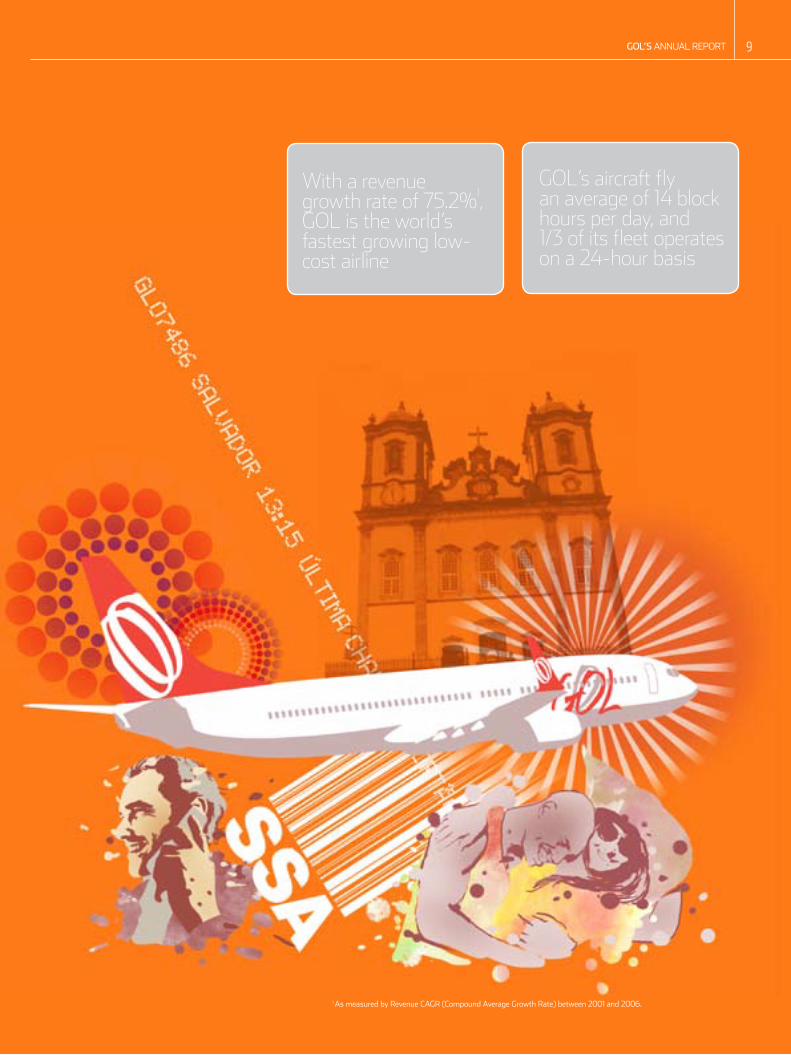
1 as measured by revenue CaGr (Compound average Growth rate) between 2001 and 2006.
With a revenue growth rate of 75.2%
1,
GOL is the world’s fastest growing low-cost airline
GOL’s aircraft fly an average of 14 block hours per day, and 1/3 of its fleet operates on a 24-hour basis

gol’s annual report10
In Brazil, the public that regularly uses air transportation has historically been mostly comprised of the higher-income economic bracket, in which
the business sector is still prevalent – approximately 60% of GOL’s passengers traveled on business in 2006.
This industry dynamic is favorable to the low-cost, low-fare model. The possibilities for expansion in Brazil are promising, with a potential
audience of approximately 140 million passengers, the total number of interstate bus passengers in 2005. In comparison, passengers who traveled by
air in the same period totaled 38.7 million on domestic flights and 5.8 million on international flights.
Also demonstrating the sector’s potential, historically the growth in the passenger transportation market in the Country has always been higher
than that of the Gross Domestic Product (GDP). Between 1998 and 2005, the airline industry grew at a compounded annual growth rate of 11.6%
(measured in RPKs), as compared to a 2.3% growth in GDP (adjusted for inflation).
In 2006, domestic air transportation grew by 12.3% (measured in RPKs) –a record 39.8 billion revenue passenger kilometer, compared to 35.4
billion in 2005, according to the ANAC. Brazil’s share of international flights was 17.8 billion revenue passengers kilometer.
On a comparative basis, the world air transportation growth totaled 5.9%, according to IATA – International Air Transportation Association.
In September 2005, the law determining the creation of ANAC was approved, furthering the industry’s modernization. The ANAC played
an important role overcoming obstacles and mitigating the crisis late in 2006, maintaining the Brazilian national aviation system as one of the
leaders in the world.
In response to the operational challenges faced by the sector in the latter part of the year, the Federal Government has announced investments
in infrastructure, equipment and training courses; as well as the addition of air traffic controllers late in the year and during 2007.
The Empresa Brasileira de Infra-estrutura Aeroportuária (Infraero), a state-controlled corporation reporting to the High Command of Aeronautics,
announced in January 2007 that it intends to invest approximately R$1.8 billion in the Brazilian airport system through 2010. The projects underway
include an investment for the modernization of the passenger terminal, the improvement of the main and auxiliary runways and the construction of
a new control tower at Congonhas airport in São paulo, the implementation of new runway extensions and construction of a new logistics center at
Salgado Filho airport, in porto alegre, and the renovation of the runway systems and Cargo terminal of tom Jobim International airport, in rio de
Janeiro.
Brazil is ranked “Level 1” in terms of flight safety worldwide along with the United States, Canada, France, the United Kingdom, Germany,
Australia, Spain, Italy and Japan. Brazilian airplanes fly with the same safety standards as US companies, in compliance with the ICAO – International
Civil aviation organization regulations.
SECTOR
REGulATORY ENVIRONMENT

gol’s annual report 11
Approximately 43.5 million passengers were transported by air in 2006

gol’s annual report1�
NEW AIRCRAFT
OPERATIONS
In line with GOL´s single-fleet strategy, GOL added 23 Boeing 737 aircraft in 2006, of which 13 were Boeing 737-800, a larger aircraft with 30%
more seat capacity per flight. Ten of these 13 800s are new737-800 Short Field Performance (SFP) aircraft, especially adapted by Boeing for GOL to
be used in shorter runways such as that of Santos Dumont airport, in rio de Janeiro.
In October 2006, the Company expanded its purchase agreement with Boeing from 101 to 121 737-800 (SFP) New Generation (NG) aircraft, to
be delivered by 2012 (87 firm orders and 34 options). Fourteen new 737-800NG aircraft from this order and one operating leased aircraft are expected
to be integrated into the fleet in 2007, totaling 80 aircraft by the end of the year.
of this new group of aircraft, 34 will be equipped with winglet systems¹, adding to the 19 that the Company currently operates. this technology
allows for the annual saving of over 650 thousand liters of fuel per aircraft, a reduction in maintenance costs and meaningful improvement in
performance during landings and take offs in short runways.
The renewed and simplified fleet is expected to produce an improved cost/benefit ratio as it allows for cost reductions in maintenance and
training courses, facilitated inventory management, and promotes better
aircraft utilization rates - the best in Brazil and one of the best in the
world.
In addition to consuming approximately 30% less fuel per
available seat-kilometer and transporting more passengers, these new
additions contribute to improve another of GOL’s principles: that of an
airline with the youngest fleet in South America, with an average age of 7.8 years.
¹ The winglet is an extension in the tip of the aircraft’s wing, projected to reduce the resistance to wind, thus allowing for fuel consumption reduction, and quieter and less pollutant flights.
24
30
12
14
6577
107 10
86
5
30
10
12
13
28
3349
21
117 7
11
14
2065
8086 88 92 94
101
141 - seat B 300s
177 - seat B 800 NG
144 - seat B 700 NG
187 - seat B 800 NG
2006 2007 2008 2009 2010 2011 2012
GOL FLEET PLAN
GOL’s aircraft utilization rate of 14.2 block hours per day is among the highest in the world

gol’s annual report 1�
BRAzIl’S lEADING E-COMMERCE COMPANY
GOL’s primary distribution system is the Internet, the quickest, easiest and most cost-effective way of selling. The widespread use of the internet
allows for the Company to save an average of 65% per ticket in comparison with other sales distribution systems, in addition to providing an easy, user-
friendly sales process, eliminating the physical sale point, and consequently reducing costs for the company.
These cost reductions and streamlined process are passed on to the consumer, who ultimately benefits from the convenience of purchasing tickets
without business hour constraints, not to mention the choice of three languages: portuguese, Spanish and english.
In 2006, GOL sold R$ 3.7 billion in air tickets through its website www.voegol.com.br, which represented 82% of its gross sales, totaling R$ 4.6
billion. Its call center and airport counters accounted for 15% of the sold tickets and 3% were distributed through GDS (Global Distribution System).
throughout the year, the website received an average of 1.4 million unique visitors per month, a figure 67% higher than that of 2005.
The quick online service is also available for check-in, flight schedule changes and real time flight status. GOL’s customer can choose to benefit from
these services on the website, without having to wait in line. Both ticket purchases and check-in can also be made through mobile phone.
Sales through the internet allow GOL to save an average of 65% per ticket as compared to other distribution systems
gol’s annual report14
In order to stimulate demand, GOL invests in a tripod strategy based on low fares – targeted marketing - innovative payment mechanisms. The
Company also makes more than 12 payment choices available for online purchases, including credit cards, debit cards and purchase in installments.
The following are some of the programs that aim to make ticket purchase and payment easier:
gol fly easy program: A card that allows for ticket purchase in up to 36 installments, without fares, especially
designed to make the purchase of our tickets easier for customers belonging to the broader income classes. Card users can buy
tickets over the Internet without a credit card. On December 31, 2006, over 650,000 customers had registered for our Fly Easy
program, 70% of whom were flying for the first time.
gol corporate card mastercard: aimed at micro, small and medium-sized companies, this is a credit card that
turns 1.9% of the invoices into credits for the purchase of future GOL tickets, allowing for expense reduction on business trips.
the credits can be converted into reais and can be used once the balance reaches r$ 50 in the next invoice, within a period of
12 months. among the offered services are travel accident Insurance and compensation for luggage loss. at the site www.
cartaogolnegocios.com.br the customer can simulate the amount of credits that a company would have during a month, based
on expenditures. The target market represents 98% of Brazil’s companies.
promotions: GOL has recurring promotions on its website. The campaigns offer tickets at very low fares during some
holiday seasons and to some customer segments such as kids and elderly people. These campaigns increase the number of
visitors to GOL’s website.
Ticket auctions: GOL promotes several ticket auctions through the internet for people who are traveling in groups.
People interested can make a bid through GOL’s/Milan Express auction portal and then wait until the tickets are sold. That
allows customers to buy tickets for lower prices. The auctions occur weekly, on Tuesdays, between 0h00 and 22h00.
In addition to uncomplicating the ticket purchase process, GOL strives to provide its passengers with efficient and differentiated support service
by offering efficient and qualitative service. One of the novelties introduced by the Company was the implementation of a communication channel
aimed at hearing impaired persons, who can call the Customer Support Center by means of a special telephone system called tS. all persons with
Special Needs are provided with special attention and guidance by flight attendants in the boarding and unboarding processes.
SPECIAl CuSTOMER SERVICE
Aimed at small and medium-sized companies, the GOL Corporate Card turns expenses into GOL tickets
STIMulATING DEMAND
OPERATIONS

gol’s annual report 15
CONSTANT COST REDuCTIONS
GOL’s objective is to remain one of the airlines with the lowest costs in the world. With that purpose in mind, the Company works relentlessly
to continually reduce expenses and, consequently, increase profitability. The purchase of new 737-800 SFP NG aircraft in 2006 is an example of how
the Company invests to meet this objective. Standardized, new, more modern and fuel-efficient aircraft translate into less expenditure with aircraft
servicing and fuel, and a larger number of available seats.
The new fleet also contributes to another of GOL’s strategies: to maximize aircraft
utilization. Its route management – designed to offer maximum connectivity and flexibility
at each stop over, provides the passengers with a larger number of choices – including stops
in major cities to where most passengers travel on business. after meeting demand on the
busiest routes, the aircraft connects several other destinations. This system benefits a varied
spectrum of travelers and a larger number of locations, at the same time, maximizing the
use of the aircraft.
GOL is continuously working to improve turnaround times at airports and for
efficient use of fuel – pilots are trained in fuel control techniques, and fueling procedures take place in locations where fuel prices are more
advantageous. owing to these systems and to its fuel hedge program, the Company reduced its fuel expenditures per aSK by 11% during the
year, even in an increasing oil price environment.
Standardized, new, more modern and fuel-efficient aircraft translats into less expenditure in aircraft servicing and fuel, and a larger number of available seats

gol’s annual report1�
NEW MAINTENANCE CENTER
A key component of the on-going cost-reduction plan is the modern Aircraft Maintenance facility, which started operating on September
5, 2006. the Center will provide Gol with scheduling autonomy and reduce expenditures relating to outsourced aircraft repairs. Cost reductions
are estimated to amount to r$ 4.5 million per year, providing the possibility to generate additional revenue in the future by providing services
to other airlines.
total investment amounted to approximately r$ 30.5 million. the Maintenance Center uses state-of-the-art technology and occupies an area of
17,300 m² next to the Tancredo Neves International Airport, in Confins, a metropolitan region of Belo Horizonte, the capital city of the state of Minas
Gerais.
the two hangars have the capacity to repair four aircraft at the same time, and are
programmed to operate 24 hours a day. The facility is one of the first to fully implement phased
maintenance technology, a system that allows for pre-emptive daily maintenance, by scheduling
maintenance servicing during the downtime of the aircraft, which helps to maximize utilization
without sacrificing profitability, reducing the Company’s costs.
The Facility´s construction in Confins produced a positive social impact, as it generated
350 new jobs (direct and indirect). The facility also reflects GOL’s concern for the environment.
among other initiatives, the garbage collection and sewage systems are fully compliant with the regulations established by the State Foundation
for the environment.
The Maintenance Center has the capacity to perform maintenance on four aircraft simultaneously
OPERATIONS
gol’s annual report 1�
CARGO TRANSPORTATION
Gollog, GOL’s cargo transportation service, is integrated into the platform offered to passengers. Customers can fill out forms, access documents
and track down cargo through the Internet. In 2006, GOL launched another user-friendly product: the first prepaid cargo service in the country, which
allows for the shipment of packages up to one kilo, to any domestic destination at a single tariff. The purpose is to simplify in order to lower prices.
With two privately-owned units - in Congonhas, São paulo, and at the airport of Cumbica, in Guarulhos - Gollog relies on 42 franchised units.
The quick service is supported by the Company’s 600 daily flights, as the cargo travel inside the aircraft’s cargo compartment. Plans for expansion to
South america are extending to cargo transportation, as well.
In 2006, Gollog recorded an increase of 51% in transported volume – from 27,300 tons in 2005 to 41,200 tons – and an increase of 60% in gross
revenue, which jumped from r$ 78.6 million to r$ 126.1 million during the same period.
The safety of its passengers and employees has always been a priority for GOL. All pilots have more than 10,000 hours of flight and, together
with the co-pilots, are given training courses with flight simulation and seminars on the latest developments in the industry. The Maintenance Center will
also be used as a new center for training courses for everyone involved in the Company’s operations, from maintenance personnel to flight attendants
and technicians.
The Company has implemented the Quality Control System for Flight Operations, which maximizes accident prevention by analyzing the flight’s
data recording system, and all of its aircraft are equipped with a program that monitors and records the engine’s performance and conditions.
GOL is a member of the Flight Safety Foundation – an entity that fosters the exchange of information on flight safety.
SAFETY
In 2006, GOL launched the Brazil’s first prepaid cargo service for the shipment of parcels of up to one kilo to any domestic destination at a single tariff

gol’s annual report1� STRATEGY AND PERSPECTIVES
EXPANSION IN SOuTH AMERICA
GOL’s strategy is to expand the low cost and low fare air transportation platform to other South American countries, offering competitive prices
in comparison to conventional airlines and road transportation.
In order to fulfill this vision, GOL is applying the same principles that have worked so well in Brazil: low operating costs, intelligent aircraft
utilization, night flights, implementation of new flights in busy routes and, at the same time, opening of routes to underserved locations with a strong
demand potential. The idea is to implement the same route planning techniques, which allows for profitable operations in multiple cities, and keep the
same high standards of aircraft utilization.
Throughout 2006, five new destinations were opened in South America: Montevideo (Uruguay), Asunción (Paraguay), Cordoba and Rosario
(Argentina), and Santiago (Chile). Cities already being serviced by GOL were benefited from with additional flights, such as Buenos Aires, the capital
of Argentina – the first destination of the Company abroad. On December 31, 2006, GOL operated seven international destinations, including Santa
Cruz de la Sierra (Bolivia).
one of the novelties during the year on the international front was the startup of routes that interconnect South-american cities without
connecting in Brazil, connecting Asunción, Buenos Aires and Santiago. In 2007, the Company included Lima (Peru) among its international destinations,
with a flight that connects the cities of Santiago and Buenos Aires. The Peruvian capital city will also have flights to the airports of Guarulhos, São Paulo
and Galeão, Rio de Janeiro. Venezuela and Colombia are also going to be part of this network in 2008.
This integration generates opportunities to increase traffic throughout the network, which increases load factors and stimulates demand for the
Company’s services. This is fundamental to extending the network over more countries in the region and establishing GOL as the only low-fare airline
in South america.
Brazil plays a significant role in this strategy. The South-American travelers that elect GOL have the advantage of choosing among the 48
destinations within the Country, in an increasingly growing domestic network: in 2006 alone, five new Brazilian destinations were added to the
network: Chapecó (SC), Juazeiro do Norte (CE), Ilhéus (BA), Santarém (PA) and Imperatriz (MA).
China
PROJECTED ANNUAL PASSENGERS GROWTH PER REGION
8.8%
Latin America
6.9%
Asia - Pacific
6.4%
North América
3.6%
Europe
3.4%
Source: Morgan Stanley Research
gol’s annual report 1�
GOL started integrating South American countries in 2006 by taking a relevant step to meet its aim to establish itself as the only low-cost airline company operating in the region
gol’s annual report�0 HuMAN RESOuRCES
every part of the Gol culture is rooted in a low cost, customer friendly policy. the Company
relies on a dedicated and motivated team, committed to maintaining the high quality service offered
to passengers.
Having a highly motivated team is a privilege of companies that believe in the potential and
decision-making skills of their employees. GOL provides employees with Career Plans and Profit
Participation, rewarding employees based on the Company’s global performance and each individual
performance. The Company also has in place a stock options plan for key employees – a proven
competitive advantage.
The Company also invests in training courses as a manner to foster its employees’ expertise and professional development. In addition to
technical training courses aimed at pilots, co-pilots and flight attendants, it provides them with opportunities for career development through Business
Management programs, in partnership with Fundação Getúlio Vargas [Getúlio Vargas Foundation], as well as e-learning tools and online training courses.
In 2006, 4.2% of GOL’s net revenue was invested in programs related to employee health, work safety, training, social-security contributions,
food and transportation, in addition to participation in profits and results.
the Company has always been concerned about providing all of its employees with equal opportunities, by respecting ethnic, cultural and racial
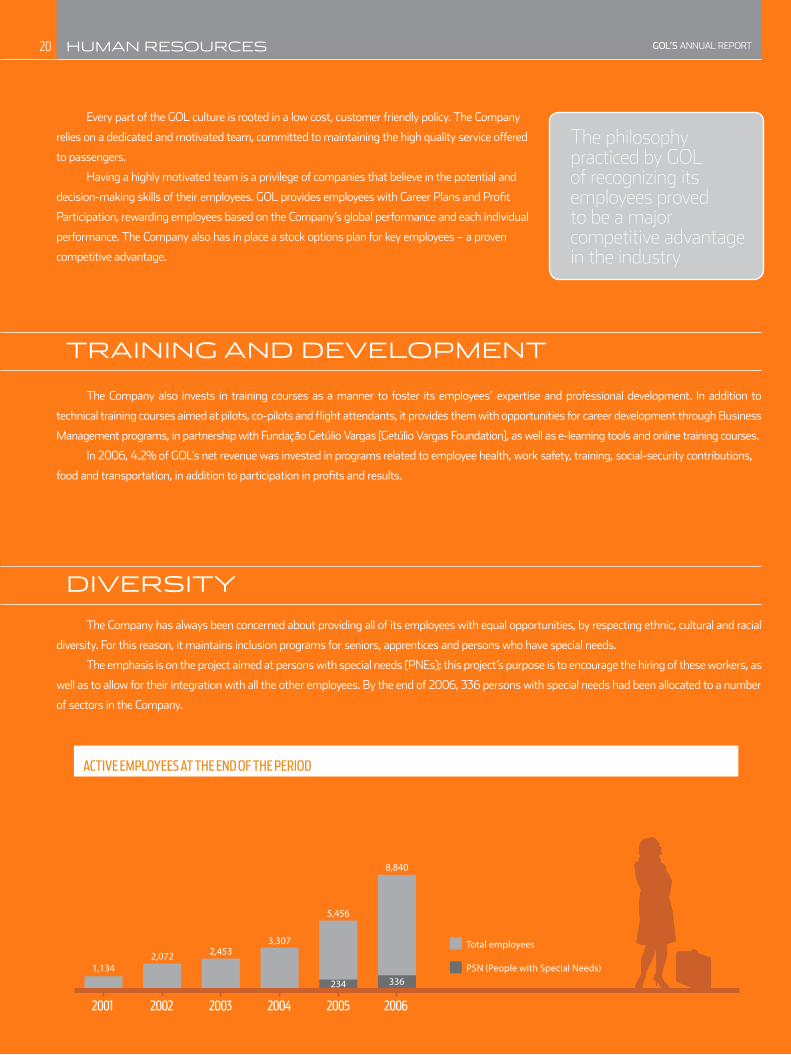
diversity. For this reason, it maintains inclusion programs for seniors, apprentices and persons who have special needs.
The emphasis is on the project aimed at persons with special needs (PNEs); this project’s purpose is to encourage the hiring of these workers, as
well as to allow for their integration with all the other employees. By the end of 2006, 336 persons with special needs had been allocated to a number
of sectors in the Company.
TRAINING AND DEVElOPMENT
DIVERSITY
The philosophy practiced by GOL of recognizing its employees proved to be a major competitive advantage in the industry
234 3361,134
2,072 2,4533,307
5,456
8,840
PSN (People with Special Needs)
Total employees
2001 2002 2003 2004 2005 2006
ACTIVE EMPLOYEES AT THE END OF THE PERIOD
gol’s annual report �1
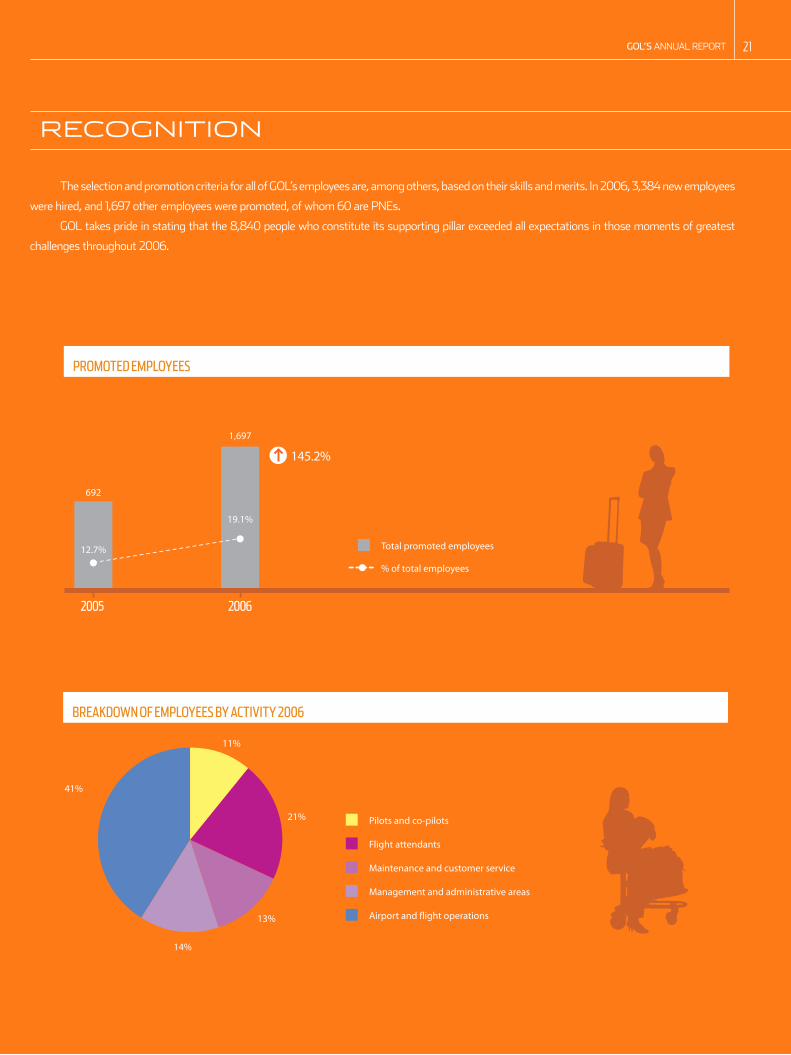
The selection and promotion criteria for all of GOL’s employees are, among others, based on their skills and merits. In 2006, 3,384 new employees
were hired, and 1,697 other employees were promoted, of whom 60 are pnes.
GOL takes pride in stating that the 8,840 people who constitute its supporting pillar exceeded all expectations in those moments of greatest
challenges throughout 2006.
RECOGNITION
692
12.7%
1,697
19.1%
2005 2006
PROMOTED EMPLOYEES
Total promoted employees
% of total employees
145.2%
BREAKDOWN OF EMPLOYEES BY ACTIVITY 2006
Airport and �ight operations
Management and administrative areas
Maintenance and customer service
Flight attendants
Pilots and co-pilots
11%
21%
13%
14%
41%

gol’s annual report�� CORPORATE GOVERNANCE
GOL is managed by a Board of Directors and a Board of Executive Officers. The Board of Directors, which is responsible for setting forth the
Company’s strategic general policies, is comprised of eight members and three independent members, according to the criteria of the NYSE and
Bovespa. The Board Executive Officers, responsible for the daily management of the businesses, is comprised of five members.
To support the Board, the Company also counts on the Audit Committee, Corporate Governance and Nomination Committee, Financial Policy
Committee, Risk Policies Committee, and People Management Committee, whose tasks involve supervising activities of the Board of Directors and
Board of Executive Officers, assisting and approving policies and practices, ensuring a qualified and independent management.
Gol is committed to maintaining transparency in its businesses and to following best practices in corporate governance. the Company complies
with Bovespa’s Corporate Governance Level 2 requirements and it was one of the first non-American companies to comply with Sarbanes-Oxley Act
Section 404, which determines an annual evaluation of internal controls and procedures for issuance of financial reports, requiring that independent
auditors certify the administration evaluation in terms of its efficiency.
Attributions of the Board of Directors, Board of Executive Officers and Committees of GOL, as well as the qualifications of their members and the description of its Corporate Governance practices are available at the investor relations website: www.voegol.com.br/ir.
NEW INVESTOR RElATIONS SITE
In June 2006, GOL released its new investor relations’ site, with specific information directed to different target audiences: analysts, institutional
investors and individual investors. Easy to browse, the website even includes guidelines for people who are interested in investing in the capital market
for the first time.
At www.voegol.com.br/ir, investors and analysts find comprehensive information, including financial statements, press releases, stock
quotes, coverage and analyst recommendations, and profit estimates by the market. The site also features basic information for those starting
in the financial market.
gol’s annual report ��
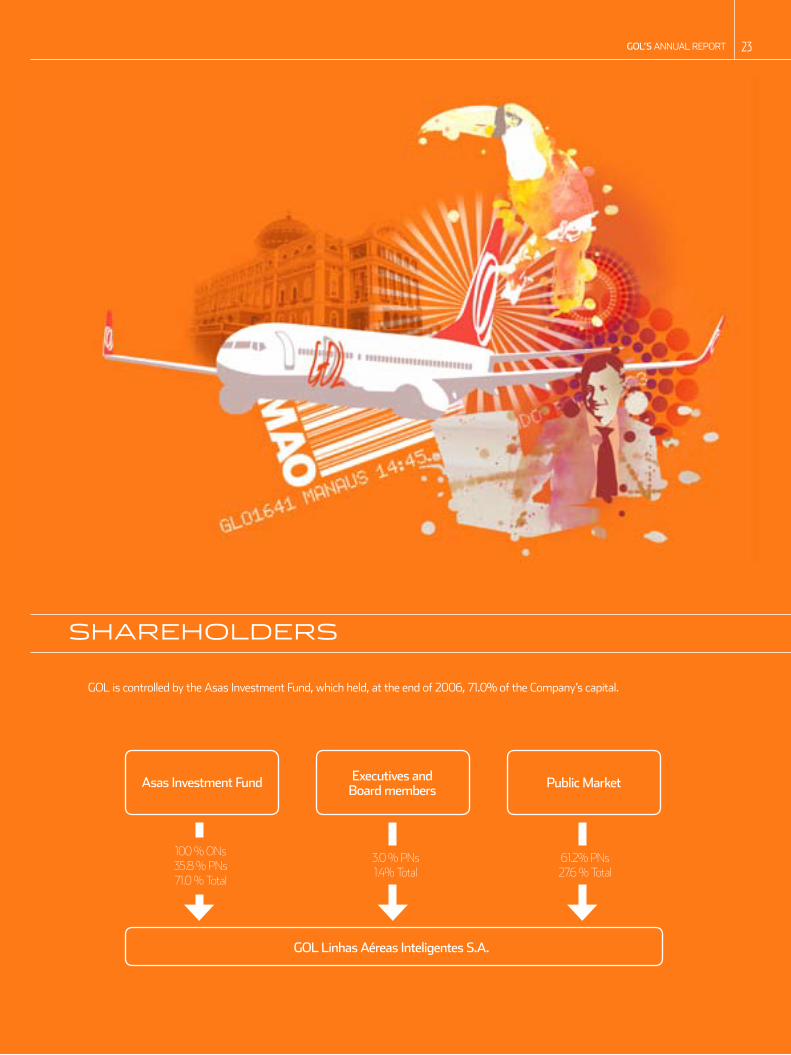
executives andboard members
public marketasas investment fund
gol linhas aéreas inteligentes s.a.
100 % ONs35.8 % PNs71.0 % Total
3.0 % PNs1.4% Total
61.2% PNs27.6 % Total
NEW INVESTOR RElATIONS SITE
GOL is controlled by the Asas Investment Fund, which held, at the end of 2006, 71.0% of the Company’s capital.
SHAREHOlDERS
gol’s annual report�4 CAPITAl MARKETS
PERFORMANCE
Since GOL´s IPO, in June 2004, through the end of 2006, GOL’s shares, which are listed on the São Paulo Stock Exchange (Bovespa), have
appreciated 142.7%, 24.8 percentage points above the Ibovespa for the same period. Similarly, Gol´s american Despositary Shares (aDS), listed on
the New York Stock Exchange (NYSE), appreciated 237.3%, while the Dow Jones index increased 19.3% during the same period.
The average daily volume of GOL’s shares traded on both the Bovespa and NYSE, amounted to approximately US$ 38 million at the end of
2006. In May 2006, GOLL4 shares were also included in IBX-50 index, by Bovespa, which measures the total return of a portfolio comprised of the 50
most traded shares, in terms of liquidity. In october, the shares were maintained in the theoretical portfolio of the Corporate Sustainability Index (ISe)
by Bovespa, comprised of companies with responsible attitudes towards the environment, company, customers, suppliers, and other stakeholders.
GOL’s shares are included in IBX-50, IGC, and Itag, indexes created by Bovespa to differentiate companies with best corporate governance
practices, as well as in the MSCI, which is calculated by Morgan Stanley Capital International. Gol shares are also part of the ISe (Corporate Sustainability
Index).
IN THE MAIN MARKET INDEXES

gol’s annual report �5
Information on shares – 2006 (R$) NYSE GOL (US$)
Opening quote 66.42 28.21
Closing quote 64.40 28.67
Average year quote 68.35 31.51
Maximum year quote 82.80 40.24
Minimum year quote 54.13 25.25
Year variation (%) -3.0% 1.6%
Ibovespa/Dow Jones year variation (%) 35.6% 16.6%
Daily average financial volume 15,331.6 29,265.6
Daily average trades closed 228,641 938,784
Market value on 31/12/2006 12.6 billion 5.6 billion
DIVIDEND DISTRIBuTION
GOL’s By-Laws provide for the payment to holders of common and preferred shares of mandatory dividends in a minimum of 25% of the annual
adjusted net income (income after legal reserve discount), according to the Corporations law.
In 2006, the Company distributed a gross amount equal to r$181.1 million (r$ 162.6 million net1 – representing 25% of base income to
shareholders). R$ 105.3 million as interest on shareholders’ equity and R$ 57.3 million as complementary dividends, summing R$ 0.83 net of income
tax per common and preferred share.
In 2007, GOL will distribute fixed quarterly dividends equal to R$ 0.35 per share, representing an expected payment of 26-29% of the base net
income and an estimated dividend yield of 2.0%.
* Considering 15% of IrrF (Withholding tax)(1) American Stock Exchange Airline Index(2) Dow Jones Industrial average
1/2 1/23 2/13 3/6 3/27 4/18 5/9 5/30 6/20 7/11 8/1 8/22 9/12 10/3 10/24 11/14 12/5 12/2750
55
60
65
70
75
80
85
90
95
100
2006 PRICE GRAPH
XAL (1)GOL (ADR) IBOVGOLL4 DJI (2)
gol’s annual report�� RISK MANAGEMENT
Gol is subject to numerous movements in fuel prices, foreign exchange rates and interest rates. Gol actively monitors such movements in order
to reduce earnings volatility. Because international prices for jet fuel are denominated in U.S. dollars, fuel costs, though payable in Reais, are subject not
only to price fluctuations but also to exchange rate fluctuations.
Gol maintains a fuel and foreign exchange hedging program, based upon best practices, under which the Company enters into fuel and currency
hedging agreements with various counterparties providing for price protection in connection with the purchase of fuel. the hedging practices cover
short-term periods, and are adjusted weekly or more frequently as conditions require. The general policy is to hedge on a short-term basis a majority
of the fuel expected to be consumed and the u.S. dollar exchange rate exposure, so as to minimize the effects of adverse changes in the fuel or
foreign exchange markets. As part of GOL’s risk management program, exposure limits, hedge ratios, instruments and programmed price triggers
are established. The Company uses a variety of financial instruments, including petroleum call options, petroleum fixed-price swap agreements, and
foreign currency forward contracts. In addition, GOL believes that its corporate-wide high standards of internal control reduce its risk exposure. GOL
was one of the first foreign private issuers in Latin America to certify its internal controls over financial reporting.
The Company’s hedging practices are executed by its internal risk management committee and overseen by the Risk Policies Committee of
the Board of Directors. The Risk Policies Committee of the Board of Directors meets quarterly to assess the effectiveness of the hedging policies and
recommends amendments where appropriate. The Company requires that all of its risk management instruments be liquid so as to allow the Company
to make position adjustments and have prices that are widely disclosed. The Company also avoids concentration of credit and product risk.
gol’s annual report ��CORPORATE RESPONSIBIlITY
Gol has always considered corporate responsibility as a part of its businesses. the objective is to obtain sustained results, encouraging social,
cultural and environmental activities.
In 2006, the Company invested approximately R$3 million in social responsibility in Brazil. The company sponsored the collection of food and
school supplies, encouraged cultural promotion and education activities, as well as initiatives in environmental protection.
Entities supported by the Company include SOS Mata Atlântica, AACD, Ashoka, Fundação Gol de Letra, Futebol dos Atores, Canto Cidadão,
Projeto Felicidade, Care Brasil, Eu Quero Ajudar, Expedicionários da Saúde, Pastoral da Criança, Centro Infantil Boldrini, Expedição Vaga Lume, and
Instituto Criar de tV.
During the year, the Company also sponsored the donation of 1,200 tickets (for national and international destinations), the collection of 17 tons
of food and 48 thousand units of school supplies, as well as the planting of 15 thousand trees. In 2006, the Company also implemented an internal
process for recycling and selective waste collection. During the year, the Company collected 20 tons of paper, cardboard and plastic. From this total,
approximately 10 tons of plastic will be turned into new products, saving 123 trees.
Gol understands its image is not built only on social actions. the Company has a strong brand and, therefore, it imposes ethical principles in its
work relations and in the conduction of businesses. In 2004, it published the Company´s Code of Ethics, available at www.voegol.com.br/ir.
2006 corporate responsibility balance sheet of gol is also available on the company’s website. visit to learn the details on the projects and people involved in gol’s corporate responsibility activities.
gol’s annual report��
2,539.0
2,669.1130.1
3,580.9
3,802.0
221.1
2005 2006
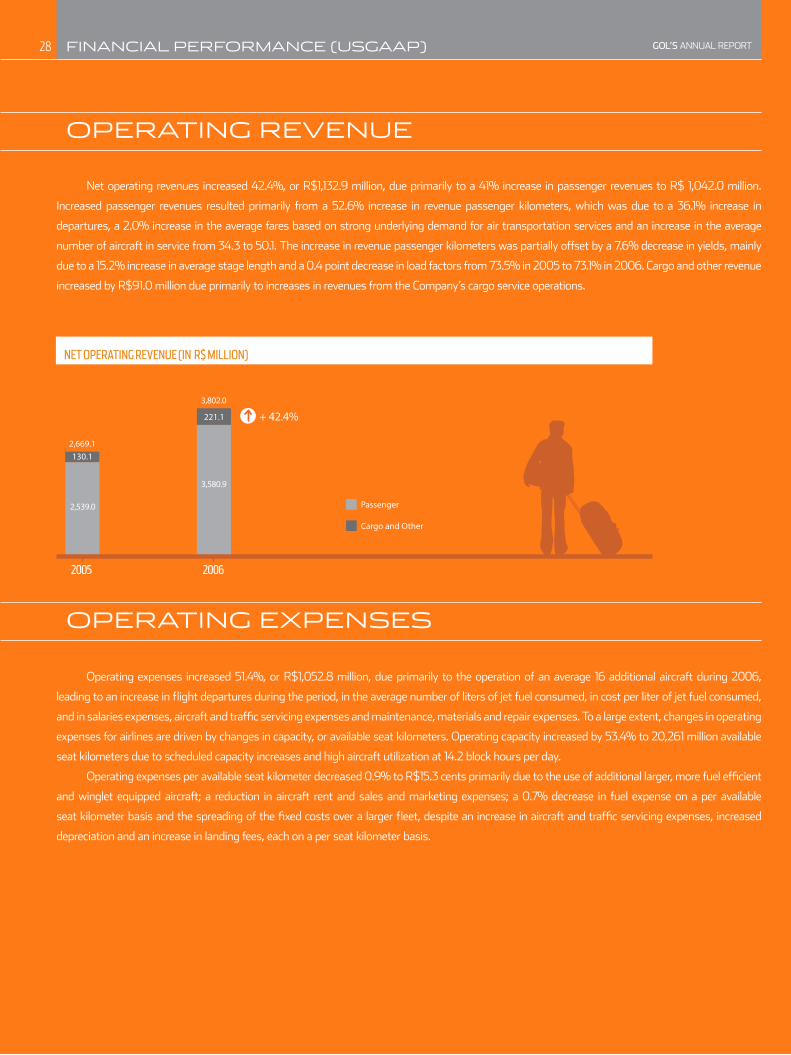
NET OPERATING REVENUE (IN R$ MILLION)
Cargo and Other
Passenger
+ 42.4%
FINANCIAl PERFORMANCE (uSGAAP)
OPERATING REVENuE
net operating revenues increased 42.4%, or r$1,132.9 million, due primarily to a 41% increase in passenger revenues to r$ 1,042.0 million.
Increased passenger revenues resulted primarily from a 52.6% increase in revenue passenger kilometers, which was due to a 36.1% increase in
departures, a 2.0% increase in the average fares based on strong underlying demand for air transportation services and an increase in the average
number of aircraft in service from 34.3 to 50.1. The increase in revenue passenger kilometers was partially offset by a 7.6% decrease in yields, mainly
due to a 15.2% increase in average stage length and a 0.4 point decrease in load factors from 73.5% in 2005 to 73.1% in 2006. Cargo and other revenue
increased by R$91.0 million due primarily to increases in revenues from the Company’s cargo service operations.
OPERATING EXPENSES
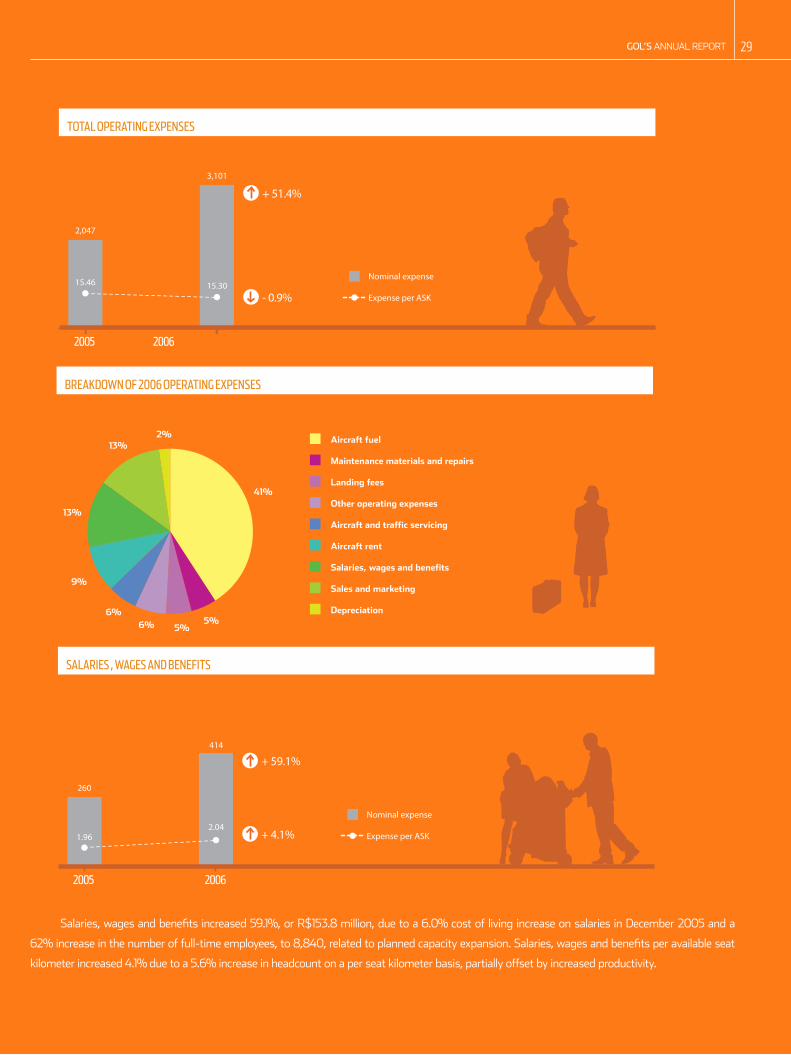
operating expenses increased 51.4%, or r$1,052.8 million, due primarily to the operation of an average 16 additional aircraft during 2006,
leading to an increase in flight departures during the period, in the average number of liters of jet fuel consumed, in cost per liter of jet fuel consumed,
and in salaries expenses, aircraft and traffic servicing expenses and maintenance, materials and repair expenses. To a large extent, changes in operating
expenses for airlines are driven by changes in capacity, or available seat kilometers. Operating capacity increased by 53.4% to 20,261 million available
seat kilometers due to scheduled capacity increases and high aircraft utilization at 14.2 block hours per day.
Operating expenses per available seat kilometer decreased 0.9% to R$15.3 cents primarily due to the use of additional larger, more fuel efficient
and winglet equipped aircraft; a reduction in aircraft rent and sales and marketing expenses; a 0.7% decrease in fuel expense on a per available
seat kilometer basis and the spreading of the fixed costs over a larger fleet, despite an increase in aircraft and traffic servicing expenses, increased
depreciation and an increase in landing fees, each on a per seat kilometer basis.
gol’s annual report ��
15.46
2,047
15.30
3,101
2005 2006
TOTAL OPERATING EXPENSES
Expense per ASK
Nominal expense
+ 51.4%
- 0.9%
1.96
260
2.04
414
2005 2006
SALARIES , WAGES AND BENEFITS
Expense per ASK
Nominal expense
+ 59.1%
+ 4.1%
Salaries, wages and benefits increased 59.1%, or R$153.8 million, due to a 6.0% cost of living increase on salaries in December 2005 and a
62% increase in the number of full-time employees, to 8,840, related to planned capacity expansion. Salaries, wages and benefits per available seat
kilometer increased 4.1% due to a 5.6% increase in headcount on a per seat kilometer basis, partially offset by increased productivity.
gol’s annual report�0
6,10
808
6,06
1.227
2005 2006
AIRCRAFT FUEL
Expense per ASK
Nominal expense
-0,7%
+ 51,8%
1.82
241
1.44
293
2005 2006
AIRCRAFT RENT
Expense per ASK
Nominal expense
-20.9%
+ 21.5%
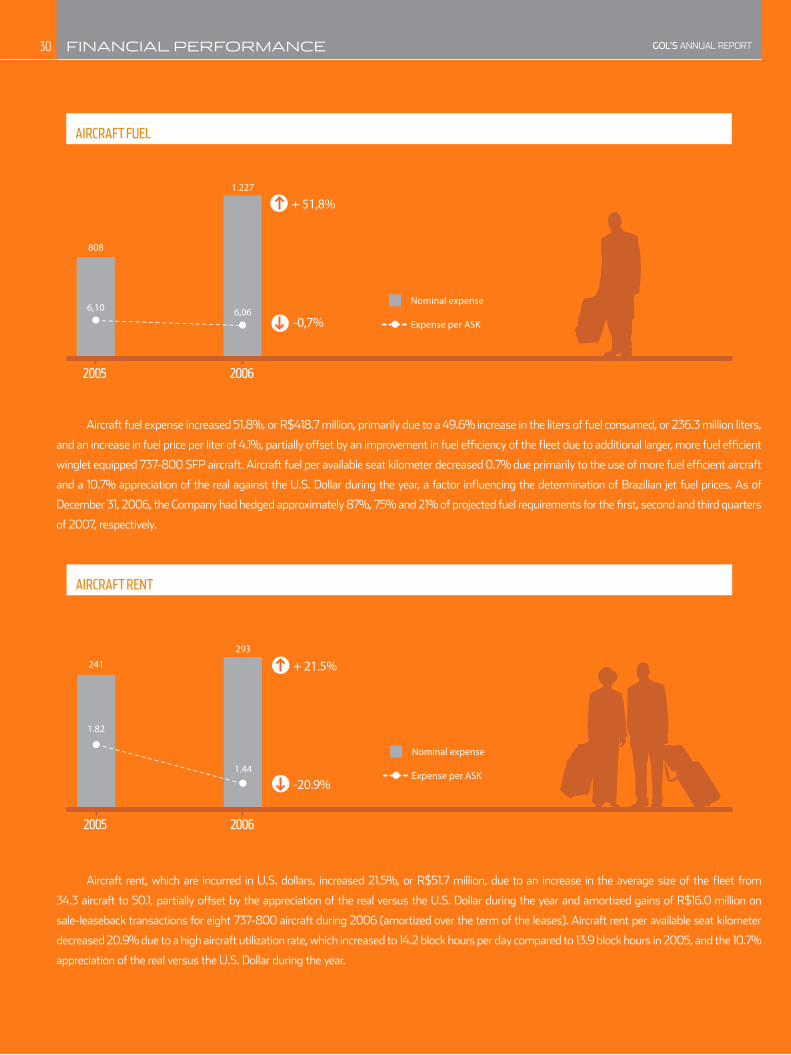
aircraft fuel expense increased 51.8%, or r$418.7 million, primarily due to a 49.6% increase in the liters of fuel consumed, or 236.3 million liters,
and an increase in fuel price per liter of 4.1%, partially offset by an improvement in fuel efficiency of the fleet due to additional larger, more fuel efficient
winglet equipped 737-800 SFP aircraft. Aircraft fuel per available seat kilometer decreased 0.7% due primarily to the use of more fuel efficient aircraft
and a 10.7% appreciation of the real against the U.S. Dollar during the year, a factor influencing the determination of Brazilian jet fuel prices. As of
December 31, 2006, the Company had hedged approximately 87%, 75% and 21% of projected fuel requirements for the first, second and third quarters
of 2007, respectively.
Aircraft rent, which are incurred in U.S. dollars, increased 21.5%, or R$51.7 million, due to an increase in the average size of the fleet from
34.3 aircraft to 50.1, partially offset by the appreciation of the real versus the u.S. Dollar during the year and amortized gains of r$16.0 million on
sale-leaseback transactions for eight 737-800 aircraft during 2006 (amortized over the term of the leases). Aircraft rent per available seat kilometer
decreased 20.9% due to a high aircraft utilization rate, which increased to 14.2 block hours per day compared to 13.9 block hours in 2005, and the 10.7%
appreciation of the real versus the u.S. Dollar during the year.
FINANCIAl PERFORMANCE
gol’s annual report �1
2.53
336
2.05
415
2005 2006
SALES AND MARKETING
Expense per ASK
Nominal expense
+ 23.5%
- 19.0%
0.70
92
0.78
158
2005 2006
LANDING FEES
Expense per ASK
Nominal expense
+ 70.7%
+ 11.4%
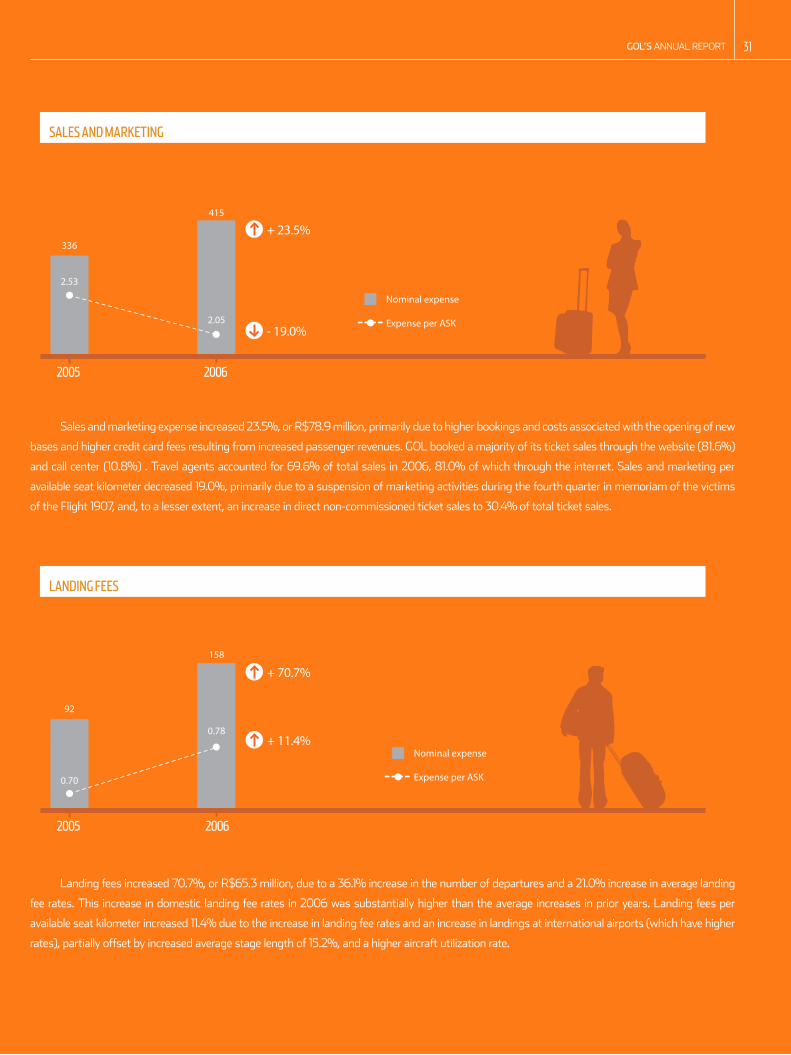
Sales and marketing expense increased 23.5%, or R$78.9 million, primarily due to higher bookings and costs associated with the opening of new
bases and higher credit card fees resulting from increased passenger revenues. GOL booked a majority of its ticket sales through the website (81.6%)
and call center (10.8%) . Travel agents accounted for 69.6% of total sales in 2006, 81.0% of which through the internet. Sales and marketing per
available seat kilometer decreased 19.0%, primarily due to a suspension of marketing activities during the fourth quarter in memoriam of the victims
of the Flight 1907, and, to a lesser extent, an increase in direct non-commissioned ticket sales to 30.4% of total ticket sales.
landing fees increased 70.7%, or r$65.3 million, due to a 36.1% increase in the number of departures and a 21.0% increase in average landing
fee rates. this increase in domestic landing fee rates in 2006 was substantially higher than the average increases in prior years. landing fees per
available seat kilometer increased 11.4% due to the increase in landing fee rates and an increase in landings at international airports (which have higher
rates), partially offset by increased average stage length of 15.2%, and a higher aircraft utilization rate.

gol’s annual report��
0.69
920.98
199
2005 2006
AIRCRAFT AND TRAFFIC SERVICING
Expense per ASK
Nominal expense
+ 117.7%
+ 42.0%
0.42
55
0.72
147
2005 2006
MAINTENANCE, MATERIALS AND REPAIRS
Expense per ASK
Nominal expense
+ 164.6%
+ 71.4%
Aircraft and traffic servicing expense increased 117.7%, or R$107.8 million, primarily due to an increase in operations from 45 to 55 airports
served, an increase in third party services in the amount of R$33.4 million and a 36.1% increase in departures. Aircraft and traffic servicing per available
seat kilometer increased 42.0%, mainly due to the increase in third party services related to technology and systems implementation and higher
ground handling services expenses, mainly due to the increase in international destinations (with relatively higher ground handling costs), partially
offset by an increased average stage length and higher aircraft utilization.
FINANCIAl PERFORMANCE
Maintenance, materials and repairs increased 164.6%, or r$91.1 million, due to 16 average additional aircraft in operation as well as the scheduled
maintenance of 23 engines, in the amount of R$77.1 million, mainly on Boeing 737-300 aircraft, repair of rotable materials, in the amount of R$34.3
million, and the use of spare parts inventory, in the amount of R$20.1 million. Maintenance, materials and repairs per available seat kilometer increased
71.4% primarily due to a higher number of scheduled maintenance services, partially offset by a 10.7% appreciation of the real against the u.S. Dollar.
gol’s annual report ��
0.26
35 0.34
69
2005 2006
DEPRECIATION AND AMORTIZATION
Expense per ASK
Nominal expense
+98.0%
+30.8%
0.96
128
0.89
179
2005 2006
OTHER OPERATING EXPENSES
Expense per ASK
Nominal expense
+ 39.9%
- 7.3%
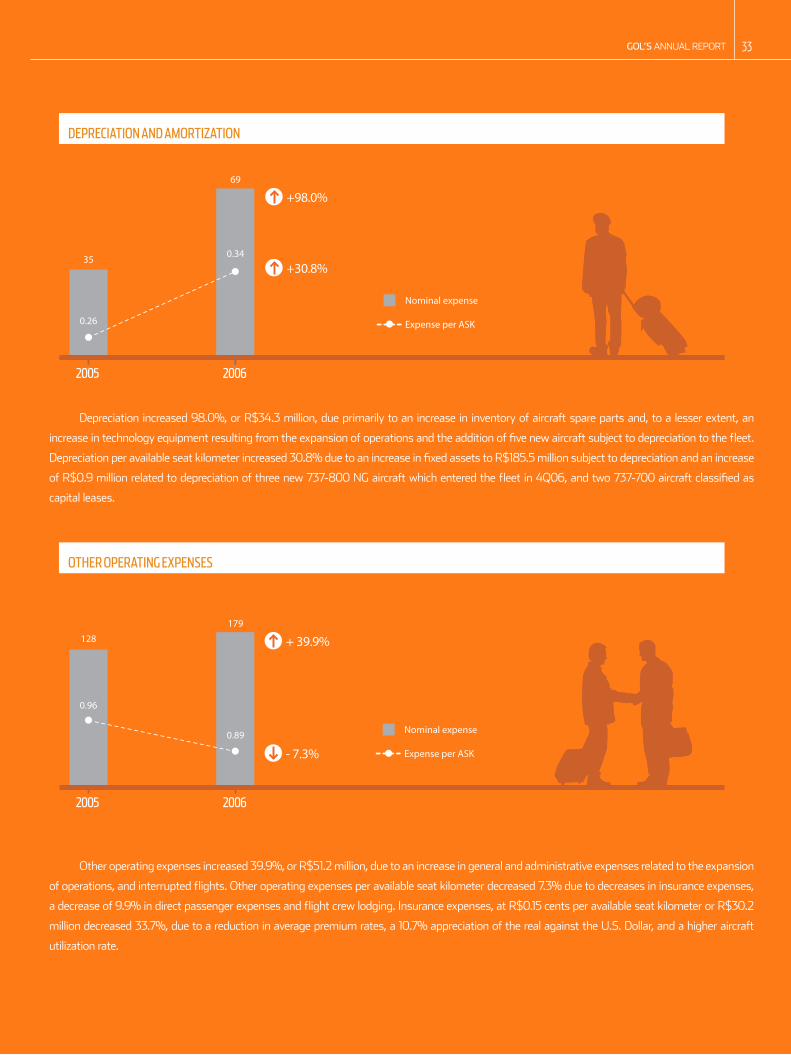
Depreciation increased 98.0%, or r$34.3 million, due primarily to an increase in inventory of aircraft spare parts and, to a lesser extent, an
increase in technology equipment resulting from the expansion of operations and the addition of five new aircraft subject to depreciation to the fleet.
Depreciation per available seat kilometer increased 30.8% due to an increase in fixed assets to R$185.5 million subject to depreciation and an increase
of R$0.9 million related to depreciation of three new 737-800 NG aircraft which entered the fleet in 4Q06, and two 737-700 aircraft classified as
capital leases.
other operating expenses increased 39.9%, or r$51.2 million, due to an increase in general and administrative expenses related to the expansion
of operations, and interrupted flights. Other operating expenses per available seat kilometer decreased 7.3% due to decreases in insurance expenses,
a decrease of 9.9% in direct passenger expenses and flight crew lodging. Insurance expenses, at R$0.15 cents per available seat kilometer or R$30.2
million decreased 33.7%, due to a reduction in average premium rates, a 10.7% appreciation of the real against the u.S. Dollar, and a higher aircraft
utilization rate.

gol’s annual report�4 FINANCIAl PERFORMANCE
NET INCOME
net income in 2006 increased to r$ 569.1 million, a 10.9% annual growth, and representing a net income magin of 15.0%. net income per share,
basic and diluted, was r$ 2.90 (uS$ 1.36 per aDS).
PROFITABIlITY AND RETuRNS
Gol ended 2006 with some of the higher return on assets and capital in the low cost air transportation sector. return on equity (roe) was
25.8% and on assets (roa) 13.2%. return on invested capital (roIC) was 17.1%. net revenue per aircraft was uS$ 34.9 million, representing one of
the higher productivity levels in the world. the great cost advantage compared to its peers, combined with a strong capital structure, enables Gol to
be one of the world leaders in profitability and return.
Return (in thousands of US$) 2006 2005 Var %
Net Revenue / Aircraft 34,874 31,955 9.1%
Operating Profit / Aircraft 6,434 7,439 -13.5%
ROIC (1) 17.1% 27.4% -10.3 pp
ROE (2) 25.8% 28.2% -2.4 pp
ROA (3) 13.2% 20.1% -6.9 pp(1) Net Profit / (Equity + Total Debt)
(2) Net Profit / Equity
(3) Net Profit / Total Assets
lIquIDITY AND CAPITAl RESOuRCES
One of GOL’s policy priorities is to keep a solid financial position, with an appropriate cash balance and appropriate financial leverage. On
December 31, 2006, the Company recorded r$ 281.0 million in cash, r$ 1.425.0 million in short term investments and r$ 659.3 million in accounts
receivable. By the end of the year, GOL had 9 open credit lines with 5 institutions, enabling loans of up to R$ 332 million.

gol’s annual report �5
CAPITAl EXPENDITuRES
In 2006, capital expenditures amounted to R$ 553.2 million, including R$ 489.8 million related to the acquisition of fixed assets and R$ 63.4
million of pre-delivery deposits in aircraft acquisitions. Investment activities amounted to r$ 1.234.1 million, including above capital expenses and
r$ 662.7 million in short term investment acquisitions. In 2005, investments amounted to r$ 482.8 million, including investments and r$ 169.4
million regarding asset and equipment acquisition and r$ 313.3 million of pre-delivery deposits in aircraft acquisitions. Investment activities amounted
to r$ 801.8 million, including above investments and r$ 319.3 million with short term investments.
GOL depends mainly on cash flow arising out of operations to obtain working capital for current and future operations. Current operations cash
flow summed up to R$ 530.4 million in 2006 and R$ 353.7 million in 2005. The increase in operational cash flow in the above mentioned periods is
mainly due to business growth.
Net cash flow used for investing and financing purposes was R$ 355.8 million in 2006 R$ 653.1 million in 2005. Main reasons for the increase
in net cash flow from financing activities in 2006 are listed below in Financing.
Net cash provided by financing activities in 2006 was mainly due to a US$200 million perpetual bond issuance of 8.75% interest rate in
April, 2006, a R$75.7 million long-term financing from BNDES (Social and Economical Development National Bank) in July, 2006, a US$50 million
long-term financing from International Finance Corporation in July, 2006 and a US$78.3 million long-term financing from Private Export Funding
Corporation (peFCo) in november, 2006.
The Company’s operational cash flow are affected by obligations provided by some commercial aircraft lease agreements entered that set forth
the existence of reserve funds for aircraft maintenance, which shall contain minimum amounts set forth therein. on December 31, 2006, Gol recorded
uS$ 263.6 million in deposits under the terms in aircraft operational leases, for maintenance. Some resources will be withdrawn from maintenance
reserve accounts for purposes of reimbursement with structural maintenance incurred costs. the Company believes that deposited amounts, and
amounts to be deposited, as well as its own cash resources, shall be sufficient to cover future costs with aircraft and maintenance during the term of
the applicable leases.
CASH FlOW

gol’s annual report��
Financing activities in 2006 included mainly:
issuance of Perpetual Bonds with an 8.75% interest rate in the amount of US$ 200 million in April in 2006;
six year financing in the amount of R$ 75.7 million with Banco Nacional de Desenvolvimento Econômico e Social (BNDES) guaranteed by
accounts receivable and with interest rate 2.65% above the long term loan rate in Brazil, which on December 31, 2006 was 6.95% per year
in reais;
long term financing of US$ 50 million with International Finance Corporation (IFC) in June 2006, with a Libor based floating interest rate
(interest rate on December 31, 2006 equal to 7.24% per year), guaranteed by collateral represented by aircraft parts and turbines;
long term financing of US$ 60 million with commercial banks in September 2006, with a Libor based floating interest rate (interest rate
on December 31, 2006 equal to 5.37% per year); and
twelve year debt financing, of US$ 78.3 million with Private Export Funding Corporation (PEFCO), for the acquisition of new Boeing 737-
800 NG aircrafts, guaranteed by the Export Import Bank (Exim) of the United States.
Long-term financings include usual covenants and restrictions, some of those obligate the Company to keep specific financial indexes. As
of December 31, 2006, the Company is in full accordance with all of them and none of which will have an adverse material effect on the Company’s
business. refer to note 7 from the Consolidated Financial Statement for further information.
Financing activities during 2005 consisted mainly of a r$ 279.1 million increase in a follow-on share issuance in May, 2005, partially offset by a
r$64.3 million reduction in short-term borrowings.
The Company intends to increase its long-term debt mainly from loans from private financial institutions, capital market financings and financial
leases for aircraft acquisition.
•
•
•
•
•
FINANCING ACTIVITIES
FINANCIAl PERFORMANCE

gol’s annual report ��

gol’s annual report�� AWARDS
awards granted to Gol in 2006, include:
Best Transport and Logistics Company in the sixth Valor 1000 Yearbook;
Best Airline in the world in 2005, according to the Aviation Week and Space Technology;
award of best airline among medium-sized airlines with innovative strategies and best management, granted by latinFinance magazine;
Award Melhores e Maiores 2006 for Best Company in Transport in Brazil, granted by Exame magazine;
Most Competitive airline, in a list published by america economia Magazine;
Award for Leadership in the Air Transportation World Market, granted by Air Transport World;
Number 1 in Best Disclosure Practices in Latin America for the second consecutive year, the main award in the sector and listing among 5
best websites of Investor Relations, in the 9th edition of IR Global Rankings.
award FGV for Corporate excellence in transportation Service category.
•
•
•
•
•
•
•
•

gol’s annual report ��
BOARD OF DIRECTORS, EXECuTIVE OFFICERS AND COMMITTEES
NAME TITlE
Constantino de oliveira Chairman
Constantino de oliveira Junior Director
Henrique Constantino Director
Joaquim Constantino neto Director
ricardo Constantino Director
Álvaro de Souza Director
antonio Kandir Director
luiz Kaufmann Director
BOARD OF DIRECTORS
NAME TITlE
Constantino de oliveira Junior President and Chief Executive Officer
David Barioni Neto executive Vice president - technical
Richard F. Lark, Jr. Executive Vice President – Finance, Chief Financial Officer and Investor Relations Officer
tarcísio Geraldo Gargioni Executive Vice President - Marketing and Services
Wilson Maciel ramos executive Vice president - planning and Information technology
audit committee corporate governance and nomination committee
Álvaro de Souza Betania Tanure de Barros
Antonio Kandir Charles Barnsley Holland
Luiz Kaufmann (financial expert) Paulo César Aragão
people policies committee risk policies committee
Henrique Constantino Barry Siler
Marco Antonio Piller Henrique Constantino
Marcos Roberto Morales Richard F. Lark, Jr.
financial policy committee
Henrique Constantino
Richard F. Lark, Jr.
EXECuTIVE OFFICERS
COMMITTEES
gol’s annual report40
shares traded on the bovespa
Custody agent:
Banco Itaú S.A.
Shareholders Department
av. engº. armando de arruda pereira,
707 – 9º andar
04344-902 – São Paulo-SP
Note: Shareholder services are provided by Bank branches.
shares traded on the nyse
specialist firm:
Fleet Specialist, Inc.
Anna G. Sakalis
Director, latin america
14 Wall Street, 21st floor
New York, NY 10005-1901 USA
tel.: 1-212-589-0106
Fax: 1-212-589-0452
E-mail: [email protected]
www.fleet-specialist.com
ads program deposity bank:
The Bank of New York
Shareholder relations
PO BOX 11258 – Church Street Station
New York, NY 10286-1258 EUA
Tel. (toll free): 1-888-BNY-ADRS (269-2377)
tel. (international): 1-610-312-5315
E-mail: [email protected]
www.adrbny.com
independent auditors
Ernst & Young Auditores Independentes
Av. Presidente Juscelino Kubitschek, 1830
torre II 6° andar
04543-900 São paulo Sp
tel.: (55 11) 3523-5200
investor relations
Richard F. Lark, Jr.
Executive Vice-President-Finance, Chief Financial Officer
and Investor Relations Officer
rua Gomes de Carvalho 1629
04547-006 São Paulo – SP - Brasil
Tel: (+55 11 3169 6800)
CORPORATE INFORMATION
gol’s annual report 41
all the relevant facts of Gol linhas aéreas Inteligentes and its subsidiaries are disclosed simultaneously to regulating authorities and bodies in
Brazil and in the United States, and to the market.
Quarterly and annual financial statements follow accounting standards defined by the Brazilian Corporation Law, and U.S. accounting standards
(US-GAAP). Additionally, as required by Law, full financial statements are published annually in Valor Econômico and the Diário Oficial of the state of
São paulo.
Quarterly and annual financial statements, corporate information, press releases, presentations, relevant facts and notices to shareholders are
available in our area of Investor relations and at the Ir website (www.voegol.com.br). other information on the company may be found at the websites
of the São Paulo Stock Exchange (www.bovespa.com.br), New York Stock Exchange (www.nyse.com), Comissão de Valores Mobiliários (www.cvm.
gov.br) and Securities and exchange Commission (www.sec.gov).
PuBlICATIONS AND INFORMATION
This report includes future considerations regarding business perspectives, estimates of operational and financial results, and GOL’s growth
perspectives. These are merely projections and, as such, are based exclusively in GOL’s management expectations regarding the future of the business
and its continuous access to capitals to fund the Company business plan. These future considerations depend, substantially, on changes to market
conditions, governmental rules, competition pressures, sector performance and the Brazilian economy, among other factors, as well as risks in
promotion documents filed by GOL and, therefore, are subject to changes without notice.

�
Financial StatementS under uSGaaP
GOl linhaS aéreaS inteliGenteS S.a.
YearS ended at december 31, 2006 and 2005,with rePOrt OF indePendent reGiStered Public accOuntinG Firm
Index
RepoRt of Independent RegIsteRed publIc AccountIng fIRm 43
AudIted fInAncIAl stAtements
Balance Sheets 44
Statements of Income 46
Statements of Cash Flow 47
Statements of Shareholders’ Equity 48

Financial StatementS under uSGaaP
GOl linhaS aéreaS inteliGenteS S.a.
YearS ended at december 31, 2006 and 2005,with rePOrt OF indePendent reGiStered Public accOuntinG Firm
The Board of Directors and Shareholders Gol Linhas Aéreas Inteligentes S.A.
We have audited the accompanying consolidated balance sheets of Gol Linhas Aéreas Inteligentes S.A. and subsidiaries as of December 31, 2006 and 2005 and the related consolidated statements of income, shareholders’ equity and cash flows for each of the three years ended in the period December 31, 2006. These financial statements are the responsibility of the Company’s management. Our responsibility is to express an opinion on these financial statements based on our audits.
We conducted our audits in accordance with the standards of the Public Company Accounting Oversight Board (United States). Those standards require that we plan and perform the audit to obtain reasonable assurance about whether the financial statements are free of material misstatement. An audit includes examining, on a test basis, evidence supporting the amounts and disclosures in the financial statements. An audit also includes assessing the accounting principles used and significant estimates made by management, as well as evaluating the overall financial statement presentation. We believe that our audits provide a reasonable basis for our opinion.
In our opinion, the financial statements referred to above present fairly, in all material respects, the consolidated financial position of Gol Linhas Aéreas Inteligentes S.A. and subsidiaries at December 31, 2006 and 2005, and the consolidated results of their operations and their cash flows for each of the three years in the period ended December 31, 2006, in conformity with U.S. generally accepted accounting principles.
We also have audited, in accordance with the standards of the Public Company Accounting Oversight Board (United States), the effectiveness of Gol Linhas Aéreas Inteligentes S.A.’s internal control over financial reporting as of December 31, 2006, based on criteria established in Internal Control-Integrated Framework issued by the Committee of Sponsoring Organizations of the Treadway Commission and our report dated January 29, 2007 expressed an unqualified opinion thereon.
São Paulo, January 29, 2007
ERNST & YOUNGAuditores Independentes S.S.CRC-2SP015199/O-1
Maria Helena PetterssonCRC-1SP119891/O-0
rePOrt OF indePendent reGiStered
Public accOuntinG Firm
43
translation into thousands of
us$
2005 2006 2006
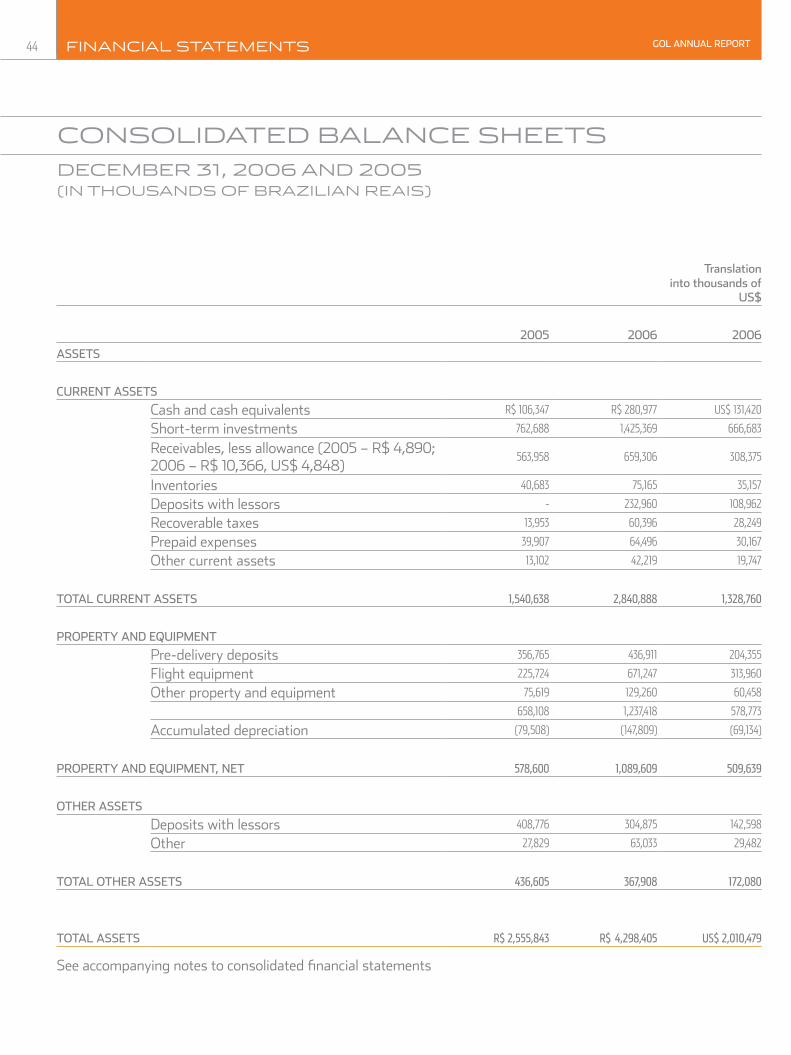
Assets
cuRRent Assets
Cash and cash equivalents R$ 106,347 R$ �80,977 US$ 131,4�0
Short-term investments 76�,688 1,4�5,369 666,683
Receivables, less allowance (2005 – R$ 4,890; 2006 – R$ 10,366, US$ 4,848)
563,958 659,306 308,375
Inventories 40,683 75,165 35,157
Deposits with lessors - �3�,960 108,96�
Recoverable taxes 13,953 60,396 �8,�49
Prepaid expenses 39,907 64,496 30,167
Other current assets 13,10� 4�,�19 19,747
totAl cuRRent Assets 1,540,638 2,840,888 1,328,760
pRopeRtY And eQuIpment
Pre-delivery deposits 356,765 436,911 �04,355
Flight equipment ��5,7�4 671,�47 313,960
Other property and equipment 75,619 1�9,�60 60,458
658,108 1,�37,418 578,773
Accumulated depreciation (79,508) (147,809) (69,134)
pRopeRtY And eQuIpment, net 578,600 1,089,609 509,639
otHeR Assets
Deposits with lessors 408,776 304,875 14�,598
Other �7,8�9 63,033 �9,48�
totAl otHeR Assets 436,605 367,908 172,080
totAl Assets R$ 2,555,843 R$ 4,298,405 US$ 2,010,479
See accompanying notes to consolidated financial statements
cOnSOlidated balance SheetS
december 31, 2006 and 2005(in thOuSandS OF brazilian reaiS)
44 Financial StatementS gol AnnuAl RepoRt
translation into thousands
of us$
2005 2006 2006
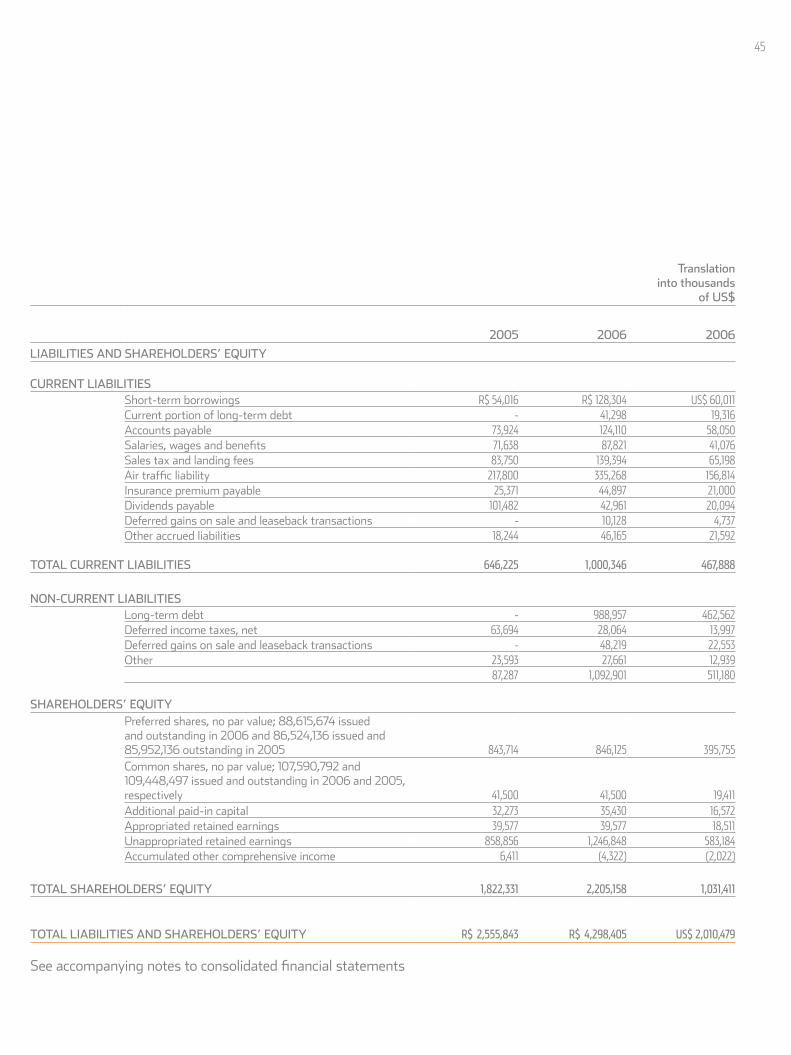
lIAbIlItIes And sHAReHoldeRs’ eQuItY
cuRRent lIAbIlItIes Short-term borrowings R$ 54,016 R$ 1�8,304 US$ 60,011Current portion of long-term debt - 41,�98 19,316Accounts payable 73,9�4 1�4,110 58,050Salaries, wages and benefits 71,638 87,8�1 41,076Sales tax and landing fees 83,750 139,394 65,198Air traffic liability �17,800 335,�68 156,814Insurance premium payable �5,371 44,897 �1,000Dividends payable 101,48� 4�,961 �0,094Deferred gains on sale and leaseback transactions - 10,1�8 4,737Other accrued liabilities 18,�44 46,165 �1,59�
totAl cuRRent lIAbIlItIes 646,225 1,000,346 467,888
non-cuRRent lIAbIlItIesLong-term debt - 988,957 46�,56�Deferred income taxes, net 63,694 �8,064 13,997Deferred gains on sale and leaseback transactions - 48,�19 ��,553Other �3,593 �7,661 1�,939
87,�87 1,09�,901 511,180
sHAReHoldeRs’ eQuItYPreferred shares, no par value; 88,615,674 issued and outstanding in 2006 and 86,524,136 issued and 85,952,136 outstanding in 2005 843,714 846,1�5 395,755Common shares, no par value; 107,590,792 and 109,448,497 issued and outstanding in 2006 and 2005, respectively 41,500 41,500 19,411Additional paid-in capital 3�,�73 35,430 16,57�Appropriated retained earnings 39,577 39,577 18,511Unappropriated retained earnings 858,856 1,�46,848 583,184Accumulated other comprehensive income 6,411 (4,3��) (�,0��)
totAl sHAReHoldeRs’ eQuItY 1,822,331 2,205,158 1,031,411
totAl lIAbIlItIes And sHAReHoldeRs’ eQuItY R$ 2,555,843 R$ 4,298,405 US$ 2,010,479
See accompanying notes to consolidated financial statements
45
translation
into thousands of us$
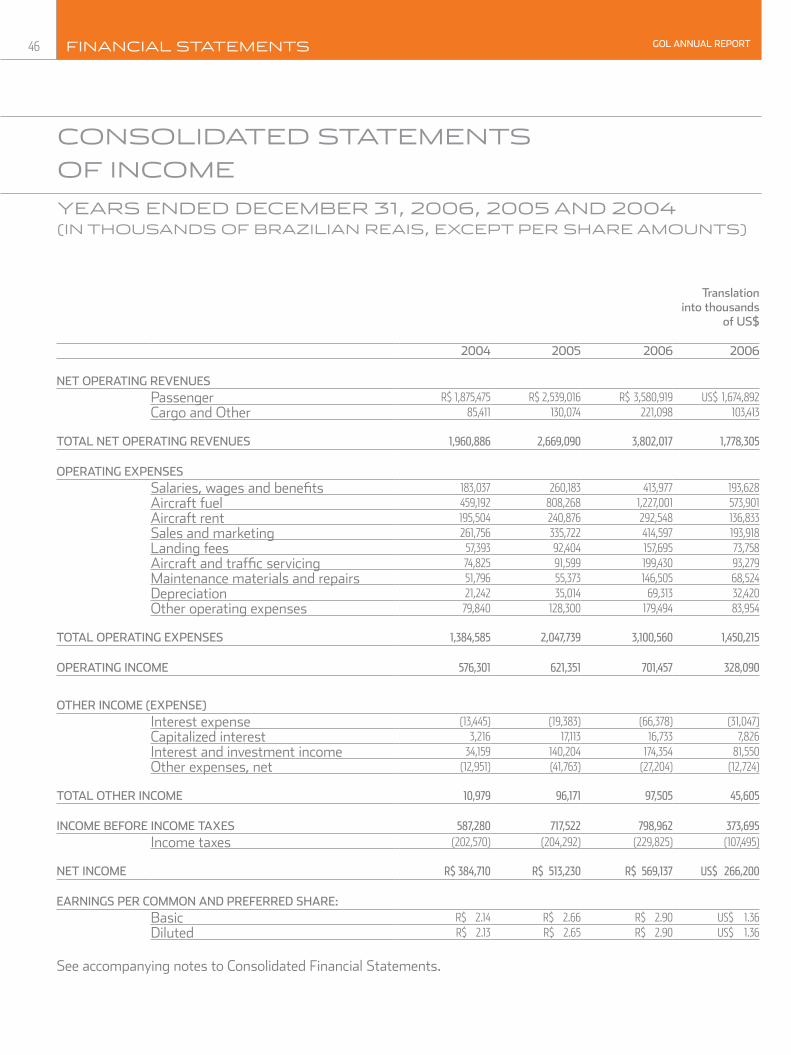
2004 2005 2006 2006
net opeRAtIng ReVenuesPassenger R$ 1,875,475 R$ �,539,016 R$ 3,580,919 US$ 1,674,89�Cargo and Other 85,411 130,074 ��1,098 103,413
totAl net opeRAtIng ReVenues 1,960,886 2,669,090 3,802,017 1,778,305
opeRAtIng expensesSalaries, wages and benefits 183,037 �60,183 413,977 193,6�8Aircraft fuel 459,19� 808,�68 1,��7,001 573,901Aircraft rent 195,504 �40,876 �9�,548 136,833Sales and marketing �61,756 335,7�� 414,597 193,918Landing fees 57,393 9�,404 157,695 73,758Aircraft and traffic servicing 74,8�5 91,599 199,430 93,�79Maintenance materials and repairs 51,796 55,373 146,505 68,5�4Depreciation �1,�4� 35,014 69,313 3�,4�0Other operating expenses 79,840 1�8,300 179,494 83,954
totAl opeRAtIng expenses 1,384,585 2,047,739 3,100,560 1,450,215
opeRAtIng Income 576,301 621,351 701,457 328,090
otHeR Income (expense)Interest expense (13,445) (19,383) (66,378) (31,047)Capitalized interest 3,�16 17,113 16,733 7,8�6Interest and investment income 34,159 140,�04 174,354 81,550Other expenses, net (1�,951) (41,763) (�7,�04) (1�,7�4)
totAl otHeR Income 10,979 96,171 97,505 45,605
Income befoRe Income tAxes 587,280 717,522 798,962 373,695
Income taxes (�0�,570) (�04,�9�) (��9,8�5) (107,495)
net Income R$ 384,710 R$ 513,230 R$ 569,137 US$ 266,200
eARnIngs peR common And pRefeRRed sHARe:Basic R$ �.14 R$ �.66 R$ �.90 US$ 1.36Diluted R$ �.13 R$ �.65 R$ �.90 US$ 1.36
See accompanying notes to Consolidated Financial Statements.
cOnSOlidated StatementS
OF incOme
YearS ended december 31, 2006, 2005 and 2004(in thOuSandS OF brazilian reaiS, excePt Per Share amOuntS)
46 Financial StatementS gol AnnuAl RepoRt
translation in thousands
of us$
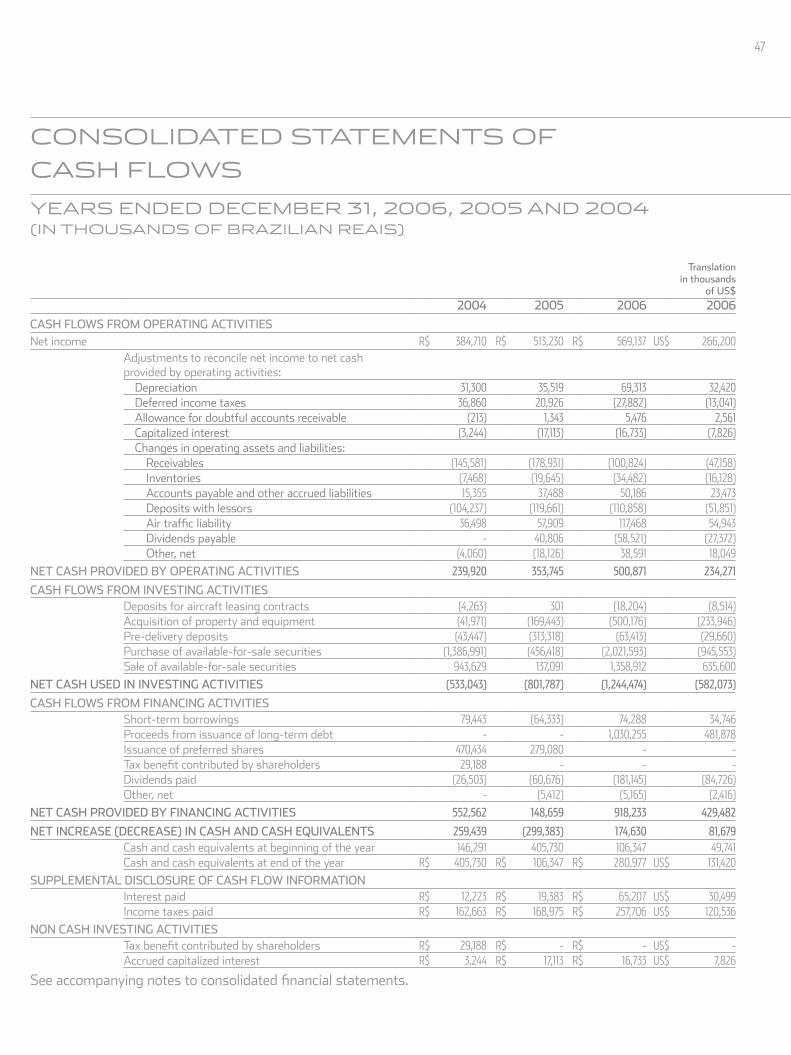
2004 2005 2006 2006
cAsH floWs fRom opeRAtIng ActIVItIesNet income R$ 384,710 R$ 513,�30 R$ 569,137 US$ �66,�00
Adjustments to reconcile net income to net cash provided by operating activities:
Depreciation 31,300 35,519 69,313 3�,4�0Deferred income taxes 36,860 �0,9�6 (�7,88�) (13,041)Allowance for doubtful accounts receivable (�13) 1,343 5,476 �,561Capitalized interest (3,�44) (17,113) (16,733) (7,8�6)Changes in operating assets and liabilities:
Receivables (145,581) (178,931) (100,8�4) (47,158)Inventories (7,468) (19,645) (34,48�) (16,1�8)Accounts payable and other accrued liabilities 15,355 37,488 50,186 �3,473Deposits with lessors (104,�37) (119,661) (110,858) (51,851)Air traffic liability 36,498 57,909 117,468 54,943Dividends payable - 40,806 (58,5�1) (�7,37�)Other, net (4,060) (18,1�6) 38,591 18,049
net cAsH pRoVIded bY opeRAtIng ActIVItIes 239,920 353,745 500,871 234,271
cAsH floWs fRom InVestIng ActIVItIesDeposits for aircraft leasing contracts (4,�63) 301 (18,�04) (8,514)Acquisition of property and equipment (41,971) (169,443) (500,176) (�33,946)Pre-delivery deposits (43,447) (313,318) (63,413) (�9,660)Purchase of available-for-sale securities (1,386,991) (456,418) (�,0�1,593) (945,553)Sale of available-for-sale securities 943,6�9 137,091 1,358,91� 635,600
net cAsH used In InVestIng ActIVItIes (533,043) (801,787) (1,244,474) (582,073)
cAsH floWs fRom fInAncIng ActIVItIesShort-term borrowings 79,443 (64,333) 74,�88 34,746Proceeds from issuance of long-term debt - - 1,030,�55 481,878Issuance of preferred shares 470,434 �79,080 - -Tax benefit contributed by shareholders �9,188 - - -Dividends paid (�6,503) (60,676) (181,145) (84,7�6)Other, net - (5,41�) (5,165) (�,416)
net cAsH pRoVIded bY fInAncIng ActIVItIes 552,562 148,659 918,233 429,482
net IncReAse (decReAse) In cAsH And cAsH eQuIVAlents 259,439 (299,383) 174,630 81,679Cash and cash equivalents at beginning of the year 146,�91 405,730 106,347 49,741Cash and cash equivalents at end of the year R$ 405,730 R$ 106,347 R$ �80,977 US$ 131,4�0
supplementAl dIsclosuRe of cAsH floW InfoRmAtIonInterest paid R$ 1�,��3 R$ 19,383 R$ 65,�07 US$ 30,499Income taxes paid R$ 16�,663 R$ 168,975 R$ �57,706 US$ 1�0,536
non cAsH InVestIng ActIVItIesTax benefit contributed by shareholders R$ �9,188 R$ - R$ - US$ -Accrued capitalized interest R$ 3,�44 R$ 17,113 R$ 16,733 US$ 7,8�6
See accompanying notes to consolidated financial statements.
cOnSOlidated StatementS OF
caSh FlOwS
YearS ended december 31, 2006, 2005 and 2004(in thOuSandS OF brazilian reaiS)
47

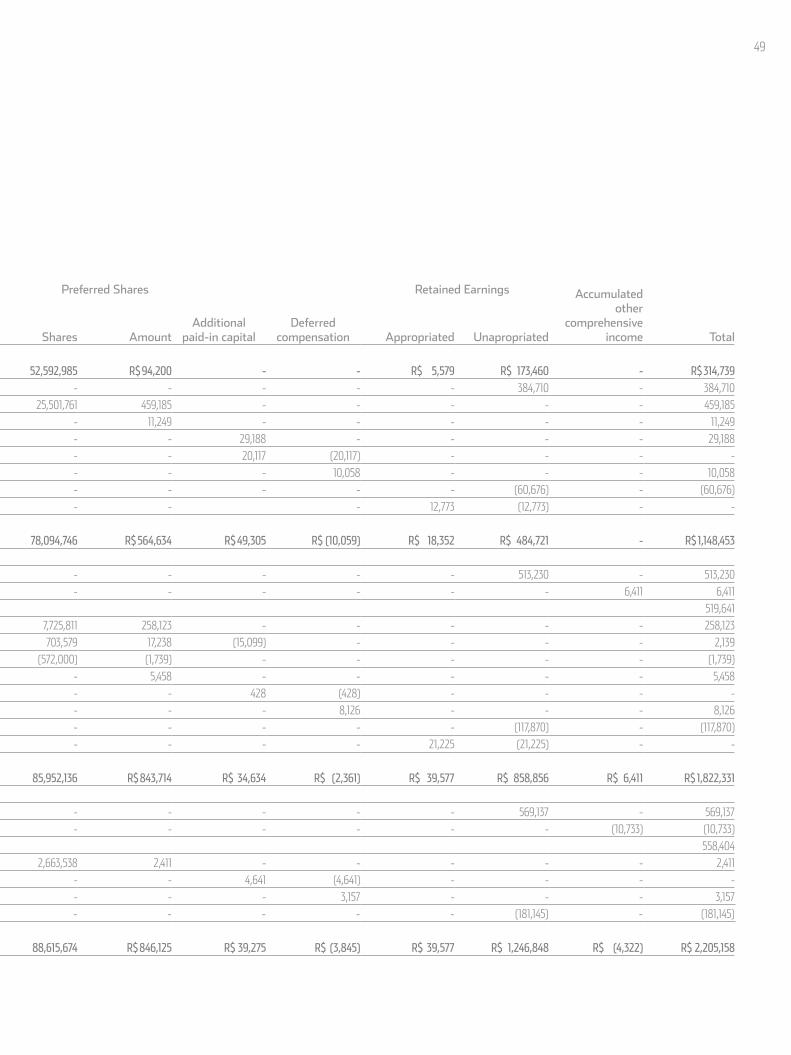
common shares preferred shares
Additionalpaid-in capital
deferred compensation
Retained earnings Accumulated other
comprehensive income totalshares Amount shares Amount Appropriated unapropriated
bAlAnce At decembeR 31, 2003 116,200,000 R$ 41,500 52,592,985 R$ 94,200 - - R$ 5,579 R$ 173,460 - R$ 314,739
Net income - - - - - - - 384,710 - 384,710
Proceeds from public offering, net (6,751,503) - �5,501,761 459,185 - - - - - 459,185
Deferred income taxes on public offering issuance costs, net - - - 11,�49 - - - - - 11,�49
Tax benefit contributed by shareholders - - - - �9,188 - - - - �9,188
Deferred compensation - - - - �0,117 (�0,117) - - - -
Amortization of deferred compensation - - - - - 10,058 - - - 10,058
Dividends payable - - - - - - - (60,676) - (60,676)
Transfer to appropriated retained earnings - - - - - 1�,773 (1�,773) - -
bAlAnce At decembeR 31, 2004 109,448,497 R$ 41,500 78,094,746 R$ 564,634 R$ 49,305 R$ (10,059) R$ 18,352 R$ 484,721 - R$ 1,148,453
Comprehensive income:Net income - - - - - - - 513,�30 - 513,�30
Unrealized gain on derivative instruments, net of taxes - - - - - - - - 6,411 6,411
Total Comprehensive income 519,641
Proceeds from public offering, net - - 7,7�5,811 �58,1�3 - - - - - �58,1�3
Issuance of preferred shares pursuant to employee stock option plan - - 703,579 17,�38 (15,099) - - - - �,139
Unpaid subscribed capital - - (57�,000) (1,739) - - - - - (1,739)
Deferred income taxes on public offering issuance costs, net - - - 5,458 - - - - - 5,458
Deferred compensation - - - - 4�8 (4�8) - - - -
Amortization of deferred compensation - - - - - 8,1�6 - - - 8,1�6
Dividends payable and interest on shareholders’ equity - - - - - - - (117,870) - (117,870)
Transfer to appropriated retained earnings - - - - - - �1,��5 (�1,��5) - -
bAlAnce At decembeR 31, 2005 109,448,497 R$ 41,500 85,952,136 R$ 843,714 R$ 34,634 R$ (2,361) R$ 39,577 R$ 858,856 R$ 6,411 R$ 1,822,331
Comprehensive income:Net income - - - - - - - 569,137 - 569,137
Change in fair value of derivative instruments, net of taxes - - - - - - - - (10,733) (10,733)
Total Comprehensive income 558,404
Paid-in subscribed capital (1,857,705) �,663,538 �,411 - - - - - �,411
Deferred compensation - - - - 4,641 (4,641) - - - -
Amortization of deferred compensation - - - - - 3,157 - - - 3,157
Dividends payable and interest on shareholders’ equity - - - - - - - (181,145) - (181,145)
bAlAnce At decembeR 31, 2006 107,590,792 R$ 41,500 88,615,674 R$ 846,125 R$ 39,275 R$ (3,845) R$ 39,577 R$ 1,246,848 R$ (4,322) R$ 2,205,158
See accompanying notes to consolidated financial statements.
cOnSOlidated StatementS OF
SharehOlderS’ eQuitY
YearS ended december 31, 2006, 2005 and 2004(in thOuSandS OF brazilian reaiS, excePt FOr Share inFOrmatiOn)
48 Financial StatementS gol AnnuAl RepoRt
common shares preferred shares
Additionalpaid-in capital
deferred compensation
Retained earnings Accumulated other
comprehensive income totalshares Amount shares Amount Appropriated unapropriated
bAlAnce At decembeR 31, 2003 116,200,000 R$ 41,500 52,592,985 R$ 94,200 - - R$ 5,579 R$ 173,460 - R$ 314,739
Net income - - - - - - - 384,710 - 384,710
Proceeds from public offering, net (6,751,503) - �5,501,761 459,185 - - - - - 459,185
Deferred income taxes on public offering issuance costs, net - - - 11,�49 - - - - - 11,�49
Tax benefit contributed by shareholders - - - - �9,188 - - - - �9,188
Deferred compensation - - - - �0,117 (�0,117) - - - -
Amortization of deferred compensation - - - - - 10,058 - - - 10,058
Dividends payable - - - - - - - (60,676) - (60,676)
Transfer to appropriated retained earnings - - - - - 1�,773 (1�,773) - -
bAlAnce At decembeR 31, 2004 109,448,497 R$ 41,500 78,094,746 R$ 564,634 R$ 49,305 R$ (10,059) R$ 18,352 R$ 484,721 - R$ 1,148,453
Comprehensive income:Net income - - - - - - - 513,�30 - 513,�30
Unrealized gain on derivative instruments, net of taxes - - - - - - - - 6,411 6,411
Total Comprehensive income 519,641
Proceeds from public offering, net - - 7,7�5,811 �58,1�3 - - - - - �58,1�3
Issuance of preferred shares pursuant to employee stock option plan - - 703,579 17,�38 (15,099) - - - - �,139
Unpaid subscribed capital - - (57�,000) (1,739) - - - - - (1,739)
Deferred income taxes on public offering issuance costs, net - - - 5,458 - - - - - 5,458
Deferred compensation - - - - 4�8 (4�8) - - - -
Amortization of deferred compensation - - - - - 8,1�6 - - - 8,1�6
Dividends payable and interest on shareholders’ equity - - - - - - - (117,870) - (117,870)
Transfer to appropriated retained earnings - - - - - - �1,��5 (�1,��5) - -
bAlAnce At decembeR 31, 2005 109,448,497 R$ 41,500 85,952,136 R$ 843,714 R$ 34,634 R$ (2,361) R$ 39,577 R$ 858,856 R$ 6,411 R$ 1,822,331
Comprehensive income:Net income - - - - - - - 569,137 - 569,137
Change in fair value of derivative instruments, net of taxes - - - - - - - - (10,733) (10,733)
Total Comprehensive income 558,404
Paid-in subscribed capital (1,857,705) �,663,538 �,411 - - - - - �,411
Deferred compensation - - - - 4,641 (4,641) - - - -
Amortization of deferred compensation - - - - - 3,157 - - - 3,157
Dividends payable and interest on shareholders’ equity - - - - - - - (181,145) - (181,145)
bAlAnce At decembeR 31, 2006 107,590,792 R$ 41,500 88,615,674 R$ 846,125 R$ 39,275 R$ (3,845) R$ 39,577 R$ 1,246,848 R$ (4,322) R$ 2,205,158
See accompanying notes to consolidated financial statements.
49

Financial StatementS under brgaap
gOl linhaS aéreaS inteligenteS S.a.
YearS ended at december 31, 2006 and 2005,with repOrt OF independent regiStered public accOunting Firm
Index
RepoRt of Independent RegIsteRed publIc AccountIng fIRm 51
AudIted fInAncIAl stAtements
Balance Sheets 52
Statements of Income 54
Statements of Shareholders’ Equity 55
Statements of Changes in Financial Position 56
APPENDIX I - Cash Flow Statements 57
APPENDIX II - Value Added Statements 58
APPENDIX III - Environmental And Social Nature Information Statement (Not Audited)
59
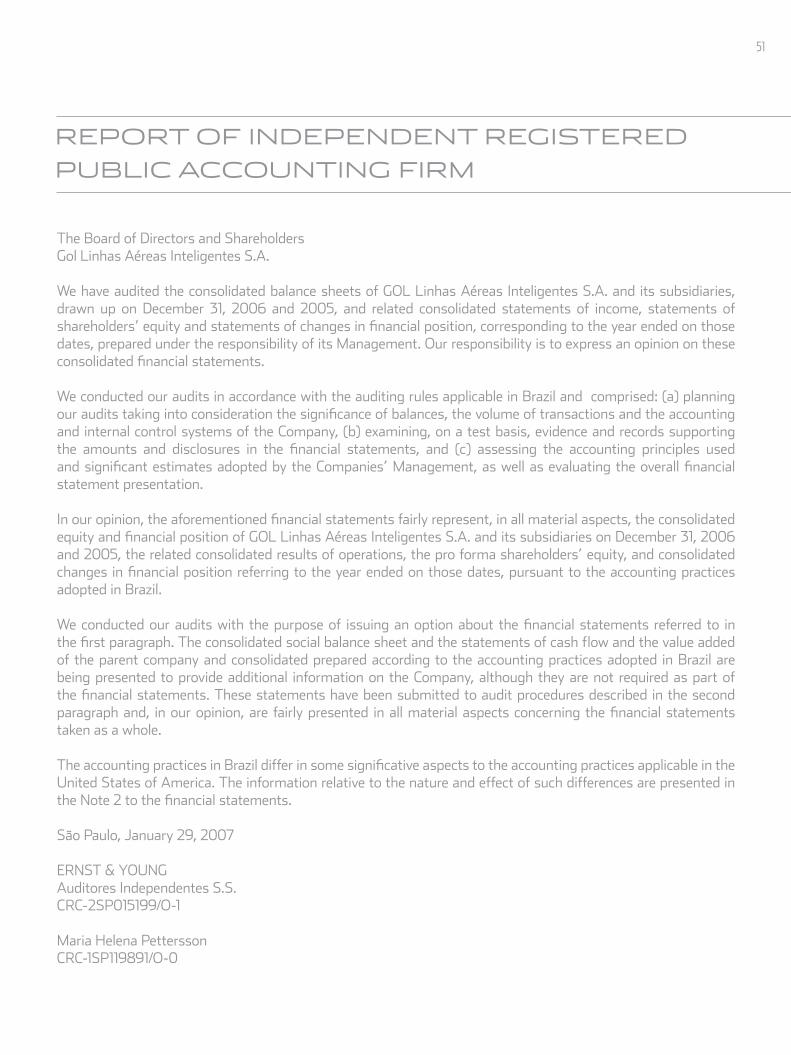
The Board of Directors and Shareholders Gol Linhas Aéreas Inteligentes S.A.
We have audited the consolidated balance sheets of GOL Linhas Aéreas Inteligentes S.A. and its subsidiaries, drawn up on December 31, 2006 and 2005, and related consolidated statements of income, statements of shareholders’ equity and statements of changes in financial position, corresponding to the year ended on those dates, prepared under the responsibility of its Management. Our responsibility is to express an opinion on these consolidated financial statements.
We conducted our audits in accordance with the auditing rules applicable in Brazil and comprised: (a) planning our audits taking into consideration the significance of balances, the volume of transactions and the accounting and internal control systems of the Company, (b) examining, on a test basis, evidence and records supporting the amounts and disclosures in the financial statements, and (c) assessing the accounting principles used and significant estimates adopted by the Companies’ Management, as well as evaluating the overall financial statement presentation.
In our opinion, the aforementioned financial statements fairly represent, in all material aspects, the consolidated equity and financial position of GOL Linhas Aéreas Inteligentes S.A. and its subsidiaries on December 31, 2006 and 2005, the related consolidated results of operations, the pro forma shareholders’ equity, and consolidated changes in financial position referring to the year ended on those dates, pursuant to the accounting practices adopted in Brazil.
We conducted our audits with the purpose of issuing an option about the financial statements referred to in the first paragraph. The consolidated social balance sheet and the statements of cash flow and the value added of the parent company and consolidated prepared according to the accounting practices adopted in Brazil are being presented to provide additional information on the Company, although they are not required as part of the financial statements. These statements have been submitted to audit procedures described in the second paragraph and, in our opinion, are fairly presented in all material aspects concerning the financial statements taken as a whole.
The accounting practices in Brazil differ in some significative aspects to the accounting practices applicable in the United States of America. The information relative to the nature and effect of such differences are presented in the Note 2 to the financial statements.
São Paulo, January 29, 2007
ERNST & YOUNGAuditores Independentes S.S.CRC-2SP015199/O-1
Maria Helena PetterssonCRC-1SP119891/O-0
repOrt OF independent regiStered
public accOunting Firm
51
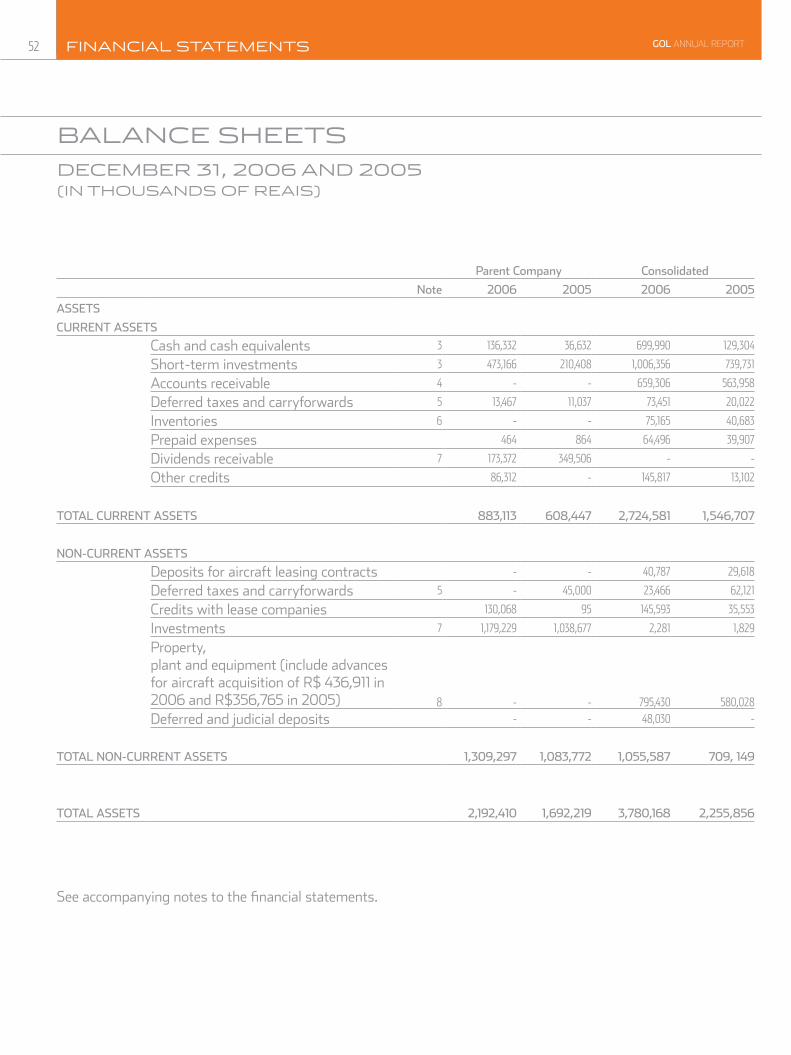
parent company consolidated
note 2006 2005 2006 2005
Assets
cuRRent Assets
Cash and cash equivalents 3 136,332 36,632 699,990 129,304
Short-term investments 3 473,166 210,408 1,006,356 739,731
Accounts receivable 4 - - 659,306 563,958
Deferred taxes and carryforwards 5 13,467 11,037 73,451 20,022
Inventories 6 - - 75,165 40,683
Prepaid expenses 464 864 64,496 39,907
Dividends receivable 7 173,372 349,506 - -
Other credits 86,312 - 145,817 13,102
totAl cuRRent Assets 883,113 608,447 2,724,581 1,546,707
non-cuRRent Assets
Deposits for aircraft leasing contracts - - 40,787 29,618
Deferred taxes and carryforwards 5 - 45,000 23,466 62,121
Credits with lease companies 130,068 95 145,593 35,553
Investments 7 1,179,229 1,038,677 2,281 1,829
Property, plant and equipment (include advances for aircraft acquisition of R$ 436,911 in 2006 and R$356,765 in 2005) 8 - - 795,430 580,028
Deferred and judicial deposits - - 48,030 -
totAl non-cuRRent Assets 1,309,297 1,083,772 1,055,587 709, 149
totAl Assets 2,192,410 1,692,219 3,780,168 2,255,856
See accompanying notes to the financial statements.
balance SheetS
december 31, 2006 and 2005(in thOuSandS OF reaiS)
Financial StatementS gol AnnuAl report52
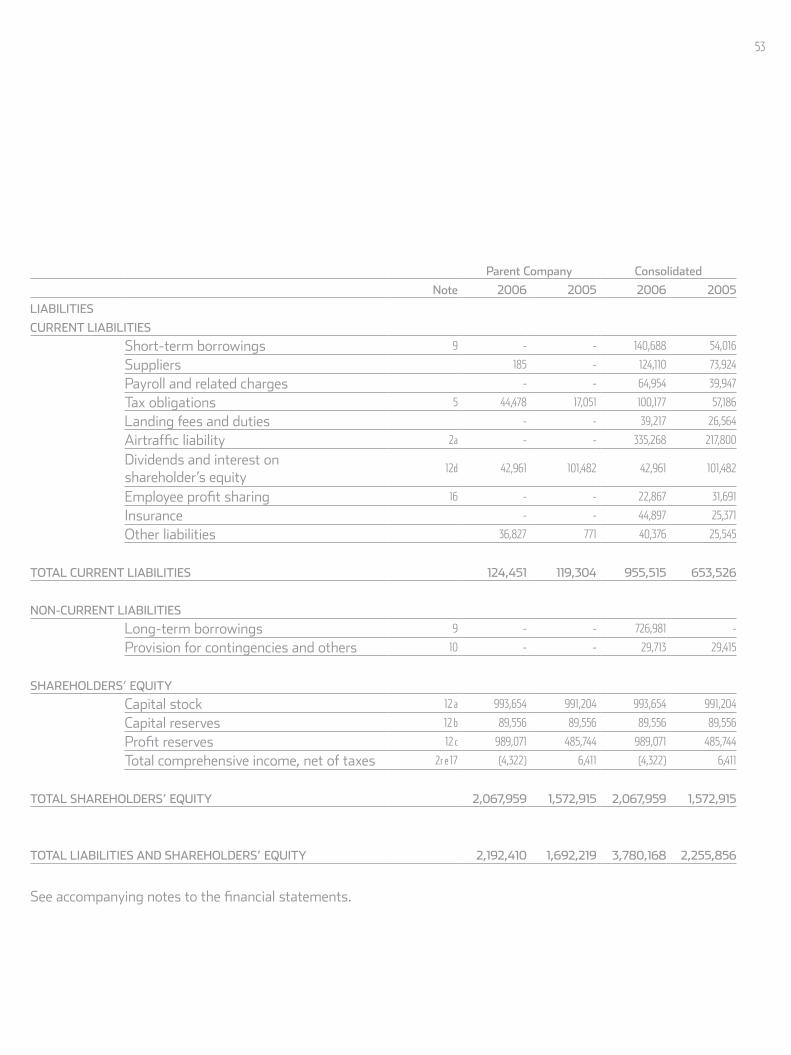
parent company consolidated
note 2006 2005 2006 2005
lIAbIlItIes
cuRRent lIAbIlItIes
Short-term borrowings 9 - - 140,688 54,016
Suppliers 185 - 124,110 73,924
Payroll and related charges - - 64,954 39,947
Tax obligations 5 44,478 17,051 100,177 57,186
Landing fees and duties - - 39,217 26,564
Airtraffic liability 2a - - 335,268 217,800
Dividends and interest onshareholder’s equity
12d 42,961 101,482 42,961 101,482
Employee profit sharing 16 - - 22,867 31,691
Insurance - - 44,897 25,371
Other liabilities 36,827 771 40,376 25,545
totAl cuRRent lIAbIlItIes 124,451 119,304 955,515 653,526
non-cuRRent lIAbIlItIes
Long-term borrowings 9 - - 726,981 -
Provision for contingencies and others 10 - - 29,713 29,415
shAReholdeRs’ equIty
Capital stock 12 a 993,654 991,204 993,654 991,204
Capital reserves 12 b 89,556 89,556 89,556 89,556
Profit reserves 12 c 989,071 485,744 989,071 485,744
Total comprehensive income, net of taxes 2r e 17 (4,322) 6,411 (4,322) 6,411
totAl shAReholdeRs’ equIty 2,067,959 1,572,915 2,067,959 1,572,915
totAl lIAbIlItIes And shAReholdeRs’ equIty 2,192,410 1,692,219 3,780,168 2,255,856
See accompanying notes to the financial statements.
53

parent company consolidated note 2006 2005 2006 2005
gRoss opeRAtIng RevenuePassenger 2a - - 3,722,046 2,642,699Cargo 2a - - 126,096 78,599Others - - 103,716 56,786 - - 3,951,858 2,778,084
Income taxes and contributions - - (149,841) (108,994)Net operating revenues - - 3,802,017 2,669,090Cost of services rendered 13 - - (2,577,111) (1,745,565)
gRoss pRofIt - - 1,224,906 923,525
opeRAtIng expenses (Income)Commercial expenses 13 - - (414,597) (335,722)Administrative expenses 13 (8,664) (1,733) (201,367) (77,341)Interest expenses 14 (135,128) (127,661) (256,565) (219,072)Interest income 14 238,201 31,518 399,376 185,730Others income 48,665 - - - 143,074 (97,876) (473,153) (446,405)
Results of equity interestEquity accounting 536,315 375,429 - -
Non-operating results 8 - - 98,071 -
Income befoRe Income tAx And socIAl contRIbutIon 679,389 277,553 849,824 477,120
Income tax and social contribution 5 (118,804) 33,278 (289,239) (166,289)
Income befoRe ReveRsAl of InteRest on shAReholdeR´s equIty 12 a 560,585 310,831 560,585 310,831
Reversal of interest on shareholder’s equity
12 123,887 113,670 123,887 113,670
net Income 684,472 424,501 684,472 424,501Number of outstanding shares on thebalance sheet date 196,206,466 195,972,633 196,206,466 195,972,633
eARnIngs peR shARe (R$) 3.49 2.17 3.49 2.17
See accompanying notes to the financial statements.
StatementS OF incOme
YearS ended On december 31, 2006 and 2005(in thOuSandS OF reaiS, except per Share prOFit)
Financial StatementS gol AnnuAl report54

capital stock capital reserves Profit reserves
subscribedcapital
unrealized capital
taxincentives
subsidiary’s special goodwill
reservelegal
reserveReinvestment
reserve
Accumulated other
comprehensive income
Retainedearnings total
bAlAnce on decembeR 31, 2004 719,474 - 60,369 29,187 11,990 167,123 - - 988,143
Capital increase on April 27, 2005
193,890 - - - - - - - 193,890
Capital increase on May 2, 2005
77,440 - - - - - - - 77,440
Capital increase on October 25, 2005
400 - - - - - - - 400
Capital increase on December 21, 2005
1,739 (1,739) - - - - - - -
Total comprehensive income, net of taxes
- - - - - - 6,411 - 6,411
Net income - - - - - - - 424,501 424,501Proposed profit allocation:
Legal reserve - - - - 21,225 - - (21,225) -Dividends and interest on own capital
- - - - - - - (117,870) (117,870)
Reinvestment reserve
- - - - - 285,406 - (285,406) -
bAlAnce on decembeR 31, 2005 992,943 (1,739) 60,369 29,187 33,215 452,529 6,411 - 1,572,915
Realized capital increase 711 1,739 - - - - - - 2,450Total comprehensive income, net of taxes
- - - - - - (10,733) - (10,733)
Net income - - - - - - - 684,472 684,472Proposed profit allocation:
Legal reserve - - - - 34,224 - - (34,224) -Dividends and interest onown capital
- - - - - - - (181,145) (181,145)
Reinvestment reserve
- - - - - 469,103 - (469,103) -
bAlAnce on decembeR 31, 2006 993,654 - 60,369 29,187 67,439 921,632 (4,322) - 2,067,959
See accompanying notes to the financial statements.
StatementS OF
SharehOlderS’ eQuitY
YearS ended On december 31, 2006 and 2005 (in thOuSandS OF reaiS)
55
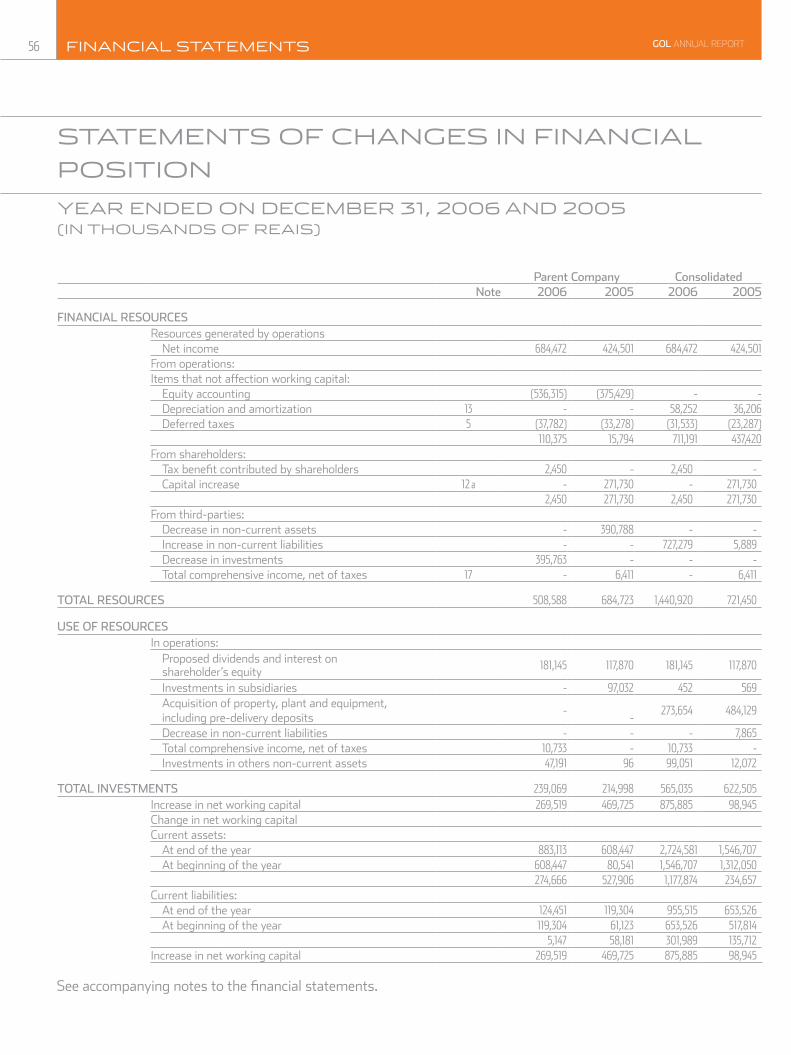
parent company consolidatednote 2006 2005 2006 2005
fInAncIAl ResouRcesResources generated by operations
Net income 684,472 424,501 684,472 424,501From operations:Items that not affection working capital:
Equity accounting (536,315) (375,429) - -Depreciation and amortization 13 - - 58,252 36,206Deferred taxes 5 (37,782) (33,278) (31,533) (23,287)
110,375 15,794 711,191 437,420From shareholders:
Tax benefit contributed by shareholders 2,450 - 2,450 -Capital increase 12 a - 271,730 - 271,730
2,450 271,730 2,450 271,730From third-parties:
Decrease in non-current assets - 390,788 - -Increase in non-current liabilities - - 727,279 5,889Decrease in investments 395,763 - - -Total comprehensive income, net of taxes 17 - 6,411 - 6,411
totAl ResouRces 508,588 684,723 1,440,920 721,450
use of ResouRcesIn operations:
Proposed dividends and interest on shareholder’s equity 181,145 117,870 181,145 117,870
Investments in subsidiaries - 97,032 452 569Acquisition of property, plant and equipment, including pre-delivery deposits
--
273,654 484,129
Decrease in non-current liabilities - - - 7,865Total comprehensive income, net of taxes 10,733 - 10,733 -Investments in others non-current assets 47,191 96 99,051 12,072
totAl Investments 239,069 214,998 565,035 622,505Increase in net working capital 269,519 469,725 875,885 98,945Change in net working capitalCurrent assets:
At end of the year 883,113 608,447 2,724,581 1,546,707At beginning of the year 608,447 80,541 1,546,707 1,312,050
274,666 527,906 1,177,874 234,657Current liabilities:
At end of the year 124,451 119,304 955,515 653,526At beginning of the year 119,304 61,123 653,526 517,814
5,147 58,181 301,989 135,712Increase in net working capital 269,519 469,725 875,885 98,945
See accompanying notes to the financial statements.
StatementS OF changeS in Financial
pOSitiOn
Year ended On december 31, 2006 and 2005(in thOuSandS OF reaiS)
56 Financial StatementS gol AnnuAl report
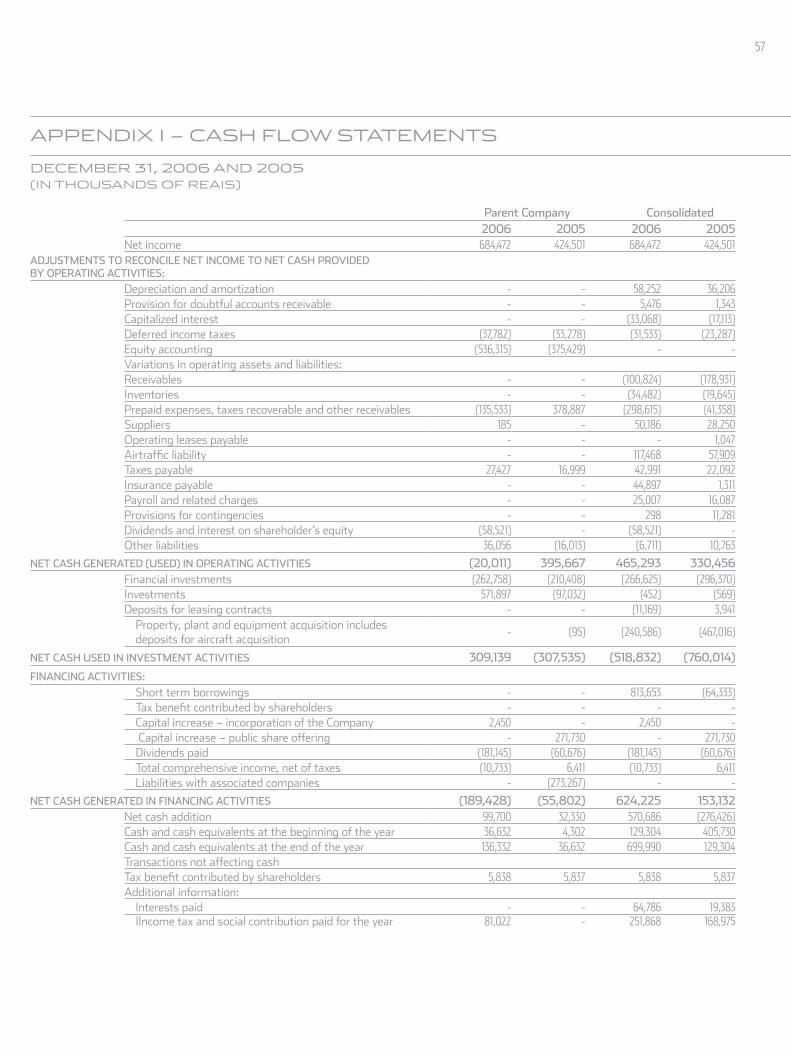
appendix i – caSh FlOw StatementS
parent company consolidated2006 2005 2006 2005
Net income 684,472 424,501 684,472 424,501Adjustments to ReconcIle net Income to net cAsh pRovIded by opeRAtIng ActIvItIes:
Depreciation and amortization - - 58,252 36,206Provision for doubtful accounts receivable - - 5,476 1,343Capitalized interest - - (33,068) (17,113)Deferred income taxes (37,782) (33,278) (31,533) (23,287)Equity accounting (536,315) (375,429) - -Variations in operating assets and liabilities:Receivables - - (100,824) (178,931)Inventories - - (34,482) (19,645)Prepaid expenses, taxes recoverable and other receivables (135,533) 378,887 (298,615) (41,358)Suppliers 185 - 50,186 28,250Operating leases payable - - - 1,047Airtraffic liability - - 117,468 57,909Taxes payable 27,427 16,999 42,991 22,092Insurance payable - - 44,897 1,311Payroll and related charges - - 25,007 16,087Provisions for contingencies - - 298 11,281Dividends and interest on shareholder’s equity (58,521) - (58,521) -Other liabilities 36,056 (16,013) (6,711) 10,763
net cAsh geneRAted (used) In opeRAtIng ActIvItIes (20,011) 395,667 465,293 330,456Financial investments (262,758) (210,408) (266,625) (296,370)Investments 571,897 (97,032) (452) (569)Deposits for leasing contracts - - (11,169) 3,941
Property, plant and equipment acquisition includes deposits for aircraft acquisition
- (95) (240,586) (467,016)
net cAsh used In Investment ActIvItIes 309,139 (307,535) (518,832) (760,014)
fInAncIng ActIvItIes:
Short term borrowings - - 813,653 (64,333)Tax benefit contributed by shareholders - - - -Capital increase – incorporation of the Company 2,450 - 2,450 - Capital increase – public share offering - 271,730 - 271,730Dividends paid (181,145) (60,676) (181,145) (60,676)Total comprehensive income, net of taxes (10,733) 6,411 (10,733) 6,411Liabilities with associated companies - (273,267) - -
net cAsh geneRAted In fInAncIng ActIvItIes (189,428) (55,802) 624,225 153,132Net cash addition 99,700 32,330 570,686 (276,426)Cash and cash equivalents at the beginning of the year 36,632 4,302 129,304 405,730Cash and cash equivalents at the end of the year 136,332 36,632 699,990 129,304 Transactions not affecting cashTax benefit contributed by shareholders 5,838 5,837 5,838 5,837Additional information:
Interests paid - - 64,786 19,383IIncome tax and social contribution paid for the year 81,022 - 251,868 168,975
december 31, 2006 and 2005(in thOuSandS OF reaiS)
57
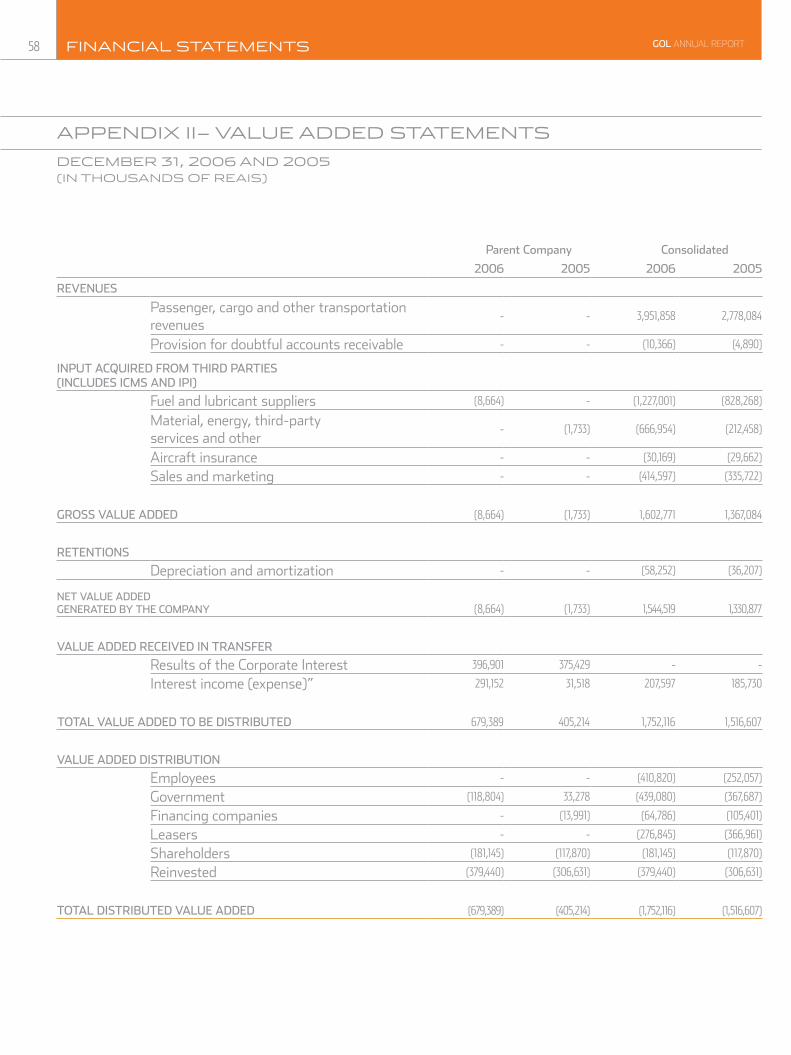
parent company consolidated
2006 2005 2006 2005
REVENUES
Passenger, cargo and other transportation revenues
- - 3,951,858 2,778,084
Provision for doubtful accounts receivable - - (10,366) (4,890)
Input AcquIRed fRom thIRd pARtIes (Includes Icms And IpI)
Fuel and lubricant suppliers (8,664) - (1,227,001) (828,268)
Material, energy, third-party services and other
- (1,733) (666,954) (212,458)
Aircraft insurance - - (30,169) (29,662)
Sales and marketing - - (414,597) (335,722)
gRoss vAlue Added (8,664) (1,733) 1,602,771 1,367,084
RetentIons
Depreciation and amortization - - (58,252) (36,207)
net vAlue Added geneRAted by the compAny (8,664) (1,733) 1,544,519 1,330,877
vAlue Added ReceIved In tRAnsfeR
Results of the Corporate Interest 396,901 375,429 - -
Interest income (expense)” 291,152 31,518 207,597 185,730
totAl vAlue Added to be dIstRIbuted 679,389 405,214 1,752,116 1,516,607
vAlue Added dIstRIbutIon
Employees - - (410,820) (252,057)
Government (118,804) 33,278 (439,080) (367,687)
Financing companies - (13,991) (64,786) (105,401)
Leasers - - (276,845) (366,961)
Shareholders (181,145) (117,870) (181,145) (117,870)
Reinvested (379,440) (306,631) (379,440) (306,631)
totAl dIstRIbuted vAlue Added (679,389) (405,214) (1,752,116) (1,516,607)
appendix ii– Value added StatementS
december 31, 2006 and 2005(in thOuSandS OF reaiS)
58 Financial StatementS gol AnnuAl report
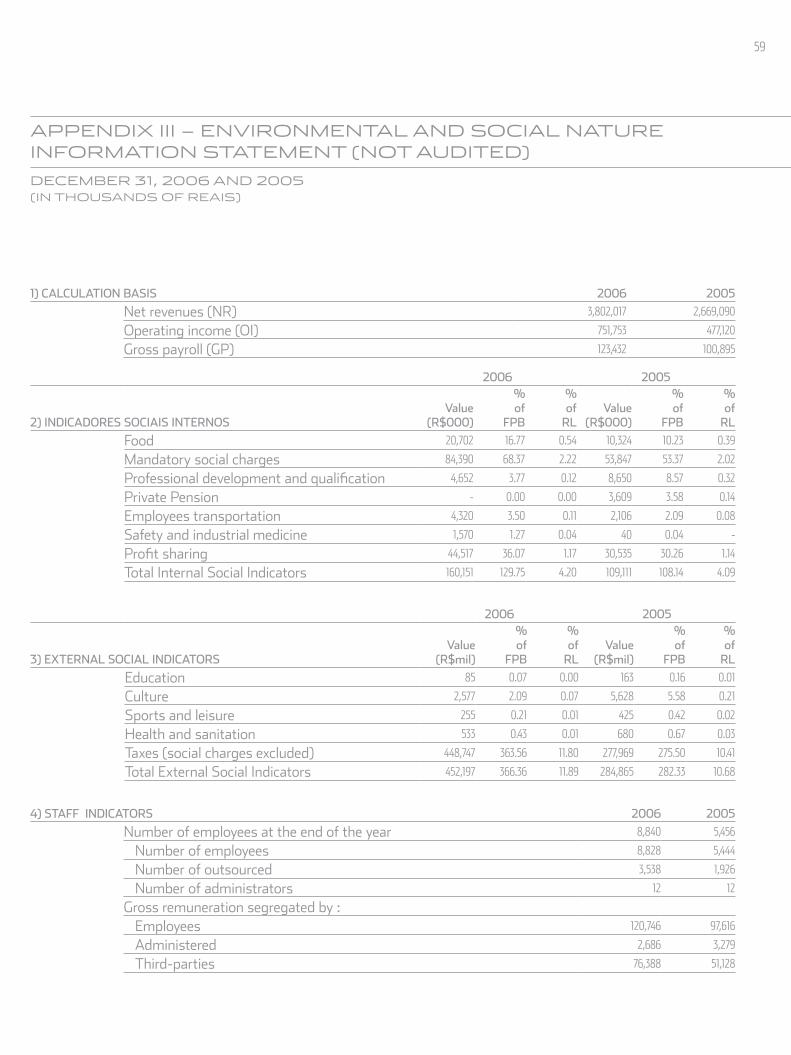
1) cAlculAtIon bAsIs 2006 2005
Net revenues (NR) 3,802,017 2,669,090
Operating income (OI) 751,753 477,120
Gross payroll (GP) 123,432 100,895
2006 2005
2) IndIcAdoRes socIAIs InteRnosvalue
(R$000)
% of
fpb
% of
Rlvalue
(R$000)
% of
fpb
% of
Rl
Food 20,702 16.77 0.54 10,324 10.23 0.39
Mandatory social charges 84,390 68.37 2.22 53,847 53.37 2.02
Professional development and qualification 4,652 3.77 0.12 8,650 8.57 0.32
Private Pension - 0.00 0.00 3,609 3.58 0.14
Employees transportation 4,320 3.50 0.11 2,106 2.09 0.08
Safety and industrial medicine 1,570 1.27 0.04 40 0.04 -
Profit sharing 44,517 36.07 1.17 30,535 30.26 1.14
Total Internal Social Indicators 160,151 129.75 4.20 109,111 108.14 4.09
appendix iii – enVirOnmental and SOcial natureinFOrmatiOn Statement (nOt audited)
december 31, 2006 and 2005(in thOuSandS OF reaiS)
4) stAff IndIcAtoRs 2006 2005
Number of employees at the end of the year 8,840 5,456
Number of employees 8,828 5,444
Number of outsourced 3,538 1,926
Number of administrators 12 12
Gross remuneration segregated by :Employees 120,746 97,616
Administered 2,686 3,279
Third-parties 76,388 51,128
2006 2005
3) exteRnAl socIAl IndIcAtoRsvalue
(R$mil)
% of
fpb
% of
Rlvalue
(R$mil)
% of
fpb
% ofRl
Education 85 0.07 0.00 163 0.16 0.01
Culture 2,577 2.09 0.07 5,628 5.58 0.21
Sports and leisure 255 0.21 0.01 425 0.42 0.02
Health and sanitation 533 0.43 0.01 680 0.67 0.03
Taxes (social charges excluded) 448,747 363.56 11.80 277,969 275.50 10.41
Total External Social Indicators 452,197 366.36 11.89 284,865 282.33 10.68
59
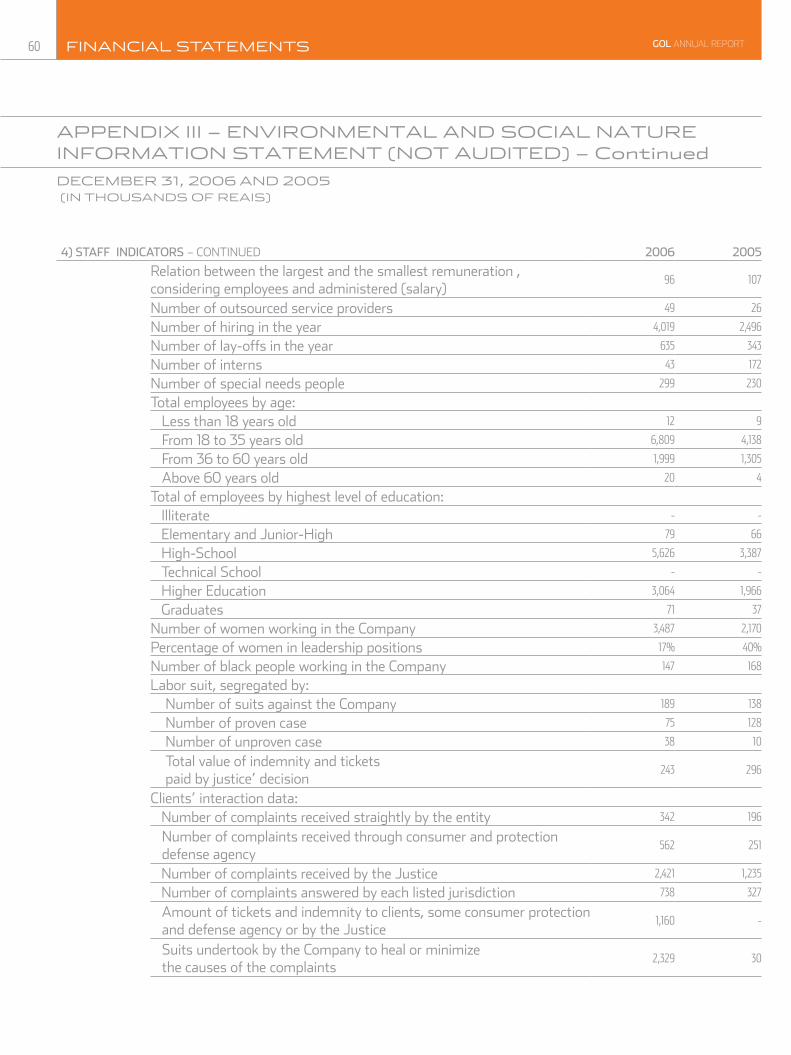
4) stAff IndIcAtoRs – CONTINUED 2006 2005
Relation between the largest and the smallest remuneration , considering employees and administered (salary)
96 107
Number of outsourced service providers 49 26
Number of hiring in the year 4,019 2,496
Number of lay-offs in the year 635 343
Number of interns 43 172
Number of special needs people 299 230
Total employees by age:Less than 18 years old 12 9
From 18 to 35 years old 6,809 4,138
From 36 to 60 years old 1,999 1,305
Above 60 years old 20 4
Total of employees by highest level of education: Illiterate - -
Elementary and Junior-High 79 66
High-School 5,626 3,387
Technical School - -
Higher Education 3,064 1,966
Graduates 71 37
Number of women working in the Company 3,487 2,170
Percentage of women in leadership positions 17% 40%
Number of black people working in the Company 147 168
Labor suit, segregated by: Number of suits against the Company 189 138
Number of proven case 75 128
Number of unproven case 38 10
Total value of indemnity and tickets paid by justice’ decision
243 296
Clients’ interaction data: Number of complaints received straightly by the entity 342 196
Number of complaints received through consumer and protectiondefense agency
562 251
Number of complaints received by the Justice 2,421 1,235
Number of complaints answered by each listed jurisdiction 738 327
Amount of tickets and indemnity to clients, some consumer protectionand defense agency or by the Justice
1,160 -
Suits undertook by the Company to heal or minimize the causes of the complaints
2,329 30
appendix iii – enVirOnmental and SOcial nature inFOrmatiOn Statement (nOt audited) – continued
december 31, 2006 and 2005 (in thOuSandS OF reaiS)
60 Financial StatementS gol AnnuAl report

4) stAff IndIcAtoRs – CONTINUED 2006 2005
Relation between the largest and the smallest remuneration , considering employees and administered (salary)
96 107
Number of outsourced service providers 49 26
Number of hiring in the year 4,019 2,496
Number of lay-offs in the year 635 343
Number of interns 43 172
Number of special needs people 299 230
Total employees by age:Less than 18 years old 12 9
From 18 to 35 years old 6,809 4,138
From 36 to 60 years old 1,999 1,305
Above 60 years old 20 4
Total of employees by highest level of education: Illiterate - -
Elementary and Junior-High 79 66
High-School 5,626 3,387
Technical School - -
Higher Education 3,064 1,966
Graduates 71 37
Number of women working in the Company 3,487 2,170
Percentage of women in leadership positions 17% 40%
Number of black people working in the Company 147 168
Labor suit, segregated by: Number of suits against the Company 189 138
Number of proven case 75 128
Number of unproven case 38 10
Total value of indemnity and tickets paid by justice’ decision
243 296
Clients’ interaction data: Number of complaints received straightly by the entity 342 196
Number of complaints received through consumer and protectiondefense agency
562 251
Number of complaints received by the Justice 2,421 1,235
Number of complaints answered by each listed jurisdiction 738 327
Amount of tickets and indemnity to clients, some consumer protectionand defense agency or by the Justice
1,160 -
Suits undertook by the Company to heal or minimize the causes of the complaints
2,329 30
4) stAff IndIcAtoRs – CONTINUED 2006 2005
EnvironmentInvestments and expenses for the maintenance of operating process to improve the environment
175 146
Investments and expenses with the preservation and/or recovery of ruined environments
- 50
Amount of environmental , administrative and legal processes against the Company
- -
Value of tickets and indemnities concerning environmental material,determined administrative and/or legally.
- -
Liabilities and environmental contingencies - -
5) RelevAnt IndIcAtoRs RegARdIng the coRpoRAte cItIzenshIp pRActIce In 2006 And 2005
2006 2005
Total number of job related accidents 110 23
The social and environmental projects developed by the Company were defined by its:
( ) ( X ) ( )
officersofficers and
managersall
employees
The work environment health and safety standards were defined by its :
( ) ( X ) ( )
officersofficers and
managersall
employees
61
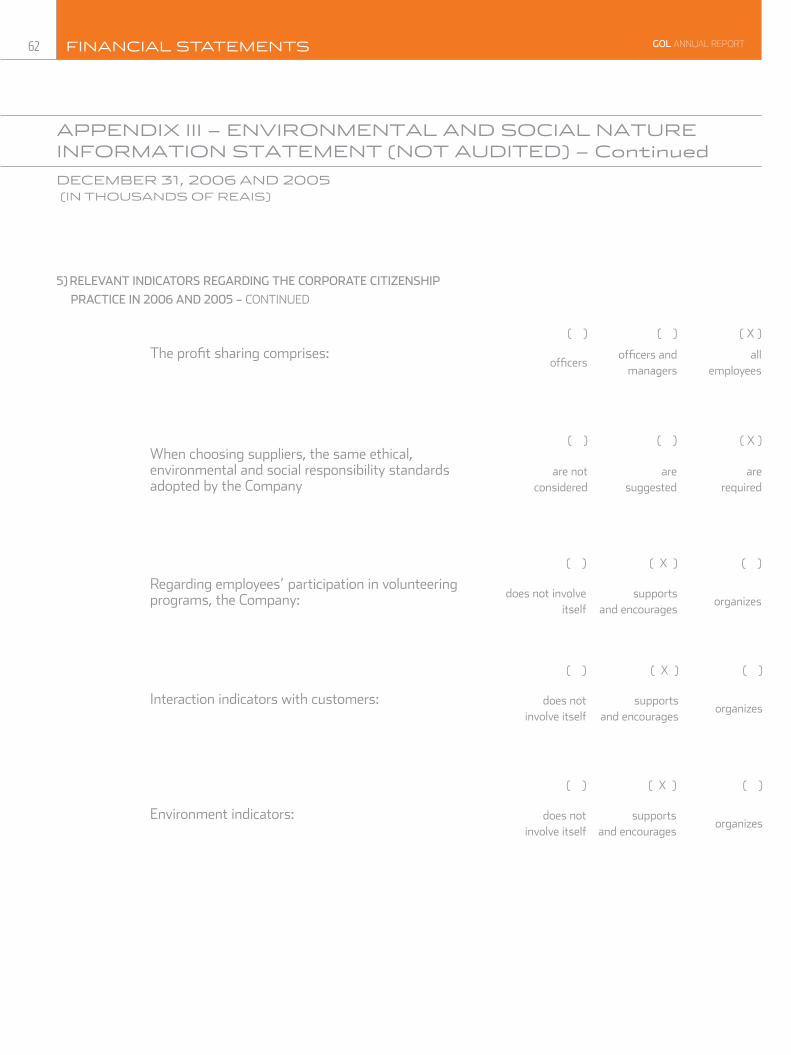
appendix iii – enVirOnmental and SOcial natureinFOrmatiOn Statement (nOt audited) – continued
december 31, 2006 and 2005 (in thOuSandS OF reaiS)
5) RelevAnt IndIcAtoRs RegARdIng the coRpoRAte cItIzenshIp
pRActIce In 2006 And 2005 – CONTINUED
The profit sharing comprises:( ) ( ) ( X )
officersofficers and
managersall
employees
When choosing suppliers, the same ethical, environmental and social responsibility standards adopted by the Company
( ) ( ) ( X )
are not considered
are suggested
are required
Regarding employees’ participation in volunteering programs, the Company:
( ) ( X ) ( )
does not involve itself
supports and encourages
organizes
Interaction indicators with customers:
( ) ( X ) ( )
does not involve itself
supports and encourages
organizes
Environment indicators:
( ) ( X ) ( )
does not involve itself
supports and encourages
organizes
62 Financial StatementS gol AnnuAl report