2006-2007 vra professional status survey preliminary results delivered at 2007 vra conference,...
TRANSCRIPT

2006-2007 VRA PROFESSIONAL STATUS SURVEYPreliminary Results Delivered at 2007 VRA Conference, Kansas City
The PowerPoint slides included here were presented at the VRA Conference at Kansas City in March 2007. They reflect the raw data gathered by the 2006-2007 VRA Professional Status Survey and are subject to change with future analysis. Comparative data from previous surveys relevant to the visual resources profession has been included for comparison whenever possible throughout this presentation.
After a post-conference, post-spring semester hiatus the Professional Status Survey committee has resumed its work on the analysis and is currently in the process of making contact with a statistics professional. We will keep you informed of our activity as work progresses on this project. If you have questions regarding this data please feel free to contact either committee co-chair, Christine Hilker (chilker @ uark.edu) or Margaret Webster ([email protected]).
A big thank you to all of the members of the task force for their sustained and invaluable service in developing the survey. Co-Chairs:
Christine Hilker, University of Arkansas (chilker @ uark.edu)Margaret Webster, Cornell University ([email protected])
Current (2007) Task Force Members:Margo Ballantyne, Lewis and Clark College ([email protected])Jeanne Keefe, Rensselaer Polytechnic Institute ([email protected])Hildegard Lindschinger, Wilfrid Laurier University ([email protected])Lynda White, University of Virginia [Advisor]
2006 Task Force Members:Margo Ballantyne, Lewis and Clark CollegeJeanne Keefe, Rensselaer Polytechnic InstituteHildegard Lindschinger, Wilfrid Laurier UniversitySusan Jane Williams, Independent ConsultantAndrew Gessner, Metropolitan Museum of Art

2006-2007 Visual Resources Professional Status Survey
Preliminary Report
Christine Hilker, University of Arkansas&
Margaret N. Webster, Cornell University
Kansas City, 03/27/2007
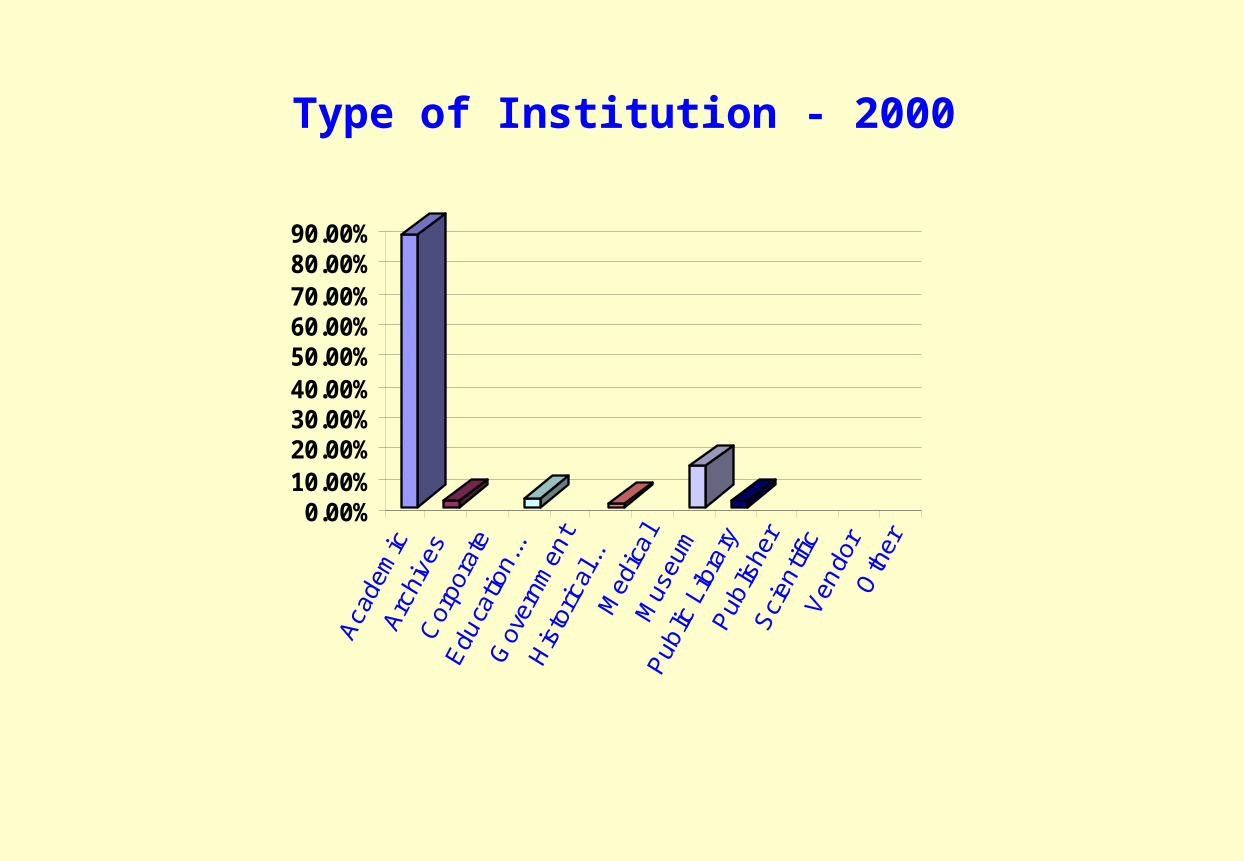
Type of Institution - 2000
0.00%10.00%20.00%30.00%40.00%50.00%60.00%70.00%80.00%90.00%

Type of Institution - 2007
0.00%
10.00%
20.00%
30.00%
40.00%
50.00%
60.00%
70.00%
80.00%
90.00%

Types of Institutions – VRA 2007 & 2000
0. 00%
10. 00%
20. 00%
30. 00%
40. 00%
50. 00%
60. 00%
70. 00%
80. 00%
90. 00%
20072000

Gender

Age Distribution - 2000

Age Distribution 2007

Age Distribution 2007 & 2000 Comparison

0
10
20
30
40
50
60
70
80
90
100
%
DEGREES ATTAINED
2007 2000
2007 75.1 44.6 9.5 0.7 41.4 5.3 10.9
2000 99 57 8 1 32 8 8
BA / BS / BFA MA / MS MFA MBA MLS PhD Other
0.00%
10.00%
20.00%
30.00%
40.00%
50.00%
60.00%
70.00%
80.00%
90.00%
100.00%
VRA - 2007ARLIS - 2004VRA - 2000
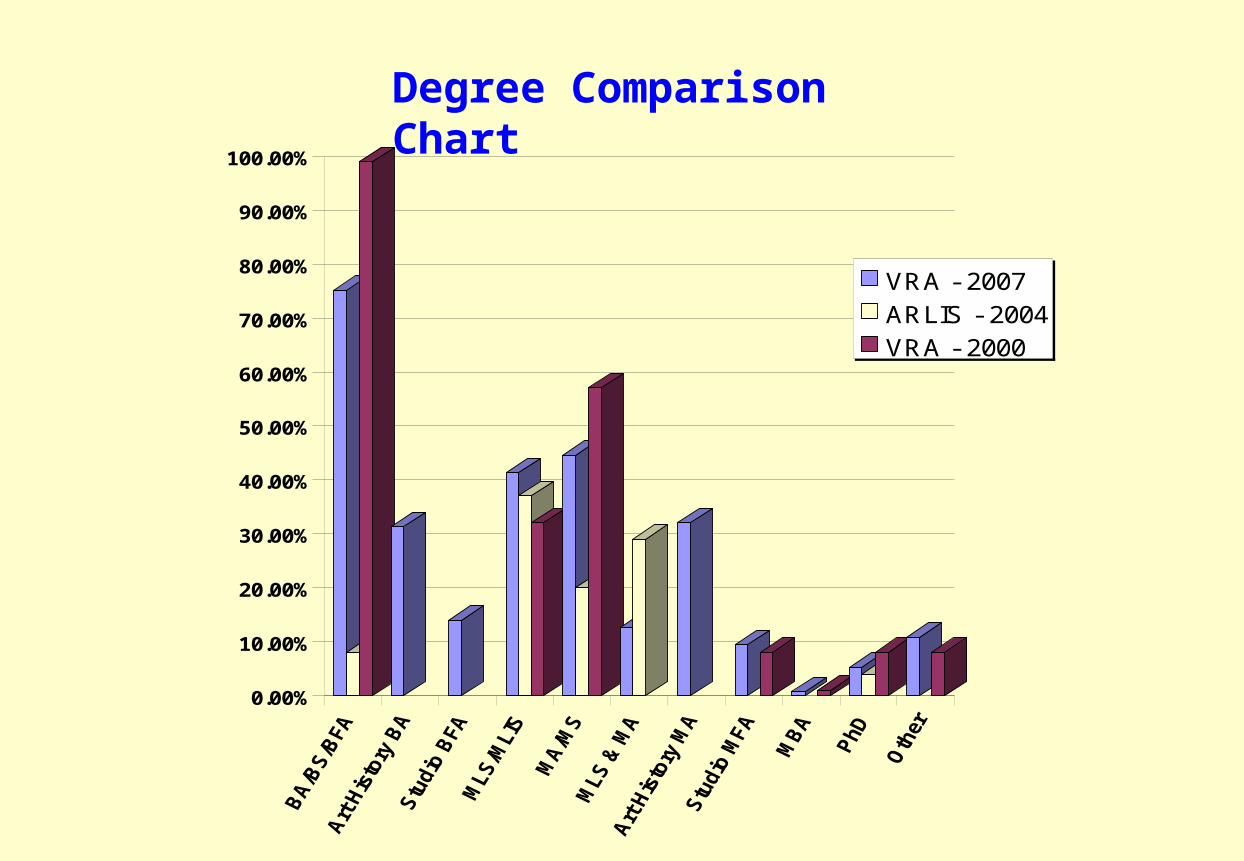
Degree Comparison Chart

Degree Comparisons
VRA - 2007 ARLIS - 2004 VRA - 2000
BA/BS/BFA 75.10%(Highest degree obtained)
8.00% 99.00%
Art History BA 31.38%
Studio BFA 14.00%
MLS/MLIS 41.40% 37.00% 32.00%
MA/MS 44.60% 20.00% 57.00%
MLS & MA 12.76% 29.00%
Art History MA 32.00%
Studio MFA 9.50% 8.00%
MBA 0.70% 1.00%
PhD 5.30% 4.00% 8.00%
Other 10.90% 8.00%


0
10
20
30
40
50
60
70
80
90
100
%
Technical Knowledge Acquired
2007
20002007 67.6 83.6 91.1 61.2 13.9 45.9 47.3 39.1
2000 56 75 54 0 0 0 41 0
Database Development
Database Management
Digital Imaging Image OpacDigital
RepositoriesWeb Course
SupportWebsite
DevelopmentWebsite
Management

0
10
20
30
40
50
60
70
80
90
100
%
Photography
2007
20002007 2.1 69 29.6 43 66.2 88.4 66.2
2000 0 97 90 94 0 0 0
NoneCopy
PhotographyDarkroom
PhotographyOriginal
PhotographyDigital
PhotpgraphyScanning
Post processing

Salary Comparison – VRA 2007 & 2000
0.00%
5.00%
10.00%
15.00%
20.00%
25.00%
30.00%
35.00%
40.00% VRA - 2007 8.30%
VRA - 2000 13.00%
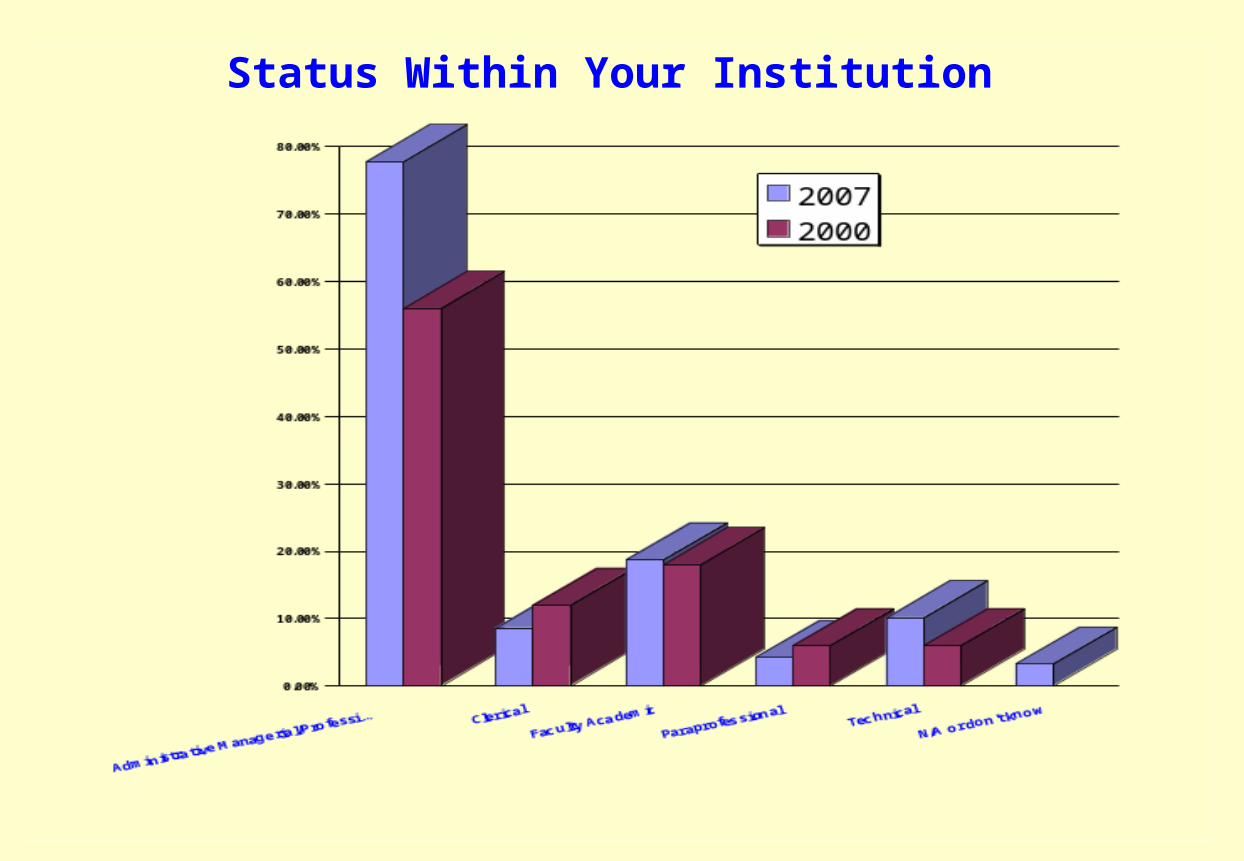
Status Within Your Institution

Years in Current Position
2007 2000
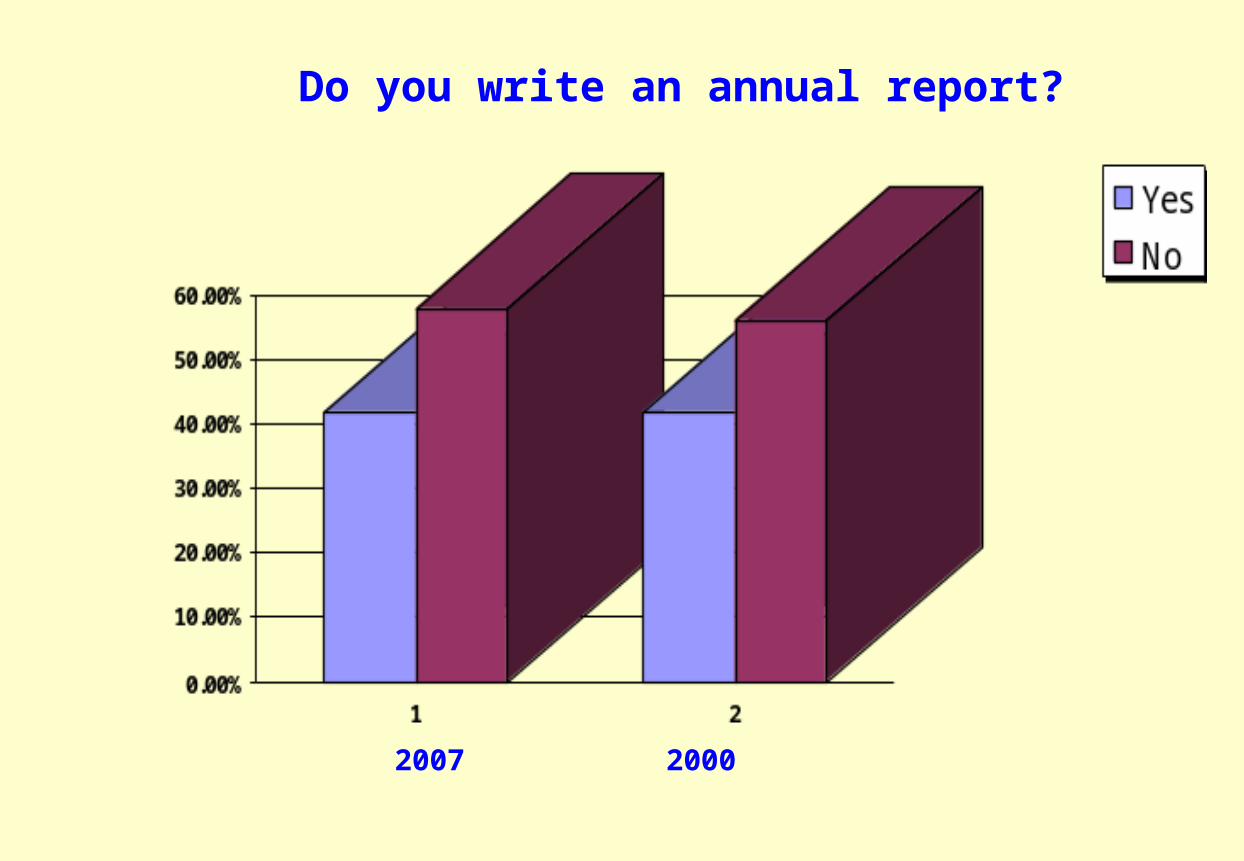
Do you write an annual report?

2007 2000
If not required, do you write an annual report?

If position upgraded in last 5 years, why?

2007 2000
Has your position changed in the last 5 years without a change in rank, grade, pay scale, etc?

0.00%
10.00%
20.00%
30.00%
40.00%
50.00%
60.00%
1
Computersupport/maint(general) for dept
Course image support(Blackboard,WebCT,web study pages.
Image OPAC (end-userdelivery system: LunaInsight, MDID, etc.)
Technical Job Responsibilities - 2007

Technical Job Responsibilities - 2007

Technical Job Responsibilities - 2007

Technical Job Responsibilities - 2007

None 2.20%
American Association of Museums 4.00%
American Library Association 13.60%
American Institute of Archeology 1.10%
American Institute of Architects 0.70%
Art Libraries Society of North America 40.10%
Art History Association 0.40%
Canadian Visual Resources Association 2.20%
Computers and the History of Art 0.40%
College Art Association 16.50%
Museum Computer Network 5.90%
Society of Architectural Historians 1.80%
Southeast College Art Conference 5.50%
Special Libraries Association 1.80%
Union (local/national) 1.80%
Visual Resources Association 88.60%
Other 18.00%
VRA and ARLIS/NA 32.06%
VRA and ALA 9.66%
VRA and ARLIS/NA and ALA 7.59%
VRA and CAA 7.59%
VRA and Canadian VR Curators 1.03%
Professional Organizations
VRA -2007
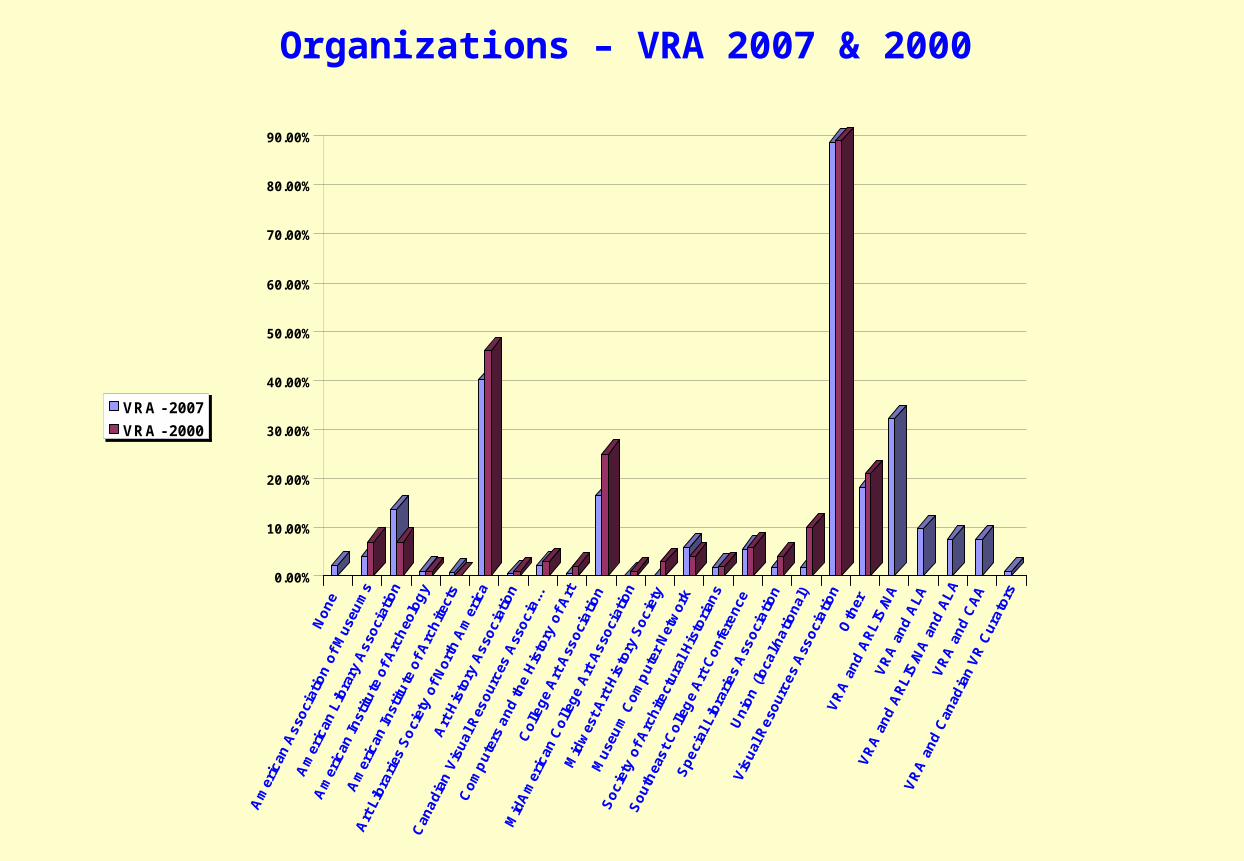
Organizations – VRA 2007 & 2000
0.00%
10.00%
20.00%
30.00%
40.00%
50.00%
60.00%
70.00%
80.00%
90.00%
VRA - 2007
VRA - 2000

Comparison of Major Professional Organizations - 2007
0. 00%
10. 00%
20. 00%
30. 00%
40. 00%
50. 00%
60. 00%
70. 00%
80. 00%
90. 00%

National Conference Attendance – VRA 2007 & 2000
0.00%
10.00%
20.00%
30.00%
40.00%
50.00%
60.00%
70.00%
80.00%
Yes No NA
VRA - 2007
VRA - 2000
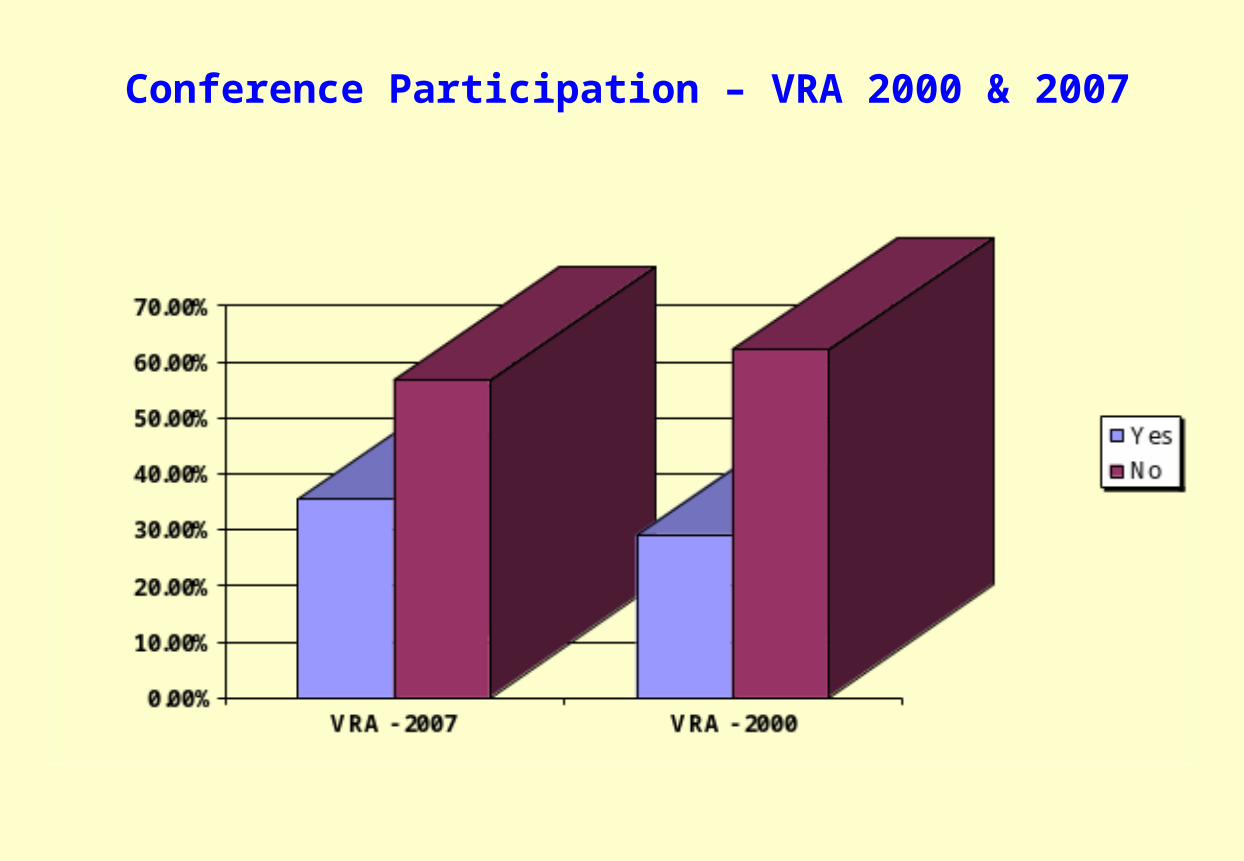
Conference Participation – VRA 2000 & 2007

Member of Committee of a Professional Organization VRA 2007 & 2000
0.00%
10.00%
20.00%
30.00%
40.00%
50.00%
60.00%
VRA - 2007 VRA - 2000
Yes
No
Served as Officer of a Professional Organization
VRA 2007 & 2000

Slide Acquisitions Stopped – When?
Not applicable
2007
2004
2002
2000
1998

0.00%
5.00%
10.00%
15.00%
20.00%
25.00%
30.00%
35.00%
40.00%
1
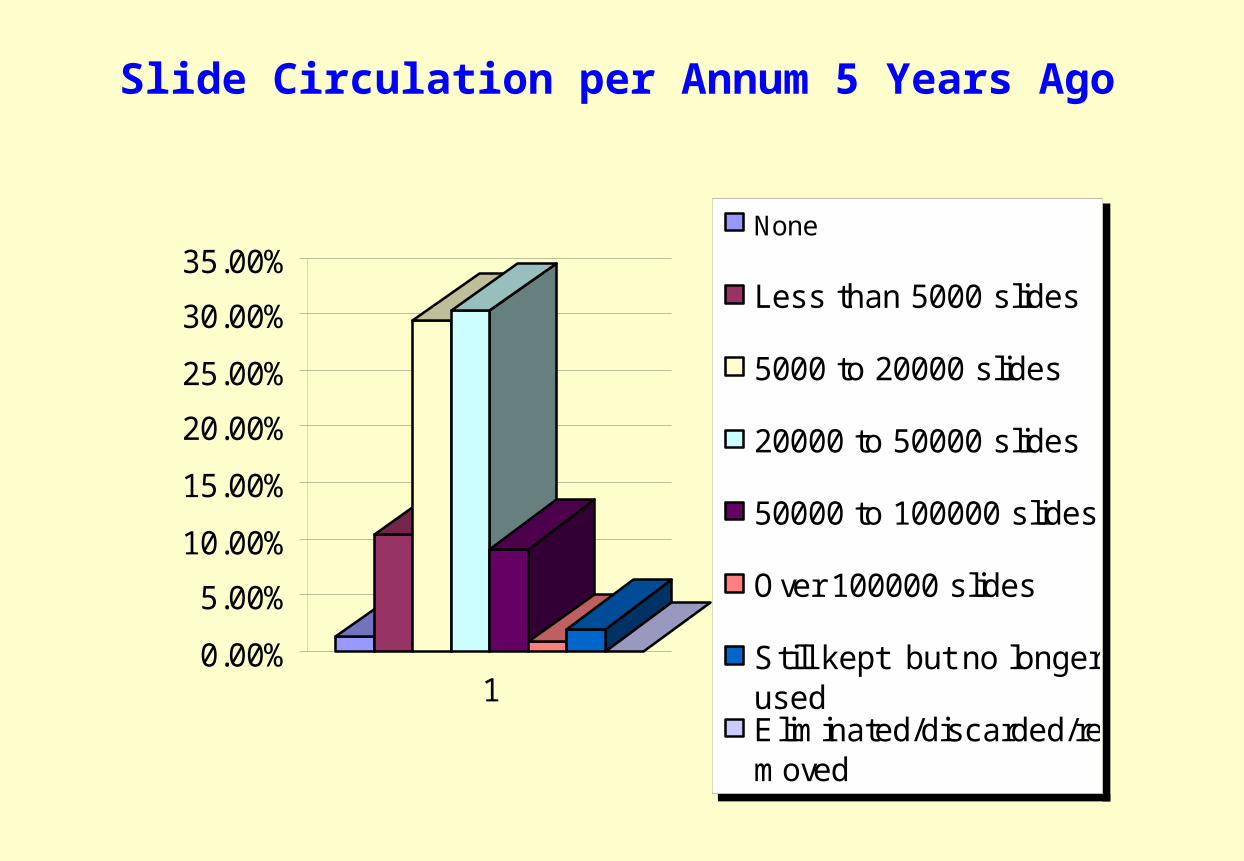
None
Less than 5000 slides
5000 to 20000 slides
20000 to 50000 slides
50000 to 100000 slides
Over 100000 slides
Still kept but no longerused
Eliminated/discarded/removed
Not applicable
Slide Circulation per Annum - 2007
0.00%
5.00%
10.00%
15.00%
20.00%
25.00%
30.00%
35.00%
1
None
Less than 5000 slides
5000 to 20000 slides
20000 to 50000 slides
50000 to 100000 slides
Over 100000 slides
Still kept but no longerusedEliminated/discarded/removed
Slide Circulation per Annum 5 Years Ago

Average Total Number of Items Circulated Per Year for the Last 5
Years
(VRA Survey of 2000)
32,555
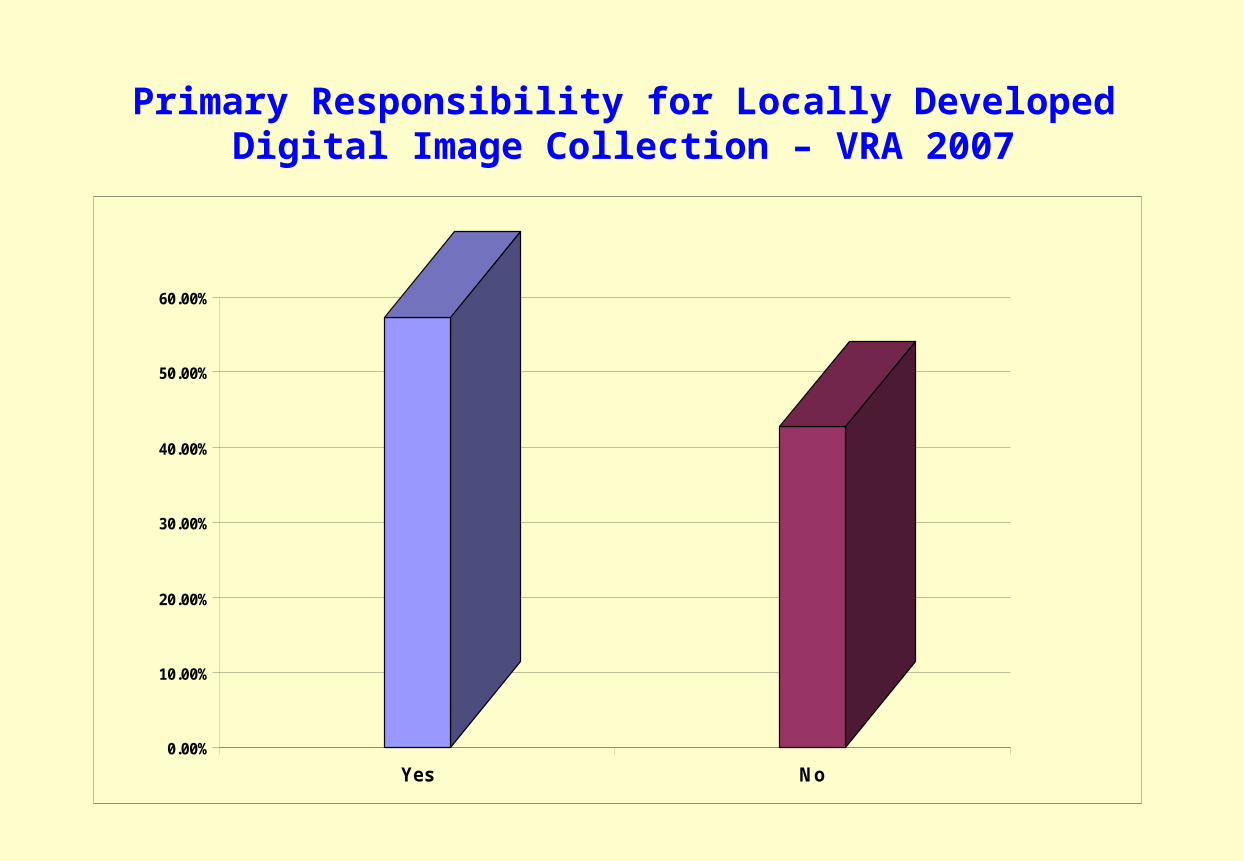
Primary Responsibility for Locally Developed Digital Image Collection – VRA 2007
0.00%
10.00%
20.00%
30.00%
40.00%
50.00%
60.00%
Yes No

0.00%2.00%4.00%6.00%8.00%
10.00%12.00%14.00%
Percent Before 1995
1995
1996
1997
1998
1999
2000
2001
2002
2003
2004
2005
Year
Percent
Before 1995 8.10%
1995 4.30%
1996 3.00%
1997 4.70%
1998 3.80%
1999 3.00%
2000 6.80%
2001 9.40%
2002 5.10%
2003 6.40%
2004 12.30%
2005 13.20%
2006 11.90%
Skipped 8.00%

Digital Images Acquisitions per Annum - 2007
0.00%
5.00%
10.00%
15.00%
20.00%
25.00%
30.00%
35.00%
40.00%
Up to 1,000 1,000 to5,000
5,000 to10,000
10,000 to20,000
20,000 to40,000
Over 40,000 NA or don'tknow
Up to 1,000
1,000 to 5,000
5,000 to10,000
10,000 to20,000
20,000 to40,000
Over 40,000
NA or don'tknow

Digital Images Average
Acquisitions per Annum
(VRA Survey of 2000)
351

0.00%5.00%
10.00%15.00%20.00%25.00%30.00%35.00%40.00%45.00%
Less than 10000
10000 to 24000
25000 to 49000
50000 to 99000
100000 to 199000
200000 to 299000
300000 to 399000
400000 to 499000
Over 500000
Size of Digital Collection - 2007
Developed locally within your institution, not online subscriptions.
(Count “master” images only, not derivatives.):

Average Digital Collection Size
(VRA Survey of 2000)
2,004

0.00%
10.00%
20.00%
30.00%
40.00%
50.00%
60.00%
1
Anthropology
Archaeology
Architecture/LA/UrbanPlanning
ArchitecturalHistory/Preservation
Art History
Art Studio/Design
Arts Administration
Cultural Studies
Education
Film Studies
Filmmaking & Photography
Anthropology 9.60%
Archaeology 8.30%
Architecture/LA/Urban Planning 15.40%
Architectural History/Preservation 9.60%
Art History 23.10%
Art Studio/Design 10.90%
Arts Administration 2.60%
Cultural Studies 5.10%
Education 4.50%
Film Studies 8.30%
Filmmaking & Photography 4.50%
Geography, Environmental Studies 5.10%
History 9.60%
Humanities 10.30%
Language & Literatures 5.80%
Museum Studies 3.20%
Religion & Culture 5.80%
Sciences 12.80%
Social Sciences 6.40%
Library 48.70%
Other 33.30%
Other Digital Collections at Institution
VRA 2007

0.00%
10.00%
20.00%
30.00%
40.00%
50.00%
60.00%
70.00%
80.00%
90.00%
Classroomprojection
Research Study NA ordon'tknow
Other
Classroom projection
Research
Study
NA or don't know
Other

0.00%
10.00%
20.00%
30.00%
40.00%
50.00%
60.00%
70.00%
80.00%
AccuNet/AP Multim edia Archive
Am ica
ARTstor
Bridgem an Education (s tand-alone)
Cam io
Luna Ins ight Com m unityCollections
Pictures of Record
RLG Cultural Materials
Scholars Resource (consortial)
None
Other

Unit’s Responsibility for Acquiring Licensed or Subscription Digital Images
– VRA 2007

Other Unit(s) That Acquire Licensed Digital Images and/or Subscribe to Digital Image Collections.

Has the Presence of Licensed or Subscription Digital Collections Had an Impact on Your Job?

0
5
10
15
20
25
30
35
40
%
Images Opacs Used
Almagest ARTstor CONTENTdm Digitool Extensis Portfolio Luna Insight MDID Other
2006 1.5 39.9 9.9 1.8 5.1 18.7 17.6 23.1
Alm agest ARTstor CONTENTdm DigitoolExtensis Portfolio
Luna Ins ight MDID Other
Only2007

Manual/cards12.70
%
Access (Microsoft)17.00
%
EmbARK 8.30%
Endeavour – Voyager (staff mode) 2.60%
Excel21.00
%
Extensis Portfolio 6.10%
FileMaker Pro31.90
%
IRIS 7.00%
VireoCat 7.90%
Innovative Interfaces (staff mode) 2.60%
InMagic (staff mode) 0.90%
MultiMimsy 0.40%
The Museum System (TMS) 3.10%
SirsiDynix (staff mode) 2.20%
Other30.60
%
None 2.20%
NA or don't know 3.90%
0.00%
5.00%
10.00%
15.00%
20.00%
25.00%
30.00%
35.00%
Cataloging Systems Used – VRA 2007
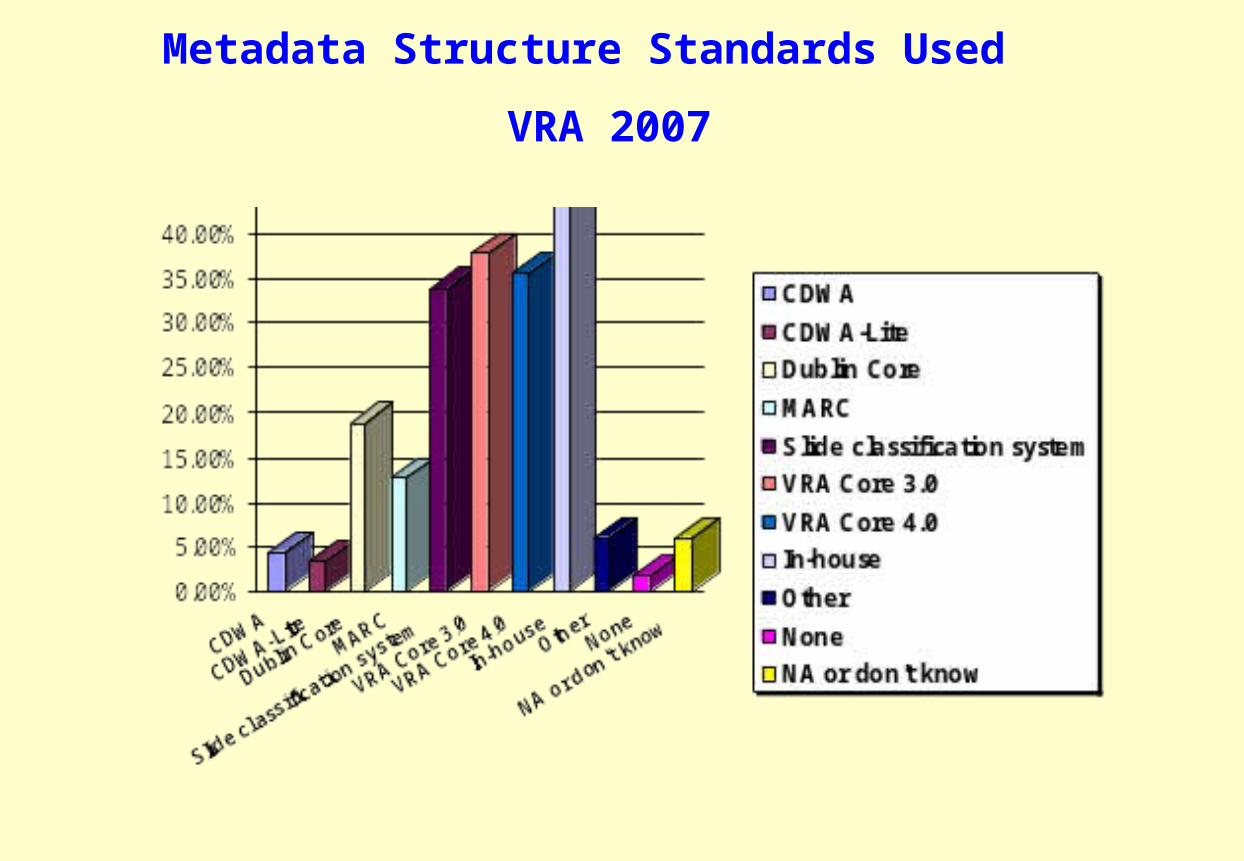
Metadata Structure Standards Used
VRA 2007

Data Content Standards Used – VRA 2007

Open public website
Open public website (image size restricted)
Public walk-in access to library/public use computer
terminals
Student access to course support by course enrollment only
Full use for staff/ limited use for students (restrictions on image
usage or size)
Remote use by means of a password/login for entire
institutional community
On-campus/site use by means of a password/login for entire
institutional community
Access to Digital Collections