2005_capturing and sustaining the benefits of advanced process control
TRANSCRIPT
CAPTURING AND SUSTAINING THE BENEFITSOF ADVANCED PROCESS CONTROL
Filippo Trivella, Steve Oglesby, Dora Nogueira
AspenTech Italy AspenTech UK, GALP Energia
Abstract: The paper describes the application of an advanced process control (APC)strategy to a complex Fluid Catalytic Cracking, two Vacuum Distillation Units and aCrude Distillation Unit located at Galp Energia Sines Refinery (Portugal). The paperdescribes the strategy and methodology adopted in the projects, specifically focusing onthe best practices related to the implementation and maintenance of large multivariablecontrollers. The technologies, tools and procedures adopted to keep the applications attheir top performance are described in detail. The benefits are shown based on data ofrigorous postaudits. Copyright © 2005 IFAC
Keywords: Multivariable Control, Manufacturing, Performance, Closedloop
1. OVERVIEW OF GALP ENERGIA
Galp Energia is the largest contributor to thePortuguese economy. Their activities go fromexploration, production , supply, refining anddistribution., with revenues in excess of 6.9 billionEuros and a net income of 114.5 Million Euros in2002. Galp Energia operate two refineries, onelocate near Porto and one in Sines. Galp EnergiaSines refinery is their largest production plant, builtin 1978 with a capacity of 225,000barrels/daycorresponding to 10.4 Million Tons of crudeprocessed per year. The production is mainlyfocused on gasoline, aviation fuel, diesel, LPG andtargeted to the Spanish, Portuguese and Africanmarkets.
The business objectives of Galp Energia at Sinesrefinery are:• Maximise income
• Maximizing throughput while adhering toregulation compliance• Identifying improvements in realtimeoperations at the plant and enterprise levels
In this context an extended automation plan has beenstarted several years ago at Sines in different steps:1. Field instrumentation upgrade2. Installation of a Distributed Control System3. Installation of a Corporate wide Information
system4. Implementation of Advanced Process
Control on major units5. Potential Implementation of real time
optimization on specific units
The first multivariable controller at Sines refinerywas implemented in 1993 on the ContinuousCatalytic Reformer (CCR) and Crude DistillationUnit (CDU) using SMCA technology.
In early 2000 the CDU controller was revamped andmigrated to DMCplus together with a new controlleron the Deisopentaniser unit.
In 2002 the FCC and Gas Concentration Unitmultivariable controllers were completed. In 2003the VDU1 and VDU2 multivariable controlstrategies were implemented.
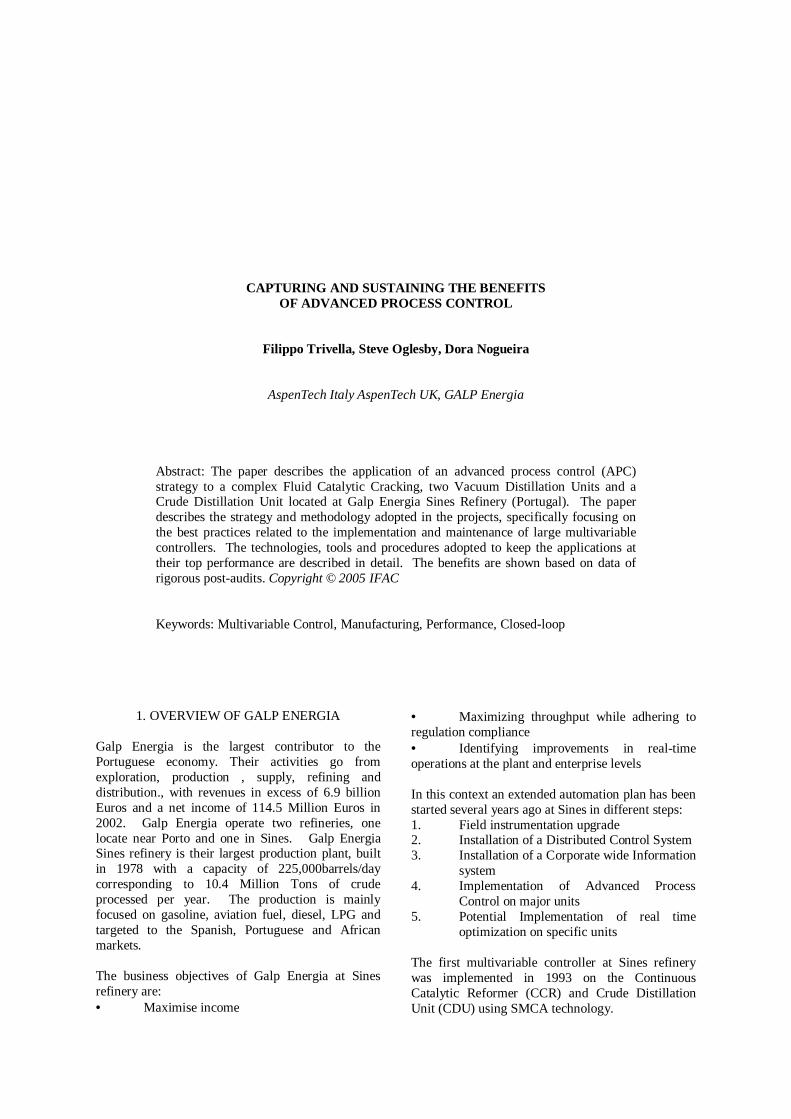
Figure 1: location of Galp Energia Refineries
DestilaçãoAtmosféric
a
225 000b/d
NaftaQuímicaGasolina Isomax
Isopentano
EnxofreFuelóeloBetume
GasolinaFCCGasóleoDes
Alquilado
Hydrisom.7 036 b/d
Alquilação8 000 b/d
80 t/d
Recup.Enxofre
PHILIPS
F.C.C.
35 000 b/d
Trat.LPGc/Amina
Visbreaker
26 000 b/d
MeroxLPG
11 760 b/d
MeroxGasolina
22 680 b/d
Trat.FGC/Amina
Frac.LPG
10 700 b/d
UOP
LUMMUS
11 130 b/d388 t/d
Platforming (CCR)
27 500 b/d MeroxGasolina3 500 b/d
MeroxPetróleo
20 500 b/d
Petróleo SR
Reformado
Jet Fuel
GasolinaLig.
Isomax
10 200 b/d
7 500b/d
MeroxLPG
MeroxIsop.
4 300 b/d
Fraccionamento
62 400 b/d
Trat.FGc/Amina
20 300b/d
Frac.LPG
FFV9
128 t/d
Recup.EnxofreA/B
Fuel Gas
Propano
Butano
Propileno
Butileno
UOP
197 t/d630t/d
HDSNAFTA
27 500 b/d
HDSGasól.Atm
f35 000 b/d
HDSGas.Vácu
o15 000 b/d
DestilaçãoVácuo I
25 000 b/d OxidaçãoAsfalto
2 400 b/d
DestilaçãoVácuo II
45 000 b/d
UOPUOP
HDSGasóleo
34 000 b/d
Trat.FGc/Amina140t/d
IFPDestilaçãoAtmosféric
a
225 000b/d
NaftaQuímicaGasolina Isomax
Isopentano
EnxofreFuelóeloBetume
GasolinaFCCGasóleoDes
Alquilado
DestilaçãoAtmosféric
a
225 000b/d
DestilaçãoAtmosféric
a
225 000b/d
NaftaQuímicaGasolina Isomax
Isopentano
EnxofreFuelóeloBetume
GasolinaFCCGasóleoDes
Alquilado
Hydrisom.7 036 b/d
Alquilação8 000 b/d
80 t/d
Recup.Enxofre
PHILIPS
F.C.C.
35 000 b/d
Trat.LPGc/Amina
Visbreaker
26 000 b/d
MeroxLPG
11 760 b/d
MeroxGasolina
22 680 b/d
Trat.FGC/Amina
Frac.LPG
10 700 b/d
UOP
LUMMUS
11 130 b/d388 t/d
Platforming (CCR)
27 500 b/d MeroxGasolina3 500 b/d
MeroxPetróleo
20 500 b/d
Petróleo SR
Reformado
Jet Fuel
GasolinaLig.
Isomax
10 200 b/d
7 500b/d
MeroxLPG
MeroxIsop.
4 300 b/d
Fraccionamento
62 400 b/d
Trat.FGc/Amina
20 300b/d
Frac.LPG
FFV9
128 t/d
Recup.EnxofreA/B
Fuel Gas
Propano
Butano
Propileno
Butileno
UOP
197 t/d630t/d
HDSNAFTA
27 500 b/d
HDSGasól.Atm
f35 000 b/d
HDSGas.Vácu
o15 000 b/d
DestilaçãoVácuo I
25 000 b/d OxidaçãoAsfalto
2 400 b/d
DestilaçãoVácuo II
45 000 b/d
UOPUOP
HDSGasóleo
34 000 b/d
Trat.FGc/Amina140t/d
IFP
Hydrisom.7 036 b/d
Alquilação8 000 b/d
80 t/d
Recup.Enxofre
PHILIPS
Hydrisom.7 036 b/dHydrisom.7 036 b/d
Alquilação8 000 b/dAlquilação8 000 b/d
80 t/d
Recup.Enxofre80 t/d
Recup.Enxofre
PHILIPS
F.C.C.
35 000 b/d
Trat.LPGc/Amina
Visbreaker
26 000 b/d
MeroxLPG
11 760 b/d
MeroxGasolina
22 680 b/d
Trat.FGC/Amina
Frac.LPG
10 700 b/d
UOP
LUMMUS
11 130 b/d388 t/d
F.C.C.
35 000 b/d
F.C.C.
35 000 b/d
Trat.LPGc/AminaTrat.LPGc/Amina
VisbreakerVisbreaker
26 000 b/d
MeroxLPG
11 760 b/d
MeroxLPG
11 760 b/d
MeroxGasolina
22 680 b/d
MeroxGasolina
22 680 b/d
Trat.FGC/AminaTrat.FGC/Amina
Frac.LPG
10 700 b/d
Frac.LPG
10 700 b/d
UOP
LUMMUS
11 130 b/d388 t/d
Platforming (CCR)
27 500 b/d MeroxGasolina3 500 b/d
MeroxPetróleo
20 500 b/d
Petróleo SR
Reformado
Jet Fuel
GasolinaLig.
Isomax
10 200 b/d
7 500b/d
MeroxLPG
MeroxIsop.
4 300 b/d
Fraccionamento
62 400 b/d
Trat.FGc/Amina
20 300b/d
Frac.LPG
FFV9
128 t/d
Recup.EnxofreA/B
Fuel Gas
Propano
Butano
Propileno
Butileno
UOP
197 t/d630t/d
HDSNAFTA
27 500 b/d
Platforming (CCR)
27 500 b/d
Platforming (CCR)
27 500 b/d MeroxGasolina3 500 b/d
MeroxGasolina3 500 b/d
MeroxPetróleo
20 500 b/d
MeroxPetróleo
20 500 b/d
Petróleo SR
Reformado
Jet Fuel
GasolinaLig.
Isomax
10 200 b/d
7 500b/d
MeroxLPG
MeroxIsop.
4 300 b/d
Fraccionamento
62 400 b/d
Trat.FGc/Amina
20 300b/d
Frac.LPG
FFV9
128 t/d
Recup.EnxofreA/B
Fuel Gas
Propano
Butano
Propileno
Butileno
UOP
197 t/d630t/d
Isomax
10 200 b/d
IsomaxIsomax
10 200 b/d
7 500b/d
MeroxLPG7 500
b/d7 500
b/d
MeroxLPG
MeroxIsop.
4 300 b/d
Fraccionamento
62 400 b/d
Fraccionamento
62 400 b/d
Trat.FGc/AminaTrat.FGc/Amina
20 300b/d
Frac.LPG
20 300b/d
Frac.LPG
FFV9FFV9
128 t/d
Recup.EnxofreA/B
128 t/d
Recup.EnxofreA/B
Fuel Gas
Propano
Butano
Propileno
Butileno
UOP
197 t/d630t/d
HDSNAFTA
27 500 b/d
HDSNAFTA
27 500 b/d
HDSGasól.Atm
f35 000 b/d
HDSGas.Vácu
o15 000 b/d
DestilaçãoVácuo I
25 000 b/d OxidaçãoAsfalto
2 400 b/d
DestilaçãoVácuo II
45 000 b/d
UOPUOP
HDSGasóleo
34 000 b/d
Trat.FGc/Amina140t/d
IFP
HDSGasól.Atm
f35 000 b/d
HDSGasól.Atm
f35 000 b/d
HDSGas.Vácu
o15 000 b/d
HDSGas.Vácu
o15 000 b/d
DestilaçãoVácuo I
25 000 b/d
DestilaçãoVácuo I
25 000 b/d OxidaçãoAsfalto
2 400 b/d
OxidaçãoAsfalto
2 400 b/d
DestilaçãoVácuo II
45 000 b/d
DestilaçãoVácuo II
45 000 b/d
UOPUOP
HDSGasóleo
34 000 b/d
HDSGasóleo
34 000 b/d
Trat.FGc/AminaTrat.FGc/Amina140t/d
IFP
Figure 2: overview of Sines Refinery
2. ADVANCED PROCESS CONTROLOBJECTIVES
The process control objectives are summarisedbelow for the most important units.
Crude Distillation Unit.The APC stragey is implemented on the preheattrain, 4 heaters, main fractionator, gas fractionationsection and deisopentanser.
The main objectives are:• Maximise Feed• Maximise most valuable products• Quality control• Automatic Crude switching
Fluid Catalytic Cracking and Gas ConcentrationThe APC strategy covers the preheat section, reactorand regenerator, main fractionator and gasconcentration unit.
The APC strategy is designed to meet the followingobjectives:
• Maximise Feed• Maximise LPG production
Vacuum Distillation 1 and 2The APC strategy is implemented on the preheattrain, heater and vacuum column of both units.
The objectives of APC are:• Maximise Feed• Maximise VGO Yield• Quality control (Asphalt mode)
Currently there are installed 7 multivariablecontrollers, divided in 16 subcontrollers. The totalnumber of variables manipulate by DMCplusexceeds 100 and the total number of controlledvariables is approximately 210. In the severalstrategies implemented there are more than 30qualities inferred through process measurements
The technologies used at Galp Energia are:• DMCplusTM for multivariable control• AspenIQTM for inferential development and
deployment• AspenWatchTM for performance monitoring• Production Control Web Server for operator
and engineer interface• DMCplus for TDC3000 package for
operator interface• Cimio for OPC to connect to the Honeywell
TDC3000
Platforming (CCR)
27 500 b/d
Isomax
10 200 b/d
7 500b/d
MeroxLPG
MeroxIsop.
4 300 b/d
DestilaçãoAtmosféric
a
225 000b/d
MeroxGasolina3 500 b/d
MeroxPetróleo
20 500 b/d
Fraccionamento
62 400 b/d
NaftaQuímica
Petróleo SR
Reformado
Trat.FGc/Amina
20 300b/d
Frac.LPG
Gasolina Isomax
Isopentano
Jet Fuel
GasolinaLig.
FFV9
128 t/d
Recup.EnxofreA/B
Fuel Gas
Propano
Butano
HDSGasól.Atm
f35 000 b/d
HDSGas.Vácu
o15 000 b/d
F.C.C.
35 000 b/d
Trat.LPGc/Amina
DestilaçãoVácuo I
25 000 b/d OxidaçãoAsfalto
2 400 b/d
Visbreaker
26 000 b/d
MeroxLPG
11 760 b/d
MeroxGasolina22 680 b/d
Trat.FGC/Amina
Frac.LPG
10 700 b/dHydrisom.7 036 b/d
Alquilação8 000 b/d
DestilaçãoVácuo II
45 000 b/d
EnxofreFuelóeloBetume
GasolinaFCCGasóleoDes
Alquilado
Propileno
Butileno
80 t/d
Recup.Enxofre
UOP
UOP
UOP UOP
LUMMUS
PHILIPS
HDSGasóleo
34 000 b/d
11 130 b/d388 t/d
197 t/d630t/d
HDSNAFTA
27 500 b/d
Trat.FGc/Amina140t/d
IFP
CDUCDU20002000
VDU 1VDU 120032003
CCRCCR19971997
Rev 2003Rev 2003
VDU 2VDU 220032003
FCCFCC20022002
VSBVSB20042004
GasConcGasConc20022002
AlkiAlki20042004
Platforming (CCR)
27 500 b/d
Isomax
10 200 b/d
7 500b/d
MeroxLPG
MeroxIsop.
4 300 b/d
DestilaçãoAtmosféric
a
225 000b/d
MeroxGasolina3 500 b/d
MeroxPetróleo
20 500 b/d
Fraccionamento
62 400 b/d
NaftaQuímica
Petróleo SR
Reformado
Trat.FGc/Amina
20 300b/d
Frac.LPG
Gasolina Isomax
Isopentano
Jet Fuel
GasolinaLig.
FFV9
128 t/d
Recup.EnxofreA/B
Fuel Gas
Propano
Butano
HDSGasól.Atm
f35 000 b/d
HDSGas.Vácu
o15 000 b/d
F.C.C.
35 000 b/d
Trat.LPGc/Amina
DestilaçãoVácuo I
25 000 b/d OxidaçãoAsfalto
2 400 b/d
Visbreaker
26 000 b/d
MeroxLPG
11 760 b/d
MeroxGasolina22 680 b/d
Trat.FGC/Amina
Frac.LPG
10 700 b/dHydrisom.7 036 b/d
Alquilação8 000 b/d
DestilaçãoVácuo II
45 000 b/d
EnxofreFuelóeloBetume
GasolinaFCCGasóleoDes
Alquilado
Propileno
Butileno
80 t/d
Recup.Enxofre
UOP
UOP
UOP UOP
LUMMUS
PHILIPS
HDSGasóleo
34 000 b/d
11 130 b/d388 t/d
197 t/d630t/d
HDSNAFTA
27 500 b/d
Trat.FGc/Amina140t/d
IFP
Platforming (CCR)
27 500 b/d
Platforming (CCR)
27 500 b/d
Isomax
10 200 b/d
IsomaxIsomax
10 200 b/d
7 500b/d
MeroxLPG
7 500b/d
7 500b/d
MeroxLPG
MeroxIsop.
4 300 b/d
DestilaçãoAtmosféric
a
225 000b/d
DestilaçãoAtmosféric
a
225 000b/d
MeroxGasolina3 500 b/d
MeroxGasolina3 500 b/d
MeroxPetróleo
20 500 b/d
MeroxPetróleo
20 500 b/d
Fraccionamento
62 400 b/d
Fraccionamento
62 400 b/d
NaftaQuímica
Petróleo SR
Reformado
Trat.FGc/AminaTrat.FGc/Amina
20 300b/d
Frac.LPG
20 300b/d
Frac.LPG
Gasolina Isomax
Isopentano
Jet Fuel
GasolinaLig.
FFV9FFV9
128 t/d
Recup.EnxofreA/B
128 t/d
Recup.EnxofreA/B
Fuel Gas
Propano
Butano
HDSGasól.Atm
f35 000 b/d
HDSGasól.Atm
f35 000 b/d
HDSGas.Vácu
o15 000 b/d
HDSGas.Vácu
o15 000 b/d
F.C.C.
35 000 b/d
F.C.C.
35 000 b/d
Trat.LPGc/AminaTrat.LPGc/Amina
DestilaçãoVácuo I
25 000 b/d
DestilaçãoVácuo I
25 000 b/d OxidaçãoAsfalto
2 400 b/d
OxidaçãoAsfalto
2 400 b/d
VisbreakerVisbreaker
26 000 b/d
MeroxLPG
11 760 b/d
MeroxLPG
11 760 b/d
MeroxGasolina22 680 b/d
MeroxGasolina22 680 b/d
Trat.FGC/AminaTrat.FGC/Amina
Frac.LPG
10 700 b/d
Frac.LPG
10 700 b/dHydrisom.7 036 b/dHydrisom.7 036 b/d
Alquilação8 000 b/dAlquilação8 000 b/d
DestilaçãoVácuo II
45 000 b/d
DestilaçãoVácuo II
45 000 b/d
EnxofreFuelóeloBetume
GasolinaFCCGasóleoDes
Alquilado
Propileno
Butileno
80 t/d
Recup.Enxofre
80 t/d
Recup.Enxofre
UOP
UOP
UOP UOP
LUMMUS
PHILIPS
HDSGasóleo
34 000 b/d
HDSGasóleo
34 000 b/d
11 130 b/d388 t/d
197 t/d630t/d
HDSNAFTA
27 500 b/d
HDSNAFTA
27 500 b/d
Trat.FGc/AminaTrat.FGc/Amina140t/d
IFP
CDUCDU20002000
VDU 1VDU 120032003
CCRCCR19971997
Rev 2003Rev 2003
VDU 2VDU 220032003
FCCFCC20022002
VSBVSB20042004
GasConcGasConc20022002
AlkiAlki20042004
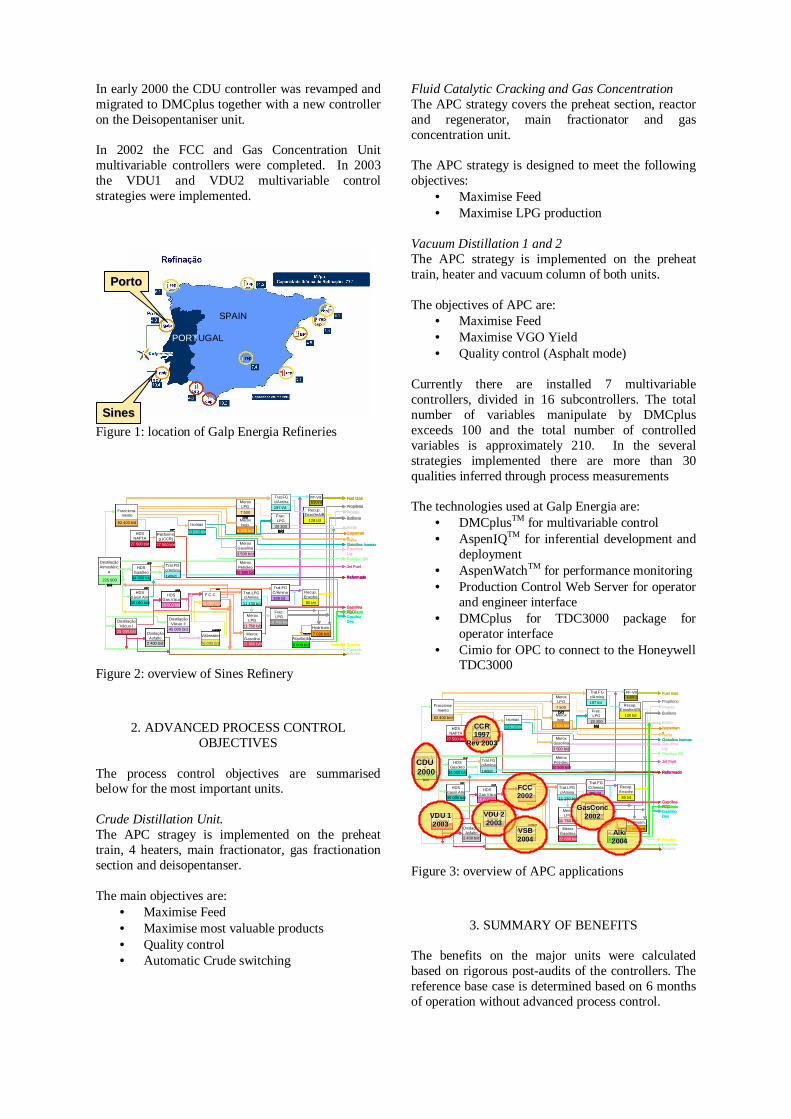
Figure 3: overview of APC applications
3. SUMMARY OF BENEFITS
The benefits on the major units were calculatedbased on rigorous postaudits of the controllers. Thereference base case is determined based on 6 monthsof operation without advanced process control.
SSiinneess
PORTUGAL
SPAIN
PPoorrttoo
In the following paragraphs a brief summary of theresults is presented.
3.1 Crude Distillation Unit
The following table shows a comparison of thebenefits obtained through the application of APC tothe CDU. The results are based on 6 months ofoperation of the multivariable controller andcompared to the expected results in the referencebase case.
Table 1: summary of the benefits on the CDU(6 months of operation)
Estimated ObtainedFeed increase 2.4% >4%Kero Yield increase 0.53% 1%HGO Yield increase 0.25% 0.8%Heavy naphtha 5%ASTM (Standarddeviation)
<3.2degC 1.5degC
HGO evap 360degC(standard deviation) <2.9% 2.2%
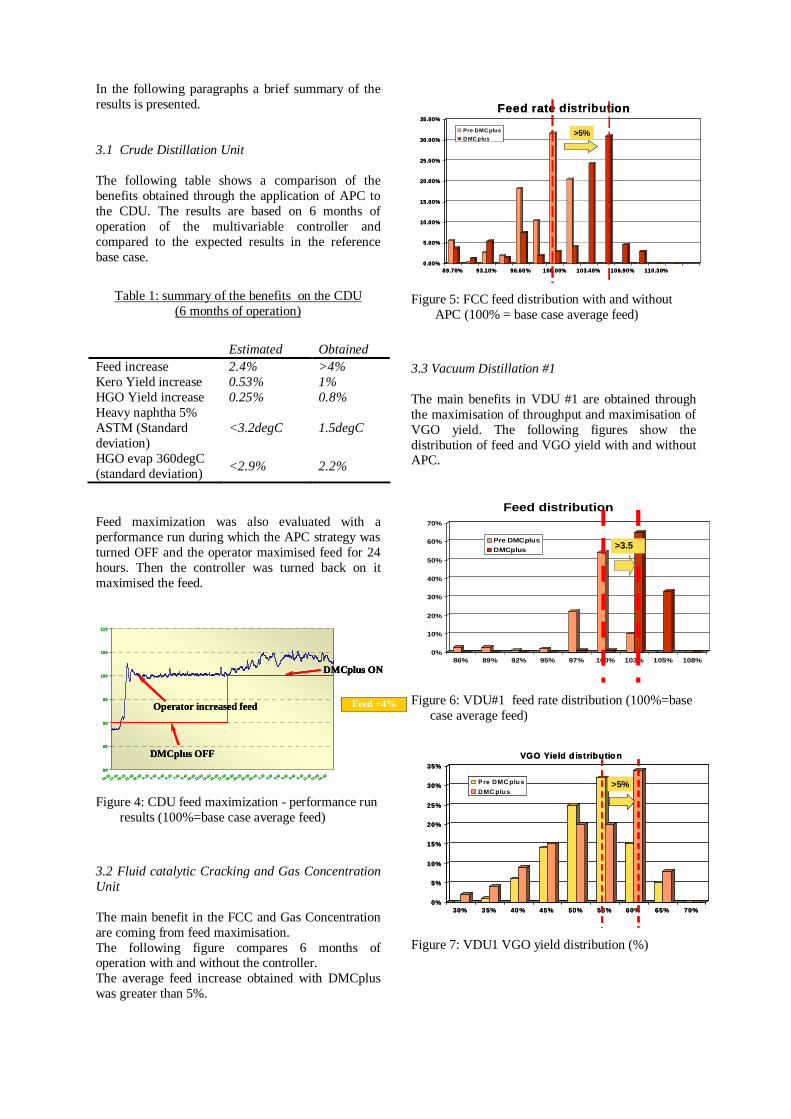
Feed maximization was also evaluated with aperformance run during which the APC strategy wasturned OFF and the operator maximised feed for 24hours. Then the controller was turned back on itmaximised the feed.
80
85
90
95
100
105
110
16:0017:4019:20
21:0022:40
0:202:00
3:405:20
7:008:40
10:2012:00
13:4015:20
17:0018:40
20:2022:00
23:401:20
3:00 4:40 6:20 8:00 9:4011:2013:00
14:40
DMCplus OFF
Operator increased feed
DMCplus ON
Feed +4%
80
85
90
95
100
105
110
16:0017:4019:20
21:0022:40
0:202:00
3:405:20
7:008:40
10:2012:00
13:4015:20
17:0018:40
20:2022:00
23:401:20
3:00 4:40 6:20 8:00 9:4011:2013:00
14:40
DMCplus OFFDMCplus OFF
Operator increased feedOperator increased feed
DMCplus ONDMCplus ON
Feed +4%
Figure 4: CDU feed maximization performance runresults (100%=base case average feed)
3.2 Fluid catalytic Cracking and Gas ConcentrationUnit
The main benefit in the FCC and Gas Concentrationare coming from feed maximisation.The following figure compares 6 months ofoperation with and without the controller.The average feed increase obtained with DMCpluswas greater than 5%.
0.00%
5.00%
10.00%
15.00%
20.00%
25.00%
30.00%
35.00%
89.70% 93.10% 96.60% 100.00% 103.40% 106.90% 110.30%
Feed rate distributionPre DMC plusD MC plus
>5%
0.00%
5.00%
10.00%
15.00%
20.00%
25.00%
30.00%
35.00%
89.70% 93.10% 96.60% 100.00% 103.40% 106.90% 110.30%
Feed rate distributionPre DMC plusD MC plus
>5%>5%
Figure 5: FCC feed distribution with and withoutAPC (100% = base case average feed)
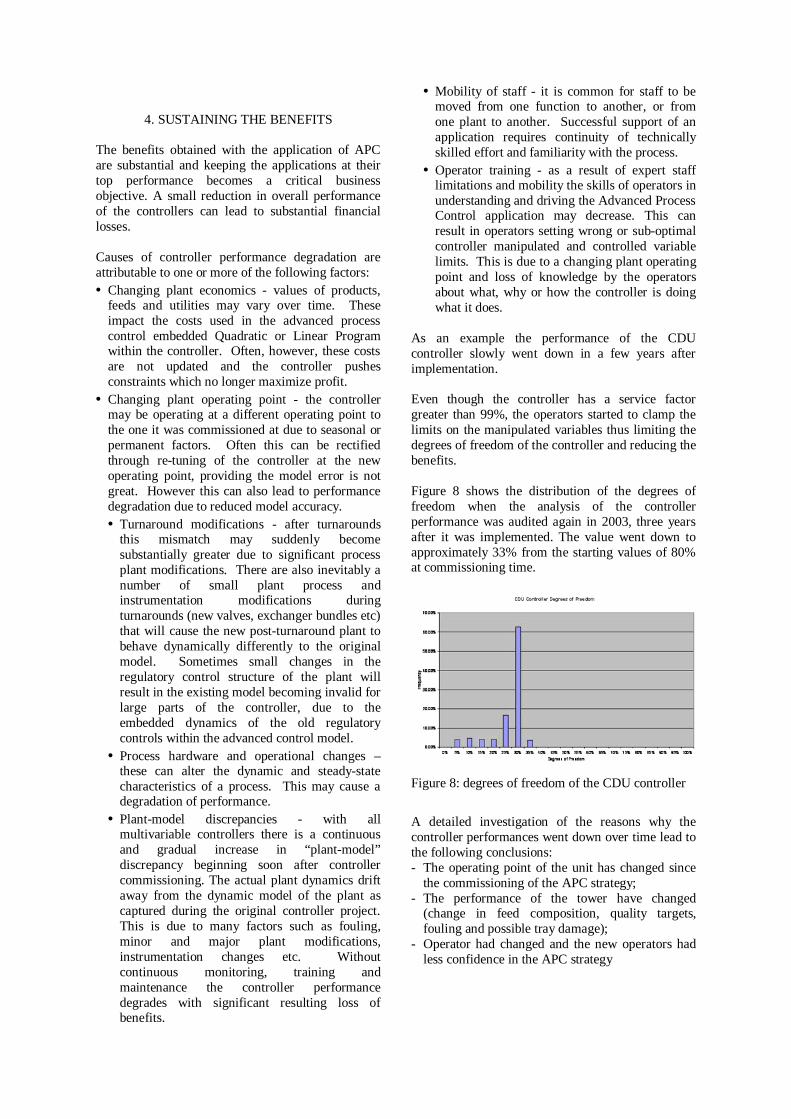
3.3 Vacuum Distillation #1
The main benefits in VDU #1 are obtained throughthe maximisation of throughput and maximisation ofVGO yield. The following figures show thedistribution of feed and VGO yield with and withoutAPC.
Figure 6: VDU#1 feed rate distribution (100%=basecase average feed)
0%
5%
10%
15%
20%
25%
30%
35%
30% 35% 40% 45% 50% 55% 60% 65% 70%
VGO Yield d istributio n
Pre DMC plusDMC plus
>5%
0%
5%
10%
15%
20%
25%
30%
35%
30% 35% 40% 45% 50% 55% 60% 65% 70%
VGO Yield d istributio n
Pre DMC plusDMC plus
>5%>5%
Figure 7: VDU1 VGO yield distribution (%)
0%
10%
20%
30%
40%
50%
60%
70%
86% 89% 92% 95% 97% 100% 103% 105% 108%
Feed distribution
Pre DMCplusDMCplus >3.5
%
4. SUSTAINING THE BENEFITS
The benefits obtained with the application of APCare substantial and keeping the applications at theirtop performance becomes a critical businessobjective. A small reduction in overall performanceof the controllers can lead to substantial financiallosses.
Causes of controller performance degradation areattributable to one or more of the following factors:• Changing plant economics values of products,
feeds and utilities may vary over time. Theseimpact the costs used in the advanced processcontrol embedded Quadratic or Linear Programwithin the controller. Often, however, these costsare not updated and the controller pushesconstraints which no longer maximize profit.
• Changing plant operating point the controllermay be operating at a different operating point tothe one it was commissioned at due to seasonal orpermanent factors. Often this can be rectifiedthrough retuning of the controller at the newoperating point, providing the model error is notgreat. However this can also lead to performancedegradation due to reduced model accuracy.• Turnaround modifications after turnarounds
this mismatch may suddenly becomesubstantially greater due to significant processplant modifications. There are also inevitably anumber of small plant process andinstrumentation modifications duringturnarounds (new valves, exchanger bundles etc)that will cause the new postturnaround plant tobehave dynamically differently to the originalmodel. Sometimes small changes in theregulatory control structure of the plant willresult in the existing model becoming invalid forlarge parts of the controller, due to theembedded dynamics of the old regulatorycontrols within the advanced control model.
• Process hardware and operational changes –these can alter the dynamic and steadystatecharacteristics of a process. This may cause adegradation of performance.
• Plantmodel discrepancies with allmultivariable controllers there is a continuousand gradual increase in “plantmodel”discrepancy beginning soon after controllercommissioning. The actual plant dynamics driftaway from the dynamic model of the plant ascaptured during the original controller project.This is due to many factors such as fouling,minor and major plant modifications,instrumentation changes etc. Withoutcontinuous monitoring, training andmaintenance the controller performancedegrades with significant resulting loss ofbenefits.
• Mobility of staff it is common for staff to bemoved from one function to another, or fromone plant to another. Successful support of anapplication requires continuity of technicallyskilled effort and familiarity with the process.
• Operator training as a result of expert stafflimitations and mobility the skills of operators inunderstanding and driving the Advanced ProcessControl application may decrease. This canresult in operators setting wrong or suboptimalcontroller manipulated and controlled variablelimits. This is due to a changing plant operatingpoint and loss of knowledge by the operatorsabout what, why or how the controller is doingwhat it does.
As an example the performance of the CDUcontroller slowly went down in a few years afterimplementation.
Even though the controller has a service factorgreater than 99%, the operators started to clamp thelimits on the manipulated variables thus limiting thedegrees of freedom of the controller and reducing thebenefits.
Figure 8 shows the distribution of the degrees offreedom when the analysis of the controllerperformance was audited again in 2003, three yearsafter it was implemented. The value went down toapproximately 33% from the starting values of 80%at commissioning time.
Figure 8: degrees of freedom of the CDU controller
A detailed investigation of the reasons why thecontroller performances went down over time lead tothe following conclusions: The operating point of the unit has changed since
the commissioning of the APC strategy; The performance of the tower have changed
(change in feed composition, quality targets,fouling and possible tray damage);
Operator had changed and the new operators hadless confidence in the APC strategy
4.1 Procedures for sustaining the benefits
Sustaining benefits on multiple APC applications canbe a challenging task that has to be approached in asystematic way.
The following factors were identified as key factorsfor maintaining APC applications:• Availability of a reporting tool. A tool that easily
created reports for management and controlengineers is essential for day to day operations ofthe controller
• APC application historian. The plant historian isuseful to trend key variables but doesn’t provideall the information required for troubleshooting. Atool that allows to go back in history to see all theAPC application parameters (limits, tuningparameters etc.) is essential for understandingbehaviour and troubleshooting the application
• Remote connection. The control engineers need tomonitor the application even when they are not inthe control room. A safe connection to the onlineserver is essential to monitor the controllerperformances. Remote connection is alsoimportant if performances have to be monitoredfrom third parties
Galp Energia selected AspenWatch as a reportingtool and APC historian.The controllers are published on the refinery Intranetusing the Production Control Web Server, so thatprocess and control engineers can monitor theapplications using their Internet Browser. Remoteconnections are done through Webex meetings.
Galp Energia and Aspen Technology formed a jointteam with clear responsibilities and activities.Galp Energia team takes care of day to daymonitoring of the applications, troubleshooting etc.The AspenTech team performs as part the AspenSustained Value (ASV) program regular remotechecks and site visits every 3 months.On request remote check are also performed on an asneeded basis.
5. CONCLUSIONS
Advanced Process control applications have resultedin significant ongoing benefits to Galp Energia.
Rigorous post audits of the application have provento be essential to prove the importance of APCapplications installed and to increase focus on theseapplications especially after commissioning.
A systematic approach for sustaining the benefits ofthe application has been essential for keeping theapplication at their top performance.