2005 iowa land value survey: overview
TRANSCRIPT

2005 IOWA LAND VALUE SURVEY: OVERVIEW 1.0 History and Purpose of the Land Value Survey.
1.1 The survey was initiated in 1941 and is sponsored annually by the Iowa Agriculture and Home Economics Experiment Station, Iowa State University. Only the state average and the district averages are based directly on the ISU survey data. The county estimates are derived by using a procedure that combines the ISU survey results with data from the U.S. Census of Agriculture. The survey was conducted by Michael Duffy and Darnell Smith.
1.2 The survey is intended to provide information on general land value trends,
geographical land price relationships and factors influencing the Iowa land market. The survey is not intended to provide an estimate for any particular piece of property.
1.3 The survey is based on reports by licensed real estate brokers and selected
individuals considered to be knowledgeable of land market conditions. Approximately 1,100 surveys are mailed each year. Normally 500-600 completed surveys are returned.
1.4 Respondents were asked to report on more than one county if they were
knowledgeable about the land markets. The 2005 survey is based on 483 usable responses providing estimates on 615 county land values.
1.5 Participants in the survey are asked to estimate the value of high, medium and low
grade land in their county. Comparative sales and other factors are taken into account by the respondents in making these value estimates.
2.0 Analysis by State.
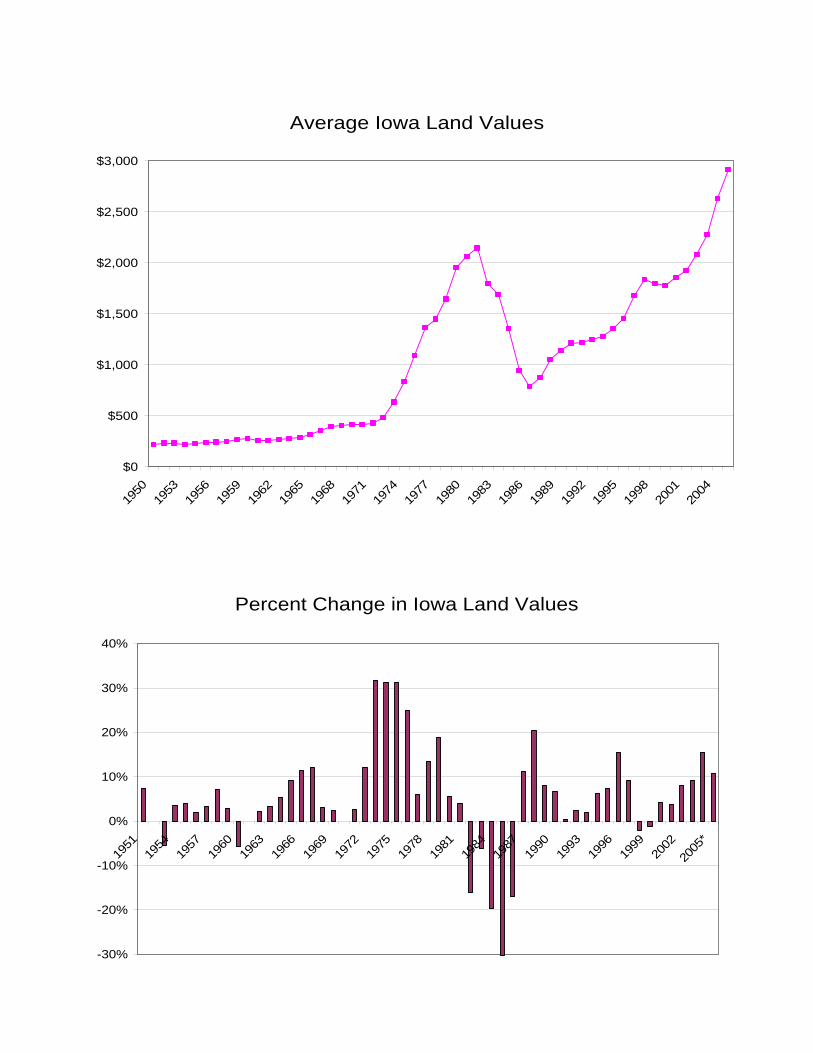
2.1 The 2005 state average for all grades of land was estimated to be $2,914 per acre.
2.2 The increase in the state value was $285 per acre from 2004.
2.3 The percentage increase was 10.8 percent from 2004.
December 2005
________________________ Prepared by Michael D. Duffy, agricultural extension economist and Darnell Smith, extension associate, Iowa State University, December 13, 2005.

3.0 Analysis by Crop Reporting District.
3.1 The highest land values were reported for Central Iowa, $3,415 per acre.
3.2 The lowest land values were estimated for South Central Iowa, $1,793 per acre.
3.3 The greatest percentage increase was in South Central Iowa, 15.9 percent.
3.4 The least percentage increase was in Southeast Iowa, 8.6 percent. 4.0 Analysis by Counties.
4.1 The highest value was estimated for Scott county, $4,707 per acre.
4.2 The lowest value was in Decatur county, $1,321 per acre.
4.3 The greatest dollar increase was $540 in Scott county.
4.4 The greatest percentage increase was 24.3 percent reported in Ringgold county. 5.0 Analysis by Quality of Land.
5.1 Low grade land in the state averaged $1,961 per acre and showed a 14.5 percent increase or $248 per acre.
5.2 Medium grade land averaged $2,736 per acre and showed a 11.4 percent increase or
$279 per acre.
5.3 High grade land averaged $3,511 per acre and showed an increase of 10.0 percent or $318 per acre.
6.0 Major Factors Influencing the Real Estate Market.
Survey respondents listed both positive and negative factors influencing the land market. The respondents listed multiple factors in most cases.
6.1 There were 5 positive factors listed by over 10 percent of the respondents.
6.2 Low interest rates (27 percent) and good crop yields (26 percent) were the most
frequently mentioned positive factors.
6.3 Other positive factors were: tax free exchanges (20 percent), government programs and payments (16 percent), and strong investment demand (12 percent).
6.4 There were 3 negative factors listed by more than 10 percent of the respondents.
Lower grain prices were listed by 28 percent of the respondents. High input, machinery and low profitability in general (16 percent) and up trending interest rates (16 percent).

7.0 Number of Sales Compared to Previous Year.
When asked to compare the number of sales in 2005 relative to 2004, 29 percent reported more, 48 percent the same, and 23 percent reported less.
8.0 Land Sales by Buyer Category.
The 2005 survey asked respondents what percent of the land sales were sold to four categories of buyers.
8.1 The majority of farmland sales: 56 percent were to existing farmers. Investors
represented 39 percent of the sales. New farmers represented 3 percent of the sales and, other purchases were 2 percent of sales.
8.2 Sales to existing farmers by Crop Reporting Districts ranged from 81 percent in East
Central to 46 percent in Southwest.
8.3 Sales to investors were highest in Northwest (51 percent). East Central reported the lowest investor activity (17 percent).
9.0 Interpretation of Survey Results. The results of this year’s survey show that the interest in Iowa farmland remains high. This
year’s average value of $2,914 is the highest ever recorded in Iowa. This is the third year in a row with a record high. When the land values are adjusted for inflation, using 1982 – 1984 time period, land values in Iowa peaked in 1979. The value reported in this year’s survey, when adjusted for inflation, is roughly the same as the value reported in 1973, the first year of the rapid increase in land values in the 1970s.
The survey also showed that the strength in the land market was apparent throughout the state. All 9 crop reporting districts showed increases in the average value of close to 10 percent. All counties showed an increase in value. There were 21 counties with an increase less than 10 percent.
The 2005 survey shows investor interest in purchasing farmland remained high. There are many reasons for this including the low interest rates and the poor performance in the stock market.
The statewide average 10.8 percent increase in land values is similar to other surveys of Iowa land values. It is important to remember the different time periods covered when comparing surveys. The Iowa State University survey reported here is an annual survey as of November 1, 2005. Iowa farmland has performed very well since 2000. The statewide average land values have increased 56.9 percent over the past 5 years. The South Central Crop Reporting District increased over 80 percent since 2000. The Central district showed the highest dollar increase ($1,220 per acre) since 2000. The South Central district reported a $801 increase. There were 7 counties that increased over 70 percent during the same time period.

Are Iowa land values at their peak? Is the market too high? These are frequently asked questions that cannot be answered from the survey nor with any certainty. It does appear from the survey, however, that these concerns are on people’s minds. When you combine several of the similar negative factors mentioned, well over a fourth of the respondents are concerned that the market is too high for profitable farm production. There is also a considerable degree of uncertainty expressed regarding farm programs, the general economy, fewer buyers, and interest rates. Another frequently asked question is whether or not high land prices are a good thing. Obviously, the answer to this depends upon your point of view and whether you are an owner or a renter, or potential buyer. A couple of observations address this question. One is that rents have been increasing at a lower rate than land values over the past several years. Another observation is that much of Iowa’s land is owned by absentee landowners. Based on a 2002 survey, 45 percent of Iowa’s farmland was owned by people who did not live on a farm. Of this, 19 percent of Iowa’s farmland was owned by people who don’t even live in Iowa. This same survey showed that almost three-fourths of Iowa’s farmland was owned without debt. This is one indicator that the potential for significant land value declines is not as great today as in the early 1980s. There are many questions pertaining to the record high land values. How you answer them depends on your point of view. The survey shows that land value increases appear to be slowing and that values may be nearing a plateau in the near future. Many respondents indicated that the supply of land on the market has increased and that the potential buyers may be hesitating to buy at these higher land prices. Time will tell.

Table 1. Recent Changes in Iowa Farmland Values
Value Dollar Percentage
Per Acre Change Change 1968 409 12 3.0 1969 419 10 2.5 1970 419 0 0.0 1971 430 11 2.6 1972 482 52 12.0 1973 635 154 31.9 1974 834 199 31.3 1975 1095 261 31.3 1976 1368 273 24.9 1977 1450 82 6.0 1978 1646 196 13.5 1979 1958 312 19.0 1980 2066 108 5.5 1981 2147 82 3.9 1982 1801 -346 -16.1 1983 1691 -110 - 6.1 1984 1357 -334 -19.8 1985 948 -409 -30.2 1986 787 -161 -17.0 1987 875 88 11.2 1988 1054 179 20.4 1989 1139 85 8.1 1990 1214 75 6.6 1991 1219 5 .4 1992 1249 30 2.5 1993 1275 26 2.1 1994 1356 81 6.4 1995 1455 99 7.3 1996 1682 227 15.6 1997 1837 155 9.2 1998 1801 -36 -1.9 1999 1781 -20 -1.1 2000 1857 76 4.3 2001 1926 69 3.7 2002 2083 157 8.2 2003 2275 192 9.2 2004 2629 354 15.1 2005 2914 285 10.8

Table 2. Average Value Per Acre of Iowa Farmland Listed by Crop Reporting Districts and Grades of Land __________________________________________________________________________________________________________________________________________________________________________________________________________________________________________________________________________________________________________________________________
State North- North North- West East South- South South- Year Average west Central east Central Central Central west Central east __________________________________________________________________________________________________________________________________________________________________________________________________________________________________________________________________________________________________________________________________
All Grades 1981 2147 2562 2721 2227 2056 2538 2530 1586 1184 1790 1986 787 937 912 786 768 930 1000 607 403 705 1987 875 1084 1055 835 871 1044 1053 676 421 782 1995 1455 1755 1724 1330 1528 1766 1676 1102 742 1367 1996 1682 2071 1997 1559 1758 2090 1965 1206 851 1502 1997 1837 2263 2194 1721 1894 2295 2110 1369 957 1580 1998 1801 2174 2119 1757 1820 2192 2123 1373 948 1585 1999 1781 2059 2073 1807 1837 2128 2118 1346 981 1570 2000 1857 2198 2169 1868 1924 2195 2190 1412 992 1655 2001 1926 2240 2240 1950 1969 2246 2324 1511 1039 1705 2002 2083 2434 2367 2149 2101 2392 2547 1632 1211 1808 2003 2275 2683 2514 2347 2329 2652 2715 1774 1354 1979 2004 2629 3118 2913 2665 2728 3101 3054 2088 1547 2286 2005 2914 3393 3222 2963 3048 3415 3396 2350 1793 2483 High Grade 1981 2759 3035 3209 2885 2576 3061 3293 2050 1880 2726 1986 1048 1131 1094 1048 1000 1154 1343 832 682 1120 1987 1150 1306 1260 1102 1125 1288 1399 912 688 1229 1995 1869 2058 1968 1729 1939 2159 2131 1483 1163 2091 1996 2151 2431 2300 2015 2210 2558 2518 1586 1316 2291 1997 2328 2647 2531 2210 2350 2790 2673 1786 1443 2383 1998 2284 2534 2449 2238 2268 2659 2683 1798 1455 2369 1999 2249 2401 2362 2275 2288 2589 2685 1773 1499 2271 2000 2324 2547 2462 2329 2375 2660 2743 1825 1509 2353 2001 2407 2588 2546 2439 2437 2685 2907 1947 1582 2447 2002 2576 2776 2676 2625 2583 2848 3105 2117 1931 2539 2003 2790 3040 2817 2857 2820 3121 3263 2285 2121 2783 2004 3193 3537 3265 3189 3264 3621 3659 2657 2358 3174 2005 3511 3813 3588 3522 3691 3935 4069 2925 2659 3385 Medium Grade 1981 1931 2252 2334 2052 1866 2279 2258 1472 1149 1604 1986 699 830 777 709 684 813 866 561 396 622 1987 780 957 903 754 776 928 925 630 413 696 1995 1322 1598 1558 1216 1394 1580 1510 1009 726 1210 1996 1514 1873 1769 1423 1585 1843 1752 1111 829 1321 1997 1668 2033 1945 1577 1742 2050 1910 1280 945 1404 1998 1638 1970 1885 1604 1670 1968 1930 1274 924 1414 1999 1629 1876 1869 1665 1692 1898 1945 1241 949 1433 2000 1701 2001 1972 1728 1772 1956 1996 1320 955 1511 2001 1768 2057 2040 1800 1807 2013 2125 1410 1004 1571 2002 1924 2278 2142 2010 1930 2175 2358 1522 1152 1659 2003 2123 2507 2309 2221 2167 2438 2543 1659 1307 1834 2004 2457 2930 2669 2515 2564 2858 2863 1956 1492 2118 2005 2736 3199 2982 2834 2833 3165 3172 2217 1725 2347 Low Grade 1981 1157 1460 1517 1220 1125 1336 1366 959 624 752 1986 377 488 468 405 350 475 460 290 176 257 1987 432 571 553 444 419 535 495 341 207 289 1995 792 992 1049 737 812 967 925 614 400 574 1996 936 1213 1207 878 981 1146 1073 688 479 674 1997 1042 1354 1337 992 1083 1279 1186 787 544 730 1998 1030 1299 1286 1059 1021 1258 1205 792 542 739 1999 1045 1216 1314 1110 1040 1296 1188 798 582 790 2000 1117 1370 1387 1167 1126 1299 1288 862 597 875 2001 1170 1388 1423 1208 1202 1416 1404 918 623 871 2002 1322 1571 1568 1448 1332 1516 1628 996 760 997 2003 1463 1808 1682 1512 1500 1707 1811 1130 858 1063 2004 1713 2087 1976 1816 1746 2028 1998 1354 1029 1272 2005 1961 2382 2252 2032 1970 2353 2237 1614 1252 1438

Level of Sales Activity, 2005 ________________________________________________________
More Same Less ________________________________________________________
Percent Northwest 23 56 22 North Central 34 44 21 Northeast 24 43 34 West Central 27 49 24 Central 32 49 19 East Central 35 43 22 Southwest 35 43 22 South Central 21 55 24 Southeast 34 46 20
STATE 29 48 23 ________________________________________________________

Iowa Land Purchases, 2005 ______________________________________________________________________
Existing New Farmers Investors Farmers Other
____________________________________________________________________________
Percent
Northwest 49 51 0 0 North Central 53 39 7 1 Northeast 58 31 6 6 West Central 65 34 1 0 Central 52 46 2 1 East Central 81 17 0 2 Southwest 46 48 3 3 South Central 49 47 3 2 Southeast 57 37 2 4 STATE 56 39 3 2 ───────────────────────────────────────────────────────────────────── . . and justice for all
The U.S. Department of Agriculture (USDA) prohibits discrimination in all its programs and activities on the basis of race, color, national origin, gender, religion, age, disability, political beliefs, sexual orientation, and marital or family status. (Not all prohibited bases apply to all programs.) Many materials can be made available in alternative formats for ADA clients. To file a complaint of discrimination, write USDA, Office of Civil Rights, Room 326-W, Whitten Building, 14th and Independence Avenue, SW, Washington, DC 20250-9410 or call 202-720-5964. Issued in furtherance of Cooperative Extension work, Acts of May 8 and June 30, 1914, in cooperation with the U.S. Department of Agriculture. Stanley R. Johnson, director, Cooperative Extension Service, Iowa State University of Science and Technology, Ames, Iowa.

By Crop Reporting District: 2005 2004 2004-2005 Change
District $/acre $/acre $ %
Northwest 3,393 3,118 274 8.8%North Central 3,222 2,913 309 10.6%Northeast 2,963 2,665 298 11.2%West Central 3,048 2,728 320 11.7%Central 3,415 3,101 314 10.1%East Central 3,396 3,054 342 11.2%Southwest 2,350 2,088 262 12.5%South Central 1,793 1,547 246 15.9%Southeast 2,483 2,286 198 8.6%State Average 2,914 2,629 285 10.8%
Comparative Iowa Land Values2004–2005
Hancock 3,344 2,986 358 12.0%Hardin 3,387 3,080 307 10.0%Harrison 2,756 2,460 296 12.0%Henry 2,812 2,677 134 5.0%Howard 2,422 2,190 232 10.6%Humboldt 3,600 3,260 339 10.4%Ida 3,243 2,935 308 10.5%Iowa 2,708 2,370 338 14.3%Jackson 2,724 2,427 297 12.2%Jasper 2,924 2,687 238 8.8%Jefferson 2,099 1,916 184 9.6%Johnson 3,473 3,169 304 9.6%Jones 3,059 2,883 176 6.1%Keokuk 2,460 2,281 179 7.8%Kossuth 3,456 3,119 337 10.8%Lee 2,620 2,341 279 11.9%Linn 3,661 3,275 386 11.8%Louisa 2,918 2,579 339 13.1%Lucas 1,555 1,358 197 14.5%Lyon 3,088 2,938 149 5.1%Madison 2,427 2,136 290 13.6%Mahaska 2,619 2,362 257 10.9%Marion 2,563 2,136 427 20.0%Marshall 3,303 3,187 116 3.6%Mills 2,714 2,310 404 17.5%Mitchell 2,995 2,724 270 9.9%Monona 2,492 2,251 241 10.7%Monroe 1,718 1,418 300 21.1%Montgomery 2,404 2,103 301 14.3%Muscatine 3,311 2,976 336 11.3%O’Brien 3,811 3,463 348 10.0%Osceola 3,261 2,963 298 10.0%Page 2,206 1,994 212 10.6%Palo Alto 3,248 2,937 311 10.6%Plymouth 3,386 3,064 321 10.5%Pocahontas 3,547 3,210 337 10.5%Polk 3,180 2,893 288 9.9%Pottawattamie 2,973 2,627 347 13.2%Poweshiek 2,767 2,518 248 9.9%Ringgold 1,494 1,202 292 24.3%Sac 3,425 3,112 314 10.1%Scott 4,707 4,167 540 12.9%Shelby 2,925 2,614 311 11.9%Sioux 3,617 3,434 182 5.3%Story 3,679 3,362 317 9.4%Tama 3,015 2,760 255 9.2%Taylor 1,791 1,629 163 10.0%Union 1,927 1,684 243 14.5%Van Buren 1,850 1,614 236 14.6%Wapello 2,056 1,969 87 4.4%Warren 2,716 2,395 321 13.4%Washington 3,144 2,915 228 7.8%Wayne 1,485 1,312 172 13.1%Webster 3,732 3,394 338 10.0%Winnebago 3,013 2,725 288 10.6%Winneshiek 2,522 2,269 254 11.2%Woodbury 2,650 2,395 255 10.7%Worth 3,025 2,708 317 11.7%Wright 3,707 3,358 350 10.4%
2005 2004 2004–2005 County Name $/acre $/acre $ Change % Change
By County: 2005 2004 2004–2005County Name $/acre $/acre $ Change % Change
Adair 2,020 1,766 254 14.4%Adams 1,952 1,697 255 15.0%Allamakee 1,978 1,789 189 10.5%Appanoose 1,455 1,270 185 14.5%Audubon 2,824 2,421 403 16.6%Benton 3,314 3,015 299 9.9%Black Hawk 3,636 3,311 325 9.8%Boone 3,597 3,284 313 9.5%Bremer 3,345 3,027 317 10.5%Buchanan 3,289 2,976 313 10.5%Buena Vista 3,555 3,223 332 10.3%Butler 3,191 2,900 290 10.0%Calhoun 3,626 3,302 324 9.8%Carroll 3,307 3,054 252 8.3%Cass 2,610 2,279 331 14.5%Cedar 3,667 3,280 386 11.8%Cerro Gordo 3,302 2,995 307 10.2%Cherokee 3,186 2,890 297 10.3%Chickasaw 2,746 2,523 223 8.8%Clarke 1,607 1,327 280 21.1%Clay 3,281 2,974 307 10.3%Clayton 2,716 2,430 286 11.8%Clinton 3,157 2,939 218 7.4%Crawford 2,880 2,607 273 10.5%Dallas 3,167 2,947 220 7.5%Davis 1,676 1,461 214 14.7%Decatur 1,321 1,104 217 19.7%Delaware 3,494 3,059 434 14.2%Des Moines 2,947 2,840 107 3.8%Dickinson 3,049 2,771 278 10.0%Dubuque 3,267 2,949 318 10.8%Emmet 3,380 3,064 316 10.3%Fayette 3,032 2,671 360 13.5%Floyd 3,058 2,781 276 9.9%Franklin 3,273 2,962 312 10.5%Fremont 2,588 2,342 246 10.5%Greene 3,154 2,909 245 8.4%Grundy 3,759 3,493 267 7.6%Guthrie 2,643 2,388 255 10.7%Hamilton 3,785 3,442 343 10.0%

���������� ����� �� ������ ��� ������ ���������� �� ��� ���� ������������������������������ �� ��� ��������� !!"������������� � ��� �����#���$%��������������%���� ����������� !!"��� ��&��%����������������%���� ����������� !!'��� ���
!!"� ��� !!'���� �( ���) ��*!++ ,*+
* -� ,-*
*!', ..�
**+!*!-'
*-�.*'*'
*+��*'-*
* +� ,.'
* '+ ,*.
**+-*!-'
*�+- +,!
*"""* *
*"'.* �!
-"! *,"
* '* ,*"
*' "*��
*- -**!
', "�
++! -!.
**!.*!"'
*�"' ,!,
*'"-*��,
*-!!* -!
*.* **,'
*",.* +'
."- '-!
*.+"*''
*.!.**"+
**'' ,+-
*!�* . "
*! " .!+
**! ,,"
* .* ,-
**+.*!+!
*-.,**-
**!**�+.
�,.+�.+,
" -,
' �,!
,," . '
*!"+ .+�
.'- " *
*!* -.�
.�- '*!**'"
*! .*�,� ,!!
*.",*',*
*-*-**��
* +, ,.-
*','*!",
* -. ,',
*!�" .-!
**�'*!�"
*--�* ."
*!", ++*
*--.* +!
. ' ' .
*�". ,*,
'.!.'�-.
**�� ,.-
*'.**�-,
.!+ *.!
.-. "�+
, ' -+.
*�+! +,*
,�+���� ".,
,'. +'!
- ! *'�
+� -..
*�'' ,�"
'-! +�
-�, *-
"-* �*-
.�- *,"
!,,�,�-
!"-�,-,
�.�+�'�+
�"""�*"+
�-!.�* .
�+"!�-�'
�-.-�'-�
�'""� .!
�'+"�*�
�* ���!'
, " -�'
+ ' ' �
-'* *++
*�-. ,'.
,.* - .
-�! .,
! !�.--
' . �*-
.�' *�!
'!' �!*
�," �-,.
�, .�-+'
"++ *'
!-�,,'
�.,��- ,
�','� !

���������� ����� �� ������ ��� ������ ���������� �� ��� ��� ������������������������������� �� ��� ��������� !!"������������ �� ��� �����#���$%��������������%���� ���������� !!"��� ��&��%�����������������%������ ������% ��������%���� ����������� !!'���� ���
�/0(12
3���� ���% ��������� �( ���) �� !!'���� !!"
(���10�$4�$�5�
3460�/�07 �46� 84/��4�
1(��7�/�67
5����$��0
�09�:
�(��$4�
��4$$
9�1�;�0
�33��44�0
54�:40
(00
90��54��0�
5�/��7� 6��/��<$4�
(4����
=:054�$ :��<<4(9
5�((�
34$$�6�$$�5�0
�9�5� ���4� (����
����
��9�14� 34(7
5�:�/�((�$4:2144�0<:00�0��::4((�:�6=4:954�4��
�9�64491�:2 ��� ��(/4��
601�$0:
=:��7(�� 1:050:1�$(0:1�0���)��$� 34��/4�$�� /�514(9$
��4�>
(24�
4?1:�0�
4��04(� 64:$/
�0::4�<4:94=(429 �/��7���6
=�20$$0 �(�2$4�
6���0�/�07
/���4�7
/�:9��
/�::��4� �/0(12 <�$/:�0 9�((�� 8��30:
�9��: 5�9��4� 6�::0� 5�:�4� 7047�7
6�30((4 80==0:�4� /0�:2�(�:7054�$<450:2
$�2(4:3�<0 6�2�0 )���1�:0�90��$�: 9�)��
8��7�4�84�0�
90(�6�:01��/����
<:��92/�5�($4�
6:�</$�/0:47003(254�$/
3�(4��($4�(�2
�((�5�700/46�:95�$�/0((6���01�<49��7���4� 0550$ 74���$/
*!++"��@
* -��!�!@
*!',�!�!@
**+!�!�*@
*-�."�*@
*+���!�!@
* +��!�*@
* '+�!�-@
**+-�!�"@
*�+-�!�*@
*"""�!�*@
*"'.�!�"@
-"!�!�.@
* '*�!�"@
*' "�!��@
*- -,�+@
', �!�.@
++!�!�"@
**!.+�*@
*�"'+�'@
*'"-�!�+@
*-!!�!�'@
*.* �!�!@
*",.,�"@
."-� �!@
*.+"�!�!@
*.!.�!�'@
**''� �!@
*!�*�!�-@
*! "���.@
**! �!� @
* .*�!�"@
**+.�!�!@
*-.,,�'@
**!**�-@
�,.+�!�"@
" ��� @
' �!�-@
,,",�,@
*!"+,�,@
.'-+�+@
*!* �*�"@
.�-���+@**'"
�!�"@*�,��!�!@
*.",.�-@
*-*-,�+@
* +,�!�"@
*','�'� @
* -.�!�+@
*!�",� @
**�',�,@
*--����+@
*!",-��@
*--.���+@
. '� � @
*�"..�'@
'.!.� �,@
**�����*@
*'.*,�-@
.!+�'�*@
.-.,�,@
, '+�+@
*�+!,�,@
,�+������*��@
,'.*�+@
- !���,@
+� "�!@
*�''.�+@
'-!.�+@
-�,�!�,@
"-* !�!@
.�-�*�'@
!,,,�-@
!"-'�'@
�.�+ ���@
�"""�'�"@
�-!. ���@
�+"!�'�-@
�-.-�'�.@
�'""�'�"@
�'+"�*��@
�* ��,�.@
, "���,@
+ '�-�-@
-'*�!�.@
*�-..�"@
,.*�*� @
-�!�'�"@
! !�'�'@
' .�*�-@
.�'�.�"@
'!'�'�*@
�," �"�!@
�, .�'�"@
"++�!�"@
!-�!�-@
�.,��!�!@
�',' '�*@

0��� ����� �� ������ ��� ������ �������%��%�������� ��������� ��� ��� ������������� !!"�������� ������:��������9�������� ����%������:��������9������ �� �� ����%� �� ������� ���% ���������������� !!'��$%���� �� �� ����� ������������ �� ��� �����#��
!!"���� �( ���) �����������:��������9������
**+"�A� *'.�A��'*+ �'+*���+�-@
-",�A��. "�A�� " ��.,*
����"�,@
, "�A� �.�A��-�' �*"!
���� �"@
'!-,�A�*�. �A� *.*�*,-
������ @
*,*"�A�*�-"�A� *"**�'�"
����!��@
*-,�A� +**�A��,.!*�!'+
������.@
*" �A� +*'�A� !* �,-*
������ @
*"++�A� ,+ �A� " *�
����!�-@*+�*�A�*�,,�A� *+
*�*,*���+�+@

�������������� ����������������������������������������������������������������������������
3���� ���% ��������� �( ���) �� !!'���� !!"
������ ������ ��!���� "��
#�������� $�%��$������ &����'������ ���
(����
�����)�������
*����
(������
+�,,����� -���� $��(�����
&����� (�����
"�����
����.�
���� #���� (����.� /��.�. &��������
"���� (����� &������(�������� #����
(��������
0���1�-������� $�����
�����
�������
0�������. +����� ��)�����. ��)� +������#���1�� 2������
+���� +��.���"���!���������
(�������0����!����2���������������),���(�����
���
!���.-�). !������� $���)��� $�1�3��
&�1���� -������� -�����2�����
�������0��&���1���
�������� �����.�� !���� ����
0���4
"��� 5������
/������
&����1��
-�����.
$��.����� 6���� &����
'����
(������� -�)���
����.���)
&��������. #�����.��
����#���
�����2����
���������� -��1���� &���� '���.���!�����
!�����
'������ �������
57!���� ����

"�������8�9���8�9���:8�9;;;8<9���:8<9=;;(�������8<9���
$����� �����
!!"���� �( ���) ��
=�����B �"++
3 �B � !-
$ ����B��.,�
:�������B��','
�9� ���B��* �
6 ��B��'+"
��� ���B��'""
9 ��B��-.-
) �1���B��+"!
5���B �.�'
3��� � �� ��B �,.*
5��������B �'!'
�� �B��,"
�����B��, .
�� �#B��-!.
(�� B��"""
5����B��.�+
6 ����B �!"-
8�����B �!,,
/���B �+�
(B �- !
95���B �,'.
� B �-�!
�� ��B �! !
5 ����B �' .
6 ���B �.�-
5 ����B �"-*
5 % # B �-�,
7�#�#B �'-!
6 %������B*��'' (���
B �,�+
5�� ���B*�*��
�%���B �, "
/ �����B �."-
�������B �+ '
<��%��B �-'*
9 �� B*��-.
3��#B*��+!
8 ��B �, '
3��%�#B �.-.
��� B �.!+
8�%���B*�'.*
�� �B*�--.
�������B*��".
�����B'�.!.
8��B*�!",
8 �#��B �. '(���
B*�--�1����B*�*�'
$ � B*�!�"5 �% ��
B*�*!*�����B*�-.,
1���B*�",.
<��B*��"'
� �����B*�*!.
�� �����B �++!
5���� B �',
�� B*� '*
6�������B �-"!
� �B*�' "
� �%���B*�- -
/ ����B*�*+.
6���B*�.*
/ ������B*�.+"
<�����B*�.",
1� �#/ �#B*�-*-
1��% � �B*� +,
9� � �B*�','
9���C�B*� -.
3������%B*�*+-
�%��#B*��+-
1�� )�� B*�"""
3�� %��� B*�"'.
����DB*�-�.
(���B*�!++
4?1���B*�+��
�� �B*� +�
3 ������
B*� '+
4��� B*� -�
9��#����B*�!',
0���B*�*+!
7���%B*�'"-
6���� ��B*�!�*
6���%B*�! "
/ ����#B*�*''
����<����B*�*!
/�������B*�-!!
6���%�B*�.!.
=� �#���B*� .*
=����B*�!"+
5���%��B �,,"
/�� ��B �'
�%��# �B �.'-
1���B*�*'"1����
B*��,�
= ���B*�!*
�� ����B �.�-
6���%�#B �" ��� � #
B��,.+
Average Iowa Land Values
$0
$500
$1,000
$1,500
$2,000
$2,500
$3,000
1950
1953
1956
1959
1962
1965
1968
1971
1974
1977
1980
1983
1986
1989
1992
1995
1998
2001
2004
Percent Change in Iowa Land Values
-30%
-20%
-10%
0%
10%
20%
30%
40%
1951
1954
1957
1960
1963
1966
1969
1972
1975
1978
1981
1984
1987
1990
1993
1996
1999
2002
2005
*

Iowa Farm Land Values Adjusted for Inflation, 1982 - 1984 Dollars
$0
$500
$1,000
$1,500
$2,000
$2,500
$3,000
1950
1953
1956
1959
1962
1965
1968
1971
1974
1977
1980
1983
1986
1989
1992
1995
1998
2001
2004
Yearly Percent Change in Inflation Adjusted Iowa Land Values, 1982 - 1984 Dollars
-40%
-30%
-20%
-10%
0%
10%
20%
30%
1951
1954
1957
1960
1963
1966
1969
1972
1975
1978
1981
1984
1987
1990
1993
1996
1999
2002
2005
*

Who Purchased Iowa Farmland
0%
10%
20%
30%
40%
50%
60%
70%
80%
90%
1989 1990 1991 1992 1993 1994 1995 1996 1997 1998 1999 2000 2001 2002 2003 2004 2005
Existing Farmers Investors New Farmers Other
Percent Change in Sales Activity from Previous Year
0%
10%
20%
30%
40%
50%
60%
1986
1987
1988
1989
1990
1991
1992
1993
1994
1995
1996
1997
1998
1999
2000
2001
2002
2003
2004
2005
More Less Same

Percent of Respondents Identifying 2005 Positive Land Market Factors
0%
5%
10%
15%
20%
25%
30%
Low interest rates Good crop yields 1031 exchanges Governmentprograms
InvestmentDemand