2005 interim report - swire pacific limited attributable to company’s shareholders 7,326 3,004...
TRANSCRIPT
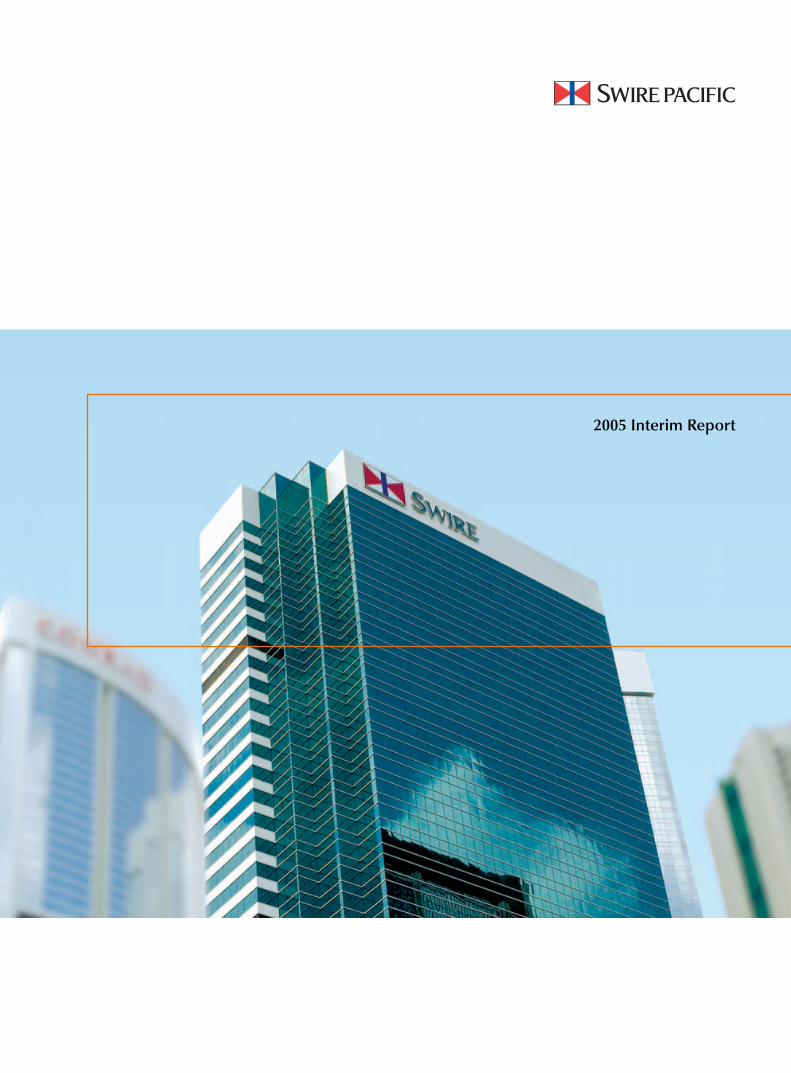
2005 Interim Report
INFORMATION FOR INVESTORS
Registered OfficeSwire Pacific Limited
35th Floor, Two Pacific Place
88 Queensway
Hong Kong
RegistrarsComputershare Hong Kong Investor Services Limited
46th Floor, Hopewell Centre
183 Queen’s Road East, Hong Kong
Website: www.computershare.com.hk
DepositaryThe Bank of New York
Investor Services
PO Box 11258
Church Street Station
New York, NY 10286-1258
U.S.A.
Website: www.stockbny.com
Email: [email protected]
Domestic toll free: 1-888-BNY-ADRs
International call: 610-382-7836
Stock Codes ‘A’ ‘B’Hong Kong Stock Exchange 19 87
ADR SWRAY SWRBY
Except for voting rights, which are equal, the entitlement of ‘A’
and ‘B’ shareholders are in the proportion 5 to 1.
Investor RelationsE-mail: [email protected]
Public AffairsE-mail: [email protected]
Tel: (852) 2840-8098
Fax: (852) 2526-9365
Website: www.swirepacific.com
Principal BankersThe Hongkong and Shanghai Banking Corporation Limited
Contents
1 Financial Highlights
2 Chairman’s Statement
3 Review of Operations
12 Financial Review
17 Credit Analysis
20 Condensed Consolidated Accounts
24 Notes to the Condensed Consolidated Accounts
38 Supplementary Information
1Swire Pacific Limited Interim Report 2005
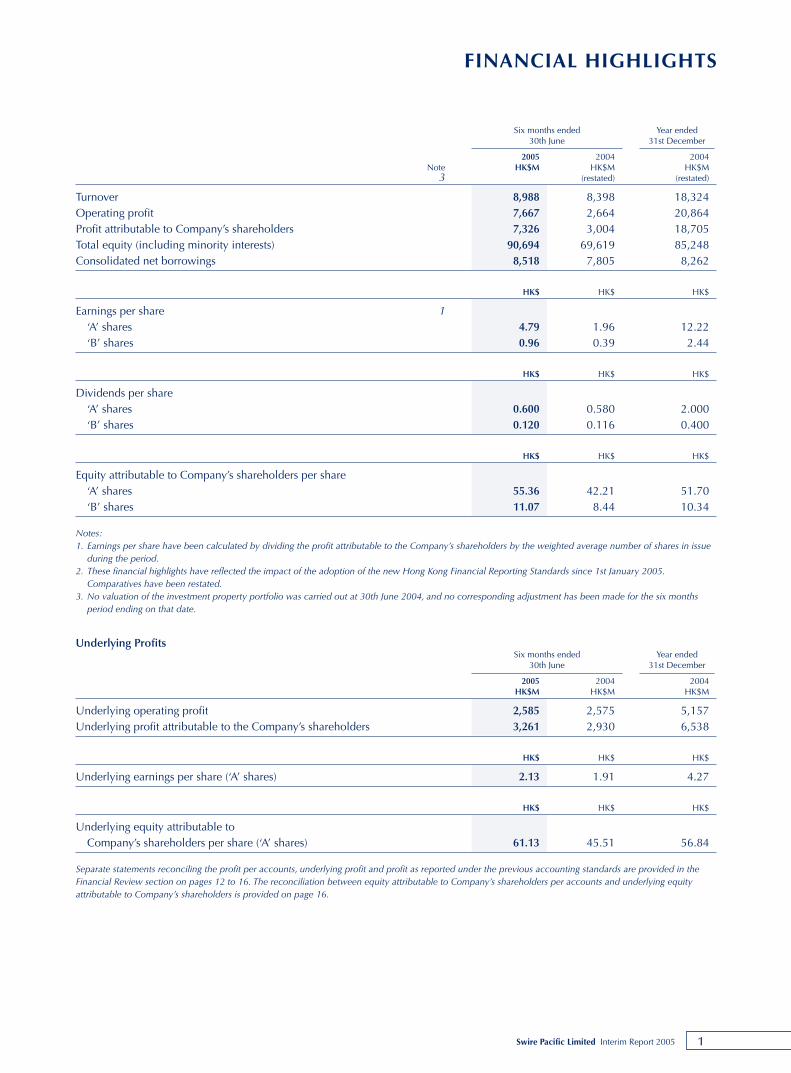
FINANCIAL HIGHLIGHTS
Six months ended Year ended30th June 31st December
2005 2004 2004Note HK$M HK$M HK$M
3 (restated) (restated)
Turnover 8,988 8,398 18,324 Operating profit 7,667 2,664 20,864 Profit attributable to Company’s shareholders 7,326 3,004 18,705 Total equity (including minority interests) 90,694 69,619 85,248 Consolidated net borrowings 8,518 7,805 8,262
HK$ HK$ HK$
Earnings per share 1‘A’ shares 4.79 1.96 12.22 ‘B’ shares 0.96 0.39 2.44
HK$ HK$ HK$
Dividends per share‘A’ shares 0.600 0.580 2.000 ‘B’ shares 0.120 0.116 0.400
HK$ HK$ HK$
Equity attributable to Company’s shareholders per share‘A’ shares 55.36 42.21 51.70 ‘B’ shares 11.07 8.44 10.34
Notes:1. Earnings per share have been calculated by dividing the profit attributable to the Company’s shareholders by the weighted average number of shares in issue
during the period.2. These financial highlights have reflected the impact of the adoption of the new Hong Kong Financial Reporting Standards since 1st January 2005.
Comparatives have been restated.3. No valuation of the investment property portfolio was carried out at 30th June 2004, and no corresponding adjustment has been made for the six months
period ending on that date.
Underlying ProfitsSix months ended Year ended
30th June 31st December
2005 2004 2004HK$M HK$M HK$M
Underlying operating profit 2,585 2,575 5,157 Underlying profit attributable to the Company’s shareholders 3,261 2,930 6,538
HK$ HK$ HK$
Underlying earnings per share (‘A’ shares) 2.13 1.91 4.27
HK$ HK$ HK$
Underlying equity attributable toCompany’s shareholders per share (‘A’ shares) 61.13 45.51 56.84
Separate statements reconciling the profit per accounts, underlying profit and profit as reported under the previous accounting standards are provided in theFinancial Review section on pages 12 to 16. The reconciliation between equity attributable to Company’s shareholders per accounts and underlying equityattributable to Company’s shareholders is provided on page 16.
2 Swire Pacific Limited Interim Report 2005
CHAIRMAN’S STATEMENT
Consolidated resultsThe profit attributable to shareholders for the first half of 2005
was HK$7,326 million. These results reflect the adoption of
new Hong Kong Financial Reporting Standards effective 1st
January 2005. Underlying attributable profits which adjust for
the impact of adopting Hong Kong Accounting Standard 40
and Interpretation 21 on investment properties and income
taxes, amounted to HK$3,261 million, 11% up on the
corresponding figure of HK$2,930 million in the first half
of 2004. Improved rental income and good growth in the
Beverages, Marine Services and Trading & Industrial Divisions
more than compensated for reduced contributions from airline
operations and residential sales.
Your directors have today declared interim dividends of
HK¢60.0 (2004: HK¢58.0) per ‘A’ share and HK¢12.0 (2004:
HK¢11.6) per ‘B’ share payable on 4th October 2005 to
shareholders registered at the close of business on 22nd
September 2005. The share registers will be closed from 16th
September to 22nd September, both dates inclusive.
Operating resultsThe Property Division had an encouraging first half with higher
occupancies and positive rental reversions seen towards the
end of the period. A total of 975,000 square feet of additional
office space was let during the period taking occupancy to
around 90%. Underlying profits for the division, however,
declined 4% from HK$1,483 million to HK$1,423 million
primarily as a result of reduced contributions from sales of
residential properties.
The Aviation Division reported a profit attributable to Swire
Pacific of HK$952 million, some 2% lower than in the
corresponding period in 2004. This reflects sharply higher
fuel prices and a significant reduction in fuel hedging gains.
Demand for both passenger and cargo capacity has remained
strong enabling yields to be maintained notwithstanding the
introduction of new capacity. Contributions from non-airline
operations in the division have shown good growth, in
particular from aircraft engineering operations in Hong Kong
and Mainland China.
The Beverages, Marine Services and Trading & Industrial
Divisions’ combined profits attributable to Swire Pacific grew
29% to HK$870 million with particularly strong growth
enjoyed by Taikoo Motors, Swire Resources, Swire Pacific
Offshore and Beverage operations on the Mainland.
FinanceThe group’s financial position remains strong with gearing of
9% at 30th June 2005, and interest cover of 20.5 for the half
year. Committed but undrawn facilities totalled HK$2,484
million. Since 30th June, Swire Properties has agreed to make
a final payment in respect of the Taikoo Shing land premium in
an amount of HK$1,531 million.
Corporate governance and financialreportingThe group has adopted the Hong Kong Financial Reporting
Standards in presenting these interim accounts. Detailed
analysis of the impact on these financial statements is provided
in the Financial Review.
ProspectsWith only limited new supply and growing demand, office
rentals and occupancies are likely to continue their upward
trend. The second half will also see a pick-up in profits from
strong sales of residential apartments in Miami.
Prospects for the Aviation Division are more mixed with the
likelihood of continued high fuel prices restricting profit
growth.
With buoyant offshore oil services demand and continued high
consumer spending across the region, profits from the other
divisions are expected to be strong in the second half.
On 30th July 2005, the Company’s offer to sell its entire
17.62% interest in Modern Terminals Limited (“MTL”) for a total
consideration of HK$2,900 million was accepted by two of the
other shareholders of MTL pursuant to the provisions on
pre-emption rights contained in its articles of association.
David Turnbull
Chairman
Hong Kong, 11th August 2005
3Swire Pacific Limited Interim Report 2005
REVIEW OF OPERATIONS
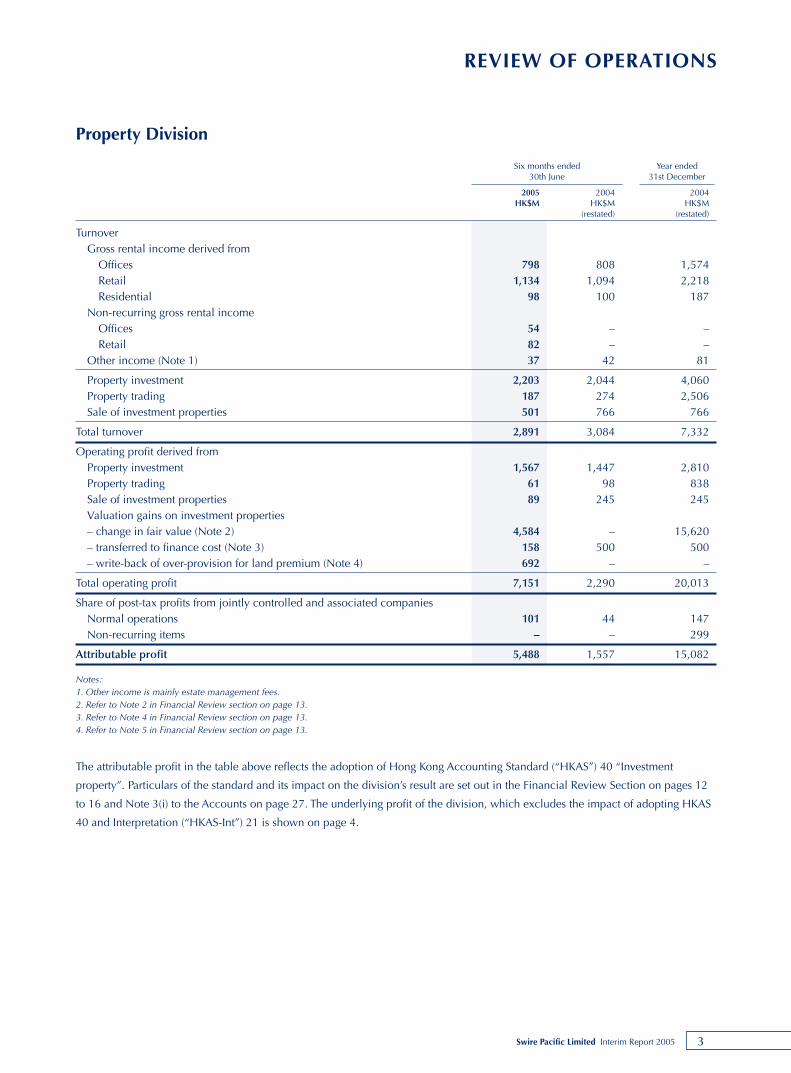
Property Division
Six months ended Year ended30th June 31st December
2005 2004 2004HK$M HK$M HK$M
(restated) (restated)
TurnoverGross rental income derived from
Offices 798 808 1,574Retail 1,134 1,094 2,218Residential 98 100 187
Non-recurring gross rental incomeOffices 54 – –Retail 82 – –
Other income (Note 1) 37 42 81
Property investment 2,203 2,044 4,060Property trading 187 274 2,506Sale of investment properties 501 766 766
Total turnover 2,891 3,084 7,332
Operating profit derived fromProperty investment 1,567 1,447 2,810Property trading 61 98 838Sale of investment properties 89 245 245Valuation gains on investment properties– change in fair value (Note 2) 4,584 – 15,620– transferred to finance cost (Note 3) 158 500 500– write-back of over-provision for land premium (Note 4) 692 – –
Total operating profit 7,151 2,290 20,013
Share of post-tax profits from jointly controlled and associated companiesNormal operations 101 44 147Non-recurring items – – 299
Attributable profit 5,488 1,557 15,082
Notes:1. Other income is mainly estate management fees.2. Refer to Note 2 in Financial Review section on page 13.3. Refer to Note 4 in Financial Review section on page 13.4. Refer to Note 5 in Financial Review section on page 13.
The attributable profit in the table above reflects the adoption of Hong Kong Accounting Standard (“HKAS”) 40 “Investment
property”. Particulars of the standard and its impact on the division’s result are set out in the Financial Review Section on pages 12
to 16 and Note 3(i) to the Accounts on page 27. The underlying profit of the division, which excludes the impact of adopting HKAS
40 and Interpretation (“HKAS-Int”) 21 is shown on page 4.
4 Swire Pacific Limited Interim Report 2005
REVIEW OF OPERATIONS
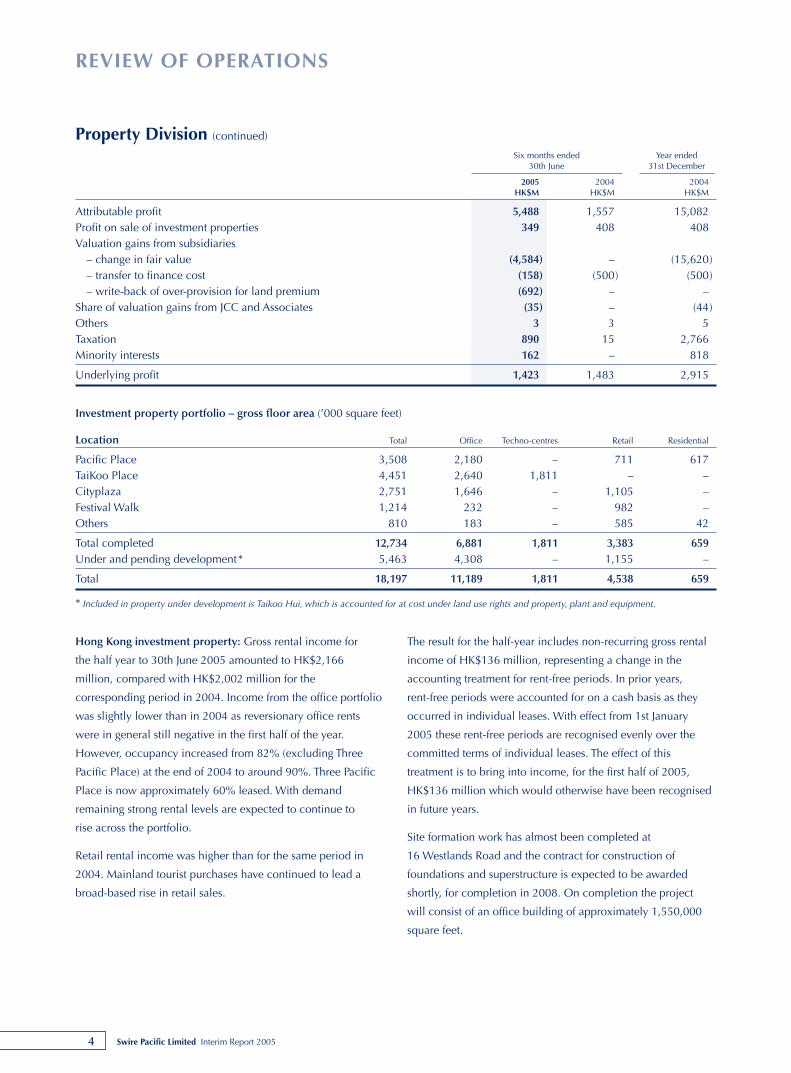
Hong Kong investment property: Gross rental income for
the half year to 30th June 2005 amounted to HK$2,166
million, compared with HK$2,002 million for the
corresponding period in 2004. Income from the office portfolio
was slightly lower than in 2004 as reversionary office rents
were in general still negative in the first half of the year.
However, occupancy increased from 82% (excluding Three
Pacific Place) at the end of 2004 to around 90%. Three Pacific
Place is now approximately 60% leased. With demand
remaining strong rental levels are expected to continue to
rise across the portfolio.
Retail rental income was higher than for the same period in
2004. Mainland tourist purchases have continued to lead a
broad-based rise in retail sales.
The result for the half-year includes non-recurring gross rental
income of HK$136 million, representing a change in the
accounting treatment for rent-free periods. In prior years,
rent-free periods were accounted for on a cash basis as they
occurred in individual leases. With effect from 1st January
2005 these rent-free periods are recognised evenly over the
committed terms of individual leases. The effect of this
treatment is to bring into income, for the first half of 2005,
HK$136 million which would otherwise have been recognised
in future years.
Site formation work has almost been completed at
16 Westlands Road and the contract for construction of
foundations and superstructure is expected to be awarded
shortly, for completion in 2008. On completion the project
will consist of an office building of approximately 1,550,000
square feet.
Property Division (continued)
Six months ended Year ended30th June 31st December
2005 2004 2004HK$M HK$M HK$M
Attributable profit 5,488 1,557 15,082Profit on sale of investment properties 349 408 408Valuation gains from subsidiaries
– change in fair value (4,584) – (15,620)– transfer to finance cost (158) (500) (500)– write-back of over-provision for land premium (692) – –
Share of valuation gains from JCC and Associates (35) – (44)Others 3 3 5Taxation 890 15 2,766Minority interests 162 – 818
Underlying profit 1,423 1,483 2,915
Investment property portfolio – gross floor area (’000 square feet)
Location Total Office Techno-centres Retail Residential
Pacific Place 3,508 2,180 – 711 617TaiKoo Place 4,451 2,640 1,811 – –Cityplaza 2,751 1,646 – 1,105 –Festival Walk 1,214 232 – 982 –Others 810 183 – 585 42
Total completed 12,734 6,881 1,811 3,383 659Under and pending development* 5,463 4,308 – 1,155 –
Total 18,197 11,189 1,811 4,538 659
* Included in property under development is Taikoo Hui, which is accounted for at cost under land use rights and property, plant and equipment.
5Swire Pacific Limited Interim Report 2005
REVIEW OF OPERATIONS
Valuation of investment properties: The portfolio of
investment properties was valued at 30th June 2005 by
professionally-qualified executives of the group. As a result
of this valuation, Swire Pacific’s operating profit increased
by HK$4,584 million, reflecting the continuing recovery in
office rentals and benchmarks set by recent transactions
in the market.
Hong Kong property trading: All remaining inventory at
Ocean Shores and Tung Chung Crescent was sold in the first
half of the year. The development at 2A-2E Seymour Road will
proceed once outstanding approvals have been obtained.
Sale of investment properties: Thirteen units at The Albany
were sold in the first half of 2005, and the building is now
sold out.
Hotels: The three hotels at Pacific Place, the JW Marriott,
Conrad Hong Kong and Island Shangri-La, have benefited from
high occupancy and increased room rates. At the Mandarin
Oriental Miami results continue to improve.
Mainland China: Work has commenced at the Taikoo Hui
mixed-use commercial development in Guangzhou, in which
Swire Properties has a 97% stake, with completion expected
in late 2008. A number of other opportunities on the Mainland
are being actively explored.
USA: Construction has been completed at The Carbonell, a
284-unit condominium tower on Brickell Key, Miami. 283 units
have been sold, and closings will commence shortly. Work is
underway at Asia, a 123-unit condominum tower also on
Brickell Key scheduled for completion in the first half of 2007.
The project is around 88% sold. All units at Jade Residences
have now been handed over to purchasers.
Taikoo Shing arbitration: The claim by the Hong Kong SAR
Government Lands Department for land premium in relation to
the Cityplaza Four, Cityplaza Three and Cityplaza One office
towers was upheld in an arbitration award announced in
January 2001. In July 2003 the Court of Final Appeal refused
to grant Swire Properties leave to appeal on a point of law.
Following a fresh hearing held in February 2004, the arbitrator
determined that the valuation dates for the purpose of
quantifying the amount of land premium on the office towers
should be the dates on which occupation permits were issued
for each of the buildings, and that interest should be calculated
at two-thirds of HIBID from those valuation dates.
Swire Properties and the Lands Department have been engaged
in discussions to settle land premium figures for the Cityplaza
office towers at the respective valuation dates. Those
discussions have now concluded and the amount of land
premium has been agreed to be HK$2,900 million.
Interest at two-thirds of HIBID from the relevant valuation dates
to early September 2005 is calculated to be HK$658 million,
of which HK$500 million was charged to profit and loss
account in 2004 and the balance of HK$158 million in the first
half of 2005. The total amount of premium and premium
interest payable in relation to the Cityplaza office towers
assuming a payment date in early September 2005 is now
estimated to be HK$3,558 million. Swire Properties made a
payment on account of premium to Government in an amount
of HK$2,027 million in August 2004. A further payment of
approximately HK$1,531 million is expected to be made in
early September 2005, representing the balance of premium
and premium interest.
An amount of HK$4,250 million was provided in the Swire
Pacific group accounts for the year ended 31st December 2000
in relation to the Cityplaza office towers. This compares with
the total amount of HK$3,558 million now estimated. The
balance of HK$692 million remaining from the provision made
in 2000 was credited to the profit and loss account in the first
half of 2005. Prior to 2005 this amount of overprovision would
have been credited to the group’s property valuation reserve:
following the group’s adoption of the new Hong Kong
Accounting Standards for the year commencing 1st January
2005, property valuation movements have been shown as part
of the group’s operating profit for the year.
6 Swire Pacific Limited Interim Report 2005
REVIEW OF OPERATIONS
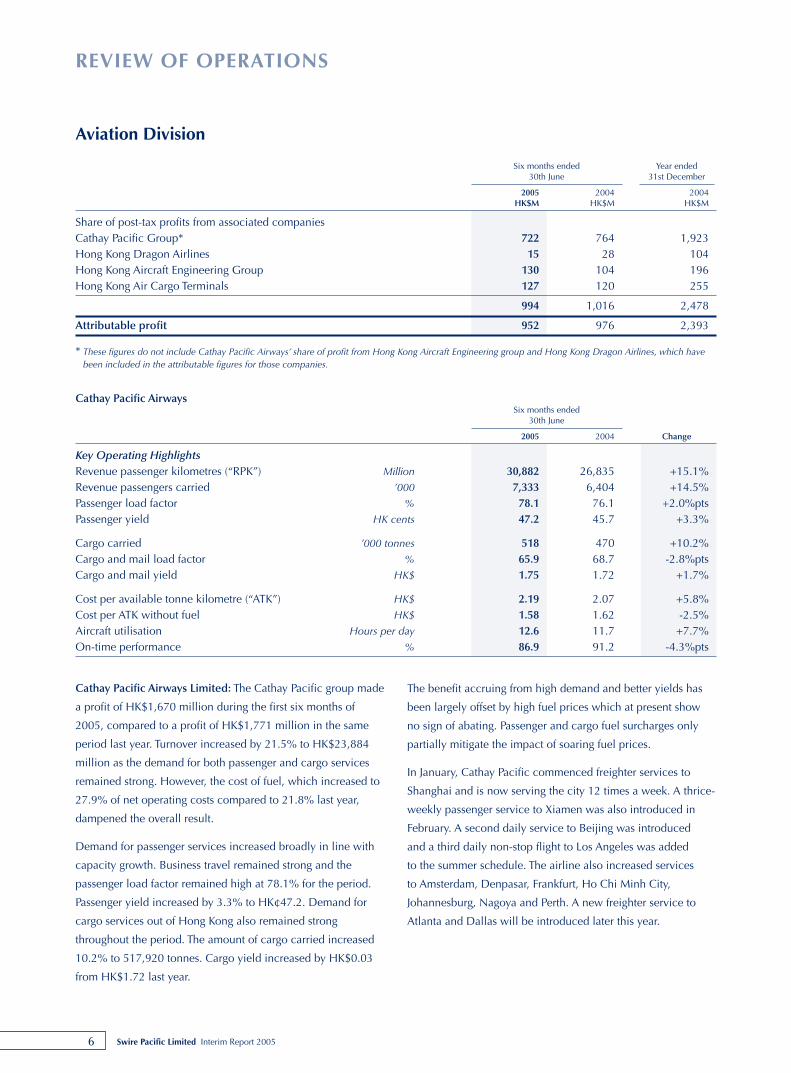
Cathay Pacific Airways Limited: The Cathay Pacific group made
a profit of HK$1,670 million during the first six months of
2005, compared to a profit of HK$1,771 million in the same
period last year. Turnover increased by 21.5% to HK$23,884
million as the demand for both passenger and cargo services
remained strong. However, the cost of fuel, which increased to
27.9% of net operating costs compared to 21.8% last year,
dampened the overall result.
Demand for passenger services increased broadly in line with
capacity growth. Business travel remained strong and the
passenger load factor remained high at 78.1% for the period.
Passenger yield increased by 3.3% to HK¢47.2. Demand for
cargo services out of Hong Kong also remained strong
throughout the period. The amount of cargo carried increased
10.2% to 517,920 tonnes. Cargo yield increased by HK$0.03
from HK$1.72 last year.
The benefit accruing from high demand and better yields has
been largely offset by high fuel prices which at present show
no sign of abating. Passenger and cargo fuel surcharges only
partially mitigate the impact of soaring fuel prices.
In January, Cathay Pacific commenced freighter services to
Shanghai and is now serving the city 12 times a week. A thrice-
weekly passenger service to Xiamen was also introduced in
February. A second daily service to Beijing was introduced
and a third daily non-stop flight to Los Angeles was added
to the summer schedule. The airline also increased services
to Amsterdam, Denpasar, Frankfurt, Ho Chi Minh City,
Johannesburg, Nagoya and Perth. A new freighter service to
Atlanta and Dallas will be introduced later this year.
Aviation Division
Six months ended Year ended30th June 31st December
2005 2004 2004HK$M HK$M HK$M
Share of post-tax profits from associated companiesCathay Pacific Group* 722 764 1,923 Hong Kong Dragon Airlines 15 28 104 Hong Kong Aircraft Engineering Group 130 104 196 Hong Kong Air Cargo Terminals 127 120 255
994 1,016 2,478
Attributable profit 952 976 2,393
* These figures do not include Cathay Pacific Airways’ share of profit from Hong Kong Aircraft Engineering group and Hong Kong Dragon Airlines, which havebeen included in the attributable figures for those companies.
Cathay Pacific AirwaysSix months ended
30th June
2005 2004 Change
Key Operating HighlightsRevenue passenger kilometres (“RPK”) Million 30,882 26,835 +15.1%Revenue passengers carried ’000 7,333 6,404 +14.5%Passenger load factor % 78.1 76.1 +2.0%ptsPassenger yield HK cents 47.2 45.7 +3.3%
Cargo carried ’000 tonnes 518 470 +10.2%Cargo and mail load factor % 65.9 68.7 -2.8%ptsCargo and mail yield HK$ 1.75 1.72 +1.7%
Cost per available tonne kilometre (“ATK”) HK$ 2.19 2.07 +5.8%Cost per ATK without fuel HK$ 1.58 1.62 -2.5%Aircraft utilisation Hours per day 12.6 11.7 +7.7%On-time performance % 86.9 91.2 -4.3%pts
7Swire Pacific Limited Interim Report 2005
REVIEW OF OPERATIONS
Cathay Pacific took delivery of a new Boeing B747-400
freighter, one B777-300 and two Airbus A330-300 passenger
aircraft in the first six months of the year. An additional A330-
300 aircraft will be delivered in the second half of this year
and three used B747-400 passenger aircraft and a B747-400
Special Freighter currently undergoing conversion at TAECO,
will enter service by the end of the year.
The company’s strategic partnership with Air China was further
cemented with the signing of accords to code-share on flights
and to participate in frequent flyer programmes.
While forward bookings are encouraging, the high price of
fuel may make it difficult for the company to achieve a similar
result in the second half. Delivering superior service and value
for money remains the airline’s focus as it continues to expand
its network and strengthen Hong Kong as a global aviation hub.
AHK Air Hong Kong Limited (“AHK”): In the first half of 2005
AHK took delivery of two new A300-600 freighters, increasing
its fleet to seven. AHK now operates overnight express cargo
services to seven destinations in Asia, namely Bangkok, Osaka,
Penang, Seoul, Singapore, Taipei and Tokyo.
With the expansion of its freighter network, capacity has
increased by 71.5%. Load factor decreased to 57.1% while
yield increased by 4.1% assisted by the focus on the regional
express cargo market.
Hong Kong Dragon Airlines Limited (“Dragonair”): Dragonair
recorded lower interim profits in 2005 as a result of the adverse
impact of increasing fuel prices.
Passenger revenue increased significantly with the airline
carrying 2.4 million passengers, 15.5% higher than last year.
Passenger load factor increased by 2.8 percentage points while
the passenger yield decreased by 0.6%.
Demand for cargo was robust. 179,931 tonnes of cargo were
carried during the period, representing growth of 21.8% over
last year. Cargo yield remained stable whilst the cargo load
factor decreased by 2.5 percentage points.
In April, the airline commenced its first trans-Pacific freighter
service to New York. Two A330s and one A320 joined the fleet
in the first six months and as a result Dragonair had a fleet of
33 aircraft at the end of June. One A330 will be delivered in
October 2005.
Hong Kong Aircraft Engineering Company (“HAECO”): The
HAECO group achieved an attributable profit of HK$289
million (2004: HK$232 million). Profit after tax from Taikoo
(Xiamen) Aircraft Engineering Company Limited (“TAECO”)
and Hong Kong Aero Engine Services Limited (“HAESL”)
improved by 26% and 38% respectively and contributions after
tax from these businesses totalled HK$160 million (2004:
HK$119 million).
Aircraft traffic through the Hong Kong International Airport, and
consequently HAECO’s line maintenance business, continued
to show good growth. Demand for heavy maintenance work
in Hong Kong and Xiamen continued to be robust, with both
facilities fully occupied for most of the period.
Construction of the new two-storey office on the cargo apron
and a second hangar at the Hong Kong International Airport
are in progress. The two facilities are expected to open in early
2006 and 2007 respectively. The fourth hangar in Xiamen will
start operations in November 2005.
The first Boeing B747-400 passenger to freighter aircraft
conversion for Cathay Pacific commenced in March at
TAECO. The aircraft is scheduled for redelivery before the
end of the year.
Hong Kong Air Cargo Terminals (“Hactl”): Hactl reported 5.6%
growth in tonnage for the first half of 2005. Exports and
transhipments showed good growth over 2004 while imports
were slightly lower.
Cathay Pacific Catering Services Group: The airline catering
group recorded a satisfactory interim profit due to increased
meal volumes. However the profit margin declined due to
considerable pressure on prices.
The overseas flight kitchens generally performed well in the
first half of 2005 although the Vietnam operation was adversely
affected by a fall in tourist traffic as a result of the recurrence
of avian flu.
Hong Kong Airport Services Limited (“HAS”): HAS recorded
good growth in revenue and interim profit with the increase in
traffic at the Hong Kong International Airport.
8 Swire Pacific Limited Interim Report 2005
REVIEW OF OPERATIONS
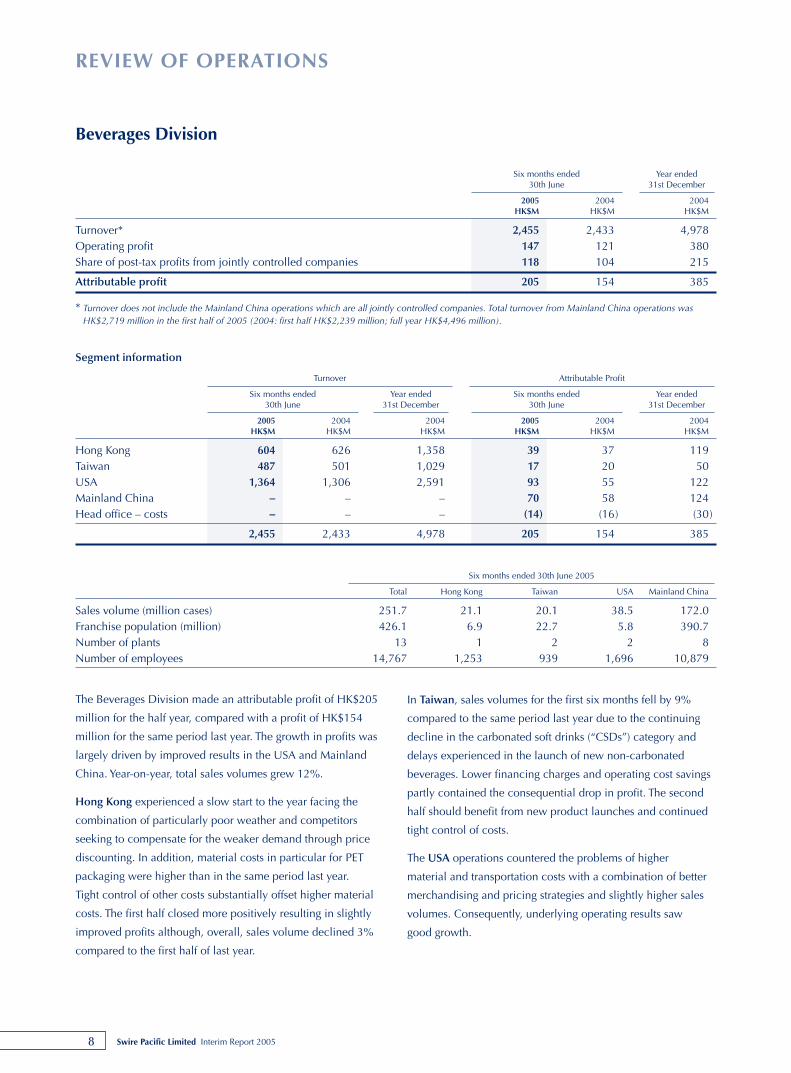
The Beverages Division made an attributable profit of HK$205
million for the half year, compared with a profit of HK$154
million for the same period last year. The growth in profits was
largely driven by improved results in the USA and Mainland
China. Year-on-year, total sales volumes grew 12%.
Hong Kong experienced a slow start to the year facing the
combination of particularly poor weather and competitors
seeking to compensate for the weaker demand through price
discounting. In addition, material costs in particular for PET
packaging were higher than in the same period last year.
Tight control of other costs substantially offset higher material
costs. The first half closed more positively resulting in slightly
improved profits although, overall, sales volume declined 3%
compared to the first half of last year.
In Taiwan, sales volumes for the first six months fell by 9%
compared to the same period last year due to the continuing
decline in the carbonated soft drinks (“CSDs”) category and
delays experienced in the launch of new non-carbonated
beverages. Lower financing charges and operating cost savings
partly contained the consequential drop in profit. The second
half should benefit from new product launches and continued
tight control of costs.
The USA operations countered the problems of higher
material and transportation costs with a combination of better
merchandising and pricing strategies and slightly higher sales
volumes. Consequently, underlying operating results saw
good growth.
Beverages Division
Six months ended Year ended30th June 31st December
2005 2004 2004HK$M HK$M HK$M
Turnover* 2,455 2,433 4,978Operating profit 147 121 380Share of post-tax profits from jointly controlled companies 118 104 215
Attributable profit 205 154 385
* Turnover does not include the Mainland China operations which are all jointly controlled companies. Total turnover from Mainland China operations wasHK$2,719 million in the first half of 2005 (2004: first half HK$2,239 million; full year HK$4,496 million).
Segment information
Turnover Attributable Profit
Six months ended Year ended Six months ended Year ended30th June 31st December 30th June 31st December
2005 2004 2004 2005 2004 2004HK$M HK$M HK$M HK$M HK$M HK$M
Hong Kong 604 626 1,358 39 37 119Taiwan 487 501 1,029 17 20 50USA 1,364 1,306 2,591 93 55 122Mainland China – – – 70 58 124Head office – costs – – – (14) (16) (30)
2,455 2,433 4,978 205 154 385
Six months ended 30th June 2005
Total Hong Kong Taiwan USA Mainland China
Sales volume (million cases) 251.7 21.1 20.1 38.5 172.0Franchise population (million) 426.1 6.9 22.7 5.8 390.7Number of plants 13 1 2 2 8Number of employees 14,767 1,253 939 1,696 10,879
9Swire Pacific Limited Interim Report 2005
REVIEW OF OPERATIONS
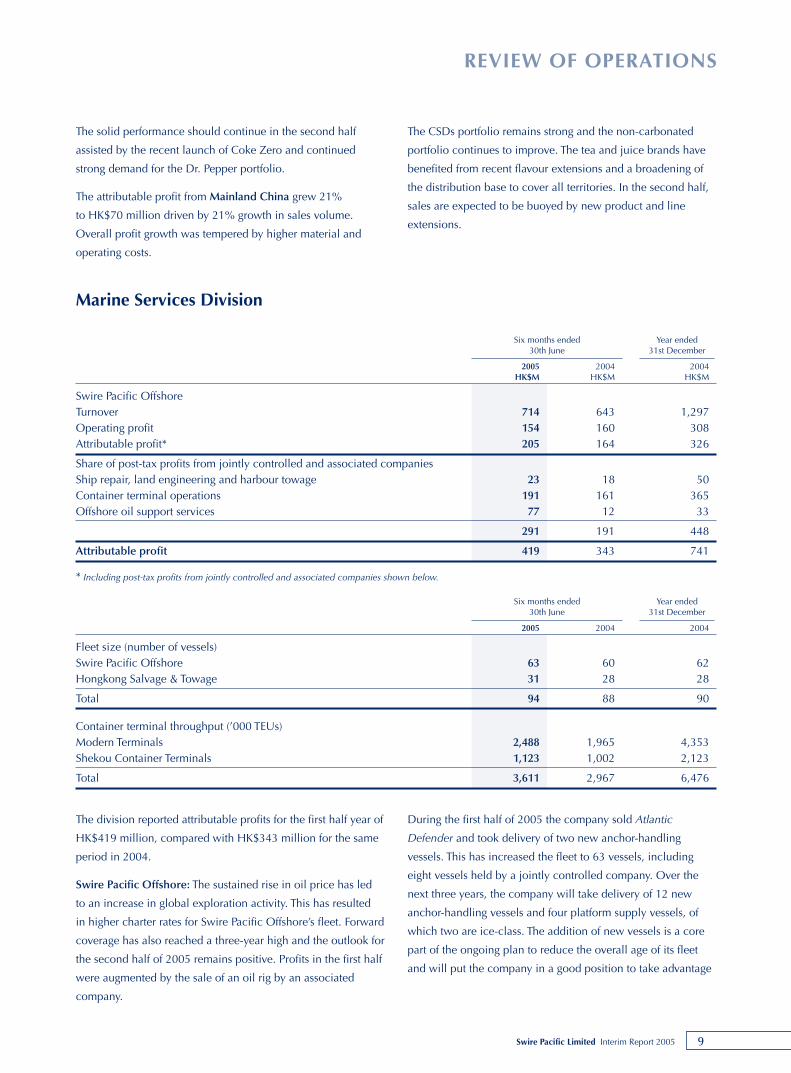
The division reported attributable profits for the first half year of
HK$419 million, compared with HK$343 million for the same
period in 2004.
Swire Pacific Offshore: The sustained rise in oil price has led
to an increase in global exploration activity. This has resulted
in higher charter rates for Swire Pacific Offshore’s fleet. Forward
coverage has also reached a three-year high and the outlook for
the second half of 2005 remains positive. Profits in the first half
were augmented by the sale of an oil rig by an associated
company.
During the first half of 2005 the company sold Atlantic
Defender and took delivery of two new anchor-handling
vessels. This has increased the fleet to 63 vessels, including
eight vessels held by a jointly controlled company. Over the
next three years, the company will take delivery of 12 new
anchor-handling vessels and four platform supply vessels, of
which two are ice-class. The addition of new vessels is a core
part of the ongoing plan to reduce the overall age of its fleet
and will put the company in a good position to take advantage
Marine Services Division
Six months ended Year ended30th June 31st December
2005 2004 2004HK$M HK$M HK$M
Swire Pacific OffshoreTurnover 714 643 1,297Operating profit 154 160 308Attributable profit* 205 164 326
Share of post-tax profits from jointly controlled and associated companiesShip repair, land engineering and harbour towage 23 18 50Container terminal operations 191 161 365Offshore oil support services 77 12 33
291 191 448
Attributable profit 419 343 741
* Including post-tax profits from jointly controlled and associated companies shown below.
Six months ended Year ended30th June 31st December
2005 2004 2004
Fleet size (number of vessels)Swire Pacific Offshore 63 60 62Hongkong Salvage & Towage 31 28 28
Total 94 88 90
Container terminal throughput (’000 TEUs)Modern Terminals 2,488 1,965 4,353Shekou Container Terminals 1,123 1,002 2,123
Total 3,611 2,967 6,476
The solid performance should continue in the second half
assisted by the recent launch of Coke Zero and continued
strong demand for the Dr. Pepper portfolio.
The attributable profit from Mainland China grew 21%
to HK$70 million driven by 21% growth in sales volume.
Overall profit growth was tempered by higher material and
operating costs.
The CSDs portfolio remains strong and the non-carbonated
portfolio continues to improve. The tea and juice brands have
benefited from recent flavour extensions and a broadening of
the distribution base to cover all territories. In the second half,
sales are expected to be buoyed by new product and line
extensions.
10 Swire Pacific Limited Interim Report 2005
REVIEW OF OPERATIONS
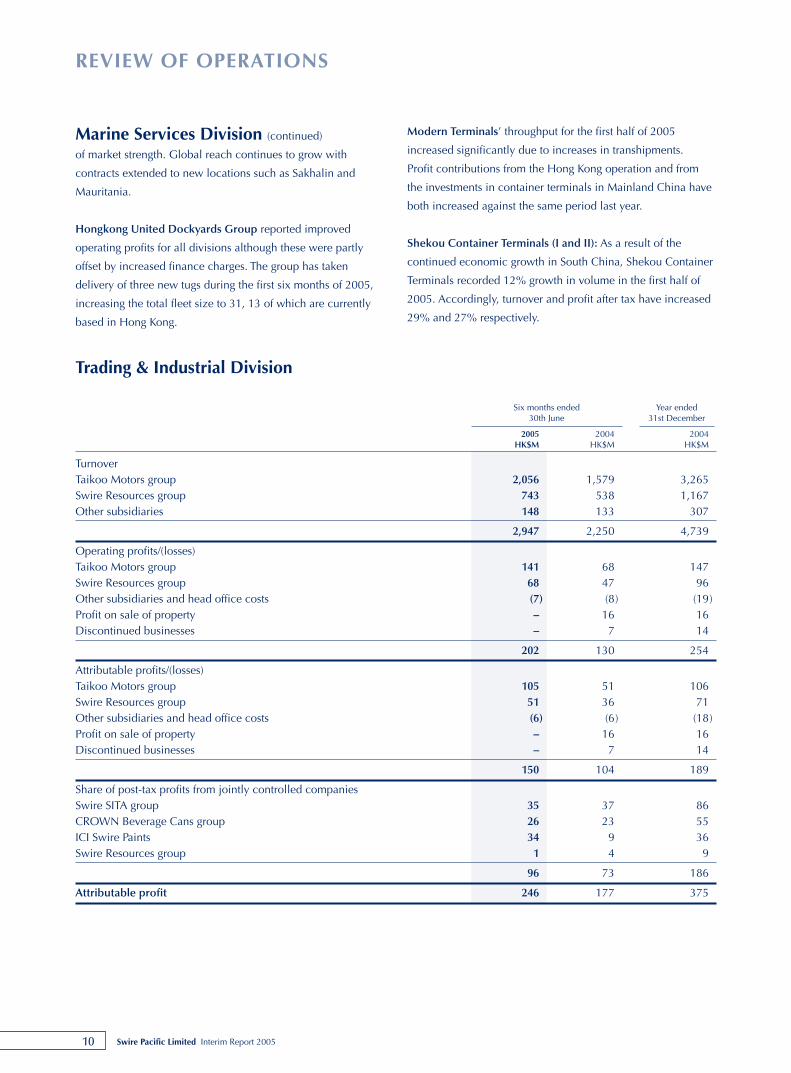
Trading & Industrial Division
Six months ended Year ended30th June 31st December
2005 2004 2004HK$M HK$M HK$M
TurnoverTaikoo Motors group 2,056 1,579 3,265Swire Resources group 743 538 1,167Other subsidiaries 148 133 307
2,947 2,250 4,739
Operating profits/(losses)Taikoo Motors group 141 68 147Swire Resources group 68 47 96Other subsidiaries and head office costs (7) (8) (19)Profit on sale of property – 16 16Discontinued businesses – 7 14
202 130 254
Attributable profits/(losses)Taikoo Motors group 105 51 106Swire Resources group 51 36 71Other subsidiaries and head office costs (6) (6) (18)Profit on sale of property – 16 16Discontinued businesses – 7 14
150 104 189
Share of post-tax profits from jointly controlled companiesSwire SITA group 35 37 86CROWN Beverage Cans group 26 23 55ICI Swire Paints 34 9 36Swire Resources group 1 4 9
96 73 186
Attributable profit 246 177 375
Marine Services Division (continued)
of market strength. Global reach continues to grow with
contracts extended to new locations such as Sakhalin and
Mauritania.
Hongkong United Dockyards Group reported improved
operating profits for all divisions although these were partly
offset by increased finance charges. The group has taken
delivery of three new tugs during the first six months of 2005,
increasing the total fleet size to 31, 13 of which are currently
based in Hong Kong.
Modern Terminals’ throughput for the first half of 2005
increased significantly due to increases in transhipments.
Profit contributions from the Hong Kong operation and from
the investments in container terminals in Mainland China have
both increased against the same period last year.
Shekou Container Terminals (I and II): As a result of the
continued economic growth in South China, Shekou Container
Terminals recorded 12% growth in volume in the first half of
2005. Accordingly, turnover and profit after tax have increased
29% and 27% respectively.
11Swire Pacific Limited Interim Report 2005
REVIEW OF OPERATIONS
The division reported a half year attributable profit of HK$246
million, a 39% increase on the first half of 2004.
Taikoo Motors Taiwan reported a profit of HK$105 million in
the first half of 2005 compared to HK$51 million in the same
period last year. The company sold 7,608 vehicles, 29% ahead
of the same period last year and well above the 13% growth in
the overall Taiwan imported car market. Margins have benefited
from the Taiwan dollar appreciation during the period. The
company commenced distribution of VW light commercial
vehicles in the first quarter and initial results are encouraging.
Sales of Volvo trucks and buses regained momentum in the first
half of the year and the forward order book is firm. Prospects
for the company in the second half
are sound.
Swire Resources, the division’s sports shoe and apparel
distribution and retail company, saw strong sales and profit
growth in the first half, ahead of the same period last year by
38% and 30% respectively. The company is distributor for 17
brands in Hong Kong and two brands in Mainland China with
94 shops in Hong Kong and 44 shops in Shanghai and Beijing.
Margins improved due to reduced discounting and favourable
sales mix with sales of sports accessories and apparel growing
at a faster rate than that for sports shoes. Most brands in the
portfolio performed well with sales of Puma and Columbia
particularly strong. The outlook for the second half of 2005 is
positive.
Taikoo Sugar reported a loss of HK$2.3 million in the first half
of the year compared to a loss of HK$2.2 million in the same
period last year. Sales in Hong Kong were flat with retail
margins under pressure. Substantial sales growth was achieved
in Mainland China.
Swire Duro reported a loss of HK$2.2 million in the first half of
2005 compared to a loss of HK$2.8 million in the same period
last year. Prospects for the second half are more encouraging.
Swire SITA Waste Services’ profit was in line with the same
period last year. The Hong Kong transfer stations and landfills
recorded higher waste receipts. Waste volumes for the
company’s waste-to-energy incinerator in Kaohsiung, Taiwan,
were adequate but fees continued to be low. Construction of
the hazardous waste incinerator in Shanghai, in which the
company has a 40% interest, is progressing as planned with
operations scheduled to start in July 2006.
The CROWN Beverage Cans group returned a HK$26 million
post-tax profit attributable to the group in the first half of 2005
compared to HK$23 million for the same period in 2004.
Demand from the beverage industry in Mainland China
continued to be strong with sales volume up 20% in the first
half. Margins fell due to the higher aluminium price. The Hanoi
plant reported improved earnings on the back of robust sales
growth. Prospects for the second half are satisfactory although
margins will continue to be under pressure from higher raw
material and power costs.
ICI Swire Paints reported a post-tax profit of HK$34 million
attributable to the group in the first half of 2005, a substantial
increase over the HK$9 million for the first half of 2004.
Sales in Hong Kong were flat while sales in Mainland China
recorded robust volume growth of 23%. The company
continues to increase its product portfolio and is expanding
its distribution network. Higher raw material costs have been
generally offset by retail price increases. The profit in the first
half year was lifted by the write-back of rebate provisions from
2004 amounting to HK$18 million. Prospects for the second
half are encouraging.
12 Swire Pacific Limited Interim Report 2005
FINANCIAL REVIEW
Additional information is provided below to illustrate the
impact and key changes on the group’s financial results and
positions arising from the adoption of the new Hong Kong
Financial Reporting Standards (“HKFRS”). These statements set
out the reconciliations between profit per accounts, underlying
profit and profit as reported under the previous accounting
standards in effect until 31st December 2004 (the “Old HKAS”)
for the periods ending 30th June 2005, 31st December and
30th June 2004. In addition there is a reconciliation between
equity attributable to Company’s shareholders per accounts and
underlying equity attributable to Company’s shareholders
ended on those same dates.
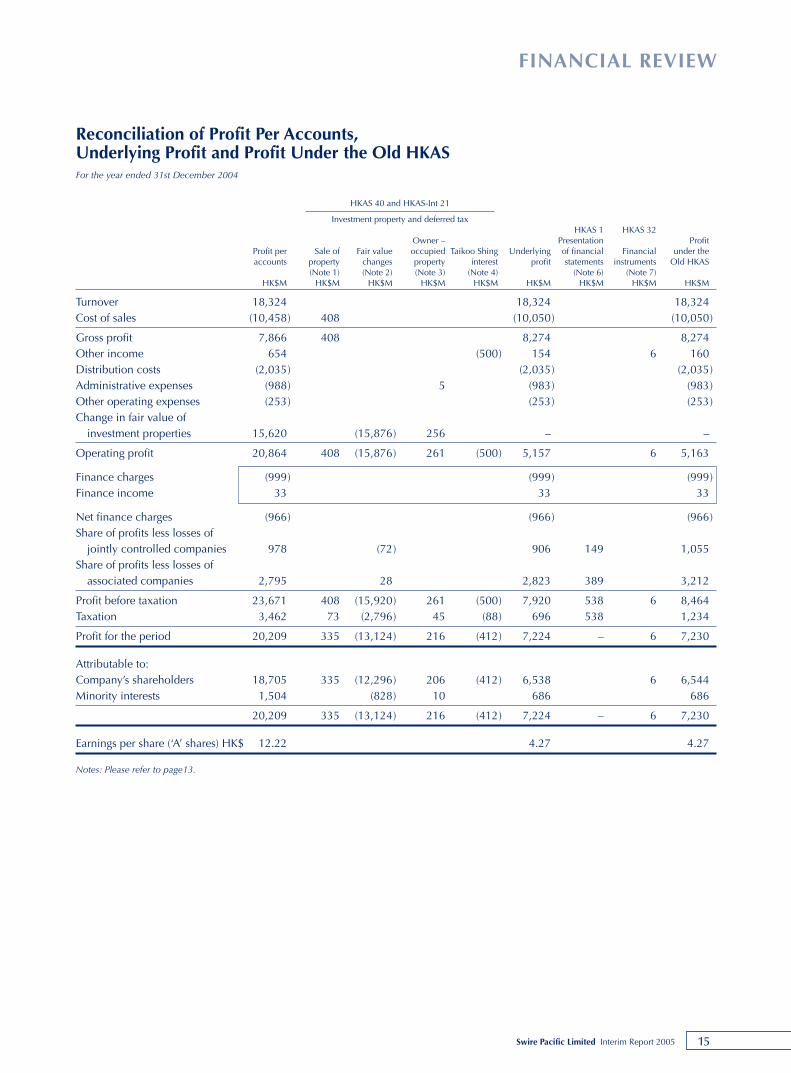
Reconciliation of Profit Per Accounts,Underlying Profit and Profit Under the Old HKASfor the six months ended 30th June 2005
HKAS 40 and HKAS-Int 21
Investment property and deferred taxHKAS 1 HKAS 32 /
Owner – Write-back Presentation HKAS 39 ProfitProfit per Sale of Fair value occupied Taikoo Shing of land Underlying of financial Financial under the accounts property changes property interest premium profit statements instruments Old HKAS
(Note 1) (Note 2) (Note 3) (Note 4) (Note 5) (Note 6) (Note 7)HK$M HK$M HK$M HK$M HK$M HK$M HK$M HK$M HK$M HK$M
Turnover 8,988 8,988 8,988Cost of sales (5,136) 349 (4,787) (4,787)
Gross profit 3,852 349 4,201 4,201Other income 954 (158) (692) 104 (51) 53Distribution costs (1,087) (1,087) (1,087)Administrative
expenses (527) 3 (524) (524)Other operating
expenses (109) (109) (109)Change in fair value
of investmentproperties 4,584 (4,681) 97 – –
Operating profit 7,667 349 (4,681) 100 (158) (692) 2,585 (51) 2,534
Finance charges (389) (389) (32) (421)Finance income 15 15 – 15
Net finance charges (374) (374) (32) (406)Share of profits less
losses of jointlycontrolled companies 419 (30) 389 71 460
Share of profits less losses of associatedcompanies 1,181 (5) 1,176 235 (98) 1,313
Profit before taxation 8,893 349 (4,716) 100 (158) (692) 3,776 306 (181) 3,901Taxation 1,152 62 (820) 17 (28) (121) 262 306 (12) 556
Profit for the period 7,741 287 (3,896) 83 (130) (571) 3,514 – (169) 3,345
Attributable to:Company’s shareholders 7,326 287 (3,732) 81 (130) (571) 3,261 (169) 3,092Minority interests 415 (164) 2 253 253
7,741 287 (3,896) 83 (130) (571) 3,514 – (169) 3,345
Earnings per share (’A’ shares) HK$ 4.79 2.13 2.02
13Swire Pacific Limited Interim Report 2005
FINANCIAL REVIEW
3. Reclassification of owner-occupied investment properties
Under HKAS 40, the portion of owner-occupied investment
properties should be reclassified and accounted for as property,
plant and equipment under HKAS 16 and subject to annual
depreciation unless that portion of investment properties
cannot be sold separately. Prior to 2005 an exemption was
applied under the Old HKAS where owner-occupied portion
represented less than 15% of the properties.
4. Transfer from property valuation reserve to profit and loss
account of finance cost relating to land premium
This adjustment represents the release of an amount previously
charged against the property valuation reserve in relation to the
Taikoo Shing Arbitration, but transferred to finance cost when
the quantum of premium was determined. For the six months
ended 30th June 2005 this amount was HK$158 million, whilst
for the six months ended 30th June 2004 and year ended
31st December 2004 the amount was HK$500 million, an
amount determined at the time a payment on account was
made in 2004.
5. Write-back of overprovision of land premium
This represents the amount of HK$692 million overprovided in
2000 in respect of the Taikoo Shing Arbitration premium and
interest. Under HKAS 40 such a movement must be released
in the profit and loss account, where previously it would have
been released as a movement in the property valuation reserve.
6. Reclassification of taxation
The share of profits less losses of jointly controlled and
associated companies are shown after tax in accordance with
HKAS 1. Previously, tax had been shown separately.
7. Remeasurements of financial liabilities and change in fair
value of derivative financial instruments
This represents the remeasurements of financial liabilities
as well as the movements in fair value of those derivative
financial instruments which do not qualify as effective hedging
instruments. Further details can be found in Note 3 (iii) and (iv)
to the Accounts on pages 27 and 28.
Notes:
1. Profit on sale of investment properties
Under the former accounting policy, when an investment
property was sold the amount shown in the profit and loss
account represented the difference between the selling price
and cost and a transfer was made between profit and loss
account and property valuation reserve, representing the
difference between cost and the carrying value. Under HKAS
40, the amount shown in the profit and loss account on sale of
an investment property is the difference between selling price
and carrying value.
2. (a) Change in fair value of investment properties
This adjustment is the amount by which the group’s
investment property increased in fair value during the
first half of 2005 and the full year of 2004, which
hitherto had been credited to the group’s property
valuation reserve. Under HKAS 40 all movements in
fair value are now shown in the profit and loss account,
and the cumulative amount of the property valuation
reserve as at 31st December 2004 has been transferred
to revenue reserves (see Note 16 to the Accounts). No
valuation of the investment property portfolio was
carried out at 30th June 2004, and no corresponding
adjustment has been made for the six-month period
ended on that date.
2. (b) Deferred taxation in respect of change in fair value of
investment properties
HKAS Interpretation 21 requires that deferred taxation be
provided in respect of valuation surpluses and deficits on
leasehold investment property at profits tax rates. This
adjustment therefore provides for taxation on the change
in fair value of investment properties for the six months
ended 30th June 2005 and the year ended 31st
December 2004. Capital gains arising on sale of property
in Hong Kong are not subject to taxation.
14 Swire Pacific Limited Interim Report 2005
FINANCIAL REVIEW
Reconciliation of Profit Per Accounts,Underlying Profit and Profit Under the Old HKASFor the six months ended 30th June 2004
HKAS 40 and HKAS-Int 21
Investment property and deferred taxHKAS 1 HKAS 32
Owner – Presentation ProfitProfit per Sale of Fair value occupied Taikoo Shing Underlying of financial Financial under the accounts property changes property interest profit statements instruments Old HKAS
(Note 1) (Note 2) (Note 3) (Note 4) (Note 6) (Note 7)HK$M HK$M HK$M HK$M HK$M HK$M HK$M HK$M HK$M
Turnover 8,398 8,398 8,398Cost of sales (4,762) 408 (4,354) (4,354)
Gross profit 3,636 408 4,044 4,044Other income 586 (500) 86 22 108Distribution costs (968) (968) (968)Administrative expenses (503) 3 (500) (500)Other operating expenses (87) (87) (87)Change in fair value of
investment properties – – –
Operating profit 2,664 408 3 (500) 2,575 22 2,597
Finance charges (688) (688) (688)Finance income 16 16 16
Net finance charges (672) (672) (672)Share of profits less losses of
jointly controlled companies 257 257 52 309Share of profits less losses
of associated companies 1,171 1,171 192 1,363
Profit before taxation 3,420 408 3 (500) 3,331 244 22 3,597Taxation 205 73 (88) 190 244 434
Profit for the period 3,215 335 3 (412) 3,141 – 22 3,163
Attributable to:Company’s shareholders 3,004 335 3 (412) 2,930 22 2,952Minority interests 211 211 211
3,215 335 3 (412) 3,141 – 22 3,163
Earnings per share (‘A’ shares) HK$ 1.96 1.91 1.93
Notes: Please refer to page13.
15Swire Pacific Limited Interim Report 2005
FINANCIAL REVIEW
Reconciliation of Profit Per Accounts,Underlying Profit and Profit Under the Old HKASFor the year ended 31st December 2004
HKAS 40 and HKAS-Int 21
Investment property and deferred taxHKAS 1 HKAS 32
Owner – Presentation ProfitProfit per Sale of Fair value occupied Taikoo Shing Underlying of financial Financial under the accounts property changes property interest profit statements instruments Old HKAS
(Note 1) (Note 2) (Note 3) (Note 4) (Note 6) (Note 7)HK$M HK$M HK$M HK$M HK$M HK$M HK$M HK$M HK$M
Turnover 18,324 18,324 18,324Cost of sales (10,458) 408 (10,050) (10,050)
Gross profit 7,866 408 8,274 8,274Other income 654 (500) 154 6 160Distribution costs (2,035) (2,035) (2,035)Administrative expenses (988) 5 (983) (983)Other operating expenses (253) (253) (253)Change in fair value of
investment properties 15,620 (15,876) 256 – –
Operating profit 20,864 408 (15,876) 261 (500) 5,157 6 5,163
Finance charges (999) (999) (999)Finance income 33 33 33
Net finance charges (966) (966) (966)Share of profits less losses of
jointly controlled companies 978 (72) 906 149 1,055Share of profits less losses of
associated companies 2,795 28 2,823 389 3,212
Profit before taxation 23,671 408 (15,920) 261 (500) 7,920 538 6 8,464Taxation 3,462 73 (2,796) 45 (88) 696 538 1,234
Profit for the period 20,209 335 (13,124) 216 (412) 7,224 – 6 7,230
Attributable to:Company’s shareholders 18,705 335 (12,296) 206 (412) 6,538 6 6,544Minority interests 1,504 (828) 10 686 686
20,209 335 (13,124) 216 (412) 7,224 – 6 7,230
Earnings per share (‘A’ shares) HK$ 12.22 4.27 4.27
Notes: Please refer to page13.
16 Swire Pacific Limited Interim Report 2005
FINANCIAL REVIEW
Reconciliation of Equity Attributable to Company’s Shareholders Per Accounts andUnderlying Equity Attributable to Company’s Shareholders
Underlying equity attributable to Company’s shareholders ignores the impact of deferred tax on property revaluations required
under HKAS 40 and HKAS-Int 21.
30th June 31st December
2005 2004 2004HK$M HK$M HK$M
(Note 1)
Equity attributable to Company’s shareholders per accounts 84,751 64,632 79,157
HKAS 40 adjustments (net) 8,837 5,040 7,862
Underlying equity attributable to Company’s shareholders 93,588 69,672 87,019 Underlying minority interests 6,433 5,254 6,544
Underlying total equity 100,021 74,926 93,563
HK$ HK$ HK$
Equity attributable to Company’s shareholders per share (‘A’ shares)Per accounts 55.36 42.21 51.70 Underlying 61.13 45.51 56.84
Note 1: These adjustments are based on cumulative valuation gains as at 1st January 2004 since no revaluation was carried out at 30th June 2004.
17Swire Pacific Limited Interim Report 2005
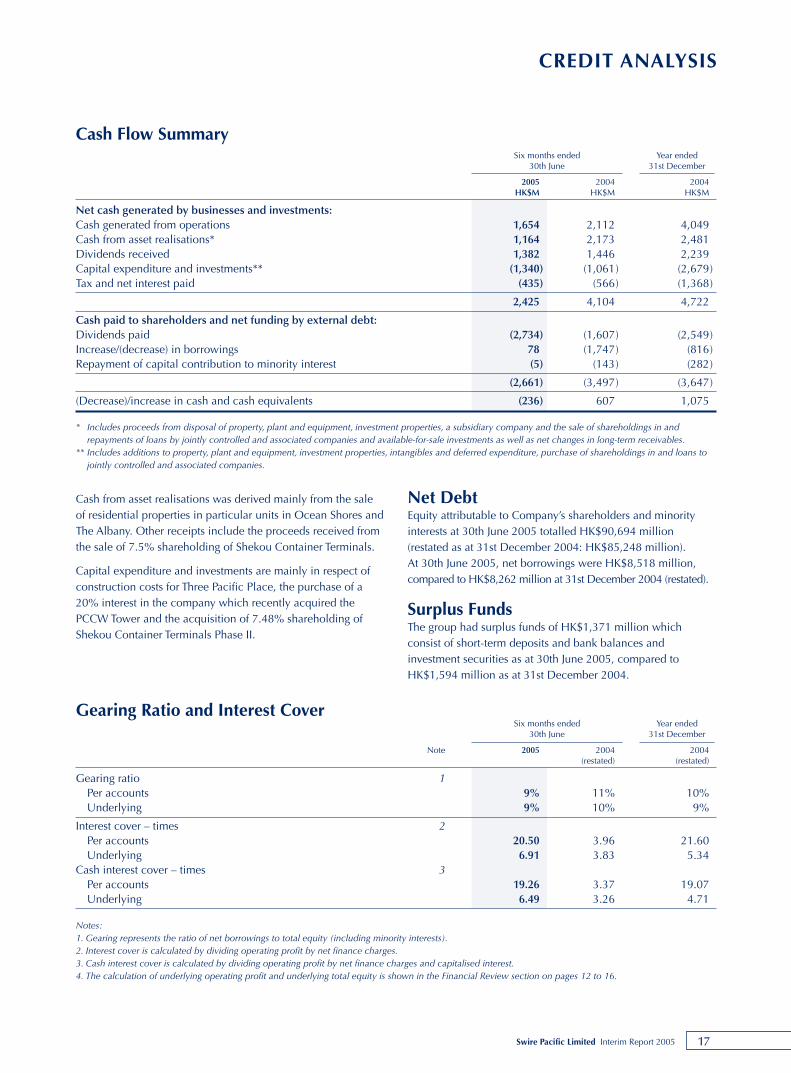
CREDIT ANALYSIS
Cash from asset realisations was derived mainly from the saleof residential properties in particular units in Ocean Shores andThe Albany. Other receipts include the proceeds received fromthe sale of 7.5% shareholding of Shekou Container Terminals.
Capital expenditure and investments are mainly in respect ofconstruction costs for Three Pacific Place, the purchase of a20% interest in the company which recently acquired thePCCW Tower and the acquisition of 7.48% shareholding ofShekou Container Terminals Phase II.
Net DebtEquity attributable to Company’s shareholders and minorityinterests at 30th June 2005 totalled HK$90,694 million(restated as at 31st December 2004: HK$85,248 million). At 30th June 2005, net borrowings were HK$8,518 million,compared to HK$8,262 million at 31st December 2004 (restated).
Surplus FundsThe group had surplus funds of HK$1,371 million whichconsist of short-term deposits and bank balances andinvestment securities as at 30th June 2005, compared toHK$1,594 million as at 31st December 2004.
Cash Flow SummarySix months ended Year ended
30th June 31st December
2005 2004 2004HK$M HK$M HK$M
Net cash generated by businesses and investments:Cash generated from operations 1,654 2,112 4,049Cash from asset realisations* 1,164 2,173 2,481Dividends received 1,382 1,446 2,239Capital expenditure and investments** (1,340) (1,061) (2,679)Tax and net interest paid (435) (566) (1,368)
2,425 4,104 4,722
Cash paid to shareholders and net funding by external debt:Dividends paid (2,734) (1,607) (2,549)Increase/(decrease) in borrowings 78 (1,747) (816)Repayment of capital contribution to minority interest (5) (143) (282)
(2,661) (3,497) (3,647)
(Decrease)/increase in cash and cash equivalents (236) 607 1,075
* Includes proceeds from disposal of property, plant and equipment, investment properties, a subsidiary company and the sale of shareholdings in andrepayments of loans by jointly controlled and associated companies and available-for-sale investments as well as net changes in long-term receivables.
** Includes additions to property, plant and equipment, investment properties, intangibles and deferred expenditure, purchase of shareholdings in and loans tojointly controlled and associated companies.
Gearing Ratio and Interest CoverSix months ended Year ended
30th June 31st December
Note 2005 2004 2004(restated) (restated)
Gearing ratio 1Per accounts 9% 11% 10%Underlying 9% 10% 9%
Interest cover – times 2Per accounts 20.50 3.96 21.60Underlying 6.91 3.83 5.34
Cash interest cover – times 3Per accounts 19.26 3.37 19.07Underlying 6.49 3.26 4.71
Notes:1. Gearing represents the ratio of net borrowings to total equity (including minority interests).2. Interest cover is calculated by dividing operating profit by net finance charges.3. Cash interest cover is calculated by dividing operating profit by net finance charges and capitalised interest.4. The calculation of underlying operating profit and underlying total equity is shown in the Financial Review section on pages 12 to 16.
18 Swire Pacific Limited Interim Report 2005
CREDIT ANALYSIS
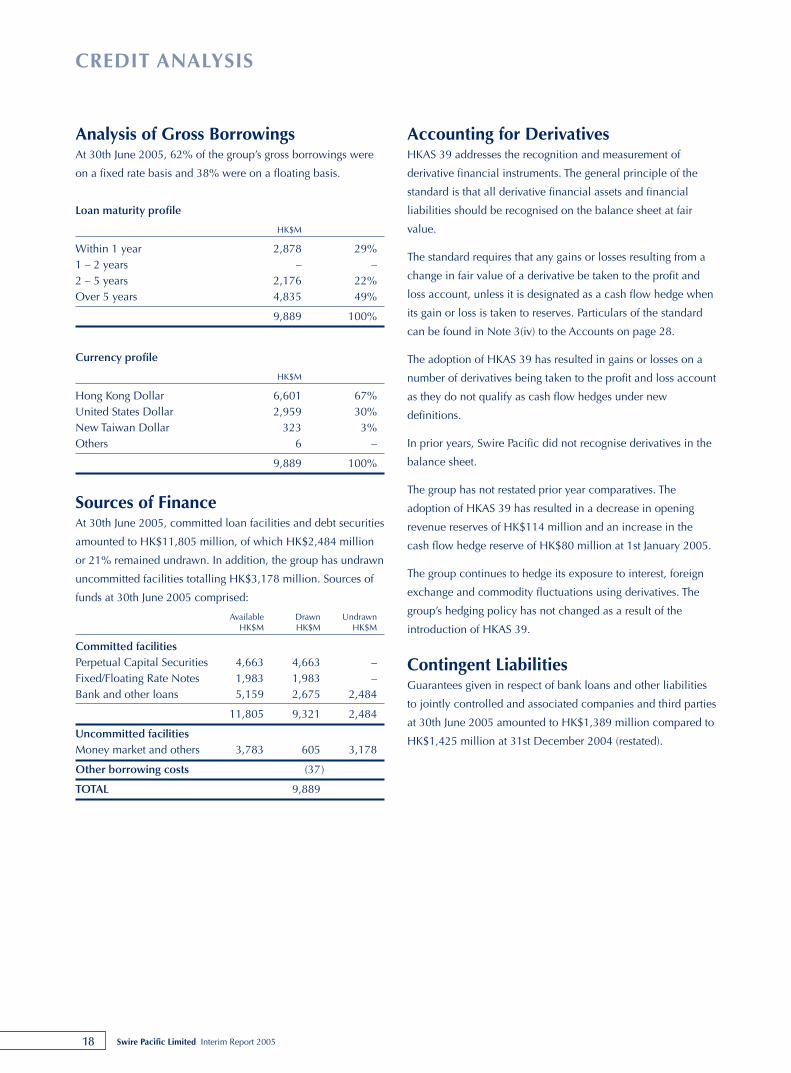
Analysis of Gross BorrowingsAt 30th June 2005, 62% of the group’s gross borrowings were
on a fixed rate basis and 38% were on a floating basis.
Loan maturity profile
HK$M
Within 1 year 2,878 29%1 – 2 years – –2 – 5 years 2,176 22%Over 5 years 4,835 49%
9,889 100%
Currency profile
HK$M
Hong Kong Dollar 6,601 67%United States Dollar 2,959 30%New Taiwan Dollar 323 3%Others 6 –
9,889 100%
Sources of FinanceAt 30th June 2005, committed loan facilities and debt securities
amounted to HK$11,805 million, of which HK$2,484 million
or 21% remained undrawn. In addition, the group has undrawn
uncommitted facilities totalling HK$3,178 million. Sources of
funds at 30th June 2005 comprised:
Available Drawn UndrawnHK$M HK$M HK$M
Committed facilitiesPerpetual Capital Securities 4,663 4,663 –Fixed/Floating Rate Notes 1,983 1,983 –Bank and other loans 5,159 2,675 2,484
11,805 9,321 2,484
Uncommitted facilitiesMoney market and others 3,783 605 3,178
Other borrowing costs (37)
TOTAL 9,889
Accounting for DerivativesHKAS 39 addresses the recognition and measurement of
derivative financial instruments. The general principle of the
standard is that all derivative financial assets and financial
liabilities should be recognised on the balance sheet at fair
value.
The standard requires that any gains or losses resulting from a
change in fair value of a derivative be taken to the profit and
loss account, unless it is designated as a cash flow hedge when
its gain or loss is taken to reserves. Particulars of the standard
can be found in Note 3(iv) to the Accounts on page 28.
The adoption of HKAS 39 has resulted in gains or losses on a
number of derivatives being taken to the profit and loss account
as they do not qualify as cash flow hedges under new
definitions.
In prior years, Swire Pacific did not recognise derivatives in the
balance sheet.
The group has not restated prior year comparatives. The
adoption of HKAS 39 has resulted in a decrease in opening
revenue reserves of HK$114 million and an increase in the
cash flow hedge reserve of HK$80 million at 1st January 2005.
The group continues to hedge its exposure to interest, foreign
exchange and commodity fluctuations using derivatives. The
group’s hedging policy has not changed as a result of the
introduction of HKAS 39.
Contingent LiabilitiesGuarantees given in respect of bank loans and other liabilities
to jointly controlled and associated companies and third parties
at 30th June 2005 amounted to HK$1,389 million compared to
HK$1,425 million at 31st December 2004 (restated).
19Swire Pacific Limited Interim Report 2005
CREDIT ANALYSIS
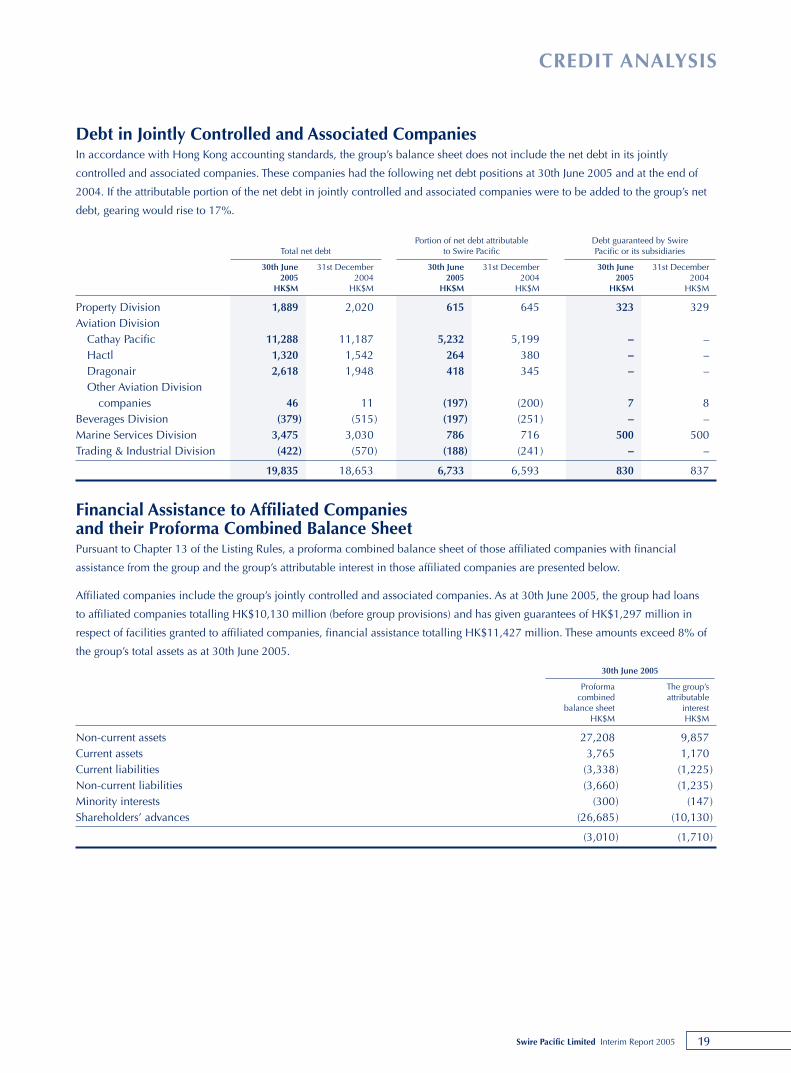
Debt in Jointly Controlled and Associated CompaniesIn accordance with Hong Kong accounting standards, the group’s balance sheet does not include the net debt in its jointly
controlled and associated companies. These companies had the following net debt positions at 30th June 2005 and at the end of
2004. If the attributable portion of the net debt in jointly controlled and associated companies were to be added to the group’s net
debt, gearing would rise to 17%.
Portion of net debt attributable Debt guaranteed by Swire Total net debt to Swire Pacific Pacific or its subsidiaries
30th June 31st December 30th June 31st December 30th June 31st December2005 2004 2005 2004 2005 2004
HK$M HK$M HK$M HK$M HK$M HK$M
Property Division 1,889 2,020 615 645 323 329Aviation Division
Cathay Pacific 11,288 11,187 5,232 5,199 – –Hactl 1,320 1,542 264 380 – –Dragonair 2,618 1,948 418 345 – –Other Aviation Division
companies 46 11 (197) (200) 7 8Beverages Division (379) (515) (197) (251) – –Marine Services Division 3,475 3,030 786 716 500 500Trading & Industrial Division (422) (570) (188) (241) – –
19,835 18,653 6,733 6,593 830 837
Financial Assistance to Affiliated Companies and their Proforma Combined Balance SheetPursuant to Chapter 13 of the Listing Rules, a proforma combined balance sheet of those affiliated companies with financial
assistance from the group and the group’s attributable interest in those affiliated companies are presented below.
Affiliated companies include the group’s jointly controlled and associated companies. As at 30th June 2005, the group had loans
to affiliated companies totalling HK$10,130 million (before group provisions) and has given guarantees of HK$1,297 million in
respect of facilities granted to affiliated companies, financial assistance totalling HK$11,427 million. These amounts exceed 8% of
the group’s total assets as at 30th June 2005.
30th June 2005
Proforma The group’scombined attributable
balance sheet interestHK$M HK$M
Non-current assets 27,208 9,857Current assets 3,765 1,170Current liabilities (3,338) (1,225)Non-current liabilities (3,660) (1,235)Minority interests (300) (147)Shareholders’ advances (26,685) (10,130)
(3,010) (1,710)
20 Swire Pacific Limited Interim Report 2005
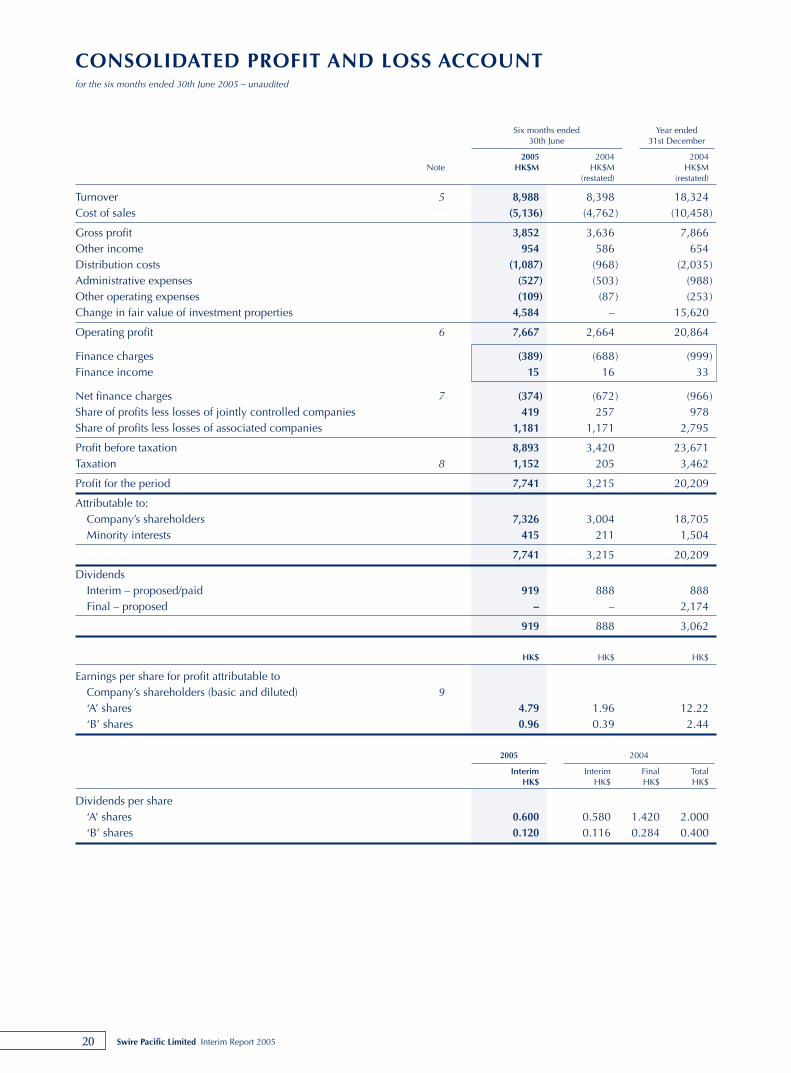
CONSOLIDATED PROFIT AND LOSS ACCOUNTfor the six months ended 30th June 2005 – unaudited
Six months ended Year ended30th June 31st December
2005 2004 2004Note HK$M HK$M HK$M
(restated) (restated)
Turnover 5 8,988 8,398 18,324Cost of sales (5,136) (4,762) (10,458)
Gross profit 3,852 3,636 7,866Other income 954 586 654Distribution costs (1,087) (968) (2,035)Administrative expenses (527) (503) (988)Other operating expenses (109) (87) (253)Change in fair value of investment properties 4,584 – 15,620
Operating profit 6 7,667 2,664 20,864
Finance charges (389) (688) (999)Finance income 15 16 33
Net finance charges 7 (374) (672) (966) Share of profits less losses of jointly controlled companies 419 257 978Share of profits less losses of associated companies 1,181 1,171 2,795
Profit before taxation 8,893 3,420 23,671Taxation 8 1,152 205 3,462
Profit for the period 7,741 3,215 20,209
Attributable to:Company’s shareholders 7,326 3,004 18,705Minority interests 415 211 1,504
7,741 3,215 20,209
DividendsInterim – proposed/paid 919 888 888Final – proposed – – 2,174
919 888 3,062
HK$ HK$ HK$
Earnings per share for profit attributable toCompany’s shareholders (basic and diluted) 9‘A’ shares 4.79 1.96 12.22‘B’ shares 0.96 0.39 2.44
2005 2004
Interim Interim Final TotalHK$ HK$ HK$ HK$
Dividends per share‘A’ shares 0.600 0.580 1.420 2.000‘B’ shares 0.120 0.116 0.284 0.400
21Swire Pacific Limited Interim Report 2005
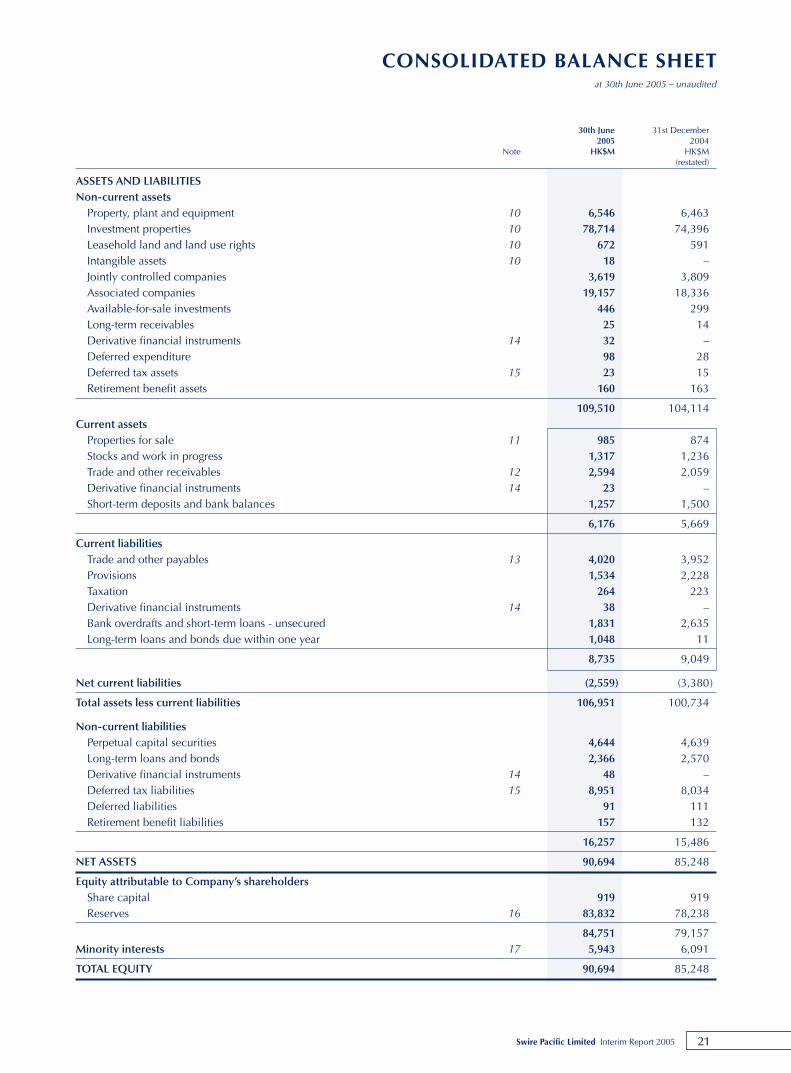
CONSOLIDATED BALANCE SHEETat 30th June 2005 – unaudited
30th June 31st December2005 2004
Note HK$M HK$M(restated)
ASSETS AND LIABILITIESNon-current assets
Property, plant and equipment 10 6,546 6,463Investment properties 10 78,714 74,396Leasehold land and land use rights 10 672 591Intangible assets 10 18 –Jointly controlled companies 3,619 3,809Associated companies 19,157 18,336Available-for-sale investments 446 299Long-term receivables 25 14Derivative financial instruments 14 32 –Deferred expenditure 98 28Deferred tax assets 15 23 15Retirement benefit assets 160 163
109,510 104,114Current assets
Properties for sale 11 985 874Stocks and work in progress 1,317 1,236Trade and other receivables 12 2,594 2,059Derivative financial instruments 14 23 –Short-term deposits and bank balances 1,257 1,500
6,176 5,669
Current liabilitiesTrade and other payables 13 4,020 3,952Provisions 1,534 2,228Taxation 264 223Derivative financial instruments 14 38 –Bank overdrafts and short-term loans - unsecured 1,831 2,635Long-term loans and bonds due within one year 1,048 11
8,735 9,049
Net current liabilities (2,559) (3,380)
Total assets less current liabilities 106,951 100,734
Non-current liabilitiesPerpetual capital securities 4,644 4,639Long-term loans and bonds 2,366 2,570Derivative financial instruments 14 48 –Deferred tax liabilities 15 8,951 8,034Deferred liabilities 91 111Retirement benefit liabilities 157 132
16,257 15,486
NET ASSETS 90,694 85,248
Equity attributable to Company’s shareholdersShare capital 919 919Reserves 16 83,832 78,238
84,751 79,157Minority interests 17 5,943 6,091
TOTAL EQUITY 90,694 85,248
22 Swire Pacific Limited Interim Report 2005
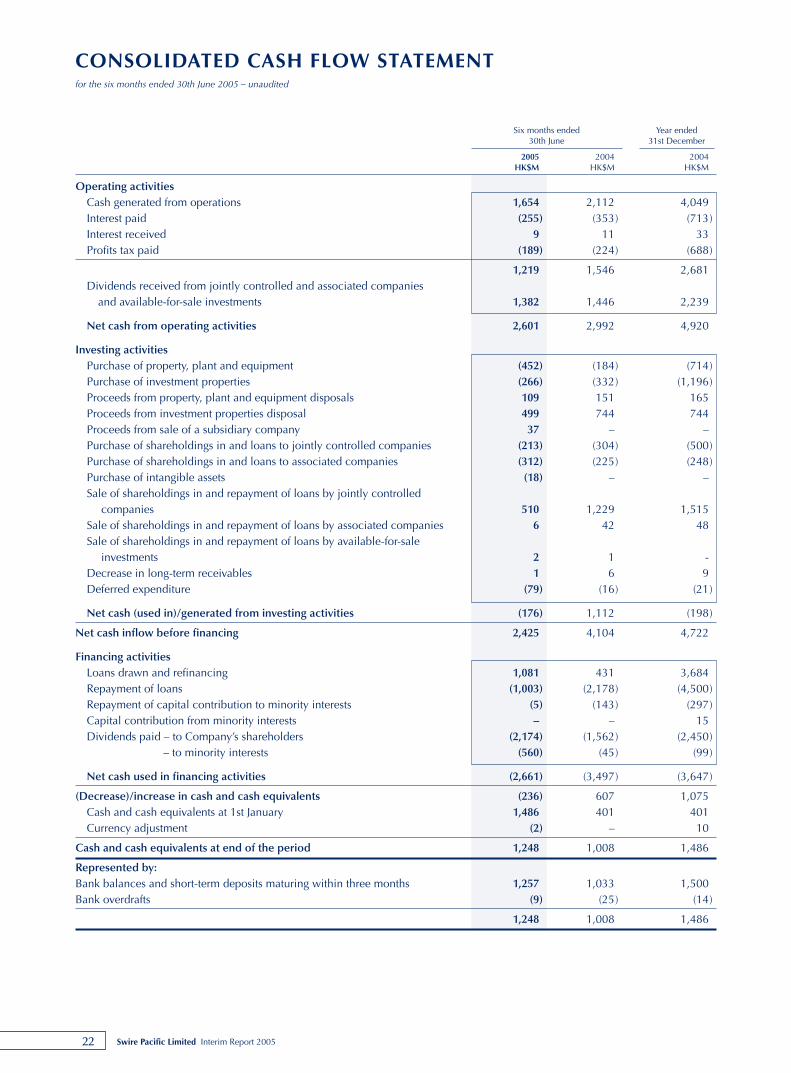
CONSOLIDATED CASH FLOW STATEMENTfor the six months ended 30th June 2005 – unaudited
Six months ended Year ended30th June 31st December
2005 2004 2004HK$M HK$M HK$M
Operating activitiesCash generated from operations 1,654 2,112 4,049Interest paid (255) (353) (713)Interest received 9 11 33Profits tax paid (189) (224) (688)
1,219 1,546 2,681Dividends received from jointly controlled and associated companies
and available-for-sale investments 1,382 1,446 2,239
Net cash from operating activities 2,601 2,992 4,920
Investing activitiesPurchase of property, plant and equipment (452) (184) (714)Purchase of investment properties (266) (332) (1,196)Proceeds from property, plant and equipment disposals 109 151 165Proceeds from investment properties disposal 499 744 744Proceeds from sale of a subsidiary company 37 – –Purchase of shareholdings in and loans to jointly controlled companies (213) (304) (500)Purchase of shareholdings in and loans to associated companies (312) (225) (248)Purchase of intangible assets (18) – –Sale of shareholdings in and repayment of loans by jointly controlled
companies 510 1,229 1,515Sale of shareholdings in and repayment of loans by associated companies 6 42 48Sale of shareholdings in and repayment of loans by available-for-sale
investments 2 1 -Decrease in long-term receivables 1 6 9Deferred expenditure (79) (16) (21)
Net cash (used in)/generated from investing activities (176) 1,112 (198)
Net cash inflow before financing 2,425 4,104 4,722
Financing activitiesLoans drawn and refinancing 1,081 431 3,684Repayment of loans (1,003) (2,178) (4,500)Repayment of capital contribution to minority interests (5) (143) (297)Capital contribution from minority interests – – 15Dividends paid – to Company’s shareholders (2,174) (1,562) (2,450)
– to minority interests (560) (45) (99)
Net cash used in financing activities (2,661) (3,497) (3,647)
(Decrease)/increase in cash and cash equivalents (236) 607 1,075Cash and cash equivalents at 1st January 1,486 401 401Currency adjustment (2) – 10
Cash and cash equivalents at end of the period 1,248 1,008 1,486
Represented by:Bank balances and short-term deposits maturing within three months 1,257 1,033 1,500Bank overdrafts (9) (25) (14)
1,248 1,008 1,486
23Swire Pacific Limited Interim Report 2005
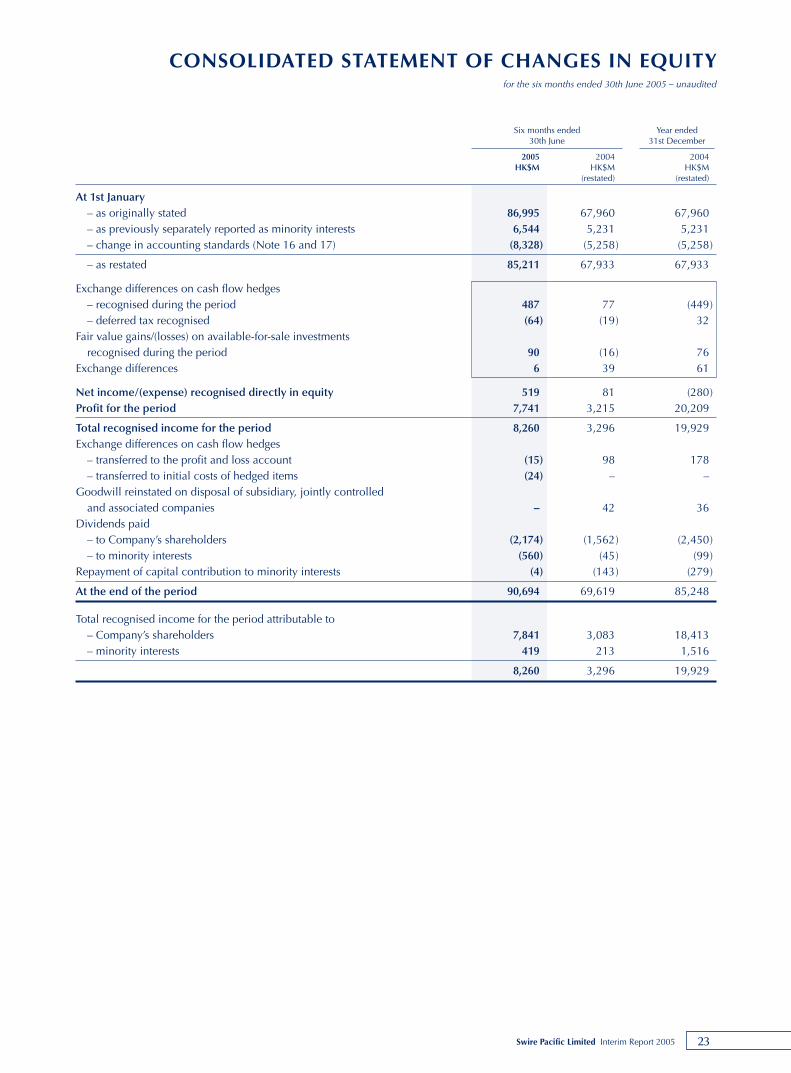
CONSOLIDATED STATEMENT OF CHANGES IN EQUITYfor the six months ended 30th June 2005 – unaudited
Six months ended Year ended30th June 31st December
2005 2004 2004HK$M HK$M HK$M
(restated) (restated)
At 1st January– as originally stated 86,995 67,960 67,960– as previously separately reported as minority interests 6,544 5,231 5,231– change in accounting standards (Note 16 and 17) (8,328) (5,258) (5,258)
– as restated 85,211 67,933 67,933
Exchange differences on cash flow hedges– recognised during the period 487 77 (449)– deferred tax recognised (64) (19) 32
Fair value gains/(losses) on available-for-sale investmentsrecognised during the period 90 (16) 76
Exchange differences 6 39 61
Net income/(expense) recognised directly in equity 519 81 (280)Profit for the period 7,741 3,215 20,209
Total recognised income for the period 8,260 3,296 19,929Exchange differences on cash flow hedges
– transferred to the profit and loss account (15) 98 178– transferred to initial costs of hedged items (24) – –
Goodwill reinstated on disposal of subsidiary, jointly controlledand associated companies – 42 36
Dividends paid– to Company’s shareholders (2,174) (1,562) (2,450)– to minority interests (560) (45) (99)
Repayment of capital contribution to minority interests (4) (143) (279)
At the end of the period 90,694 69,619 85,248
Total recognised income for the period attributable to– Company’s shareholders 7,841 3,083 18,413– minority interests 419 213 1,516
8,260 3,296 19,929
24 Swire Pacific Limited Interim Report 2005
NOTES TO THE CONDENSED CONSOLIDATED ACCOUNTS
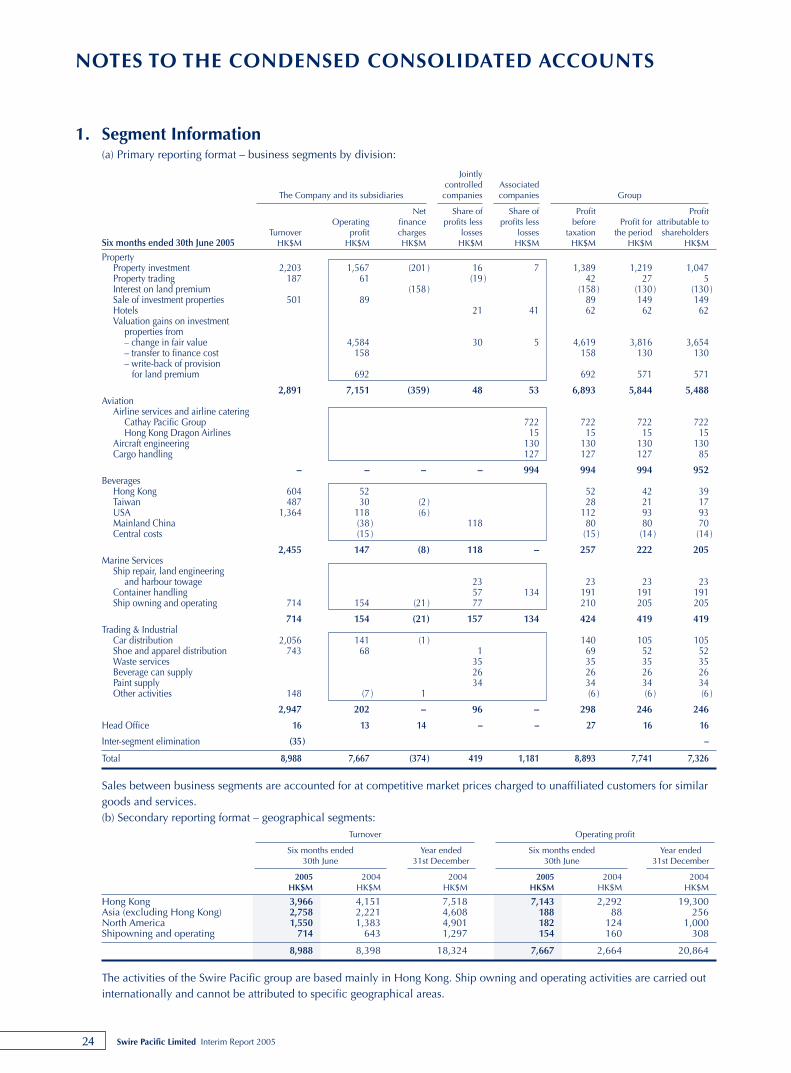
1. Segment Information(a) Primary reporting format – business segments by division:
Jointlycontrolled Associated
The Company and its subsidiaries companies companies Group
Net Share of Share of Profit ProfitOperating finance profits less profits less before Profit for attributable to
Turnover profit charges losses losses taxation the period shareholdersSix months ended 30th June 2005 HK$M HK$M HK$M HK$M HK$M HK$M HK$M HK$M
PropertyProperty investment 2,203 1,567 (201 ) 16 7 1,389 1,219 1,047Property trading 187 61 (19 ) 42 27 5Interest on land premium (158 ) (158 ) (130 ) (130 )Sale of investment properties 501 89 89 149 149Hotels 21 41 62 62 62Valuation gains on investment
properties from– change in fair value 4,584 30 5 4,619 3,816 3,654– transfer to finance cost 158 158 130 130– write-back of provision
for land premium 692 692 571 571
2,891 7,151 (359) 48 53 6,893 5,844 5,488Aviation
Airline services and airline cateringCathay Pacific Group 722 722 722 722Hong Kong Dragon Airlines 15 15 15 15
Aircraft engineering 130 130 130 130Cargo handling 127 127 127 85
– – – – 994 994 994 952Beverages
Hong Kong 604 52 52 42 39Taiwan 487 30 (2 ) 28 21 17USA 1,364 118 (6 ) 112 93 93Mainland China (38 ) 118 80 80 70Central costs (15 ) (15 ) (14 ) (14 )
2,455 147 (8) 118 – 257 222 205Marine Services
Ship repair, land engineeringand harbour towage 23 23 23 23
Container handling 57 134 191 191 191Ship owning and operating 714 154 (21 ) 77 210 205 205
714 154 (21) 157 134 424 419 419Trading & Industrial
Car distribution 2,056 141 (1 ) 140 105 105Shoe and apparel distribution 743 68 1 69 52 52Waste services 35 35 35 35Beverage can supply 26 26 26 26Paint supply 34 34 34 34Other activities 148 (7 ) 1 (6 ) (6 ) (6 )
2,947 202 – 96 – 298 246 246
Head Office 16 13 14 – – 27 16 16
Inter-segment elimination (35) –
Total 8,988 7,667 (374) 419 1,181 8,893 7,741 7,326
Sales between business segments are accounted for at competitive market prices charged to unaffiliated customers for similargoods and services.(b) Secondary reporting format – geographical segments:
Turnover Operating profit
Six months ended Year ended Six months ended Year ended30th June 31st December 30th June 31st December
2005 2004 2004 2005 2004 2004HK$M HK$M HK$M HK$M HK$M HK$M
Hong Kong 3,966 4,151 7,518 7,143 2,292 19,300Asia (excluding Hong Kong) 2,758 2,221 4,608 188 88 256North America 1,550 1,383 4,901 182 124 1,000Shipowning and operating 714 643 1,297 154 160 308
8,988 8,398 18,324 7,667 2,664 20,864
The activities of the Swire Pacific group are based mainly in Hong Kong. Ship owning and operating activities are carried outinternationally and cannot be attributed to specific geographical areas.
25Swire Pacific Limited Interim Report 2005
NOTES TO THE CONDENSED CONSOLIDATED ACCOUNTS
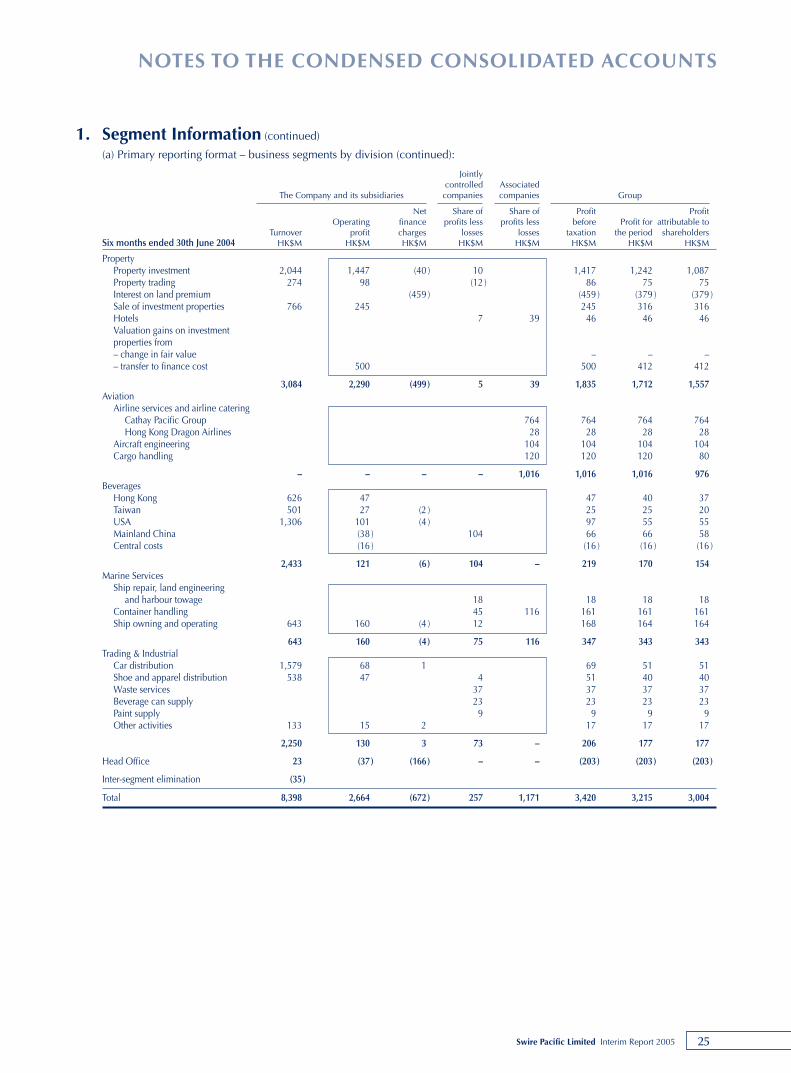
1. Segment Information (continued)
(a) Primary reporting format – business segments by division (continued):
Jointlycontrolled Associated
The Company and its subsidiaries companies companies Group
Net Share of Share of Profit Profit Operating finance profits less profits less before Profit for attributable to
Turnover profit charges losses losses taxation the period shareholdersSix months ended 30th June 2004 HK$M HK$M HK$M HK$M HK$M HK$M HK$M HK$M
PropertyProperty investment 2,044 1,447 (40 ) 10 1,417 1,242 1,087Property trading 274 98 (12 ) 86 75 75Interest on land premium (459 ) (459 ) (379 ) (379 )Sale of investment properties 766 245 245 316 316Hotels 7 39 46 46 46Valuation gains on investmentproperties from– change in fair value – – –– transfer to finance cost 500 500 412 412
3,084 2,290 (499) 5 39 1,835 1,712 1,557Aviation
Airline services and airline cateringCathay Pacific Group 764 764 764 764Hong Kong Dragon Airlines 28 28 28 28
Aircraft engineering 104 104 104 104Cargo handling 120 120 120 80
– – – – 1,016 1,016 1,016 976Beverages
Hong Kong 626 47 47 40 37Taiwan 501 27 (2 ) 25 25 20USA 1,306 101 (4 ) 97 55 55Mainland China (38 ) 104 66 66 58Central costs (16 ) (16 ) (16 ) (16 )
2,433 121 (6) 104 – 219 170 154Marine Services
Ship repair, land engineering and harbour towage 18 18 18 18
Container handling 45 116 161 161 161Ship owning and operating 643 160 (4 ) 12 168 164 164
643 160 (4) 75 116 347 343 343Trading & Industrial
Car distribution 1,579 68 1 69 51 51Shoe and apparel distribution 538 47 4 51 40 40Waste services 37 37 37 37Beverage can supply 23 23 23 23Paint supply 9 9 9 9Other activities 133 15 2 17 17 17
2,250 130 3 73 – 206 177 177
Head Office 23 (37) (166) – – (203) (203) (203)
Inter-segment elimination (35)
Total 8,398 2,664 (672) 257 1,171 3,420 3,215 3,004
26 Swire Pacific Limited Interim Report 2005
NOTES TO THE CONDENSED CONSOLIDATED ACCOUNTS
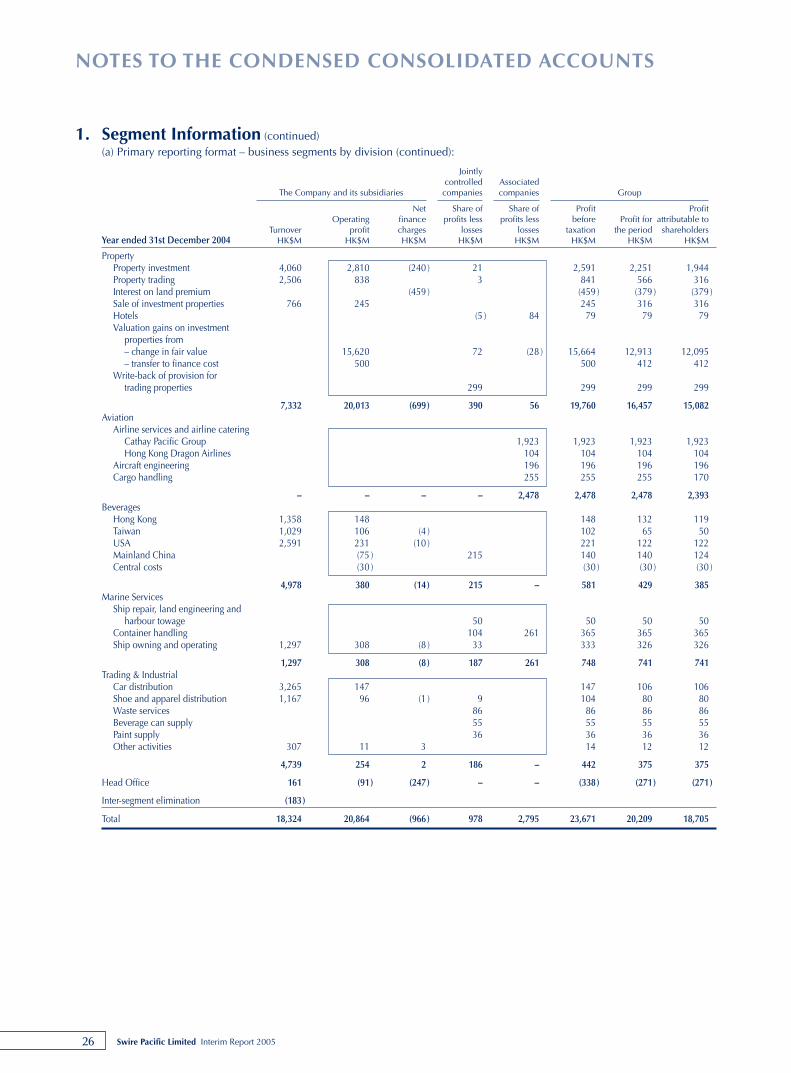
1. Segment Information (continued)(a) Primary reporting format – business segments by division (continued):
Jointlycontrolled Associated
The Company and its subsidiaries companies companies Group
Net Share of Share of Profit Profit Operating finance profits less profits less before Profit for attributable to
Turnover profit charges losses losses taxation the period shareholdersYear ended 31st December 2004 HK$M HK$M HK$M HK$M HK$M HK$M HK$M HK$M
PropertyProperty investment 4,060 2,810 (240 ) 21 2,591 2,251 1,944Property trading 2,506 838 3 841 566 316Interest on land premium (459 ) (459 ) (379 ) (379 )Sale of investment properties 766 245 245 316 316Hotels (5 ) 84 79 79 79Valuation gains on investment
properties from– change in fair value 15,620 72 (28 ) 15,664 12,913 12,095– transfer to finance cost 500 500 412 412
Write-back of provision fortrading properties 299 299 299 299
7,332 20,013 (699) 390 56 19,760 16,457 15,082Aviation
Airline services and airline cateringCathay Pacific Group 1,923 1,923 1,923 1,923Hong Kong Dragon Airlines 104 104 104 104
Aircraft engineering 196 196 196 196Cargo handling 255 255 255 170
– – – – 2,478 2,478 2,478 2,393Beverages
Hong Kong 1,358 148 148 132 119Taiwan 1,029 106 (4 ) 102 65 50USA 2,591 231 (10 ) 221 122 122Mainland China (75 ) 215 140 140 124Central costs (30 ) (30 ) (30 ) (30 )
4,978 380 (14) 215 – 581 429 385Marine Services
Ship repair, land engineering andharbour towage 50 50 50 50
Container handling 104 261 365 365 365Ship owning and operating 1,297 308 (8 ) 33 333 326 326
1,297 308 (8) 187 261 748 741 741Trading & Industrial
Car distribution 3,265 147 147 106 106Shoe and apparel distribution 1,167 96 (1 ) 9 104 80 80Waste services 86 86 86 86Beverage can supply 55 55 55 55Paint supply 36 36 36 36Other activities 307 11 3 14 12 12
4,739 254 2 186 – 442 375 375
Head Office 161 (91) (247) – – (338) (271) (271)
Inter-segment elimination (183)
Total 18,324 20,864 (966) 978 2,795 23,671 20,209 18,705
27Swire Pacific Limited Interim Report 2005
NOTES TO THE CONDENSED CONSOLIDATED ACCOUNTS
2. Basis of preparation and accounting policiesThe unaudited condensed consolidated accounts have been prepared on a basis consistent with the principal accounting
policies adopted in the 2004 annual accounts apart from the adoption of the new Hong Kong Financial Reporting Standards
(“HKFRSs”) and Hong Kong Accounting Standards (“HKASs”) (collectively the “HKFRSs”) issued by the Hong Kong Institute of
Certified Public Accountants (“HKICPA”), which are effective for accounting periods beginning on or after 1st January 2005.
The changes to the group’s accounting policies and the effect of adopting these new standards are set out in note 3 below.
The condensed consolidated accounts have been prepared in accordance with the HKAS 34 “Interim Financial Reports”
issued by the HKICPA and the disclosure requirements of the Listing Rules of The Stock Exchange of Hong Kong Limited.
3. Changes in accounting standardsThe group’s accounting policies remain consistent as set out more fully in the 2004 annual accounts, with the exception of
those policies detailed below.
(i) Investment properties
Following the adoption of HKAS 40 “Investment property”, changes in the fair values of investment properties are included
in the profit and loss account. Previously the group had recorded such fair value changes in the property valuation reserve.
In addition, Hong Kong Accounting Standard Interpretation (“HKAS-Int”) 21 now requires deferred taxation to be calculated,
using profits tax rates, as opposed to using capital gain tax rates, on these surpluses and deficits.
The adoption of the new HKAS 40 and HKAS-Int 21 has been applied retrospectively and comparatives presented have been
restated to conform to the changed policy. Opening revenue reserves at 1st January 2004 and 2005 have been increased by
HK$14,651 million and HK$26,818 million respectively. Profit for the six months ended 30th June 2004 and for the year
ended 31st December 2004 have been increased by HK$74 million and HK$12,167 million respectively.
(ii) Leasehold land
The adoption of HKAS 17 “Leases” has resulted in a change in the accounting policy relating to the reclassification of
leasehold land from property, plant and equipment to operating leases. The up-front prepayments made for the leasehold land
are expensed in the profit and loss account on a straight-line basis over the period of the lease or where there is impairment,
the impairment is expensed in the profit and loss account. In prior years, the leasehold land was accounted for at fair value
or cost less accumulated depreciation and accumulated impairment. Apart from certain presentational changes with
comparatives restated, this change in accounting policy does not have any material effect on the accounts.
(iii) Financial assets and liabilities
The adoption of HKAS 32 “Financial instruments: disclosure and presentation” and HKAS 39 “Financial instruments:
recognition and measurement” has resulted in a change in the accounting policy relating to the classification of financial
assets and liabilities and their measurement.
Financial assets are now classified into two categories: loans and receivables and available-for-sale investments. Loans and
receivables are carried at amortised cost using the effective interest method whereas previously they were carried at cost.
Available-for-sale investments are carried at fair value with any unrealised gains and losses recognised in equity. While there is
no change in their measurement basis or the treatment of subsequent fair value changes, available-for-sale investments were
previously classified as investment securities.
Borrowings are now recognised initially at fair value, net of transaction costs incurred. They are subsequently stated at
amortised cost with any difference between the proceeds (net of transaction costs) and the redemption value recognised in the
profit and loss account over the period of the borrowing using the effective interest method or at fair value through profit and
loss. Borrowings were previously carried at cost.
28 Swire Pacific Limited Interim Report 2005
NOTES TO THE CONDENSED CONSOLIDATED ACCOUNTS
3. Changes in accounting standards (continued)
This change in accounting policy has been applied retrospectively and comparatives presented have been restated to confirm
to the changed policy. Opening revenue reserve as at 1 January 2004 and 2005 have been decreased by HK$16 million and
by HK$22 million respectively. Profit for the six months ended 30th June 2004 and for the year ended 31st December 2004
have been decreased by HK$22 million and HK$6 million respectively.
(iv) Derivative financial instruments
Following the adoption of HKAS 32 and HKAS 39, derivatives are initially recognised at fair value on the date a derivative
contract is entered into and are subsequently remeasured at their fair value. The method of recognising the resulting gain or
loss depends on whether the derivative is designated as a hedging instrument, and if so, the nature of the item being hedged.
The group designates certain derivatives as either: (1) hedges of the fair value of recognised assets or liabilities or a firm
commitment (fair value hedge) or (2) hedges of highly probable forecast transactions (cash flow hedges).
The group documents at the inception of the transaction the relationship between hedging instruments and hedged items, as
well as its risk management objective and strategy for undertaking various hedge transactions. The group also documents its
assessment, both at hedge inception and on an ongoing basis, of whether the derivatives that are used in hedging transactions
are highly effective in offsetting changes in fair values or cash flows of hedged items.
(a) Fair value hedge
Changes in the fair value of derivatives that are designated and qualify as fair value hedges are recorded in the profit
and loss account, together with any changes in the fair value of the hedged asset or liability that are attributable to the
hedged risk.
(b) Cash flow hedge
The effective portion of changes in the fair value of derivatives that are designated and qualify as cash flow hedges
are recognised in equity. The gain or loss relating to the ineffective portion is recognised immediately in the profit and
loss account.
Amounts accumulated in equity are recycled in the profit and loss account in the periods when the hedged item will affect
profit or loss. However, when the forecast transaction that is hedged results in the recognition of a non-financial asset or a
liability, the gains and losses previously deferred in equity are transferred from equity and included in the initial
measurement of the cost of the asset or liability.
When a hedging instrument expires or is sold, or when a hedge no longer meets the criteria for hedge accounting, any
cumulative gain or loss existing in equity at that time remains in equity and is recognised when the forecast transaction
is ultimately recognised in the profit and loss account. When a forecast transaction is no longer expected to occur, the
cumulative gain or loss that was reported in equity is immediately transferred to the profit and loss account.
(c) Derivatives that do not qualify for hedge account
Certain derivative instruments do not qualify for hedge accounting. Changes in the fair value of any derivative instruments
that do not qualify for hedge accounting are recognised immediately in the profit and loss account.
In previous years, derivative financial instruments were not separately recorded in the financial statements. The adoption of the
new HKAS 39 represents a change in accounting policy. As a result of this change, the opening revenue reserve and cash flow
hedge reserve at 1st January 2005 have been decreased by HK$114 million and increased by HK$80 million respectively.
Comparatives have not been restated.
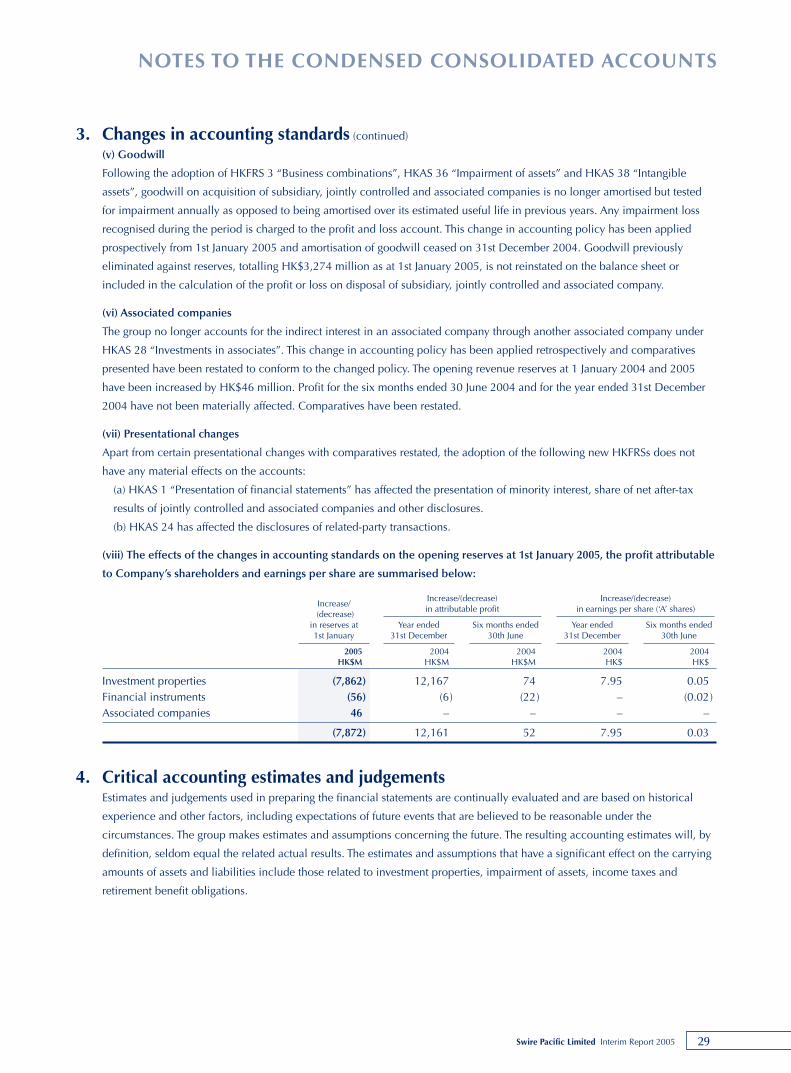
29Swire Pacific Limited Interim Report 2005
NOTES TO THE CONDENSED CONSOLIDATED ACCOUNTS
3. Changes in accounting standards (continued)
(v) Goodwill
Following the adoption of HKFRS 3 “Business combinations”, HKAS 36 “Impairment of assets” and HKAS 38 “Intangible
assets”, goodwill on acquisition of subsidiary, jointly controlled and associated companies is no longer amortised but tested
for impairment annually as opposed to being amortised over its estimated useful life in previous years. Any impairment loss
recognised during the period is charged to the profit and loss account. This change in accounting policy has been applied
prospectively from 1st January 2005 and amortisation of goodwill ceased on 31st December 2004. Goodwill previously
eliminated against reserves, totalling HK$3,274 million as at 1st January 2005, is not reinstated on the balance sheet or
included in the calculation of the profit or loss on disposal of subsidiary, jointly controlled and associated company.
(vi) Associated companies
The group no longer accounts for the indirect interest in an associated company through another associated company under
HKAS 28 “Investments in associates”. This change in accounting policy has been applied retrospectively and comparatives
presented have been restated to conform to the changed policy. The opening revenue reserves at 1 January 2004 and 2005
have been increased by HK$46 million. Profit for the six months ended 30 June 2004 and for the year ended 31st December
2004 have not been materially affected. Comparatives have been restated.
(vii) Presentational changes
Apart from certain presentational changes with comparatives restated, the adoption of the following new HKFRSs does not
have any material effects on the accounts:
(a) HKAS 1 “Presentation of financial statements” has affected the presentation of minority interest, share of net after-tax
results of jointly controlled and associated companies and other disclosures.
(b) HKAS 24 has affected the disclosures of related-party transactions.
(viii) The effects of the changes in accounting standards on the opening reserves at 1st January 2005, the profit attributable
to Company’s shareholders and earnings per share are summarised below:
Increase/Increase/(decrease) Increase/(decrease)
(decrease)in attributable profit in earnings per share (‘A’ shares)
in reserves at Year ended Six months ended Year ended Six months ended1st January 31st December 30th June 31st December 30th June
2005 2004 2004 2004 2004HK$M HK$M HK$M HK$ HK$
Investment properties (7,862) 12,167 74 7.95 0.05Financial instruments (56) (6) (22) – (0.02)Associated companies 46 – – – –
(7,872) 12,161 52 7.95 0.03
4. Critical accounting estimates and judgementsEstimates and judgements used in preparing the financial statements are continually evaluated and are based on historical
experience and other factors, including expectations of future events that are believed to be reasonable under the
circumstances. The group makes estimates and assumptions concerning the future. The resulting accounting estimates will, by
definition, seldom equal the related actual results. The estimates and assumptions that have a significant effect on the carrying
amounts of assets and liabilities include those related to investment properties, impairment of assets, income taxes and
retirement benefit obligations.
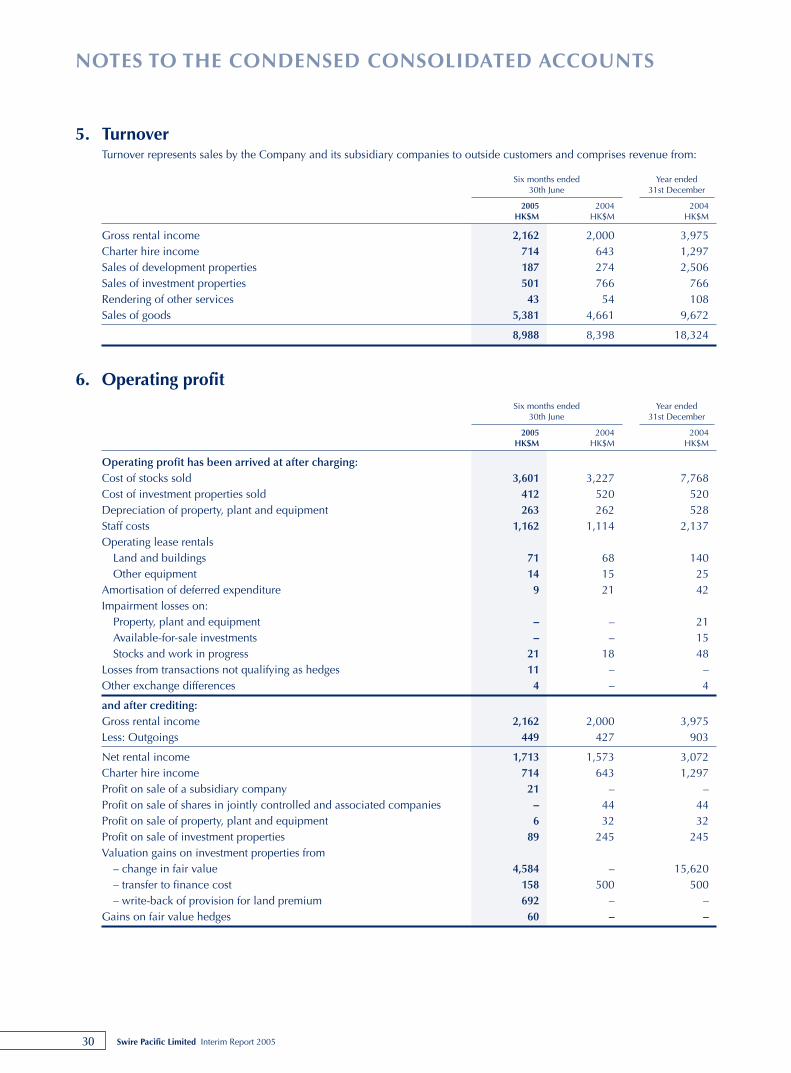
30 Swire Pacific Limited Interim Report 2005
NOTES TO THE CONDENSED CONSOLIDATED ACCOUNTS
5. TurnoverTurnover represents sales by the Company and its subsidiary companies to outside customers and comprises revenue from:
Six months ended Year ended30th June 31st December
2005 2004 2004HK$M HK$M HK$M
Gross rental income 2,162 2,000 3,975Charter hire income 714 643 1,297Sales of development properties 187 274 2,506Sales of investment properties 501 766 766Rendering of other services 43 54 108Sales of goods 5,381 4,661 9,672
8,988 8,398 18,324
6. Operating profitSix months ended Year ended
30th June 31st December
2005 2004 2004HK$M HK$M HK$M
Operating profit has been arrived at after charging:Cost of stocks sold 3,601 3,227 7,768Cost of investment properties sold 412 520 520Depreciation of property, plant and equipment 263 262 528Staff costs 1,162 1,114 2,137Operating lease rentals
Land and buildings 71 68 140Other equipment 14 15 25
Amortisation of deferred expenditure 9 21 42Impairment losses on:
Property, plant and equipment – – 21Available-for-sale investments – – 15Stocks and work in progress 21 18 48
Losses from transactions not qualifying as hedges 11 – –Other exchange differences 4 – 4
and after crediting:Gross rental income 2,162 2,000 3,975Less: Outgoings 449 427 903
Net rental income 1,713 1,573 3,072Charter hire income 714 643 1,297Profit on sale of a subsidiary company 21 – –Profit on sale of shares in jointly controlled and associated companies – 44 44Profit on sale of property, plant and equipment 6 32 32Profit on sale of investment properties 89 245 245Valuation gains on investment properties from
– change in fair value 4,584 – 15,620– transfer to finance cost 158 500 500– write-back of provision for land premium 692 – –
Gains on fair value hedges 60 – –
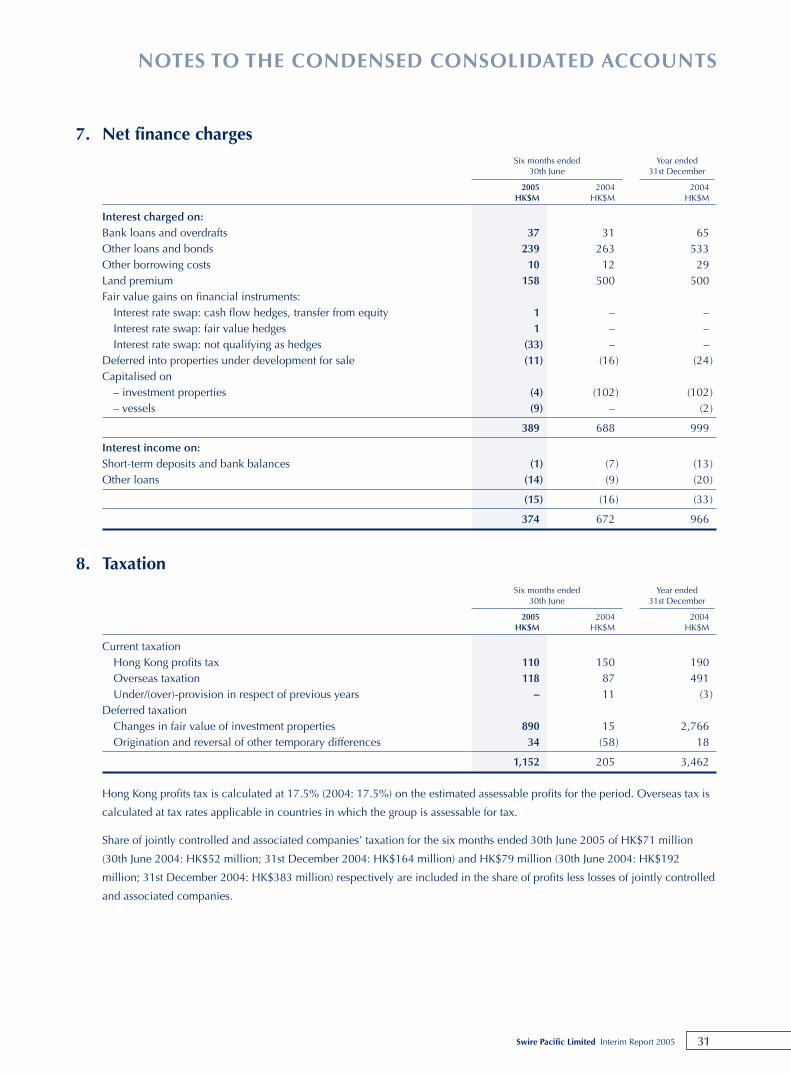
31Swire Pacific Limited Interim Report 2005
NOTES TO THE CONDENSED CONSOLIDATED ACCOUNTS
7. Net finance chargesSix months ended Year ended
30th June 31st December
2005 2004 2004HK$M HK$M HK$M
Interest charged on:Bank loans and overdrafts 37 31 65Other loans and bonds 239 263 533Other borrowing costs 10 12 29Land premium 158 500 500Fair value gains on financial instruments:
Interest rate swap: cash flow hedges, transfer from equity 1 – –Interest rate swap: fair value hedges 1 – –Interest rate swap: not qualifying as hedges (33) – –
Deferred into properties under development for sale (11) (16) (24)Capitalised on
– investment properties (4) (102) (102)– vessels (9) – (2)
389 688 999
Interest income on:Short-term deposits and bank balances (1) (7) (13)Other loans (14) (9) (20)
(15) (16) (33)
374 672 966
8. TaxationSix months ended Year ended
30th June 31st December
2005 2004 2004HK$M HK$M HK$M
Current taxationHong Kong profits tax 110 150 190Overseas taxation 118 87 491Under/(over)-provision in respect of previous years – 11 (3)
Deferred taxationChanges in fair value of investment properties 890 15 2,766Origination and reversal of other temporary differences 34 (58) 18
1,152 205 3,462
Hong Kong profits tax is calculated at 17.5% (2004: 17.5%) on the estimated assessable profits for the period. Overseas tax is
calculated at tax rates applicable in countries in which the group is assessable for tax.
Share of jointly controlled and associated companies’ taxation for the six months ended 30th June 2005 of HK$71 million
(30th June 2004: HK$52 million; 31st December 2004: HK$164 million) and HK$79 million (30th June 2004: HK$192
million; 31st December 2004: HK$383 million) respectively are included in the share of profits less losses of jointly controlled
and associated companies.
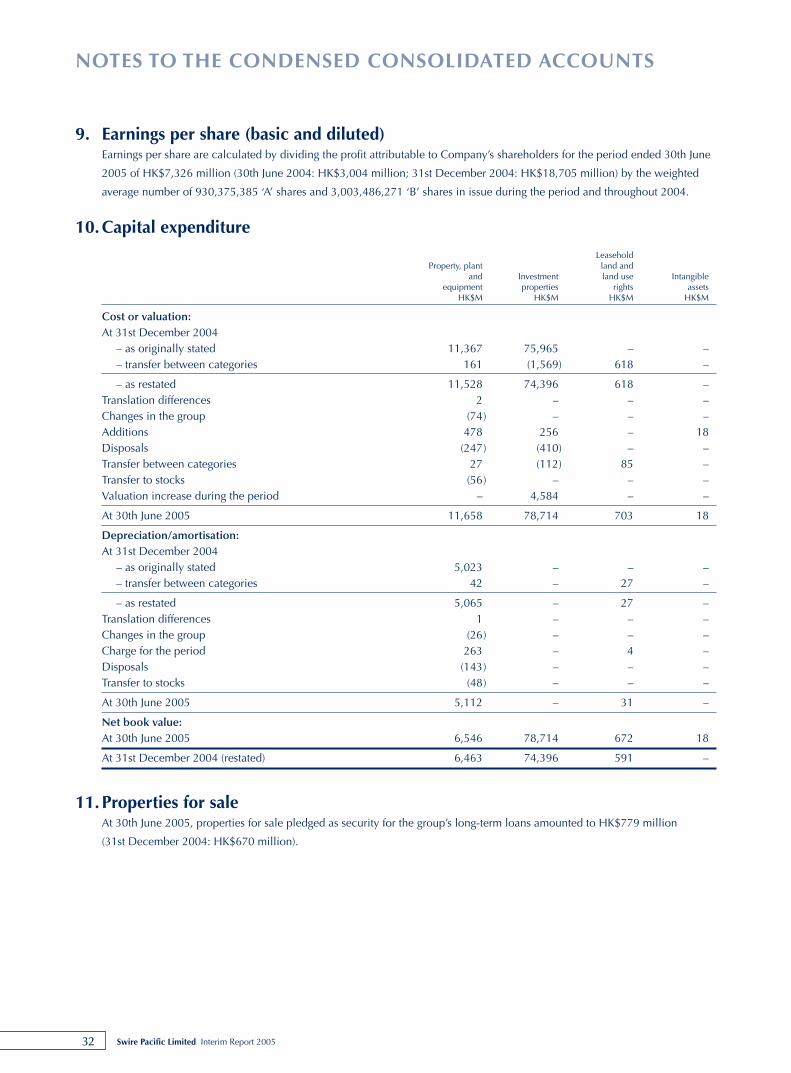
32 Swire Pacific Limited Interim Report 2005
NOTES TO THE CONDENSED CONSOLIDATED ACCOUNTS
9. Earnings per share (basic and diluted)Earnings per share are calculated by dividing the profit attributable to Company’s shareholders for the period ended 30th June
2005 of HK$7,326 million (30th June 2004: HK$3,004 million; 31st December 2004: HK$18,705 million) by the weighted
average number of 930,375,385 ‘A’ shares and 3,003,486,271 ‘B’ shares in issue during the period and throughout 2004.
10.Capital expenditureLeasehold
Property, plant land andand Investment land use Intangible
equipment properties rights assetsHK$M HK$M HK$M HK$M
Cost or valuation:At 31st December 2004
– as originally stated 11,367 75,965 – –– transfer between categories 161 (1,569) 618 –
– as restated 11,528 74,396 618 –Translation differences 2 – – –Changes in the group (74) – – –Additions 478 256 – 18Disposals (247) (410) – –Transfer between categories 27 (112) 85 –Transfer to stocks (56) – – –Valuation increase during the period – 4,584 – –
At 30th June 2005 11,658 78,714 703 18
Depreciation/amortisation:At 31st December 2004
– as originally stated 5,023 – – –– transfer between categories 42 – 27 –
– as restated 5,065 – 27 –Translation differences 1 – – –Changes in the group (26) – – –Charge for the period 263 – 4 –Disposals (143) – – –Transfer to stocks (48) – – –
At 30th June 2005 5,112 – 31 –
Net book value:At 30th June 2005 6,546 78,714 672 18
At 31st December 2004 (restated) 6,463 74,396 591 –
11.Properties for saleAt 30th June 2005, properties for sale pledged as security for the group’s long-term loans amounted to HK$779 million
(31st December 2004: HK$670 million).
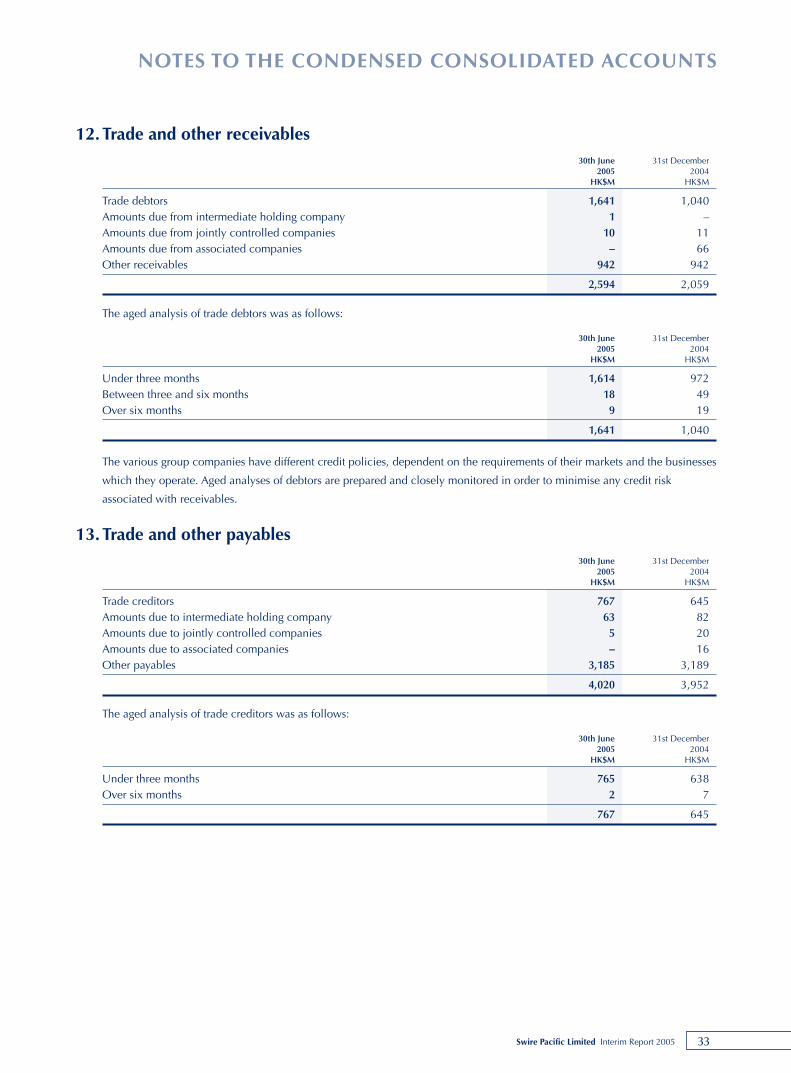
33Swire Pacific Limited Interim Report 2005
NOTES TO THE CONDENSED CONSOLIDATED ACCOUNTS
12.Trade and other receivables30th June 31st December
2005 2004HK$M HK$M
Trade debtors 1,641 1,040Amounts due from intermediate holding company 1 –Amounts due from jointly controlled companies 10 11Amounts due from associated companies – 66Other receivables 942 942
2,594 2,059
The aged analysis of trade debtors was as follows:
30th June 31st December2005 2004
HK$M HK$M
Under three months 1,614 972Between three and six months 18 49Over six months 9 19
1,641 1,040
The various group companies have different credit policies, dependent on the requirements of their markets and the businesses
which they operate. Aged analyses of debtors are prepared and closely monitored in order to minimise any credit risk
associated with receivables.
13.Trade and other payables30th June 31st December
2005 2004HK$M HK$M
Trade creditors 767 645Amounts due to intermediate holding company 63 82Amounts due to jointly controlled companies 5 20Amounts due to associated companies – 16Other payables 3,185 3,189
4,020 3,952
The aged analysis of trade creditors was as follows:
30th June 31st December2005 2004
HK$M HK$M
Under three months 765 638Over six months 2 7
767 645
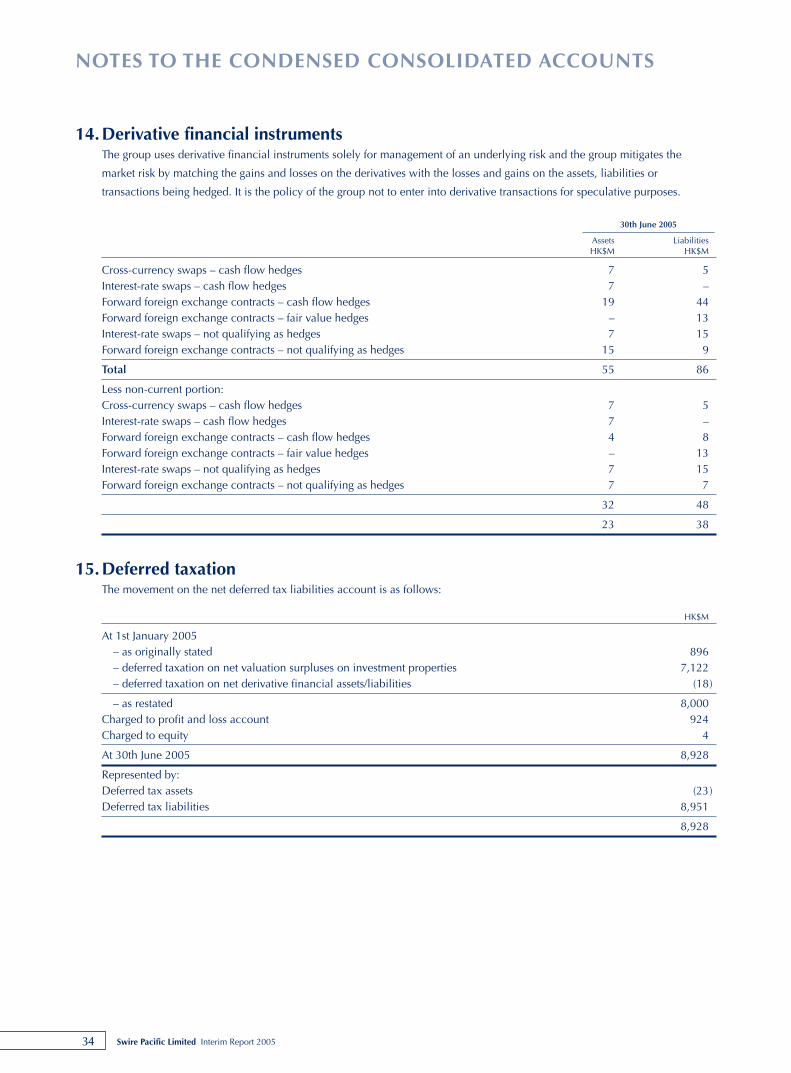
34 Swire Pacific Limited Interim Report 2005
NOTES TO THE CONDENSED CONSOLIDATED ACCOUNTS
14.Derivative financial instrumentsThe group uses derivative financial instruments solely for management of an underlying risk and the group mitigates the
market risk by matching the gains and losses on the derivatives with the losses and gains on the assets, liabilities or
transactions being hedged. It is the policy of the group not to enter into derivative transactions for speculative purposes.
30th June 2005
Assets LiabilitiesHK$M HK$M
Cross-currency swaps – cash flow hedges 7 5Interest-rate swaps – cash flow hedges 7 –Forward foreign exchange contracts – cash flow hedges 19 44Forward foreign exchange contracts – fair value hedges – 13Interest-rate swaps – not qualifying as hedges 7 15Forward foreign exchange contracts – not qualifying as hedges 15 9
Total 55 86
Less non-current portion:Cross-currency swaps – cash flow hedges 7 5Interest-rate swaps – cash flow hedges 7 –Forward foreign exchange contracts – cash flow hedges 4 8Forward foreign exchange contracts – fair value hedges – 13Interest-rate swaps – not qualifying as hedges 7 15Forward foreign exchange contracts – not qualifying as hedges 7 7
32 48
23 38
15.Deferred taxationThe movement on the net deferred tax liabilities account is as follows:
HK$M
At 1st January 2005– as originally stated 896– deferred taxation on net valuation surpluses on investment properties 7,122– deferred taxation on net derivative financial assets/liabilities (18)
– as restated 8,000Charged to profit and loss account 924Charged to equity 4
At 30th June 2005 8,928
Represented by:Deferred tax assets (23)Deferred tax liabilities 8,951
8,928
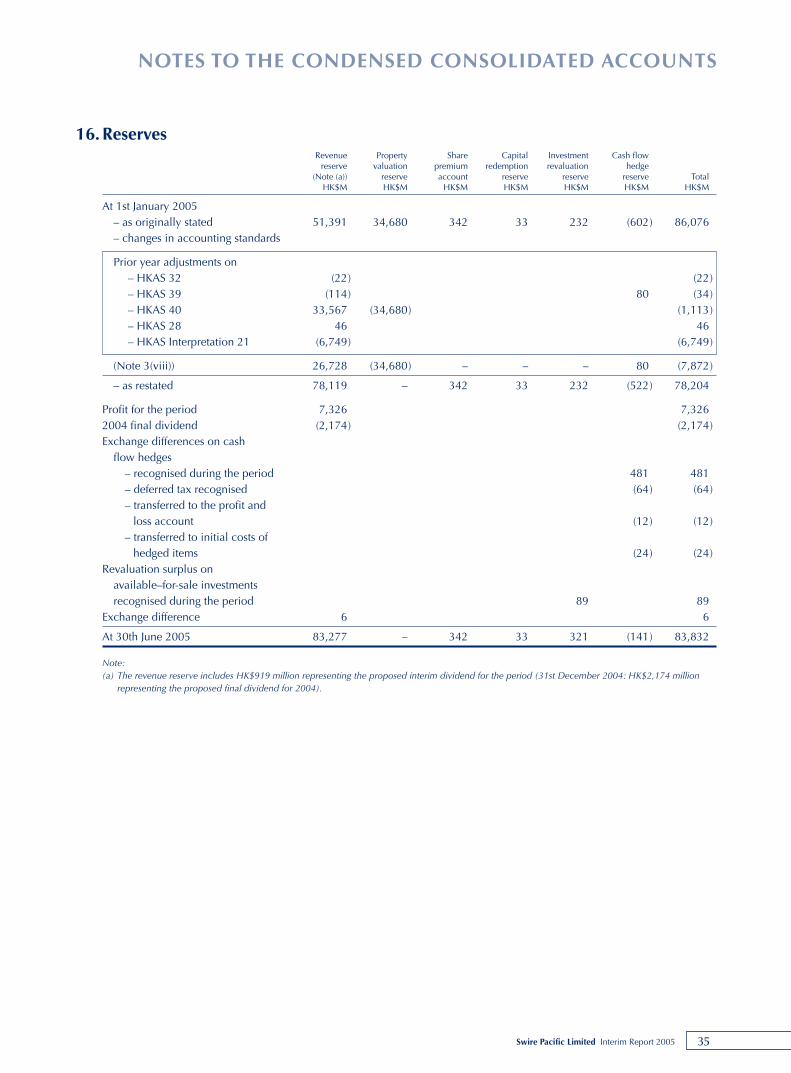
35Swire Pacific Limited Interim Report 2005
NOTES TO THE CONDENSED CONSOLIDATED ACCOUNTS
16.ReservesRevenue Property Share Capital Investment Cash flow
reserve valuation premium redemption revaluation hedge(Note (a)) reserve account reserve reserve reserve Total
HK$M HK$M HK$M HK$M HK$M HK$M HK$M
At 1st January 2005– as originally stated 51,391 34,680 342 33 232 (602) 86,076– changes in accounting standards
Prior year adjustments on– HKAS 32 (22) (22)– HKAS 39 (114) 80 (34)– HKAS 40 33,567 (34,680) (1,113)– HKAS 28 46 46– HKAS Interpretation 21 (6,749) (6,749)
(Note 3(viii)) 26,728 (34,680) – – – 80 (7,872)
– as restated 78,119 – 342 33 232 (522) 78,204
Profit for the period 7,326 7,3262004 final dividend (2,174) (2,174)Exchange differences on cash
flow hedges– recognised during the period 481 481– deferred tax recognised (64) (64)– transferred to the profit and
loss account (12) (12)– transferred to initial costs of
hedged items (24) (24)Revaluation surplus on
available–for-sale investmentsrecognised during the period 89 89
Exchange difference 6 6
At 30th June 2005 83,277 – 342 33 321 (141) 83,832
Note:(a) The revenue reserve includes HK$919 million representing the proposed interim dividend for the period (31st December 2004: HK$2,174 million
representing the proposed final dividend for 2004).
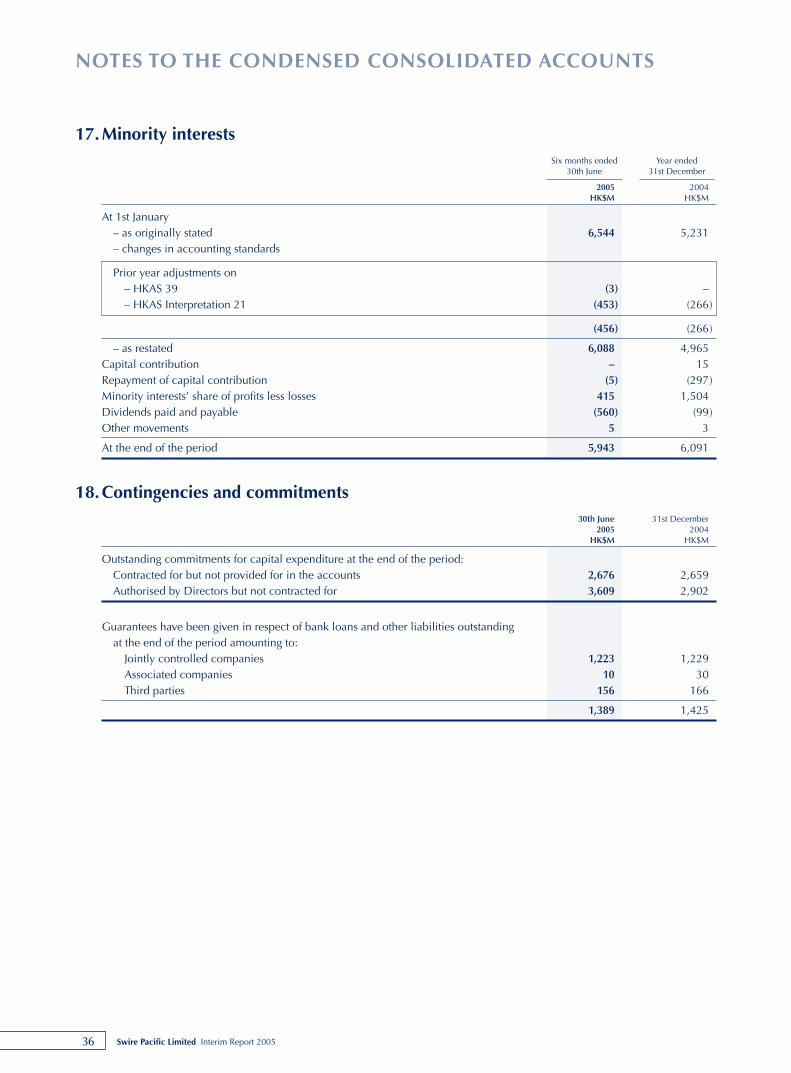
36 Swire Pacific Limited Interim Report 2005
NOTES TO THE CONDENSED CONSOLIDATED ACCOUNTS
17.Minority interestsSix months ended Year ended
30th June 31st December
2005 2004HK$M HK$M
At 1st January– as originally stated 6,544 5,231– changes in accounting standards
Prior year adjustments on– HKAS 39 (3) –– HKAS Interpretation 21 (453) (266)
(456) (266)
– as restated 6,088 4,965Capital contribution – 15Repayment of capital contribution (5) (297)Minority interests’ share of profits less losses 415 1,504Dividends paid and payable (560) (99)Other movements 5 3
At the end of the period 5,943 6,091
18.Contingencies and commitments30th June 31st December
2005 2004HK$M HK$M
Outstanding commitments for capital expenditure at the end of the period:Contracted for but not provided for in the accounts 2,676 2,659Authorised by Directors but not contracted for 3,609 2,902
Guarantees have been given in respect of bank loans and other liabilities outstandingat the end of the period amounting to:
Jointly controlled companies 1,223 1,229Associated companies 10 30Third parties 156 166
1,389 1,425
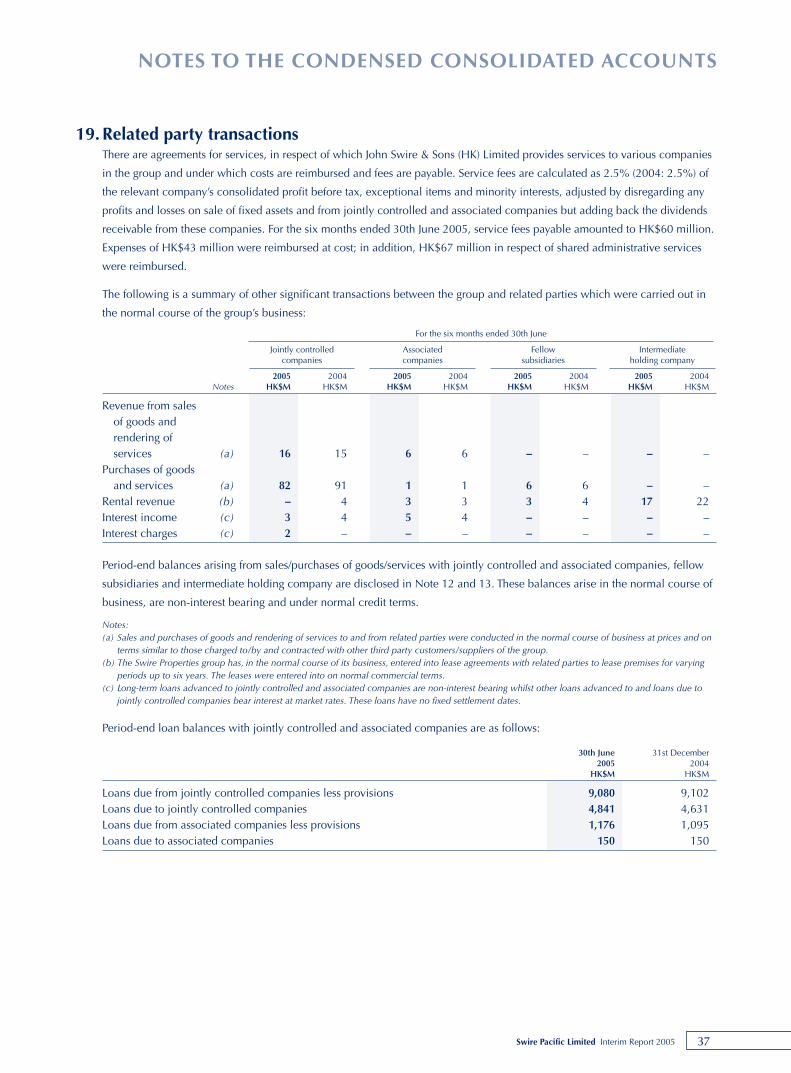
37Swire Pacific Limited Interim Report 2005
NOTES TO THE CONDENSED CONSOLIDATED ACCOUNTS
19.Related party transactionsThere are agreements for services, in respect of which John Swire & Sons (HK) Limited provides services to various companies
in the group and under which costs are reimbursed and fees are payable. Service fees are calculated as 2.5% (2004: 2.5%) of
the relevant company’s consolidated profit before tax, exceptional items and minority interests, adjusted by disregarding any
profits and losses on sale of fixed assets and from jointly controlled and associated companies but adding back the dividends
receivable from these companies. For the six months ended 30th June 2005, service fees payable amounted to HK$60 million.
Expenses of HK$43 million were reimbursed at cost; in addition, HK$67 million in respect of shared administrative services
were reimbursed.
The following is a summary of other significant transactions between the group and related parties which were carried out in
the normal course of the group’s business:
For the six months ended 30th June
Jointly controlled Associated Fellow Intermediatecompanies companies subsidiaries holding company
2005 2004 2005 2004 2005 2004 2005 2004Notes HK$M HK$M HK$M HK$M HK$M HK$M HK$M HK$M
Revenue from salesof goods andrendering ofservices (a) 16 15 6 6 – – – –
Purchases of goodsand services (a) 82 91 1 1 6 6 – –
Rental revenue (b) – 4 3 3 3 4 17 22Interest income (c) 3 4 5 4 – – – –Interest charges (c) 2 – – – – – – –
Period-end balances arising from sales/purchases of goods/services with jointly controlled and associated companies, fellow
subsidiaries and intermediate holding company are disclosed in Note 12 and 13. These balances arise in the normal course of
business, are non-interest bearing and under normal credit terms.
Notes:(a) Sales and purchases of goods and rendering of services to and from related parties were conducted in the normal course of business at prices and on
terms similar to those charged to/by and contracted with other third party customers/suppliers of the group.(b) The Swire Properties group has, in the normal course of its business, entered into lease agreements with related parties to lease premises for varying
periods up to six years. The leases were entered into on normal commercial terms.(c) Long-term loans advanced to jointly controlled and associated companies are non-interest bearing whilst other loans advanced to and loans due to
jointly controlled companies bear interest at market rates. These loans have no fixed settlement dates.
Period-end loan balances with jointly controlled and associated companies are as follows:
30th June 31st December2005 2004
HK$M HK$M
Loans due from jointly controlled companies less provisions 9,080 9,102Loans due to jointly controlled companies 4,841 4,631Loans due from associated companies less provisions 1,176 1,095Loans due to associated companies 150 150
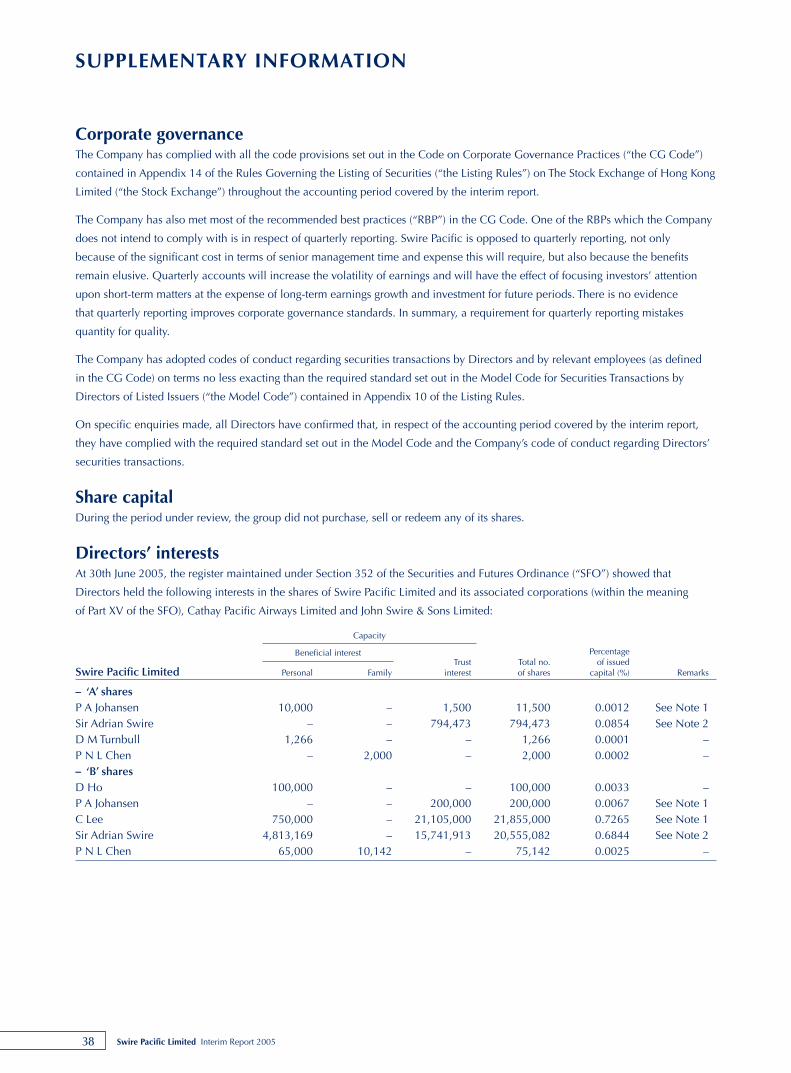
38 Swire Pacific Limited Interim Report 2005
SUPPLEMENTARY INFORMATION
Corporate governanceThe Company has complied with all the code provisions set out in the Code on Corporate Governance Practices (“the CG Code”)
contained in Appendix 14 of the Rules Governing the Listing of Securities (“the Listing Rules”) on The Stock Exchange of Hong Kong
Limited (“the Stock Exchange”) throughout the accounting period covered by the interim report.
The Company has also met most of the recommended best practices (“RBP”) in the CG Code. One of the RBPs which the Company
does not intend to comply with is in respect of quarterly reporting. Swire Pacific is opposed to quarterly reporting, not only
because of the significant cost in terms of senior management time and expense this will require, but also because the benefits
remain elusive. Quarterly accounts will increase the volatility of earnings and will have the effect of focusing investors’ attention
upon short-term matters at the expense of long-term earnings growth and investment for future periods. There is no evidence
that quarterly reporting improves corporate governance standards. In summary, a requirement for quarterly reporting mistakes
quantity for quality.
The Company has adopted codes of conduct regarding securities transactions by Directors and by relevant employees (as defined
in the CG Code) on terms no less exacting than the required standard set out in the Model Code for Securities Transactions by
Directors of Listed Issuers (“the Model Code”) contained in Appendix 10 of the Listing Rules.
On specific enquiries made, all Directors have confirmed that, in respect of the accounting period covered by the interim report,
they have complied with the required standard set out in the Model Code and the Company’s code of conduct regarding Directors’
securities transactions.
Share capitalDuring the period under review, the group did not purchase, sell or redeem any of its shares.
Directors’ interestsAt 30th June 2005, the register maintained under Section 352 of the Securities and Futures Ordinance (“SFO”) showed that
Directors held the following interests in the shares of Swire Pacific Limited and its associated corporations (within the meaning
of Part XV of the SFO), Cathay Pacific Airways Limited and John Swire & Sons Limited:
Capacity
Beneficial interest PercentageTrust Total no. of issued
Swire Pacific Limited Personal Family interest of shares capital (%) Remarks
– ‘A’ sharesP A Johansen 10,000 – 1,500 11,500 0.0012 See Note 1Sir Adrian Swire – – 794,473 794,473 0.0854 See Note 2D M Turnbull 1,266 – – 1,266 0.0001 –P N L Chen – 2,000 – 2,000 0.0002 –– ‘B’ sharesD Ho 100,000 – – 100,000 0.0033 –P A Johansen – – 200,000 200,000 0.0067 See Note 1C Lee 750,000 – 21,105,000 21,855,000 0.7265 See Note 1Sir Adrian Swire 4,813,169 – 15,741,913 20,555,082 0.6844 See Note 2P N L Chen 65,000 10,142 – 75,142 0.0025 –
39Swire Pacific Limited Interim Report 2005
SUPPLEMENTARY INFORMATION
Capacity
Beneficial interest PercentageTrust Total no. of issued
John Swire & Sons Limited Personal Family interest of shares capital (%) Remarks
– Ordinary Shares of £1Baroness Dunn 8,000 – – 8,000 0.01 See Note 3P A Johansen 8,000 – – 8,000 0.01 See Note 3Sir Adrian Swire 2,292,152 2,815,062 24,565,975 29,673,189 29.67 See Note 4– 8% Cum. Preference Shares of £1Baroness Dunn 2,400 – – 2,400 0.01 See Note 3Sir Adrian Swire 1,186,758 843,411 7,332,727 9,362,896 31.21 See Note 4
Cathay Pacific Airways Limited Beneficial interest (personal) Percentage of issued capital (%)
– Ordinary SharesP N L Chen 9,000 0.00027
Notes:1. All the Swire Pacific Limited ‘A’ and ‘B’ shares held by these Directors under “Trust Interest” are held by them as beneficiaries of trusts.2. All the Swire Pacific Limited ‘A’ and ‘B’ shares held by Sir Adrian Swire under ”Trust Interest” are held by him as trustee only and he has no beneficial interest
in those shares.3. Sir Adrian Swire has a residual beneficial interest in 4,000 Ordinary Shares in John Swire & Sons Limited held by each of Baroness Dunn and P A Johansen
and in 1,200 Preference Shares held by Baroness Dunn. These holdings are therefore duplicated in the personal interest of Sir Adrian Swire.4. Neither Sir Adrian Swire nor his wife, who are trustees of trusts which hold the Ordinary and Preference Shares in John Swire & Sons Limited listed under
“Trust Interest”, has any beneficial interest in those shares.
Included in the personal beneficial interest of Sir Adrian Swire are 18,426 Ordinary Shares and 2,453 Preference Shares held by other shareholders, includingthose referred to in Note 3, in which he has a residual beneficial interest.
Other than as stated above, no Director or chief executive of the Company had any interest or short position, whether beneficial or
non-beneficial, in the shares or underlying shares and debentures of the Company or any of its associated corporations (within the
meaning of Part XV of the SFO).
40 Swire Pacific Limited Interim Report 2005
SUPPLEMENTARY INFORMATION
Substantial shareholders’ and other interestsThe register of substantial shareholders maintained under Section 336 of the SFO shows the following interests in the Company’s
shares as at 30th June 2005:
Percentage Percentageof issued of issued
‘A’ shares capital (%) ‘B’ shares capital (%) Remarks
Substantial ShareholdersJohn Swire & Sons Limited 40,765,128 4.38 2,012,783,265 67.01 See Note 1Franklin Resources, Inc. 103,228,390 11.10 – – See Note 2J.P. Morgan Chase & Company 111,588,980 11.99 – – See Note 3
Other ShareholdersAberdeen Asset Management
Asia Limited 227,777,900 7.58 See Note 4Capital Group Companies Inc. 56,042,871 6.02 – – See Note 4
Notes:1. The shares are held in the capacity of beneficial owner.2. This notification was filed under the repealed Securities (Disclosure of Interests) Ordinance and the capacities in which they are held were not given.
A subsequent notification has been received from Templeton Global Advisors Ltd, which is a 100% owned subsidiary of Franklin Resources, Inc.,declaring its interest in 55,761,220 ‘A’ shares (representing 5.99% of the issued capital), held in the capacity of investment manager.
3. The shares held by J.P. Morgan Chase & Company are held in the following capacities:
Capacity No. of shares
Beneficial owner 3,180,076Investment manager 46,235,660Custodian Corporation/Lending agent 62,173,244
4. These shares are held in the capacity of investment manager.
The Company had not been notified of any short positions in the shares of the Company as at 30th June 2005.
At 30th June 2005, the John Swire & Sons Limited Group owned directly or indirectly interests in shares of the Company
representing 29.47% of the issued capital and 52.87% of the voting rights.
Subsequent EventOn 30th July 2005, the Company’s offer to sell its entire 17.62% interest in Modern Terminals Limited (“MTL”) for a total
consideration of HK$2,900 million was accepted by two of the other shareholders of MTL pursuant to the provisions on
pre-emption rights contained in its articles of association. Completion shall take place on or before 15th August 2005 (or such
other date as may be agreed in writing between the parties). Upon completion, the Company will realise a profit on disposal of
approximately HK$2,300 million.

This
inte
rim
rep
ort i
s pr
inte
d on
rec
ycle
d pa
per
D
esig
n by
Sed
gwic
k R
icha
rdso
n
www.swirepacific.com