2005 annual repor t - motor oil · directors report on motor oil 2005 consolidated financial...
TRANSCRIPT
A N N U A L R E P O R T 2 0 0 5
AN
NU
AL
R
EP
OR
T
20
05
Annual Report
2005


Table of Contents
4 ■ annual report
Table of Contents
1. INFORMATION CONCERNING THIS ANNUAL REPORT AND THE COMPANY AUDITORS ................................ 6
2. SHAREHOLDERS’ RIGHTS .......................................................................................................................................................... 9
2.1 General Information .................................................................................................................................................................. 9
2.2 Dividend Taxation .................................................................................................................................................................... 10
3. MARKET INFORMATION AND STRUCTURE ...................................................................................................................... 11
3.1 Structure of the Greek Oil Refining Market ........................................................................................................................ 11
3.2 Regulatory Framework .......................................................................................................................................................... 12
3.3 Recent Developments in the World Oil Market ................................................................................................................ 14
4. COMPANY PROFILE .................................................................................................................................................................... 15
4.1 General Information ................................................................................................................................................................ 15
4.2 Background .............................................................................................................................................................................. 17
4.3 Company Activity - Fixed Assets............................................................................................................................................ 18
4.4 Sales & Distribution Network – Customer Service ............................................................................................................ 19
4.5 Share Capital – Shareholder Structure ................................................................................................................................ 19
4.6 Company Administration & Management ........................................................................................................................ 20
4.7 Organization Chart ................................................................................................................................................................ 21
4.8 Personnel .................................................................................................................................................................................. 22
4.9 2003 – 2005 Capital Expenditure ........................................................................................................................................ 23
4.10 MOTOR OIL and Society .................................................................................................................................................... 25
5. PERFORMANCE REVIEW.......................................................................................................................................................... 28
5.1 Company Activities .................................................................................................................................. 28
5.2 Company Turnover and Earnings Review 2004 – 2005 ................................................................................ 31
5.3 Company Balance Sheet Statements Review 2004 – 2005 .......................................................................... 34
5.4 Company Key Financial Ratios .................................................................................................................. 38
5.5 Company Cash Flow Statements .............................................................................................................. 39
5.6 Share Performance .................................................................................................................................. 40
5.7 Consolidated Financial Statements............................................................................................................ 41
6. AFFILIATED COMPANIES .......................................................................................................................................................... 48
6.1 MOTOR OIL Subsidiaries ...................................................................................................................................................... 48
6.2 Companies included in MOTOR OIL Consolidated Financial Statements ................................................................ 49
6.3 MOTOR OIL Affiliated Companies .................................................................................................................................... 50
6.4 Other Related Companies...................................................................................................................................................... 51
6.5 BoD Report on Inter-company Transactions according to Corporate Governance Law 3016/2002 .................. 51
7. FUTURE GOALS ............................................................................................................................................................................ 52
7.1 Goals & Strategy ...................................................................................................................................................................... 52
7.2 Prospects.................................................................................................................................................................................... 53
8. DIVIDEND POLICY ...................................................................................................................................................................... 55
9. APPENDIX ...................................................................................................................................................................................... 57
Invitation to the Annual General Meeting of May 30th, 2006 ............................................................................................ 59
MOTOR OIL 2005 Published Figures and Information (Parent Company and Consolidated) .................................. 60
MOTOR OIL 2005 Financial Statements (Parent Company and Consolidated) – Report of the Auditors .............. 64
Directors Report on MOTOR OIL 2005 Consolidated Financial Statements .................................................................. 92
Directors Report on MOTOR OIL 2005 Financial Statements .......................................................................................... 97
Information Bulletin compiled in accordance with the Law 3401/2005 ........................................................................ 103
annual report ■ 5

1. Information Concerning this Annual Report and the CompanyAuditors
This Annual Report contains all the information and financial data needed for a correct assessment of the property, the
activities, the financial position, the profitability and the prospects of the Company “MOTOR OIL (HELLAS) CORINTH
REFINERIES S.A” (henceforth called the “Company” or “MOTOR OIL”), on the part of the investors and their investment
consultants.
Investors interested in additional pieces of information may inquire during working days and hours with Messrs. Spyros
Balezos (Investor Relations Officer), Philip Malergos (Financial Controller) and Ioannis Dimakis (Corporate Announcements
Officer and Shareholders’ Office Head) at the Company Headquarters, 12A Irodou Attikou str., Maroussi 151 24, (++ 30
210 8094194).
This Annual Report was compiled and distributed in accordance with the Hellenic Capital Market Commission decision
7/372/15.02.2006 as it is in force.
The following persons are responsible for the writing of this Report and the accuracy of the data contained herein:
■ Petros Tzannetakis, Deputy Managing Director – Chief Financial Officer, 12A Irodou Attikou str., Maroussi 151 24,
(tel. ++ 30 210 8094162)
■ Spyros Balezos, Banking Manager and Investor Relations Off icer, 12A Irodou Attikou str., Maroussi 151 24,
(tel. ++ 30 210 8094169).
The Company Board of Directors declare that all its Members have reviewed the content of this Annual Report and jointly
with its authors confirm that:
■ All information and data contained in the Annual Report are complete, true, correct and accurate.
■ There are no other data, neither have any events occurred, the concealment or omission of which might render the
totality or part of the data and information contained in this Annual Report misleading.
■ There are no legal disputes pending against the Company or the companies in which the Company has a controlling
interest that might have serious consequences on its financial position.
6 ■ annual report

MOTOR OIL FINANCIAL STATEMENTS (PARENT COMPANY AND CONSOLIDATED), ADJUSTED SHAREHOLDERS’
EQUITY (PARENT COMPANY AND CONSOLIDATED) AS AT 1.1.2004 DUE TO THE TRANSITION FROM THE GREEK
ACCOUNTING STANDARDS (GREEK GAAP) TO THE INTERNATIONAL FINANCIAL REPORTING STANDARDS
(IFRS), CERTIFIED PUBLIC ACCOUNTANTS, TAX AUDIT.
The Company is audited by Certified Public Accountants. The regular audits of the Company’s financial statements (Parent
Company and Consolidated) for the years 2004 – 2005 were conducted by the Auditing Company DELOITTE, 250-254
Kifissias Avenue, Halandri, tel. ++ 30 210 6781100 (responsible Certified Public Accountant Mr. George Cambanis REG
No.ICPA (GR) 10761). According to the 2005 Auditor’ s Report there are no comments for the accounting year 2005 with
the exception of a matter of emphasis concerning the Company’s following note: “The Company has not been subject to
a tax audit for the years from 2000 up to 2005. Avin Oil, has not been subject to a tax audit for the years from 2003 up
to 2005. The outcome of a tax audit cannot be estimated at present and, consequently, no provision has been made in
the financial statements, in relation to this issue. In addition, the associated companies have not been audited by the Tax
authorities since their establishment and up to 2005”.
The companies included in the consolidated financial statements of the Company are, apart from the parent Company,
the wholly owned subsidiary AVIN OIL S.A with the “full consolidation” method, the OLYMPIC FUEL COMPANY S.A with
the “net equity” method (percentage of direct and indirect participation 28%) and HAFCO S.A also with the “net equity
method” (percentage of indirect participation 50%).
It is clarified that at the time of the production of the Company consolidated financial statements of the accounting period
2005 no audited financial statements were available for the OLYMPIC FUEL COMPANY S.A and HAFCO S.A. The contribution
of the earnings of these two companies in the consolidated earnings after tax and minorities of MOTOR OIL for the year
2005 amount to 0.13% .
All three companies included in the consolidated financial statements of MOTOR OIL are audited by Certif ied Public
Accountants (Chapter 6 of the present Annual Report).
It is stressed that MOTOR OIL prepared its financial statements in accordance with the International Financial Reporting
Standards (IFRS) for the first time in 2005 and for this reason in the present Annual Report and in particular in Chapter
5 “Performance Review” a review of the last two accounting years 2004 and 2005 only is offered as their financial figures
are directly comparable. In addition, in the same Chapter the Earnings Per Share (EPS) and the Book Value (BV) Per Share
figures (Parent Company and Consolidated) are offered based on the number of shares at the year end as well as on the
weighted number of shares according to the International Accounting Standard no. 33.
The adjusted Shareholders’ Equity (on Parent Company and Consolidated basis) as at January 1, 2004 following the
transition from the Greek Accounting Standards to the International Financial Reporting Standards (IFRS) is presented
in the following table:
annual report ■ 7
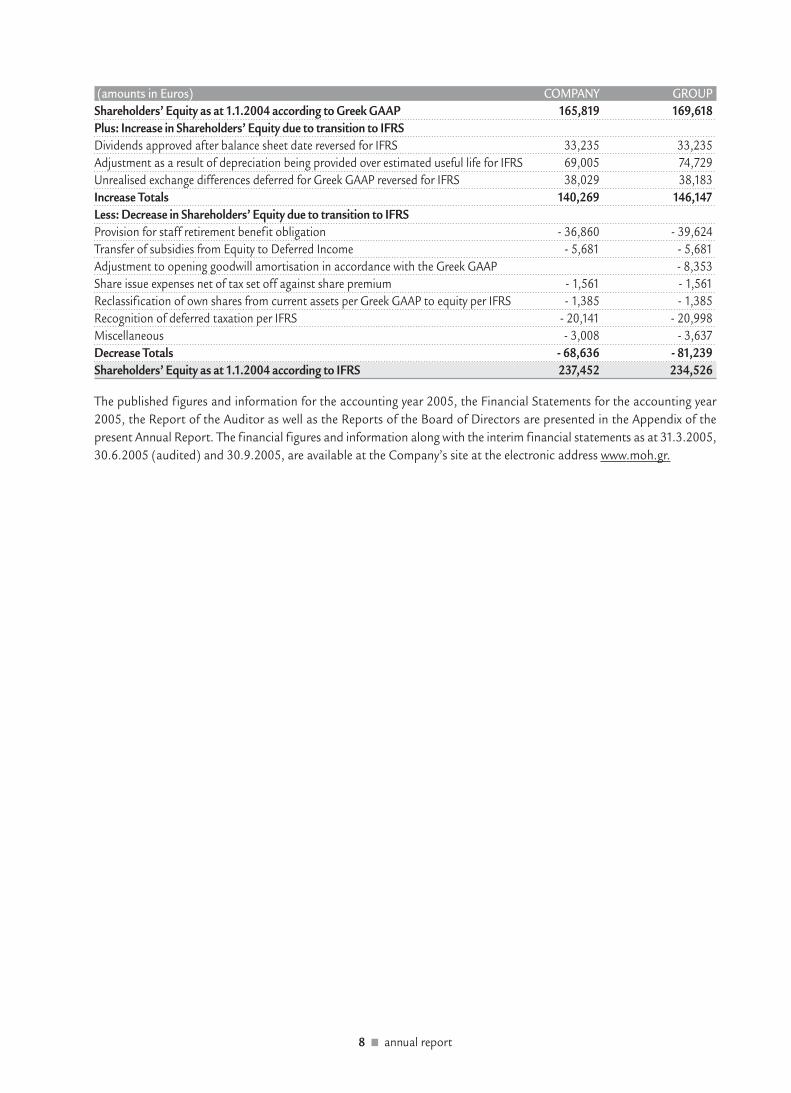
(amounts in Euros) COMPANY GROUP
Shareholders’ Equity as at 1.1.2004 according to Greek GAAP 165,819 169,618
Plus: Increase in Shareholders’ Equity due to transition to IFRS
Dividends approved after balance sheet date reversed for IFRS 33,235 33,235
Adjustment as a result of depreciation being provided over estimated useful life for IFRS 69,005 74,729
Unrealised exchange differences deferred for Greek GAAP reversed for IFRS 38,029 38,183
Increase Totals 140,269 146,147
Less: Decrease in Shareholders’ Equity due to transition to IFRS
Provision for staff retirement benefit obligation - 36,860 - 39,624
Transfer of subsidies from Equity to Deferred Income - 5,681 - 5,681
Adjustment to opening goodwill amortisation in accordance with the Greek GAAP - 8,353
Share issue expenses net of tax set off against share premium - 1,561 - 1,561
Reclassification of own shares from current assets per Greek GAAP to equity per IFRS - 1,385 - 1,385
Recognition of deferred taxation per IFRS - 20,141 - 20,998
Miscellaneous - 3,008 - 3,637
Decrease Totals - 68,636 - 81,239
Shareholders’ Equity as at 1.1.2004 according to IFRS 237,452 234,526
The published figures and information for the accounting year 2005, the Financial Statements for the accounting year
2005, the Report of the Auditor as well as the Reports of the Board of Directors are presented in the Appendix of the
present Annual Report. The financial figures and information along with the interim financial statements as at 31.3.2005,
30.6.2005 (audited) and 30.9.2005, are available at the Company’s site at the electronic address www.moh.gr.
8 ■ annual report
2. Shareholders’ Rights
2.1. General
The last cash share capital increase of the Company was effected in the context of its listing in the Athens Stock Exchange
in 2001 with the issue of 5,275,380 new common registered shares through an Initial Public Offering at the price of €
10.30 per share. In addition, based on the December 19th, 2001 decision of the General Assembly of Company Shareholders
and ruling K2-17690/14.1.2002 of the Ministry of Development the nominal value of its shares increased to € 0.30 per
share. As a result, the Company’s Share Capital today amounts to € 33,234,894 divided into 110,782,980 common
registered shares.
■ Every Company share embodies all the rights and obligations specified by Codified Law 2190/1920 and the Company
Codified Memorandum and Articles of Association. Possession of a Company Share automatically denotes acceptance,
on the part of its owner, of the Company Codified Memorandum and Articles of Association and of the lawful decisions
of the General Assembly of Company Shareholders.
■ Based on the decisions of the Extraordinary General Assembly of Company Shareholders dated December 23rd,
2005 certain provisions of the Company’s Memorandum and Articles of Association were amended – cancelled as
follows:
• Paragraph 1 of article 14 regarding the number of the members of the Board of Directors was amended and henceforth
the headcount of Board members may range from 8 up to 12.
• Paragraph 5 of article 14 regarding the right of certain shareholders to appoint members in the Board of Directors
of the Company was cancelled.
• The 2nd section of paragraph 1 of article 16 regarding the filling of the post of the Managing Director by a member
of the Board of Directors appointed or elected following a proposal of ARAMCO OVERSEAS B.V. was cancelled.
• Paragraph 1a of article 18 regarding the capacity of the Board of Directors to convene its meetings abroad was
amended and specifically the relevant convenience of the Board to convene its meetings at Dhahran of Saudi Arabia
was cancelled.
• Paragraphs 2 of article 19 and 1 of article 30 and specifically the requirement to keep the minutes of the Board of
Directors meetings and of the General Shareholders meetings respectively in the English language were cancelled.
Company shares do not embody any special privileges of any sort and the Company has not issued any ownership stock
or shares participating in earnings, neither any common or preferred founders’ shares.
Shareholder responsibility is limited to the nominal value of the shares they own. Each share entitles its owner to a right
on the Company’s property and proportionate participation in Company’s earnings in accordance with the Law and the
Company Codified Memorandum and Articles of Association. The rights and obligations that accompany each share are
transferred to every universal or special shareholder successor.
Shareholders exercise their rights in relation to Company management only through General Assemblies of Company
Shareholders.
Shareholders have a right in every future share capital increase of the Company, proportionally to their shareholding prior
to the increase, as prescribed by article 13, paragraph 5 of Codified Law 2190/1920.
Creditors of a shareholder and their successors may in no way cause the confiscation or placement of any restriction on
the use or disposal of any Company asset or of Company accounting Ledgers, neither may they demand its distribution
or its liquidation, nor may they in any way interfere in its administration or management.
Every shareholder regardless of his/her actual place of residence, is considered as having as his legal address the Company’s
headquarters and is subject to Greek Law with respect to his/her relations to the Company. Any difference or dispute
between the Company on the one hand and its shareholders or any third party on the other belongs to the exclusive
jurisdiction of the regular courts, while the Company may be sued only before the courts of its domicile.
annual report ■ 9

Every share is indivisible and entitles its owner to the right of one vote. Joint owners of common shares must appoint in
writing to the Company their representative who will represent them at the General Assembly of Company Shareholders.
In case no common representative is appointed, the rights of joint owners of shares cannot be exercised at a General
Assembly of Company Shareholders.
Every shareholder has the right to participate in a General Assembly of Company Shareholders either in person or through
a fully authorized representative. In order to be able to participate in an Extraordinary or Ordinary General Assembly of
Company Shareholders, a shareholder must block his/her shares with the Securities Dematerialization System (SAT) or
the Central Securities Depository (CSD) at least five (5) days prior to the date set for the General Assembly of Company
Shareholders. Within the same deadline the Company must receive certification of this blocking placed on the shares as
well as representation documentation in return for a receipt that is given to the shareholder or representative for his/her
admission to the General Assembly of Company Shareholders. Those who fail to comply with these terms can only be
admitted to the General Assembly of Company Shareholders by permission of the latter.
Company Shareholders representing at least 5% of paid up Share Capital:
a. Have the right to submit petition to the First Instance Court of the Company’s domicile to conduct an audit of the
Company in accordance with articles 40, 40e of Codified Law 2190/1920, and
b. May ask the convention of General Assembly of Company Shareholders. The Board of Directors is obliged to convene
the Meeting no later than thirty (30) days from the day the relevant petition is submitted to the Chairman of the Board
of Directors. On their petition, the petitioning shareholders have to state the issues on which the General Assembly will
have to decide upon.
Every shareholder may request, ten (10) days prior to the Ordinary General Assembly of Company Shareholders, copies
of the annual financial statements as well as of the relevant Board-of-Directors reports and of Auditors’ reports.
Shareholders entitled to dividend are the ones who appear on the Shareholders’ Registry, which is kept by the Company,
on the date the annual accounting statements are approved by the Ordinary General Assembly of Company Shareholders
or on whichever date specified by the Ordinary General Assembly of Company Shareholders.
Dividend first day of payment is within two (2) months from the date of the Ordinary General Assembly of Company
Shareholders that approved the annual financial statements. The place and method of payment is acknowledged to the
shareholders through announcements on the daily press.
Dividends not claimed for five years since they became payable are written off in favor of the State.
All procedural matters regarding share blocking, so that shareholders may participate in General Assemblies of Company
Shareholders, and dividend payment are provided for by the Regulation of Operation and Clearance of the Securities
Dematerialization System of the Central Securities Depository as this Regulation is in force.
2.2 Dividend Taxation
Under Greek Corporate Law (Law 2238/1994 article 109), as it is in force, the rate of income tax for companies listed on
the Athens Stock Exchange (ASE), with the exemption of banks, is 32% for the accounting year 1.1.2005 – 31.12.2005 and
is applied on taxable earnings prior to any appropriation. In this way, dividends are paid out from already taxed corporate
earnings and, therefore, the shareholder has no further tax obligation on the dividend amount he collects.
The date on which the General Assembly of Company Shareholders approves the Financial Statements is regarded as the
one that dividend income is generated.
It must be noted that, under Greek Corporate Law, in case a subsidiary proceeds with a dividend distribution from its
earnings, the portion of the dividend attributable to the parent company can only be distributed by the latter to its shareholders
during the next fiscal year (unless the parent company decides to distribute an interim dividend during the current fiscal
year) and, consequently, this portion of dividend is recorded as income on next fiscal year’s earnings of the parent company.
That part of parent company earnings accounted for by dividend income received by its subsidiaries can only be distributed
to parent company shareholders in the next fiscal year following its collection.
10 ■ annual report

3. Market information and Structure
3.1 Structure of the Greek Oil Refining Market
3.1.1. General
Production of crude oil in Greece is very limited. The Prinos reserves at Kavala cover less than 2% of domestic demand and
consequently nearly all of the country’s needs in crude oil is covered by imports. Once processed in domestic refining
units, crude oil is exported or sold in the domestic market.
The following chart depicts the structure of the domestic oil market:
annual report ■ 11
OIL REFINING COMPANIES
CRUDE
OIL
PRODUCT
IMPORTS
REFINING FUEL TRADING END CONSUMER
– MOTOR OIL
– HELLENIC PETROLEUM
– PUBLIC POWER CORP.
– ARMED FORCES
– ALUMINIUM OF GREECE
– Aviation
– Shipping
FUEL TRADING COMPANIES
EXPORTS
INTERNATIONAL SALES
– Gas Stations
– Other Retail Sales
– Industrial Sales
DOMESTIC MARKET
Gas Stations
EKO - ELDA
BP
SHELL
AVIN
OTHERS
3.2. Regulatory Framework
3.2.1 General
Fuel production and distribution in Greece takes place within a unique regulatory framework. Until the mid-eighties there
was heavy state intervention. The Greek government set the pricing policy and ruled that petroleum product commercial
enterprises could only get their supplies from the two state-owned refineries. Gradually the market liberalized completely
and at present its operation is regulated by Law 3054/2002. According to this law a legal entity may obtain more than
one licenses (e.g., oil refining, fuel trading, retail customer sales activities/gas stations’ operation etc.) on condition that
the licensee fulfills the requirements, as these are set by the law, for each separate activity.
3.2.2. Oil Refining
This regulatory framework allows oil refining companies to freely import and process crude oil and petroleum products
from any country on condition that they pay taxes relating to imports from non European Union Member States in
harmonisation to European Union directives.
3.2.3. Fuel Retailing (Marketing)
For the Ministry of Development to grant an operating license to a Company engaged in fuel retailing the latter must fulfill
the following requirements: a) the Company share capital must exceed a stipulated floor, b) the Company must be in
possession of its own storage premises or must be entitled to the usage of storage premises the storage capacity of which
is dependent upon the type of license the Company has applied for, c) the Company technical installations must be suitable
for the safe transport and distribution of the products, and d) the Company must be in possession of a tank truck fleet
with a minimum number of vehicles. The Law enforces restrictions regarding the usage of tank trucks and of the vessels
which carry oil products from refineries.
Companies engaging in fuel retailing may obtain finished products either from domestic refineries or through imports
from any country under the sole condition that they pay taxes in harmonization to European Union directives relating to
imports from non EU Member States. According to the Law 3054 / 2002, these companies may operate gas outlets and
have the right to be owners of land and gas outlet equipment. In addition, “independent” gas outlet owners may get their
supplies directly from the refineries and/or through imports as well as from companies engaging in fuel retailing.
3.2.4. Mandatory Reserves
Based on the Law 3054/2002 the importers of crude and petroleum products either domestic refineries, or companies
engaging in fuel trading, or gas station owners, have to maintain mandatory reserves equal [in value] to 90/365 of previous
calendar year’s net imports as a means to meet not only the country’s needs but also the European Union and the
International Energy Association (IEA) requirements. Compliance with the law calling for maintenance of mandatory
reserves results in Greek refineries adding a mark up when selling their products in the domestic market to compensate
for this additional cost of storage.
3.2.5. Pricing
Consumer prices of petroleum products are fully liberalised and set according to supply and demand prevailing conditions.
For reasons relating to protection of the consumers, refineries acknowledge to the Ministry of Development their way of
ex factory price determination, while companies engaging in petroleum product commerce acknowledge the actual selling
prices at which they supply the gas outlets. The government has kept the right to impose on a national or local level
maximum selling prices.
12 ■ annual report

3.2.6. Taxes
Law 2127/93 and Law 1642/86 as amended on 1/1/93, deal with all issues relating to Excise Tax and VAT on fuels.
3.2.7. Allocation of the greenhouse gas emission allowances
Aiming at the reinforcement of the global endeavor to confront the danger of climate change, the Kyoto Protocol was
adopted in 1997, defining legally binding objectives for the reduction of the greenhouse gas emissions in the developed
countries.
In the framework of the accomplishment of the objectives of the Protocol, the E.U adopted the Directive 2003/87/EC,
according to which, a trading scheme for the greenhouse gas emission allowances was established. The Directive calls on
the Member States to submit comprehensive national allocation plans for the greenhouse gas emission allowances to the
different activities covered by the Directive, and therefore to the relevant installations. Following the Ministerial Decision
No. 54409/2632 of 2004, Greece harmonised with the above mentioned directive, while in 2005 the Greek National
Allocation Plan was approved by the European Commission.
The crude oil refining and trading sector is subject to the above-mentioned Directive. Hence, during the first phase of the
implementation of the Plan (2005-2007) MOTOR OIL HELLAS was allocated gas emission allowances both for its existing
and already operating units as well as for its units under construction.
3.2.8. Product Specifications
Specifications regarding oil products targeted for the domestic market are prescribed by Law 549/70 and its consequent
ministerial decrees. Product testing regarding specif ications fulf ilment is carried out by the State General Chemical
Laboratory. In the context of European Union’s environmental protection policy, new specifications on sulfur content as
well as other qualities for gasoline and automotive diesel fuel oil were set recently. The new specifications will become
effective through a two step process the respective deadlines of which have been announced as the years 2005 and 2009.
These new specifications are presented in the next table.
NEW SPECIFICATIONS (FOR GASOLINE & GASOIL)
EFFECTIVE FROM:01/01/2005 01/01/2009
Unleaded Gasoline
Sulfur content (ppm) 50 max 1 10 max
Aromatics (% vol.) 35 max 35 max
Olefins (% vol. ) 18 max 18 max
Benzene (% vol.) 1 max 1 max
Oxygenates (% vol.) 2.7 max 2.7 max
Automotive Gasoil (Diesel)
Density at 15oC (kg/l) 0.845 max 0.845 max
Sulfur content (ppm) 50 max 1 10 max
Cetane number 51 min 51 min
Polyaromatics (% wt) 11 max 11 max
Distillation at 95% vol. (oC) 360 max 360 max
1 As of January 1st, 2005, each European Union Member State must gradually make available gasoline and automotive diesel with a
maximum 10mg/kg sulfur content.
annual report ■ 13
3.3. Recent Developments in the World Oil Market
During 2005 the demand for crude oil increased in absolute terms by 1.1 million bpd, with the aggregate demand amounting
to 83.22 million bpd against an increase of 2.7 million bpd and of an aggregate demand of 82.15 million bpd, in 2004.
The comparatively slower rate of demand increase in 2005 compared to 2004, did not create conditions of surplus of oil
supply since the latter was negatively affected to a great extent by natural phenomena and specifically the Hurricanes Rita
and Katrina that hit the geographic region of the gulf of Mexico in the USA.
The production of crude in the USA was affected by the stoppage of drilling operations resulting in the reduction of oil
production by roughly 5% in 2005 compared to 2004. More specifically, during the last quarter of 2005 it is estimated
that the reduction of crude production in the USA in absolute terms amounted to 570,000 bpd in relation to the respective
quarter of 2004 and as a percentage to –16%.
As a result of the above, the international prices of various types of crude rose to considerably higher levels in 2005 compared
to 2004 (Chapter 7 of the present Annual Report).
As regards petroleum products, a notable increase in their prices occured in 2005. This development is attributed to the
fact that particularly during the second half of the year the production of refined products decreased due to the hurricanes
in the USA when the local refineries suspended their operations. However, the demand for refined products coming from
the other areas in the USA (one of the biggest oil consumers worldwide) as well as the rest of the world remained steady.
Along with the above described situation in the USA, the extremely adverse weather conditions (snowfalls) prevailing in
Europe in 2005 revealed, to a certain degree, the diff iculty of the refineries to adjust their product mix and meet the
demand for particular products such as gasolines and diesels the prices of which rose significantly (Chapter 7 of the present
Annual Report).
To sum up, the incremental increase of the prices of the refined products was greater than the incremental increase of the
prices of crude oil and this resulted in the refining margins of the complex refineries in the region of Eastern Mediterranean
to amount to 63.4 $/MT on average in 2005.
14 ■ annual report

4. Company Profile
4.1. General Information
MOTOR OIL is one of the most important industrial companies in Greece in the oil sector.
In 2002 the Company acquired 100% of AVIN OIL S.A. (henceforth called “AVIN OIL”), which ranks 4th amongst the fuel
trading companies in the domestic market, thus obtaining a strong arm in retail sales.
MOTOR OIL is the only refining company that possesses a lubricants complex and together with Hellenic Petroleum’s
Aspropyrgos refinery, are the only complex oil refineries in Greece. Besides the basic complexes (atmospheric distillation,
catalytic reforming and hydrotreating) it includes other conversion units such as catalytic and thermal cracking.
The Company was founded through the notarial deed nr 4105/1970 with initial shareholders the Vardinoyannis Group
companies “VARNIMA CORPORATION OF PANAMA” and “SEKA SA VESSEL FUELING STATIONS”. Its founding permit
was based on Ministry of Commerce decision 23020/1339 that ratif ied its charter (Government Journal - FEK - nr
511/7.05.1970) under the name “MOTOR OIL (HELLAS) LUBRICANT REFINERIES S.A.”, that was subsequently changed,
following a decision at its General Assembly of Company Shareholders of 31.10.1972 (Government Gazette – FEK – nr
1896/29.11.1972), into “MOTOR OIL (HELLAS) CORINTH REFINERIES S.A.” - as accurately translated from the Greek,
this is the Company’s official trade name used in its transactions with foreign business entities.
The Company’s headquarters are located in the municipality of Maroussi of Attica (official address: 12A Irodou Attikou
str.) and is registered as an incorporated firm (“Societé Anonyme”) with the Prefecture of Athens, East Attica Sector, with
Incorporated Company Registration number 1482/06/B/86/26.
The Company’s term was set to 50 years, up to 7/5/2020. License number D3/A/4124/20.3.2001, issued by the Ministry
of Development provides the Company the right to infinitely operate its premises in the area of Aghii Theodori of Corinth.
According to article 3 of the Codified Memorandum and Articles of Association of the Company, its corporate objectives
are:
■ To establish and operate industrial units for the production and processing of gasoline, light diesel, illuminating
kerosene, fuel oil, heating gasoil, LPG (liquid petroleum gas), basic and final lubricants, mineral oils and other petroleum
products and by-products of any kind as well as to establish units for the packaging and preservation thereof and
develop the various types of products and by-products being produced or manufactured.
■ In accordance with Decision nr 805/729/1970 of the Ministers of Coordination, Finance and Industry to carry on any
commercial or industrial activities for the development or marketing, in Greece and abroad, with respect to the above
mentioned products and any products, in general, being produced by the Company, i.e petroleum products and by-
products and services to automobiles, vessels, aircraft and establish machine repair shops, motor inns, restaurants
and coffee-shops and any other relevant activities.
■ To acquire, purchase, store, import, export, be a broker with respect to, transport, sell and /or distribute crude oil,
petroleum products and by-products and of other hydrocarbons, minerals and ores, chemicals (both organic and
inorganic), and by-products and products used as substitutes therefore and generally to be involved in the marketing
and distribution business and have any other activities which are necessary or useful for doing and developing such
business.
■ To establish and operate facilities for the production of steam and electric power as well as port facilities, hydraulic
facilities, sewage facilities and other similar facilities serving the Company’s objectives and the objectives of other
companies to be established or of entities that are related or cooperate with the Company as well as to render various
general services to these companies or entities.
annual report ■ 15

■ To establish and operate factories for the industrial processing and storage of LPG, packaging materials, and to
perform any marketing related thereto as well as to perform any industrial or commercial activity or business relating
to this purpose.
■ To hold, license and otherwise possess and manage in any way whatsoever trademarks, copyrights and letters patent,
methods of elaboration/preparation of plans/designs, production methods, etc.
■ To establish, operate and exploit liquid fuel outlets.
■ To engage in the business of handling, transporting and disposing of hydrocarbon wastes
■ To establish other companies of any legal form with identical, similar or complementary objectives or companies
simply useful in any way, even on an indirect manner, for the accomplishment of the objectives of the Company.
■ To participate in and cooperate with other business entities/ groups of whatever form with similar, relevant, complementary
or even simply useful in any way for the accomplishment, even on an indirect basis, of the objectives of the Company
as well as to represent, directly or indirectly, Greek or foreign companies having similar objectives.
■ To purchase, rent, and lease tangible and intangible assets as a means to fulfill the above mentioned objectives.
■ To grant third party guarantees or ordinary guarantees or any security of any form whatsoever (real or personal) in
favor of natural persons or legal entities and in general to perform any act that aims directly or indirectly at achieving
any of the above mentioned objectives.
It is noted that the corporate objectives of the Company, as set forth in its Codified Memorandum and Articles of Association,
have not been amended in the last five years.
The industry in which the Company carries out its business activities is defined as “Production of Oil Refining Products”
(Statistical Codification of Economic Activity –STAKOD 03- 232.0).
16 ■ annual report
4.2. Background
The main milestones in the Company’s history are:
1970-1972
Foundation and beginning of operation of the refinery comprised of a crude oil refining unit, a basic lubricant production
unit, a jetty with loading terminal, and truck loading terminals.
1975
Entrance to fuel production with the addition of the Atmospheric Distillation Unit.
1978
Construction of the Catalytic Reforming Unit (further downstream processing of naphtha).
1980
Installation of the Catalytic Cracking Unit (further downstream processing of fuel oil to turn it into high value-added
products).
1984
Construction of an Electric Power Production Unit that uses gaseous fuel as raw material. Right to sell energy to the
domestic market.
1993
ISO 9002 accreditation for the entire spectrum of activities of the Company.
1996
Purchase of 50% of the Company’s shares by Aramco Overseas Company BV, 100% subsidiary of Saudi Arabian Oil Company
(Saudi Aramco). Relocation of Company Headquarters to a modern building in Maroussi, Attica.
2000
Completion of investment projects aiming at the production of products in harmonization to European Union specifications
for 2000. During the same year the Environmental Protection System of the Company is ISO 14001 accredited.
2001
Installation of a new gas turbine in the electric power station. Upgrading of the lubricants’ vacuum unit. Company share
capital increase through public offer of shares and listing in the Athens Stock Exchange.
2002
Acquisition of 100% of AVIN OIL which engages in fuel trading in the domestic market.
2003
ISO 9001:2000 accreditation for the Quality regarding the whole spectrum of Company activities.
2004
Recertification of the Environmental Protection System of the Company according to the ISO 14001 with validity for three
more years (until 2007).
2005
Completion of the installation of the Hydrockracking Unit (Hydrocracker) for the production of the new clean fuels
according to the specifications of the European Union not only of 2005 but also of 2009 (Auto Oil II). Acquisition of the
aggregate stake of Aramco Overseas Company B.V. in the Company by Motor Oil Holdings S.A.
annual report ■ 17
4.3. Company Activity – Fixed Assets
Together with its ancillary units and its fuel custody transfer premises the refinery constitutes the largest private industrial
complex in Greece and is considered one of the most flexible refineries in Southeast Europe.
Up until 1989 MOTOR OIL exported its entire production. From 1989 until today, following the liberalization of the market,
the Company has acquired approximately 25% of the domestic market remaining at the same time a strong export refinery.
Consequently, business risk is reduced through the geographical distribution of sales between domestic and foreign markets
as well bunkering (shipping and aviation).
The refinery is one of the most modern industrial complexes, capable of processing low-quality raw material and turn it
into high-value-added finished products. The refinery is vertically integrated to the highest degree possible and apart from
that its facilities include extensive storage capacity of approximately 2.2 million cubic meters, loading premises and, port
installations consisting of three jetties with maximum berthing capacity of 450,000 tons.
The Company uses crude oil as its primary raw material to produce a full range of products, i.e, gasoline, diesel, fuel oil,
asphalt, jet fuel and lubricants with the emphasis being placed on high-value-added products and on new-specification
products thus catering to the needs of large companies engaging in petroleum product commercial activities in Greece
and abroad. It is also the only producer of lubricants in Greece. The basic and final lubricants produced are approved by
international organizations (ACEA, API) and by the United States Armed Forces.
Total covered area at refinery premises concerns mainly storage tanks and building complexes. These building complexes
accommodate the monitoring equipment of the production facilities, the ancillary power stations, the maintenance-repair
units, the storage premises for auxiliary production material – equipment, and management offices.
Most of those premises were built in the period 1972-3. Major additions to buildings were effected gradually throughout
the decades of the 1980s and the 1990s. Furthermore, large scale investments were carried out during the last three year
period 2003 – 2005 amounting to approximately € 500 million (detailed description in the section 4.9 of the present
Chapter).
As at 31.12.2005 the net book value of the building complexes owned by the Company amounted to € 67,392 thousand
whereas the net book value of land sites to € 30,752 thousand.
Apart from its industrial production activity, the Company is active in commerce through buying and selling finished
products, taking advantage of any market opportunities as they appear.
The Company rents office space at the building at Maroussi (12A Irodou Attikou str., 151 24 Athens) in which it houses
its headquarters.
It is emphasized that the Company has all required licenses relating to its operation while no administrative penalty has
ever been imposed or is pending for any violation on these licenses.
It must also be stressed that there has never been an interruption in Company activities throughout the period since its
foundation.
18 ■ annual report
4.4. Sales & Distribution Network – Customer Service
The bulk of the Company’s product output is delivered to its customers FOB at the refinery premises at Aghii Theodori.
That part of the output targeted for consumption in the large cities is carried with vessels to third party premises, while
the remainder is either carried through pipelines at the nearby storage tanks of AVIN OIL or delivered onto tank-trucks
directly from the refinery.
The clientele of MOTOR OIL includes all large Greek companies engaging in petroleum product activities as well as
companies engaging in ship refueling (bunkering), while part of the revenue is generated from exports to the countries of
the East Mediterranean, the Balkans etc.
Further to its commercial activities, the Company offers its customers various types of services taking full advantage of its
infrastructure. These services include product storage facilities as well as crude oil refining for third parties.
It is also emphasized that MOTOR OIL is one of the major aircraft fuel suppliers of the new Athens Airport at Spata. More
specifically, the Company participates in the share capital of the “ATHENS AIRPORT FUEL PIPELINE COMPANY” assigned
the project to construct and handle the pipeline which will carry fuel directly from the Aspropyrgos Hellenic Petroleum Refinery
to the new Athens Airport, and in the share capital of “OLYMPIC FUEL COMPANY” assigned the task to handle the fuel tanks
and the fuel pipeline within the new Athens Airport area (for the participation percentages please see Chapter 6).
4.5. Share Capital – Shareholder Structure
The share capital of the Company amounts to € 33,234,894 consisting of 110,782,980 common registered shares of a
nominal value of € 0.30 each. It must be noted that there is not any authorized but not yet issued share capital and no
issue of shares which do not represent share capital has taken place. Moreover, there are not any outstanding convertible
to shares bonds (or any other form of debt), and there are not any terms in the Codified Memorandum and Articles of
Association relating to changes of share capital which are more restrictive than those terms specified by the law.
The Company’s shareholder structure is presented hereunder:
Shareholder Number of Shares %
PETROVENTURE HOLDINGS LTD 56,499,320 51.00%
PETROSHARES LIMITED 11,673,690 10.54%
Free Float 42,609,970 38.46%
TOTAL 110,782,980 100.00%
The two legal entities-shareholders of MOTOR OIL, PETROVENTURE HOLDINGS LTD and PETROSHARES LIMITED have
their headquarters at Jersey Channel Islands and they operate according to the 1991 Jersey law. In November 2005, MOTOR
OIL HOLDINGS S.A a Luxembourg based holding company owned by the Vardinoyannis family announced that it became
the controlling shareholder of PETROVENTURE HOLDINGS LTD and PETROSHARES LIMITED.
SHARE BUYBACK
In 2005, MOTOR OIL sold the aggregate of 15,180 own shares it acquired in the context of the relevant decision of the
Annual Ordinary General Shareholders Meeting of June 1st, 2004. As a result, MOTOR OIL has no own shares in its
possession.
annual report ■ 19
4.6. Company Administration & Management
The Board of Directors of the Company is presented hereunder:
First Name and Surname BoD Position Member Identity *
1. Vardis J. Vardinoyannis Chairman & Managing Director Executive
2. John V. Vardinoyannis Vice-Chairman Non-Executive
3. Panayotis N. Kontaxis Vice-Chairman Non-Executive
4. John N. Kosmadakis Deputy Managing Director Executive
5. Petros T. Tzannetakis Deputy Managing Director Executive
6. Demosthenes N. Vardinoyannis Member Non-Executive
7. Nikos Th. Vardinoyannis Member Non-Executive
8. George P. Alexandridis Member Non-Executive
9. George Th. Theodoroulakis Member Non-Executive
10. Despina N. Manolis Member Non-Executive
11. Konstantinos V. Maraveas Member Non-Executive Independent
12. Leonidas K. Georgopoulos Member Non-ExecutiveIndependent
* According to Corporate Governance Law 3016/2002
The term of the above Board of Directors expires on the next Annual Ordinary General Assembly of the Company Shareholders
which will approve the Company Financial Statements of the accounting year 2005.
The top executives of the Company are presented hereunder:
■ Vardis J. Vardinoyannis, Chairman & Managing Director. He is one of the founders of the Company and has been a
member of the top management team since 1972. Apart from MOTOR OIL, he has exploited a wide array of
entrepreneurial endeavours in Greece and abroad.
■ John N. Kosmadakis, Deputy Managing Director, General Manager of Marketing. He has been working with the
Company since 1978.
■ Petros T. Tzannetakis, Deputy Managing Director, Chief Financial Officer. He has been working with the Company
since 1986.
■ Michael Stiakakis, Refinery Manufacturing General Manager. He has been working with the Company since 1982.
■ Constantinos Vasilakis, General Manger of Corporate Planning. He has been working with the Company since 1973.
Mr. Constantinos Thanopoulos is the Internal Audit Manager.
Top Management and Administration remuneration for accounting year 2005 amounted to € 1,852.0 thousand while
BoD members’ fees (included in Administrative Expenses) amounted to € 216.0 thousand.
TOP MANAGEMENT REMUNERATION
(amounts in thousand euros) 2003 2004 2005
Top Management and Administration Remuneration 1,791.6 1,941.5 1,852.0
BoD Members’ Fees 213.0 213.0 216.0
Total 2,004.6 2,154.5 2,068.0
20 ■ annual report

annual report ■ 21
BO
AR
D O
F D
IRE
CT
OR
S
VIC
E C
HA
IRM
AN
O
F T
HE
BO
AR
D
DE
PU
TY
MA
NA
GIN
G D
IRE
CT
OR
CO
RP
OR
AT
E P
LA
NN
ING
FIN
AN
CE
MA
RK
ET
ING
RE
FIN
ER
Y M
AN
UFA
CT
UR
ING
DE
PU
TY
MA
NA
GIN
G D
IRE
CT
OR
VIC
E C
HA
IRM
AN
O
F T
HE
BO
AR
D
Inte
rnal
Au
dit
Lega
l Dep
artm
ent
Stra
tegi
c P
lan
nin
g D
epar
tmen
t
Bu
sin
ess
An
alys
is
Dep
artm
ent
Trea
sury
D
epar
tmen
t
Inve
sto
r R
elat
ion
s D
epar
tmen
t
Insu
ran
ce
Dep
artm
ent
Ban
kin
g &
In
vest
men
t D
epar
tmen
t
Info
rmat
ion
Sy
stem
s D
epar
tmen
t
Ad
min
istr
atio
n &
H
um
an
Res
ou
rces
D
epar
tmen
t
Fuel
s &
Cru
de
Mar
keti
ng
Dep
artm
ent
Sup
ply
&
Dis
trib
uti
on
D
epar
tmen
t
Tech
nic
al
Dep
artm
ent
Qu
alit
y A
ssu
ran
ce
Sect
ion
Fuel
s P
rod
uct
ion
D
epar
tmen
t
Fuel
sO
ffsi
tes
Dep
artm
ent
Pu
rch
asin
g D
epar
tmen
t
Mai
nte
nan
ce
Dep
artm
ent
Lub
es
Pro
du
ctio
n
Dep
artm
ent
Ad
min
istr
atio
nD
epar
tmen
t
Lub
es
Mar
keti
ng
Dep
artm
ent
Op
erat
ion
s D
epar
tmen
t
Acc
ou
nti
ng
Dep
artm
ent
Acc
ou
nti
ng
&
Fin
anci
al
Co
ntr
ol
Sect
ion
Fin
anci
al
Rep
ort
ing
& In
ter.
C
on
tro
l Sta
ff
CH
AIR
MA
N O
F T
HE
BO
AR
D
& M
AN
AG
ING
DIR
EC
TO
R
4.7
. Org
aniz
atio
n C
har
t
4.8. Personnel
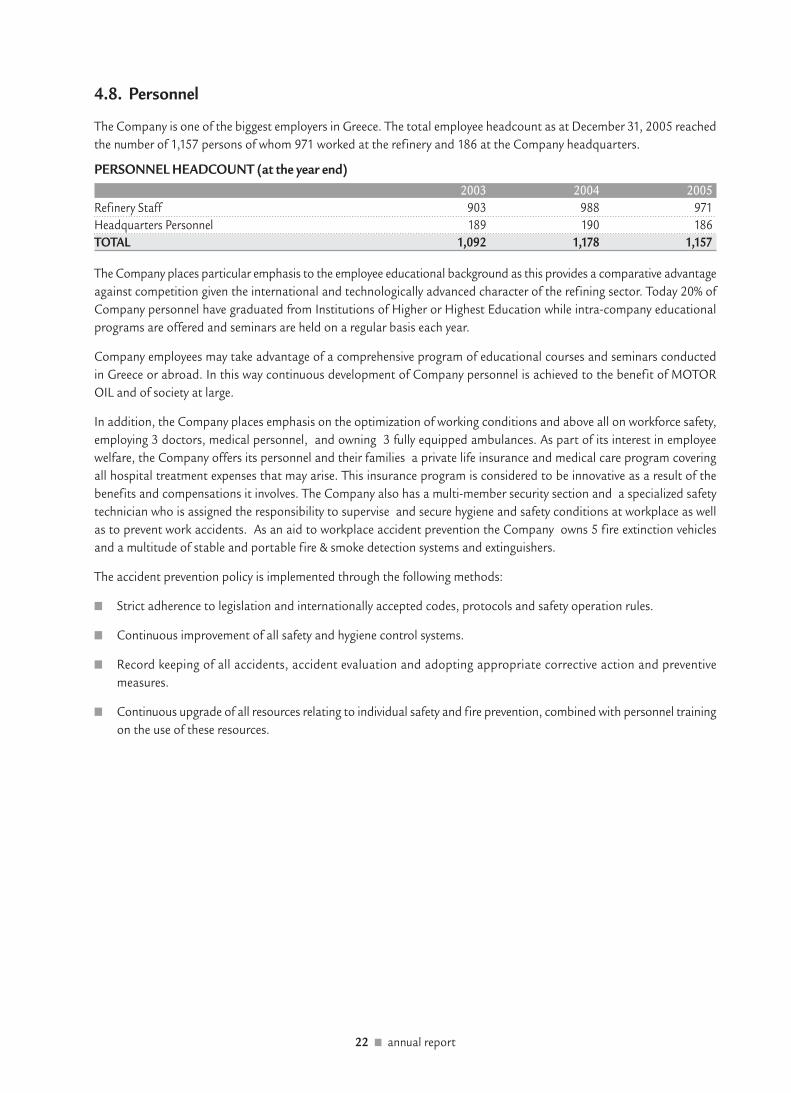
The Company is one of the biggest employers in Greece. The total employee headcount as at December 31, 2005 reached
the number of 1,157 persons of whom 971 worked at the refinery and 186 at the Company headquarters.
PERSONNEL HEADCOUNT (at the year end)
2003 2004 2005
Refinery Staff 903 988 971
Headquarters Personnel 189 190 186
TOTAL 1,092 1,178 1,157
The Company places particular emphasis to the employee educational background as this provides a comparative advantage
against competition given the international and technologically advanced character of the refining sector. Today 20% of
Company personnel have graduated from Institutions of Higher or Highest Education while intra-company educational
programs are offered and seminars are held on a regular basis each year.
Company employees may take advantage of a comprehensive program of educational courses and seminars conducted
in Greece or abroad. In this way continuous development of Company personnel is achieved to the benefit of MOTOR
OIL and of society at large.
In addition, the Company places emphasis on the optimization of working conditions and above all on workforce safety,
employing 3 doctors, medical personnel, and owning 3 fully equipped ambulances. As part of its interest in employee
welfare, the Company offers its personnel and their families a private life insurance and medical care program covering
all hospital treatment expenses that may arise. This insurance program is considered to be innovative as a result of the
benefits and compensations it involves. The Company also has a multi-member security section and a specialized safety
technician who is assigned the responsibility to supervise and secure hygiene and safety conditions at workplace as well
as to prevent work accidents. As an aid to workplace accident prevention the Company owns 5 fire extinction vehicles
and a multitude of stable and portable fire & smoke detection systems and extinguishers.
The accident prevention policy is implemented through the following methods:
■ Strict adherence to legislation and internationally accepted codes, protocols and safety operation rules.
■ Continuous improvement of all safety and hygiene control systems.
■ Record keeping of all accidents, accident evaluation and adopting appropriate corrective action and preventive
measures.
■ Continuous upgrade of all resources relating to individual safety and fire prevention, combined with personnel training
on the use of these resources.
22 ■ annual report

4.9. 2003–2005 Capital Expenditure
During the last three years capital expenditure amounted to € 483 million aiming at the expansion and the upgrading of
the production units of the refinery.
(amounts in million euros) 2003 2004 2005 Total
Investment Amount 86 243 154 483
A) The greatest part of capital expenditure during the period 2003–2005 aimed at the maximization of the refining margin.
The most significant of these investments are presented next:
■ Installation of a Hydrocracking Unit (total expenditure € 350 million) for the production of the new clean fuels
according to the specifications of the European Union not only for 2005 but also for 2009 (Auto Oil II). This unit will
enhance the production capacity of the refinery with reference to diesel, of which there is a shortage in Greece and
generally in Europe. The additional diesel production will substitute refinery imports while the particular unit will
provide greater flexibility in maximizing either diesel or gasolines production according to seasonal demand.
In the context of this project the following units were constructed:
• A Mild Hydrocracker unit with a 37,000 bpd capacity.
• A Gasoil desulphurisation unit with a 32,000 bpd capacity.
• A hydrogen production unit with a 65,000 Nm3/hr capacity.
• A 150 kV substation for the connection of the refinery with the interconnected transmission system of electricity, as
well as a new gas turbine with which the installed electricity capacity increased to 62 MW.
• A new complex for sulfur recovery.
Furthermore, extended revamp works in the existing distillation units (atmospheric and vacuum) as well as restructuring
in the refinery utilities (new flare, new desalination units, water treatment, instrument air etc.) took place.
The Hydrockracker Complex became fully operational in November 2005. All the project objectives regarding delivery
deadlines, quality of produced products and budgeted capital expenditure were met.
For the completion of the project more than 4.5 million man hours were required. It is important to mention that throughout
the duration of the project no working accident occurred, despite the fact that a great part of the works took place in
limited space conditions due to the existing units. This is indicative of the emphasis placed by the Company on the aspect
of safety at workplace.
In the context of the Hydrockracker project and through a series of upgrades, modifications and additions, the environmental
terms of the refinery improved as regards both the gas emissions and the management of liquid wastes.
As a result of the installation of the Hydrockracker, the Nelson Complexity Index assigned to the ref inery increased
significantly placing it among the most sophisticated and modern ones all over Europe, thus strengthening one of its key
competitive advantages even more.
■ The installation of an Advanced Process Control (APC) System, which is an extension of the Distributed Control
System, contributes to the maximization of the refining profit margin of the Company since it constitutes a key catalyst
for the increase in production of high value-added products, the rationalization of the utilization of the ref inery
production units and the operating cost containment. During the period 2003-2005, and in the context of a wider
investment project of a total expenditure of € 8.8 million, the APC system was applied on the existing refinery units
and was modified to reflect the new operating conditions following the installation of the new Mild Hydrocracker
while the process for the inclusion in the APC system of additional units was initiated.
■ In 2005 the installation of a Power Management System (PMS) aiming at increasing reliability of the electricity network
of the refinery as well as reducing the energy cost was completed. The capital expenditure for the PMS amounted to
€ 3 million.
annual report ■ 23
B) In addition, aiming at the promotion and sale of all refinery products at the best possible price, MOTOR OIL proceeded
with the construction of a new Truck Loading Terminal (TLT) at the refinery as a means to improve and optimize the
distribution system of the Company. This new loading terminal, the operation of which started in April 2004, improves
customer service while contributing to the Company’s increasing its market share in the areas of Peloponissos and
Western Greece (total project budget € 20.5 million).
C) During the period 2003–2005 the Company completed, as part of its firm policy, a number of significant projects for
the improvement of environmental conditions and safety standards of the refinery.
■ In the beginning of 2003 the installation of a new sulfur-recovery unit was completed (total expenditure € 9.3 million).
This investment contributes to environmental protection and to the additional boost of productivity of the refinery
units. In the context of the installation of the new Mild Hydrocracker a new complex of units for sulfur recovery was
constructed, contributing to the reliability and availability of the unit while achieving the minimum environmental
impairment at the same time.
■ In 2004 the works for the upgrading of the Waste Water Treatment (WWT Unit) commenced with the installation
of a new biological treatment unit and the thorough upgrading of the primary and secondary treatment system. The
project aims at the increase of the capacity of the WWT Unit in order to cater for the new Hydrocracker complex as
well as extreme rainfall conditions. Furthermore, provision has been made for the modernization of the facility with
the employment of new technologies as a means to further improve waste water quality and enhance the mechanical
availability. The project will be completed within 2006 and its total budget amounts to € 16 million.
■ The works for the reduction of catalyst emissions from the Fluid Catalytic Cracking Unit (FCC) also commenced in
2004 (total budget € 10.9 million). The project includes among other things the installation of an electrostatic
precipitator on the flue gas of the FCC for the minimization of the catalyst emissions in the atmosphere by following
the Best Available Techniques (BAT) adopted by the European Union with reference to the refineries. The project was
completed within 2005.
For the year 2006 the capital expenditure of the Company is estimated at approximately € 40 million, the greater part of
which concerns the installation of three (3) fixed roof tanks of a 35,000 m3 capacity each, the connection of the refinery
with the natural gas pipeline and the subsequent internal network construction, and, finally, the substitution of one of
the four gas turbines for the production of electricity.
24 ■ annual report
4.10. MOTOR OIL and Society
4.10.1 Environment – Quality
From the beginning of its operation MOTOR OIL focused its efforts on the production of quality products having as a
main objective to satisfy the needs of its customers. Another Company objective is to offer its customers dependable quality
products through total mobilization of its management and to resolve any potential problems before they arise.
As a result of the previously mentioned objectives, in 1992 the Company initiated the planning and development of a
Quality Assurance System which covered all Company activities and fulfilled the requirements of the ISO 9002 standards.
This system was firstly certified in December 1993.
Since then, the Quality System has become an integral part of MOTOR OIL operations.
In 2002 started the restructuring of the existing system in order to develop a new Quality Management System fulfilling
the ISO 9001:2000 standards. This new system was certif ied in January 2003 by Bureau Veritas Quality International
(BVQI).
The Administration and personnel of the Company are fully committed to continuous quality improvement.
The adoption of methods and procedures that protect the environment comprise top priority for MOTOR OIL. The refinery
operation conforms to the environmental regulation of the Ministry of Urban Planning and the Ministry of Development
and is fully harmonized with the most stringent international environmental standards. The employment of advanced
processing methods that do not cause any environmental harm contributed to the refinery’s certification with ISO 14001
in December 2000 and recertification in January 2004 with certificates valid up until January 2007.
It is important to note that MOTOR OIL is the unique refinery in Greece and one among only a handful in Europe which
with such a high complexity index has been certif ied with both systems which are part of the Integrated Management
System.
In order to accomplish and adhere to the above mentioned environmental objectives, the Company seeks to:
■ Reduce its consumption needs for natural resources and energy while at the same time increase its self-produced
energy capacity.
■ Produce products and use technologies that are environmental friendly.
■ Control the management of gaseous emissions and continue the monitoring of the quality of the atmosphere.
■ Promote recycling and effective management of solid and liquid waste.
■ Tackle environmental emergencies through the development and implementation of emergency response plans such
as the Oil Spill Contingency Plan.
Ultimately, the new Hydrocracker complex, which aims at the production of environment friendly gasoline and diesel with
low sulfur content, will have a decisive contribution to the Company’s environmental protection goals. Moreover, several
other units such as sour water stripping, sulfur recovery, waste water treatment upgrading are well under way together
with energy saving projects and the connection to the Natural Gas network which will render the Company’s production
facilities more environment friendly.
annual report ■ 25

4.10.2. Social responsibility
Social responsibility, in the sense of initiatives by businesses to integrate community welfare and environmental protection
into their commercial activities, was adopted by businesses in both the United States and the European Union many years
prior to the development and establishment of the concept of Corporate Social Responsibility as a part of modern business
practice. It is obvious that today’s businesses – as members of the society in which they operate and because of their
potential to influence the living conditions of those working for them or indirectly affected by their activities – should
actively promote social cohesion and fund social programs in the general public interest.
The principles and commitments associated with corporate social responsibility programs are not merely about charitable
donations and sponsorships aimed at promoting a corporate image. They are an extension of the commitment by businesses
not only to fully comply with legislative requirements but also to act altruistically and ensure industrial development is
conforming to the sustainable growth principles.
MOTOR OIL has been a founding member of the Greek Corporate Social Responsibility Network since 1999 and has
adopted activities and programs to develop its human resources, protect the environment and ensure the social well-being
of the community in which it operates. Within this context, the key action points for businesses are the following:
■ development of human resources
■ health and safety in the workplace
■ environmental and natural resources management
■ cooperation with local communities
■ contribution to sustainable development.
Through its participation in the Greek Corporate Social Responsibility Network the company aims to contribute to the
bolstering of social cohesion, to support social stability and to apply the best practices in environmental protection so as
to ensure sustainable development, that is, to satisfy its own needs without depleting resources for future generations.
This contribution is practically implemented through policies and actions related to the management of its own human
resources, of quality, of occupational health and safety and of environmental protection. Furthermore, it is expressed
through a variety of support activities, both to local communities and the society at large. In other words, for MOTOR
OIL, corporate social responsibility means giving satisfactory returns to its shareholders, ensuring the personal and
professional development for its employees, satisfying the needs of its clients and functioning without compromising health
and safety at work, environmental protection or the interests of society as a whole.
A detailed presentation of the company’s policies and actions with regard to Corporate Social Responsibility is available
at a separate edition produced by MOTOR OIL titled “Environmental and Social Report”.
26 ■ annual report
4.10.3. Subsidies – Sponsorships – Educational Programs
The Company engages in various areas of social activities. More specifically, MOTOR OIL supports international sports
events, athletic clubs, art events, hospitals, educational institutes and social organizations by the means of sponsorships
and grants while it organizes festive events for children every year.
MOTOR OIL was “Golden Sponsor” of the Greek Olympic Team for physically challenged persons in the “Special Olympics”
Games held in Sydney, Australia, while the Company is permanent sponsor of the Greek Special Olympics Teams. More
specifically, in 2004 the Company was the sponsor of 25 athletes who were members of the Greek Team for the Games
which took place at the Rhodes island.
In addition to providing on-the-job intra-company training seminars to its personnel, MOTOR OIL holds every year a series
of educational sessions at the refinery to visiting university students who receive up to date information on various technical
and commercial matters as well as advice on professional orientation.
Moreover, every year MOTOR OIL accommodates a large number of university students doing their practice, as part
requirement of their studies, either at the Refinery or Company Headquarters.
annual report ■ 27

5. Performance Review
5.1 Company Activities
Company turnover for the year 2005 amounted to € 2,923.8 million compared to € 1,937.2 million for 2004 and € 1,560.1
million for 2003 demonstrating an increase of 50.93% in 2005 in relation to 2004. The development of Company turnover
by product, type of activity (refining, trading) and geographical market during the last three year period is presented
hereunder:
TURNOVER BREAKDOWN (amounts in million euros)
2003 2004 2005
Refining Production
Domestic 632.5 681.8 827.4
Exports 609.8 801.4 1,181.3
Total Refining Production 1,242.3 1,483.3 2,008.7
Trading Activity
Domestic 177.9 207.4 479.5
Export 139.8 246.5 435.6
Total Trading Activity 317.8 453.9 915.1
TOTAL TURNOVER 1,560.1 1,937.2 2,923.8
TURNOVER BREAKDOWN (% of total)
2003 2004 2005
Refining Production
Domestic 40.5% 35.2% 28.3%
Exports 39.1% 41.4% 40.4%
Total Refining Production 79.6% 76.6% 68.7%
Trading Activity
Domestic 11.4% 10.7% 16.4%
Exports 9.0% 12.7% 14.9%
Total Trading Activity 20.4% 23.4% 31.3%
TOTAL TURNOVER 100.0% 100.0% 100.0%
The refining production concerns the sales of products produced by the refinery of MOTOR OIL.
The trading activity concerns the sales generated as a result of imports of finished products from the international market
and their resale in the domestic market and/or abroad. The Company has the flexibility to take full advantage of the
favorable market conditions, whenever these arise, and is in a position to respond in any exceptional and unpredictable
event meeting the increased demand in the domestic and international market with imports.
28 ■ annual report

5.1.1. Turnover
The major objective of MOTOR OIL is to achieve the optimum selling price for its products and to increase its market share
in Greece. At the same time the Company aims to accomplish emerging market penetration. To this end, MOTOR OIL has
created a coherent sales and distribution network for the promotion of its products as a means to strengthen its presence
in the oil market. It is important to note that the Company responds to customer demand without neglecting workplace
hygiene, workforce safety and environmental protection issues. Through these moves MOTOR OIL aims to increase its
profitability and maximize shareholder value.
The following tables include summary data of MOTOR OIL’s turnover breakdown by type of activity, market and product
for the last three years.
By Type of Activity
(thousand ΜΤ) (million EURO)2003 2004 2005 2003 2004 2005
Refining Production 5,562 5,808 5,492 1,242.2 1,483.3 2,008.7
Trading Activity 1,199 1,495 2,158 317.9 453.9 915.1
TOTAL 6,761 7,303 7,650 1,560.1 1,937.2 2,923.8
By Type of Market
(thousand ΜΤ) (million EURO)2003 2004 2005 2003 2004 2005
Domestic 3,157 3,066 3,238 809.8 890.6 1,306.9
Exports 2,375 2,867 3,160 550.4 782.3 1,259.2
Shipping – Aviation 1,229 1,370 1,252 199.9 264.3 357.7
TOTAL 6,761 7,303 7,650 1,560.1 1,937.2 2,923.8
Domestic Market
The domestic sales of the Company in 2005 increased both by volume (5.6%) and value (46.7%) compared to the previous
year.
Exports
In 2005 MOTOR OIL exports increased compared to the previous year by both volume (10.2%) and value (60.96%). This
increase is mainly accounted for by the sale and promotion of products in the international markets, in which traditionally
MOTOR OIL is very active, as a result of the significantly improved margins these markets offered during 2005.
Shipping - Aviation
The sales of the Company in this market decreased by volume (- 8.6%) and increased by value (35.5%) compared to the
previous year. The lower sales volume is attributed to the decrease in the volume sales of fuel oil since its limited production,
following the refinery shutdown for a three week period in April for the installation of the Hydrocracker, was directed to
exports given the relatively higher margins these markets offered during 2005.
annual report ■ 29
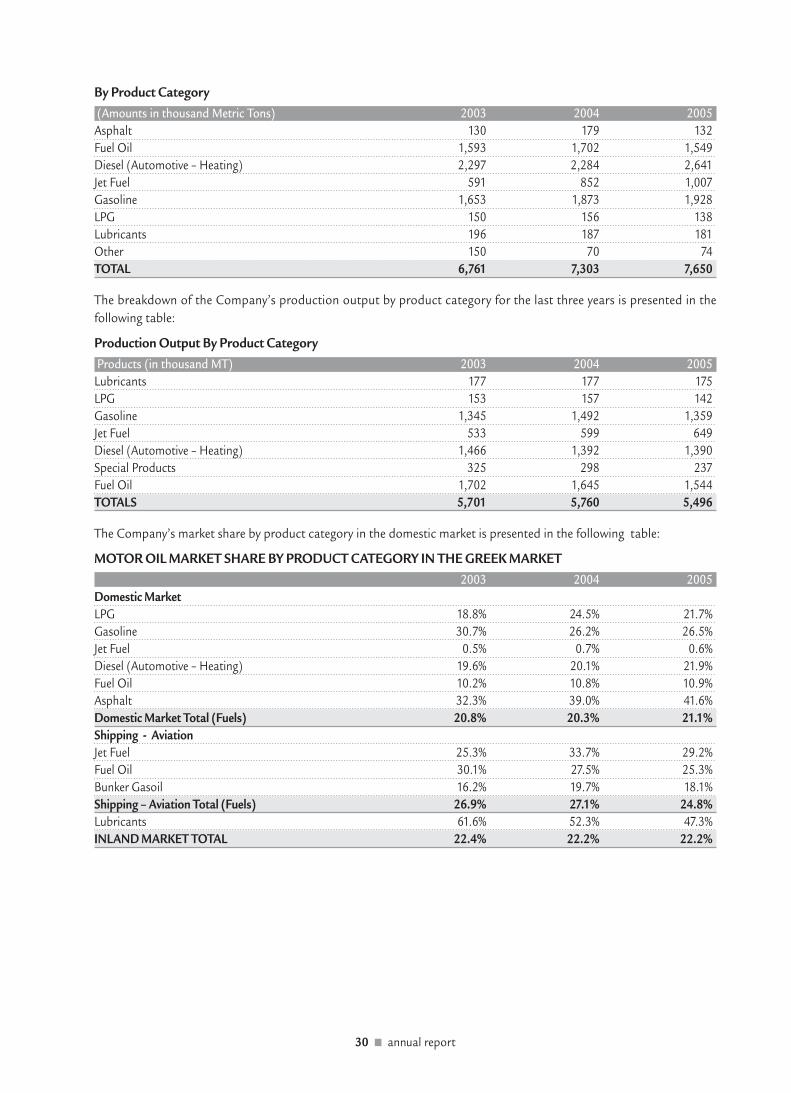
By Product Category
(Amounts in thousand Metric Tons) 2003 2004 2005
Asphalt 130 179 132
Fuel Oil 1,593 1,702 1,549
Diesel (Automotive – Heating) 2,297 2,284 2,641
Jet Fuel 591 852 1,007
Gasoline 1,653 1,873 1,928
LPG 150 156 138
Lubricants 196 187 181
Other 150 70 74
TOTAL 6,761 7,303 7,650
The breakdown of the Company’s production output by product category for the last three years is presented in the
following table:
Production Output By Product Category
Products (in thousand MT) 2003 2004 2005
Lubricants 177 177 175
LPG 153 157 142
Gasoline 1,345 1,492 1,359
Jet Fuel 533 599 649
Diesel (Automotive – Heating) 1,466 1,392 1,390
Special Products 325 298 237
Fuel Oil 1,702 1,645 1,544
TOTALS 5,701 5,760 5,496
The Company’s market share by product category in the domestic market is presented in the following table:
MOTOR OIL MARKET SHARE BY PRODUCT CATEGORY IN THE GREEK MARKET
2003 2004 2005
Domestic Market
LPG 18.8% 24.5% 21.7%
Gasoline 30.7% 26.2% 26.5%
Jet Fuel 0.5% 0.7% 0.6%
Diesel (Automotive – Heating) 19.6% 20.1% 21.9%
Fuel Oil 10.2% 10.8% 10.9%
Asphalt 32.3% 39.0% 41.6%
Domestic Market Total (Fuels) 20.8% 20.3% 21.1%
Shipping - Aviation
Jet Fuel 25.3% 33.7% 29.2%
Fuel Oil 30.1% 27.5% 25.3%
Bunker Gasoil 16.2% 19.7% 18.1%
Shipping – Aviation Total (Fuels) 26.9% 27.1% 24.8%
Lubricants 61.6% 52.3% 47.3%
INLAND MARKET TOTAL 22.4% 22.2% 22.2%
30 ■ annual report

5.2. Company Turnover and Earnings Review 2004-2005
The development of Company earnings for the period 2004-2005 is presented in the following table:
(amounts in thousand euros) 2004 2005
Turnover (Sales) 1,937,191 2,923,769
Less: Cost of Sales (before Depreciation) -1,745,885 -2,660,561
Gross Profit (before depreciation) 1 191,306 263,208
% on turnover 9.88% 9.00%
Less: Administrative Expenses (before depreciation)1,2 -14,558 -14,376
% on turnover -0.75% -0.49%
Less: Selling Expenses (before depreciation) 1 -12,576 -12,776
% on turnover -0.65% -0.44%
Plus (Less): Other Operating Income (Expenses) 20,394 -17,322
Earnings before Interest, Depreciation & Tax (EBITDA) 184,566 218,734
% on turnover 9.52% 7.48%
Plus: Income from Participations & Interest 6,351 4,773
Less: Interest & Related Expenses -6,727 -12,461
Earnings before Depreciation & Tax 184,190 211,046
% on turnover 9.50% 7.22%
Less: Depreciation -17,504 -22,516
Earnings Before Tax (EBT) 166,686 188,530
% on turnover 8.60% 6.45%
Less: Income Tax 3 -48,026 -57,843
Earnings after Tax (EAT) 118,660 130,687
% on turnover 6.12% 4.47%
Weighted number of shares 4 110,715,732 110,776,573
Number of shares at year end 110,782,980 110,782,980
PER SHARE DATA (in euros) 2004 2005
Earnings before Depreciation and Tax 5 1.66 1.91
Earnings Before Tax 5 1.50 1.70
Earnings after Tax 5 1.07 1.18
Dividend per share 6 0.85 1.10
Notes: 1 The breakdown of depreciation charges relating to Cost of Sales and Administrative & Selling Expenses is available in the section
“Depreciation” of the present chapter. 2 BoD fees for 2004 (€ 213 thousand) and 2005 (€ 216 thousand) are included in Administrative Expenses.
3 The Company has been audited for tax purposes until the accounting year 1999 (included). 4 For the weighted number of shares the buy back shares in possession of the Company were taken into consideration.
5 Based on the weighted number of shares. It is noted that due to the small number of buy back shares in possession of the Company
during the years 2004 and 2005 the data per share would not differ in case the calculations were made using the number of shares
at the year end. 6 The 2005 dividend amount per share regards the proposal of the Company BoD to the General Assembly of Company Shareholders.
annual report ■ 31
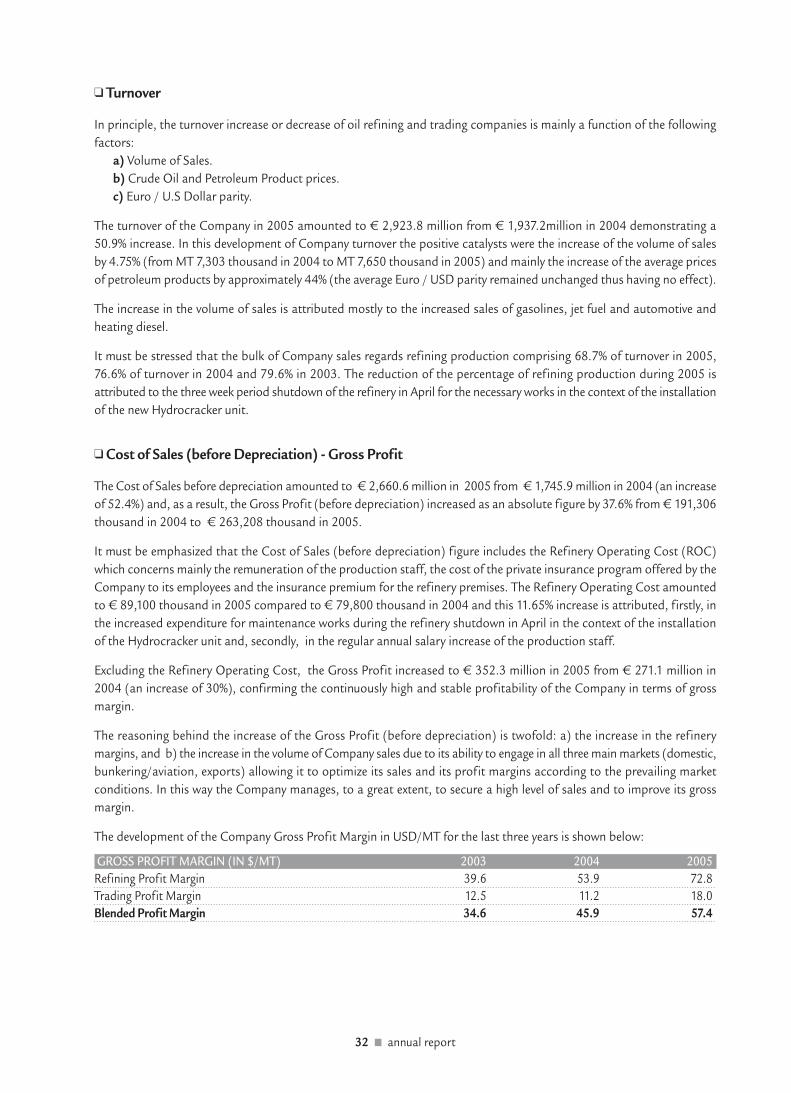
❑ Turnover
In principle, the turnover increase or decrease of oil refining and trading companies is mainly a function of the following
factors:
a) Volume of Sales.
b) Crude Oil and Petroleum Product prices.
c) Euro / U.S Dollar parity.
The turnover of the Company in 2005 amounted to € 2,923.8 million from € 1,937.2million in 2004 demonstrating a
50.9% increase. In this development of Company turnover the positive catalysts were the increase of the volume of sales
by 4.75% (from MT 7,303 thousand in 2004 to MT 7,650 thousand in 2005) and mainly the increase of the average prices
of petroleum products by approximately 44% (the average Euro / USD parity remained unchanged thus having no effect).
The increase in the volume of sales is attributed mostly to the increased sales of gasolines, jet fuel and automotive and
heating diesel.
It must be stressed that the bulk of Company sales regards refining production comprising 68.7% of turnover in 2005,
76.6% of turnover in 2004 and 79.6% in 2003. The reduction of the percentage of refining production during 2005 is
attributed to the three week period shutdown of the refinery in April for the necessary works in the context of the installation
of the new Hydrocracker unit.
❑ Cost of Sales (before Depreciation) - Gross Profit
The Cost of Sales before depreciation amounted to € 2,660.6 million in 2005 from € 1,745.9 million in 2004 (an increase
of 52.4%) and, as a result, the Gross Profit (before depreciation) increased as an absolute figure by 37.6% from € 191,306
thousand in 2004 to € 263,208 thousand in 2005.
It must be emphasized that the Cost of Sales (before depreciation) figure includes the Refinery Operating Cost (ROC)
which concerns mainly the remuneration of the production staff, the cost of the private insurance program offered by the
Company to its employees and the insurance premium for the refinery premises. The Refinery Operating Cost amounted
to € 89,100 thousand in 2005 compared to € 79,800 thousand in 2004 and this 11.65% increase is attributed, firstly, in
the increased expenditure for maintenance works during the refinery shutdown in April in the context of the installation
of the Hydrocracker unit and, secondly, in the regular annual salary increase of the production staff.
Excluding the Refinery Operating Cost, the Gross Profit increased to € 352.3 million in 2005 from € 271.1 million in
2004 (an increase of 30%), confirming the continuously high and stable profitability of the Company in terms of gross
margin.
The reasoning behind the increase of the Gross Profit (before depreciation) is twofold: a) the increase in the refinery
margins, and b) the increase in the volume of Company sales due to its ability to engage in all three main markets (domestic,
bunkering/aviation, exports) allowing it to optimize its sales and its profit margins according to the prevailing market
conditions. In this way the Company manages, to a great extent, to secure a high level of sales and to improve its gross
margin.
The development of the Company Gross Profit Margin in USD/MT for the last three years is shown below:
GROSS PROFIT MARGIN (IN $/MT) 2003 2004 2005
Refining Profit Margin 39.6 53.9 72.8
Trading Profit Margin 12.5 11.2 18.0
Blended Profit Margin 34.6 45.9 57.4
32 ■ annual report
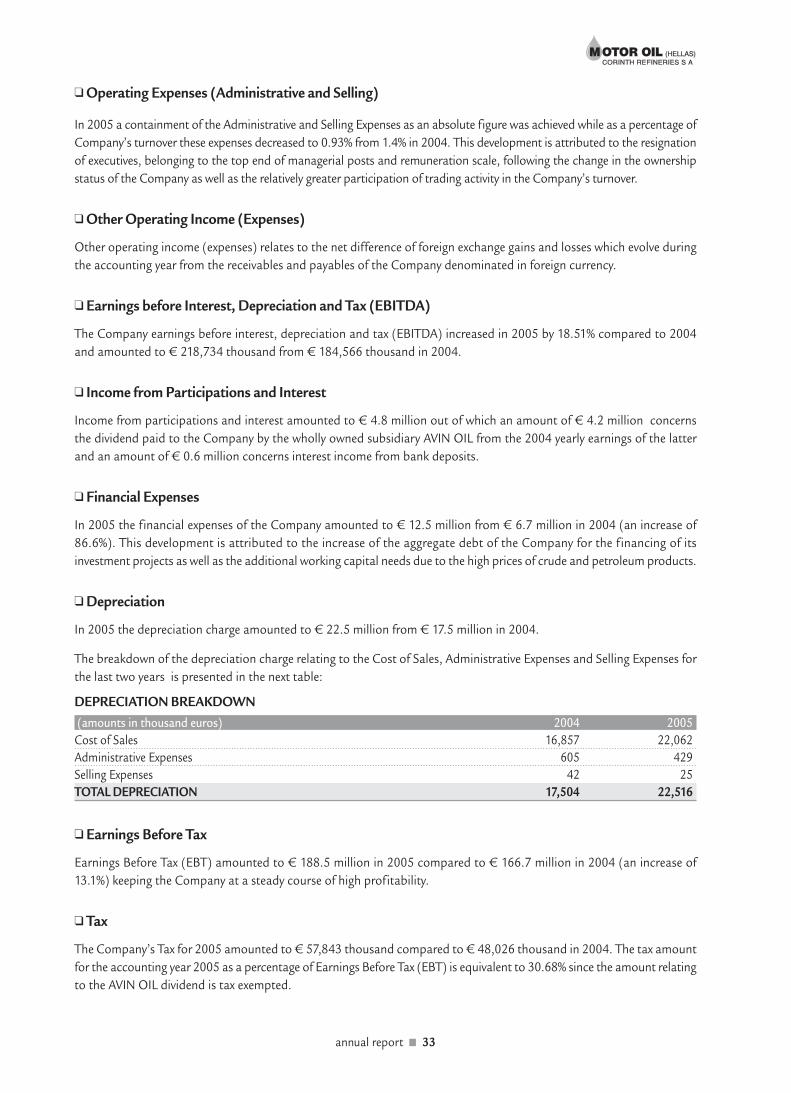
❑ Operating Expenses (Administrative and Selling)
In 2005 a containment of the Administrative and Selling Expenses as an absolute figure was achieved while as a percentage of
Company’s turnover these expenses decreased to 0.93% from 1.4% in 2004. This development is attributed to the resignation
of executives, belonging to the top end of managerial posts and remuneration scale, following the change in the ownership
status of the Company as well as the relatively greater participation of trading activity in the Company’s turnover.
❑ Other Operating Income (Expenses)
Other operating income (expenses) relates to the net difference of foreign exchange gains and losses which evolve during
the accounting year from the receivables and payables of the Company denominated in foreign currency.
❑ Earnings before Interest, Depreciation and Tax (EBITDA)
The Company earnings before interest, depreciation and tax (EBITDA) increased in 2005 by 18.51% compared to 2004
and amounted to € 218,734 thousand from € 184,566 thousand in 2004.
❑ Income from Participations and Interest
Income from participations and interest amounted to € 4.8 million out of which an amount of € 4.2 million concerns
the dividend paid to the Company by the wholly owned subsidiary AVIN OIL from the 2004 yearly earnings of the latter
and an amount of € 0.6 million concerns interest income from bank deposits.
❑ Financial Expenses
In 2005 the financial expenses of the Company amounted to € 12.5 million from € 6.7 million in 2004 (an increase of
86.6%). This development is attributed to the increase of the aggregate debt of the Company for the f inancing of its
investment projects as well as the additional working capital needs due to the high prices of crude and petroleum products.
❑ Depreciation
In 2005 the depreciation charge amounted to € 22.5 million from € 17.5 million in 2004.
The breakdown of the depreciation charge relating to the Cost of Sales, Administrative Expenses and Selling Expenses for
the last two years is presented in the next table:
DEPRECIATION BREAKDOWN
(amounts in thousand euros) 2004 2005
Cost of Sales 16,857 22,062
Administrative Expenses 605 429
Selling Expenses 42 25
TOTAL DEPRECIATION 17,504 22,516
❑ Earnings Before Tax
Earnings Before Tax (EBT) amounted to € 188.5 million in 2005 compared to € 166.7 million in 2004 (an increase of
13.1%) keeping the Company at a steady course of high profitability.
❑ Tax
The Company’s Tax for 2005 amounted to € 57,843 thousand compared to € 48,026 thousand in 2004. The tax amount
for the accounting year 2005 as a percentage of Earnings Before Tax (EBT) is equivalent to 30.68% since the amount relating
to the AVIN OIL dividend is tax exempted.
annual report ■ 33
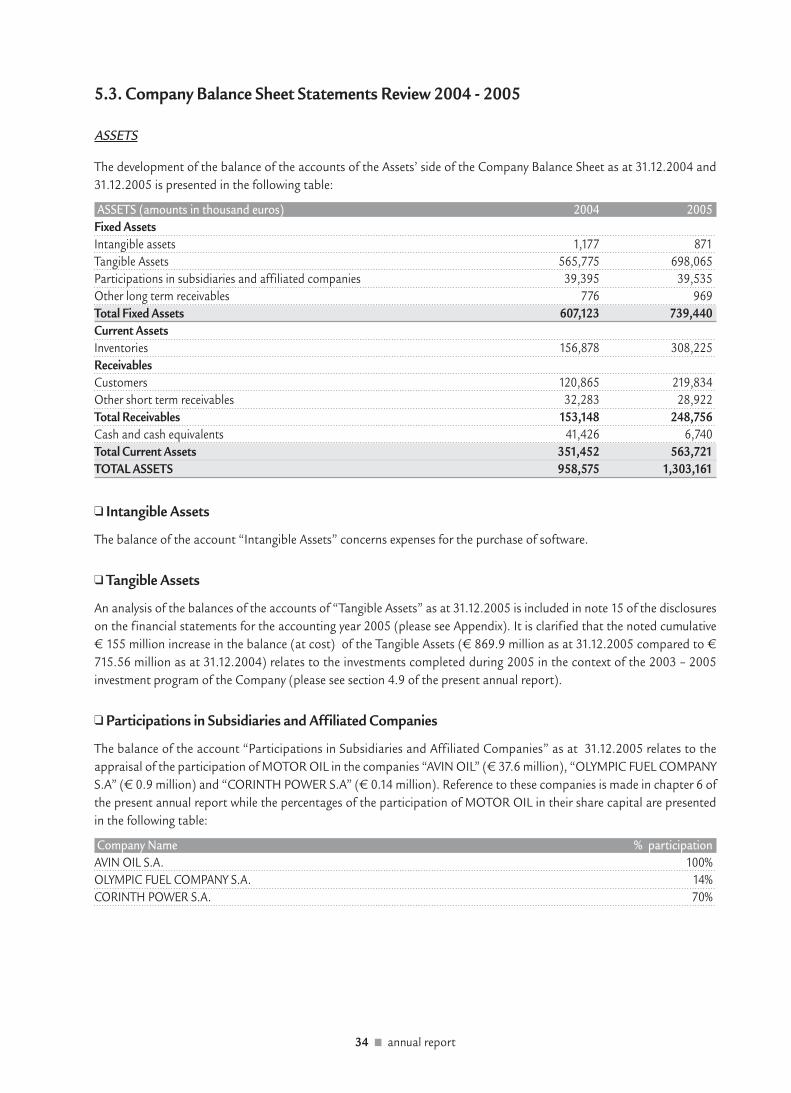
5.3. Company Balance Sheet Statements Review 2004 - 2005
ASSETS
The development of the balance of the accounts of the Assets’ side of the Company Balance Sheet as at 31.12.2004 and
31.12.2005 is presented in the following table:
ASSETS (amounts in thousand euros) 2004 2005
Fixed Assets
Intangible assets 1,177 871
Tangible Assets 565,775 698,065
Participations in subsidiaries and affiliated companies 39,395 39,535
Other long term receivables 776 969
Total Fixed Assets 607,123 739,440
Current Assets
Inventories 156,878 308,225
Receivables
Customers 120,865 219,834
Other short term receivables 32,283 28,922
Total Receivables 153,148 248,756
Cash and cash equivalents 41,426 6,740
Total Current Assets 351,452 563,721
TOTAL ASSETS 958,575 1,303,161
❑ Intangible Assets
The balance of the account “Intangible Assets” concerns expenses for the purchase of software.
❑ Tangible Assets
An analysis of the balances of the accounts of “Tangible Assets” as at 31.12.2005 is included in note 15 of the disclosures
on the financial statements for the accounting year 2005 (please see Appendix). It is clarified that the noted cumulative
€ 155 million increase in the balance (at cost) of the Tangible Assets (€ 869.9 million as at 31.12.2005 compared to €
715.56 million as at 31.12.2004) relates to the investments completed during 2005 in the context of the 2003 – 2005
investment program of the Company (please see section 4.9 of the present annual report).
❑ Participations in Subsidiaries and Affiliated Companies
The balance of the account “Participations in Subsidiaries and Affiliated Companies” as at 31.12.2005 relates to the
appraisal of the participation of MOTOR OIL in the companies “AVIN OIL” (€ 37.6 million), “OLYMPIC FUEL COMPANY
S.A” (€ 0.9 million) and “CORINTH POWER S.A” (€ 0.14 million). Reference to these companies is made in chapter 6 of
the present annual report while the percentages of the participation of MOTOR OIL in their share capital are presented
in the following table:
Company Name % participation
AVIN OIL S.A. 100%
OLYMPIC FUEL COMPANY S.A. 14%
CORINTH POWER S.A. 70%
34 ■ annual report

❑ Other Long-Term Receivables
The balance of the account “Other Long-Term Receivables” as at 31.12.2005 amounted to € 969 thousand compared to
€ 776 thousand as at 31.12.2004 and concerns prepayments of rental payments and guarantees.
❑ Inventories
Year-end inventories (finished goods, raw materials, consumables etc.) are valued at the lower value between the purchase
cost and the net realizable value at the end of each accounting period.
It must be stressed that because of the nature of Company products, economic depreciation of inventories is ruled out
while the volume of transactions (purchases – sales) achieved during each accounting period eliminates the possibility of
slowly moving inventories, in particular, with relation to petroleum products.
Furthermore, the Company keeps a stock of spare parts which were purchased for the purpose to be used in maintenance
and repair works of its machinery. This stock concerns a large number of items, some of which are of high value and slow
moving in general. The management of the refinery has declared that this situation is acceptable because these spare parts
are accompanying items of the new machinery and of the equipment purchased by the Company in order to be in operational
readiness. More specifically, keeping a safety stock of such items is a prerequisite for the Company on two counts: firstly,
in order to be in a position to meet the maintenance and repair needs of the refinery equipment without delays and,
secondly in order to avoid any refinery units remaining idle as a consequence of a certain spare part not being immediately
available since a shortage may have serious an impact on Company production.
The total value of inventories as at 31.12.2005 amounted to € 308,225 thousand compared to € 156,878 thousand as
at 31.12.2004 a development attributed to the increase in the prices of the crude and of the petroleum products. It is
emphasized that a firm Company policy is to always keep low level of inventories.
❑ Customers
The balance of the account “Customers” amounted to € 219,834 thousand as at 31.12.2005 compared to € 120,865
thousand as at 31.12.2004. This development is mainly attributed to the increase in the prices of the crude and of the
petroleum products. The average collection period of customer receivables is 20 days approximately.
❑ Other short term receivables
The balance of the account “Other short term receivables” amounted to € 28,922 thousand as at 31.12.2005 compared
to € 32,283 thousand as at 31.12.2004 and mainly relates to receivables from VAT return and rebates on raw material
purchases effected during the accounting year.
❑ Cash and cash equivalents
As at 31.12.2005 the cash balances of the Company relating to its current and time deposits amounted to € 6,740 thousand
compared to € 41,426 thousand as at 31.12.2004.
annual report ■ 35
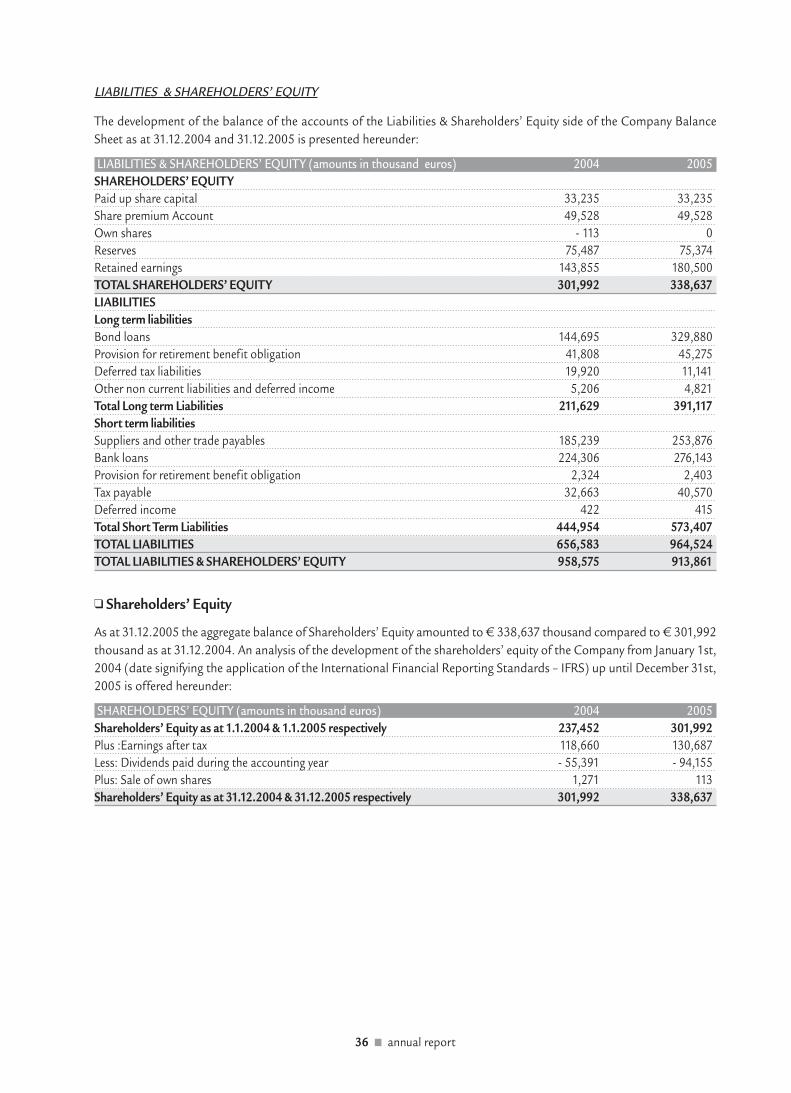
LIABILITIES & SHAREHOLDERS’ EQUITY
The development of the balance of the accounts of the Liabilities & Shareholders’ Equity side of the Company Balance
Sheet as at 31.12.2004 and 31.12.2005 is presented hereunder:
LIABILITIES & SHAREHOLDERS’ EQUITY (amounts in thousand euros) 2004 2005
SHAREHOLDERS’ EQUITY
Paid up share capital 33,235 33,235
Share premium Account 49,528 49,528
Own shares - 113 0
Reserves 75,487 75,374
Retained earnings 143,855 180,500
TOTAL SHAREHOLDERS’ EQUITY 301,992 338,637
LIABILITIES
Long term liabilities
Bond loans 144,695 329,880
Provision for retirement benefit obligation 41,808 45,275
Deferred tax liabilities 19,920 11,141
Other non current liabilities and deferred income 5,206 4,821
Total Long term Liabilities 211,629 391,117
Short term liabilities
Suppliers and other trade payables 185,239 253,876
Bank loans 224,306 276,143
Provision for retirement benefit obligation 2,324 2,403
Tax payable 32,663 40,570
Deferred income 422 415
Total Short Term Liabilities 444,954 573,407
TOTAL LIABILITIES 656,583 964,524
TOTAL LIABILITIES & SHAREHOLDERS’ EQUITY 958,575 913,861
❑ Shareholders’ Equity
As at 31.12.2005 the aggregate balance of Shareholders’ Equity amounted to € 338,637 thousand compared to € 301,992
thousand as at 31.12.2004. An analysis of the development of the shareholders’ equity of the Company from January 1st,
2004 (date signifying the application of the International Financial Reporting Standards – IFRS) up until December 31st,
2005 is offered hereunder:
SHAREHOLDERS’ EQUITY (amounts in thousand euros) 2004 2005
Shareholders’ Equity as at 1.1.2004 & 1.1.2005 respectively 237,452 301,992
Plus :Earnings after tax 118,660 130,687
Less: Dividends paid during the accounting year - 55,391 - 94,155
Plus: Sale of own shares 1,271 113
Shareholders’ Equity as at 31.12.2004 & 31.12.2005 respectively 301,992 338,637
36 ■ annual report

❑ Long-Term Liabilities
As at 31.12.2005 the balance of this account was € 391,117 thousand compared to € 211,629 thousand as at 31.12.2004.
This increase is mainly attributed to the two bond loans of the Company the first of which for an amount of € 250 million
and duration of seven years (it was received gradually according to the progress of the Hydrocracker project) and the
second one for an amount of USD 150 million and duration of five years. The agreement for the first loan was signed in
July 2004. This loan concerns the financing needs of the Hydrocracker project and matures on June 30th, 2011. The balance
of this loan included in the long term liabilities of the Company as at 31.12.2005 amounts to € 205 million compared to
€ 144.7 million as at 31.12.2004. The second loan concerns the refinancing of a long term loan for an amount of USD
150 million for the financing of the Company’s working capital needs of a rather permanent nature. The refinancing was
effected in December 2005. The new loan matures in December 2010.
❑ Suppliers and other trade payables
As at 31.12.2005 the balance of the account “Suppliers and other trade payables” amounted to € 253,876 thousand
compared to € 185,239 thousand as at 31.12.2004. The average payment period of trade payables is 30 days approximately.
The increase in the balance of this account as at 31.12.2005 is mainly attributed to the higher prices of raw material and
finished products during the accounting period.
❑ Short-Term Bank Loans
As at 31.12.2005 the balance of “Short term bank loans” amounted to € 276,143 thousand compared to € 224,306
thousand as at 31.12.2004. It is clarified that the balance of 31.12.2005 includes an amount of € 30 million relating to
the installment of the € 250 million bond loan payable within 2006. We also note that the balance of 31.12.2004 included
the aggregate amount of the USD 150 million long term loan which was refinanced in December 2005 as well as an amount
of € 15 million relating to the installment of the € 250 million bond loan paid within 2005. The increase in the short term
bank loans within the accounting year 2005 is attributed to the enhanced working capital needs of the Company due to
the high prices of crude and of the petroleum products.
❑ Tax payable
The tax liabilities of the Company as at 31.12.2005 increased to € 40,570 thousand compared to € 32,663 thousand as
at 31.12.2004 due to the increased earnings for the accounting year 2005 compared to the accounting year 2004.
annual report ■ 37
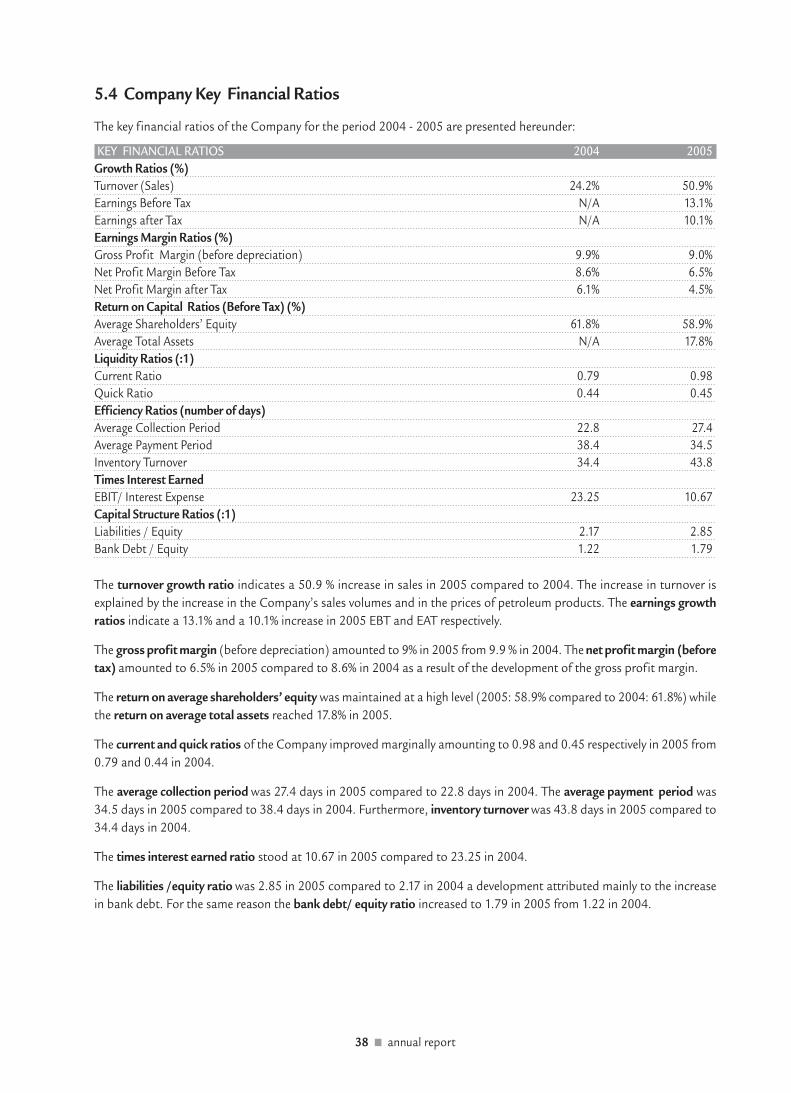
5.4 Company Key Financial Ratios
The key financial ratios of the Company for the period 2004 - 2005 are presented hereunder:
KEY FINANCIAL RATIOS 2004 2005
Growth Ratios (%)
Turnover (Sales) 24.2% 50.9%
Earnings Before Tax N/A 13.1%
Earnings after Tax N/A 10.1%
Earnings Margin Ratios (%)
Gross Profit Margin (before depreciation) 9.9% 9.0%
Net Profit Margin Before Tax 8.6% 6.5%
Net Profit Margin after Tax 6.1% 4.5%
Return on Capital Ratios (Before Tax) (%)
Average Shareholders’ Equity 61.8% 58.9%
Average Total Assets N/A 17.8%
Liquidity Ratios (:1)
Current Ratio 0.79 0.98
Quick Ratio 0.44 0.45
Efficiency Ratios (number of days)
Average Collection Period 22.8 27.4
Average Payment Period 38.4 34.5
Inventory Turnover 34.4 43.8
Times Interest Earned
EBIT/ Interest Expense 23.25 10.67
Capital Structure Ratios (:1)
Liabilities / Equity 2.17 2.85
Bank Debt / Equity 1.22 1.79
The turnover growth ratio indicates a 50.9 % increase in sales in 2005 compared to 2004. The increase in turnover is
explained by the increase in the Company’s sales volumes and in the prices of petroleum products. The earnings growth
ratios indicate a 13.1% and a 10.1% increase in 2005 EBT and EAT respectively.
The gross profit margin (before depreciation) amounted to 9% in 2005 from 9.9 % in 2004. The net profit margin (before
tax) amounted to 6.5% in 2005 compared to 8.6% in 2004 as a result of the development of the gross profit margin.
The return on average shareholders’ equity was maintained at a high level (2005: 58.9% compared to 2004: 61.8%) while
the return on average total assets reached 17.8% in 2005.
The current and quick ratios of the Company improved marginally amounting to 0.98 and 0.45 respectively in 2005 from
0.79 and 0.44 in 2004.
The average collection period was 27.4 days in 2005 compared to 22.8 days in 2004. The average payment period was
34.5 days in 2005 compared to 38.4 days in 2004. Furthermore, inventory turnover was 43.8 days in 2005 compared to
34.4 days in 2004.
The times interest earned ratio stood at 10.67 in 2005 compared to 23.25 in 2004.
The liabilities /equity ratio was 2.85 in 2005 compared to 2.17 in 2004 a development attributed mainly to the increase
in bank debt. For the same reason the bank debt/ equity ratio increased to 1.79 in 2005 from 1.22 in 2004.
38 ■ annual report

DESCRIPTION OF KEY FINANCIAL RATIOS
GROWTH RATIOS (%)
Turnover (Sales) = [(Current Year’s Turnover – Previous Year’s Turnover ) / Previous Year’s Turnover ] *100
Earnings Before Tax (EBT) = [(Current Year’s EBT – Previous Year’s EBT) / Previous Year’s EBT] *100
Earnings after Tax (EAT) = [(Current Year’s EAT – Previous Year’s EAT) / Previous Year’s EAT] *100
PROFIT MARGIN RATIOS (%)
Gross Profit Margin (before depreciation) = [Gross Profit (before depreciation) / Turnover] * 100
Net Profit Margin before Tax = [ Earnings Before Tax / Turnover] * 100
Net Profit Margin after Tax = [ Earnings After Tax / Turnover ] * 100
RETURN ON CAPITAL RATIOS (%) (before tax)
Average Shareholders’ Equity = [Current Year’s EBT /((Current Year’s Shareholders’ Equity +Previous Year’s Shareholders’ Equity)/2)]*100
Average Total Assets = {(Current Year’s EBT + Interest & related Expenses) / [(Current Year’sTotal Assets + Previous Year’s Total Assets ) / 2]}*100
LIQUIDITY RATIOS (:1)
Current Ratio = (Current Assets / Current Liabilities)
Quick Ratio = (Current Assets - Inventories) / (Current Liabilities)
EFFICIENCY RATIOS (number of days)
Receivables = [Debtors’ year end balance / Turnover]* 365
Payables = [Suppliers’ year end balance/Cost of Sales (before depreciation)] * 365
Inventories = [Closing Stock of inventories/ Cost of Sales (before depreciation)]* 365
CAPITAL STRUCTURE RATIOS
Liabilities / Equity = (Long-Term Liabilities + Current Liabilities) / Shareholders’ Equity
Bank Debt / Equity = (Long-Term Bank Loans + Short-Term Bank Loans + Current portionof Long Term Bank Loans ) / Shareholders’ Equity
TIMES INTEREST EARNED RATIO
Earnings before Interest and Tax / Interest Expenses = (EBT + Interest Expenses ) / (Interest Expenses)
5.5 Cash Flow Statements
The Company Cash Flow Statements for the accounting year 2005 are included in the Appendix of this Annual Report
(please see Appendix).
annual report ■ 39
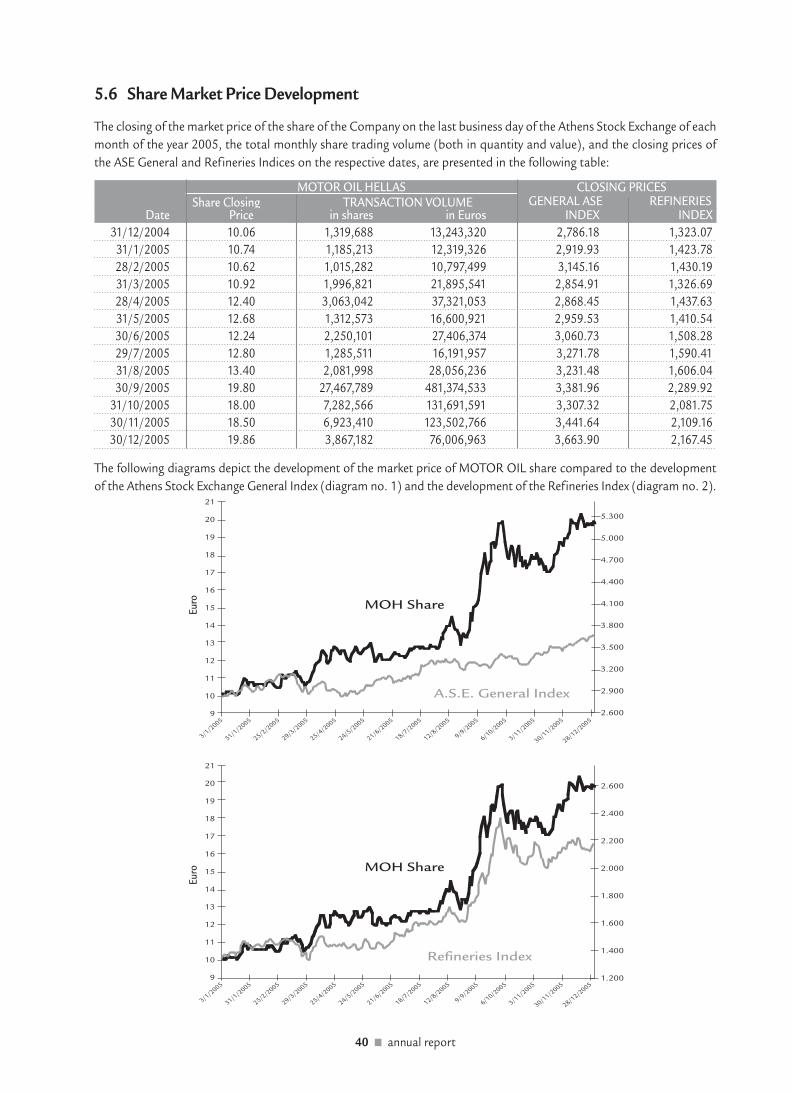
5.6 Share Market Price Development
The closing of the market price of the share of the Company on the last business day of the Athens Stock Exchange of each
month of the year 2005, the total monthly share trading volume (both in quantity and value), and the closing prices of
the ASE General and Refineries Indices on the respective dates, are presented in the following table:
MOTOR OIL HELLAS CLOSING PRICESShare Closing TRANSACTION VOLUME GENERAL ASE REFINERIES
Date Price in shares in Euros INDEX INDEX
31/12/2004 10.06 1,319,688 13,243,320 2,786.18 1,323.07
31/1/2005 10.74 1,185,213 12,319,326 2,919.93 1,423.78
28/2/2005 10.62 1,015,282 10,797,499 3,145.16 1,430.19
31/3/2005 10.92 1,996,821 21,895,541 2,854.91 1,326.69
28/4/2005 12.40 3,063,042 37,321,053 2,868.45 1,437.63
31/5/2005 12.68 1,312,573 16,600,921 2,959.53 1,410.54
30/6/2005 12.24 2,250,101 27,406,374 3,060.73 1,508.28
29/7/2005 12.80 1,285,511 16,191,957 3,271.78 1,590.41
31/8/2005 13.40 2,081,998 28,056,236 3,231.48 1,606.04
30/9/2005 19.80 27,467,789 481,374,533 3,381.96 2,289.92
31/10/2005 18.00 7,282,566 131,691,591 3,307.32 2,081.75
30/11/2005 18.50 6,923,410 123,502,766 3,441.64 2,109.16
30/12/2005 19.86 3,867,182 76,006,963 3,663.90 2,167.45
The following diagrams depict the development of the market price of MOTOR OIL share compared to the development
of the Athens Stock Exchange General Index (diagram no. 1) and the development of the Refineries Index (diagram no. 2).
40 ■ annual report
3/1/2
005
31/1/2
005
25/2/2
005
29/3/2
005
25/4/2
005
24/5/2
005
21/6/2
005
18/7/2
005
12/8/2
005
9/9/2
005
6/10/2
005
3/11/2
005
30/11/2
005
28/12/2
005
Euro MOH Share
Refineries Index
21
20
19
18
17
16
15
14
13
12
11
10
9
2.600
2.400
2.200
2.000
1.800
1.600
1.400
1.200
3/1/2
005
31/1/2
005
25/2/2
005
29/3/2
005
25/4/2
005
24/5/2
005
21/6/2
005
18/7/2
005
12/8/2
005
9/9/2
005
6/10/2
005
3/11/2
005
30/11/2
005
28/12/2
005
Euro
A.S.E. General Index
ΜΟΗ Share
5.300
5.000
4.700
4.400
4.100
3.800
3.500
3.200
2.900
2.600
21
20
19
18
17
16
15
14
13
12
11
10
9

5.7 Consolidated Financial Statements
In 1999 the Company produced Consolidated Financial Statements for the f irst time in which, apart from the parent
company, AVIN OIL S.A. was included with the full consolidation method.
It is clarified that up until March 7th 2002, AVIN OIL was not a MOTOR OIL subsidiary. Nevertheless, nine (9) members
of the MOTOR OIL Board of Director participated in the Board of AVIN OIL and this fact constituted condition for
(horizontal) consolidation even though there was no direct participation of one company in the share capital of the other
company. On March 8th, 2002 MOTOR OIL acquired 100% of the shares of AVIN OIL.
In 2003 the Company produced Consolidated Financial Statements in which OLYMPIC FUEL COMPANY S.A was additionally
included with the net equity method (aggregate percentage of direct and indirect participation 28%).
Furthermore, in 2004 the Company produced Consolidated Financial Statements in which HAFCO S.A was additionally
included with the net equity method (percentage of indirect participation 50%).
In the following tables the development of MOTOR OIL consolidated financial figures for the accounting years 2004 and
2005 compiled in accordance with the International Financial Reporting Standards is presented. The regular audit of the
Company’s consolidated financial statements was conducted by the Auditing Company DELOITTE, 250-254 Kifissias
Avenue, Halandri, tel. ++ 30 210 6781100 (responsible Certified Public Accountant Mr. George Cambanis REG No. ICPA
- GR - 10761).
annual report ■ 41

5.7.1 Consolidated Turnover and Earnings Review 2004 - 2005
The development of the Consolidated Turnover and Earnings during the accounting years 2004 – 2005 is presented in the
following table:
CONSOLIDATED YEARLY EARNINGS
(amounts in thousand euros) 2004 2005
Turnover (Sales) 2,219,042 3,237,376
Less: Cost of Sales (before depreciation)1 -1,986,362 -2,930,085
Gross Profit (before depreciation)1 232,680 307,291
% on Turnover 10.49% 9.49%
Less: Administrative Expenses (before depreciation)1 -21,663 -22,038
% on Turnover - 0.98% - 0.68%
Less: Selling Expenses (before depreciation)1 -38,288 -40,834
% on Turnover - 1.73% - 1.26%
Plus (Less): Other Operating Income (Expenses) 23,339 -14,112
Earnings before Interest, Depreciation and Tax (EBITDA) 196,068 230,307
% on Turnover 8.84% 7.11%
Plus: Income from Interest / earnings from participations 2,404 1,640
Less: Interest and other related expenses - 8,817 - 14,631
Earnings before Depreciation and Tax 189,655 217,316
% on Turnover 8.55% 6.71%
Less: Depreciation - 21,814 - 25,959
Earnings Before Tax (EBT) 167,841 191,357
% on Turnover 7.56% 5.91%
Less: Income tax 2 -50,289 -59,722
Earnings after Tax (EAT) 117,552 131,635
% on Turnover 5.30% 4.07%
Weighted Number of Shares 3 110,715,732 110,776,573
Number of Shares at year end 110,782,980 110,782,980
DATA PER SHARE (in euros) 2004 2005
Earnings before Depreciation and Tax 4 1.71 1.97
Earnings Before Tax 4 1.51 1.73
Earnings after Tax 4,5 1.06 1.19
1 The breakdown of the depreciation charges relating to Cost of Sales, Administrative and Selling Expenses is presented in the section
“Depreciation” of this chapter of the annual report.2 The parent company has been audited for tax purposes until the accounting year 1999 (included). The wholly owned subsidiary AVIN
OIL has been audited for tax purposes until the accounting year 2002 (included).3 For the weighted number of shares the buy back shares in possession of the parent Company were taken into consideration.4 Based on the weighted number of shares. It is noted that due to the small number of buy back shares in possession of the parent
Company during the years 2004 and 2005 the data per share would not differ in case the calculations were made using the number
of shares at the year end.
5 There are no minority interests.
❑ Consolidated Turnover
The Consolidated Turnover for 2005 amounted to € 3,237.4 million compared to € 2,219.0 million for 2004 demonstrating
a 45.89% increase. This development is by and large attributed to the same factors which contributed to the increase in
the turnover of the parent company MOTOR OIL, namely, the increase of the volume of sales and the prices of the petroleum
products.
42 ■ annual report
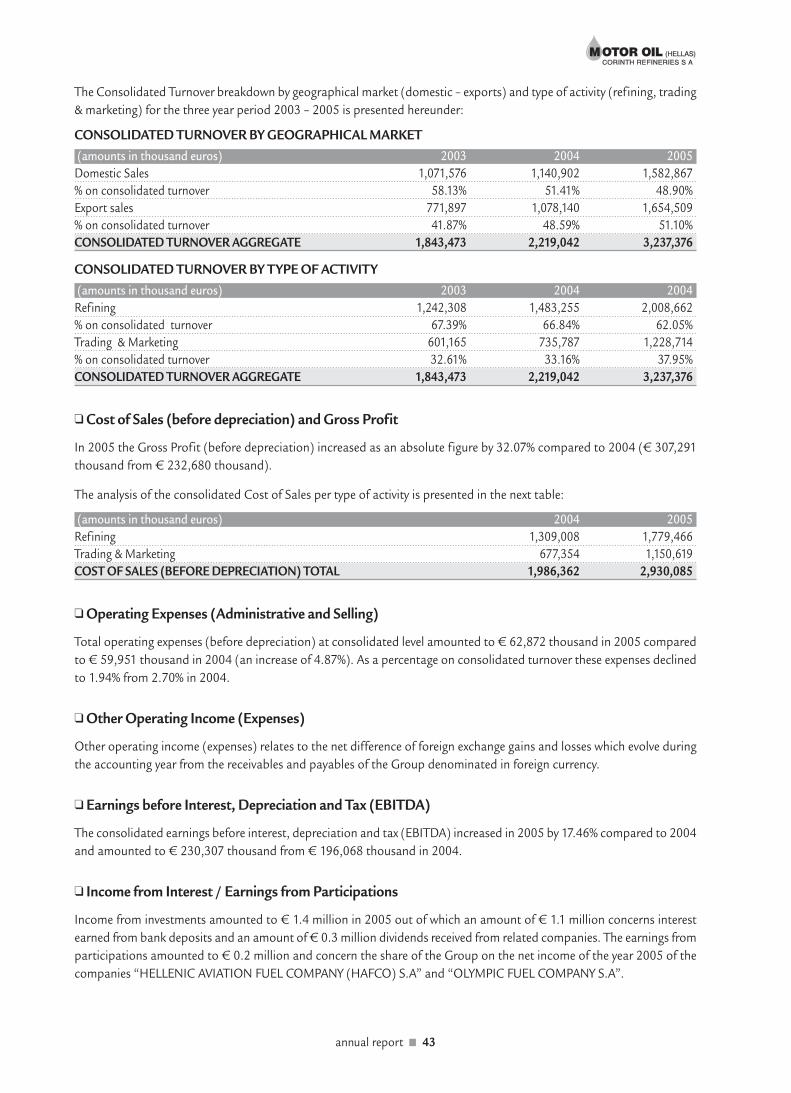
The Consolidated Turnover breakdown by geographical market (domestic – exports) and type of activity (refining, trading
& marketing) for the three year period 2003 – 2005 is presented hereunder:
CONSOLIDATED TURNOVER BY GEOGRAPHICAL MARKET
(amounts in thousand euros) 2003 2004 2005
Domestic Sales 1,071,576 1,140,902 1,582,867
% on consolidated turnover 58.13% 51.41% 48.90%
Export sales 771,897 1,078,140 1,654,509
% on consolidated turnover 41.87% 48.59% 51.10%
CONSOLIDATED TURNOVER AGGREGATE 1,843,473 2,219,042 3,237,376
CONSOLIDATED TURNOVER BY TYPE OF ACTIVITY
(amounts in thousand euros) 2003 2004 2004
Refining 1,242,308 1,483,255 2,008,662
% on consolidated turnover 67.39% 66.84% 62.05%
Trading & Marketing 601,165 735,787 1,228,714
% on consolidated turnover 32.61% 33.16% 37.95%
CONSOLIDATED TURNOVER AGGREGATE 1,843,473 2,219,042 3,237,376
❑ Cost of Sales (before depreciation) and Gross Profit
In 2005 the Gross Profit (before depreciation) increased as an absolute figure by 32.07% compared to 2004 (€ 307,291
thousand from € 232,680 thousand).
The analysis of the consolidated Cost of Sales per type of activity is presented in the next table:
(amounts in thousand euros) 2004 2005
Refining 1,309,008 1,779,466
Trading & Marketing 677,354 1,150,619
COST OF SALES (BEFORE DEPRECIATION) TOTAL 1,986,362 2,930,085
❑ Operating Expenses (Administrative and Selling)
Total operating expenses (before depreciation) at consolidated level amounted to € 62,872 thousand in 2005 compared
to € 59,951 thousand in 2004 (an increase of 4.87%). As a percentage on consolidated turnover these expenses declined
to 1.94% from 2.70% in 2004.
❑ Other Operating Income (Expenses)
Other operating income (expenses) relates to the net difference of foreign exchange gains and losses which evolve during
the accounting year from the receivables and payables of the Group denominated in foreign currency.
❑ Earnings before Interest, Depreciation and Tax (EBITDA)
The consolidated earnings before interest, depreciation and tax (EBITDA) increased in 2005 by 17.46% compared to 2004
and amounted to € 230,307 thousand from € 196,068 thousand in 2004.
❑ Income from Interest / Earnings from Participations
Income from investments amounted to € 1.4 million in 2005 out of which an amount of € 1.1 million concerns interest
earned from bank deposits and an amount of € 0.3 million dividends received from related companies. The earnings from
participations amounted to € 0.2 million and concern the share of the Group on the net income of the year 2005 of the
companies “HELLENIC AVIATION FUEL COMPANY (HAFCO) S.A” and “OLYMPIC FUEL COMPANY S.A”.
annual report ■ 43
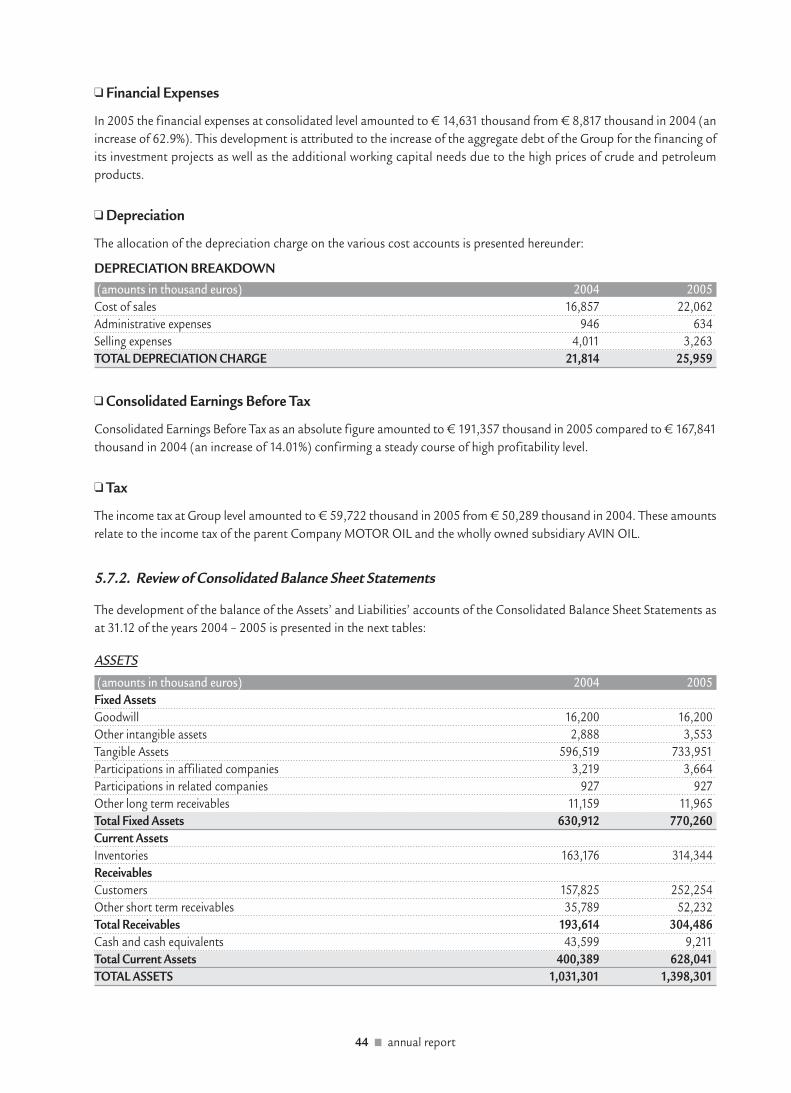
❑ Financial Expenses
In 2005 the financial expenses at consolidated level amounted to € 14,631 thousand from € 8,817 thousand in 2004 (an
increase of 62.9%). This development is attributed to the increase of the aggregate debt of the Group for the financing of
its investment projects as well as the additional working capital needs due to the high prices of crude and petroleum
products.
❑ Depreciation
The allocation of the depreciation charge on the various cost accounts is presented hereunder:
DEPRECIATION BREAKDOWN
(amounts in thousand euros) 2004 2005
Cost of sales 16,857 22,062
Administrative expenses 946 634
Selling expenses 4,011 3,263
TOTAL DEPRECIATION CHARGE 21,814 25,959
❑ Consolidated Earnings Before Tax
Consolidated Earnings Before Tax as an absolute figure amounted to € 191,357 thousand in 2005 compared to € 167,841
thousand in 2004 (an increase of 14.01%) confirming a steady course of high profitability level.
❑ Tax
The income tax at Group level amounted to € 59,722 thousand in 2005 from € 50,289 thousand in 2004. These amounts
relate to the income tax of the parent Company MOTOR OIL and the wholly owned subsidiary AVIN OIL.
5.7.2. Review of Consolidated Balance Sheet Statements
The development of the balance of the Assets’ and Liabilities’ accounts of the Consolidated Balance Sheet Statements as
at 31.12 of the years 2004 – 2005 is presented in the next tables:
ASSETS
(amounts in thousand euros) 2004 2005
Fixed Assets
Goodwill 16,200 16,200
Other intangible assets 2,888 3,553
Tangible Assets 596,519 733,951
Participations in affiliated companies 3,219 3,664
Participations in related companies 927 927
Other long term receivables 11,159 11,965
Total Fixed Assets 630,912 770,260
Current Assets
Inventories 163,176 314,344
Receivables
Customers 157,825 252,254
Other short term receivables 35,789 52,232
Total Receivables 193,614 304,486
Cash and cash equivalents 43,599 9,211
Total Current Assets 400,389 628,041
TOTAL ASSETS 1,031,301 1,398,301
44 ■ annual report
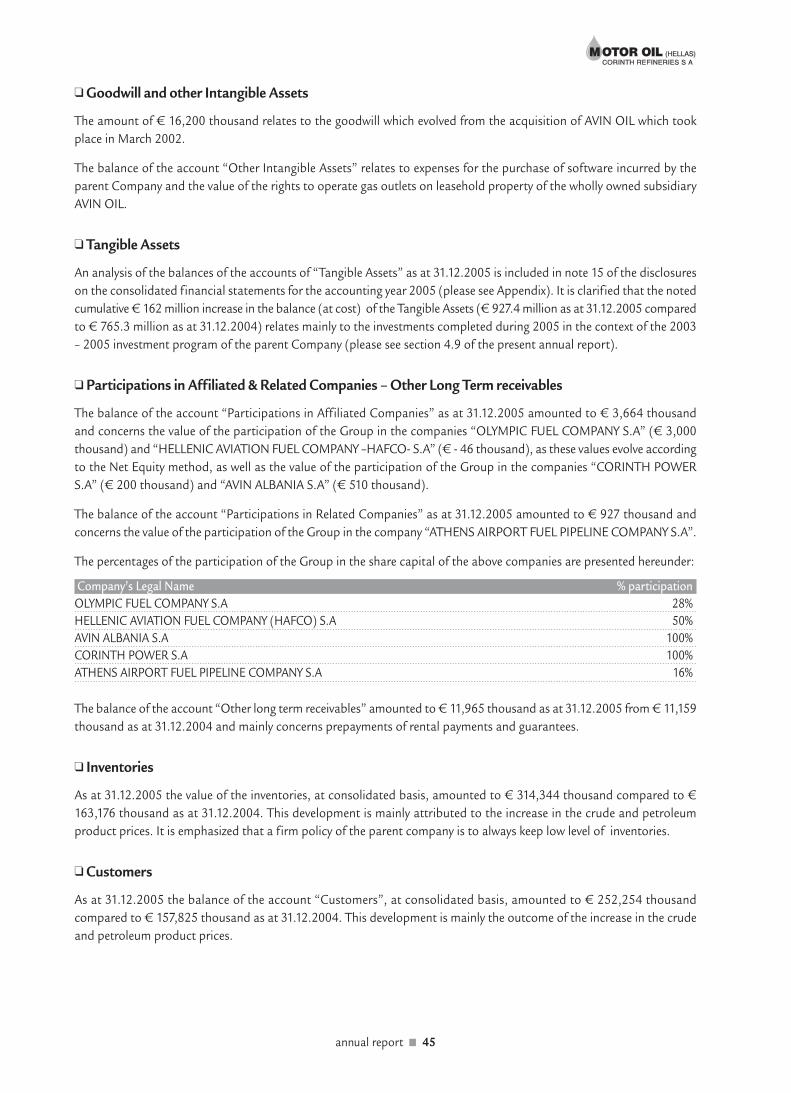
❑ Goodwill and other Intangible Assets
The amount of € 16,200 thousand relates to the goodwill which evolved from the acquisition of AVIN OIL which took
place in March 2002.
The balance of the account “Other Intangible Assets” relates to expenses for the purchase of software incurred by the
parent Company and the value of the rights to operate gas outlets on leasehold property of the wholly owned subsidiary
AVIN OIL.
❑ Tangible Assets
An analysis of the balances of the accounts of “Tangible Assets” as at 31.12.2005 is included in note 15 of the disclosures
on the consolidated financial statements for the accounting year 2005 (please see Appendix). It is clarified that the noted
cumulative € 162 million increase in the balance (at cost) of the Tangible Assets (€ 927.4 million as at 31.12.2005 compared
to € 765.3 million as at 31.12.2004) relates mainly to the investments completed during 2005 in the context of the 2003
– 2005 investment program of the parent Company (please see section 4.9 of the present annual report).
❑ Participations in Affiliated & Related Companies – Other Long Term receivables
The balance of the account “Participations in Affiliated Companies” as at 31.12.2005 amounted to € 3,664 thousand
and concerns the value of the participation of the Group in the companies “OLYMPIC FUEL COMPANY S.A” (€ 3,000
thousand) and “HELLENIC AVIATION FUEL COMPANY –HAFCO- S.A” (€ - 46 thousand), as these values evolve according
to the Net Equity method, as well as the value of the participation of the Group in the companies “CORINTH POWER
S.A” (€ 200 thousand) and “AVIN ALBANIA S.A” (€ 510 thousand).
The balance of the account “Participations in Related Companies” as at 31.12.2005 amounted to € 927 thousand and
concerns the value of the participation of the Group in the company “ATHENS AIRPORT FUEL PIPELINE COMPANY S.A”.
The percentages of the participation of the Group in the share capital of the above companies are presented hereunder:
Company’s Legal Name % participation
OLYMPIC FUEL COMPANY S.A 28%
HELLENIC AVIATION FUEL COMPANY (HAFCO) S.A 50%
AVIN ALBANIA S.A 100%
CORINTH POWER S.A 100%
ATHENS AIRPORT FUEL PIPELINE COMPANY S.A 16%
The balance of the account “Other long term receivables” amounted to € 11,965 thousand as at 31.12.2005 from € 11,159
thousand as at 31.12.2004 and mainly concerns prepayments of rental payments and guarantees.
❑ Inventories
As at 31.12.2005 the value of the inventories, at consolidated basis, amounted to € 314,344 thousand compared to €
163,176 thousand as at 31.12.2004. This development is mainly attributed to the increase in the crude and petroleum
product prices. It is emphasized that a firm policy of the parent company is to always keep low level of inventories.
❑ Customers
As at 31.12.2005 the balance of the account “Customers”, at consolidated basis, amounted to € 252,254 thousand
compared to € 157,825 thousand as at 31.12.2004. This development is mainly the outcome of the increase in the crude
and petroleum product prices.
annual report ■ 45
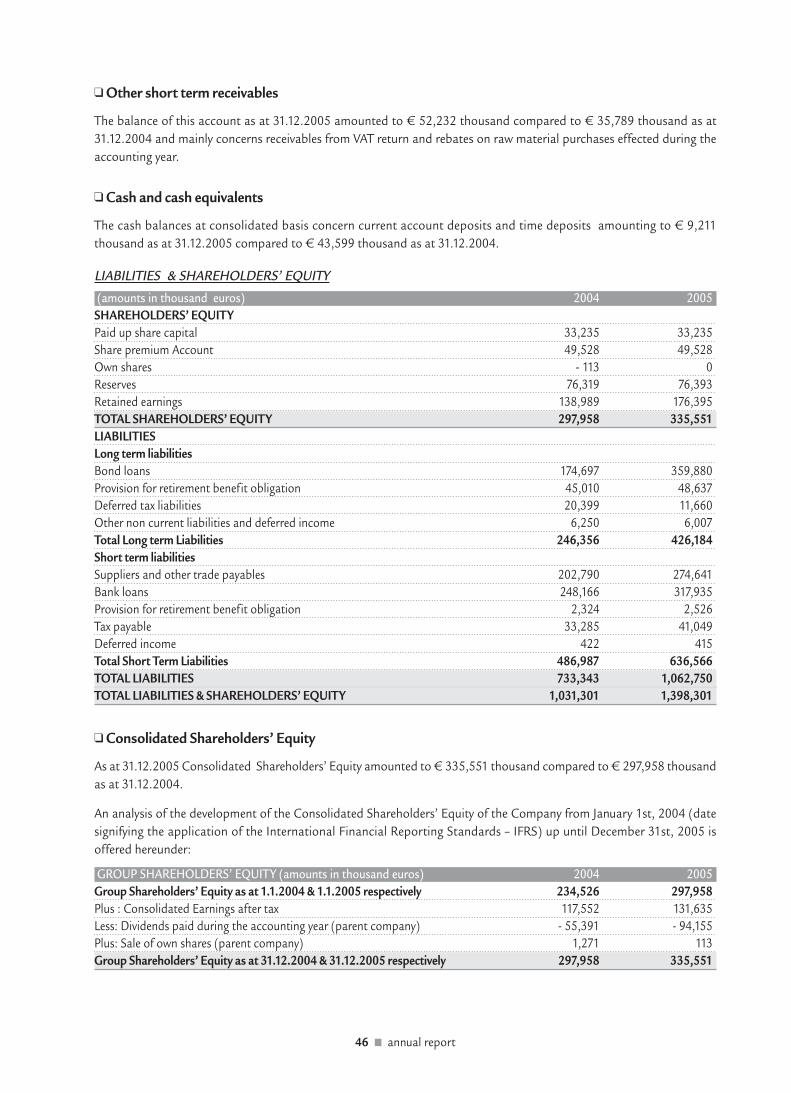
❑ Other short term receivables
The balance of this account as at 31.12.2005 amounted to € 52,232 thousand compared to € 35,789 thousand as at
31.12.2004 and mainly concerns receivables from VAT return and rebates on raw material purchases effected during the
accounting year.
❑ Cash and cash equivalents
The cash balances at consolidated basis concern current account deposits and time deposits amounting to € 9,211
thousand as at 31.12.2005 compared to € 43,599 thousand as at 31.12.2004.
LIABILITIES & SHAREHOLDERS’ EQUITY
(amounts in thousand euros) 2004 2005
SHAREHOLDERS’ EQUITY
Paid up share capital 33,235 33,235
Share premium Account 49,528 49,528
Own shares - 113 0
Reserves 76,319 76,393
Retained earnings 138,989 176,395
TOTAL SHAREHOLDERS’ EQUITY 297,958 335,551
LIABILITIES
Long term liabilities
Bond loans 174,697 359,880
Provision for retirement benefit obligation 45,010 48,637
Deferred tax liabilities 20,399 11,660
Other non current liabilities and deferred income 6,250 6,007
Total Long term Liabilities 246,356 426,184
Short term liabilities
Suppliers and other trade payables 202,790 274,641
Bank loans 248,166 317,935
Provision for retirement benefit obligation 2,324 2,526
Tax payable 33,285 41,049
Deferred income 422 415
Total Short Term Liabilities 486,987 636,566
TOTAL LIABILITIES 733,343 1,062,750
TOTAL LIABILITIES & SHAREHOLDERS’ EQUITY 1,031,301 1,398,301
❑ Consolidated Shareholders’ Equity
As at 31.12.2005 Consolidated Shareholders’ Equity amounted to € 335,551 thousand compared to € 297,958 thousand
as at 31.12.2004.
An analysis of the development of the Consolidated Shareholders’ Equity of the Company from January 1st, 2004 (date
signifying the application of the International Financial Reporting Standards – IFRS) up until December 31st, 2005 is
offered hereunder:
GROUP SHAREHOLDERS’ EQUITY (amounts in thousand euros) 2004 2005
Group Shareholders’ Equity as at 1.1.2004 & 1.1.2005 respectively 234,526 297,958
Plus : Consolidated Earnings after tax 117,552 131,635
Less: Dividends paid during the accounting year (parent company) - 55,391 - 94,155
Plus: Sale of own shares (parent company) 1,271 113
Group Shareholders’ Equity as at 31.12.2004 & 31.12.2005 respectively 297,958 335,551
46 ■ annual report

❑ Long-Term Liabilities
As at 31.12.2005 the balance of this account amounted to € 426,184 thousand compared to € 246,356 thousand as at
31.12.2004. This increase is mainly attributed to the two bond loans (one for an amount of € 250 million and one for an
amount of USD 150 million) received by the parent company and described in detail in section 5.3 of the present annual
report. The balance of the account “Bank Loans” both as at 31.12.2004 and as at 31.12.2005 includes a bond loan for an
amount of € 30 million received by AVIN OIL in 2004 which will be fully repaid in 2008.
❑ Suppliers and other trade payables
As at 31.12.2005 the balance of the account “Suppliers and other trade payables”, at consolidated basis, amounted to €
274,641 thousand compared to € 202,790 thousand as at 31.12.2004. The increase in the balance of this account as at
31.12.2005 is mainly attributed to the higher prices of raw materials and finished products during the accounting period.
❑ Short-Term Bank Loans
As at 31.12.2005 the balance of “Short Term Bank Loans”, at consolidated basis, increased to € 317,935 thousand from
€ 248,166 thousand as at 31.12.2004. The short term debt increased within 2005 due to the working capital needs both
of the parent company and of AVIN OIL because of the increase in the prices of crude and petroleum products.
❑ Tax Payable
As at 31.12.2005 the balance of the account “Tax Payable”, at consolidated basis, amounted to € 41,049 thousand
compared to € 33,285 thousand as at 31.12.2004 a development attributed to the increased profitability of the parent
company and its subsidiary during the accounting year 2005 compared to the accounting year of 2004.
5.7.3. Consolidated Cash Flow Statements
The Consolidated Cash Flow Statements for the year 2005 is included in the Appendix of the present Annual Report (please
see Appendix).
annual report ■ 47
6. Affiliated Companies
6.1 MOTOR OIL Subsidiaries
AVIN OIL Industrial, Commercial & Maritime Oil Company S.A.
AVIN OIL Industrial, Commercial & Maritime Oil Company S.A was founded in Athens in 1977 and currently its headquarters
are located at Maroussi (12A Irodou Attikou str., 151 24). The main activity of the company is the sale of liquid fuels,
lubricants, LPG and asphalt which have a wide array of applications (transportation, industrial and home use).
The sole shareholder of the company (Share Capital: € 5,200,272 divided into 1,768,800 common registered shares of a
nominal value € 2.94 each) is MOTOR OIL (HELLAS) S.A which in March 2002 purchased the aggregate of the shares of
AVIN OIL in the context of a relevant condition set in the process of the introduction its shares in the main market of the
Athens Stock Exchange.
The acquisition of AVIN OIL gave MOTOR OIL a strong arm in the retail sector of fuels and lubricants since the acquired
company ranks fourth among its competitors in the Greek market with a market share of approximately 9%.
The gas outlet network of AVIN OIL numbers approximately 550 units and several representatives all over Greece while at
the same time the company owns tank-trucks and employs specialized technical personnel.
Moreover, AVIN OIL has built and operates a twin grand station at Megara (70 km outside Athens), located on the new
section of the Athens–Corinth highway, which, besides fuelling, offers banking, catering, and car maintenance services, at
both sides of the road.
The primary objective of AVIN OIL is the qualitative enhancement of its gas outlet network and the strengthening of its
new endeavors. The participation of the company as a founding shareholder in the companies “HAFCO S.A” and “OLYMPIC
FUEL COMPANY S.A” (section 6.2 of the present chapter) fall within the context of the above mentioned objective.
AVIN OIL sells fuels in the Greek market mainly through its privately owned storage premises located at Aghii Theodoroi
in Corinth. The operation of the premises started in 1987 and constitute a modern truck loading terminal fully equipped
with safety and environment protection systems.
The major supplier of AVIN OIL is MOTOR OIL (section 6.5 of the present chapter).
The aggregate personnel headcount of AVIN OIL as at 31.12.2005 amounted to 212 employees (2004: 209 employees).
The company is audited by certified public accountants (Auditing firm DELOITTE, responsible certified public accountant
for the year 2005 Mr. George Cambanis REG No.ICPA – GR - 10761). The AVIN OIL yearly financial statements (based on
the International Financial Reporting Standards – IFRS), the report of the auditor and the management report of the
Board of Directors for the accounting year 2005 (Sales: € 705.3 million (+ 22%), Earnings after Tax: € 4.4 million (+
10.8%), Total Assets: € 150 million, Shareholders’ Equity: € 17.8 million) are available at the AVIN OIL site at the electronic
address www.avinoil.gr.
48 ■ annual report
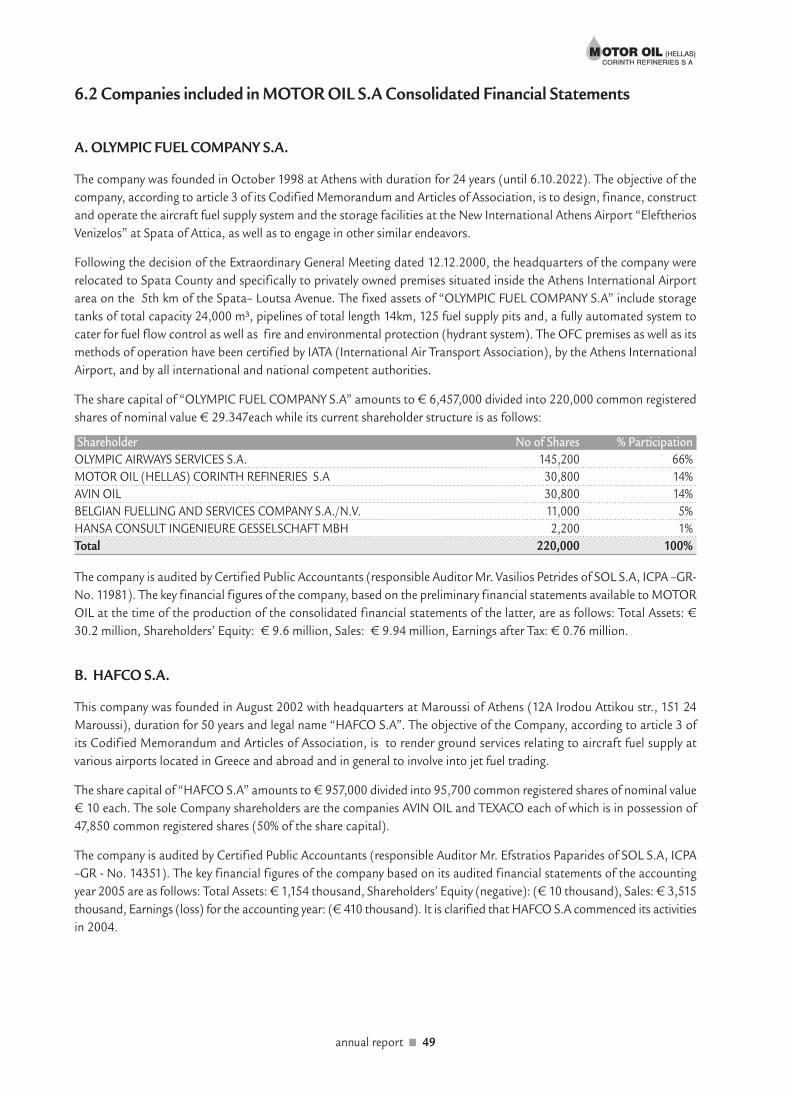
6.2 Companies included in MOTOR OIL S.A Consolidated Financial Statements
A. OLYMPIC FUEL COMPANY S.A.
The company was founded in October 1998 at Athens with duration for 24 years (until 6.10.2022). The objective of the
company, according to article 3 of its Codified Memorandum and Articles of Association, is to design, finance, construct
and operate the aircraft fuel supply system and the storage facilities at the New International Athens Airport “Eleftherios
Venizelos” at Spata of Attica, as well as to engage in other similar endeavors.
Following the decision of the Extraordinary General Meeting dated 12.12.2000, the headquarters of the company were
relocated to Spata County and specifically to privately owned premises situated inside the Athens International Airport
area on the 5th km of the Spata– Loutsa Avenue. The fixed assets of “OLYMPIC FUEL COMPANY S.A” include storage
tanks of total capacity 24,000 m³, pipelines of total length 14km, 125 fuel supply pits and, a fully automated system to
cater for fuel flow control as well as fire and environmental protection (hydrant system). The OFC premises as well as its
methods of operation have been certified by IATA (International Air Transport Association), by the Athens International
Airport, and by all international and national competent authorities.
The share capital of “OLYMPIC FUEL COMPANY S.A” amounts to € 6,457,000 divided into 220,000 common registered
shares of nominal value € 29.347each while its current shareholder structure is as follows:
Shareholder No of Shares % Participation
OLYMPIC AIRWAYS SERVICES S.A. 145,200 66%
MOTOR OIL (HELLAS) CORINTH REFINERIES S.A 30,800 14%
AVIN OIL 30,800 14%
BELGIAN FUELLING AND SERVICES COMPANY S.A./N.V. 11,000 5%
HANSA CONSULT INGENIEURE GESSELSCHAFT MBH 2,200 1%
Total 220,000 100%
The company is audited by Certified Public Accountants (responsible Auditor Mr. Vasilios Petrides of SOL S.A, ICPA –GR-
No. 11981). The key financial figures of the company, based on the preliminary financial statements available to MOTOR
OIL at the time of the production of the consolidated financial statements of the latter, are as follows: Total Assets: €
30.2 million, Shareholders’ Equity: € 9.6 million, Sales: € 9.94 million, Earnings after Tax: € 0.76 million.
B. HAFCO S.A.
This company was founded in August 2002 with headquarters at Maroussi of Athens (12A Irodou Attikou str., 151 24
Maroussi), duration for 50 years and legal name “HAFCO S.A”. The objective of the Company, according to article 3 of
its Codified Memorandum and Articles of Association, is to render ground services relating to aircraft fuel supply at
various airports located in Greece and abroad and in general to involve into jet fuel trading.
The share capital of “HAFCO S.A” amounts to € 957,000 divided into 95,700 common registered shares of nominal value
€ 10 each. The sole Company shareholders are the companies AVIN OIL and TEXACO each of which is in possession of
47,850 common registered shares (50% of the share capital).
The company is audited by Certified Public Accountants (responsible Auditor Mr. Efstratios Paparides of SOL S.A, ICPA
–GR - No. 14351). The key financial figures of the company based on its audited financial statements of the accounting
year 2005 are as follows: Total Assets: € 1,154 thousand, Shareholders’ Equity (negative): (€ 10 thousand), Sales: € 3,515
thousand, Earnings (loss) for the accounting year: (€ 410 thousand). It is clarified that HAFCO S.A commenced its activities
in 2004.
annual report ■ 49

6.3 MOTOR OIL related companies
ATHENS AIRPORT FUEL PIPELINE COMPANY S.A.
The company was founded in May 2000 at Maroussi (199 Kifisias Ave., zip code 151 25) with duration for 50 years. The
objective of the ATHENS AIRPORT FUEL PIPELINE COMPANY S.A, according to article no. 3 of its Codified Memorandum
and Articles of Association, is the execution of all works and activities relating to the design, f inancing, construction,
completion, operation, maintenance and handling of the pipeline and its premises for the carrying of aircraft fuel from
the “Hellenic Petroleum” (EL-PE) refinery at Aspropyrgos to the Athens International Airport “Eleftherios Venizelos” at
Spata. The length of the pipeline is 53 km, the diameter is 26 cm and the advancement capacity is 300 m3 / hour.
This investment provides many environmental benefits as it contributes to the reduction of air pollution as well as the
traffic relief at the greater Athens area (the aggregate distance covered every year by trucks carrying aircraft fuel to the
airport was estimated at 2,000,000 km and the number of travels at 18,000). Additionally, thanks to the underground
routing of the pipeline both the natural environment and the settlement will be unaffected.
The operation of the pipeline started in the beginning of 2004 and caters successfully for the fulfillment of jet fuel needs
while the economic viability of the project is guaranteed as a result of increasing demand for jet fuel at the airport area.
The share capital of the “ATHENS AIRPORT FUEL PIPELINE COMPANY S.A” amounts to € 5,782,355 and is divided into
1,973,500 common registered shares of nominal value € 2.93 each.
The current shareholder structure of the company is as follows:
Shareholder Number of Shares % Participation
HELLENIC PETROLEUM S.A 986,750 50%
MOTOR OIL (HELLAS) CORINTH REFINERIES S.A 315,760 16%
OLYMPIC AIRWAYS SERVICES S.A 335,495 17%
ATHENS INTERNATIONAL AIRPORT S.A 335,495 17%
Total 1,973,500 100%
The company is audited by certified public accountants (Auditing firm DELOITTE, responsible certified public accountant
Mr. Telemahos Georgopoulos REG No.ICPA –GR- 19271). For the accounting year 2005 the company Sales amounted to
€ 3,061 thousand and the Earnings before Taxes to € 709 thousand.
50 ■ annual report
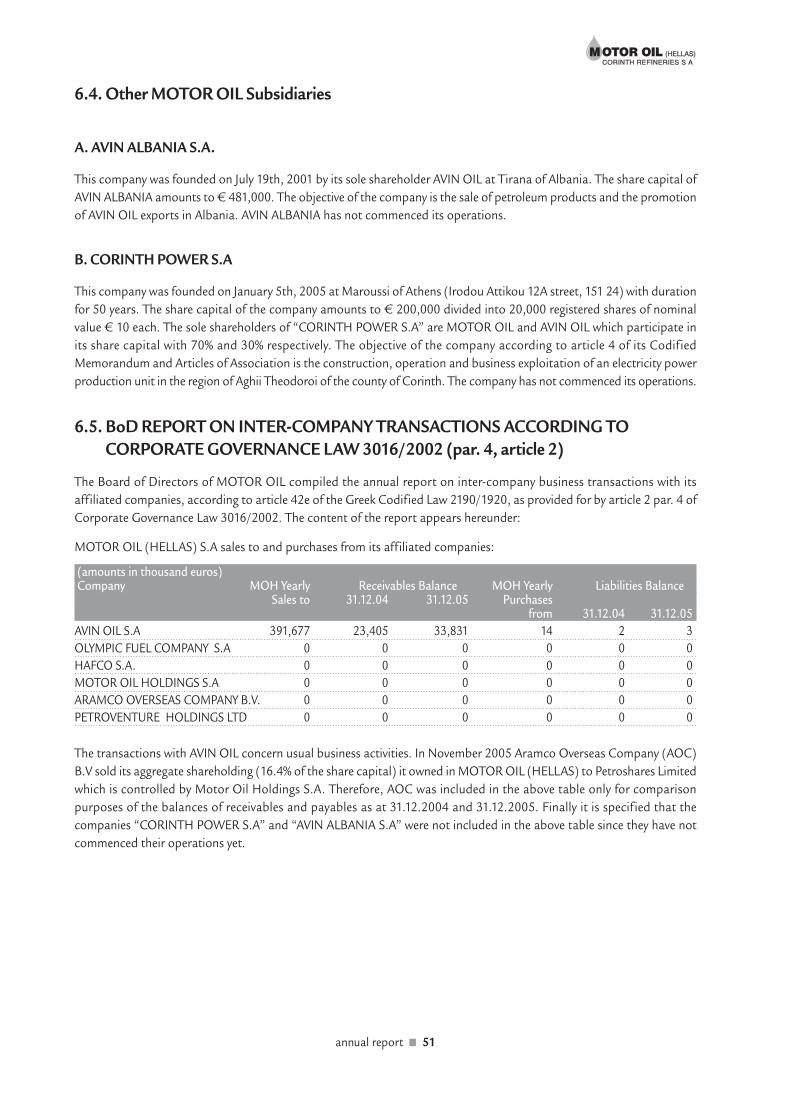
6.4. Other MOTOR OIL Subsidiaries
A. AVIN ALBANIA S.A.
This company was founded on July 19th, 2001 by its sole shareholder AVIN OIL at Tirana of Albania. The share capital of
AVIN ALBANIA amounts to € 481,000. The objective of the company is the sale of petroleum products and the promotion
of AVIN OIL exports in Albania. AVIN ALBANIA has not commenced its operations.
B. CORINTH POWER S.A
This company was founded on January 5th, 2005 at Maroussi of Athens (Irodou Attikou 12A street, 151 24) with duration
for 50 years. The share capital of the company amounts to € 200,000 divided into 20,000 registered shares of nominal
value € 10 each. The sole shareholders of “CORINTH POWER S.A” are MOTOR OIL and AVIN OIL which participate in
its share capital with 70% and 30% respectively. The objective of the company according to article 4 of its Codified
Memorandum and Articles of Association is the construction, operation and business exploitation of an electricity power
production unit in the region of Aghii Theodoroi of the county of Corinth. The company has not commenced its operations.
6.5. BoD REPORT ON INTER-COMPANY TRANSACTIONS ACCORDING TO
CORPORATE GOVERNANCE LAW 3016/2002 (par. 4, article 2)
The Board of Directors of MOTOR OIL compiled the annual report on inter-company business transactions with its
affiliated companies, according to article 42e of the Greek Codified Law 2190/1920, as provided for by article 2 par. 4 of
Corporate Governance Law 3016/2002. The content of the report appears hereunder:
MOTOR OIL (HELLAS) S.A sales to and purchases from its affiliated companies:
(amounts in thousand euros)Company MOH Yearly Receivables Balance MOH Yearly Liabilities Balance
Sales to 31.12.04 31.12.05 Purchases from 31.12.04 31.12.05
AVIN OIL S.A 391,677 23,405 33,831 14 2 3
OLYMPIC FUEL COMPANY S.A 0 0 0 0 0 0
HAFCO S.A. 0 0 0 0 0 0
MOTOR OIL HOLDINGS S.A 0 0 0 0 0 0
ARAMCO OVERSEAS COMPANY B.V. 0 0 0 0 0 0
PETROVENTURE HOLDINGS LTD 0 0 0 0 0 0
The transactions with AVIN OIL concern usual business activities. In November 2005 Aramco Overseas Company (AOC)
B.V sold its aggregate shareholding (16.4% of the share capital) it owned in MOTOR OIL (HELLAS) to Petroshares Limited
which is controlled by Motor Oil Holdings S.A. Therefore, AOC was included in the above table only for comparison
purposes of the balances of receivables and payables as at 31.12.2004 and 31.12.2005. Finally it is specif ied that the
companies “CORINTH POWER S.A” and “AVIN ALBANIA S.A” were not included in the above table since they have not
commenced their operations yet.
annual report ■ 51
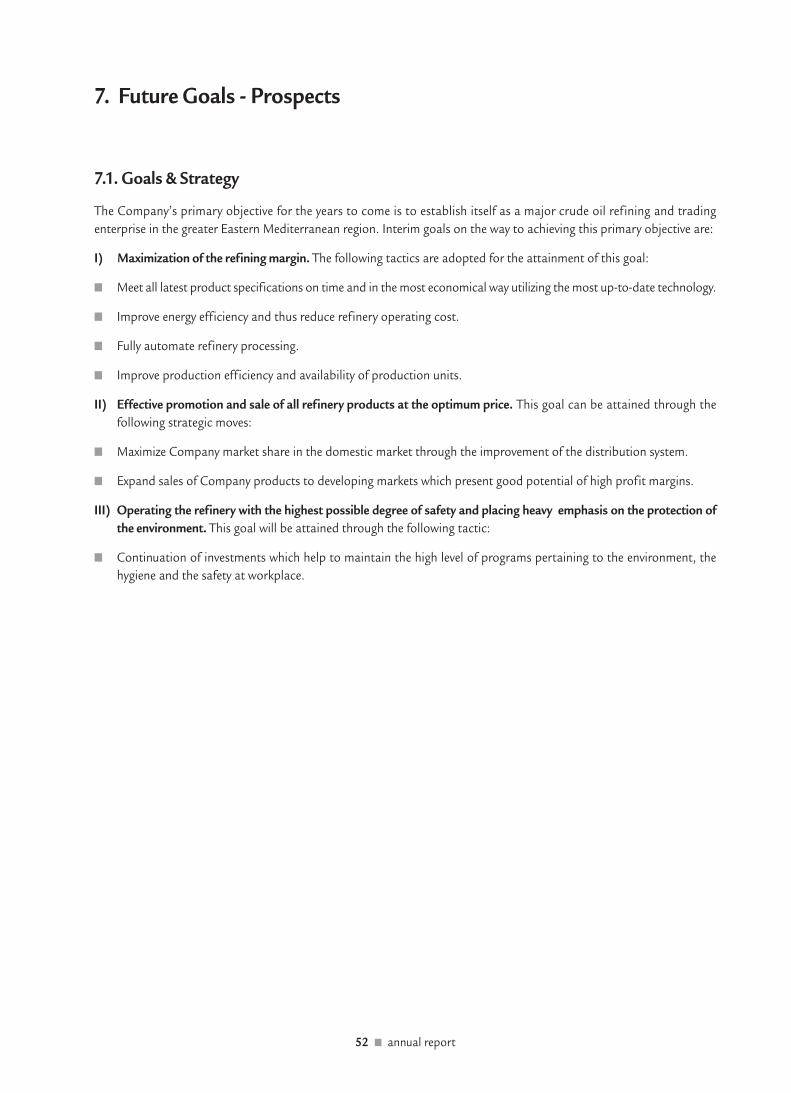
7. Future Goals - Prospects
7.1. Goals & Strategy
The Company’s primary objective for the years to come is to establish itself as a major crude oil ref ining and trading
enterprise in the greater Eastern Mediterranean region. Interim goals on the way to achieving this primary objective are:
I) Maximization of the refining margin. The following tactics are adopted for the attainment of this goal:
■ Meet all latest product specifications on time and in the most economical way utilizing the most up-to-date technology.
■ Improve energy efficiency and thus reduce refinery operating cost.
■ Fully automate refinery processing.
■ Improve production efficiency and availability of production units.
II) Effective promotion and sale of all refinery products at the optimum price. This goal can be attained through the
following strategic moves:
■ Maximize Company market share in the domestic market through the improvement of the distribution system.
■ Expand sales of Company products to developing markets which present good potential of high profit margins.
III) Operating the refinery with the highest possible degree of safety and placing heavy emphasis on the protection of
the environment. This goal will be attained through the following tactic:
■ Continuation of investments which help to maintain the high level of programs pertaining to the environment, the
hygiene and the safety at workplace.
52 ■ annual report
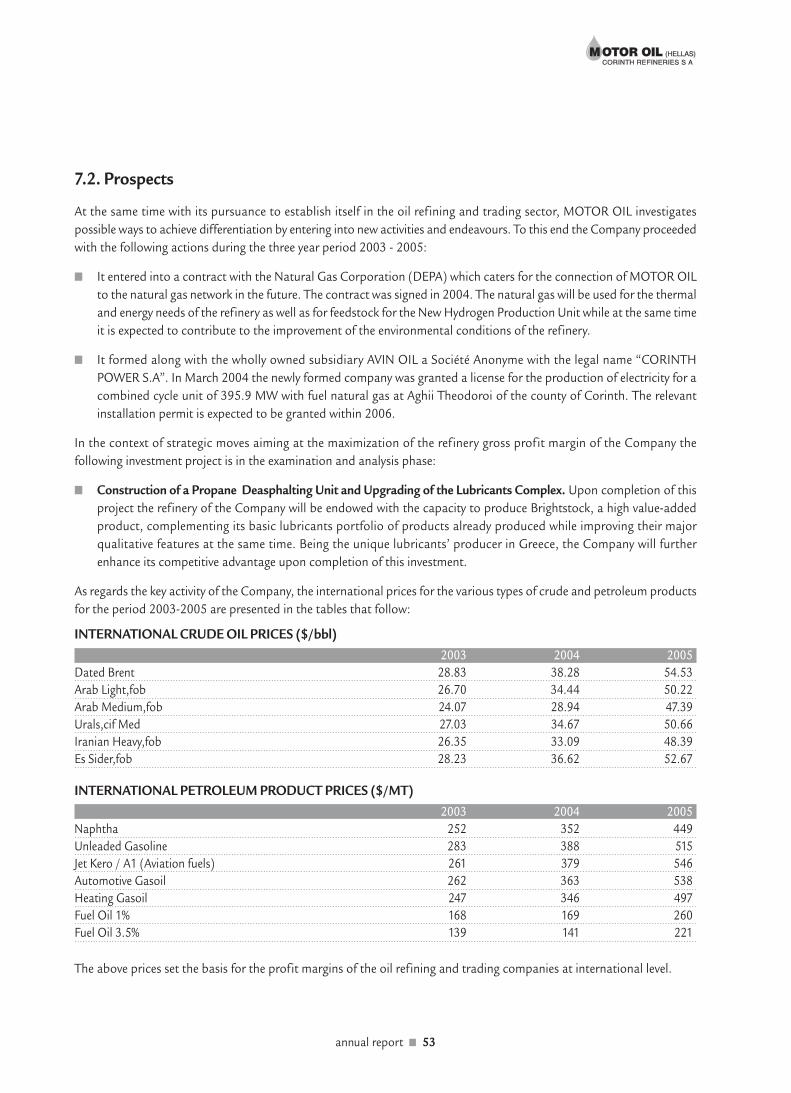
7.2. Prospects
At the same time with its pursuance to establish itself in the oil refining and trading sector, MOTOR OIL investigates
possible ways to achieve differentiation by entering into new activities and endeavours. To this end the Company proceeded
with the following actions during the three year period 2003 - 2005:
■ It entered into a contract with the Natural Gas Corporation (DEPA) which caters for the connection of MOTOR OIL
to the natural gas network in the future. The contract was signed in 2004. The natural gas will be used for the thermal
and energy needs of the refinery as well as for feedstock for the New Hydrogen Production Unit while at the same time
it is expected to contribute to the improvement of the environmental conditions of the refinery.
■ It formed along with the wholly owned subsidiary AVIN OIL a Société Anonyme with the legal name “CORINTH
POWER S.A”. In March 2004 the newly formed company was granted a license for the production of electricity for a
combined cycle unit of 395.9 MW with fuel natural gas at Aghii Theodoroi of the county of Corinth. The relevant
installation permit is expected to be granted within 2006.
In the context of strategic moves aiming at the maximization of the ref inery gross profit margin of the Company the
following investment project is in the examination and analysis phase:
■ Construction of a Propane Deasphalting Unit and Upgrading of the Lubricants Complex. Upon completion of this
project the refinery of the Company will be endowed with the capacity to produce Brightstock, a high value-added
product, complementing its basic lubricants portfolio of products already produced while improving their major
qualitative features at the same time. Being the unique lubricants’ producer in Greece, the Company will further
enhance its competitive advantage upon completion of this investment.
As regards the key activity of the Company, the international prices for the various types of crude and petroleum products
for the period 2003-2005 are presented in the tables that follow:
INTERNATIONAL CRUDE OIL PRICES ($/bbl)
2003 2004 2005
Dated Brent 28.83 38.28 54.53
Arab Light,fob 26.70 34.44 50.22
Arab Medium,fob 24.07 28.94 47.39
Urals,cif Med 27.03 34.67 50.66
Iranian Heavy,fob 26.35 33.09 48.39
Es Sider,fob 28.23 36.62 52.67
INTERNATIONAL PETROLEUM PRODUCT PRICES ($/MT)
2003 2004 2005
Naphtha 252 352 449
Unleaded Gasoline 283 388 515
Jet Kero / A1 (Aviation fuels) 261 379 546
Automotive Gasoil 262 363 538
Heating Gasoil 247 346 497
Fuel Oil 1% 168 169 260
Fuel Oil 3.5% 139 141 221
The above prices set the basis for the profit margins of the oil refining and trading companies at international level.
annual report ■ 53

The following table presents the refining margin achieved by the refineries in the Mediterranean region compared to that
achieved by MOTOR OIL during the last three year period:
REFINING MARGIN ($/MT)
2003 2004 2005
MOTOR OIL (HELLAS) S.A 39.6 53.9 72.8
Complex Mediterranean Refinery 34.4 56.8 63.4
Demand estimates per product category are presented in detail in the following table:
ESTIMATES FOR TOTAL DEMAND PER PRODUCT CATEGORY (in thousand MT)
2003 2004 2005 2006 (Est.)
Lubricants 160 160 144 144
Asphalt 385 418 275 336
LPG 384 382 355 363
Jet Kero / A1 (Aviation fuels) 1,148 1,198 1,228 1,210
Gasoline 3,685 3,823 3,965 4,046
Fuel Oil 5,401 5,420 5,376 5,125
Diesel (Automotive – Heating) 8,298 7,973 7,908 7,835
TOTAL 19,460 19,374 19,251 19,060
% Change over previous year 5.2% - 0.4% - 0.6% - 1.0%
In the domestic market the reduction in the demand for LPG is indicative of the introduction of the natural gas in the
energy balance. The demand for gasoline increases every year driven by various catalysts (new registrations of high cubic
capacity engine vehicles, greater use of the Attika Ring Road and the Rio – Antirio bridge by the drivers). The demand for
automotive diesel slowed slightly in 2005. This development is very likely to be reversed when the automotive diesel will
be allowed to be used in passenger vehicles. The demand for heating diesel still remains closely dependent on weather con-
ditions during winter months since natural gas penetration for household needs occurs at a pace much slower than antic-
ipated. The noted reduction in fuel oil demand is attributed to natural gas substitution. Finally, as regards asphalt, the
significant reduction in demand is explained by the slow down of the activities facing the construction sector at the post
Olympic Games era.
54 ■ annual report

8. Dividend Policy
The dividend policy is determined taking into consideration the Company earnings and the need for capital expenditure
for new investment projects.
Over time the dividend amount paid to the shareholders as percentage on the Company’s Earnings after Tax is notably
high. This percentage for the accounting years 2004 and 2005 is presented in the next table:
DIVIDEND POLICY
(amounts in thousand Euros) 2004 2005
Earnings after Tax 118,660 130,687
Total Dividend amount 94,165 121,861
Dividend as % on Earnings after Tax 79.36 % 93.25 %
The Board of Directors will propose to the Annual General Meeting of Company Shareholders the distribution of an
aggregate dividend amount of € 1.10 per share from 2005 Company earnings.
It is noted that on 20.12.2005 the Company proceeded with the distribution of an interim dividend of € 0.20 per share,
based on the interim financial statements dated 30.9.2005, as advance payment for the year 2005 dividend.
According to the Greek law, the minimum amount of dividend paid to Company shareholders equals at least 35% of net
earnings (after the deduction of the corresponding income tax and the legal reserves), or 6% of the paid up share capital,
whichever of these two amounts is greater.
The payment of the dividend is effected within two months from the date of the Annual Ordinary General Meeting of
Company Shareholders which approved the Company’s financial statements.
The Company aims to continue the high dividend payout policy.
annual report ■ 55

56
9. Appendix
■ INVITATION TO THE ANNUAL GENERAL MEETING OF MAY 30TH, 2006
■ MOTOR OIL 2005 PUBLISHED FIGURES AND INFORMATION
(PARENT COMPANY AND CONSOLIDATED)
■ MOTOR OIL 2005 FINANCIAL STATEMENTS
(PARENT COMPANY AND CONSOLIDATED) – REPORT OF THE AUDITORS
■ BoD REPORT ON MOTOR OIL 2005 CONSOLIDATED FINANCIAL STATEMENTS
■ BoD REPORT ON MOTOR OIL 2005 FINANCIAL STATEMENTS
■ INFORMATION BULLETIN COMPILED IN ACCORDANCE WITH THE LAW 3401/2005

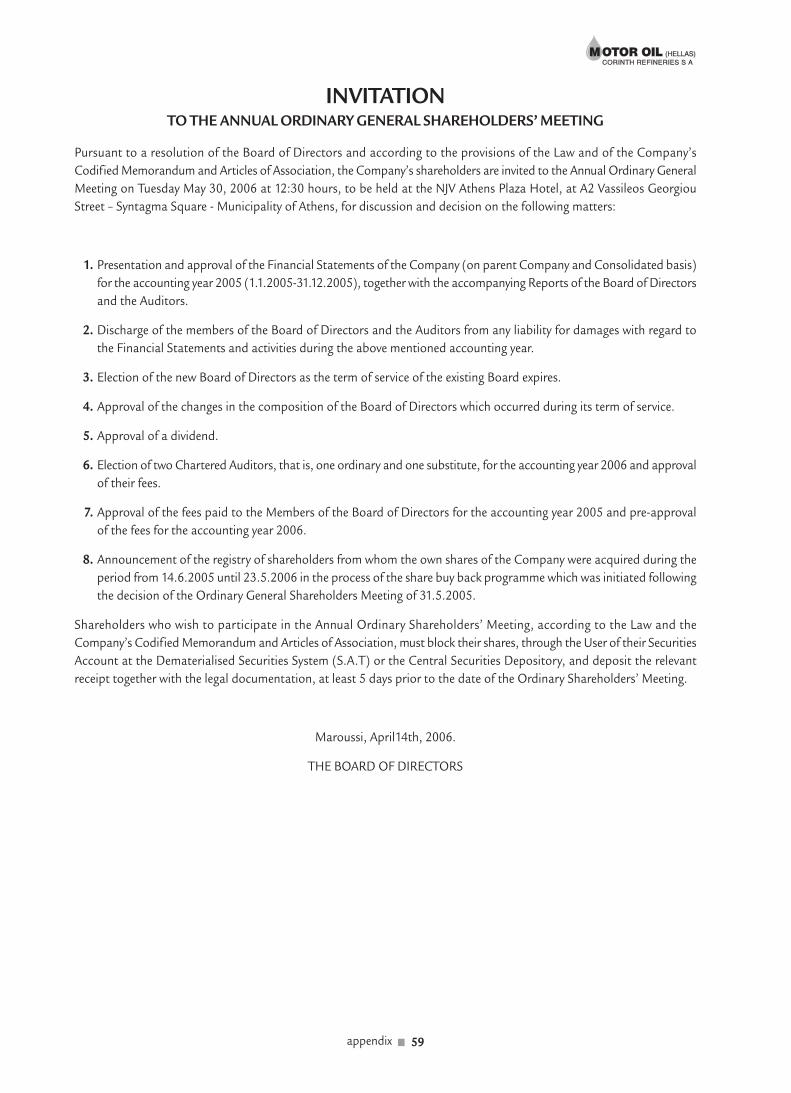
INVITATIONΤΟ ΤΗΕ ANNUAL ORDINARY GENERAL SHAREHOLDERS’ MEETING
Pursuant to a resolution of the Board of Directors and according to the provisions of the Law and of the Company’s
Codified Memorandum and Articles of Association, the Company’s shareholders are invited to the Annual Ordinary General
Meeting on Tuesday May 30, 2006 at 12:30 hours, to be held at the NJV Athens Plaza Hotel, at A2 Vassileos Georgiou
Street – Syntagma Square - Municipality of Athens, for discussion and decision on the following matters:
1. Presentation and approval of the Financial Statements of the Company (on parent Company and Consolidated basis)
for the accounting year 2005 (1.1.2005-31.12.2005), together with the accompanying Reports of the Board of Directors
and the Auditors.
2. Discharge of the members of the Board of Directors and the Auditors from any liability for damages with regard to
the Financial Statements and activities during the above mentioned accounting year.
3. Election of the new Board of Directors as the term of service of the existing Board expires.
4. Approval of the changes in the composition of the Board of Directors which occurred during its term of service.
5. Approval of a dividend.
6. Election of two Chartered Auditors, that is, one ordinary and one substitute, for the accounting year 2006 and approval
of their fees.
7. Approval of the fees paid to the Members of the Board of Directors for the accounting year 2005 and pre-approval
of the fees for the accounting year 2006.
8. Announcement of the registry of shareholders from whom the own shares of the Company were acquired during the
period from 14.6.2005 until 23.5.2006 in the process of the share buy back programme which was initiated following
the decision of the Ordinary General Shareholders Meeting of 31.5.2005.
Shareholders who wish to participate in the Annual Ordinary Shareholders’ Meeting, according to the Law and the
Company’s Codified Memorandum and Articles of Association, must block their shares, through the User of their Securities
Account at the Dematerialised Securities System (S.A.T) or the Central Securities Depository, and deposit the relevant
receipt together with the legal documentation, at least 5 days prior to the date of the Ordinary Shareholders’ Meeting.
Maroussi, April14th, 2006.
THE BOARD OF DIRECTORS
appendix ■ 59

60 ■ appendix
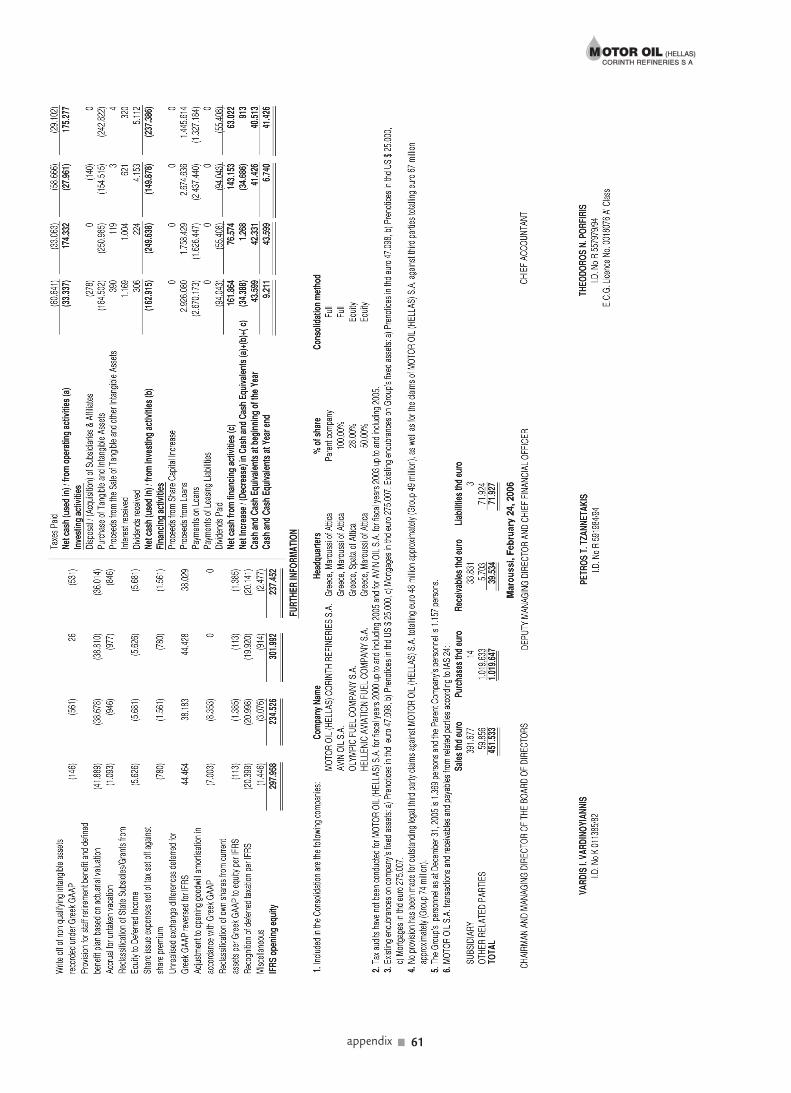
appendix ■ 61

Prefecture of Attica Registration Nr 1482/06/Β/86/26
Headquarters: Irodou Attikou 12Α – 151 24 Maroussi Attica
ANNUAL FINANCIAL STATEMENTS
IN ACCORDANCE WITH THE INTERNATIONAL FINANCIAL REPORTING STANDARDS
THAT HAVE BEEN ADOPTED BY THE EUROPEAN UNION
FOR THE YEAR 1 JANUARY – 31 DECEMBER 2005
FOR THE GROUP AND THE COMPANY
«MOTOR OIL (HELLAS) CORINTH REFINERIES S.A.»
62 ■ appendix

TABLE OF CONTENTS
Pages
1. Income Statement for the year ended 31 December 2005 64
2. Balance Sheet as at 31st December 2005. 65
3. Statement of Changes in Equity for the year ended 31 December 2005 66
4. Cash Flow Statement for the year ended 31 December 2005 67
5. Νotes to the Financial Statements for the year ended 31 December 2005 68-89
6. Opening Equity and Profit Reconciliation between Greek GAAP & IFRS 89-90
7. Auditors’ report 91
The financial statements of the Group and of the Company, set out on pages 64 to 90, were approved at the Board of
Directors’ Meeting dated Friday February 24, 2006 and are subject to the approval of the Annual Ordinary General Meeting
of Company Shareholders.
THE CHAIRMAN OF THE BOARD THE DEPUTY MANAGING DIRECTOR THE CHIEF ACCOUNTANT
OF DIRECTORS AND AND CHIEF FINANCIAL OFFICER
MANAGING DIRECTOR
VARDIS I. VARDINOYANNIS PETROS T. TZANNETAKIS THEODOROS N. PORFIRIS
appendix ■ 63

MOTOR OIL (HELLAS)
CORINTH REFINERIES S.A.
Income Statement for the year ended 31 December 2005
In 000’ Euros Note GROUP COMPANY1.1.2005- 1.1.2004- 1.1.2005- 1.1.2004-
31.12.2005 31.12.2004 31.12.2005 31.12.2004
Continuing Operations
Revenue 4 3,237,376 2,219,042 2,923,769 1,937,191
Cost of Sales (2,952,147) (2,003,219) (2,682,623) (1,762,742)____________ ____________ ____________ ____________
Gross profit 285,229 215,823 241,146 174,449
Distribution expenses (44,097) (42,299) (12,801) (12,618)
Administrative expenses (22,672) (22,609) (14,805) (15,163)
Other operating income/expenses 6 (14,112) 23,339 (17,322) 20,394____________ ____________ ____________ ____________
Profit from operations 7 204,348 174,254 196,218 167,062
Investment income 8 1,474 2,172 4,773 6,351
Share of profits in associates 16 166 232 0 0
Finance costs 9 (14,631) (8,817) (12,461) (6,727)____________ ____________ ____________ ____________
Profit before taxes 191,357 167,841 188,530 166,686
Income tax 10 (59,722) (50,289) (57,843) (48,026)____________ ____________ ____________ ____________
Profit after taxes attributable to
shareholders of the parent company 131,635 117,552 130,687 118,660____________ ____________ ____________ ________________________ ____________ ____________ ____________
Earnings per share (in Euro) 12 1.19 1.06 1.18 1.07
The notes on pages 68-89 are an integral part of these Financial Statements.
64 ■ appendix
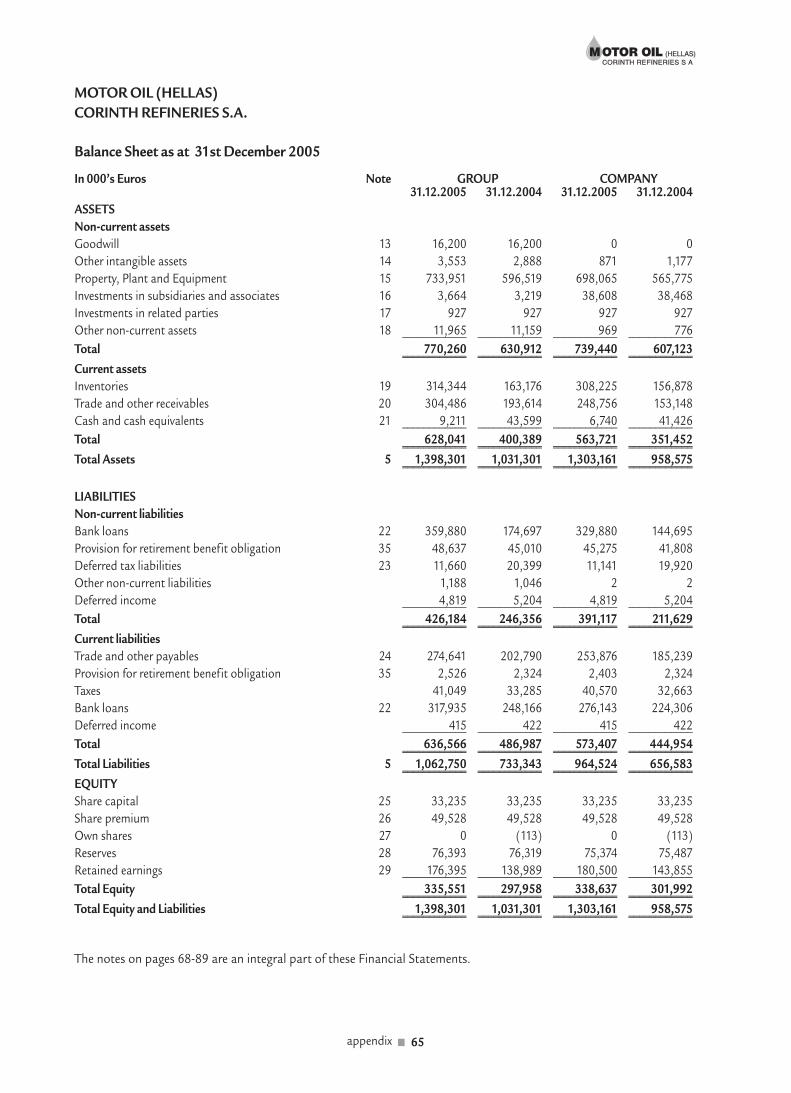
MOTOR OIL (HELLAS)
CORINTH REFINERIES S.A.
Balance Sheet as at 31st December 2005
In 000’s Euros Note GROUP COMPANY31.12.2005 31.12.2004 31.12.2005 31.12.2004
ASSETS
Non-current assets
Goodwill 13 16,200 16,200 0 0
Other intangible assets 14 3,553 2,888 871 1,177
Property, Plant and Equipment 15 733,951 596,519 698,065 565,775
Investments in subsidiaries and associates 16 3,664 3,219 38,608 38,468
Investments in related parties 17 927 927 927 927
Other non-current assets 18 11,965 11,159 969 776____________ ____________ ____________ ____________
Total 770,260 630,912 739,440 607,123____________ ____________ ____________ ________________________ ____________ ____________ ____________
Current assets
Inventories 19 314,344 163,176 308,225 156,878
Trade and other receivables 20 304,486 193,614 248,756 153,148
Cash and cash equivalents 21 9,211 43,599 6,740 41,426____________ ____________ ____________ ____________
Total 628,041 400,389 563,721 351,452____________ ____________ ____________ ________________________ ____________ ____________ ____________
Total Assets 5 1,398,301 1,031,301 1,303,161 958,575____________ ____________ ____________ ________________________ ____________ ____________ ____________
LIABILITIES
Non-current liabilities
Bank loans 22 359,880 174,697 329,880 144,695
Provision for retirement benefit obligation 35 48,637 45,010 45,275 41,808
Deferred tax liabilities 23 11,660 20,399 11,141 19,920
Other non-current liabilities 1,188 1,046 2 2
Deferred income 4,819 5,204 4,819 5,204____________ ____________ ____________ ____________
Total 426,184 246,356 391,117 211,629____________ ____________ ____________ ________________________ ____________ ____________ ____________
Current liabilities
Trade and other payables 24 274,641 202,790 253,876 185,239
Provision for retirement benefit obligation 35 2,526 2,324 2,403 2,324
Taxes 41,049 33,285 40,570 32,663
Bank loans 22 317,935 248,166 276,143 224,306
Deferred income 415 422 415 422____________ ____________ ____________ ____________
Total 636,566 486,987 573,407 444,954____________ ____________ ____________ ________________________ ____________ ____________ ____________
Total Liabilities 5 1,062,750 733,343 964,524 656,583____________ ____________ ____________ ________________________ ____________ ____________ ____________
EQUITY
Share capital 25 33,235 33,235 33,235 33,235
Share premium 26 49,528 49,528 49,528 49,528
Own shares 27 0 (113) 0 (113)
Reserves 28 76,393 76,319 75,374 75,487
Retained earnings 29 176,395 138,989 180,500 143,855____________ ____________ ____________ ____________
Total Equity 335,551 297,958 338,637 301,992____________ ____________ ____________ ________________________ ____________ ____________ ____________
Total Equity and Liabilities 1,398,301 1,031,301 1,303,161 958,575____________ ____________ ____________ ________________________ ____________ ____________ ____________
The notes on pages 68-89 are an integral part of these Financial Statements.
appendix ■ 65

MOTOR OIL (HELLAS)
CORINTH REFINERIES S.A.
Statement of Changes in Equity for the year ended 31 December 2005
GROUP Share Share Own RetainedIn 000’s Euros capital premium Reserves Shares earnings Total
Balance as at 1 January 2004 33,235 49,528 67,369 (1,385) 85,779 234,526
Profit for the year 117,552 117,552
Dividends (55,391) (55,391)
Own shares sales 1,272 1,272
Other movements - - 8,950 - (8,951) (1)____________ ____________ ____________ ____________ ____________ ____________
Balance as at 31 December 2004 33,235 49,528 76,319 (113) 138,989 297,958____________ ____________ ____________ ____________ ____________ ________________________ ____________ ____________ ____________ ____________ ____________
Profit for the year 131,635 131,635
Dividends (94,155) (94,155)
Own shares sales 113 113
Other movements - - 74 (74) 0____________ ____________ ____________ ____________ ____________ ____________
Balance as at 31 December 2005 33,235 49,528 76,393 0 176,395 335,551____________ ____________ ____________ ____________ ____________ ________________________ ____________ ____________ ____________ ____________ ____________
COMPANY Share Share Own RetainedIn 000’s Euros capital premium Reserves Shares earnings Total
Balance as at 1 January 2004 33,235 49,528 66,758 (1,385) 89,316 237,452
Profit for the year 118,660 118,660
Dividends (55,391) (55,391)
Own shares sales 1,272 1,272
Other movements - - 8,729 - (8,730) (1)____________ ____________ ____________ ____________ ____________ ____________
Balance as at 31 December 2004 33,235 49,528 75,487 (113) 143,855 301,992____________ ____________ ____________ ____________ ____________ ________________________ ____________ ____________ ____________ ____________ ____________
Profit for the year 130,687 130,687
Dividends (94,155) (94,155)
Own shares sales 113 113
Other movements - - (113) - 113 0____________ ____________ ____________ ____________ ____________ ____________
Balance as at 31 December 2005 33,235 49,528 75,374 0 180,500 338,637____________ ____________ ____________ ____________ ____________ ________________________ ____________ ____________ ____________ ____________ ____________
The notes on pages 68-89 are an integral part of these Financial Statements.
66 ■ appendix
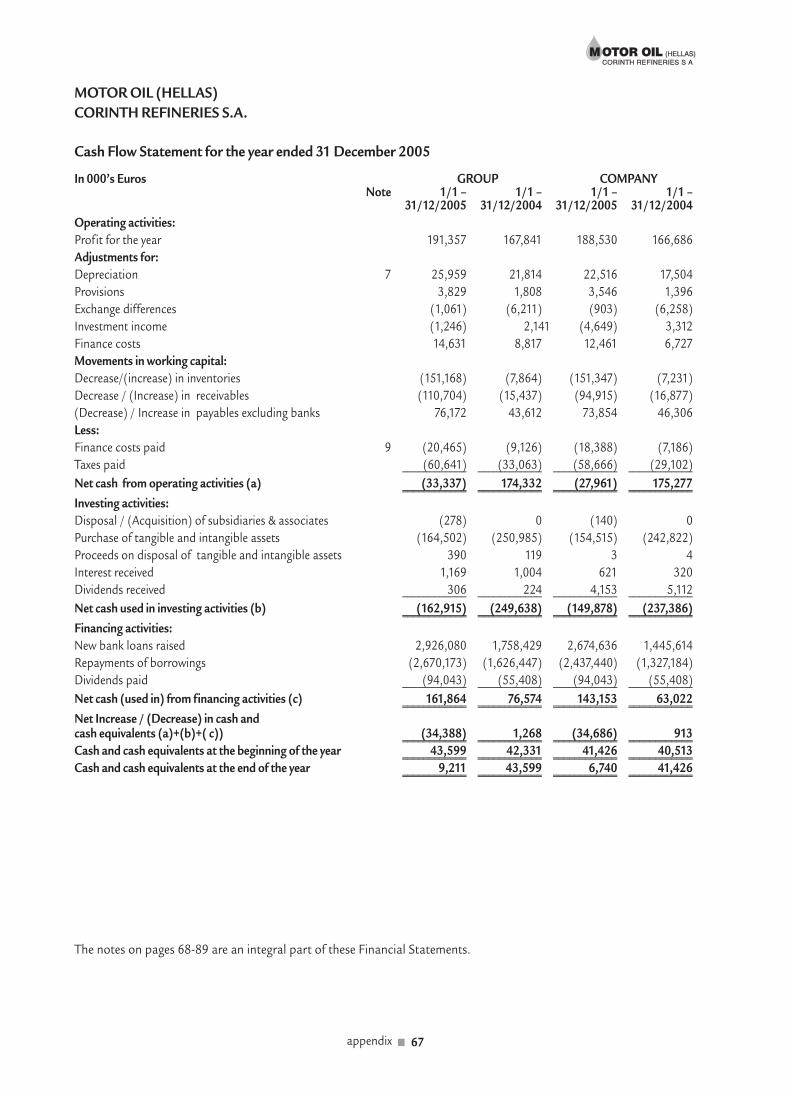
MOTOR OIL (HELLAS)
CORINTH REFINERIES S.A.
Cash Flow Statement for the year ended 31 December 2005
In 000’s Euros GROUP COMPANYNote 1/1 – 1/1 – 1/1 – 1/1 –
31/12/2005 31/12/2004 31/12/2005 31/12/2004
Operating activities:
Profit for the year 191,357 167,841 188,530 166,686
Adjustments for:
Depreciation 7 25,959 21,814 22,516 17,504
Provisions 3,829 1,808 3,546 1,396
Exchange differences (1,061) (6,211) (903) (6,258)
Investment income (1,246) 2,141 (4,649) 3,312
Finance costs 14,631 8,817 12,461 6,727
Movements in working capital:
Decrease/(increase) in inventories (151,168) (7,864) (151,347) (7,231)
Decrease / (Increase) in receivables (110,704) (15,437) (94,915) (16,877)
(Decrease) / Increase in payables excluding banks 76,172 43,612 73,854 46,306
Less:
Finance costs paid 9 (20,465) (9,126) (18,388) (7,186)
Taxes paid (60,641) (33,063) (58,666) (29,102)____________ ____________ ____________ ____________
Net cash from operating activities (a) (33,337) 174,332 (27,961) 175,277____________ ____________ ____________ ________________________ ____________ ____________ ____________
Investing activities:
Disposal / (Acquisition) of subsidiaries & associates (278) 0 (140) 0
Purchase of tangible and intangible assets (164,502) (250,985) (154,515) (242,822)
Proceeds on disposal of tangible and intangible assets 390 119 3 4
Interest received 1,169 1,004 621 320
Dividends received 306 224 4,153 5,112____________ ____________ ____________ ____________
Net cash used in investing activities (b) (162,915) (249,638) (149,878) (237,386)____________ ____________ ____________ ________________________ ____________ ____________ ____________
Financing activities:
New bank loans raised 2,926,080 1,758,429 2,674,636 1,445,614
Repayments of borrowings (2,670,173) (1,626,447) (2,437,440) (1,327,184)
Dividends paid (94,043) (55,408) (94,043) (55,408)____________ ____________ ____________ ____________
Net cash (used in) from financing activities (c) 161,864 76,574 143,153 63,022____________ ____________ ____________ ________________________ ____________ ____________ ____________
Net Increase / (Decrease) in cash and cash equivalents (a)+(b)+( c)) (34,388) 1,268 (34,686) 913____________ ____________ ____________ ________________________ ____________ ____________ ____________Cash and cash equivalents at the beginning of the year 43,599 42,331 41,426 40,513____________ ____________ ____________ ________________________ ____________ ____________ ____________Cash and cash equivalents at the end of the year 9,211 43,599 6,740 41,426____________ ____________ ____________ ________________________ ____________ ____________ ____________
The notes on pages 68-89 are an integral part of these Financial Statements.
appendix ■ 67

ΝOTES TO THE FINANCIAL STATEMENTS FOR THE YEAR ENDED 31 DECEMBER 2005
1. GENERAL INFORMATION
The parent company of the MOTOR OIL Group (the Group) is the entity under the trade name "Motor Oil (Hellas) Corinth
Refineries S.A." (the Company), which is registered in Greece as an incorporated firm (Societe Anonyme) according to
the provisions of CL 2190/1920, with headquarters in Maroussi of Attica, 12Α Irodou Attikou street, Athens 151 24. The
Company operates in the oil sector with its main activities being oil refining and oil products trading.
Major shareholders of the Company are "Petroventure Holdings Ltd" and "Petroshares Ltd", holding 51% and 16.4% of
Company shares respectively. It is noted that during 2005 "Aramco Overseas Company BV", effective subsidiary of "Saudi
Aramco" group, sold its share of 16.4% in "Motor Oil (Hellas) S.A"
These financial statements are presented in Euro because that is the currency of the primary economic environment in
which the Group operates. Foreign operations do not exist.
As at December 31st, 2005 the personnel headcount for the Group and the Company, totaled 1,369 and 1,157 persons
respectively. (2004: Group: 1,384 persons, Company: 1,175 persons)
2. TRANSITION TO INTERNATIONAL FINANCIAL REPORTING STANDARDS (IFRS)
The f inancial statements have been prepared for the f irst time in accordance with International Financial Reporting
Standards("IFRS") issued by the International Accounting Standards Board ("IASB") as well as the relevant Interpretations
issued by the International Financial Reporting Interpretations Committee ("IFRIC") which are applicable to the Group’s
activities and are valid for the periods commencing 1 January 2005 and have been adopted by the European Union
Commission. Information required by IFRS 1 in relation to the transition from the Greek GAAP, previously applied according
to CL 2190/1920 and the General Greek Chart of Accounts, to IFRS as adopted by the European Union and introduced
to Greece under L 3229/2004 are provided from page 89 to page 90 of this set of financial statements.
The most recent financial statements prepared in accordance with Greek GAAP related to the year ended December 31,
2004. The date of transition to IFRS was January 1st, 2004.
3. SIGNIFICANT ACCOUNTING POLICIES
Basis of Accounting
The financial statements have been prepared in accordance with International Financial Reporting Standards
(IFRSs) for the first year.
The financial statements have been prepared on the historical cost basis, except for land and buildings which are stated
at deemed cost as allowed by IFRS1. The principal accounting policies adopted are set out below:
Basis of Consolidation
The consolidated financial statements incorporate the financial statements of the Company and entities controlled by
the Company (its subsidiaries) at the end of each respective period. Control is achieved where the Company has the power
to govern the financial and operating policies of an investee entity so as to obtain benefits from its activities.
On acquisition, the assets and liabilities and contingent liabilities of a subsidiary are measured at their fair values at the
date of acquisition. Any excess of the cost of acquisition over the fair values of the identif iable net assets acquired is
recognized as goodwill. Any deficiency of the cost of acquisition below the fair values of the identifiable net assets acquired
(i.e. discount on acquisition) is credited to profit and loss in the period of acquisition.
The accounting policies of the subsidiary used for are in line with those used by the Group.
All intra-group transactions, balances, income and expenses are eliminated on consolidation.
68 ■ appendix

Investments in Associates
An associate is an entity over which the Group is in a position to exercise significant influence, but not control or joint
control, through participation in the financial and operating policy decisions of the investee.
The results, assets and liabilities of associates are incorporated in these financial statements using the equity method of
accounting. Investments in associates are carried in the balance sheet at cost as adjusted by post-acquisition changes in
the Group’s share of the net assets of the associate, less any impairment in the value of individual investments. Losses of
the associates in excess of the Group’s interest in those associates are not recognized.
Profits or losses arising on transactions among associates and companies included in the consolidated accounts are
eliminated to the extent of the Group’s share in the associates. Losses may be an indication of impairment of the asset, in
which case a relevant provision is accounted for.
Investments in subsidiaries and associates are stated in the Companies stand alone Balance Sheets at cost.
Goodwill
Goodwill arising on the acquisition of a subsidiary or a jointly controlled entity represents the excess of the cost of acquisition
over the Group’s interest in the net fair value of the identifiable assets, liabilities and contingent liabilities of the subsidiary
or jointly controlled entity recognized at the date of acquisition. Goodwill is initially recognized as an asset at cost and is
subsequently measured at cost less any accumulated impairment losses.
For the purpose of impairment testing, goodwill is allocated to each of the Group’s cash-generating units expected to
benefit from the synergies of the combination. Cash-generating units to which goodwill has been allocated are tested for
impairment annually, or more frequently when there is an indication that the unit may be impaired. If the recoverable
amount of the cash-generating unit is less than the carrying amount of the unit, the impairment loss is allocated first to
reduce the carrying amount of any goodwill allocated to the unit and then to the other assets of the unit pro-rata on the
basis of the carrying amount of each asset in the unit. An impairment loss recognized for goodwill is not reversed in a
subsequent period.
On disposal of a subsidiary or a jointly controlled entity, the attributable amount of goodwill is included in the determination
of the profit or loss on disposal.
Revenue Recognition
Revenue is measured at the fair value of the consideration received or receivable and represents amounts receivable for
goods and services provided in the normal course of business, net of discounts, VAT and sales related taxes.
Sales of goods are recognized when goods are delivered and ownership has passed.
Interest income is accrued on a time basis, by reference to the principal outstanding and at the effective interest rate
applicable, which is the rate that exactly discounts estimated future cash receipts through the expected life of the financial
asset to that asset’s net carrying amount.
Dividend income from investments is recognized when the shareholders’ rights to receive payment have been established.
The Group as lessor
Rental income from operating leases is recognised on a straight-line basis over the term of the relevant lease. Initial direct
costs incurred in negotiating and arranging an operating lease are added to the carrying amount of the leased asset and
recognised on a straight-line basis over the lease term.
AVIN OIL S.A., a subsidiary of Motor Oil (Hellas), leases under long-term operating leases (approx. 10 years), immovable
property for use as gas stations, which in turn are subleased to physical/legal persons for a corresponding period for the
operation of fuel and lubricants stations under the "Avin" trademark.
appendix ■ 69

The Group as lessee
Assets held under finance leases are recognised as assets of the Group at their fair value at the inception of the lease or, if
lower, at the present value of the minimum lease payments. The corresponding liability to the lessor is included in the
balance sheet as a finance lease obligation.
Lease payments are apportioned between finance charges and reduction of the lease obligation so as to achieve a constant
rate of interest on the remaining balance of the liability. Finance charges are charged to profit or loss, unless they are
directly attributable to qualifying assets, in which case they are capitalised in accordance with the Group’s general policy
on borrowing costs (see below).
Rentals payable under operating leases are charged to profit or loss on a straight-line basis over the term of the relevant
lease. Benefits received and receivable as an incentive to enter into an operating lease are also spread on a straight-line
basis over the lease term.
Foreign Currencies
The individual financial statements of each group entity are presented in the currency of the primary economic environment
in which the entity operates (its functional currency). For the purpose of the consolidated financial statements, the results
and financial position of each entity are expressed in Currency Units, which is the functional currency of the Company,
and the presentation currency for the consolidated financial statements.
In preparing the financial statements of the individual entities, transactions in currencies other than the entity’s functional
currency (foreign currencies) are recorded at the rates of exchange prevailing on the dates of the transactions. At each
balance sheet date, monetary items denominated in foreign currencies are retranslated at the rates prevailing on the
balance sheet date.
Exchange differences arising on the settlement of monetary items, and on the retranslation of monetary items, are included
in profit or loss for the period.
Borrowing Costs
Borrowing costs directly attributable to the acquisition, construction or production of qualifying assets, which are assets
that necessarily take a substantial period of time to get ready for their intended use or sale, are added to the cost of those
assets, until such time as the assets are substantially ready for their intended use or sale. Investment income earned on the
temporary investment of specific borrowings pending their expenditure on qualifying assets is deducted from the borrowing
costs eligible for capitalization.
All other borrowing costs are recognized in profit or loss in the period in which they are incurred.
Government Grants
Government grants towards staff re-training costs are recognized as income over the periods necessary to match them
with the related costs and are deducted from the related expense.
Government grants relating to property, plant and equipment are treated as deferred income and released to profit and
loss over the expected useful lives of the assets concerned.
Retirement Benefit Costs
Payments to defined contribution retirement plans are charged as an expense as they fall due. Payments made to state-
managed retirement benefit schemes are dealt with as payments to defined contribution plans where the Group’s obligations
under the plans are equivalent to those arising in a defined contribution retirement benefit plan.
For defined benefit retirement benefit plans, the cost of providing benefits is determined using the Projected Unit Credit
70 ■ appendix
Method, with actuarial valuations being carried out at each balance sheet date. Actuarial gains and losses are recognized
in profit or loss in the period in which they are incurred.
Past service cost is recognized immediately in the profit or loss to the extent that the benefits are already vested, and
otherwise is amortized on a straight-line basis over the average period until the benefits become vested.
The retirement benefit obligation recognized in the balance sheet represents the present value of the defined benefit
obligation as reduced by the fair value of plan assets.
Taxation
The tax expense represents the sum of the current tax payable and deferred tax, reduced by any discount obtained for
paying previous year taxes in one lump sum.
The current tax payable is based on taxable profit for the year. Taxable profit differs from net profit as reported in the
income statement because it excludes items of income or expense that are taxable or deductible in other periods and it
further excludes items that are never taxable or deductible. The Group’s liability for current tax is calculated using tax rates
that have been enacted or substantively enacted by the balance sheet date.
Deferred tax is recognized on differences, between the carrying amounts of assets and liabilities in the financial statements
and the corresponding tax bases used in the computation of taxable profit, and is accounted for using the balance sheet
liability method. Deferred tax liabilities are generally recognized for all taxable temporary differences and deferred tax
assets are recognized to the extent that it is probable that taxable profits will be available against which deductible temporary
differences can be utilized. Such assets and liabilities are not recognized if the temporary difference arises from goodwill
or from the initial recognition (other than in a business combination) of other assets and liabilities in a transaction that
affects neither the tax profit nor the accounting profit.
Deferred tax liabilities are recognized for taxable temporary differences arising on investments in subsidiaries and associates,
and interests in joint ventures, except where the Group is able to control the reversal of the temporary difference and it is
probable that the temporary difference will not reverse in the foreseeable future.
The carrying amount of deferred tax assets is reviewed at each balance sheet date and reduced to the extent that it is no
longer probable that sufficient taxable profits will be available to allow all or part of the asset to be recovered.
Deferred tax is calculated at the tax rates that are expected to apply in the period when the liability is settled or the asset
is realized. Deferred tax is charged or credited in the income statement, except when it relates to items charged or credited
directly to equity, in which case the deferred tax is also dealt with in equity.
Deferred tax assets and liabilities are offset when there is a legally enforceable right to set off current tax assets against
current tax liabilities and when they relate to income taxes levied by the same taxation authority and the Group intends
to settle its current tax assets and liabilities on a net basis.
Property, Plant and Equipment
Land and buildings held for use in the production or supply of goods or services, or for administrative purposes, are stated
in the balance sheet at their cost amounts less any subsequent accumulated depreciation.
Properties in the course of construction for production, rental or administrative purposes, or for purposes not yet determined,
are carried at cost, less any recognized impairment loss. Cost includes professional fees and, for qualifying assets, borrowing
costs capitalized in accordance with the Group’s accounting policy.
Depreciation of these assets, on the same basis as other property assets, commences when the assets are ready for their
intended use.
Fixtures and equipment are stated at cost less accumulated depreciation and any recognized impairment loss.
appendix ■ 71

Fixed assets under finance leases are depreciated over the same useful lives as the Group owned fixed assets.
Depreciation is charged so as to write off the cost or valuation of assets, other than land and properties under construction,
over their estimated useful lives, using the straight-line method, on the following bases:
FIXED ASSETS CATEGORY USEFUL LIVES (YRS)
Land Indefinite
Buildings 40
Plant & machinery 7-30
Transportation equipment 15-20
Fixtures and equipment 4-20
The gain or loss arising on the disposal or retirement of an asset is determined as the difference between the sales proceeds
and the carrying amount of the asset and is recognized in profit or loss.
It is noted that, in making the transition to International Financial Reporting Standards (IFRS), the Group elected for land
and for buildings to use as deemed cost the historic cost as adjusted by Greek law revaluations, and historic cost for all
other fixed assets. Depreciation was provided based on the assets’ useful lives from the date of acquisition or construction
Internally-generated Intangible Assets - Research and Development Expenditure
Expenditure on research activities is recognized as an expense in the period in which it is incurred.
An internally-generated intangible asset arising from the Group’s development is recognized only if all of the following
conditions are met:
■ an asset is created that can be identified (such as software and new processes);
■ it is probable that the asset created will generate future economic benefits; and
■ the development cost of the asset can be measured reliably.
Internally-generated intangible assets are amortized on a straight-line basis over their useful lives. Where no internally-
generated intangible asset can be recognized, development expenditure is recognized as an expense in the period in which
it is incurred.
Other intangible assets
Other Intangible Assets include the Group’s software as well as rights to operate gas stations on property leased by its
subsidiary, Avin Oil.
These assets are initially recorded at acquisition cost and then depreciated based on expected useful lives in respect of
software, and in respect of Avin Oil’s leasing rights, over the period the Company is entitled to the rights.
The useful life of these assets is noted bellow:
INTANGIBLE ASSETS YEARS
Software 3 – 8
Leasing Rights (average) 9
Impairment of tangible and intangible assets excluding goodwill
At each balance sheet date, the Group reviews the carrying amounts of its tangible and intangible assets to determine
whether there is any indication that those assets have suffered an impairment loss. If any such indication exists, the
recoverable amount of the asset is estimated in order to determine the extent of the impairment loss (if any). Where the
asset does not generate cash flows that are independent from other assets, the Group estimates the recoverable amount
of the cash-generating unit to which the asset belongs.
72 ■ appendix

Recoverable amount is the higher of fair value less costs to sell and value in use. In assessing value in use, the estimated
future cash flows are discounted to their present value using a pre-tax discount rate that reflects current market assessments
of the time value of money and the risks specific to the asset.
If the recoverable amount of an asset (or cash-generating unit) is estimated to be less than its carrying amount, the carrying
amount of the asset (cash-generating unit) is reduced to its recoverable amount. An impairment loss is recognized as an
expense immediately, unless the relevant asset is carried at a revalued amount, in which case the impairment loss is treated
as a revaluation decrease.
Where an impairment loss subsequently reverses, the carrying amount of the asset (cash-generating unit) is increased to
the revised estimate of its recoverable amount, but so that the increased carrying amount does not exceed the carrying
amount that would have been determined had no impairment loss been recognized for the asset (cash-generating unit)
in prior years. A reversal of an impairment loss is recognized as income immediately, unless the relevant asset is carried at
a revalued amount, in which case the reversal of the impairment loss is treated as a revaluation increase.
Inventories
Inventories are stated at the lower of cost and net realizable value. Cost comprise direct materials and where applicable,
direct labor costs and those overheads that have been incurred in bringing the inventories to their present location and
condition. Cost is calculated using the weighted average method. Net realizable value represents the estimated selling price
less all estimated costs of completion and costs to be incurred in marketing, selling and distribution.
Financial Instruments
Financial assets and financial liabilities are recognized on the Group’s balance sheet when the Group becomes a party to
the contractual provisions of the instrument.
Trade receivables
Trade receivables are interest free and are stated at their nominal value as reduced by appropriate allowances for estimated
irrecoverable amounts.
Cash and cash equivalents
Cash and cash equivalents comprise cash on hand and demand deposits.
Bank borrowings
Interest-bearing bank loans and overdrafts are recorded according to the amounts received, net of direct issue costs.
Finance charges, including premiums payable on settlement or redemption and direct issue costs, are accounted for on
an accrual basis to the profit and loss account using effective interest method and are added to the carrying amount of
the instrument to the extent that they are not settled in the period in which they arise.
Trade payables
Trade payables are interest free and are stated at their nominal value.
Provisions
Provisions are recognized when the Group has a present obligation as a result of a past event, and it is probable that the
Group will be required to settle that obligation. Provisions are measured at the Group management’s best estimate of the
expenditure required to settle the obligation at the balance sheet date, and are discounted to present value where the
effect is material.
appendix ■ 73

Provisions for restructuring costs, if any, are recognized only when the entity has developed a detailed formal plan for the
restructuring and have announced details of plan to the involved parties.
Main sources of uncertainty in accounting estimations.
The major sources of uncertainty in accounting estimations by the Group’s management, concern mainly the legal cases
and the financial periods not audited by the tax authorities, as described in detail in note 31.
For the legal claims by third parties against the Group and the legal claims by the Group against third parties, the Group
according to its policy does not make any provision until the final court decision.
The relevant accounting treatment applicable to the years not audited by the tax authorities, is stated in note 31.
4. REVENUE
An analysis of the revenue, is as follows:
GROUP COMPANYIn 000’s Euros 1/1 – 31/12/05 1/1 – 31/12/04 1/1 – 31/12/05 1/1 – 31/12/04
Sales of goods 3,237,376 2,219,042 2,923,769 1,937,191
The following table provides an analysis of the sales by geographical market (domestic – export) and by category of goods
sold (products – merchandise).
GROUP (In 000’s Euros) 1/1 – 31/12/05 1/1 – 31/12/04SALES DOMESTIC EXPORT TOTAL DOMESTIC EXPORT TOTAL
Products 827,388 1,181,274 2,008,662 678,248 805,007 1,483,255
Merchandise 755,479 473,235 1,228,714 462,654 273,133 735,787
TOTAL 1,582,867 1,654,509 3,237,376 1,140,902 1,078,140 2,219,042
COMPANY (In 000’s Euros) 1/1 – 31/12/05 1/1 – 31/12/04SALES DOMESTIC EXPORT TOTAL DOMESTIC EXPORT TOTAL
Products 827,388 1,181,274 2,008,662 678,248 805,007 1,483,255
Merchandise 479,548 435,559 915,107 212,382 241,554 453,936
TOTAL 1,306,936 1,616,833 2,923,769 890,630 1,046,561 1,937,191
5. BUSINESS AND GEOGRAPHICAL SEGMENTS
The Group’s basic activities are oil refining and oil product trading.
All of the Group’s activities take place in Greece, given that all Group Companies included in the consolidation have their
headquarters in Greece and no branches abroad.
All operational segments fall under one of two distinct activity categories: Refinery’s Activities and "Sales to Gas Stations".
Segment information is presented in the table below.
74 ■ appendix

Income Statement
In 000’s Euros 01.01-31.12.2005 01.01-31.12.2004Business Refinery’s Sales to Gas Eliminations Total Refinery’s Sales to Gas Eliminations TotalOperations Activities Stations Activities Stations
External sales 2,532,106 705,270 0 3,237,376 1,640,972 578,070 0 2,219,042
Inter-segment sales 391,663 14 (391,677) 0 296,219 3 (296,222) 0
Total revenue 2,923,769 705,284 (391,677) 3,237,376 1,937,191 578,073 (296,222) 2,219,042
Cost of Sales (2,682,623) (661,492) 391,968 (2,952,147) (1,762,742) (536,404) 295,927 (2,003,219)
Gross profit 241,146 43,792 291 285,229 174,449 41,669 (295) 215,823
Distribution costs (12,801) (32,326) 1,030 (44,097) (12,618) (30,689) 1,008 (42,299)
Administrative expenses (14,805) (7,906) 39 (22,672) (15,163) (7,482) 36 (22,609)
Other operating income/expense(17,322) 4,275 (1,065) (14,112) 20,394 3,999 (1,054) 23,339
Segment result from operations 196,218 7,835 295 204,348 167,062 7,497 (305) 174,254
Investment revenues 4,773 (701) (2,432) 1,640 6,351 821 (4,768) 2,404
Finance cost (12,461) (2,171) 1 (14,631) (6,727) (2,088) (2) (8,817)
Profit before tax 188,530 4,963 (2,136) 191,357 166,686 6,230 (5,075) 167,841
Other Information
Capital additions 154,515 9,987 164,502 242,822 8,163 250,985
Depreciation/amortization 22,516 3,443 25,959 17,504 4,310 21,814
Balance Sheet
Assets
Segment assets(except investments) 1,263,626 148,035 (17,951) 1,393,710 919,180 115,795 (7,820) 1,027,155
Subsidiaries & Associates 38,608 910 (35,854) 3,664 38,468 910 (36,159) 3,219
Related Parties 927 1,042 (1,042) 927 927 904 (904) 927
Total assets 1,303,161 149,987 (54,847) 1,398,301 958,575 117,609 (44,883) 1,031,301
Total liabilities 964,524 132,153 (33,927) 1,062,750 656,583 100,166 (23,406) 733,343
Sales to foreign customers representing more than 10% of foreign sales concern sales to U.S.A amounting to € 339,003
thousand for 2005 (2004: € 209,743 thousand).
6. OTHER OPERATING INCOME / (EXPENSES)
In 000’s Euros GROUP COMPANY1/1 – 31/12/05 1/1 – 31/12/04 1/1 – 31/12/05 1/1 – 31/12/04
Foreign exchange -(losses) (60,089) (29,240) (59,497) (28,531)
Foreign exchange -gains 35,876 42,378 35,046 41,670
Service Income 6,687 6,750 6,687 6,750
Rental Income 3,568 3,162 0 0
Other Income/(Expenses) (154) 289 442 505
Total (14,112) 23,339 (17,322) 20,394
appendix ■ 75

7. PROFIT FROM OPERATIONS
The Group and the Company profits from operation have been arrived at after charging/(crediting):
In 000’s Euros GROUP COMPANY1/1 – 31/12/05 1/1 – 31/12/04 1/1 – 31/12/05 1/1 – 31/12/04
Foreign exchange losses/(gains) 24,213 (13,138) 24,451 (13,139)
Amortization of intangible assets 566 732 414 437
Depreciation of property, plant and equipment 25,393 21,082 22,102 17,067
Total depreciation/amortization 25,959 21,814 22,516 17,504
Government grants amortization (415) (422) (415) (422)
Cost of Sales 2,947,918 1,998,389 2,678,394 1,757,912
Impairment of inventories 4,229 4,830 4,229 4,830
Staff costs 86,560 76,938 76,159 66,837
8. INVESTMENT INCOME
Income from investments, is as follows:
In 000’s Euros GROUP COMPANY1/1 – 31/12/05 1/1 – 31/12/04 1/1 – 31/12/05 1/1 – 31/12/04
Interest on bank deposits 1,096 1,004 548 320
Dividends received 306 224 4,153 5,112
Other investment income 72 159 72 159
Income from Sale of Own Shares 0 785 0 760
TOTAL INVESTMENT INCOME 1,474 2,172 4,773 6,351
9. FINANCE COSTS
In 000’s Euros GROUP COMPANY1/1 – 31/12/05 1/1 – 31/12/04 1/1 – 31/12/05 1/1 – 31/12/04
Interest on bank loans & related expenses 22,075 8,817 19,905 6,727
Less: amounts included in the cost of qualifying assets (7,444) 0 (7,444) 0
TOTAL FINANCE COST 14,631 8,817 12,461 6,727
Borrowing costs included in the cost of qualifying assets incurred during the year from borrowings acquired exclusively to
finance the refinery’s new hydrocracker unit, an investment which will significantly improve the Company’s capacity to
produce high-specification fuels.
10. INCOME TAX EXPENSES
In 000’s Euros GROUP COMPANY1/1 – 31/12/05 1/1 – 31/12/04 1/1 – 31/12/05 1/1 – 31/12/04
Corporation tax for the current year 69,354 51,484 67,515 48,992
Tax audit differences from prior years 0 150 0 0
Less: Income tax discount (893) (746) (893) (746)
68,461 50,888 66,622 48,246
Deferred tax (note 23) (8,739) (599) (8,779) (220)
Total 59,722 50,289 57,843 48,026
Domestic income tax is calculated at 32% on the estimated tax assessable profit for the year 2005 (2004:35%).
76 ■ appendix

The Group’s and the Company’s total income tax rate for the year can be reconciled to the accounting profit as follows:
In 000’s Euros GROUP COMPANY1/1 – 31/12/05 1/1 – 31/12/04 1/1 – 31/12/05 1/1 – 31/12/04
Tax at the domestic income tax rate 32.0% 35.0% 32.0% 35.0%
Tax effects from:
Tax audit differences 0.0% 0.1% 0.0% 0.0%
Tax effect of non tax deductible expenses 0.1% 0.2% 0.1% 0.2%
Tax effect of tax free income -0.1% -2.1% -0.7% -3.3%
Effect of change in income tax rate -0.3% -2.6% -0.3% -2.6%
Income tax discount -0.5% -0.5% -0.5% -0.4%
Effective tax rate for the year 31.2% 30.0% 30.7% 28.8%
11. DIVIDENDS
Dividends to shareholders are proposed by the management at each year end and are subject to approval by the Annual
General Assembly Meeting. Dividends relating to the previous year (1.1-31.12.2004) amounted to € 0.85 per share, of
which an interim dividend of € 0.20 per share was paid in December 2004 and accounted for in 2004, and € 0.65 has
been accounted for in 2005. The Management of the Company has proposed to the coming Annual General Assembly
Meeting the distribution of total dividends for 2005 of € 121,861,278 (or € 1.10 per share). It is noted that an interim
dividend of € 0.20 for 2005 has been paid in December 2005 and has been accounted for within 2005, while the remaining
€ 0.90 per share will be accounted for in 2006.
It is noted that in accordance with Greek Tax legislation, the taxable income is taxed at source fulfilling all tax obligations
on dividends. Thus the dividends payable to the shareholders (individuals and legal entities) are paid net of any tax.
12. EARNINGS PER SHARE
The calculation of the basic earnings per share attributable to the ordinary equity holders of the Company is based on the
following data:
In 000’s Euros GROUP COMPANY1/1 – 31/12/05 1/1 – 31/12/04 1/1 – 31/12/05 1/1 – 31/12/04
Earnings 131,635 117,552 130,687 118,660
Weighted average number of ordinary shares for the purposes of basic earnings per share 110,715,732 110,776,573 110,715,732 110,776,573
Earnings per share in € 1.19 1.06 1.18 1.07
13. GOODWILL
There was no change in Goodwill of the Group for the years ended December 31, 2005 and December 31, 2004 amounting
to € 16,200 thousand. This Goodwill pertains to the acquisition of the subsidiary company Αvin Oil AVENEP, which has
shown high profitability during all years in which it is owned by the Group. Furthermore the Group performs on an annual
basis impairment testing on Goodwill from which no need for impairment has arisen.
appendix ■ 77
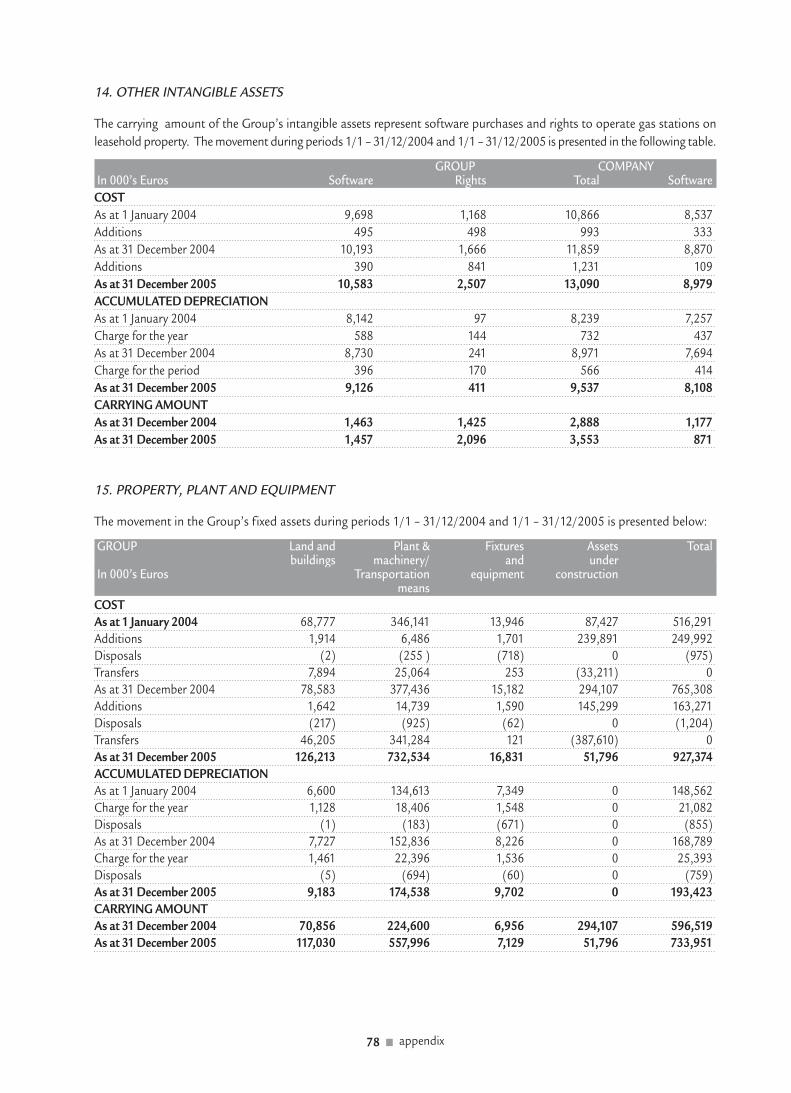
14. OTHER INTANGIBLE ASSETS
The carrying amount of the Group’s intangible assets represent software purchases and rights to operate gas stations on
leasehold property. The movement during periods 1/1 – 31/12/2004 and 1/1 – 31/12/2005 is presented in the following table.
GROUP COMPANYIn 000’s Euros Software Rights Total Software
COST
As at 1 January 2004 9,698 1,168 10,866 8,537
Additions 495 498 993 333
As at 31 December 2004 10,193 1,666 11,859 8,870
Additions 390 841 1,231 109
As at 31 December 2005 10,583 2,507 13,090 8,979
ACCUMULATED DEPRECIATION
As at 1 January 2004 8,142 97 8,239 7,257
Charge for the year 588 144 732 437
As at 31 December 2004 8,730 241 8,971 7,694
Charge for the period 396 170 566 414
As at 31 December 2005 9,126 411 9,537 8,108
CARRYING AMOUNT
As at 31 December 2004 1,463 1,425 2,888 1,177
As at 31 December 2005 1,457 2,096 3,553 871
15. PROPERTY, PLANT AND EQUIPMENT
The movement in the Group’s fixed assets during periods 1/1 – 31/12/2004 and 1/1 – 31/12/2005 is presented below:
GROUP Land and Plant & Fixtures Assets Totalbuildings machinery/ and under
In 000’s Euros Transportation equipment constructionmeans
COST
As at 1 January 2004 68,777 346,141 13,946 87,427 516,291
Additions 1,914 6,486 1,701 239,891 249,992
Disposals (2) (255 ) (718) 0 (975)
Transfers 7,894 25,064 253 (33,211) 0
As at 31 December 2004 78,583 377,436 15,182 294,107 765,308
Additions 1,642 14,739 1,590 145,299 163,271
Disposals (217) (925) (62) 0 (1,204)
Transfers 46,205 341,284 121 (387,610) 0
As at 31 December 2005 126,213 732,534 16,831 51,796 927,374
ACCUMULATED DEPRECIATION
As at 1 January 2004 6,600 134,613 7,349 0 148,562
Charge for the year 1,128 18,406 1,548 0 21,082
Disposals (1) (183) (671) 0 (855)
As at 31 December 2004 7,727 152,836 8,226 0 168,789
Charge for the year 1,461 22,396 1,536 0 25,393
Disposals (5) (694) (60) 0 (759)
As at 31 December 2005 9,183 174,538 9,702 0 193,423
CARRYING AMOUNT
As at 31 December 2004 70,856 224,600 6,956 294,107 596,519
As at 31 December 2005 117,030 557,996 7,129 51,796 733,951
78 ■ appendix

The movement in the Company’s fixed assets during periods 1/1 – 31/12/2004 and 1/1 – 31/12/2005 is presented below.
COMPANY Land and Plant & Fixtures Assets Totalbuildings machinery/ and under
In 000’s Euros Transportation equipment constructionmeans
COSTAs at 1 January 2004 58,504 316,637 11,209 87,386 473,736Additions 349 927 1,384 239,829 242,489Disposals 0 (25) (628) 0 (653)Transfers 7,894 25,064 253 (33,211) 0As at 31 December 2004 66,747 342,603 12,218 294,004 715,572Additions 636 8,060 1,423 144,287 154,406Disposals 0 (14) (19) 0 (33)Transfers 45,752 341,724 134 (387,610) 0As at 31 December 2005 113,135 692,373 13,756 50,681 869,945ACCUMULATED DEPRECIATIONAs at 1 January 2004 4,764 122,316 6,293 0 133,373Charge for the year 815 15,050 1,202 0 17,067Disposals 0 (15) (628) 0 (643)As at 31 December 2004 5,579 137,351 6,867 0 149,797Charge for the year 1,107 19,703 1,292 0 22,102Disposals 0 0 (19) 0 (19)As at 31 December 2005 6,686 157,054 8,140 0 171,880CARRYING AMOUNTAs at 31 December 2004 61,168 205,252 5,351 294,004 565,775As at 31 December 2005 106,449 535,319 5,616 50,681 698,065
Within the cost of Plant & machinery/Transportation means an amount of € 7,327 thousand is included for 2005 as
capitalized borrowing costs. (2004: € 1,083 thousand)
The Company and, consequently, the Group has mortgaged land and buildings as security for bank loans granted to the
Group, an analysis of which is presented below.
BANK PRENOTICES MORTGAGES000’s € 000’s $ 000’s €
N.B.G 47,098 25,000 6
CITIBANK INTERNATIONAL PLC 0 0 275,001
TOTAL 47,098 25,000 275,007
16. INVESTMENTS IN SUBSIDIARIES AND ASSOCIATES
Details of the Group’s subsidiaries and related parties, are as follows:
Name Place of Propotion Principalincorporation of ownership activityand operation interest
AVIN OIL Greece, Maroussi of Attika 100% Petroleum ProductsOLYMPIC FUEL COMPANY S.A. Greece, Spata of Attika 28% Aviation Fueling SystemsHELLENIC AVIATION FUEL COMPANY S.A. Greece, Maroussi of Attika 50% Aviation Fueling SystemsCORINTH POWER S.A. Greece, Maroussi of Attika 100% Energy AVIN ALBANIA S.A. Tirana, Albania 100% Petroleum Products
appendix ■ 79
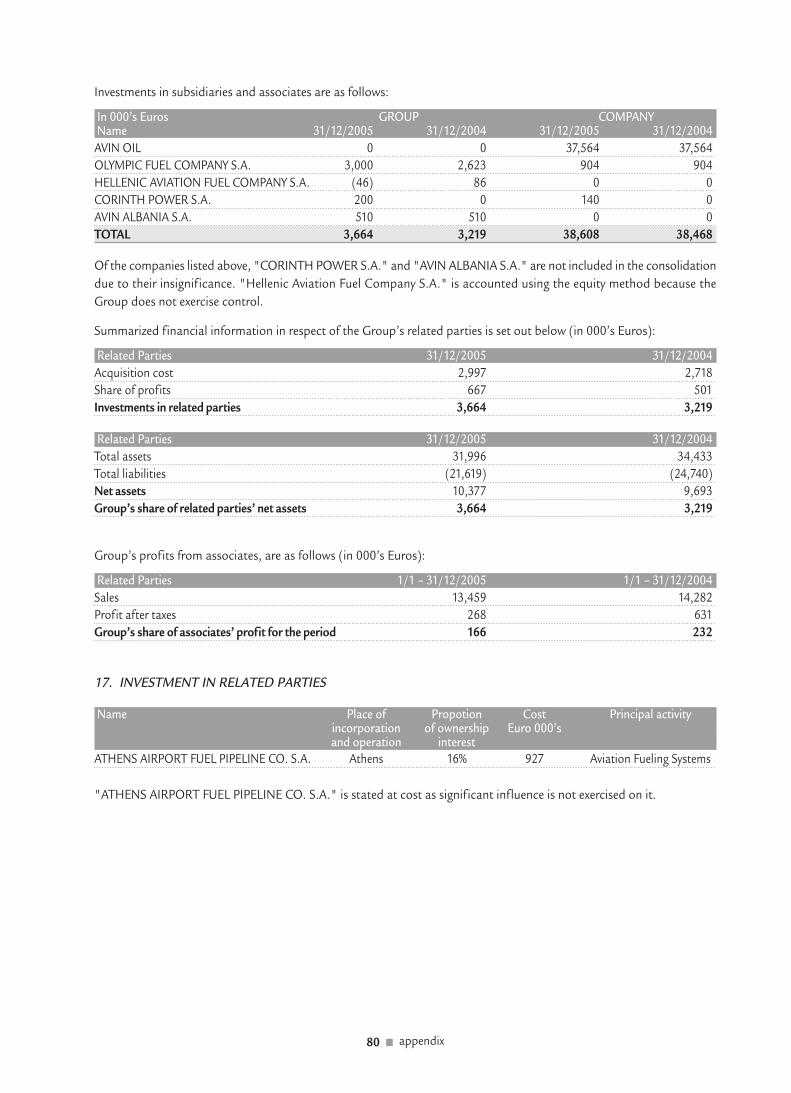
Investments in subsidiaries and associates are as follows:
In 000’s Euros GROUP COMPANYName 31/12/2005 31/12/2004 31/12/2005 31/12/2004
AVIN OIL 0 0 37,564 37,564
OLYMPIC FUEL COMPANY S.A. 3,000 2,623 904 904
HELLENIC AVIATION FUEL COMPANY S.A. (46) 86 0 0
CORINTH POWER S.A. 200 0 140 0
AVIN ALBANIA S.A. 510 510 0 0
TOTAL 3,664 3,219 38,608 38,468
Of the companies listed above, "CORINTH POWER S.A." and "AVIN ALBANIA S.A." are not included in the consolidation
due to their insignif icance. "Hellenic Aviation Fuel Company S.A." is accounted using the equity method because the
Group does not exercise control.
Summarized financial information in respect of the Group’s related parties is set out below (in 000’s Euros):
Related Parties 31/12/2005 31/12/2004
Acquisition cost 2,997 2,718
Share of profits 667 501
Investments in related parties 3,664 3,219
Related Parties 31/12/2005 31/12/2004
Total assets 31,996 34,433
Total liabilities (21,619) (24,740)
Net assets 10,377 9,693
Group’s share of related parties’ net assets 3,664 3,219
Group’s profits from associates, are as follows (in 000’s Euros):
Related Parties 1/1 – 31/12/2005 1/1 – 31/12/2004
Sales 13,459 14,282
Profit after taxes 268 631
Group’s share of associates’ profit for the period 166 232
17. INVESTMENT IN RELATED PARTIES
Name Place of Propotion Cost Principal activityincorporation of ownership Euro 000’sand operation interest
ATHENS AIRPORT FUEL PIPELINE CO. S.A. Athens 16% 927 Aviation Fueling Systems
"ATHENS AIRPORT FUEL PIPELINE CO. S.A." is stated at cost as significant influence is not exercised on it.
80 ■ appendix
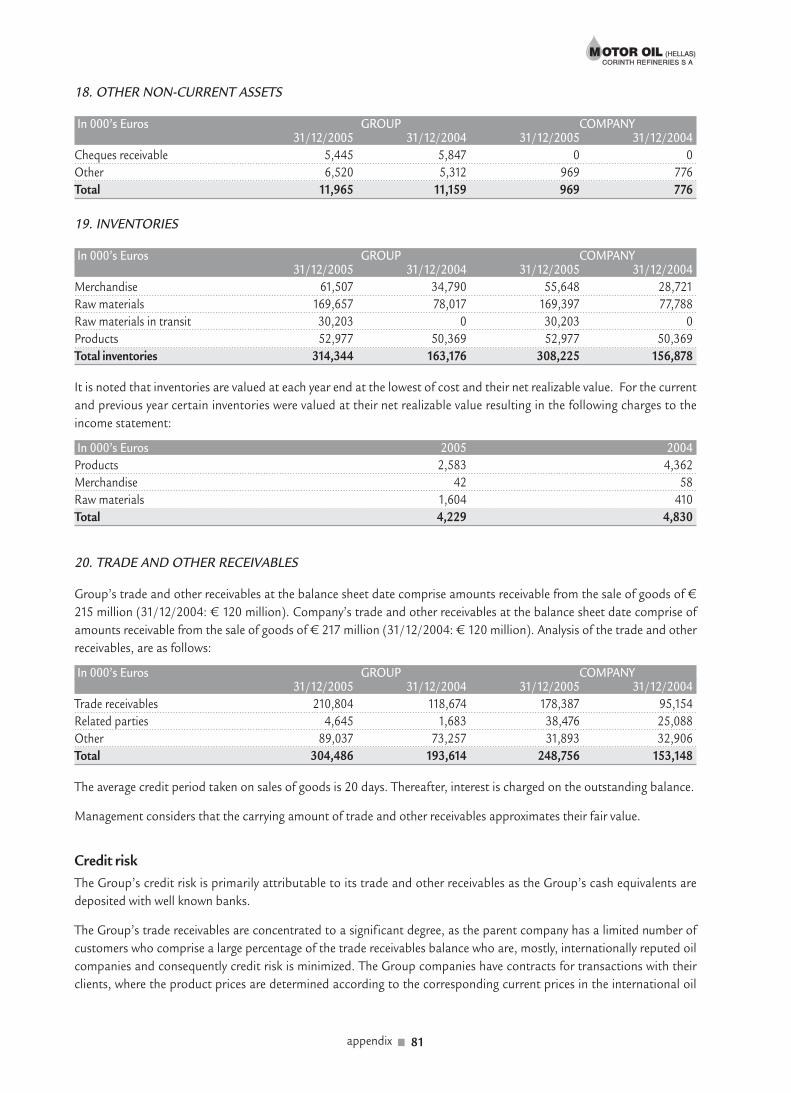
appendix ■ 81
18. OTHER NON-CURRENT ASSETS
In 000’s Euros GROUP COMPANY31/12/2005 31/12/2004 31/12/2005 31/12/2004
Cheques receivable 5,445 5,847 0 0
Other 6,520 5,312 969 776
Total 11,965 11,159 969 776
19. INVENTORIES
In 000’s Euros GROUP COMPANY31/12/2005 31/12/2004 31/12/2005 31/12/2004
Merchandise 61,507 34,790 55,648 28,721
Raw materials 169,657 78,017 169,397 77,788
Raw materials in transit 30,203 0 30,203 0
Products 52,977 50,369 52,977 50,369
Total inventories 314,344 163,176 308,225 156,878
It is noted that inventories are valued at each year end at the lowest of cost and their net realizable value. For the current
and previous year certain inventories were valued at their net realizable value resulting in the following charges to the
income statement:
In 000’s Euros 2005 2004
Products 2,583 4,362
Merchandise 42 58
Raw materials 1,604 410
Total 4,229 4,830
20. TRADE AND OTHER RECEIVABLES
Group’s trade and other receivables at the balance sheet date comprise amounts receivable from the sale of goods of €
215 million (31/12/2004: € 120 million). Company’s trade and other receivables at the balance sheet date comprise of
amounts receivable from the sale of goods of € 217 million (31/12/2004: € 120 million). Analysis of the trade and other
receivables, are as follows:
In 000’s Euros GROUP COMPANY31/12/2005 31/12/2004 31/12/2005 31/12/2004
Trade receivables 210,804 118,674 178,387 95,154
Related parties 4,645 1,683 38,476 25,088
Other 89,037 73,257 31,893 32,906
Total 304,486 193,614 248,756 153,148
The average credit period taken on sales of goods is 20 days. Thereafter, interest is charged on the outstanding balance.
Management considers that the carrying amount of trade and other receivables approximates their fair value.
Credit risk
The Group’s credit risk is primarily attributable to its trade and other receivables as the Group’s cash equivalents are
deposited with well known banks.
The Group’s trade receivables are concentrated to a significant degree, as the parent company has a limited number of
customers who comprise a large percentage of the trade receivables balance who are, mostly, internationally reputed oil
companies and consequently credit risk is minimized. The Group companies have contracts for transactions with their
clients, where the product prices are determined according to the corresponding current prices in the international oil

market during the period of transactions. In addition the parent company as a policy, receives letters of guarantee from
its clients in order to secure its receivables. As far as receivables by "Avin Oil" are concerned these are spread in a wide
number of customers and in this way there is no material concentration and material credit risk.
21. CASH AND CASH EQUIVALENTS
Cash and cash equivalents consist from cash and short term deposits of initial duration of three months or less. The book
value for cash and cash equivalents approximates their fair value.
22. BANK LOANS
In 000’s Euros GROUP COMPANY31/12/2005 31/12/2004 31/12/2005 31/12/2004
Bank loans 680,087 424,766 608,295 370,904
Less: Bond loan expenses* (2,272) (1,903) (2,272) (1,903)
Total loans 677,815 422,863 606,023 369,001
The borrowings are repayable as follows:
On demand or within one year 317,935 248,166 276,143 224,306
In the second year 30,000 30,098 30,000 30,098
From the third to fifth years inclusive 247,152 120,002 217,152 90,000
After five years 85,000 26,500 85,000 26,500
Less: Bond loan expenses* (2,272) (1,903) (2,272) (1,903)
Total loans 677,815 422,863 606,023 369,001
Less: Amount payable within 12 months (shown under current liabilities) 317,935 248,166 276,143 224,306
Amount payable after 12 months 359,880 174,697 329,880 144,695
*The amounts of bank loans included in the financial statements are reduced by the expenses of the Company’s bond
loan, acquired exclusively to finance the refinery’s new hydrocracker unit (€ 2,272 thousand on 31/12/2005 and € 1,903
thousand on 31/12/2004). Those amounts will be charged to expenses after the investment’s completion, in proportion
to the number of years remaining to loan maturity.
Analysis of borrowings by currency on 31/12/05:
In 000’s Euros GROUP COMPANY31/12/2005 31/12/2004 31/12/2005 31/12/2004
Loan’s currency
EURO 421,889 229,656 350,098 175,794
U.S DOLLARS 166,993 110,124 166,992 110,124
SWISS FRANC 91,205 84,986 91,205 84,986
Total 680,087 424,766 608,295 370,904
The Group’s management considers that the carrying amount of the Group’s borrowings approximates their fair value.
The Group has the following bank loans:
i) Motor Oil has been granted a loan amounting to € 250,000 thousand. The loan was drawn down in five instalments,
starting on 31/8/2004 and ending on 2/6/2005. The loan is repayable in semi-annual instalments commencing on
31/12/2005 and the last instalment is due on 30/6/2011. The loan’s balance at the end of the year is € 235,000 thousand.
The loan is secured with mortgages registered on specific assets of the Group amounting to € 275,000 thousand.
Other loans totalling €127,151 thousand consist of long-term loans, granted on 22/12/2005 and shall be repaid by
19/12/2010. Short-term loans totalling € 246,143 thousand shall be repaid within one year.
There are outstanding mortgages and pledges against these loans as mentioned above in note number 15.
82 ■ appendix

ii) Avin Oil has been granted a loan of € 30 million granted on 14/6/2004 which is fully repayable on 14/6/2008. The
Company’s other loans are all short-term, totalling to € 41,792 thousand and shall be repaid within one year.
The interest rate of the above loans is LIBOR/EURIBOR+SPREAD.
23. DEFERRED TAX
The following are the major deferred tax liabilities and assets recognized by the Group and the Company, and the movements
thereon, during the current and prior reporting periods.
GROUP Income Incomestatement statement
In 000’s Euros 1/1/2004 expense/ 31/12/2004 expense/ 31/12/2005(income) (income)
Deferred tax arising from:
Difference in depreciation 24,659 (4,547) 20,112 2,272 22,384
Items not qualifying as assets (743) 332 (411) 292 (119)
Gain from exchange differences 13,364 865 14,229 (13,919) 310
Retirement benefit obligations (15,094) 3,182 (11,912) (350) (12,262)
Capitalised borrowing cost 0 0 0 1,883 1,883
Other differences between tax and accounting basis (1,188) (431) (1,619) 1,083 (536)
Total 20,998 (599) 20,399 (8,739) 11,660
COMPANY Income Incomestatement statement
In 000’s Euros 1/1/2004 expense/ 31/12/2004 expense/ 31/12/2005(income) (income)
Deferred tax arising from:
Difference in depreciation 22,833 (4,065) 18,768 2,330 21,098
Items not qualifying as assets (732) 369 (363) 307 (56)
Gain from exchange differences 13,310 907 14,217 (13,953) 264
Retirement benefit obligations (14,118) 3,006 (11,112) (279) (11,391)
Capitalised borrowing cost 0 0 0 1,883 1,883
Other differences between tax and accounting basis (1,153) (437) (1,590) 933 (657)
Total 20,140 (220) 19,920 (8,779) 11,141
Certain deferred tax assets and liabilities have been offset. Deferred taxes are analyzed as follows:
In 000’s Euros GROUP COMPANY31/12/2005 31/12/2004 31/12/2005 31/12/2004
Deferred tax liabilities 24,577 34,341 23,245 32,985
Deferred tax assets (12,917) (13,942) (12,104) (13,065)
TOTAL 11,660 20,399 11,141 19,920
appendix ■ 83

24. TRADE AND OTHER PAYABLE
Trade and other payables mainly comprise amounts outstanding for trade purchases and operating expenses.
The major raw material for the Group’s production of oil products is crude oil.
The average credit period received for trade purchases is approximately 30 days.
The Company’s management considers that the carrying amount of trade payables approximates their fair value. Analysis
of the trade and other payables, are as follows (excluding banks):
In 000’s Euros GROUP COMPANY31/12/2005 31/12/2004 31/12/2005 31/12/2004
Trade payable 190,330 130,214 173,880 116,644
Current liabilities of the related parties 71,685 59,588 71,688 59,590
Other 12,626 12,988 8,308 9,005
Total 274,641 202,790 253,876 185,239
25. SHARE CAPITAL
In 000’s Euros 31/12/2005 31/12/2004
Authorized, issued and fully paid: 33,235 33,235
(110,782,980 ordinary shares of € 0.30 each)
The Company has one class of ordinary registered shares which bear no right to fixed income.
Please see note number 27 concerning the Company’s own shares.
As far as the weighted number of shares for the period is concerned, please see note number 12.
26. SHARE PREMIUM ACCOUNT
In 000’s Euros 31/12/2005 31/12/2004
Opening and closing balance for the period 49,528 49,528
27. OWN SHARES
In 000’s Euros 31/12/2005 31/12/2004
Opening balance of the period 113 1,385
Acquired in the period 0 113
Sold during the period (113) (1,385)
Closing balance of the period 0 113
According to a decision by the Annual Ordinary Shareholders’ General Assembly Meeting of 31/5/2005, the Company
may purchase shares from 14/6/2005 to 23/5/2006 (1% of the total number of shares) up to 1,107,800 shares at a price
ranging between € 7 and € 17 per share.
84 ■ appendix
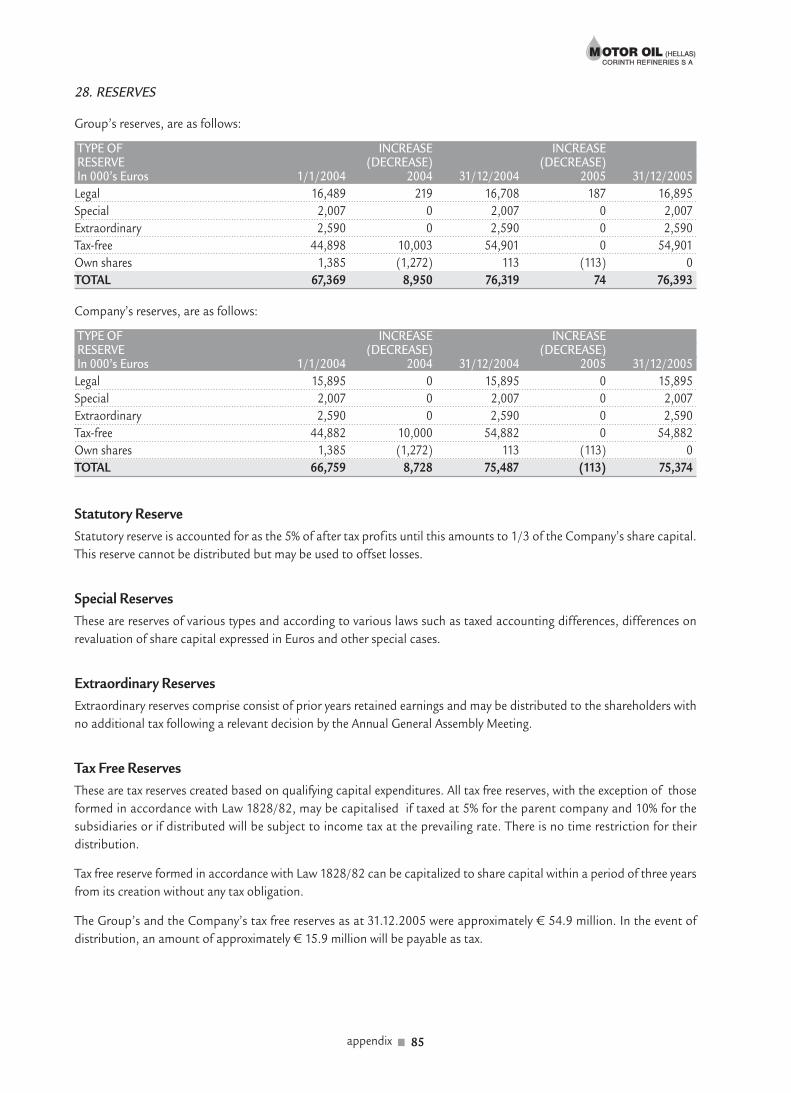
appendix ■ 85
28. RESERVES
Group’s reserves, are as follows:
TYPE OF INCREASE INCREASERESERVE (DECREASE) (DECREASE)In 000’s Euros 1/1/2004 2004 31/12/2004 2005 31/12/2005
Legal 16,489 219 16,708 187 16,895
Special 2,007 0 2,007 0 2,007
Extraordinary 2,590 0 2,590 0 2,590
Tax-free 44,898 10,003 54,901 0 54,901
Own shares 1,385 (1,272) 113 (113) 0
TOTAL 67,369 8,950 76,319 74 76,393
Company’s reserves, are as follows:
TYPE OF INCREASE INCREASERESERVE (DECREASE) (DECREASE)In 000’s Euros 1/1/2004 2004 31/12/2004 2005 31/12/2005
Legal 15,895 0 15,895 0 15,895
Special 2,007 0 2,007 0 2,007
Extraordinary 2,590 0 2,590 0 2,590
Tax-free 44,882 10,000 54,882 0 54,882
Own shares 1,385 (1,272) 113 (113) 0
TOTAL 66,759 8,728 75,487 (113) 75,374
Statutory Reserve
Statutory reserve is accounted for as the 5% of after tax profits until this amounts to 1/3 of the Company’s share capital.
This reserve cannot be distributed but may be used to offset losses.
Special Reserves
These are reserves of various types and according to various laws such as taxed accounting differences, differences on
revaluation of share capital expressed in Euros and other special cases.
Extraordinary Reserves
Extraordinary reserves comprise consist of prior years retained earnings and may be distributed to the shareholders with
no additional tax following a relevant decision by the Annual General Assembly Meeting.
Tax Free Reserves
These are tax reserves created based on qualifying capital expenditures. All tax free reserves, with the exception of those
formed in accordance with Law 1828/82, may be capitalised if taxed at 5% for the parent company and 10% for the
subsidiaries or if distributed will be subject to income tax at the prevailing rate. There is no time restriction for their
distribution.
Tax free reserve formed in accordance with Law 1828/82 can be capitalized to share capital within a period of three years
from its creation without any tax obligation.
The Group’s and the Company’s tax free reserves as at 31.12.2005 were approximately € 54.9 million. In the event of
distribution, an amount of approximately € 15.9 million will be payable as tax.
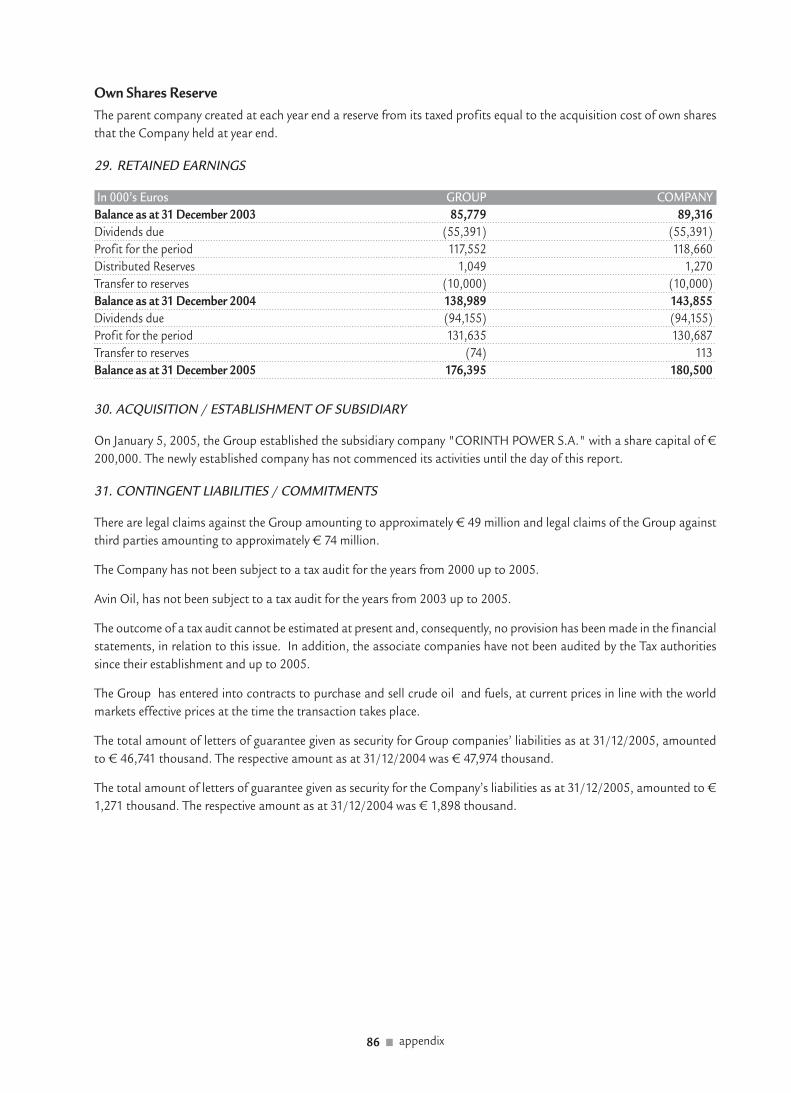
Own Shares Reserve
The parent company created at each year end a reserve from its taxed profits equal to the acquisition cost of own shares
that the Company held at year end.
29. RETAINED EARNINGS
In 000’s Euros GROUP COMPANY
Balance as at 31 December 2003 85,779 89,316
Dividends due (55,391) (55,391)
Profit for the period 117,552 118,660
Distributed Reserves 1,049 1,270
Transfer to reserves (10,000) (10,000)
Balance as at 31 December 2004 138,989 143,855
Dividends due (94,155) (94,155)
Profit for the period 131,635 130,687
Transfer to reserves (74) 113
Balance as at 31 December 2005 176,395 180,500
30. ACQUISITION / ESTABLISHMENT OF SUBSIDIARY
On January 5, 2005, the Group established the subsidiary company "CORINTH POWER S.A." with a share capital of €
200,000. The newly established company has not commenced its activities until the day of this report.
31. CONTINGENT LIABILITIES / COMMITMENTS
There are legal claims against the Group amounting to approximately € 49 million and legal claims of the Group against
third parties amounting to approximately € 74 million.
The Company has not been subject to a tax audit for the years from 2000 up to 2005.
Avin Oil, has not been subject to a tax audit for the years from 2003 up to 2005.
The outcome of a tax audit cannot be estimated at present and, consequently, no provision has been made in the financial
statements, in relation to this issue. In addition, the associate companies have not been audited by the Tax authorities
since their establishment and up to 2005.
The Group has entered into contracts to purchase and sell crude oil and fuels, at current prices in line with the world
markets effective prices at the time the transaction takes place.
The total amount of letters of guarantee given as security for Group companies’ liabilities as at 31/12/2005, amounted
to € 46,741 thousand. The respective amount as at 31/12/2004 was € 47,974 thousand.
The total amount of letters of guarantee given as security for the Company’s liabilities as at 31/12/2005, amounted to €
1,271 thousand. The respective amount as at 31/12/2004 was € 1,898 thousand.
86 ■ appendix
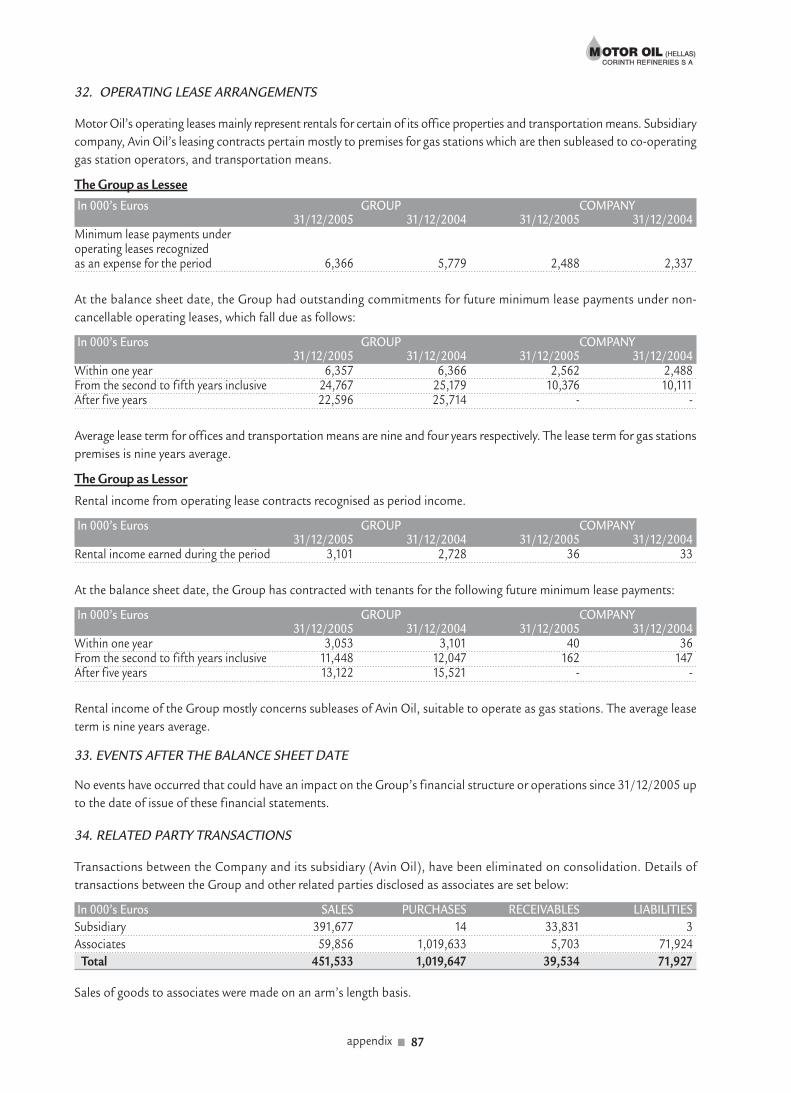
32. OPERATING LEASE ARRANGEMENTS
Motor Oil’s operating leases mainly represent rentals for certain of its office properties and transportation means. Subsidiary
company, Avin Oil’s leasing contracts pertain mostly to premises for gas stations which are then subleased to co-operating
gas station operators, and transportation means.
The Group as Lessee
In 000’s Euros GROUP COMPANY31/12/2005 31/12/2004 31/12/2005 31/12/2004
Minimum lease payments under operating leases recognized as an expense for the period 6,366 5,779 2,488 2,337
At the balance sheet date, the Group had outstanding commitments for future minimum lease payments under non-
cancellable operating leases, which fall due as follows:
In 000’s Euros GROUP COMPANY31/12/2005 31/12/2004 31/12/2005 31/12/2004
Within one year 6,357 6,366 2,562 2,488From the second to fifth years inclusive 24,767 25,179 10,376 10,111After five years 22,596 25,714 - -
Average lease term for offices and transportation means are nine and four years respectively. The lease term for gas stations
premises is nine years average.
The Group as Lessor
Rental income from operating lease contracts recognised as period income.
In 000’s Euros GROUP COMPANY31/12/2005 31/12/2004 31/12/2005 31/12/2004
Rental income earned during the period 3,101 2,728 36 33
At the balance sheet date, the Group has contracted with tenants for the following future minimum lease payments:
In 000’s Euros GROUP COMPANY31/12/2005 31/12/2004 31/12/2005 31/12/2004
Within one year 3,053 3,101 40 36From the second to fifth years inclusive 11,448 12,047 162 147After five years 13,122 15,521 - -
Rental income of the Group mostly concerns subleases of Avin Oil, suitable to operate as gas stations. The average lease
term is nine years average.
33. EVENTS AFTER THE BALANCE SHEET DATE
No events have occurred that could have an impact on the Group’s financial structure or operations since 31/12/2005 up
to the date of issue of these financial statements.
34. RELATED PARTY TRANSACTIONS
Transactions between the Company and its subsidiary (Avin Oil), have been eliminated on consolidation. Details of
transactions between the Group and other related parties disclosed as associates are set below:
In 000’s Euros SALES PURCHASES RECEIVABLES LIABILITIES
Subsidiary 391,677 14 33,831 3
Associates 59,856 1,019,633 5,703 71,924
Total 451,533 1,019,647 39,534 71,927
Sales of goods to associates were made on an arm’s length basis.
appendix ■ 87
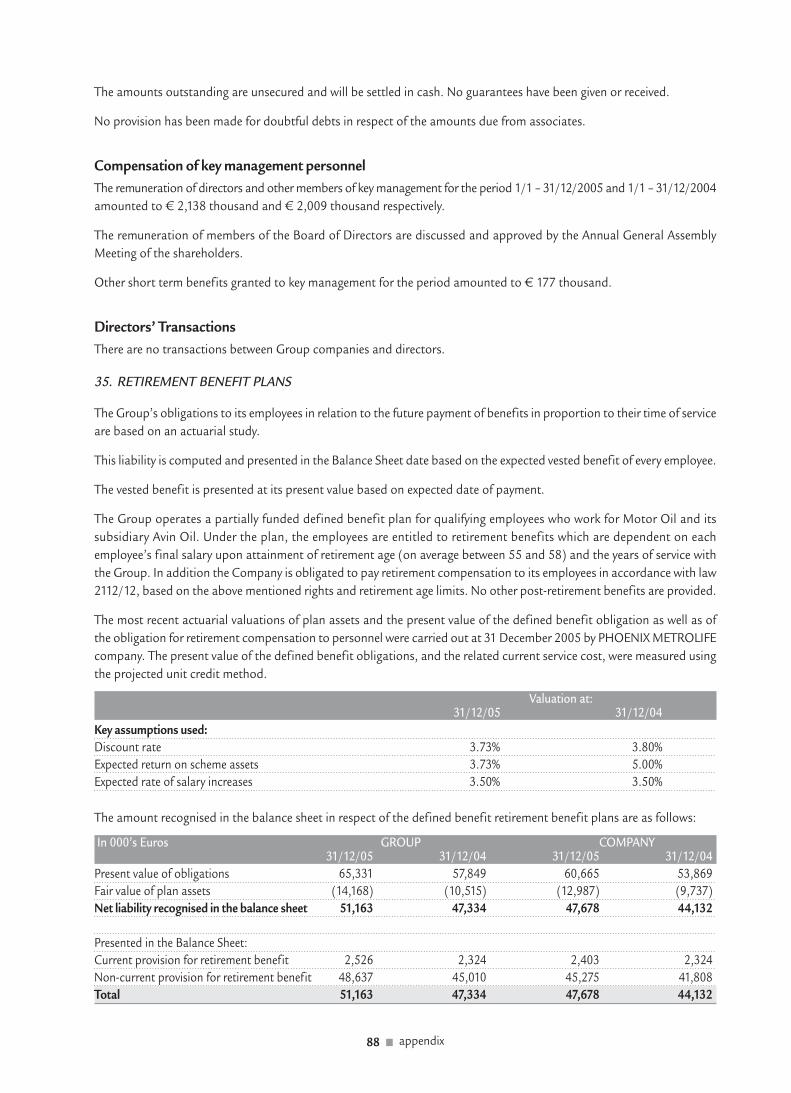
The amounts outstanding are unsecured and will be settled in cash. No guarantees have been given or received.
No provision has been made for doubtful debts in respect of the amounts due from associates.
Compensation of key management personnel
The remuneration of directors and other members of key management for the period 1/1 – 31/12/2005 and 1/1 – 31/12/2004
amounted to € 2,138 thousand and € 2,009 thousand respectively.
The remuneration of members of the Board of Directors are discussed and approved by the Annual General Assembly
Meeting of the shareholders.
Other short term benefits granted to key management for the period amounted to € 177 thousand.
Directors’ Transactions
There are no transactions between Group companies and directors.
35. RETIREMENT BENEFIT PLANS
The Group’s obligations to its employees in relation to the future payment of benefits in proportion to their time of service
are based on an actuarial study.
This liability is computed and presented in the Balance Sheet date based on the expected vested benefit of every employee.
The vested benefit is presented at its present value based on expected date of payment.
The Group operates a partially funded defined benefit plan for qualifying employees who work for Motor Oil and its
subsidiary Avin Oil. Under the plan, the employees are entitled to retirement benefits which are dependent on each
employee’s final salary upon attainment of retirement age (on average between 55 and 58) and the years of service with
the Group. In addition the Company is obligated to pay retirement compensation to its employees in accordance with law
2112/12, based on the above mentioned rights and retirement age limits. No other post-retirement benefits are provided.
The most recent actuarial valuations of plan assets and the present value of the defined benefit obligation as well as of
the obligation for retirement compensation to personnel were carried out at 31 December 2005 by PHOENIX METROLIFE
company. The present value of the defined benefit obligations, and the related current service cost, were measured using
the projected unit credit method.
Valuation at:31/12/05 31/12/04
Key assumptions used:
Discount rate 3.73% 3.80%
Expected return on scheme assets 3.73% 5.00%
Expected rate of salary increases 3.50% 3.50%
The amount recognised in the balance sheet in respect of the defined benefit retirement benefit plans are as follows:
In 000’s Euros GROUP COMPANY31/12/05 31/12/04 31/12/05 31/12/04
Present value of obligations 65,331 57,849 60,665 53,869
Fair value of plan assets (14,168) (10,515) (12,987) (9,737)
Net liability recognised in the balance sheet 51,163 47,334 47,678 44,132
Presented in the Balance Sheet:
Current provision for retirement benefit 2,526 2,324 2,403 2,324
Non-current provision for retirement benefit 48,637 45,010 45,275 41,808
Total 51,163 47,334 47,678 44,132
88 ■ appendix

Amounts recognised in the income statement in respect of these defined benefit schemes are as follows:
In 000’s Euros GROUP COMPANY31/12/05 31/12/04 31/12/05 31/12/04
Current service cost 4,973 3,068 4,538 2,802Interest cost 3,565 2,439 3,314 2,293Net expense recognised in the Income Statement 8,538 5,507 7,852 5,096
Movements in the present value of the defined benefit obligations in the current period are as follows:
In 000’s Euros GROUP COMPANY31/12/2005 31/12/2004 31/12/2005 31/12/2004
Defined benefit obligation 1/1/05 57,849 53,728 53,869 50,160Service cost 4,973 3,068 4,538 2,802Interest cost 3,565 2,439 3,314 2,293Benefits paid (1,056) (1,386) (1,056) (1,386)Defined benefit obligation 31/12/05 65,331 57,849 60,665 53,869
36. Opening Equity Reconciliation for the Group and the Company between Greek GAAP and IFRS as at 31/12/2004and 01/01/2004
In 000’s Euros GROUP COMPANY31.12.2004 01.01.2004 31.12.2004 01.01.2004
GREEK GAAP opening equity 179,559 169,618 177,373 165,819A. Adjustments according to the qualifications of the certified public accountantsActuarial valuation for statutory staff retirement benefit (30,371) (26,258) (28,935) (25,093)Provision for voluntary benefit plan based on actuarial valuation (11,518) (12,420) (9,875) (10,921)Bad debt provision 0 (1,653) 0 (1,653)Adjustment to opening goodwill amortization in accordance with Greek GAAP (7,003) (8,353) 0 0Total (A) (48,892) (48,684) (38,810) (37,667)
B. Adjustments due to differences between Greek GAAP and IFRSDividends approved after balance sheet date reversed for IFRS 72,009 33,235 72,009 33,235Adjustment as a result of depreciation being provided over estimated useful life for IFRS. 80,421 74,729 75,296 69,005Write off of non qualifying intangible assets recorded under Greek GAAP. (146) (561) 26 (531)Accrual for untaken vacation (1,093) (946) (977) (846)Reclassification of State Subsidies/Grants from Equity to Deferred Income and recalculation of its amortization according to the relative fixed assets useful life. (5,626) (5,681) (5,626) (5,681)Share issue expenses net of tax set off against share premium (780) (1,561) (780) (1,561)Unrealized exchange differences deferred for Greek GAAP reversed for IFRS. 44,464 38,183 44,428 38,029Reclassification of own shares from current assets per Greek GAAP to equity per IFRS (113) (1,385) (113) (1,385)Recognition of deferred taxation per IFRS (20,399) (20,998) (19,920) (20,141)Miscellaneous (1,446) (1,423) (914) (824)Total (B) 167,291 113,592 163,429 109,300
Total (A + B) 118,399 64,908 124,619 71,633
IFRS Equity 297,958 234,526 301,992 237,452
appendix ■ 89

36. Profits Reconciliation for the Group and the Company between Greek GAAP and IFRS for the Year 1/1/2004-
31/12/2004 In 000’s Euros GROUP COMPANY
In 000’s Euros GROUP COMPANYProfit Profit
GREEK GAAP opening equity 155,947 155,414
A. Adjustments according to the qualifications of the certified public accountants
Actuarial valuation for statutory staff retirement benefit (4,113) (3,842)
Provision for voluntary benefit plan based on actuarial valuation 902 1,046
Bad debt provision 1,653 1,653
Adjustment to opening goodwill amortization in accordance with Greek GAAP 1,350 -
Total (A) (208) (1,143)
B. Adjustments due to differences between Greek GAAP and IFRS
Dividends approved after balance sheet date reversed for IFRS - -
Adjustment as a result of depreciation being provided over estimated useful life for IFRS. 6,099 6,192
Write off of non qualifying intangible assets recorded under Greek GAAP. 16 156
Accrual for untaken vacation (147) (131)
Reclassification of State Subsidies/Grants from Equity to Deferred Income and recalculation of its amortization according to the relative fixed assets useful life. (252) (252)
Share issue expenses net of tax set off against share premium. 780 780
Unrealized exchange differences deferred for Greek GAAP reversed for IFRS. 6,282 6,399
Reclassification of own shares from current assets per Greek GAAP to equity per IFRS
Recognition of deferred taxation per IFRS 599 220
Income tax for the year (51,485) (48,992)
Depreciation on spare parts (40) (40)
Difference arising on adjusting inventories valuation method (80) (80)
Accounting for relating land acquisition cost expenses 30 30
Reverse of the depreciation of the borrowing cost for the Hydrocracker 400 400
Allocation of fixed assets depreciation to inventories 100 100
Provision for obsolete inventories
Goodwill on consolidation 67
Prior years tax differences (150)
Property Tax and B.O.D Fees (406) (393)
Total (B) (38,187) (35,512)
Total (A + B) (38,395) (36,755)
IFRS Equity 117,552 118,660
90 ■ appendix
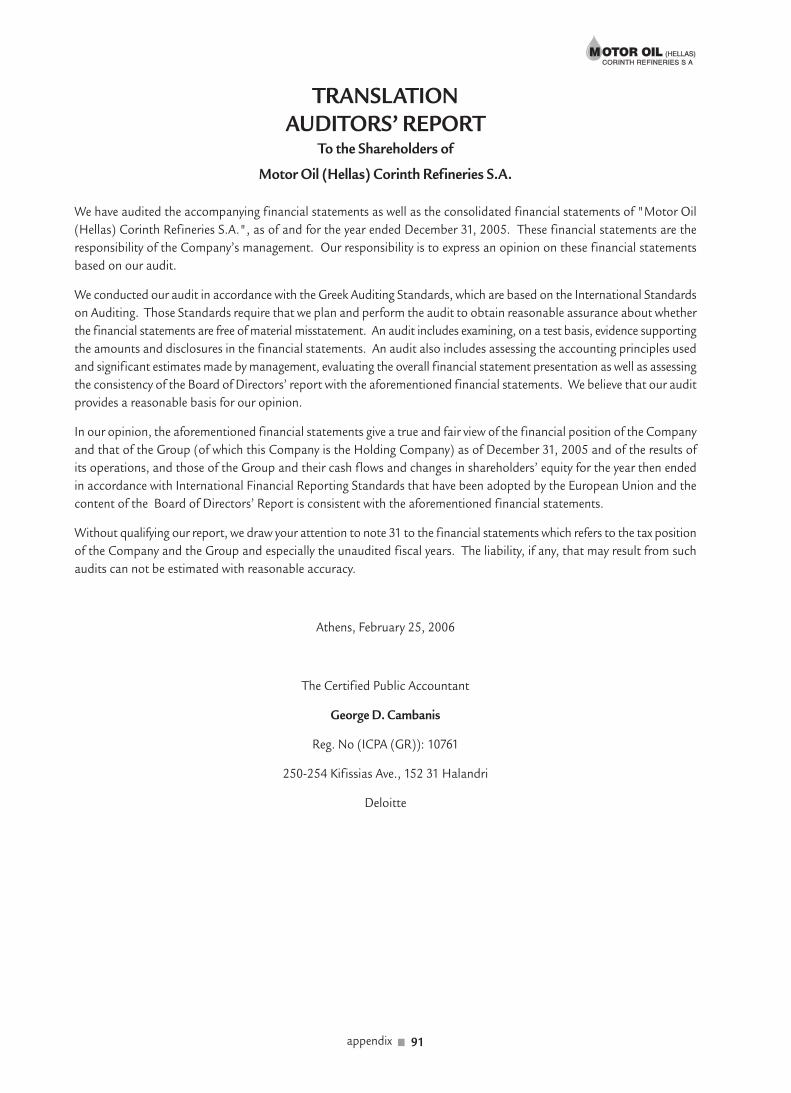
TRANSLATIONAUDITORS’ REPORT
To the Shareholders of
Motor Oil (Hellas) Corinth Refineries S.A.
We have audited the accompanying financial statements as well as the consolidated financial statements of "Motor Oil
(Hellas) Corinth Refineries S.A.", as of and for the year ended December 31, 2005. These financial statements are the
responsibility of the Company’s management. Our responsibility is to express an opinion on these financial statements
based on our audit.
We conducted our audit in accordance with the Greek Auditing Standards, which are based on the International Standards
on Auditing. Those Standards require that we plan and perform the audit to obtain reasonable assurance about whether
the financial statements are free of material misstatement. An audit includes examining, on a test basis, evidence supporting
the amounts and disclosures in the financial statements. An audit also includes assessing the accounting principles used
and significant estimates made by management, evaluating the overall financial statement presentation as well as assessing
the consistency of the Board of Directors’ report with the aforementioned financial statements. We believe that our audit
provides a reasonable basis for our opinion.
In our opinion, the aforementioned financial statements give a true and fair view of the financial position of the Company
and that of the Group (of which this Company is the Holding Company) as of December 31, 2005 and of the results of
its operations, and those of the Group and their cash flows and changes in shareholders’ equity for the year then ended
in accordance with International Financial Reporting Standards that have been adopted by the European Union and the
content of the Board of Directors’ Report is consistent with the aforementioned financial statements.
Without qualifying our report, we draw your attention to note 31 to the financial statements which refers to the tax position
of the Company and the Group and especially the unaudited fiscal years. The liability, if any, that may result from such
audits can not be estimated with reasonable accuracy.
Athens, February 25, 2006
The Certified Public Accountant
George D. Cambanis
Reg. No (ICPA (GR)): 10761
250-254 Kifissias Ave., 152 31 Halandri
Deloitte
appendix ■ 91
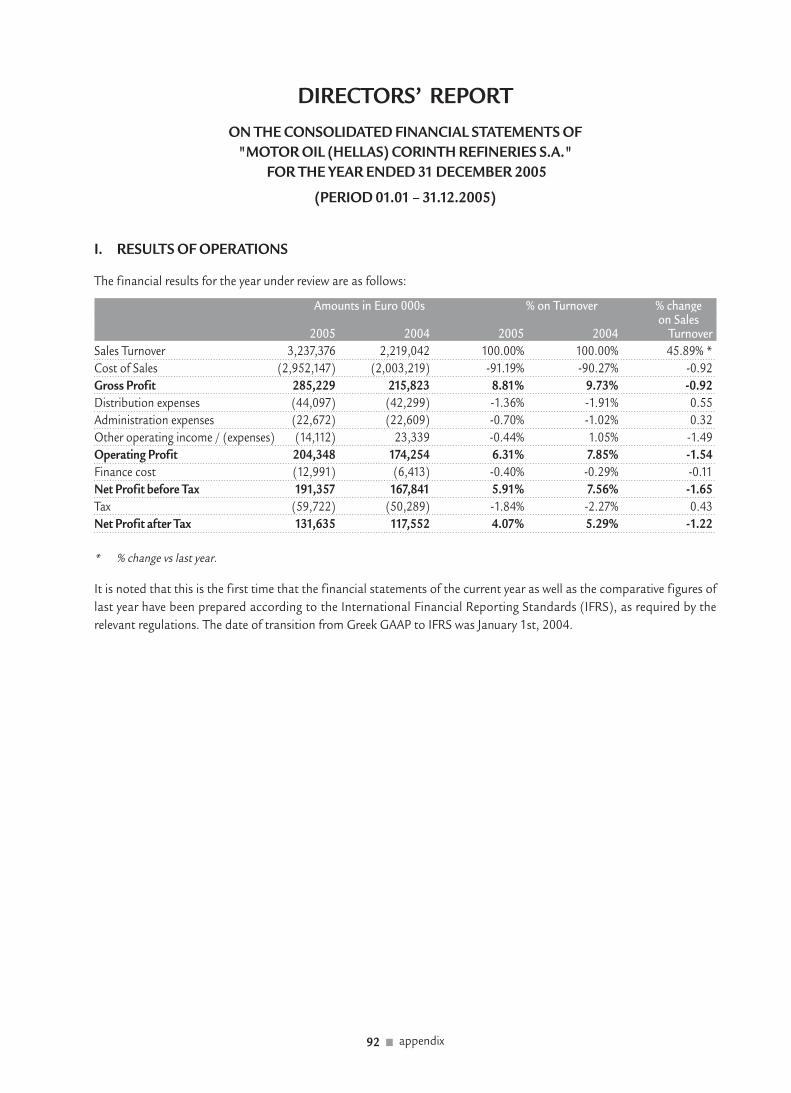
DIRECTORS’ REPORT
ON THE CONSOLIDATED FINANCIAL STATEMENTS OF
"MΟΤΟR ΟIL (HΕLLΑS) CORINTH REFINERIES S.Α."
FOR THE YEAR ENDED 31 DECEMBER 2005
(PERIOD 01.01 – 31.12.2005)
Ι. RESULTS OF OPERATIONS
Τhe financial results for the year under review are as follows:
Amounts in Euro 000s % on Turnover % changeon Sales
2005 2004 2005 2004 Turnover
Sales Turnover 3,237,376 2,219,042 100.00% 100.00% 45.89% *
Cost of Sales (2,952,147) (2,003,219) -91.19% -90.27% -0.92
Gross Profit 285,229 215,823 8.81% 9.73% -0.92
Distribution expenses (44,097) (42,299) -1.36% -1.91% 0.55
Administration expenses (22,672) (22,609) -0.70% -1.02% 0.32
Other operating income / (expenses) (14,112) 23,339 -0.44% 1.05% -1.49
Operating Profit 204,348 174,254 6.31% 7.85% -1.54
Finance cost (12,991) (6,413) -0.40% -0.29% -0.11
Net Profit before Tax 191,357 167,841 5.91% 7.56% -1.65
Tax (59,722) (50,289) -1.84% -2.27% 0.43
Net Profit after Tax 131,635 117,552 4.07% 5.29% -1.22
* % change vs last year.
It is noted that this is the first time that the financial statements of the current year as well as the comparative figures of
last year have been prepared according to the International Financial Reporting Standards (IFRS), as required by the
relevant regulations. The date of transition from Greek GAAP to IFRS was January 1st, 2004.
92 ■ appendix
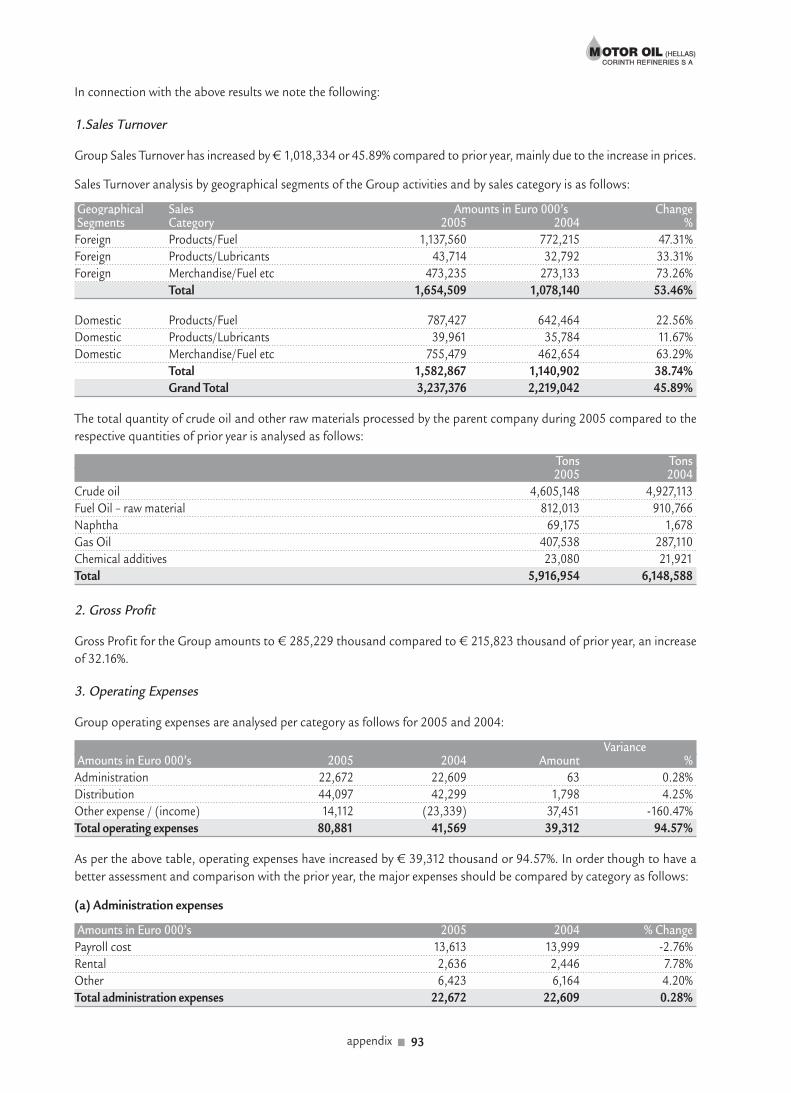
In connection with the above results we note the following:
1.Sales Turnover
Group Sales Turnover has increased by € 1,018,334 or 45.89% compared to prior year, mainly due to the increase in prices.
Sales Turnover analysis by geographical segments of the Group activities and by sales category is as follows:
Geographical Sales Amounts in Euro 000’s ChangeSegments Category 2005 2004 %
Foreign Products/Fuel 1,137,560 772,215 47.31%
Foreign Products/Lubricants 43,714 32,792 33.31%
Foreign Merchandise/Fuel etc 473,235 273,133 73.26%
Total 1,654,509 1,078,140 53.46%
Domestic Products/Fuel 787,427 642,464 22.56%
Domestic Products/Lubricants 39,961 35,784 11.67%
Domestic Merchandise/Fuel etc 755,479 462,654 63.29%
Total 1,582,867 1,140,902 38.74%
Grand Total 3,237,376 2,219,042 45.89%
The total quantity of crude oil and other raw materials processed by the parent company during 2005 compared to the
respective quantities of prior year is analysed as follows:
Tons Tons2005 2004
Crude oil 4,605,148 4,927,113
Fuel Oil – raw material 812,013 910,766
Νaphtha 69,175 1,678
Gas Oil 407,538 287,110
Chemical additives 23,080 21,921
Total 5,916,954 6,148,588
2. Gross Profit
Gross Profit for the Group amounts to € 285,229 thousand compared to € 215,823 thousand of prior year, an increase
of 32.16%.
3. Operating Expenses
Group operating expenses are analysed per category as follows for 2005 and 2004:
VarianceAmounts in Euro 000’s 2005 2004 Amount %
Administration 22,672 22,609 63 0.28%
Distribution 44,097 42,299 1,798 4.25%
Other expense / (income) 14,112 (23,339) 37,451 -160.47%
Total operating expenses 80,881 41,569 39,312 94.57%
As per the above table, operating expenses have increased by € 39,312 thousand or 94.57%. In order though to have a
better assessment and comparison with the prior year, the major expenses should be compared by category as follows:
(a) Administration expenses
Amounts in Euro 000’s 2005 2004 % Change
Payroll cost 13,613 13,999 -2.76%
Rental 2,636 2,446 7.78%
Other 6,423 6,164 4.20%
Total administration expenses 22,672 22,609 0.28%
appendix ■ 93

(b) Distribution expenses
Amounts in Euro 000’s 2005 2004 % Change
Payroll cost 7,598 8,100 -6.20%
Rental 3,063 2,648 15.67%
Warehousing 4,565 4,793 -4.76%
Transportation 18,887 16,695 13.13%
Other 9,984 10,063 -0.79%
Total distribution expenses 44,097 42,299 4.25%
(c) Other Operating (income) / expenses
Amounts in Euro 000’s 2005 2004 % Change
FX losses 60,089 29,240 105.50%
FX gains (35,876) (42,378) -15.34%
Sale of services (6,687) (6,750) -0.93%
Rental income (3,568) (3,162) 12.84%
Other 154 (289) -153.29%
Total Other 14,112 (23,339) -160.47%
Total Operating Expenses 80,881 41,569 94.57%
The above expenses represent 2.50% and 1.87% on the sales turnover for the years 2005 and 2004 respectively.
4. Finance Costs
Net finance costs (expenses) for the year have been increased from prior year by € 6,512 thousand. This variance is analysed
per category in the following table:
VarianceAmounts in Euro 000’s 2005 2004 Amount %
Investment income (378) (1,168) -790 -67.64%
Interest income (1,096) (1,004) 92 9.16%
Interest expense & bank charges 14,631 8,817 5,814 65.94%
Total Finance cost (income)/expense 13,157 6,645 6,512 98.00%
Investment income concerns mainly income from dividends and from sale of securities. Prior year also includes gain on
liquidation of the subsidiary "Pyrros". The increase in interest expense is due to the increase in borrowings.
5. Taxes
Taxes for 2005 were € 59,722 thousand and they have increased by € 9,433 thousand compared to last year or 18.76%.
The breakdown of taxes is presented hereunder:
Amounts in Euro 000’s 2005 2004
Income tax 69.354 51,484
Differences on prior years’ tax audits – 150
Discount on income tax down payment (893) (746)
Deferred tax (8,739) (599)
Total 59,722 50,289
It is noted that the parent company has been tax audited until the fiscal year 1999 inclusive, while the subsidiary "AVIN
OIL ΑVΕΝΕP" until the fiscal year 2002 inclusive.
94 ■ appendix
6. Dividends
The parent company’s management assessing the various factors determining the dividends’ policy, proposes to the Annual
Ordinary General Assembly the distribution of a total dividend of € 121,861,278 (or € 1.10 per share) for the fiscal year
2005. It is noted that an amount of € 22,156,596 (or € 0.20 per share) has been already paid as interim dividend for the
fiscal year 2005 within December 2005.
ΙΙ. PROSPECTS
The course of the Group’s activities within the new year 2006 is very satisfactory, until now, since the sales turnover for
January 2006 was € 377,238,778 (January 2005: € 194,376,711) and the quantity of crude oil and other raw materials
processed by the refinery was 585,853 Metric Tons (January 2005: 406,446 ΜΤ).
It is expected that, for the total year of 2006, the international refinery margins will remain approximately at the same
high levels of 2005. It is also expected that the sales volume for the parent company for 2006 will increase by approximately
2%, and the sales revenues by approximately 5%.
ΙΙΙ. CAPITAL EXPENDITURES
Τhe major projects that were completed during 2005 were the following:
■ Replacement of equipment Μ-1100.
■ Replacement and improvement of distillation tower C-1101.
■ Works for MHC.
■ Replacement of Outer Baskets in the Reformer reactors.
■ New pier unloading line VGO.
The new project of the Hydro-cracking Unit installation was also completed within 2005 with a total cost of € 376 mil.
The Hydro-cracking Unit has the ability to produce auto gasoil and gasoline with the new standards and also increases
the production capacity of auto gasoil and heating oil of the refinery. It is expected that as from 2006, the completion of
this project will boost the sales volume and the gross margins.
The estimated capital expenditures for 2006 are approximately € 62 mil. and the most important project is the natural
gas network at the refinery and its connection to the DEPA network.
ΙV. SHAREHOLDERS
It is noted that within 2005 "MOTOR OIL HOLDINGS S.A" sold its share of 16.4 % in the parent company "ΜΟΤΟR ΟIL
(HELLΑS) CORINTH REFINERIES S.Α.".
In 2005 the sale/acquisition of the shareholding of "ARAMCO OVERSEAS COMPANY BV" in "ΜΟΤΟR ΟIL (HELLΑS)
CORINTH REFINERIES S.Α." from "MOTOR OIL HOLDINGS S.A." was also completed.
appendix ■ 95

V. SIGNIFICANT POST BALANCE SHEET EVENTS
There are no significant events occurred todate, which may affect the Group’s financial position as at 31 December 2005.
VΙ. OWN SHARES
During 2004 the parent company disposed off 205,890 own shares acquired at a total cost of € 1,384,955 for € 1,544,175
i.e. with a gain of € 159,220. Afterwards the Company acquired 15,180 own shares, of nominal value € 0.30 each, for a
total cost of € 113,592 for which the Company accounted for an equal reserve from Retained Earnings. As at 31.12.2005
the parent company had no own shares.
Μaroussi, 24 February 2006
THE CHAIRMAN OF THE BOD
AND MANAGING DIRECTOR THE VICE CHAIRMEN
VARDIS J. VARDINOYANNIS JOHN V. VARDINOYANNIS
PANAGIOTIS Ν. ΚΟΝΤΑXIS
THE DEPUTY MANAGING DIRECTORS ΤHE MEMBERS OF THE BOD
JOHN Ν. ΚΟSMADAKIS ΝΙΚΟS TH. VARDINOYANNIS
PETROS Τ. ΤΖΑΝΝΕΤΑΚIS GEORGE P. ΑLEXANDRIDIS
GEORGE TH. THEODOROULAKIS
ΚOΝSΤΑΝΤΙΝΟS B. ΜΑRΑVΕΑS
ΙRENE-ΚΑRΟLΙΝΑ Α. ΚΟΝΤΟYΑΝΝI
LEONIDΑS Κ. GEORGOPOULOS
DESPIΝΑ Ν. ΜΑΝOLI
96 ■ appendix
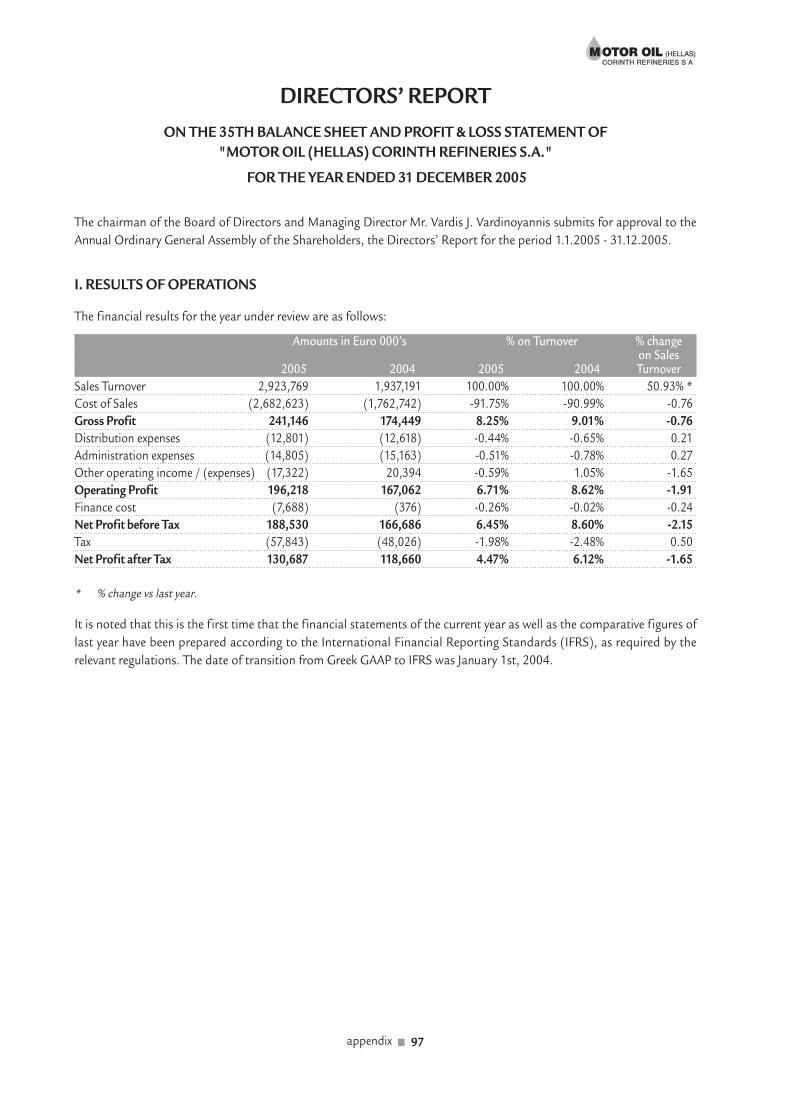
DIRECTORS’ REPORT
ON THE 35TH BALANCE SHEET AND PROFIT & LOSS STATEMENT OF
"MΟΤΟR ΟIL (HΕLLΑS) CORINTH REFINERIES S.Α."
FOR THE YEAR ENDED 31 DECEMBER 2005
The chairman of the Board of Directors and Managing Director Mr. Vardis J. Vardinoyannis submits for approval to the
Annual Ordinary General Assembly of the Shareholders, the Directors’ Report for the period 1.1.2005 - 31.12.2005.
Ι. RESULTS OF OPERATIONS
Τhe financial results for the year under review are as follows:
Amounts in Euro 000’s % on Turnover % changeon Sales
2005 2004 2005 2004 Turnover
Sales Turnover 2,923,769 1,937,191 100.00% 100.00% 50.93% *
Cost of Sales (2,682,623) (1,762,742) -91.75% -90.99% -0.76
Gross Profit 241,146 174,449 8.25% 9.01% -0.76
Distribution expenses (12,801) (12,618) -0.44% -0.65% 0.21
Administration expenses (14,805) (15,163) -0.51% -0.78% 0.27
Other operating income / (expenses) (17,322) 20,394 -0.59% 1.05% -1.65
Operating Profit 196,218 167,062 6.71% 8.62% -1.91
Finance cost (7,688) (376) -0.26% -0.02% -0.24
Net Profit before Tax 188,530 166,686 6.45% 8.60% -2.15
Tax (57,843) (48,026) -1.98% -2.48% 0.50
Net Profit after Tax 130,687 118,660 4.47% 6.12% -1.65
* % change vs last year.
It is noted that this is the first time that the financial statements of the current year as well as the comparative figures of
last year have been prepared according to the International Financial Reporting Standards (IFRS), as required by the
relevant regulations. The date of transition from Greek GAAP to IFRS was January 1st, 2004.
appendix ■ 97

In connection with the above results we note the following:
1. Sales Turnover
Sales Turnover has increased by € 986,578 thousand or 50.93% compared to prior year mainly due to the increase in prices
but also increase in the volume by approx. 5%.
Sales Turnover analysis by geographical segments and by sales category is as follows:
Geographical Sales Amounts in Euro 000’s ChangeSegments Category 2005 2004 %
Foreign Products/Fuel 1,137,560 772,215 47.31%
Foreign Products/Lubricants 43,714 32,792 33.31%
Foreign Merchandise/Fuel etc 435,559 241,554 80.32%
Total 1,616,833 1,046,561 54.49%
Domestic Products/Fuel 787,427 642,464 22.56%
Domestic Products/Lubricants 39,961 35,784 11.67%
Domestic Merchandise/Fuel etc 479,548 212,382 125.80%
Total 1,306,936 890,630 46.74%
Grand Total 2,923,769 1,937,191 50.93%
The total quantity of crude oil and other raw materials processed by the Company during 2005 compared to the respective
quantities of prior year is analysed as follows:
Τons Τons2005 2004
Crude oil 4,605,148 4,927,113
Fuel Oil – raw material 812,013 910,766
Νaphtha 69,175 1,678
Gas Oil 407,538 287,110
Chemical additives 23,080 21,921
Total 5,916,954 6,148,588
2. Gross profit
Gross Profit for the Company amounts to € 241,146 thousand compared to € 174,449 thousand of prior year, an increase
of 38.23%.
3. Operating expenses
Operating expenses for the Company for the years 2005 and 2004 are as follows:
VarianceAmounts in Euro 000’s 2005 2004 Amount %
Administration 14,805 15,163 -358 -2.36%
Distribution 12,801 12,618 183 1.45%
Other expense / (income) 17,322 (20,394) 37,716 -184.94%
Total 44,928 7,387 37,541 508.20%
As per the above table operating expenses have increased by € 37,541 thousand or 508.20%. This increase is mainly due
to realised FX differences that have affected the current year. It is noted that the above difference represents just 1.28% of
the Sales Turnover.
98 ■ appendix
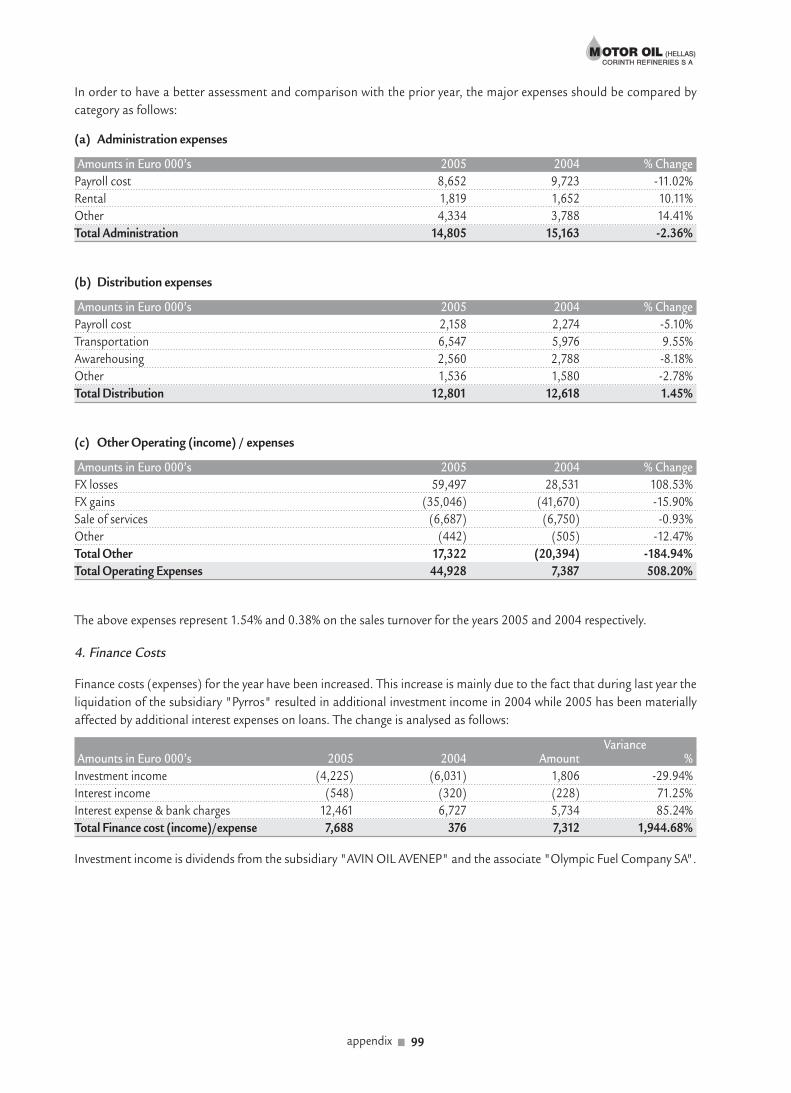
In order to have a better assessment and comparison with the prior year, the major expenses should be compared by
category as follows:
(a) Administration expenses
Amounts in Euro 000’s 2005 2004 % Change
Payroll cost 8,652 9,723 -11.02%
Rental 1,819 1,652 10.11%
Other 4,334 3,788 14.41%
Total Administration 14,805 15,163 -2.36%
(b) Distribution expenses
Amounts in Euro 000’s 2005 2004 % Change
Payroll cost 2,158 2,274 -5.10%
Transportation 6,547 5,976 9.55%
Αwarehousing 2,560 2,788 -8.18%
Other 1,536 1,580 -2.78%
Total Distribution 12,801 12,618 1.45%
(c) Other Operating (income) / expenses
Amounts in Euro 000’s 2005 2004 % Change
FX losses 59,497 28,531 108.53%
FX gains (35,046) (41,670) -15.90%
Sale of services (6,687) (6,750) -0.93%
Other (442) (505) -12.47%
Total Other 17,322 (20,394) -184.94%
Total Operating Expenses 44,928 7,387 508.20%
The above expenses represent 1.54% and 0.38% on the sales turnover for the years 2005 and 2004 respectively.
4. Finance Costs
Finance costs (expenses) for the year have been increased. This increase is mainly due to the fact that during last year the
liquidation of the subsidiary "Pyrros" resulted in additional investment income in 2004 while 2005 has been materially
affected by additional interest expenses on loans. The change is analysed as follows:
VarianceAmounts in Euro 000’s 2005 2004 Amount %
Investment income (4,225) (6,031) 1,806 -29.94%
Interest income (548) (320) (228) 71.25%
Interest expense & bank charges 12,461 6,727 5,734 85.24%
Total Finance cost (income)/expense 7,688 376 7,312 1,944.68%
Investment income is dividends from the subsidiary "AVIN OIL AVENEP" and the associate "Οlympic Fuel Company SA".
appendix ■ 99
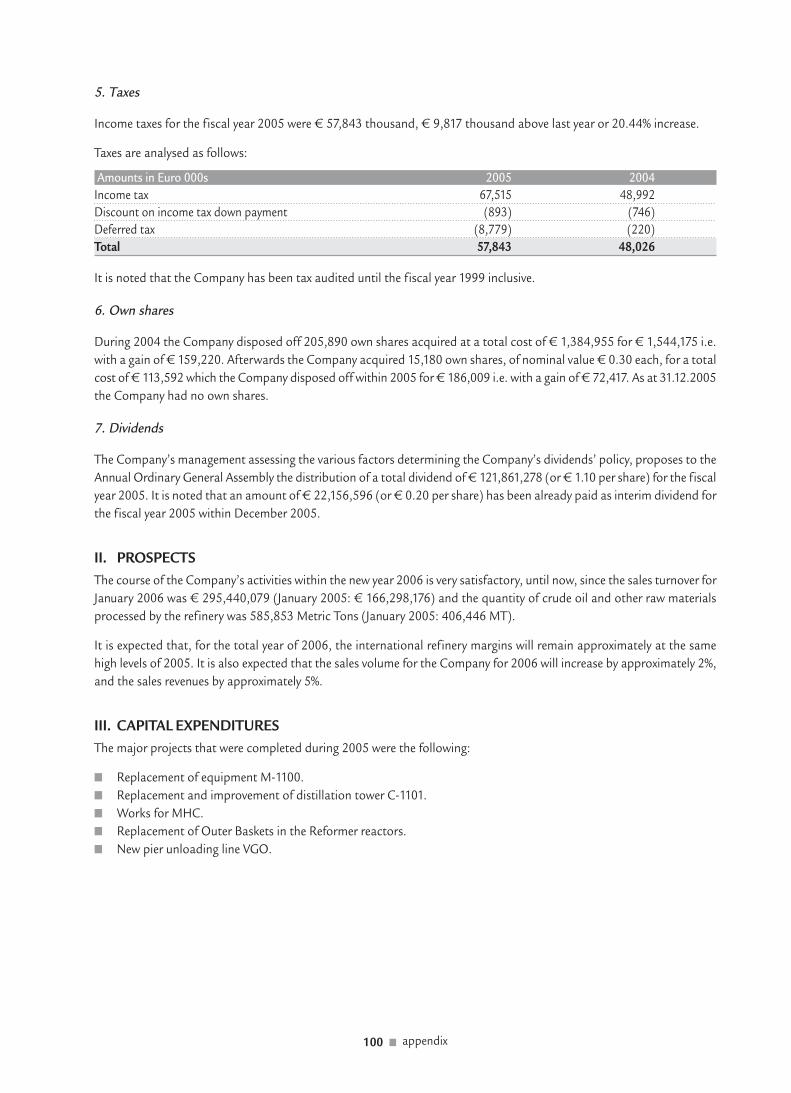
5. Taxes
Income taxes for the fiscal year 2005 were € 57,843 thousand, € 9,817 thousand above last year or 20.44% increase.
Taxes are analysed as follows:
Amounts in Euro 000s 2005 2004
Income tax 67,515 48,992
Discount on income tax down payment (893) (746)
Deferred tax (8,779) (220)
Total 57,843 48,026
It is noted that the Company has been tax audited until the fiscal year 1999 inclusive.
6. Own shares
During 2004 the Company disposed off 205,890 own shares acquired at a total cost of € 1,384,955 for € 1,544,175 i.e.
with a gain of € 159,220. Afterwards the Company acquired 15,180 own shares, of nominal value € 0.30 each, for a total
cost of € 113,592 which the Company disposed off within 2005 for € 186,009 i.e. with a gain of € 72,417. As at 31.12.2005
the Company had no own shares.
7. Dividends
The Company’s management assessing the various factors determining the Company’s dividends’ policy, proposes to the
Annual Ordinary General Assembly the distribution of a total dividend of € 121,861,278 (or € 1.10 per share) for the fiscal
year 2005. It is noted that an amount of € 22,156,596 (or € 0.20 per share) has been already paid as interim dividend for
the fiscal year 2005 within December 2005.
ΙΙ. PROSPECTS
The course of the Company’s activities within the new year 2006 is very satisfactory, until now, since the sales turnover for
January 2006 was € 295,440,079 (January 2005: € 166,298,176) and the quantity of crude oil and other raw materials
processed by the refinery was 585,853 Metric Tons (January 2005: 406,446 ΜΤ).
It is expected that, for the total year of 2006, the international refinery margins will remain approximately at the same
high levels of 2005. It is also expected that the sales volume for the Company for 2006 will increase by approximately 2%,
and the sales revenues by approximately 5%.
ΙΙΙ. CAPITAL EXPENDITURES
Τhe major projects that were completed during 2005 were the following:
■ Replacement of equipment Μ-1100.
■ Replacement and improvement of distillation tower C-1101.
■ Works for MHC.
■ Replacement of Outer Baskets in the Reformer reactors.
■ New pier unloading line VGO.
100 ■ appendix
The new project of the Hydro-cracking Unit installation was also completed within 2005 with a total cost of € 376 mil.
The Hydro-cracking Unit has the ability to produce auto gasoil and gasoline with the new standards and also increases
the production capacity of auto gasoil and heating oil of the refinery. It is expected that as from 2006, the completion of
this project will boost the sales volume and the gross margins.
The estimated capital expenditures for 2006 are approximately € 53 mil. And the most important project is the natural
gas network at the refinery and its connection to the DEPA network.
IV. ASSETS
1. Fixed assets
Total Net Book Value of tangible fixed assets (Property, Plant and Equipment) as at 31.12.2005 was € 698,065 thousand
(31.12.2004: € 565,775 thousand). Τhe site with the technical installations and buildings of the Company is located at
Soussaki, Ag. Theodori of Cοrinth.
2. Cash in foreign currency
Cash in foreign currency as at 31 December 2005 was $ 2,168,676.76 or € 1,838,329.04.
3. Branches
The refinery of the Company at Soussaki, Ag. Theodori of Corinth operates as branch of the Company.
V. SHAREHOLDERS
It is noted that within 2005 "MOTOR OIL HOLDINGS S.A" sold its share of 16.4 % in "ΜΟΤΟR ΟIL (HELLΑS) CORINTH
REFINERIES S.Α.".
In 2005 the sale/acquisition of the shareholding of "ARAMCO OVERSEAS COMPANY BV" in "ΜΟΤΟR ΟIL (HELLΑS)
CORINTH REFINERIES S.Α." from "MOTOR OIL HOLDINGS S.A." was also completed.
appendix ■ 101

VΙ. SIGNIFICANT POST BALANCE SHEET EVENTS
There are no significant events occurred todate, which may affect the Company’s financial position as at 31 December
2005.
In light of the above analysis and the attached Financial Statements and the notes thereto, a complete picture of the
Company’s activities and the actions resolved by the Board of Directors, please Messrs. Shareholders, approve these and
discharge the Board of Directors and the Auditors from any liability for this year.
Μaroussi, 24 February 2006
THE CHAIRMAN OF THE BOD
AND MANAGING DIRECTOR THE VICE CHAIRMEN
VARDIS J. VARDINOYANNIS JOHN V. VARDINOYANNIS
PANAGIOTIS Ν. ΚΟΝΤΑXIS
THE DEPUTY MANAGING DIRECTORS ΤHE MEMBERS OF THE BOD
JOHN Ν. ΚΟSMADAKIS ΝΙΚΟS TH. VARDINOYANNIS
PETROS Τ. ΤΖΑΝΝΕΤΑΚIS GEORGE P. ΑLEXANDRIDIS
GEORGE TH. THEODOROULAKIS
ΚOΝSΤΑΝΤΙΝΟS B. ΜΑRΑVΕΑS
ΙRENE-ΚΑRΟLΙΝΑ Α. ΚΟΝΤΟYΑΝΝI
LEONIDΑS Κ. GEORGOPOULOS
DESPIΝΑ Ν. ΜΑΝOLI
102 ■ appendix
appendix ■ 103
104 ■ appendix
appendix ■ 105

106 ■ appendix
appendix ■ 107
108 ■ appendix

appendix ■ 109

110 ■ appendix

appendix ■ 111

■ DESIGN - PRODUCTION: NEMESIS S.A.

12A Irodou Attikou str.,Maroussi 151 24, Athens - GREECE
website: http://www.moh.gr
AN
NU
AL
RE
PO
RT
20
05