2004 – sales and results - · pdf fileorganisation chart. shareholder structure (at...
TRANSCRIPT

2004 – Sales and results

Organisation chart

Shareholder structure (at 31.12.2004)
BNP PARIBAS
19.0%
BPFRANCE
2.6%
Employees22.7%
Own shares3.7%
Free float52.0%

2004 Sales(€m)
CONSTRUCTION 3,411 3,885 + 13.9 % o/w property development 364 492
ROAD CONSTRUCTION 1,985 2,145 + 8.1 % ELECTRICAL CONTRACTING 1,346 1,507 + 12.0 % METALLIC CONSTRUCTION 211 201 - 4.7 % CONCESSIONS 9 27 x 3
6,962 7,765 + 11.5 %
Of which - France 5,735 6,493 + 13.2 %- Europe 1,051 1,160 + 10.4 %- rest of the world 176 112 - 36.4 %
TOTAL
2003 2004 Change

Sales
Electrical contracting
19.4%
Road construction
27.6%
Metallic construction
2.6%
Construction43.8%
Property develpt
6 3%
Concessions0.3%7,765
6,9626,9416,4026,245
2000 2001 2002 2003 2004
(€m)
6.3%

Eiffage in Europe(€m)
COUNTRIES ACTIVITIES
BELGIUM 430 Constr. - Prop. Dev. - Electr. - Concessions
SPAIN 230 Road - Electricity
POLAND 170 Construction
GERMANY 150 Road - Civil Engineering - Electricity (2005)
PORTUGAL 110 Motorways - Property Development
ITALY 50 Civil Engineering - Electricity
OTHERS 20 Ireland - U.K. - Norway - Luxemburg
TOTAL SALES 1,160
SALES 2004
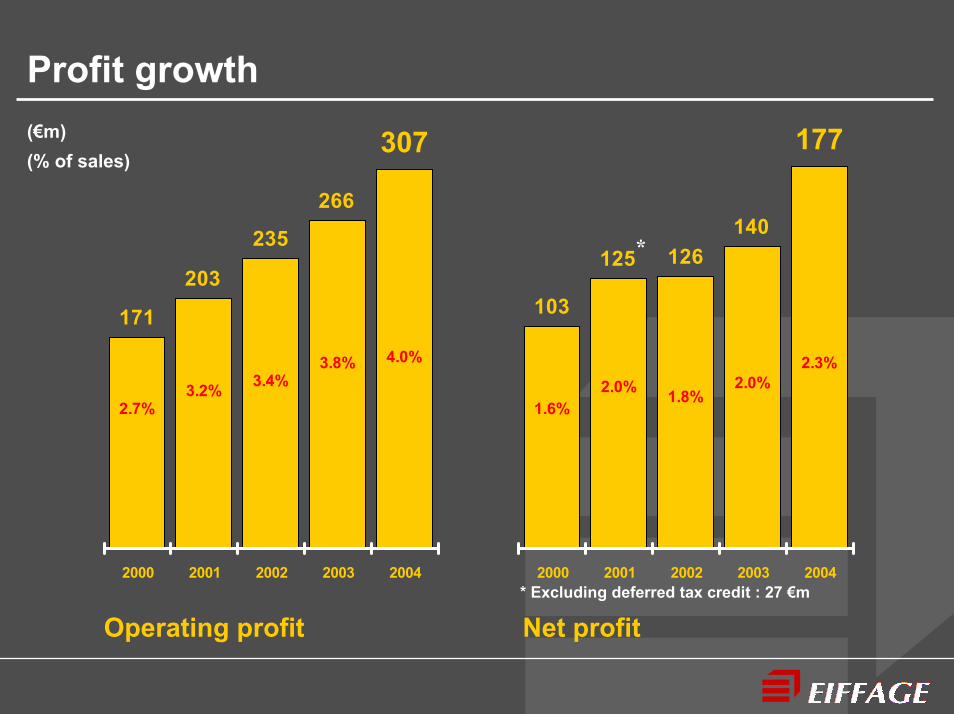
Profit growth(€m)
Operating profit Net profit* Excluding deferred tax credit : 27 €m
*
(% of sales)
171
203
235
266
307
2.7%3.2% 3.4%
3.8% 4.0%
2000 2001 2002 2003 2004
103
125 126140
177
1.6%2.0% 1.8%
2.0%2.3%
2000 2001 2002 2003 2004

Operating profit and margins(€m)
% sales % sales
CONSTRUCTION + 138 + 4.0 % + 150 + 3.9 %
ROAD CONSTRUCTION + 54 + 2.7 % + 79 + 3.7 %
ELECTRICAL CONTRACTING + 62 + 4.6 % + 70 + 4.6 %
METALLIC CONSTRUCTION + 12 + 5.7 % + 6 + 3.0 %
CONCESSIONS + 1 n.s. + 4 n.s.
HOLDING COMPANIES - 1 - - 2 n.s.
Consolidated operating profit + 266 + 3.8 % + 307 + 4.0 %
2003 2004

Consolidated profit & loss account(€m)
Sales 6,962 7,765
Operating profit + 266 + 307 Net financial charges - 1 + 6
+ 265 + 313 Exceptional items - 27 - 37 Tax - 88 - 94 Equity accounted companies + 44 + 48 Goodwill amortisation - 55 - 53 Minority interests + 1 + 0
Net profit - Group share + 140 + 177
2003 2004
Profit on ordinary activities

Breakdown of net profit – Group share(€m)
CONSTRUCTION + 87 + 94 ROAD CONSTRUCTION + 34 + 50 ELECTRICAL CONTRACTING + 38 + 43 METALLIC CONSTRUCTION + 5 + 4 CONCESSIONS + 41 + 47 HOLDING COMPANIES - 11 - 8
+ 194 + 230 Goodwill amortisation - 55 - 53 Minority interests + 1 0
+ 140 + 177
2003 2004
NET PROFIT - GROUP SHARE
Result before goodwill

Consolidated balance sheet(€m)
ASSETS 2002 2003 2004 LIABILITIES 2002 2003 2004
Intangible assets 537 523 565 Capital and reserves 783 881 991
Concessions 418 540 816 Net profit 126 140 177
Tangible assets 429 456 520 Shareholders' equity 909 1,021 1,168
Investments 128 123 166
Fixed assets 1,512 1,642 2,067
Net cash - 83 41 Net debt 72 - -
Other assets 3,704 3,471 3,717 Other liabilities 3,841 3,745 4,225
TOTAL 5,216 5,196 5,825 TOTAL 5,216 5,196 5,825
Provisions 394 430 432

Fixed assets - Concessions(€m)
145
540
816
418
215
2000 2001 2002 2003 2004
Cofiroute 190 212 Millau viaduct 284 399 Norscut - - Prado Carénage 8 10 Eiffage Parking 56 174 Perpignan - Fig. - 17 Connectic 78 - 2 Others 2 2
Total 540 816
2003 2004

Cash flow statement(€m)
Consolidated cash flow + 277 + 319 Provisions / Profit on disposals - 5 - 29 Change in WCR + 149 + 217 Capital expenditure - 330 - 454 Disposals + 93 + 67
Net cash flow + 184 + 120
Dividends - 31 - 62 Capital increase + 6 + 8 Change in consolidation scope - 4 - 108
Change in net debt + 155 - 42
2003 2004

Capital expenditure(€m)
Intangible 5 5
Tangible 97 119
Concessions 147 223
Acquisitions 81 107
Total 330 454
2003 2004

Order book (at 01/01/2005)(€m)
CONSTRUCTION 4,490 4,940 + 10.0 %
ROAD CONSTRUCTION 1,000 1,150 + 15.0 %
ELECTRICAL CONTRACTING 550 770 + 40.0 %
METALLIC CONSTRUCTION 210 190 - 9.5 %
6,250 7,050 + 12.8 %
At 01/01/2004 At 01/01/2005 Change
TOTAL

2005 sales(€m)
CONSTRUCTION 3,885 4,000 + 3.0 % o/w property development 492 440
ROAD CONSTRUCTION 2,145 2,250 + 4.9 % ELECTRICAL CONTRACTING 1,507 1,650 + 9.5 % METALLIC CONSTRUCTION 201 150 - 25.4 % CONCESSIONS 27 100 x 4
7,765 8,150 + 5.0 %
Of which - France 6,493 6,880 + 6.0 %- Europe 1,160 1,170 + 0.9 %- rest of the world 112 100 - 10.7 %
TOTAL
2004 2005 Change

Stock market performance – between 01/01/03 and 22/02/05
248
125
60
80
100
120
140
160
180
200
220
240
260
280
300
01/01/2003 01/04/2003 01/07/2003 01/10/2003 01/01/2004 01/04/2004 01/07/2004 01/10/2004 01/01/2005
EiffageCAC 40
– Dividend : Interim dividend in novembre 2004 of 1€ p/share. Final dividend to be set by GM of 20 April 2005.
Base

IFRS : Impact on the consolidated balance sheet
ASSETS LIABILITIES
Intangible assets 523 - 7 516
Concessions 540 + 11 551 Capital and reserves 1,021 - 100 (2) 921
Tangible assets 456 + 234 690
Investments 123 0 123
Fixed assets 1,642 + 238 (1) 1,880
Cash 794 - 24 770 Debt 711 + 262 (4) 973
Other assets 3,471 - 34 3,437 Other liabilities 3,745 - 82 3,663
TOTAL 5,907 180 6,087 TOTAL 5,907 + 180 6,087
(3) 530
01/01/04 IFRS01/01/04 Change Change01/01/04
IFRS 01/01/04
Provisions 430 + 100