2004 indian ocean tsunami: 10 years on - aon...
TRANSCRIPT

Risk. Reinsurance. Human Resources.
Aon BenfieldAnalytics | Impact Forecasting
2004 Indian Ocean Tsunami: 10 Years OnJanuary 2015

Table of Contents
Preface . . . . . . . . . . . . . . . . . . . . . . . . . . . . . . . . . . . . . . . . . . . . . . . . . . . . 3
Event Recap . . . . . . . . . . . . . . . . . . . . . . . . . . . . . . . . . . . . . . . . . . . . . . . . 4
Impacts of the Tsunami on Infrastructure . . . . . . . . . . . . . . . . . . . . . . . . . 9
Tsunami characteristics and sources in Indian Ocean . . . . . . . . . . . . . . 20
Indian Ocean tsunami warning systems . . . . . . . . . . . . . . . . . . . . . . . . . 24
Preparedness and communication . . . . . . . . . . . . . . . . . . . . . . . . . . . . . 32
Aon Benfield’s tsunami modeling initiatives . . . . . . . . . . . . . . . . . . . . . 35
Tsunami insurance coverage in Asia Pacific . . . . . . . . . . . . . . . . . . . . . . 41
Closing Remarks . . . . . . . . . . . . . . . . . . . . . . . . . . . . . . . . . . . . . . . . . . . 42
Appendix 1 . Indian Ocean tsunami observations between 1900 and 2014 . . . . . . . . . . . . . . . . . . . . . . . . . . . . . . . . . . . . 43
Appendix 2 . Useful Internet Links . . . . . . . . . . . . . . . . . . . . . . . . . . . . . 44
Appendix 3 . Availability of tsunami insurance cover in Asia Pacific region . . . . . . . . . . . . . . . . . . . . . . . . . . . . . . . . . . . . . . . . 46
Appendix 4 . Remnants and Reminders of 2004 Indian Ocean tsunami . . . . . . . . . . . . . . . . . . . . . . . . . . . . . . . . . . . . . . . 52
References . . . . . . . . . . . . . . . . . . . . . . . . . . . . . . . . . . . . . . . . . . . . . . . . 55
Acknowledgements . . . . . . . . . . . . . . . . . . . . . . . . . . . . . . . . . . . . . . . . 56

Aon Benfield 3
Preface
The 2004 Indian Ocean earthquake and tsunami (also called
the Boxing Day tsunami) was a devastating catastrophe that
caused extensive loss of life and damage. The people of the
affected territories experienced immense suffering due to the
event. Since then, there has been an enormous amount of
research carried out on the catastrophe and a large volume
of literature published on the subject. This publication marks
the completion of a decade following the event and aims
to reflect upon the event and the subsequent changes in
several aspects regarding the peril, over the past ten years.
The document is organized into seven chapters. The first
chapter, titled ‘Event Recap’, provides some background
on how the event was triggered and provides a brief
commentary on the losses experienced as a result of the
disaster. The second chapter is an invited commentary
by Professor Iaon Nistor and Professor Tad Murthy,
internationally renowned experts on tsunami risk. The
chapter explores the impact of the tsunami on the
infrastructure present in the region at the time of the event,
based on the characteristics of the tsunami and general field
observations after the event. The third chapter explores the
sources and features of tsunamis in the Indian Ocean region.
The scale of damage due to the tsunami had not been
experienced before and the people of the affected regions
were not suitably prepared regarding the event. The
unsuspecting communities, therefore, endured massive
losses. Countries like India and Indonesia, which were
affected by the tsunami, established institutions and warning
systems following the event that could advise the at-risk
communities of impending tsunamis. Chapter four briefly
summarizes these warning systems. The changes in the
preparedness towards similar events and the communication
systems in place are discussed in the fifth chapter.
The sixth chapter looks at the tsunami risk from an insurance
industry perspective, while the seventh chapter briefly
discusses Impact Forecasting’s approach to tsunami
modeling, through case studies from Japan and Chile.
Related appendices and references are included.
years. Figure 1: Tsunami wave monument in Banda Aceh, Indonesia.
Source: Impact Forecasting

4 2004 Indian Ocean Tsunami: 10 Years On
Event Recap
On December 26, 2004, a megathrust earthquake was
registered off the coast of Sumatra, Indonesia, which
generated a huge tsunami that spread across the Indian
Ocean, killing and injuring hundreds of thousands of
people and causing devastating damage. There is still
no consensus as to the total number of people who
perished as a result of the disaster – most estimates
suggest a figure of around 230,000. The earthquake
of magnitude Mw9.1 (USGS) struck at 07:58 local time
(00:58 UTC) with an epicenter 250 kilometers (155
miles) south-southeast of Banda Aceh, Indonesia.
Figure 2: Tectonic base map of the Sumatra subduction zone showing major faults and the location of main shock. The annual speed and direction of plate movement is also indicated.
Source: http://walrus.wr.usgs.gov/tsunami/sumatraEQ/tectonic.html

Aon Benfield 5
The earthquake, the third largest ever recorded
instrumentally and the largest known tremor to have struck
the Indonesian archipelago occurred as a result of thrust-
faulting at the interface of the Indo-Australian tectonic plate
and the Burma tectonic plate. Figure 2 shows the tectonic
base map of the Sumatra subduction zone showing major
faults and the location of the main shock. From the epicenter,
the fault-rupture propagated northwestward for 500
kilometers (310 miles) towards the southern Andaman and
Nicobar Islands. (Some models suggest that the
fault-rupture may have propagated as far as 1,200 kilometers
(745 miles) from the epicenter.) The width of the rupture
zone was approximately 150 kilometers (95 miles), and
the maximum displacement on the fault plane was about
20 meters (65 feet). The depth of the earthquake was
only 30 kilometers (18.6 miles). The shallow depth
combined with the substantial movement on the fault
plane meant that the sea-floor overlying the thrust
fault was uplifted by several meters. It was this sea-
floor uplift that triggered the catastrophic tsunami.
The sudden vertical rise of the sea-floor due to the earthquake
displaced an enormous volume of water triggering the
tsunami. The wave immediately spread out in all directions
from the earthquake epicenter, taking just 15 minutes to
reach the western coast of Sumatra. About 7 hours later,
the wave had traversed the Indian Ocean and had come
ashore in eastern Africa. In total, the tsunami affected the
coasts of 14 countries around the rim of the Indian Ocean:
Bangladesh, India, Indonesia, Kenya, Madagascar, Malaysia,
Maldives, Myanmar, Seychelles, Somalia, Sri Lanka, Tanzania,
Thailand, and Yemen. The vast majority of the fatalities
and damage were a result of the tsunami rather than being
directly caused by the earthquake. Post-event analysis
uncovered evidence that runup height reached as high as 49
meters (160 feet) as it came ashore near Banda Aceh (Figure
4b) and travelled as far as 5 kilometers (3.1 miles) inland.
In Thailand, runup heights of up to 10.6 meters (35 feet)
were observed (source: National Geophysical Data Center,
NOAA). Wherever the tsunami came ashore, buildings,
structures, vegetation, and vehicles were destroyed.
Figure 3a: 2004 Indian Ocean tsunami runup heights.
Source: http://www.ngdc.noaa.gov/hazard/img/indian_ocean_runups.png)

6 2004 Indian Ocean Tsunami: 10 Years On
Figure 5: Boat on the roof, Gampong Lampulo, Banda Aceh; 56 people survived from the disaster by taking shelter in the boat.
Figure 4b: Maximum runup height of 48.86 m was noticed in Rhitting, near Banda Aceh.
Economic Losses and Fatalities
The most devastating effects of the tsunami were observed
in Indonesia, particularly in Banda Aceh Province, where
almost 170,000 lives were lost. Total economic losses reached
USD4.5 billion (2004). In Sri Lanka, the death toll reached
almost 35,500 and economic losses totaled USD1.5 billion
(2004). In Thailand, the number of lives lost reached almost
8,500 and economic losses were USD2.2 billion (2004)
[Ref: Asian Disaster Prepared Center]. The combined cost
of damage caused by the tsunami across the 14 affected
countries was USD14 billion. To cite one example of the
magnitude of the damage, a fishing boat (length: 25 meters
(82 feet), width: 5.5 meters (18 feet), and weight: 20 tonnes)
was carried several kilometers inland onto the roof of a house
(Figure 5) in Lampulo village, Banda Aceh, Indonesia.
Source: Prof. Tomoya Shibayama, Waseda University, Japan
Source: Impact Forecasting

Aon Benfield 7
The high number of fatalities caused by the tsunami has
been attributed by many to be due to two main factors:
firstly, the large number of coastal communities around
the perimeter of the Indian Ocean on low-lying ground;
and, secondly, the lack of a tsunami warning system.
Given the short amount of time it took the tsunami to
strike the Banda Aceh coast, it is unlikely that a tsunami
warning system would have been deployed in time to
prevent many of the fatalities there. However, had a
warning system been deployed in Sri Lanka and India, it
would have given the population there almost 3 hours
to prepare and evacuate from low-lying areas, and in
all likelihood, would have prevented many thousands
of deaths. Over 16,000 people were estimated to have
been killed in India and runup height above 5 meters (17
feet) was noticed at Nagapattinam in Tamil Nadu state.
Insured Losses
There were a wide range of insured loss estimates
from different sources following the event, a significant
component of which were attributed to losses in the
life insurance, personal accident and property lines
of business. The insured losses were estimated to be
approximately USD3 billion (2004). The tsunami did
not have a significant impact on major city centers
or concentrations of infrastructure in the affected
territories. Most of the property destroyed was in the
regions with low insurance penetration. Losses were
also dispersed widely over many countries. Many
properties including residential structures, motor, cargo,
industrial plants, tourist sites and resort hotels were
destroyed or severely damaged during the event.
Figure 6: Tsunami monument at Lhoknga beach, one of the severely affected sites in Indonesia.
Source: Impact Forecasting

8 2004 Indian Ocean Tsunami: 10 Years On
Insurance penetration in the affected areas was generally
low, particularly with regard to residential properties and
small businesses. The countries impacted by the tsunami
were characterized by a large number of small localized
insurance companies who spread their risk primarily
through national and regionally based reinsurance
companies, generally by proportional reinsurance.
Historically the insurance companies and national
reinsurance companies also ceded a significant amount
of risk by proportional reinsurance to the international
reinsurance market. Following the events of 9/11 and
Typhoon Nari which hit Taiwan in September 2001, event
limitations were introduced in 2002 to South Korean
and Taiwanese proportional treaties for catastrophic
peril loss recoveries. In subsequent years Philippines
and Indonesia also introduced such event limitations for
catastrophic loss recovery from proportional treaties.
Also catastrophic peril losses were excluded from
Taiwanese surplus treaties. As a result of the adoption of
these non-proportional restrictions on to proportional
treaties, proportional reinsurance capacity became scarce
and uneconomically viable resulting in many insurers
opting to reinsure their catastrophic perils via non-
proportional treaties. This significantly reduced the risk
to the international reinsurers. Although the estimated
total insured loss is large, for individual companies,
and even national reinsurers, the losses were probably
generally not large relative to their retentions. As a
consequence, the estimated total insured loss would
have been borne by the tens of local, national and
regional insurance and reinsurance companies, for some
of whom it may have been a significant loss, but for very
few of whom it would have been a disastrous event.
Another characteristic feature of the regions impacted
by the tsunami event was the significant concentration
of international tourist resorts, especially in Thailand,
Sri Lanka and the Maldives. These were probably
largely insured offshore, so will have impacted on
international insurers. However, they were reasonably
well spread among a number of insurers, probably
roughly in proportion to the size of the insurers.
Figure 7: Affected tourist sites in Thailand.
Courtesy: Dr. Poh Poh Wong
Aon Benfield 9
Impacts of the Tsunami on Infrastructure
Introduction
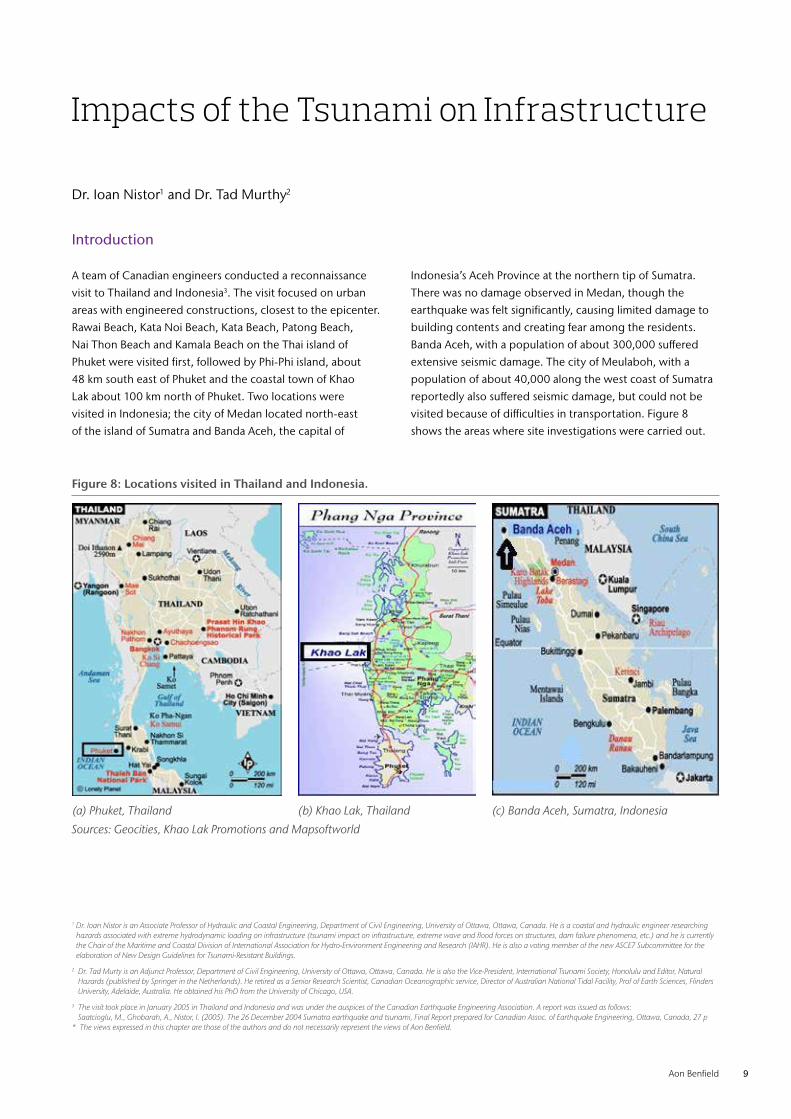
A team of Canadian engineers conducted a reconnaissance
visit to Thailand and Indonesia3. The visit focused on urban
areas with engineered constructions, closest to the epicenter.
Rawai Beach, Kata Noi Beach, Kata Beach, Patong Beach,
Nai Thon Beach and Kamala Beach on the Thai island of
Phuket were visited first, followed by Phi-Phi island, about
48 km south east of Phuket and the coastal town of Khao
Lak about 100 km north of Phuket. Two locations were
visited in Indonesia; the city of Medan located north-east
of the island of Sumatra and Banda Aceh, the capital of
Indonesia’s Aceh Province at the northern tip of Sumatra.
There was no damage observed in Medan, though the
earthquake was felt significantly, causing limited damage to
building contents and creating fear among the residents.
Banda Aceh, with a population of about 300,000 suffered
extensive seismic damage. The city of Meulaboh, with a
population of about 40,000 along the west coast of Sumatra
reportedly also suffered seismic damage, but could not be
visited because of difficulties in transportation. Figure 8
shows the areas where site investigations were carried out.
1 Dr. Ioan Nistor is an Associate Professor of Hydraulic and Coastal Engineering, Department of Civil Engineering, University of Ottawa, Ottawa, Canada. He is a coastal and hydraulic engineer researching hazards associated with extreme hydrodynamic loading on infrastructure (tsunami impact on infrastructure, extreme wave and flood forces on structures, dam failure phenomena, etc.) and he is currently the Chair of the Maritime and Coastal Division of International Association for Hydro-Environment Engineering and Research (IAHR). He is also a voting member of the new ASCE7 Subcommittee for the elaboration of New Design Guidelines for Tsunami-Resistant Buildings.
2 Dr. Tad Murty is an Adjunct Professor, Department of Civil Engineering, University of Ottawa, Ottawa, Canada. He is also the Vice-President, International Tsunami Society, Honolulu and Editor, Natural Hazards (published by Springer in the Netherlands). He retired as a Senior Research Scientist, Canadian Oceanographic service, Director of Australian National Tidal Facility, Prof of Earth Sciences, Flinders University, Adelaide, Australia. He obtained his PhD from the University of Chicago, USA.
3 The visit took place in January 2005 in Thailand and Indonesia and was under the auspices of the Canadian Earthquake Engineering Association. A report was issued as follows: Saatcioglu, M., Ghobarah, A., Nistor, I. (2005). The 26 December 2004 Sumatra earthquake and tsunami, Final Report prepared for Canadian Assoc. of Earthquake Engineering, Ottawa, Canada, 27 p
* The views expressed in this chapter are those of the authors and do not necessarily represent the views of Aon Benfield.
Dr. Ioan Nistor1 and Dr. Tad Murthy2
(a) Phuket, Thailand (b) Khao Lak, Thailand (c) Banda Aceh, Sumatra, Indonesia
Figure 8: Locations visited in Thailand and Indonesia.
Sources: Geocities, Khao Lak Promotions and Mapsoftworld

10 2004 Indian Ocean Tsunami: 10 Years On
General Field Observations
Damage along southern Phuket beaches was limited to
coastal erosion and partial failures of non-engineered
reinforced concrete and timber frame structures along
the coast. The runup height was measured to be
approximately 6meters (20 feet) from the sea in Kata
Beach, damaging low-rise buildings, including roof tiles,
as illustrated in Figure 9. The most populated beach
town along the west coast of Phuket was Patong Beach,
which suffered extensive damage to low-rise buildings.
The water mark on buildings was measured to vary
between 4-6meters (13-20 feet) above sea level. The
building inventory in Patong Beach consisted of a large
number of non-engineered one to two story reinforced
concrete and timber frame shops and hotels. There
were also a number of multistory engineered reinforced
concrete hotels. Extensive damage to masonry infill walls
was observed. Limited damage occurred in reinforced
concrete structural elements, though significant damage
was seen in timber structural elements. Most of the
entire shopping district of Patong Beach was destroyed
within an area extending approximately two kilometers
inland from the shore as illustrated in Figure 10.
Figure 9: Damage to single story non-engineered buildings in Kata Beach.
Figure 10: Observed damage in Patong Beach.
Nai Thon Beach, further north of Patong Beach on
the island of Phuket, suffered extensive structural
and non-structural damage to reinforced concrete
frame buildings. The water depth was in excess of
10 meters (33 feet), especially in areas between
the shore and the nearby hilly terrains, and led
to significant water run-ups. Figure 11 illustrates
the structural damage observed in this area.
Aon Benfield 11
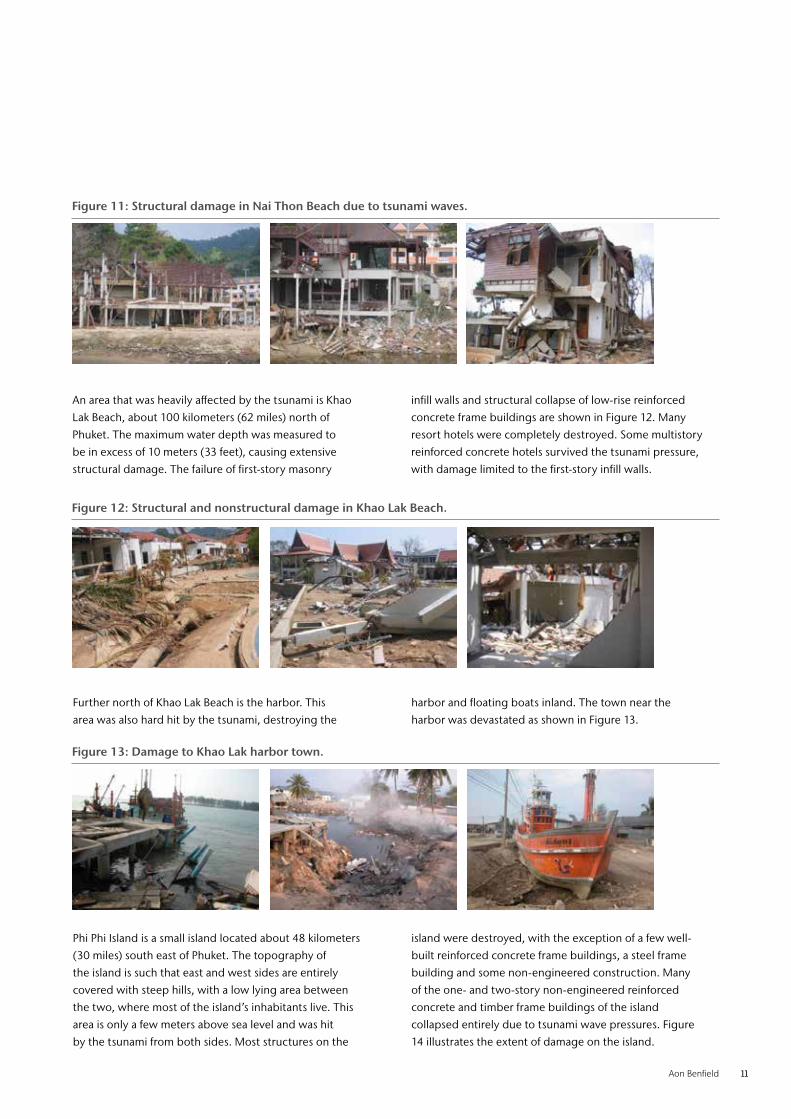
An area that was heavily affected by the tsunami is Khao
Lak Beach, about 100 kilometers (62 miles) north of
Phuket. The maximum water depth was measured to
be in excess of 10 meters (33 feet), causing extensive
structural damage. The failure of first-story masonry
infill walls and structural collapse of low-rise reinforced
concrete frame buildings are shown in Figure 12. Many
resort hotels were completely destroyed. Some multistory
reinforced concrete hotels survived the tsunami pressure,
with damage limited to the first-story infill walls.
Figure 11: Structural damage in Nai Thon Beach due to tsunami waves.
Figure 12: Structural and nonstructural damage in Khao Lak Beach.
Further north of Khao Lak Beach is the harbor. This
area was also hard hit by the tsunami, destroying the
harbor and floating boats inland. The town near the
harbor was devastated as shown in Figure 13.
Figure 13: Damage to Khao Lak harbor town.
Phi Phi Island is a small island located about 48 kilometers
(30 miles) south east of Phuket. The topography of
the island is such that east and west sides are entirely
covered with steep hills, with a low lying area between
the two, where most of the island’s inhabitants live. This
area is only a few meters above sea level and was hit
by the tsunami from both sides. Most structures on the
island were destroyed, with the exception of a few well-
built reinforced concrete frame buildings, a steel frame
building and some non-engineered construction. Many
of the one- and two-story non-engineered reinforced
concrete and timber frame buildings of the island
collapsed entirely due to tsunami wave pressures. Figure
14 illustrates the extent of damage on the island.

12 2004 Indian Ocean Tsunami: 10 Years On
Banda Aceh, Indonesia, was a city with a population of
about 300,000 inhabitants before the tsunami. It was
subjected to damaging forces of not only the tsunami but
also the earthquake. The majority of casualties were in this
city. Coastal areas were entirely swept away by tsunami
waves, leaving piles of timber as the remains of building
infrastructure. A large number of non-engineered reinforced
concrete buildings suffered structural damage, especially in
their first floor columns. Multi-story engineered reinforced
concrete government buildings suffered earthquake
damage due to poor seismic design and detailing practices.
A large number of mosques survived the disaster, though
they also suffered damage to masonry walls. Figures 15 and
16 illustrate the extent of damage observed in Banda Aceh.
Figure 14: Phi Phi Island, Thailand.
Figure 15: Tsunami damage in Banda Aceh, Indonesia.
Figure 16: Earthquake damage in Banda Aceh, Indonesia.

Aon Benfield 13
Effects of tsunami inundation
Tsunami waves imposed dynamic water pressures on
coastal structures as well as buildings and bridges near the
coastline, inducing serious damage to the entire surrounding
infrastructure located up to approximately 4 kilometers
(2.5 miles) inland. The resulting impulsive pressures of
breaking waves and hydro-dynamic pressures associated
with water velocity inflicted partial and full collapses of non-
structural and structural elements. The damage observed
in Thailand was almost entirely due to water pressures
that varied from impulsive pressures of breaking waves at
the shore, to reduced dynamic pressures inland as water
velocity decreased due to surface friction. There was some
impact loading generated by the floating debris, though
this was most pronounced in Banda Aceh, where large
objects were observed to have impacted on structures.
Performance of timber construction
In both Thailand and Indonesia, coastal towns had a large
number of low-rise timber frame buildings. These buildings
had timber columns and beams, supporting timber joist
floor systems. The roofs either had light corrugated iron
coverage or clay roofing tiles. Figure 17 illustrates the
framing system used and the types of damage observed.
Figure 17: Damage to timber frame buildings in Phi Phi Island, Thailand.

14 2004 Indian Ocean Tsunami: 10 Years On
Performance of unreinforced masonry walls
The majority of buildings in Thailand and Indonesia
had frames infilled with unreinforced masonry walls.
The masonry units used were consistently of the same
type, with 50 millimeters (2 inches) in thickness. Both
hollow clay bricks and concrete masonry blocks of
the same thickness were used (Figure 18). These walls
suffered punching shear failures due to the tsunami wave
pressure, applied perpendicular to the wall plane. These
resulted in large holes in walls, sometimes removing
the masonry almost entirely. The remaining walls
around the frames did not show any sign of diagonal
tension cracks, contrary to expectations, unless the
failure was caused by seismic excitations, which was
limited to Banda Aceh only. Figure 19 shows the type
of punching failures observed in masonry infill walls.
Figure 18: Clay brick and concrete masonry block units with 50 mm thickness.
(a) Kamala Beach (b) Khao Lak Beach (c) Banda Aceh
Figure 19: Punching failure of masonry infill walls caused by tsunami wave pressure.

Aon Benfield 15
(a) Khao Lak Beach (b) Phi Phi Island (c) Banda Aceh
Performance of non-engineered reinforced concrete buildings
The majority of one- to two-story low-rise buildings
were constructed using cast-in-situ concrete, without
much evidence of engineering design. The columns were
of very small cross-section (about 200 millimeters (8
inches) square), containing 4 smooth or deformed corner
bars with 8 millimeter (0.3 inch) diameter, resulting in
approximately 0.5% reinforcement ratio. Their flexural
capacity was computed to be significantly below the
moments imposed by tsunami waves and slightly below
the moments imposed by hydrostatic pressure. Figure 20
illustrates column failures in non-engineered reinforced
concrete frame buildings due to the tsunami wave pressure.
Observations on column behavior indicated that many
failures occurred at mid-height, especially in Banda Aceh.
This was attributed to the effects of debris impact, over and
above the tsunami wave pressure. Indeed, floating building
remains, as well as floating large objects like fishing boats
and cars impacted on the columns, causing column failures
near their mid-heights. This is illustrated in Figure 21.
Figure 20: Column failures in non-engineered reinforced concrete construction.
Figure 21: Column failures due to debris impact in Banda Aceh.
Performance of engineered reinforced concrete buildings
There were many low- to mid-rise reinforced concrete
frame buildings which appeared to have been
engineered in the visited areas of Thailand and Indonesia.
These buildings survived the tsunami pressure without
structural damage, though they suffered damage
to non-structural elements, especially the first story
masonry walls. Figure 22 shows reinforced concrete
hotel buildings in Thailand that survived the tsunami
without any sign of structural damage, although
nearby non-engineered buildings were either partially
or fully collapsed. There were some exceptions to
this observation in Nai Thon Beach, where water
runup affected slender reinforced concrete columns
of a shopping center, causing a partial collapse.

16 2004 Indian Ocean Tsunami: 10 Years On
A common precast slab system that was used in Thailand
consisted of prefabricated reinforced concrete strips,
supported by cast-in-place beams. These strips had 50
millimeter (2 inch) thickness, 300 millimeter (12 inch)
width and 2.0 meters (79 inches) length, reinforced with
4-6 millimeter (0.1-0.2 inch) diameter smooth wires,
equally spaced in the center of the section. Figure 23
shows the specifics of the slab system. Because of lack of
proper connection to the supporting beams, these strips
lifted up due to water pressure, causing slab failures. One
good example was a shopping center in Patong Beach
on Phuket Island, Thailand, where the lower level below
grade was filled up with water, lifting and destroying the
first floor slab panels, as illustrated in Figure 23. A similar
type of slab failure was also observed in the concrete dock
of the Kao Lak Harbor, as shown in Figure 24, though the
strips used in the harbor dock were slightly thicker.
Figure 24: Failure of Kao Lak Harbor dock.
Figure 23: Failure of precast slab strips in Patong Beach.
(a) Hotel on Phi Phi Island (b) Hotel on Phi Phi Island (c) Hotel in Nai Thon
Figure 22: Engineered concrete buildings survived tsunami forces without structural damage.
Aon Benfield 17
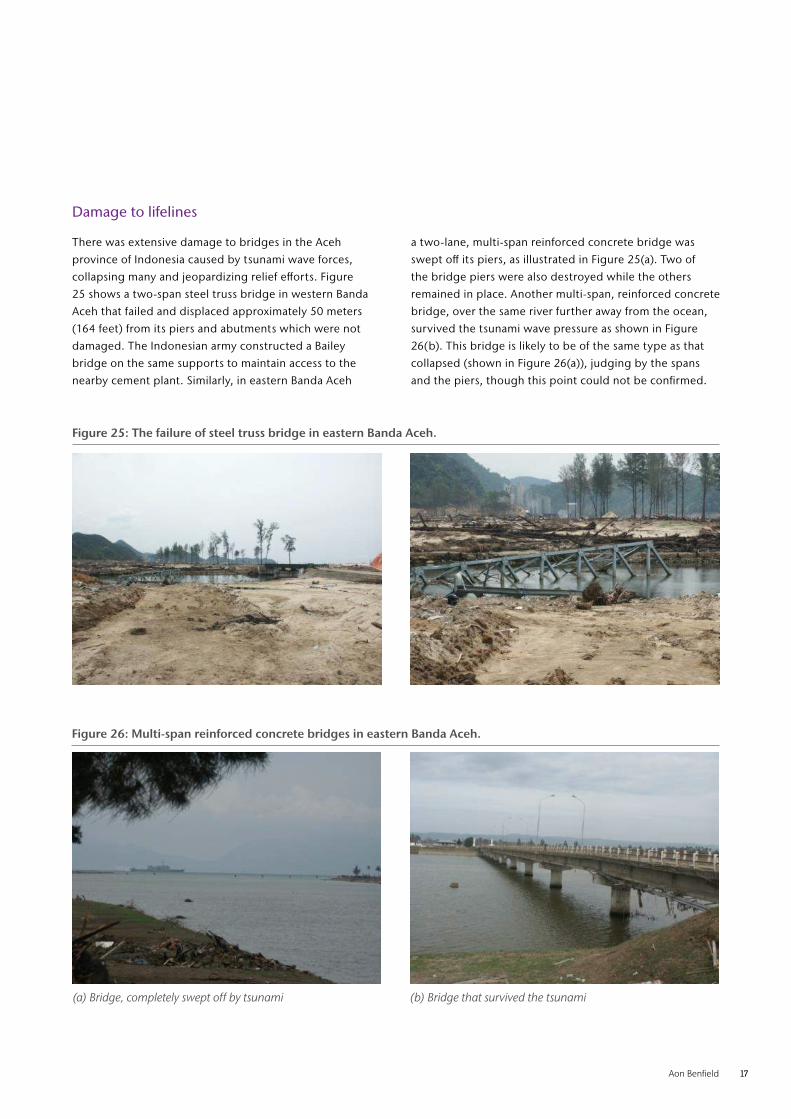
Damage to lifelines
There was extensive damage to bridges in the Aceh
province of Indonesia caused by tsunami wave forces,
collapsing many and jeopardizing relief efforts. Figure
25 shows a two-span steel truss bridge in western Banda
Aceh that failed and displaced approximately 50 meters
(164 feet) from its piers and abutments which were not
damaged. The Indonesian army constructed a Bailey
bridge on the same supports to maintain access to the
nearby cement plant. Similarly, in eastern Banda Aceh
a two-lane, multi-span reinforced concrete bridge was
swept off its piers, as illustrated in Figure 25(a). Two of
the bridge piers were also destroyed while the others
remained in place. Another multi-span, reinforced concrete
bridge, over the same river further away from the ocean,
survived the tsunami wave pressure as shown in Figure
26(b). This bridge is likely to be of the same type as that
collapsed (shown in Figure 26(a)), judging by the spans
and the piers, though this point could not be confirmed.
Figure 25: The failure of steel truss bridge in eastern Banda Aceh.
(a) Bridge, completely swept off by tsunami
Figure 26: Multi-span reinforced concrete bridges in eastern Banda Aceh.
(b) Bridge that survived the tsunami
18 2004 Indian Ocean Tsunami: 10 Years On
The transportation system in Banda Aceh was completely
paralyzed by the tsunami. Main arteries as well as small
streets were massively blocked by debris, jeopardizing
response and relief efforts. Foreign aid crews put in a
substantial effort to clean and open streets that had
been covered by the debris of collapsed buildings
and destroyed trees. Access to urban areas was lost, in
particular the 150 kilometer (93 mile) coastal road to
Meulaboh was washed away and bridges on the way lost
their superstructure due to the tsunami wave pressure.
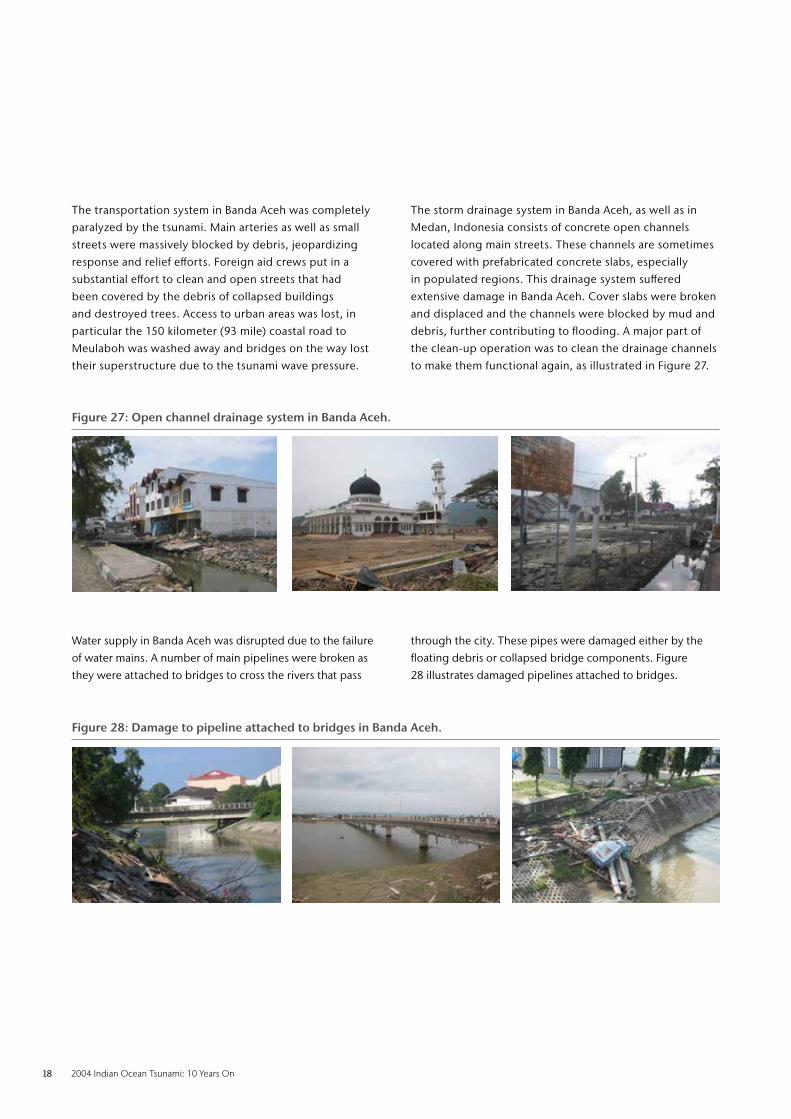
The storm drainage system in Banda Aceh, as well as in
Medan, Indonesia consists of concrete open channels
located along main streets. These channels are sometimes
covered with prefabricated concrete slabs, especially
in populated regions. This drainage system suffered
extensive damage in Banda Aceh. Cover slabs were broken
and displaced and the channels were blocked by mud and
debris, further contributing to flooding. A major part of
the clean-up operation was to clean the drainage channels
to make them functional again, as illustrated in Figure 27.
Figure 27: Open channel drainage system in Banda Aceh.
Water supply in Banda Aceh was disrupted due to the failure
of water mains. A number of main pipelines were broken as
they were attached to bridges to cross the rivers that pass
through the city. These pipes were damaged either by the
floating debris or collapsed bridge components. Figure
28 illustrates damaged pipelines attached to bridges.
Figure 28: Damage to pipeline attached to bridges in Banda Aceh.
Aon Benfield 19
Conclusions from the field-trip
The following conclusions can be drawn from the
reconnaissance visit conducted in Thailand and Indonesia
to assess engineering significance of the December 26,
2004 Indian Ocean tsunami and earthquake disaster,
with lessons learned and re-learned, as stated below:
• Lateralforcesgeneratedbytsunamiwavepressurecan
be orders of magnitude higher than typical design wind
pressures, generating out of plane forces high enough
to damage unreinforced masonry walls within the
tsunami height. The observations indicated widespread
failure of masonry infill walls within the first story level
of most frame buildings. These failures were often in
the form of large circular holes in the masonry walls.
• Whiletherelativelevelofforceswillchangefromone
building to another, depending on the characteristics
of the building, the type of exterior enclosure,
proximity to shoreline, topography of the region and
other seismic and tsunami characteristics, tsunami
generated base shear in buildings can be at a level
that is comparable to seismic induced base shears.
• Non-engineeredlow-risereinforcedconcreteframe
buildings, with small size structural elements, are
vulnerable to partial or full collapse due to lateral
tsunami pressures. Columns of such buildings are
further vulnerable to impact forces generated by
floating debris caused by tsunami, often leading to
flexural failures of columns within their mid-heights.
• Engineeredreinforcedconcreteframesoftenappearto
have sufficient strength against tsunami forces. There was
very little damage observed in structural components
of engineered concrete buildings. Often, nonstructural
elements failed before the effects of tsunami pressure
reached a critical level for structural components of such
buildings, relieving pressure on structural elements.
There was one steel frame building investigated, which
survived the tsunami pressure without any sign of distress.
• Prefabricatedreinforcedconcreteslabstrips,commonly
used in the area, suffered from uplift forces caused
by hydrostatic pressures. Lack of proper anchorage
to the supporting beams was blamed for the failure
of these slab systems.
• Bridgeinfrastructurewasdevastatedbytsunamiforces.
Many bridges were swept away from their supports,
disabling the transportation network.
• Storagetanksshouldbewellanchoredtotheir
foundations to resist tsunami pressures. Many steel
storage tanks, as well as other unanchored structures
floated away long distances due to the uplift pressure
generated by tsunami.
• Lighttimberframebuildingsareextremelyvulnerableto
tsunami wave pressures. Many residential districts with
timber residential buildings in Banda Aceh were
entirely wiped out by tsunami waves.
20 2004 Indian Ocean Tsunami: 10 Years On
General Characteristics of tsunami
Tsunamis (Japanese: “harbor wave”) are giant waves
due to the sudden displacement of a large volume of
the water in the sea or in the lake. These displacements
are most often caused by earthquakes; other caused
of tsunamis include submarine and coastal landslides,
volcanic eruptions or meteoric impacts.
Devastating tsunamis have been historically generated on
faults which are located offshore or inland at small distance
from shore. Tsunamis can be generated when the sea floor
abruptly deforms and vertically displaces the overlying water.
Tsunamis often occur following under-sea earthquakes, due
to the destabilization of the water above the deformed area.
Tsunamis are also generated by volcanic eruptions and under-
sea and coastal landslides. (Ref: Nayak S., Kumar S.T. (2008)
Addressing the Risk of Tsunami in the Indian Ocean,
Journal of South East Asia Disaster Studies).
The energy released from a tsunami is constant, which
is the function of wave speed and wave height. Tsunami
waves form only a small hump on the open sea, barely
noticeable and harmless, which generally travels at a
very high speed of 500-1,000 kph (310-620 mph).
As the wave travels towards the shore (shallower water) the
speed decreases and in order to conserve the energy the
wave height increases. Distant-tsunamis or tele-tsunamis (or
far-field tsunamis) are those that travel a long distance and
strike far from the original source, whereas local-tsunamis
(or near-field tsunamis) affect regions close to the source.
Tsunami characteristics and sources in Indian Ocean
Source: http://walrus.wr.usgs.gov/tsunami/sumatraEQ/seismo.html
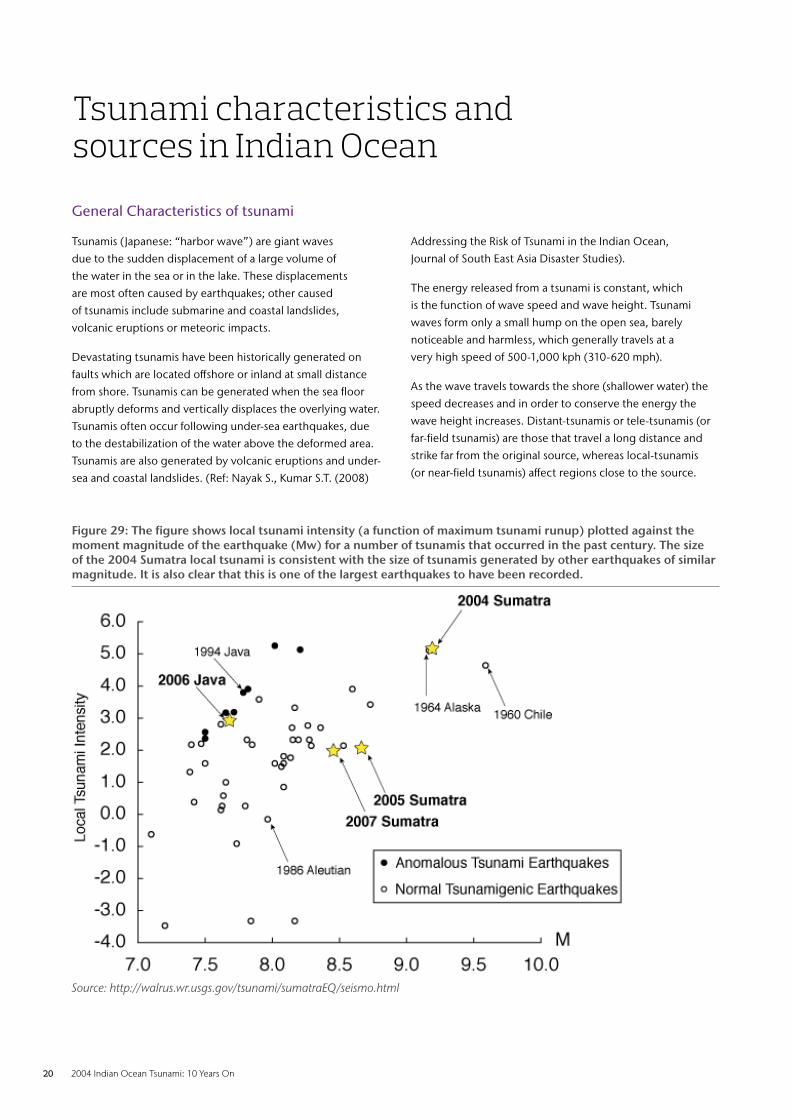
Figure 29: The figure shows local tsunami intensity (a function of maximum tsunami runup) plotted against the moment magnitude of the earthquake (Mw) for a number of tsunamis that occurred in the past century. The size of the 2004 Sumatra local tsunami is consistent with the size of tsunamis generated by other earthquakes of similar magnitude. It is also clear that this is one of the largest earthquakes to have been recorded.

Aon Benfield 21
Tsunami characteristics are highly influenced by
earthquake parameters such as seismic moment, source
mechanism and hypo central depth. The seismic moment
represents the energy released by the earthquake
which indicates the magnitude of the earthquake.
Major tsunamis have been invariably the result of larger
earthquakes. The earthquake mechanism is defined by
the orientation of the fault and direction of fault slip.
Earthquakes which have larger vertical fault movement
(dip-slip events) are more effective in triggering
tsunamis compared to earthquakes which have larger
horizontal fault movement (strike-slip events). Also,
shallower hypocentral earthquakes are more capable of
triggering tsunamis compared to deeper earthquakes.
Figure 30: Location of the origin of tsunamis in Indian Ocean between 1900 and 2014.
Tsunamigenic earthquake sources in the Indian Ocean
When compared to Pacific Ocean tsunamis, those in the
Indian Ocean occur less often. However, a large number
of countries are vulnerable, including (in alphabetical
order) Australia, Bangladesh, India, Indonesia, Iran,
Kenya, Madagascar, Malaysia, Maldives, Mauritius,
Myanmar, Oman, Pakistan, Reunion Island (France),
Seychelles, Somalia, South Africa, Sri Lanka, Thailand.
(Ref: Department of Ocean Development, Integrated
Coastal and Marine Area Management, Project Directorate,
Chennai, India (2005) Preliminary Assessment of Impact
of Tsunami in Selected Coastal Areas of India).
(source: NOAA)

22 2004 Indian Ocean Tsunami: 10 Years On
Figure 31: Areas prone to Tsunami in and around Indonesia.
Destructive tsunamis largely originate from earthquakes
that occur along the following principal tectonic sources.
In the western part of Indian Ocean, the Makran coast
is an east-west subduction zone running from the Strait
of Hormuz to the Ornach-Nal Fault in Pakistan. The best
known historical tsunami in the region was generated by
the great earthquake of November 28, 1945 off Pakistan’s
Makran Coast (Balochistan) in the Northern Arabian Sea.
The destructive tsunami killed more than 4,000 people
in Southern Pakistan but also caused great loss of life
and devastation along the coasts of Western India, Iran,
Oman and possibly elsewhere. Further south on the
western side the Indian tectonic plate is bounded by the
Central Indian and Carlsberg mid-ocean ridges, a region
of shallow seismicity. To the east, the Sunda Arc extends
over 5,600 kilometers (3,480 miles) between the Andaman
Islands to the northwest and the Banda Arc to the east,
resulting from convergence between the Indo-Australian
plate and Southeast Asia. The Sunda Arc consists of three
primary segments; the Sumatra segment, the Sunda Strait
Segment and the Java Segment. These locations represent
the area of greatest seismic exposure, with earthquake
magnitudes of 8 or higher on the Richter scale - as the 26
December 2004 proved. Among these tectonic features,
the Makran and Sunda Arc subduction zones are the
primary tsunamigenic sources in the Indian Ocean.
A tsunami catalogue for last 100 years is given in Appendix 1
indicating that several major events were generated in the
Indian Ocean. The runup heights range between few
centimeters and several meters with the maximum 49 meters
(160 feet) resulting from the 2004 Indian Ocean tsunami
event. The same data are illustrated in Figure 29 which
shows evidence for highest activity in the Sunda Arc
subduction region, especially the islands of Indonesia
and Andaman Islands.
Source: InaTEWS

Aon Benfield 23
Tsunami Hazard Assessment
The hazard parameter of interest from a tsunami is
typically runup height which is a measurement of the
maximum height of the water that the tsunami pushed
onshore above a reference sea level. The goal of the
hazard assessment is to determine the runup height of a
tsunami striking an area. Traditionally, tsunami hazards
have been assessed deterministically using the concept of
a maximum credible event or worst-case scenario. There
is, however, no single accepted way of determining this
scenario. In some cases, the physically largest earthquake
is used to assess the tsunami hazard at a coastal site,
whereas in other approaches, the largest historical event
is defined as the worst-case scenario. The methods
require specifying all relevant tsunami sources that may
affect the site, performing time demanding numerical
hydrodynamic modeling for each source, and aggregating
the results to form the hazard curve which expresses the
frequency of occurrence as a function of the runup height.
The geographical extent of Indian Ocean is smaller
compared to the Pacific Ocean and therefore the tsunami
reaches the coast earlier in Indian Ocean. To capture
the scenarios in a more realistic fashion, it is critical that
the models should use good quality bathymetry and
coastal bathymetry data.

24 2004 Indian Ocean Tsunami: 10 Years On
UNESCO’s Intergovernmental Oceanographic Committee
(IOC) coordinated and established the Intergovernmental
Coordination Group for the Indian Ocean Tsunami Warning
and Mitigation System (ICG/IOTWS) in 2005. It became
fully operational in 2011 in twenty eight countries that
form the Intergovernmental Coordination Group (ICG).
The aim of the system is to provide information regarding
approaching tsunami waves. The system works by detecting
tsunamigenic earthquakes more quickly and precisely than
was possible before as several new seismograph stations have
been added to the pre-existing network. It then confirms if
a tsunami wave has been generated and issues appropriate
warnings. While there were only a few real-time seismometers
prior to 2004, there are now several countries in the region
which operate real-time seismic networks (Figure 32).
Many Indian Ocean countries now have established National
Tsunami Warning Centers that are capable of receiving and
distributing tsunami advisories. Australia, India, and Indonesia
act as Regional Tsunami Service Providers (RTSP) under the
IOTWS and are the primary source of tsunami advisories for
the basin. The following sections discuss the tsunami warning
systems developed in India and Indonesia since the event.
Indian National Centre for Ocean Information Services (INCOIS)
In response to the 2004 Indian Ocean tsunami event,
the Indian government, via the Ministry of Earth
Sciences, established the Indian Tsunami Early Warning
System. It is based at and operated by Indian National
Center for Ocean Information Services (INCOIS),
Hyderabad (operational set-up is shown in Figure
33). The main objective of the Indian Tsunami Early
Warning Centre is to detect, locate, and determine the
magnitude of potentially tsunamigenic earthquakes
occurring in the Indian Ocean Basin, and subsequently
issue warnings regarding any potential event.
The National Tsunami Early Warning Centre at INCOIS has
been operational since October 2007 (Ref: Addressing
the Risk of Tsunami in the Indian Ocean: Shailesh Nayak
and T. Srinivasa Kumar) and has been issuing tsunami
advisories for all under-sea earthquakes of ≥ 6.5-magnitude.
Information regarding earthquakes is received from a
network of 17 broadband seismic monitoring stations
and more than 300 international stations. A database of
all possible earthquake scenarios for the Indian Ocean is
used to identify the regions at risk at the time of event.
Significant changes in sea level are monitored at the
time of occurrence of tsunamigenic earthquakes.
Indian Ocean tsunami warning systems
Figure 32: Seismic Network in Indian Ocean, 2004 (left) and 2014 (right).
Source: Intergovernmental Oceanographic Commission

Aon Benfield 25
The change in sea level needs to be measured close to the
fault zone with high accuracy. The Indian Tsunami Early
Warning Centre’s sea level network comprises 7 tsunami
buoys (5 in Bay of Bengal & 2 in North Arabian Sea) and tide
gauge stations at 21 locations. The location of the ocean
buoys and tide gauges is shown in Figure 34. Near-real time
data is also received from international stations as well as
Indian Meteorological Department (Ref: Indian Tsunami
Warning System by Shailesh Nayak and T. Srinivasa Kumar).
Necessary software for real-time reception, display and
archiving of tide gauge data has also been developed.
Source: Impact Forecasting
Figure 33: Operational set-up at INCOIS office, Hyderabad, India.

26 2004 Indian Ocean Tsunami: 10 Years On
Figure 34: Map showing the network of seismic stations, tsunami buoys and tidal gauges surrounding India.
Source: INCOIS
In addition to real time monitoring of the natural
phenomena, INCOIS also uses modeling software in order
to assess the possibility of a tsunami after an earthquake.
Further modeling software is also being developed in
order to better determine the possibility of tsunami.
INCOIS and its subsidiaries collect information regarding
seismic events in real time, study the possibility of a tsunami
after a seismic event and disseminate warnings to both
emergency centers and the general public. Timely tsunami
advisories (Warning/ Alerts/ Watches) are disseminated
to the vulnerable communities following a Standard
Operating Procedure (SOP), shown in Figure 35, by means
of various available communication methods like global
telecommunication systems, fax, phone, SMS and others.
The center, along with other such warning centers in the
region also provides regular training and conducts drills

Aon Benfield 27
Figure 35: Standard Operating Procedure (SOP) of Indian Tsunami Early Warning Centre (source: INCOIS)Source: INCOIS
to study the preparedness of the systems in place. India
is a Regional Tsunami Service Provider and also issues
warnings and advice to surrounding countries in the
Indian Ocean which could be affected by a tsunami.
There are still challenges in modeling, estimation of
tsunami wave heights and dissemination of information to
remote regions, among others. However, the systems in
place are much improved now, when compared to 2004;
improvements have been made in seismic monitoring
networks, sea level monitoring, tsunami modeling,
standard operating procedures, international network
development and capacity building. Improvements are
happening in the development of denser seismic networks,
modeling and visualization software, utilization of satellite
networks for faster dissemination of information and
the integration of storm surge forecasting system.
Figure 35: Standard Operating Procedure (SOP) of Indian Tsunami Early Warning Centre.
28 2004 Indian Ocean Tsunami: 10 Years On
Indonesia Tsunami Early Warning System (InaTEWS)
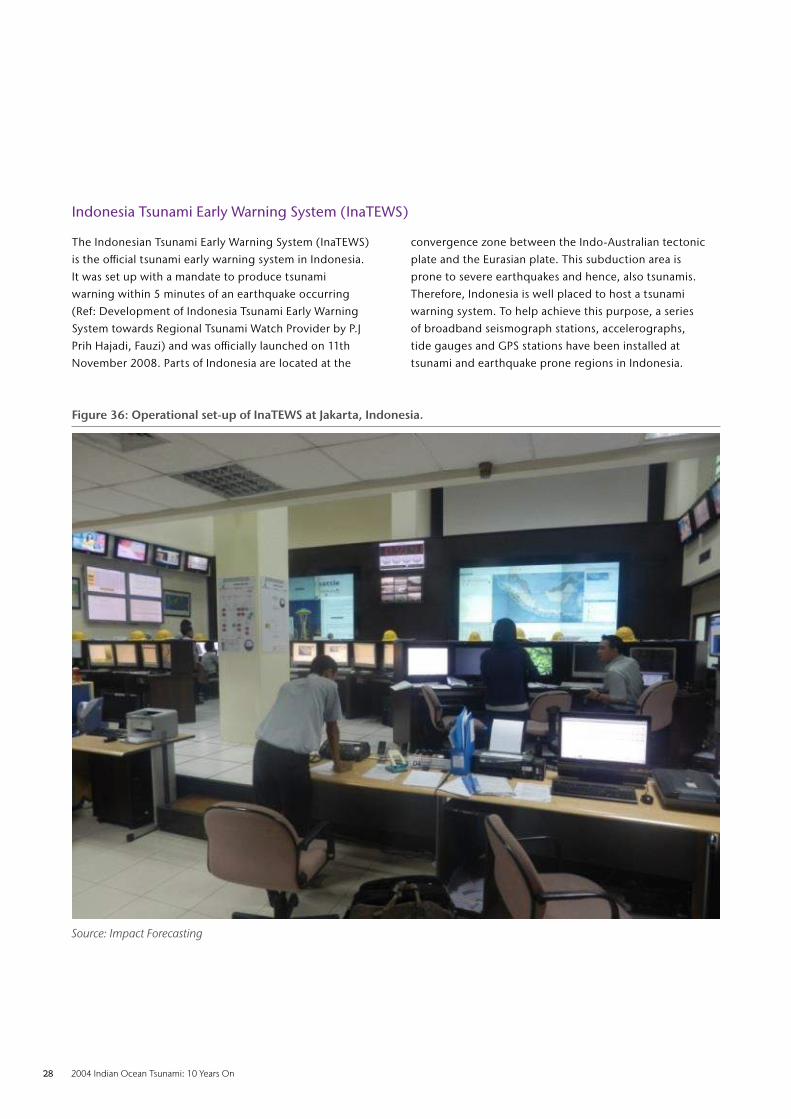
The Indonesian Tsunami Early Warning System (InaTEWS)
is the official tsunami early warning system in Indonesia.
It was set up with a mandate to produce tsunami
warning within 5 minutes of an earthquake occurring
(Ref: Development of Indonesia Tsunami Early Warning
System towards Regional Tsunami Watch Provider by P.J
Prih Hajadi, Fauzi) and was officially launched on 11th
November 2008. Parts of Indonesia are located at the
convergence zone between the Indo-Australian tectonic
plate and the Eurasian plate. This subduction area is
prone to severe earthquakes and hence, also tsunamis.
Therefore, Indonesia is well placed to host a tsunami
warning system. To help achieve this purpose, a series
of broadband seismograph stations, accelerographs,
tide gauges and GPS stations have been installed at
tsunami and earthquake prone regions in Indonesia.
Source: Impact Forecasting
Figure 36: Operational set-up of InaTEWS at Jakarta, Indonesia.

Aon Benfield 29
Source: InaTEWS
The operational component is denoted by agencies like the
BMKG (Meteorological, Climatological and Geophysical
Agency), Indonesian Geospatial Information Agency
(Badan Informasi Geospasial, BIG) and BPPT (Agency for
the assessment and application of technology). These
departments are primarily involved in monitoring the
situation, processing and analyzing information, and
issuing and disseminating warnings in case of an event.
Earthquake monitoring is performed via a network
of seismographs (163 broadband stations), and 259
accelerographs, while land deformation is assessed by
30 GPS stations. Sea level is monitored by DART–buoys
(Deep-ocean Assessment and Reporting of Tsunamis)
and tide gauges (113 stations). The information from the
different monitoring stations and networks is transmitted
to a central monitoring center via satellite communication.
Figure 37: Network of seismic stations in and around Indonesia.

30 2004 Indian Ocean Tsunami: 10 Years On
Source: InaTEWS
Source: InaTEWS
Figure 38: Network of tsunami sirens in Indonesia.
Figure 39: CCTV monitoring at InaTEWS office.
Aon Benfield 31
The mitigation and emergency response is undertaken
by BNPB (Indonesia’s National Disaster Relief Agency)
and other government and private agencies (such as
local governments at provincial, district and municipal
levels, national and local television and radio stations,
the Indonesian military, the National Indonesian
Police, communities at risk, cellular service providers,
managers of hotels/tourist sites) which can respond
appropriately after an event and keep the public aware
and prepared at other times. Satellite communications
are useful here as well. Once it is confirmed that a
tsunami has been generated, other devices of mass
communication, such as sirens (Figure 38), are deployed
to inform a large number of people about the danger
and warning them to relocate to higher ground.
The capacity building component comprises of LIPI
(Indonesian Institute of Sciences) and ITB (Bandung
Institute of Technology) which assist in research and
development and in building human and other resources
to tackle the tsunami risk in the region. Based on
previous tsunamis and their characteristics, tsunami
modeling is also pursued at these institutions.
In addition to being an effort at a multi-institutional
level, InaTEWS has been developed with assistance
at the multi-national level. InaTEWS is also a regional
tsunami watch provider and provides warnings
to other nations in the ASEAN region.
Other Countries: It is to be noted that several countries
in the region operate their own tsunami warning systems:
like the National Disaster Warning Centre in Thailand,
Malaysia Meteorological Services in Malaysia and
Department of Meteorology and Hydrology in Myanmar.

32 2004 Indian Ocean Tsunami: 10 Years On
Preparedness and communication
Given the very short warning lead time, preparedness
is key to mitigating the losses from a tsunami event. As
such, creating public awareness about the appropriate
response (such as following the instructions/signs,
reaching higher grounds and tsunami shelters etc.)
and education about the peril is essential.
Prior to 2004, there was no real-time earthquake monitoring
in Indian Ocean; but now, several countries operate real-
time seismic networks and are capable of estimating the
event parameters within 10 minutes of the occurrence.
Establishment of monitoring and warning systems in different
territories and coordination activities among different
agencies in disseminating the information stands out as a
marked improvement from the past. Television, radio, phone,
fax, email, SMS, etc. are all now used to issue warnings and
advisories to the general public and communities at risk.
Source: Impact Forecasting
Figure 40: Tsunami evacuation sign and escape building in Banda Aceh.

Aon Benfield 33
The first real test of the system was when a Mw8.6
earthquake struck to the southwest of Banda Aceh in
April 2012. The RTSPs in India, Indonesia and Australia
issued the warnings within a few minutes of the
occurrence of the event. Ultimately no tsunami was
generated by the quake but it provided an opportunity
to assess the effectiveness of the system and identify
areas where improvements were still required.
More recently, a mock test of the system was undertaken
in September 2014 when the three RTSPs issued warnings
based on computer-simulated earthquake and tsunami
scenarios. 24 countries took part in the exercise with
many countries undertaking public evacuation exercises.
The test was designed to assess the effectiveness of
communication flows between the agencies involved,
country readiness, and the efficiency of emergency
procedures. Preliminary results from the exercise suggest
that, ten years on from the event that inspired the
development of the basin-wide tsunami warning system,
the region is now much better prepared for such incidents.
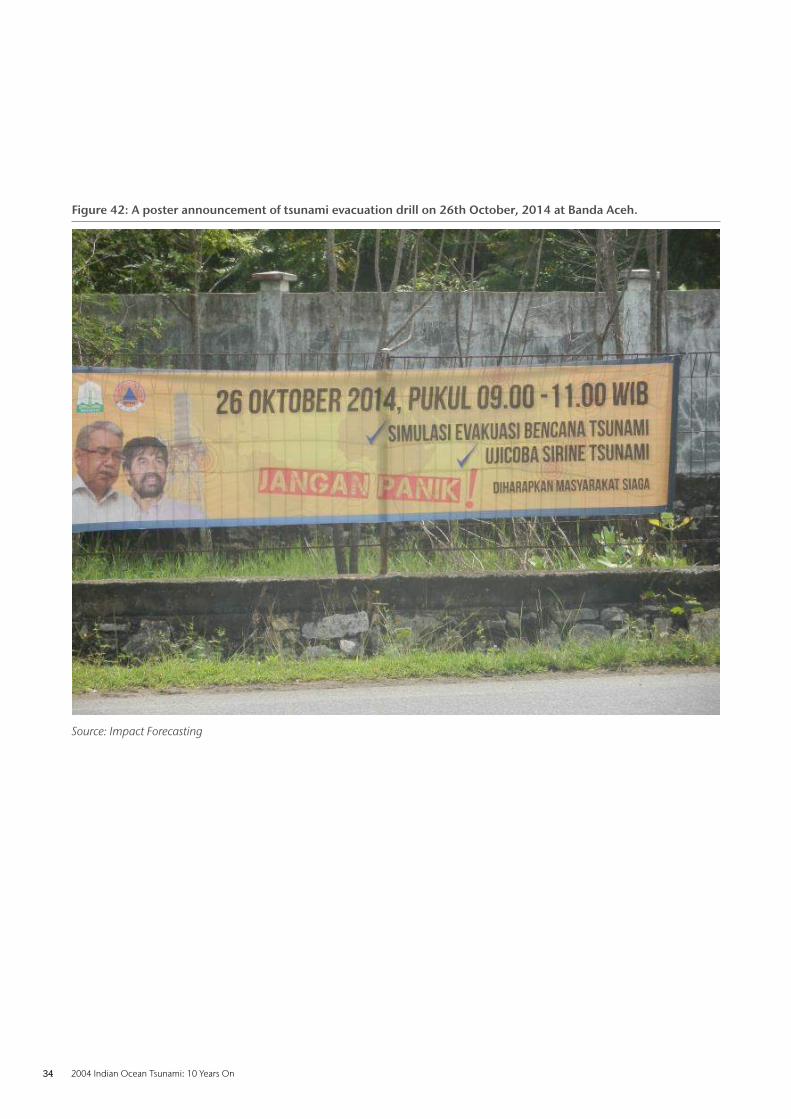
Some challenges in tsunami risk management include
issuing quick and accurate warnings to regions near the
source, maintenance of expensive equipment and the
improvement in public response to the warnings. For
example, when an earthquake of Mw8.5 occurred near
Aceh in 2012, people did not approach higher elevations or
evacuation buildings but instead they ran farther inland. This
highlights the need for creating further safety awareness,
active community participation and the effective last
mile connectivity for warning dissemination. The recent
“Indian Ocean Wave 14” tsunami simulation exercises
involving 24 nations in the region during September 2014
and the evacuation drill in Banda Aceh on 26th October
2014 (Figure 42) are positive steps in this direction.
Courtesy: Dr. Poh Poh Wong
Figure 41: Tsunami evacuation route map, warning tower, height marker and shelter in Thailand.
34 2004 Indian Ocean Tsunami: 10 Years On
Source: Impact Forecasting
Figure 42: A poster announcement of tsunami evacuation drill on 26th October, 2014 at Banda Aceh.

Aon Benfield 35
Due to the low insurance penetration in the regions
affected by 2004 Indian Ocean tsunami, the insured losses
were relatively low. However, the recent devastating
tsunami events such as 2010 Maule in Chile and 2011
Tohoku in Japan caused significant industry losses
leading to a need to understand and quantify the risk
from this secondary peril, in particular in the APAC
region as the exposures continue to grow rapidly.
Impact Forecasting, Aon Benfield’s catastrophe model
development center of excellence, has developed
tsunami models for Japan and Chile, and implemented
them on its proprietary loss calculation platform
ELEMENTS. Impact Forecasting recently collaborated
with Deltares (one of the research partners of Aon
Benfield) on different tsunami risk assessment projects.
The following paragraphs discuss some of the tsunami
risk assessment initiatives undertaken by Aon Benfield.
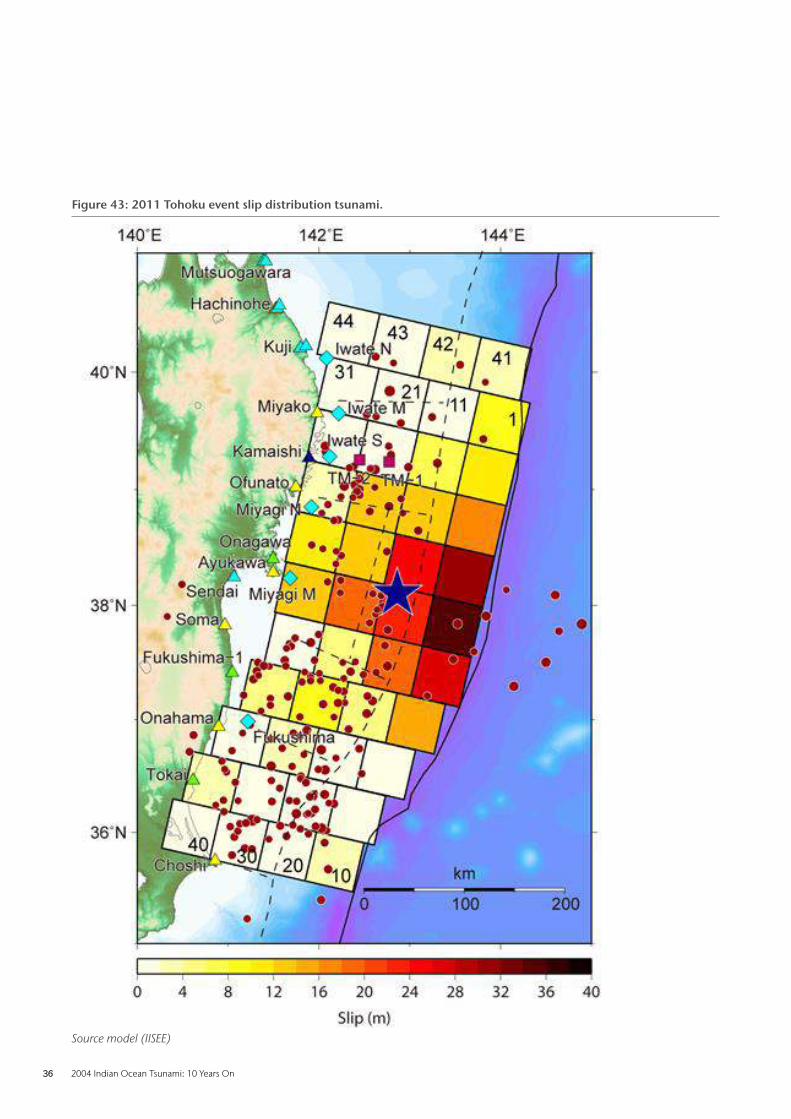
1. Japan tsunami scenario model
The Japan tsunami scenario model is based on
information gathered from scientific publications
and the Japanese Government Cabinet office. The
model has been developed in-house but evaluated
together with local academics from Japan. The
following scenario events are available for analyses:
List of events.
Event ID Event name Magnitude (Mw) Source
1 Kanto 1923 8.0 Kobayashi and Koketsu 2005
2 1703 Genroku-Kanto 8.2 Shishikura et al 2005
3 Tohoku 9.1 IISEE
4 – 15 Nankai 9.0 Government Cabinet’s office 2012
Aon Benfield’s tsunami modeling initiatives
36 2004 Indian Ocean Tsunami: 10 Years On
Figure 43: 2011 Tohoku event slip distribution tsunami.
Source model (IISEE)

Aon Benfield 37
2. Chile Tsunami probabilistic and scenario model
Impact Forecasting’s Chile earthquake and tsunami model is
the first model on the market that includes both probabilistic
and scenario tsunami components as the secondary peril
to the earthquake component (Ref: A Probabilistic model
for Chile: Rara V et al, 2014). The tsunami probabilistic
event set contains 3,700 events and the historical includes
1960 Mw9.5 Valdivia and 5 variations of 2010 Mw8.8
Maule event. The tsunami hazard is defined in terms
of inundation depth and velocity. Wave propagation
and inland inundation (flooding) is modelled using 2-D
hydraulic software Delft3D (Deltares). An original set of
tsunami damage curves is developed for general and
detailed construction and occupancy classes reflecting
the particularities of the Chilean construction practice.
Source: GEER team report, SRTM, Impact Forecasting
Figure 44: Validation of the simulated and observed tsunami extent for 2010 Maule event in Talcahuano.

38 2004 Indian Ocean Tsunami: 10 Years On
3. Jakarta tsunami scenario
As part of the Jakarta Coastal Defence Strategy (JCDS,
Deltares 2009-2012) a tsunami model was developed by
Deltares for Jakarta based on the worst case hypothetical
tsunamigenic earthquake along the Sunda Strait. Figure
45 shows the inundation depths generated using
the hypothetical scenario. Aon Benfield will examine
further to implement a scenario on ELEMENTS.
Source: Deltares; background imagery: Google Earth
Figure 45: Screenshot showing the simulated inundation depths using a hypothetical worst case scenario for Jakarta.
4. Hong Kong and PRD Tsunami study
Aon Benfield engaged an external agency to investigate the
probabilistic tsunami hazard for Hong Kong and the Pearl
River Delta region caused by earthquake sources around the
South China Sea. As shown in Figures 46 and 47, the Manila
Trench is determined as the dominant tsunami source in the
South China Sea for Hong Kong and Shenzen while sources
from the Indonesian archipelago were also considered.

Aon Benfield 39
Figure 46: Source and magnitude disaggregation map of Hong Kong, 475 average return period; the northern section of Manila Trench poses the most significant risk to Hong Kong.
Figure 47: Source and magnitude disaggregation map of Shenzhen, 475 average return period; the southern section of the Manila trench has greater impact while Hong Kong islands provide sheltering effect.
40 2004 Indian Ocean Tsunami: 10 Years On
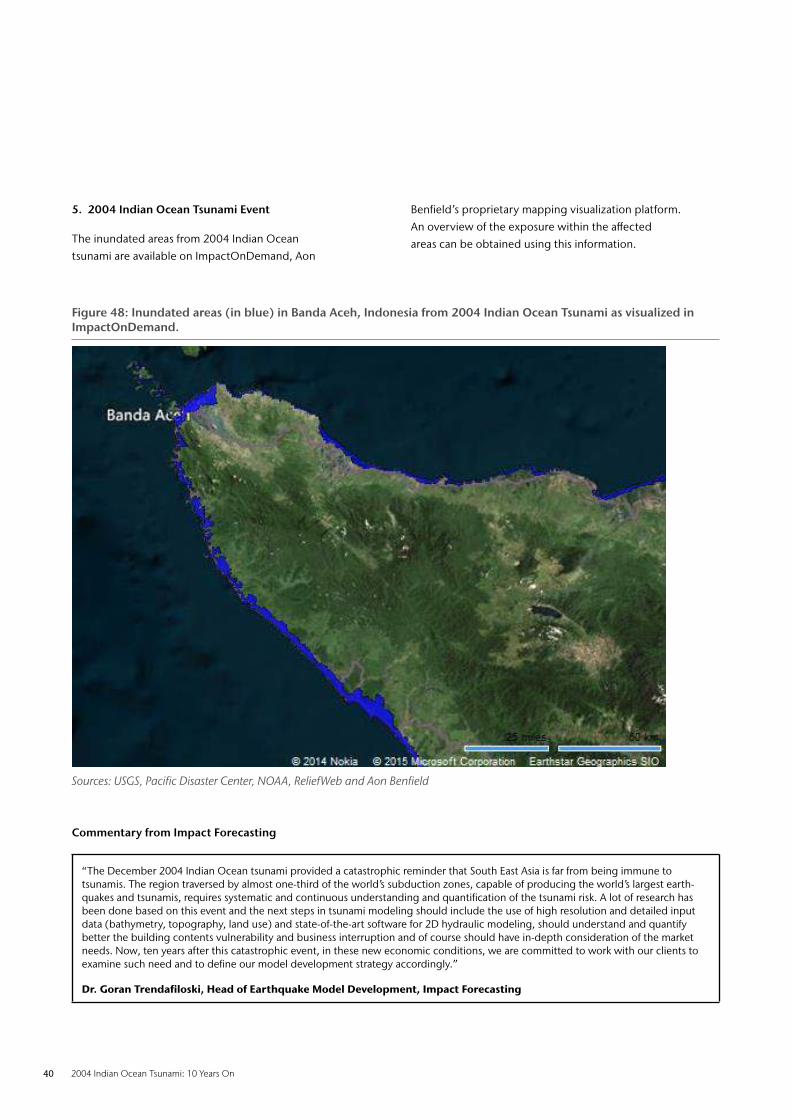
5. 2004 Indian Ocean Tsunami Event
The inundated areas from 2004 Indian Ocean
tsunami are available on ImpactOnDemand, Aon
Benfield’s proprietary mapping visualization platform.
An overview of the exposure within the affected
areas can be obtained using this information.
Commentary from Impact Forecasting
“The December 2004 Indian Ocean tsunami provided a catastrophic reminder that South East Asia is far from being immune to tsunamis. The region traversed by almost one-third of the world’s subduction zones, capable of producing the world’s largest earth-quakes and tsunamis, requires systematic and continuous understanding and quantification of the tsunami risk. A lot of research has been done based on this event and the next steps in tsunami modeling should include the use of high resolution and detailed input data (bathymetry, topography, land use) and state-of-the-art software for 2D hydraulic modeling, should understand and quantify better the building contents vulnerability and business interruption and of course should have in-depth consideration of the market needs. Now, ten years after this catastrophic event, in these new economic conditions, we are committed to work with our clients to examine such need and to define our model development strategy accordingly.”
Dr. Goran Trendafiloski, Head of Earthquake Model Development, Impact Forecasting
Sources: USGS, Pacific Disaster Center, NOAA, ReliefWeb and Aon Benfield
Figure 48: Inundated areas (in blue) in Banda Aceh, Indonesia from 2004 Indian Ocean Tsunami as visualized in ImpactOnDemand.
Aon Benfield 41
Tsunami insurance coverage in Asia Pacific
One aspect of tsunamis that make them different to other
insured hazards is the potential for wide geographical extent
of their impact, as well as their impact on a wide range of
insurance classes. With some exceptions, insurance cover
for losses resulting from tsunamis appears to be widely
available. A summary of the general availability of insurance
cover for tsunami losses from insurance companies in
select territories in Asia Pacific is given in Appendix 3.
Catastrophe Reinsurance
Reinsurance for catastrophe losses arising from tsunamis
appears to be fully available without any significant
exclusions. However in line with normal practice, reinsurance
only covers tsunami losses if the primary insurance company
includes it in their policy terms, since a reinsurance
contract is subject to the policy conditions used by the
primary company being followed in the event of losses.
Property Insurance
In most Asian countries indemnity is usually provided for
tsunami losses under named perils policies in association
with either earthquake or flood cover, depending on the
country, or covered under an all risk policy in the case
of larger commercial and industrial businesses. In Asian
countries it is most commonly associated with flood
cover; however in Malaysia and Indonesia, it is clubbed
with earthquake coverage. The relatively low levels of
insurance losses in the 2004 Indian Ocean tsunami was
primarily due to the low penetration of insurance cover
generally in the areas affected and even lower levels of
extensions to earthquake, flood and other major perils.
While most residential property insurance policies in the
region exclude tsunami cover, most standard commercial
and industrial policies cover it. A common proviso indicating
that should the damage be ‘caused by or arising out of an
earthquake or seismological disturbance’ may be the cause of
contention in the event of losses from earthquake-generated
tsunami, with insurers arguing that the proximate cause is the
tsunami and not the earthquake or seismological disturbance.
However by excluding ‘tidal wave’, the old colloquial term
for tsunami, but including the phrase ‘or seismological
disturbance’, which many would interpret as including
tsunamis, some insurance companies may find themselves
liable for earthquake-generated tsunami losses even if this is
not their intention. Special policies for larger commercial and
industrial business often do not have the seawater exclusion.
42 2004 Indian Ocean Tsunami: 10 Years On
Closing Remarks
Revisiting and learning from the devastating event can
offer opportunities to reduce vulnerabilities and risks. The
destruction caused by the 2004 Indian Ocean tsunami
underlined the under-preparedness of the region in the
event of such massive disaster. There was no organized
approach to alert communities across the Indian Ocean
that a calamitous wave was approaching their coasts.
However, after a decade, several countries in the region
are now equipped with the scientific know-how and
instruments to forewarn the public in case of a possible
disaster and are better prepared to face such events.
But, as ever, challenges like effective maintenance of the
warning systems which requires continuous funding,
information dissemination to all the vulnerable groups,
disaster response and infrastructure resilience remain.
There has been a substantial amount of work from research
and academic institutions to understand more about
the tsunami peril in recent years. Various institutions
[e.g. TDMRC (Tsunami and Disaster Mitigation Research
Centre, Banda Aceh)] have been specifically set up to
study and explore potential ways to mitigate the risk
from tsunamis. It is now generally known that tsunamis
are not as rare as they were formerly perceived to be.
The insurance industry can play a vital role in rebuilding
after such catastrophic events. The insured losses were
relatively small when compared to the large economic
losses during the 2004 Indian Ocean tsunami and
rebuilding has largely depended on external funding
and aid; however, as the insurance penetration rates
continue to grow in the region, one could expect more
resilience against economic disruptions arising from such
events which would alleviate the loss burden. In this
milieu, the insurance industry, via better risk assessment
approaches, development of suitable products and risk
transfer mechanisms can support loss mitigation and
economic recovery following such natural disasters.

Aon Benfield 43
Year Magnitude Country Name Latitude Longitude Runup Height
1908 7.5 INDONESIA SW. SUMATRA -2 100 1.4
1917 6.6 INDONESIA BALI SEA -7 116 2
1921 7.5 INDONESIA JAVA -11 111 0.1
1930 6 INDONESIA SOUTH OF JAVA -5.6 105.3 1.5
1930 6.5 INDONESIA SOUTH OF JAVA -9.3 114.3 0.1
1931 7.4 INDONESIA SW. SUMATRA -5 102.7 1
1941 7.6 INDIA ANDAMAN SEA, E. COAST INDIA 12.5 92.5 1.5
1945 8 PAKISTAN MAKRAN COAST 24.5 63 17
1957 5.5 INDONESIA SOUTH OF JAVA -8.2 107.3 0.7
1977 8 INDONESIA SUNDA ISLANDS -11.1 118.4 15
1982 5.4 INDONESIA JAVA TRENCH 4.3 97.7 0.1
1982 6.6 INDONESIA SUMBAWA ISLAND -9.2 118.4 0.1
1983 7.7 UK TERRITORY CHAGOS ARCHIPELAGO REGION -6.8 72.1 1.5
1985 6.2 INDONESIA BALI ISLAND -9.2 114.1 2
1987 6.6 INDONESIA TIMOR SEA -8.2 124.1 0.1
1992 7.8 INDONESIA FLORES SEA -8.4 121.8 26.2
1994 7.8 INDONESIA SOUTH OF JAVA -10.4 112.8 13.9
1994 6.6 INDONESIA SOUTH OF JAVA -10.3 112.8 3.7
1994 6.1 INDONESIA SOUTH OF JAVA -10.3 113.3 3
1995 6.9 INDONESIA TIMOR SEA -8.4 125 4
2000 7.9 AUSTRALIA SOUTH INDIAN OCEAN -13.8 97.4 0.3
2004 9.1 INDONESIA OFF W. COAST OF SUMATRA 3.3 95.8 50.9
2005 8.7 INDONESIA INDONESIA 2 97.1 4.2
2005 6.7 INDONESIA KEPULAUAN MENTAWAI -1.6 99.6 0.4
2006 7.7 INDONESIA SOUTH OF JAVA -9.2 107.4 20.9
2007 8.4 INDONESIA SUMATRA -4.4 101.3 5
2008 6.5 INDONESIA SUMATRA -2.4 99.9 0.12
2009 7.5 INDIA ANDAMAN ISLANDS 14.1 92.8 0.01
2009 6.7 INDONESIA SUMATRA -1.4 99.4 0.18
2009 7.5 INDONESIA SUMATRA -0.7 99.8 0.27
2010 7.8 INDONESIA SUMATRA 2.3 97.1 0.44
2010 7.5 INDIA LITTLE NICOBAR ISLAND 7.8 91.9 0.03
2010 7.8 INDONESIA SUMATRA -3.4 100.1 9.3
(Source: NOAA)
Appendix 1. Indian Ocean tsunami observations between 1900 and 2014
44 2004 Indian Ocean Tsunami: 10 Years On
Appendix 2. Useful Internet Links
Web Link Information on Tsunamis and 2004 Indian Ocean Tsunami
http://www.pmel.noaa.gov/tsunami/sumatra20041226.html
US NOAA web site containing extensive links to reports and studies on 2004 Indian Ocean tsunami
http://www.drs.dpri.kyoto-u.ac.jp/sumatra/index-e.html
Extensive links to reports and studies of 2004 Indian Ocean tsunami and general information on tsunamis
http://www.tsunami2004.net/tsunami-2004-facts/
Website contains information about 2004 Indian Ocean tsunami
Tsunami Databases
http://www.ngdc.noaa.gov/hazard/tsu_db.shtml
World-wide historical database of tsunami events maintained by the national Geophysical
Data centre of NOAA, the US government meteorological organization.
http://tsun.sscc.ru/On_line_Cat.htm
Historical tsunami database compiled by Institute of Computational and Mathematical Geophysics,
Novosibirsh, Russia. Includes 1490 Pacific Ocean events dating from 47BC, 260 Atlantic Ocean events dating
from 60BC, and 548 Mediterranean Sea events dating from 1628BC – but no Indian Ocean events.
Tsunami Warning Centers
http://www.bom.gov.au/tsunami/about/jatwc.shtml
The Joint Australian Tsunami Warning Centre (JATWC) is operated by the Bureau
of Meteorology (Bureau) and Geoscience Australia (GA).
http://www.tsunami.incois.gov.in/ITEWS/HomePage.do
Indian National Centre for Ocean Information Sciences (INCOIS) based in Hyderabad, India
https://inatews.bmkg.go.id/new/
Indonesia Tsunami Early Warning System, Jakarta, Indonesia
Others – General
http://www.nerc-bas.ac.uk/tsunami-risks/
Information on tsunami occurrences and risk
http://walrus.wr.usgs.gov/tsunami/
US Geological Survey tsunami site.
http://www.tsunami.noaa.gov/
US NOAA tsunami site. Extensive information on nature of tsunamis, studies of different tsunamis, and emergency response.
http://itic.ioc-unesco.org/index.php
Web site of the International Tsunami Information Centre (ITIC) established by the International Oceanic Commission (IOC)
http://nctr.pmel.noaa.gov/model.html
Information on tsunami modeling and research from NOAA Center for Tsunami Research
http://www.ioc-tsunami.org/index.php?option=com_content&view=article&id=8&Itemid=13&lang=en
Link to Indian Ocean page of Intergovernmental Oceanographic Commission (IOC)
http://ioc.unesco.org/itsu/

Aon Benfield 45
Web site of the International Co-ordination Group for the Tsunami Warning System in the Pacific
http://iotic.ioc-unesco.org/
Indian Ocean Tsunami Information Centre located in UNESCO office at Jakarta, Indonesia;
established by The Intergovernmental Oceanographic Commission (IOC) of UNESCO
http://www.itc.nl/library/tsunami.asp
Website of ITC, Netherlands to publications and websites containing information on tsunamis
http://www.earthobservatory.sg/
Earth Observatory of Singapore; an institution with research focus on the geohazards in and around Southeast Asia
Others – Indian Ocean Tsunami
http://walrus.wr.usgs.gov/tsunami/indianocean.html
US Geological Survey studies and reports on 2004 Indian Ocean Tsunami
http://en.wikipedia.org/wiki/2004_Indian_Ocean_earthquake
Wikipedia encyclopedia report.

46 2004 Indian Ocean Tsunami: 10 Years On
Appendix 3. Availability of tsunami insurance cover in Asia Pacific region
Country Domestic property policies
Not Covered
Standard Cover
Earthquake Extension
Flood Extension
Comments
Bangladesh X Policy excludes loss caused as a
direct result of earthquake.
China X Tsunami is a standard exclusion in all
domestic policies but it can be covered
by Tsunami Extension with sub-limit
around 80% of sum insured.
India X Earthquake Extension covers Tsunami losses.
Indonesia X Not covered under Indonesian Fire
standard policy. Will be covered
under the EQ Pool scheme.
Korea X Exclusion under local standard policies.
Malaysia X Earthquake Extension covers Tsunami losses;
extension requires additional premium.
Maldives X Earthquake Extension covers Tsunami losses.
Philippines X By specific exclusion, but cover
may be re-purchased.
Sri Lanka X Earthquake Extension covers Tsunami losses.
Taiwan X Definition of Flood is including surge and
therefore presumed to be covered.
Thailand X Earthquake Extension covers Tsunami losses.
Vietnam X X Extension possible using the Flood and
Earthquake extensions. Earthquake
extensions are rarely used.
Japan X Earthquake Extension covers Tsunami losses.
Australia X Provides explicit coverage for:
Earthquake, Tsunami that happens as
a result of an earthquake, Landslide or
subsidence that happens immediately
as a result of an earthquake.
New Zealand X Covered by combination of national
government earthquake insurance
scheme (EQC) and private sector
While an attempt has been made to provide a general overview of tsunami insurance coverage in different territories
via the following tables, there might a few exceptions (or deviations from) to the information outlined below.
Aon Benfield 47
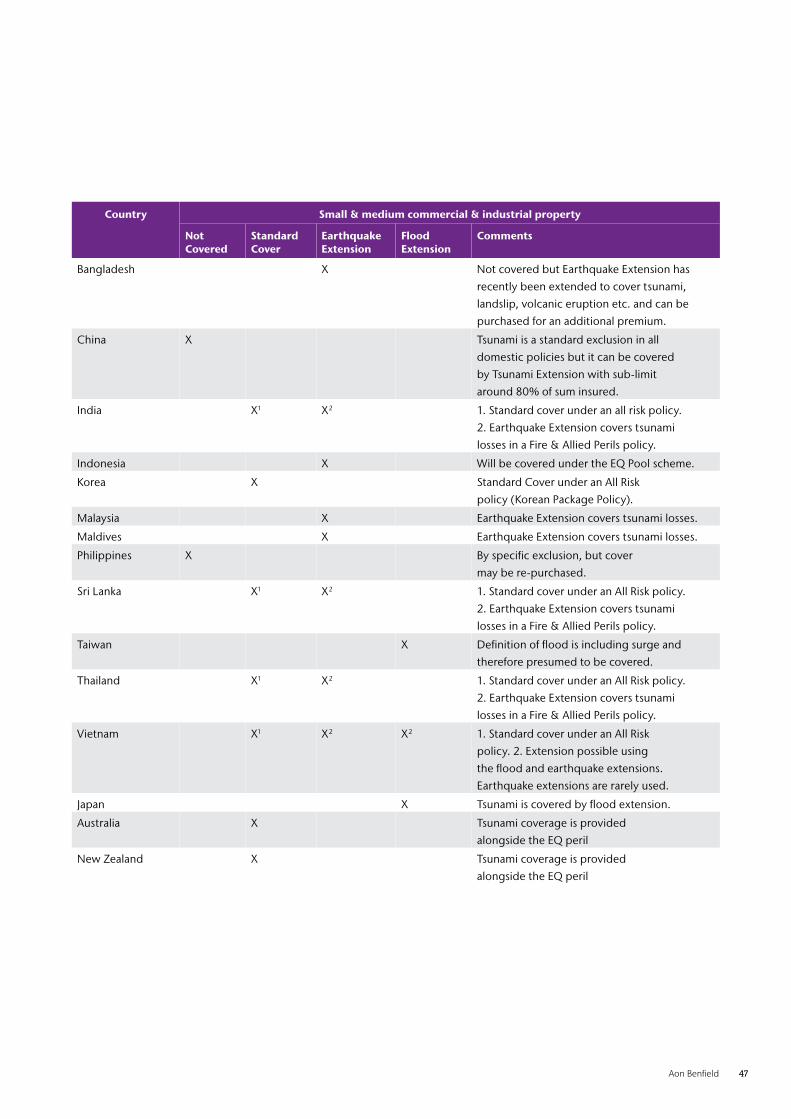
Country Small & medium commercial & industrial property
Not Covered
Standard Cover
Earthquake Extension
Flood Extension
Comments
Bangladesh X Not covered but Earthquake Extension has
recently been extended to cover tsunami,
landslip, volcanic eruption etc. and can be
purchased for an additional premium.
China X Tsunami is a standard exclusion in all
domestic policies but it can be covered
by Tsunami Extension with sub-limit
around 80% of sum insured.
India X1 X2 1. Standard cover under an all risk policy.
2. Earthquake Extension covers tsunami
losses in a Fire & Allied Perils policy.
Indonesia X Will be covered under the EQ Pool scheme.
Korea X Standard Cover under an All Risk
policy (Korean Package Policy).
Malaysia X Earthquake Extension covers tsunami losses.
Maldives X Earthquake Extension covers tsunami losses.
Philippines X By specific exclusion, but cover
may be re-purchased.
Sri Lanka X1 X2 1. Standard cover under an All Risk policy.
2. Earthquake Extension covers tsunami
losses in a Fire & Allied Perils policy.
Taiwan X Definition of flood is including surge and
therefore presumed to be covered.
Thailand X1 X2 1. Standard cover under an All Risk policy.
2. Earthquake Extension covers tsunami
losses in a Fire & Allied Perils policy.
Vietnam X1 X2 X2 1. Standard cover under an All Risk
policy. 2. Extension possible using
the flood and earthquake extensions.
Earthquake extensions are rarely used.
Japan X Tsunami is covered by flood extension.
Australia X Tsunami coverage is provided
alongside the EQ peril
New Zealand X Tsunami coverage is provided
alongside the EQ peril

48 2004 Indian Ocean Tsunami: 10 Years On
Country Large commercial & industrial property (including ISR)
Not Covered
Standard Cover
Earthquake Extension
Flood Extension
Comments
Bangladesh X Not covered but Earthquake Extension has
recently been extended to cover tsunami,
landslip, volcanic eruption etc. and can be
purchased for an additional premium.
China X Tsunami is a standard exclusion in all
domestic policies but it can be covered
by Tsunami Extension with sub-limit
around 80% of sum insured.
India X1 X2 1. Standard cover under an All Risk policy.
2. Earthquake Extension covers tsunami
losses in a Fire & Allied Perils policy.
Indonesia X Will be covered under the EQ Pool scheme.
Korea X Standard cover under an All Risk
policy (Korean Package Policy).
Malaysia X Earthquake Extension covers tsunami losses.
Maldives X Earthquake Extension covers tsunami losses.
Philippines X By specific exclusion, but cover
may be re-purchased.
Sri Lanka X1 X2 1. Standard cover under an All Risk policy.
2. Earthquake Extension covers tsunami
losses in a Fire & Allied Perils policy.
Taiwan X Covered under All Risk policy.
Thailand X1 X2 1. Standard cover under an All Risk policy.
2. Earthquake Extension covers tsunami
losses in a Fire & Allied Perils policy.
Vietnam X1 X2 X2 1. Standard cover under an All Risk
policy. 2. Extension possible using
the flood and earthquake extensions.
Earthquake extensions are rarely used.
Japan X Tsunami is covered by flood extension.
Australia X ISR
New Zealand X

Aon Benfield 49
Country Motor
Not Covered
Standard Cover
Earthquake Extension
Flood Extension
Comments
Bangladesh X Policy does not exclude tsunami.
Presumed to be covered.
China X Policy does not exclude tsunami.
Presumed to be covered.
India X
Indonesia X Tsunami and earthquake are covered
under Act of God extension.
Korea X
Malaysia X X Both earthquake and flood extensions
cover tsunami losses; extension
requires additional premium.
Maldives X
Philippines X By specific exclusion, but cover
may be re-purchased.
Sri Lanka X
Taiwan X X Earthquake and flood extension are
included under the same extension.
Thailand X
Vietnam X
Japan X Some policies cover tsunami as indemnity
and some cover it as expense.
Australia X
New Zealand X

50 2004 Indian Ocean Tsunami: 10 Years On
Country Workers’ Compensation
Not Covered
Standard Cover
Earthquake Extension
Flood Extension
Comments
Bangladesh X Policy does not exclude tsunami.
Presumed to be covered.
China X Policy does not exclude tsunami.
Presumed to be covered.
India X
Indonesia X
Korea X It appears to be absolute exclusion
under local standard policies.
Malaysia X Policy does not exclude tsunami.
Presumed to be covered.
Maldives X
Philippines X
Sri Lanka X
Taiwan X Policy does not exclude tsunami.
Presumed to be covered.
Thailand X Policy does not exclude tsunami.
Presumed to be covered.
Vietnam X
Japan X Presumed to be covered.
Australia X
New Zealand X
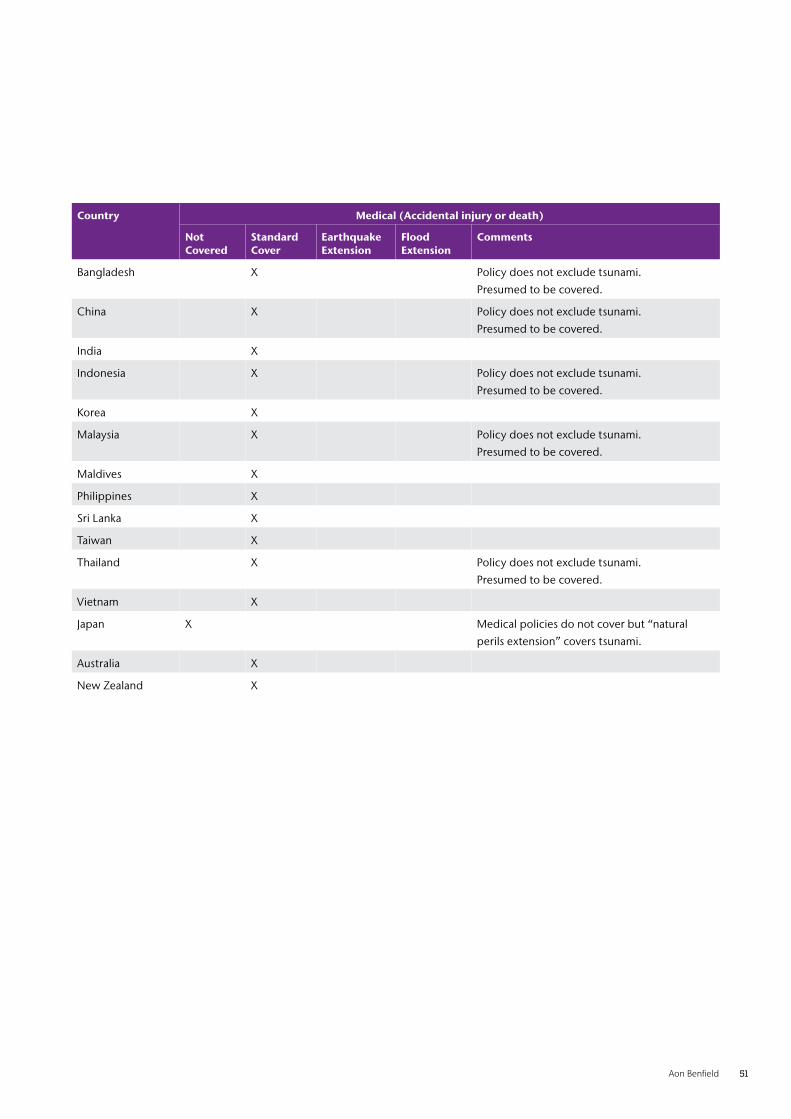
Aon Benfield 51
Country Medical (Accidental injury or death)
Not Covered
Standard Cover
Earthquake Extension
Flood Extension
Comments
Bangladesh X Policy does not exclude tsunami.
Presumed to be covered.
China X Policy does not exclude tsunami.
Presumed to be covered.
India X
Indonesia X Policy does not exclude tsunami.
Presumed to be covered.
Korea X
Malaysia X Policy does not exclude tsunami.
Presumed to be covered.
Maldives X
Philippines X
Sri Lanka X
Taiwan X
Thailand X Policy does not exclude tsunami.
Presumed to be covered.
Vietnam X
Japan X Medical policies do not cover but “natural
perils extension” covers tsunami.
Australia X
New Zealand X

52 2004 Indian Ocean Tsunami: 10 Years On
Appendix 4. Remnants and Reminders of 2004 Indian Ocean tsunami
Figure 50: Recent (Oct 2014) views of Lampuk (left) and Lhoknga (right) beaches, Indonesia which were affected during the event.
Figure 49: Top: ‘Aceh Thanks to the World’ monument at Blang Padang in Banda Aceh; it is a symbol of gratitude to the support extended after the disaster. Down: Tsunami museum at Banda Aceh (left picture); the museum houses many photos and videos related to the event including the names of the victims (picture on the right).
Source: Impact Forecasting
Source: Impact Forecasting
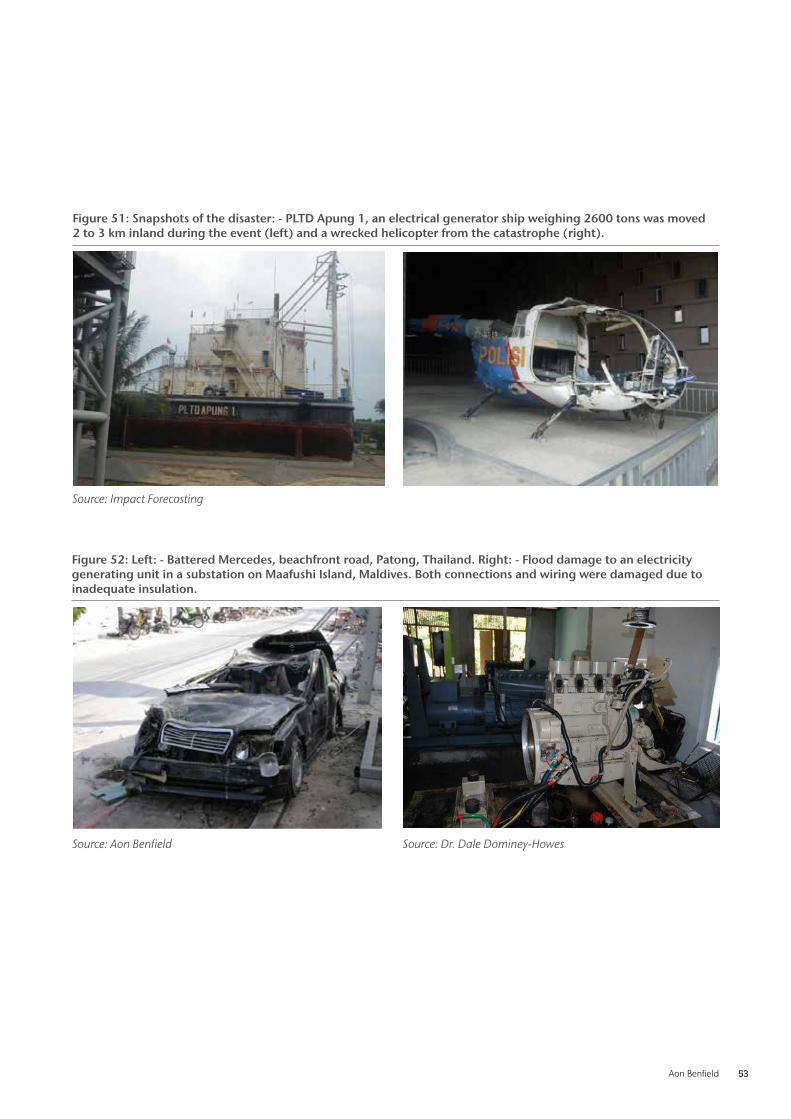
Aon Benfield 53
Figure 51: Snapshots of the disaster: - PLTD Apung 1, an electrical generator ship weighing 2600 tons was moved 2 to 3 km inland during the event (left) and a wrecked helicopter from the catastrophe (right).
Figure 52: Left: - Battered Mercedes, beachfront road, Patong, Thailand. Right: - Flood damage to an electricity generating unit in a substation on Maafushi Island, Maldives. Both connections and wiring were damaged due to inadequate insulation.
Source: Impact Forecasting
Source: Dr. Dale Dominey-HowesSource: Aon Benfield

54 2004 Indian Ocean Tsunami: 10 Years On
Source: Impact Forecasting
Figure 53: One of the tsunami sirens installed at Banda Aceh, Indonesia.

Aon Benfield 55
References
[1] Asian Disaster Prepared Center, http://cmsdata.iucn.org/downloads/social_and_
economic_impact_of_december_2004_tsunami_apdc.pdf
[2] Department of Ocean Development (2005) Preliminary Assessment of Impact of Tsunami in
Selected Coastal Areas of India compiled by Department of Ocean Development, Integrated
Coastal and Marine Area Management, Project Directorate, Chennai, India.
[3] Geocities, www.geocities.com
[4] Haque C. E., Nirupama N., Murty T. S., (2006) Nature itself does not cause a
disaster, In Natural Hazards & Disaster Mitigation pp 79:103
[5] Harjadi P.J.P., Fauzi (2009): Development of Indonesia Tsunami Early Warning System
(InaTEWS) toward Regional Tsunami Watch Provider (RTWP). - In: (Ed.), -DEWS-Midterm-
Conference 2009, DEWS Midterm Conference 2009 (Potsdam 2009), p. 10-10.
[6] Harjadi P.J.P., Fuazi, (2010) InaTEWS Concept and Implementation, from Agency
for Meteorology Climatology and Geophysics, Jakarta, Indonesia
[7] Mapsoftworld, www.mapsoftworld.com
[8] National Geophysical Data Center, http://www.ngdc.noaa.gov/hazard/tsu.shtml
[9] National Science Foundation, http://www.nsf.gov/news/news_summ.jsp?cntn_id=104179
[10] Nayak S., Kumar S.T. (2008) Addressing the Risk of Tsunami in the Indian Ocean, J South Asia Disaster Stud. 1(1): 45-57
[11] Nayak S., and Kumar S.T. (2008) Indian Tsunami Warning System, In: International Archives of Photogrammetry,
Remote Sensing and Spatial Information Sciences. Part B4, Beijing, XXXVII. pp 1501-1506
[12] Rara V., Arango C., Puncochar P., Trendafiloski G., Ewing Ch., Vatvani D., Chandler A. (2014) A Probabilistic
model for Chile, 11th International Conference on Hydroinformatics, New York City, USA, August 2014
[13] U.S. Geological Survey, http://www.usgs.gov/

56 2004 Indian Ocean Tsunami: 10 Years On
Acknowledgements
We would like to thank Mr. Nicolas Arcos (NOAA), Prof Russell Blong, Dr. Patrick Daley, Dr. Dale Dominey-
Howes, Mr. Shubharoop Ghosh, Mr. Ibnu Mundzir, Prof Tad Murty, Prof Ioan Nistor, Dr Mochammed Riyadi
(InaTEWS), Dr. T. Srinivas Kumar (INCOIS), Ms. M V Sunanda (INCOIS), Dr. George Walker, Dr. Poh Poh Wong
and the staff members at the following organizations: INCOIS, InaTEWS and TDMRC (Tsunami and Disaster
Mitigation Research Centre, Banda Aceh) for their support during the various stages of publication.

ContactsAdityam KrovvidiHead of Impact Forecasting Asia Pacific Singapore +65 6239 7651 [email protected]
Sastry DharaDirector, Impact Forecasting Singapore +65 6645 0137 [email protected]
Aon Benfield, a division of Aon plc (NYSE: AON), is the world’s leading reinsurance intermediary and full-service capital
advisor. We empower our clients to better understand, manage and transfer risk through innovative solutions and
personalized access to all forms of global reinsurance capital across treaty, facultative and capital markets. As a trusted
advocate, we deliver local reach to the world’s markets, an unparalleled investment in innovative analytics, including
catastrophe management, actuarial and rating agency advisory. Through our professionals’ expertise and experience, we
advise clients in making optimal capital choices that will empower results and improve operational effectiveness for their
business. With more than 80 offices in 50 countries, our worldwide client base has access to the broadest portfolio of
integrated capital solutions and services. To learn how Aon Benfield helps empower results, please visit aonbenfield.com.
© Impact Forecasting®. No claim to original government works. The text and graphics of this publication are provided for
informational purposes only. While Impact Forecasting® has tried to provide accurate and timely information, inadvertent
technical inaccuracies and typographical errors may exist, and Impact Forecasting® does not warrant that the information
is accurate, complete or current. The data presented at this site is intended to convey only general information on current
natural perils and must not be used to make life-or-death decisions or decisions relating to the protection of property,
as the data may not be accurate. Please listen to official information sources for current storm information. This data
has no official status and should not be used for emergency response decision-making under any circumstances.
© Aon plc. All rights reserved. No part of this document may be reproduced, tored in a retrieval
system, or transmitted in any form or by any means, electronic, mechanical, photocopying,
recording or otherwise. Impact Forecasting® is a wholly owned subsidiary of Aon plc.
About Aon Benfield

58 2004 Indian Ocean Tsunami: 10 Years On
Notes

Aon Benfield 59
Notes

About Aon Aon plc (NYSE:AON) is the leading global provider of risk management, insurance and reinsurance brokerage, and human resources solutions and outsourcing services. Through its more than 66,000 colleagues worldwide, Aon unites to empower results for clients in over 120 countries via innovative and effective risk and people solutions and through industry-leading global resources and technical expertise. Aon has been named repeatedly as the world’s best broker, best insurance intermediary, best reinsurance intermediary, best captives manager, and best employee benefits consulting firm by multiple industry sources. Visit aon.com for more information on Aon and aon.com/manchesterunited to learn about Aon’s global partnership with Manchester United.
© Aon plc 2015. All rights reserved.The information contained herein and the statements expressed are of a general nature and are not intended to address the circumstances of any particular individual or entity. Although we endeavor to provide accurate and timely information and use sources we consider reliable, there can be no guarantee that such information is accurate as of the date it is received or that it will continue to be accurate in the future. No one should act on such information without appropriate profes-sional advice after a thorough examination of the particular situation.
Risk. Reinsurance. Human Resources.