2004 aan active home equity market contributed to strong consumer loan activity, with home equity...
TRANSCRIPT

MA
RS
HA
LL
&
IL
SL
EY
CO
RP
OR
AT
IO
N
20
04
A
NN
UA
L
RE
PO
RT
TO
SH
AR
EH
OL
DE
RS
51162_FRONT COVER 3/1/05 8:08 AM Page 1

one 2004 Financial Highlights
two To Our Shareholders
five Honoring Jim Wigdale
seven Serving Our Customers
twelve Metavante Corporation – Forty Years of Innovation
twenty-three A Strong Commitment to Our Communities
twenty-four Marshall & Ilsley Corporation Mission Statement
Marshall & Ilsley Corporation Officers
twenty-five Marshall & Ilsley Corporation Board of Directors
twenty-six Affiliate Boards
thirty-six Selected Financial Data
forty-one Consolidated Financial Information
Management’s Discussion and Analysis of
Financial Position and Results of Operations
Consolidated Financial Statements
Management’s Report on Internal Control Over Financial Reporting
Reports of Independent Registered Public Accounting Firm
i n s i d e b a c k c o v e r Shareholder Information
Table of Contents
51162 M&I 3/1/05 7:44 AM Page 2

($000’s except share data) 2004 2003 2002
NET INCOME $627,086 $544,105 $480,327
PER SHARE
Diluted – Net Income $2.77 $2.38 $2.16
Dividends Declared 0.810 0.700 0.625
Shareholders’ Equity 17.24 15.00 13.51
FINANCIAL CONDITION – AVERAGE
Assets $37,162,594 $33,268,021 $29,202,650
Loans and Leases 27,021,498 24,392,591 21,028,444
Deposits 23,987,935 21,985,878 18,642,987
Shareholders’ Equity 3,504,786 3,240,654 2,766,690
OTHER SIGNIF ICANT DATA
Return on Average Shareholders’ Equity 17.89% 16.79% 17.36%
Return on Average Assets 1.69 1.64 1.64
Net Charge-Offs to Average Loans and Leases 0.11 0.21 0.21
Allowance for Loan and Lease Losses to
End of Period Loans and Leases 1.21 1.39 1.42
The summary financial and other information contained herein is not complete and should be read in
conjunction with Marshall & Ilsley Corporation’s Annual Report on Form 10-K for the year ending
December 31, 2004.
2004 Financial Highlights
o n e
51162 M&I 3/1/05 7:44 AM Page 3

Marshall & Ilsley Corporation had an outstanding year in 2004. Your Corporation addressed the
challenge of an economy that may not have been as robust as we would have liked, posting solid
gains, increasing market share, and expanding in new markets. We ended the year with over
$40 billion in assets, with significant progress to report in our Commercial Banking division,
Community Banking division, Wealth Management, the Financial Institutions Group, and within
Metavante Corporation.
Our bank and trust business lines continue to drive our earnings and are
still the mainstay of our business. Once again, M&I not only maintained
but increased our leading market share in the state of Wisconsin, with
196 banking offices at the end of 2004. In the past four years, we’ve
more than doubled the number of offices in Arizona, ending the year
with 34. We also had 12 offices in the Minneapolis/St. Paul region, seven
offices in the St. Louis area, two offices on the west coast of Florida, and
one office in Las Vegas, Nevada. A year-long emphasis on further aligning our wealth management busi-
nesses has resulted in our high-net-worth customers receiving customized, integrated service through
our trust services, private banking services, asset management, and brokerage and insurance services.
Our Commercial Banking division experienced sizable market share
gains in Wisconsin and outlying markets, and we continue to look to
those markets for considerable growth opportunities. In addition, the
Financial Institutions Group (FIG) continued to make the most of
cross-selling to financial institutions in all 50 states.
Our growth at Metavante Corporation was fueled by the strategic acquisitions that began in the fall of
2003. Through these acquisitions, Metavante enhanced its product line and expanded its customer base,
providing valuable new business opportunities nationwide.
To Our Shareholders
t w o
51162 M&I 3/1/05 7:44 AM Page 4

James Wigdale, Chairman of the Board, retired, Marshall & Ilsley Corporation; Dennis Kuester, Chairman of
the Board, President and CEO, Marshall & Ilsley Corporation; Mark Furlong, Executive Vice President,
Marshall & Ilsley Corporation, and President, M&I Marshall & Ilsley Bank.
51162 M&I 3/1/05 7:45 AM Page 5

All of these successes assisted us in building shareholder value, a commitment that has been foremost
throughout our history. In April 2004, we were pleased to celebrate our thirty-second annual dividend
increase, further evidence of M&I as an investment that has consistently rewarded our shareholders
with solid returns and performance.
Our success in 2004 is a credit to all of our more than 13,000 M&I
associates. We would not have achieved our goals without them.
We thank them for their expertise, hard work, and dedication.
James B. Wigdale
Chairman of the Board, retired, Marshall & Ilsley Corporation
Dennis J. Kuester
Chairman of the Board, President and CEO, Marshall & Ilsley Corporation
Mark F. Furlong
Executive Vice President, Marshall & Ilsley Corporation
President, M&I Marshall & Ilsley Bank
f o u r
51162 M&I 3/1/05 7:45 AM Page 6

Jim Wigdale’s financial services expertise and strong business ethics
have made him a highly respected member of the business community.
He is also well regarded for his outstanding civic leadership, demonstrated
by his service to numerous organizations. Those who have worked with
Jim know him as a man who is not only committed to conducting business
with a high degree of honesty and integrity, but also one whose compassion
and sense of humor have had an equal role in his success – as a business
person, community leader, husband, father, and grandfather. Therefore,
when he announced he would be retiring at the end of 2004, it marked a
milestone in not only M&I’s history, but also in the community as well.
Jim Wigdale joined M&I in 1962 as a floor plan auditor, responsible for auditing the vehicle inventory
of auto dealers. After 30 years and a number of promotions, he was elected Chairman and Chief
Executive Officer of the Corporation in 1992 and in that role successfully led M&I into the twenty-
first century. During his tenure as Chairman, M&I’s assets grew from nearly $8 billion to over
$40 billion.
Jim’s success in business is rivaled only by his compassionate commitment to making our
community a better place to live. He served on the boards of directors of many community organizations
and is Past Chairman of the Medical College of Wisconsin, the Boys & Girls Clubs of Greater
Milwaukee, Columbia Health System, Inc., and the Board of Trustees of the YMCA of Metropolitan
Milwaukee. He has, and will continue to have, a powerful impact on the important efforts of these
and many other organizations.
“I have had the honor of working with Jim for over 29 years,” said Dennis Kuester. “His contributions
throughout his career at M&I have been integral to M&I’s success. His knowledge of the banking
industry and generous commitment to serving the community have been inspirational to those with
whom he worked.”
Honoring Jim Wigdale
f i v e
51162 M&I 3/1/05 7:45 AM Page 7

M&I’s commitment to customer satisfaction comes through in everything we do, whether our customers are banking in
one of our offices, online from the comfort of home, or using one of M&I’s many convenient drive-through locations.
51162 M&I 3/1/05 7:45 AM Page 8

Serving Our Customers
M&I’s commitment to serving our customers continues to be the cornerstone of our success, and in 2004, all our customers – whether small business owners, large commercial entities, individual consumers, or high-net-worth clients – had the opportunity to take advantage of enhanced productlines and valuable new services. Our customers’ success drives our own success and we worked diligently throughout the year to ensure their financial services needs were met with the high degreeof professionalism and quality products and services they have come to expect from M&I.
Our community banking customers continued to benefit from M&I’smulti-year branch expansion. Six new offices opened in the growingArizona market, one new office opened in the Minneapolis/St. Paularea, and several more projects were under way in Arizona,Minnesota, and Missouri. This extensive branch office network con-tinues to serve us well, providing a strong community presence andconvenient locations for our customers to do their banking in person.
More and more, however, our community banking customers also want the convenience of accessingtheir finances on their own schedule – and from anywhere. Therefore, we continue to enhance ourservices and product lines so our customers can check their balances from the comfort of home, paya bill from work, or transfer funds while on vacation.
To that end, we’ve made several enhancements to our consumer online banking products, whichinclude a free bill-pay service. A comprehensive online guarantee ensures customers’ online bankingand bill pay transactions are processed with the highest level of privacy and security. The results havebeen significant. Online banking usage is up 60 percent and online bill payments doubled in one year.
Many M&I customers have also learned about the valuable benefits offered through M&I Rewards,a very unique and successful program that offers members the opportunity to combine points fromtheir Rewards credit and debit cards to earn valuable rewards, including gift cards, air travel, cruises,and more.
s e v e n
Customers are also attracted to M&I by its revamped checking lineup, which now includes accounts
specifically designed for students and seniors. Plus, new overdraft protection options allow customers to
link their accounts to their savings account, home equity line of credit, and/or credit card. By year-end,
M&I had experienced more than 20 consecutive months of net checking account growth since
introducing the new lineup.
Our mortgage business experienced increased penetration of the purchase and construction market,
and our home equity business continues to thrive, with a 20 percent five-year compound growth rate.
An active home equity market contributed to strong consumer loan activity, with home equity loans
representing three-fourths of all consumer loans in 2004.
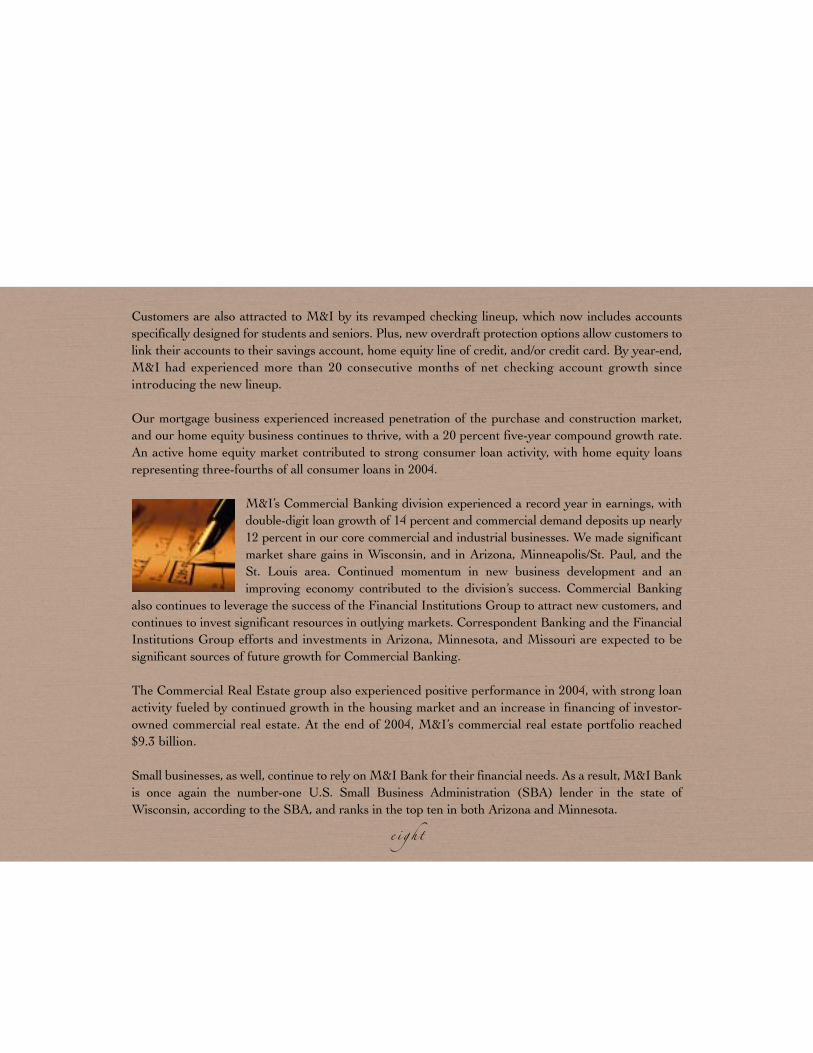
M&I’s Commercial Banking division experienced a record year in earnings, with
double-digit loan growth of 14 percent and commercial demand deposits up nearly
12 percent in our core commercial and industrial businesses. We made significant
market share gains in Wisconsin, and in Arizona, Minneapolis/St. Paul, and the
St. Louis area. Continued momentum in new business development and an
improving economy contributed to the division’s success. Commercial Banking
also continues to leverage the success of the Financial Institutions Group to attract new customers, and
continues to invest significant resources in outlying markets. Correspondent Banking and the Financial
Institutions Group efforts and investments in Arizona, Minnesota, and Missouri are expected to be
significant sources of future growth for Commercial Banking.
The Commercial Real Estate group also experienced positive performance in 2004, with strong loan
activity fueled by continued growth in the housing market and an increase in financing of investor-
owned commercial real estate. At the end of 2004, M&I’s commercial real estate portfolio reached
$9.3 billion.
Small businesses, as well, continue to rely on M&I Bank for their financial needs. As a result, M&I Bank
is once again the number-one U.S. Small Business Administration (SBA) lender in the state of
Wisconsin, according to the SBA, and ranks in the top ten in both Arizona and Minnesota.
e i g h t
51162 M&I 3/1/05 7:45 AM Page 10

M&I’s Commercial Real Estate group provided financing for Shea Commercial’s Pima Commerce Center, an office
condominium project in Scottsdale, Arizona, that provides small- to medium-sized businesses with the opportunity
to own and customize their own offices. Businesses interested in moving into the 63,000-square-foot complex also
have the opportunity to finance their purchase through M&I’s Business Banking services.
51162 M&I 3/1/05 7:45 AM Page 11

Amy Sarles (right), Senior Vice President and Senior Credit Officer, M&I Private Bank; and Scott Holan (center),
Vice President and Portfolio Manager, Marshall & Ilsley Trust Company N.A.; serve as advisors to Katie Heil,
an M&I Wealth Management client.
51162 M&I 3/1/05 7:46 AM Page 12

Our Financial Institutions Group (FIG), specialists in serving financial institutions nationwide,
continued to successfully cross-sell M&I’s services. By taking advantage of M&I’s comprehensive
product selection, customers of FIG – including the smallest of financial institutions – have the
tools they need to compete with even the largest banks, to better
serve their customers. FIG’s success outside of M&I’s traditional
footprint supports the philosophy that the Corporation can grow its
business significantly without traditional bricks-and-mortar facilities.
FIG customers can now be found in all 50 states; the FIG initiative
has produced over 600 referrals and resulted in sales of over 200 new
products and services.
Throughout the year, M&I worked to align its Wealth Management businesses to more effectively
serve customers through M&I’s personal trust services, commercial trust services, private banking
services, asset management, and brokerage and insurance services. The goal is not only to grow
each of these individual businesses, but to ensure they are tightly connected with Community
Banking and Commercial Banking. As a result, high-net-worth individuals and institutional clients,
such as foundations and corporations relying on M&I for employee benefit plans, have access to all
these resources through one comprehensive relationship.
M&I Investment Management Corp. focused on investment performance and consistent returns, and
at year-end had over $18 billion in assets under management. Marshall & Ilsley Trust Company N.A.
had $76 billion in assets under administration, an all-time high. We continued to expand our brokerage
services throughout the community banking system and worked to fully integrate our private banking
and trust capabilities.
M&I’s Commercial Trust division, a provider of 401(k) and other defined contribution plans,
received 29 Best in Class awards in the Defined Contribution Survey conducted by PLANSPONSOR
magazine. Clients rated M&I as a top-ranked retirement plan provider for the third year in
a row.
e l e v e n
51162 M&I 3/1/05 7:46 AM Page 13

Metavante Corporation celebrated 40 years of operations in 2004 and began the year committed to
providing superior service to its clients and to grow its business internally and through acquisitions.
Focused on financial services and payment solutions, Metavante made strategic acquisitions to move
the company toward $1 billion in annual revenue. As a result, Metavante is even better positioned to
add value and new products to serve its clients.
The first of eight acquisitions, beginning in November 2003, was
Printing For Systems, Inc. (PSI), a Madison, Connecticut, provider of
identification cards and related documents to the health-care insurance
industry. Metavante saw a fit between its electronic funds transfer (EFT)
and card-production services and PSI’s customer needs. During 2004,
PSI introduced health-care eligibility cards and health-care payment
cards, and replaced traditional insurance ID cards with magnetic-striped
plastic cards, thereby reducing the threat of identity theft by printing less personal data on the card.
From Paper to Plastic
PSI’s health-care payment cards, which consumers use like debit cards, provide access to flexible
spending accounts (FSA), health-care spending accounts, and health reimbursement arrangements.
The payment feature of these cards offers health plans and third party admin-
istrators a more efficient way to manage the financial payments and activities
for benefit plans. The card’s payment flexibility gives consumers immediate
access to funds and reduces their out-of-pocket expenses or need to request
reimbursement. Several national health-care insurance providers distribute
the Metavante FSA cards to their clients.
Metavante actively participates in the macroeconomic shift from paper-based to electronic payments
occurring in the United States. By acquiring New Jersey-based NYCE Corporation from First Data
Corporation and other shareholders in July, Metavante added the ownership and operation of one of the
nation’s largest ATM networks and providers of PIN-based, point-of-sale debit card transactions to its
comprehensive payment solutions.
t w e l v e
Metavante Corporation –
Forty Years of Innovation
51162 M&I 3/1/05 7:46 AM Page 14

Opposite: Ralph Rotermund, President, Printing For Systems, Inc. Above: Metavante’s executive committee and
CEO direct reports – Paul Danola, Senior Executive Vice President, Financial Services Group; Jamie Geschke,
Executive Vice President, Financial Technology Services; Frank D’Angelo, Senior Executive Vice President, Payment
Solutions Group; Donald Layden, Senior Vice President, Corporate Development; Brian Hurdis, Executive Vice
President and Chief Information Officer; Debra Bronder, Senior Vice President, Human Resources and Administrative
Support; Gary Nelson, Executive Vice President, Metavante Corporation, and President, Advanced Financial
Solutions; Mike Hayford, Senior Executive Vice President and Chief Financial Officer; Gary Refinski, Executive Vice
President, eBanking, Conversions and Professional Services; Frank Martire, President and Chief Executive Officer.
51162 M&I 3/1/05 7:46 AM Page 15

Opposite: Steven Rathgaber, President and Chief Operating Officer, NYCE Corporation.
Above: The NYCE Corporation Data Center in Secaucus, New Jersey, monitors the routing of ATM and PIN-
debit transactions between nearly 1,900 financial institutions and numerous merchant locations nationwide.
NYCE is the nation’s third-largest electronic funds transfer network based on switch volume.
51162 M&I 3/1/05 7:46 AM Page 16

The acquisition expanded Metavante’s market reach, enabling
Metavante to actively cross-sell financial technology products to nearly
1,900 NYCE financial institution clients. Metavante also is
cross-selling NYCE network services to its core financial account-
processing clients, of which nearly 10 percent already were NYCE
participants.
Electronic Payments Exceed Checks
Providing convenient payment access at the point of sale is critical in today’s environment where
electronic-payment transactions surpassed paper check payments for the first time in 2003. The use
of debit cards by Americans has been gaining steadily in popularity; meanwhile, in Canada, debit
card use is the highest per capita of any country in the world. To help U.S. retailers provide added
convenience for Canadians traveling and shopping in the U.S., NYCE in October became the first
U.S. network to provide widespread cross-border PIN-debit access for five leading Canadian financial
institutions. Within two weeks, Canadians had made PIN-debit purchases in all 50 states.
Metavante’s prepaid debit cards allow issuers like M&I Bank to offer
commercial customers sophisticated treasury-management tools. Businesses
can replace paper checks with payroll cards that give employees access to
their pay through ATM cash withdrawals. The cards are less expensive to
produce and process than paychecks and help reduce the risk of lost or stolen
checks. Prepaid gift cards can help businesses reward their employees as part
of a bonus or incentive program. M&I Bank also works with its merchant
clients to set up gift card programs for in-store use.
M&I Bank now makes gift cards available for individuals to purchase from any branch or on its web-
site. The Visa®-branded gift cards may be used for purchases at millions of locations worldwide and
provide customers with a unique means to honor an occasion or to say thank you.
f i f t e e n
51162 M&I 3/1/05 7:47 AM Page 17

Credit cards remain the most popular form of electronic payment and, in September, Metavante
purchased Response Data Corporation (RDC), a Parsippany, New Jersey-based provider of services
to leading consumer-credit issuers. RDC helps its clients grow their receivables and lower costs with
solutions including balance transfer; convenience checks and cash advances; card-funded bill pay;
refunds, rebates, and rewards; as well as fraud prevention, online reporting, and analysis. Metavante
will build on the RDC client relationships and also cross-sell its services to other credit card-issuing
financial institutions.
Check 21 Legislation Takes Effect
Perhaps the banking industry’s most anticipated event in 2004 was the
Check Clearing for the 21st Century Act, known as “Check 21,” which
became effective on October 28. The law permits banks to exchange
an image for payment and reconciliation of paper checks instead of
transporting checks between banks on a daily basis. By capturing and
exchanging check images – a process that will occur through online
exchange networks – banks eventually will reduce their costs and
streamline a highly labor-intensive process.
In 2004, Metavante acquired the two industry-leading software providers of
check image technology for financial institutions and check processors:
Advanced Financial Solutions (AFS) of Oklahoma City, and VECTORsgi
of Addison, Texas. Together the companies serve the range of financial
institutions, with VECTORsgi having relationships with 41 of the top 50 U.S.
banks. Each company also affiliates with one of the two leading national
check-image exchange networks. With these acquisitions, Metavante gains
new client relationships and positions itself to help financial account-
processing clients transition to electronic check-image exchange – a business
with adoption growth opportunity over the next several years.
s i x t e e n
51162 M&I 3/1/05 7:47 AM Page 18

Opposite: Gary Nelson, President, Advanced Financial Solutions.
Above: Financial institutions in the United States and numerous foreign countries have licensed image-based and
conventional check processing software from Oklahoma City-based Advanced Financial Solutions.
51162 M&I 3/1/05 7:47 AM Page 19

Opposite, top: Sydney Smith Hicks, President, VECTORsgi.
Above: Forty-one of the nation’s 50 largest banks use VECTORsgi technology. The company, which operates from
headquarters in Addison, Texas, provides software to support electronic check-image processing and image
exchange, item processing, dispute resolution, and e-commerce solutions for financial institutions and corporations.
51162 M&I 3/1/05 7:47 AM Page 20

With AFS, Metavante also acquired the Endpoint Exchange
Network, the first operating U.S. check-image exchange network.
It enables U.S. financial institutions to clear their check-based
transactions by exchanging check images between its approximately
3,300 member institutions, including M&I Bank. By comparison,
VECTORsgi developed the Distributed Traffic Agent for SVPCO,
a clearinghouse owned by 19 of the nation’s largest banks to facilitate
national image exchange.
AFS and VECTORsgi each offer distributed capture technology, which eliminates the need for
a business to take paper checks to a bank for deposit. M&I Bank and other financial institutions are
using the AFS direct merchant software to allow merchants to capture front-and-back check images
at their locations. Companies and banks using distributed capture should benefit from improved
collection speed and reduced courier costs.
Committed to Core Processing
Payment systems, whether debit cards, electronic bill payments,
or checks, require access to a funding account. This is where the
Metavante commitment to core financial-account processing for deposits,
loans, and investment accounts provides a marketplace advantage. With
the ability to link more financial institutions and their core accounts to
various payment networks, Metavante helps drive greater efficiencies for
its clients.
In addition to its single platform for outsourced financial-account processing that serves nearly 500
institutions with approximately 16 million demand deposit accounts, Metavante also wanted to provide
a software option for clients that process accounts in-house. In May 2004, Metavante acquired
Kirchman Corporation, of Orlando, Florida, to fill that product gap.
n i n e t e e n
51162 M&I 3/1/05 7:48 AM Page 21

Kirchman pioneered in-house core-processing software in 1968. Serving 800 clients,
the Kirchman Bankway solution is scalable to meet the needs of any size bank from de novo to large
bank holding companies. In addition, Kirchman has a number of valued data-center partnerships
that provide clients with attractive outsourcing alternatives for the Bankway solution.
As banks renew their emphasis on branches and attracting and retaining
deposit accounts, Metavante has seen increased interest in its branch
and teller automation products as well as its customer relationship-
management (CRM) product suite. In October 2004, Metavante
acquired NuEdge Systems’ marketing-automation and campaign-
management products to integrate with its CRM solutions. NuEdge
serves the financial institution, retail, and catalog markets.
In the first quarter of 2005, Metavante completed the acquisition of
Prime Associates, Inc., another New Jersey company that provides
anti-money laundering and regulatory-compliance software, which
can be sold along with Metavante’s enterprise risk-management
consulting practices. Financial institutions need such software and
consulting to comply with increased regulations driven by the USA
PATRIOT Act and Bank Secrecy Act.
Metavante ended 2004 having renewed long-term contracts with 48 financial account-processing
clients. Committed to providing its clients with products and services to help meet as many operating
requirements as possible, Metavante remains focused on strategic investments – whether through
internal development, partnerships, or acquisitions. The company begins 2005 with a greatly expanded
suite of products and services to drive cross-selling throughout its family of companies.
t w e n t y
51162 M&I 3/1/05 7:48 AM Page 22

Opposite, top: Rachel Landrum, President, Kirchman Corporation.
Above: Founded in 1968, Kirchman Corporation, which operates from this campus in Orlando, Florida, provides bank
automation software and compliance services to the banking industry, with 800 financial institution clients.
51162 M&I 3/1/05 7:48 AM Page 23

Opposite, top: Employees from M&I Bank, Green Bay, helped build a house as part of M&I Community Day.
Opposite, bottom: Dennis Kuester, Chairman and CEO of Marshall & Ilsley Corporation, and Co-chair of the
United Way Community Campaign in Greater Milwaukee, with Deajanique Downie, who helped reveal that the
campaign raised a total of $37 million to fund United Way programs.
Above: Metavante Corporation employees lent a hand to help beautify a Milwaukee neighborhood for
M&I Community Day.
51162 M&I 3/1/05 7:48 AM Page 24

If we measured Marshall & Ilsley Corporation’s achievements
in numbers alone, we’d be ignoring one of the most critical
contributors to our success: the energy and enthusiasm our
employees bring to the workplace, and their dedication and com-
mitment to making our communities a better place to live. Every
day, you’ll find M&I employees hard at work in their communities,
volunteering their time to the organizations and causes most
important to them.
Therefore, it’s not surprising that our employees were also eager to lend a hand for the fourth annual
M&I Community Day, an all-employee effort to make a difference in the communities we serve. Over
2,500 employees in 158 communities participated in volunteer activities that benefited over 100
organizations. From a collection to benefit hurricane victims in Florida, to beautifying a veterans’
center in Racine, Wisconsin, to holding a food drive in Braintree, Massachusetts, M&I employees
went the extra mile to make M&I Community Day a success.
In addition to taking a hands-on approach to community service,
M&I employees also generously support fundraising efforts
throughout the year. In 2004, M&I employees were once again
quick to respond, wherever their help was needed most – whether
in their own backyard, or thousands of miles away. Following the
tsunami in south Asia, employees rallied to raise over $140,000
as part of a matching gifts challenge; M&I matched employee
donations, up to $100,000, to benefit the victims of this disaster. In
addition, M&I and its employees gave generously to the 2004
United Way Community Campaign, donating over $1.9 million in
Greater Milwaukee alone.
A Strong Commitment
to Our Communities
t w e n t y - t h r e e
51162 M&I 3/1/05 7:48 AM Page 25
t w e n t y - f o u r
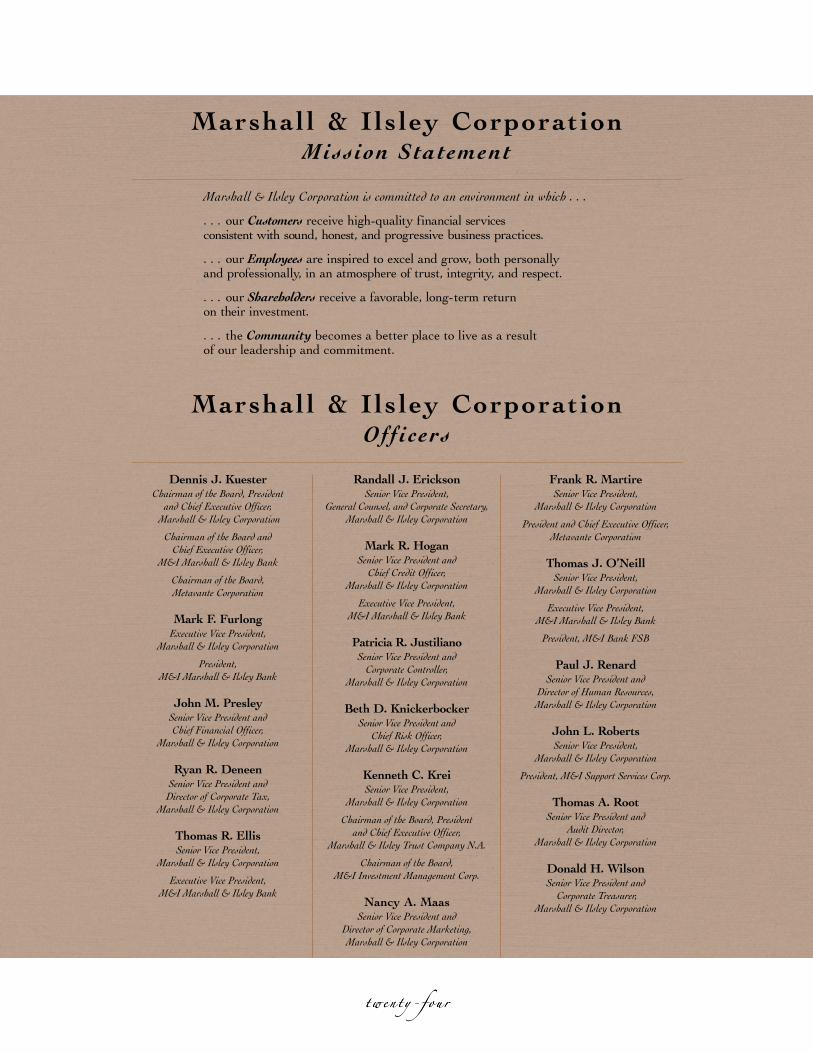
Marshall & Ilsley Corporation is committed to an environment in which . . .
. . . our Customers receive high-quality financial services consistent with sound, honest, and progressive business practices.
. . . our Employees are inspired to excel and grow, both personally and professionally, in an atmosphere of trust, integrity, and respect.
. . . our Shareholders receive a favorable, long-term return on their investment.
. . . the Community becomes a better place to live as a result of our leadership and commitment.
Dennis J. Kuester
Chairman of the Board, President and Chief Executive Officer,
Marshall & Ilsley Corporation
Chairman of the Board and Chief Executive Officer,
M&I Marshall & Ilsley Bank
Chairman of the Board,Metavante Corporation
Mark F. Furlong
Executive Vice President, Marshall & Ilsley Corporation
President, M&I Marshall & Ilsley Bank
John M. Presley
Senior Vice President and Chief Financial Officer,
Marshall & Ilsley Corporation
Ryan R. Deneen
Senior Vice President and Director of Corporate Tax,
Marshall & Ilsley Corporation
Thomas R. Ellis
Senior Vice President, Marshall & Ilsley Corporation
Executive Vice President, M&I Marshall & Ilsley Bank
Randall J. Erickson
Senior Vice President,General Counsel, and Corporate Secretary,
Marshall & Ilsley Corporation
Mark R. Hogan
Senior Vice President andChief Credit Officer,
Marshall & Ilsley Corporation
Executive Vice President, M&I Marshall & Ilsley Bank
Patricia R. Justiliano
Senior Vice President andCorporate Controller,
Marshall & Ilsley Corporation
Beth D. Knickerbocker
Senior Vice President and Chief Risk Officer,
Marshall & Ilsley Corporation
Kenneth C. Krei
Senior Vice President,Marshall & Ilsley Corporation
Chairman of the Board, President and Chief Executive Officer,
Marshall & Ilsley Trust Company N.A.
Chairman of the Board,M&I Investment Management Corp.
Nancy A. Maas
Senior Vice President andDirector of Corporate Marketing,Marshall & Ilsley Corporation
Frank R. Martire
Senior Vice President,Marshall & Ilsley Corporation
President and Chief Executive Officer,Metavante Corporation
Thomas J. O’Neill
Senior Vice President,Marshall & Ilsley Corporation
Executive Vice President, M&I Marshall & Ilsley Bank
President, M&I Bank FSB
Paul J. Renard
Senior Vice President andDirector of Human Resources,
Marshall & Ilsley Corporation
John L. Roberts
Senior Vice President,Marshall & Ilsley Corporation
President, M&I Support Services Corp.
Thomas A. Root
Senior Vice President and Audit Director,
Marshall & Ilsley Corporation
Donald H. Wilson
Senior Vice President andCorporate Treasurer,
Marshall & Ilsley Corporation
Marshall & Ils ley Corporation
Officers
Marshall & Ils ley Corporation
Mission Statement
t w e n t y - f o u r
51162 M&I 3/1/05 7:48 AM Page 26

Marshall & Ilsley Corporation – 770 North Water Street – Milwaukee, WI 53202 (414) 765-7700 www.micorp.com
Directors
Dennis J. Kuester
Chairman of the Board, President and Chief Executive Officer,
Marshall & Ilsley Corporation
Chairman of the Board and Chief Executive Officer,
M&I Marshall & Ilsley Bank
Chairman of the Board, Metavante Corporation
Richard A. Abdoo
Chairman of the Board and Chief Executive Officer, retired, Wisconsin Energy Corporation,
a holding company with subsidiaries in utility and non-utility businesses
Chairman of the Board, retired, We Energies
David L. Andreas
Former President and Chief Executive Officer,
National City Bancorporation, a bank holding company
Andrew N. Baur
Chairman of the Board, Southwest Bank of St. Louis
Jon F. Chait
Chairman of the Board and Chief Executive Officer,
Hudson Highland Group, Inc., a provider of workforce
staffing and search services
Bruce E. Jacobs
President and Chief Executive Officer,Grede Foundries, Inc.,
a manufacturer of gray and ductile iron, steel, and alloyed castings
Ted D. Kellner, CFA
Chairman of the Board and Chief Executive Officer,
Fiduciary Management, Inc., an investment management firm
Katharine C. Lyall
President, retired, University of Wisconsin System
John A. Mellowes
Chairman of the Board and Chief Executive Officer,
Charter Manufacturing Company, Inc., a producer of bar, rod, wire, and wire partsfor the auto industry and other industries
Edward L. Meyer, Jr.
Vice Chairman, Sanimax Corporation,
a processor and manufacturer of various rendered products
San W. Orr, Jr.
Chairman of the Board, Wausau-Mosinee Paper Corporation
Robert J. O’Toole
Chairman of the Board and Chief Executive Officer,
A.O. Smith Corporation, a manufacturer of electric motors and water systems technologies
Peter M. Platten III
Vice Chairman of the Board, retired, Marshall & Ilsley Corporation
Robert A. Schaefer
Former Executive Vice President and Chief Operating Officer, retired, Security Capital Corporation,
a bank holding company
John S. Shiely
Chairman of the Board, President and Chief Executive Officer,
Briggs & Stratton Corporation, a manufacturer of gasoline engines
for outdoor power equipment
James A. Urdan
Partner, retired, Quarles & Brady, a law firm
Debra S. Waller
Chairman of the Board and Chief Executive Officer,
Jockey International, Inc., a manufacturer of undergarments
George E. Wardeberg
Vice Chairman of the Board, retired,Wisconsin Energy Corporation,
a holding company with subsidiaries in utility and non-utility businesses
James B. Wigdale
Chairman of the Board, retired, Marshall & Ilsley Corporation
Directors Emeriti
Oscar C. BoldtWendell F. BuecheGlenn A. FranckeBurleigh E. Jacobs
James F. KressDon R. O’Hare
Stuart W. TisdaleJames O. WrightGus A. Zuehlke
Marshall & Ils ley Corporation
Board of Directors
t w e n t y - f i v e
51162 M&I 3/1/05 7:48 AM Page 27

Affi l iate Boards
M&I MARSHALL
& ILSLEY BANK
770 North Water StreetMilwaukee, WI 53202
(414) 765-7700 www.mibank.com
Directors
Dennis J. Kuester
Chairman of the Board and Chief Executive Officer,
M&I Marshall & Ilsley Bank
Chairman of the Board,President and
Chief Executive Officer, Marshall & Ilsley Corporation
Chairman of the Board, Metavante Corporation
Mark F. Furlong
President, M&I Marshall & Ilsley Bank
Executive Vice President,Marshall & Ilsley Corporation
Richard A. Abdoo
Chairman of the Board and Chief Executive Officer, retired,Wisconsin Energy Corporation
Chairman of the Board, retired, We Energies
Bruce E. Jacobs
President and Chief ExecutiveOfficer, Grede Foundries, Inc.
James A. Urdan
Partner, retired, Quarles & Brady
George E. Wardeberg
Vice Chairman of the Board,retired, Wisconsin Energy
Corporation
James B. Wigdale
Chairman of the Board, retired, Marshall & Ilsley Corporation
Directors Emeriti
Wendell F. BuecheJohn E. ForesterCarl L. Gosewehr
Burleigh E. JacobsOrville R. MertzDavid F. Nelson
Douglas SeamanLeo E. Suycott
Stuart W. TisdaleJames O. Wright
ARIZONA
Community Bank Advisory Board
Dennis R. Jones
Chairman and President, M&I Marshall & Ilsley Bank,
Arizona
John G. Barry
Executive Vice President and Commercial Bank Manager,
M&I Marshall & Ilsley Bank,Arizona
Gary S. Clancy
Managing Member, RecycledBusiness Systems, L.L.C.
P. Robert Fannin
Partner, Steptoe & Johnson, LLP
Michael C. Francis
Owner/Manager, Francis Insurance Agency
Charles F. Sands
President, Nutribiotech LLC; JED C, LLC
Richard H. Whitney
Partner, Gust Rosenfeld P.L.C.
D. Otis Wolkins
Vice President, retired, GTE Service Corporation
Stephen A. Wood
President, InsurersAdministrative Corporation
Leyton S. Woolf, Jr.
Owner/Farmer, Woolf Roses, L.L.C.
MINNESOTA
Community Bank Advisory Board
Kim Culp
Chairman, M&I Marshall & Ilsley Bank,
Minnesota Region
Bradley D. Chapin
President, M&I Marshall & Ilsley Bank,
Minnesota
David L. Andreas
Former President and Chief Executive Officer,
National City Bancorporation
Marty Chorzempa
Chairman, retired, Richfield Bank & Trust
Mike Fiterman
President and Chief Executive Officer,
Liberty Diversified Products
Esperanza
Guerrero-Anderson
President and Chief Executive Officer,
Milestone Growth Fund, Inc.
Michael Horovitz
Owner and President, Minneapolis Glass Company
Katie Kelley
Executive Vice President, M&I Marshall & Ilsley Bank,
Minnesota
David Malmberg
Chairman of the Board, Sagebrush Corporation
Sheldon Wert
Former President and Chief Executive Officer,
Century Bancshares, Inc.
APPLETON, WI
Community Bank Advisory Board
David J. Gitter
President, M&I Marshall & Ilsley Bank,
Appleton
Thomas J. Boldt
Chief Executive Officer, The Boldt Company
John A. Bykowski
President and Chief Executive Officer,
Secura Insurance Companies
Joyce A. Bytof
President, Coldwell Banker
The Real Estate Group, Inc.
Stephen M. Evans
President, Evans Title Companies, Inc.
James R. Hayes
President and Chief Executive Officer, retired,
Hayes Manufacturing Group, Inc.
Paul J. Heid
President, Heid Music Company, Inc.
Mary M. Hosmer
Account Executive/Owner, Insurance Services, Inc.
John E. Pfefferle
President, Grubb & Ellis/Pfefferle
Dennis M. Sheen
Regional Director, Northeast Region, Marshall & Ilsley
Trust Company N.A.
Lawrence W. Wirth
President, retired, Presto Products, Inc.
Director Emeritus
Gus A. Zuehlke
t w e n t y - s i x
51162 M&I 3/1/05 7:48 AM Page 28

t w e n t y - s e v e n
ASHLAND, WI
Community Bank Advisory Board
Peter P. Viater
President, M&I Marshall & Ilsley Bank,
Ashland
Paul R. Bretting
Vice President, C. G. Bretting Manufacturing
Company, Inc.
Donald N. Marcouiller
Regional Administrator, Wisconsin Indianhead
Technical College, Ashland Campus
Leslie J. Whiteaker
Vice President and Chief Financial Officer,
Memorial Medical Center
BROOKFIELD, WI
Community Bank Advisory Board
Irv Hansen
Chairman, M&I Marshall & Ilsley Bank,
Brookfield
J. Nathan Cunniff
President, M&I Marshall & Ilsley Bank,
Brookfield
Robert H. Eldridge
Executive Vice President and Secretary-Treasurer, retired,
Briggs & Stratton Corporation
John R. Evans
President, retired, Evans Brothers Company, Inc.
Andrew J.
Fleckenstein
Trustee, Fleck Foundation
W. P. Halquist
Chairman of the Board, Halquist Stone Co., Inc.
James E. Keyes
Chairman of the Board, KSM Industries, Inc.
James M. Leef
President, Industrial Towel &
Uniform, Inc.
Gordon J. Liebl
President, A. L. Schutzman Co., Inc.
Aldo Madrigrano
President, W.O.W. Distributing Co., Inc.
Randall J. Wright
President and Chief Executive Officer,
Empire Level Mfg. Corp.
Directors Emeriti
Glenn A. FranckePhilip K. HarveyJohn P. MetzgerGerry E. Seider
Donald A. Trepte
BURLINGTON, WI
Community Bank Advisory Board
James R. Bauman
Chairman, M&I Marshall & Ilsley Bank,
Burlington
Glenda Dupons
President, Bear Realty Inc.
Frederick J. Koenen
Chairman of the Board, Reineman’s True Value Inc.
John L. Malchine
Farmer
Lawrence Smith
Larry’s Barber Shop
James F. Weis
President, May’s Insurance Agency
EAGLE RIVER, WI
Community Bank Advisory Board
James E. Levandoski
President, M&I Marshall & Ilsley Bank,
Eagle River
Al Block
Owner, retired, A. L. Block Realty
Al Bybee
Food Broker, retired
C. Randall Cox
Consultant, retired
T. J. Doyle, D.D.S.
Dentist, retired
Thomas Gaffney
Owner, retired, Gaffney Funeral Home
Darryl Gremban,
D.D.S.
Dentist, retired
Richard D. Hansen
President, retired, M&I Marshall & Ilsley Bank,
Eagle River
Affi l iate Boards
t w e n t y - s e v e n
51162 M&I 3/1/05 7:48 AM Page 29

EAU CLAIRE, WI
Community Bank Advisory Board
Robert R. Hood
President, M&I Marshall & Ilsley Bank,
Eau Claire
James D. Myers
Vice President, Pleasant Hill Farm, Inc.
Peter B. Scobie
President, R. W. Scobie, Inc.
Steven R. Senn
Chief Executive Officer, Senn Blacktop, Inc.
Roger R. Sipple
Roger & Donald Sipple Farm
Daniel J. Toycen
President, Toycen Motors, Inc.
President, Toycen of Ladysmith, Inc.
Kenneth C. Vance
President, Ken Vance Car City Inc.
President, Ken Vance Motors, Inc.
GREEN BAY, WI
Community Bank Advisory Board
Michael D. Simmer
President, M&I Marshall & Ilsley Bank,
Green Bay
Richard G. Baumgarten
President, retired, M&I Fox Heights Bank
Bernard E. Dahlin
President, Nicols Paper Products
John M. Jones
Executive Vice President andChief Operating Officer,
Green Bay Packers
Michael J. Langenhorst
President and CEO,Anamax Group, U.S.,
a division ofSanimax Corporation
Peter D. Mancuso
Chief Executive Officer,Lindquist Machine Co.
Edward L. Meyer, Jr.
Vice Chairman,Sanimax Corporation
Ann M. Murphy
Vice President,Murphy Development, Inc.
Thomas M. Olejniczak
Partner, Liebmann, Conway,Olejniczak & Jerry, S.C.
Peter M. Platten III
Former Chairman of the Board,M&I Bank Northeast
Vice Chairman of the Board,retired, Marshall & Ilsley
Corporation
Ronald A. Weyers
Directors Emeriti
William R. BodartCarl Farah
Michael B. Gage
HARTLAND, WI
Community Bank Advisory Board
Arthur T. Kraemer
Chairman, M&I Marshall & Ilsley Bank,
Hartland
Scott A. Kraemer
President, M&I Marshall & Ilsley Bank,
Hartland
Steven C. Boysa
Chairman of the Board,Creative Equities Company, Inc.
Robert C. Goff
President, Goff’s Auto Body, Inc.
Stanley F. Hack
Attorney
Donald L. McNeil
Retired, Executive Director, Inc.
Richard A. Natalizio
Chairman of the Board, HNI Company, Inc.
Charles L. Rushman
Chairman, First Weber Realty
Paul J. Schmidt
President, retired, Collections Unlimited, Inc.
Sheldon Volk
Executive Vice President, retired,M&I Lake Country Bank
Dennis H. Wollenzien
President and Chief Operating Officer, retired,
M&I Lake Country Bank
Directors Emeriti
Patrick A. CorcoranAnton R. GraschCharles J. Herro
William HollenbeckJ. Scott Kestly
Richard K. MuellerAugust U. PabstCharles A. Perry
Richard A. SchmidtThomas J. Waldera
JANESVILLE, WI
Community Bank Advisory Board
Ronald K. Ochs
President, M&I Marshall & Ilsley Bank,
Janesville
Frank E. Bauchiero
Consultant
J. Michael Borden
President, Hufcor, Inc.
Mark A. Cullen
President, J. P. Cullen & Sons
Richard L. Dashnaw
Retired, Coltec Industries
John H. Franz
Consultant
Dennis L. Hansch
Attorney, Nowlan & Mouat
Charles H. Harker
President, Mid-States Concrete
Mary E. Kilkenny
Broker, Keefe Real Estate
James F. Ruethling
Administrator, Beloit Clinic, S.C.
David A. Weber
President, Mode Industries, Inc.
Director Emeritus
Donald P. Ryan
Affi l iate Boards
t w e n t y - e i g h t
51162 M&I 3/1/05 7:48 AM Page 30

KENOSHA, WI
Community Bank Advisory Board
Kenneth L. Fellman
President, M&I Marshall & Ilsley Bank,
Kenosha
Mario Garetto, M.D.
Gastroenterologist
Robert G. Terwall
President, Cherry Electrical Products
Dennis Vignieri
President and Chief Executive Officer,
Kenosha Beef International Limited
Michael W. Wells
President, Frank L. Wells Company
LA CROSSE, WI
Community Bank Advisory Board
Ronald A. Wessels
President, M&I Marshall & Ilsley Bank,
La Crosse
Dr. Julio J. Bird, M.D.
Gundersen Lutheran
Karl J. Brickl
President, Brickl Bros., Inc.
Russell J. Callahan, Jr.
Retired, Herbergers
Randolph A. Eddy, Sr.
President, Carrier Insurance Agency
Barbara Skogen
Vice President, Skogen’s Foodliner, Inc.
MADISON, WI
Community Bank Advisory Board
Robert A. Schlicht
President, M&I Marshall & Ilsley Bank,
Madison
Timothy B. Erdman
Vice Chairman,Marshall Erdman & Assoc.
Chairman and CEO, Erdman Holdings
John M. Flesch
Executive Vice President and Treasurer,
Gordon Flesch Company, Inc.
Harold F. Mayer
Vice President Operations, retired, Oscar Mayer Foods Corp.
Robert F. O’Loughlin
President, Softspikes, Inc.
Richard R. Renk
President, The Renk Seed Company
Douglas G. Reuhl
President, American of Madison
Terry K. Shockley
President, Shockley Group, Inc.
Jay L. Smith
President, JLS Investment Group
F. Charles Steinhauer
Vice President, Madison Dairy Produce
Jerry J. Weygandt
Professor of Accounting, UW School of Business
MARSHFIELD, WI
Community Bank Advisory Board
Alan D. Nystrom
President, M&I Marshall & Ilsley Bank,
Marshfield
John Baltus
President, Baltus Oil Co.
Donald Boon
President, Boon Construction
Ronald D. Doine
President, Doine Excavating, Inc.
Terry Frankland
General Manager, V&H, Inc.
Kenneth F. Heiman
Owner, Nasonville Dairy, Inc.
Ronald Maurer
President, Maurer Roofing
Directors Emeriti
Vernon BaltusFloyd Hamus
Robert O. HeckKen Heiting
James W. HewittJohn W. KoenigRobert Solberg
James F. SternweisLawrence I. Thill
Warner G. Von HolzenFrederick J. WenzelRonald Wiskerchen
Affi l iate Boards
t w e n t y - n i n e
51162 M&I 3/1/05 7:48 AM Page 31

MAYVILLE, WI
Community Bank Advisory Board
Kevin E. Volm
President, M&I Marshall & Ilsley Bank,
Mayville
Melvin Drinkwine
Retired, Tab Products Co.
Leo R. Fisher
Chairman of the Board, retired,M&I Bank of Mayville
Dennis M. Kemmel
Owner, Kemmel Insurance Agency
George F. Olson
Sales and Engineering, W. G. Strohwig Tool & Die, Inc.
Roy Rohlinger
Vice President, Rohlinger Construction, Inc.
Stanley A. Waas
President, Waas Boring & Cable, Inc.
MENOMONEE
FALLS, WI
Community Bank Advisory Board
Richard C. Becker
President, M&I Marshall & Ilsley Bank,
Menomonee Falls
Ronald R. Bast
President, Riteway Bus Service, Inc.
Robert E. Drisner
President and Chief Executive Officer, retired, Community Health Care Services
Donald H. Nimmer
Chief Executive Officer, Enercon Industries Corporation
Michael Richardson
President, Richardson Financial Group, Inc.
Douglas H.
Stadelmann
President, Stadelmann Engineering, Inc.
Directors Emeriti
Gerald S. ParshalleDon A. Schneiders
A. W. Zillmer
MERRILL, WI
Community Bank Advisory Board
John F. Koch
President, M&I Marshall & Ilsley Bank,
Merrill
Brian Arndorfer
Assistant Vice President,Church Mutual
Insurance Company
Edward G. Chartier
Retired
Lance R. Nienow
Chief Executive Officer,Weinbrenner Shoe Co.
Gary L. Schulze
Vice President, Victory Clinic Pharmacy, Inc.
David B. Smith
Consultant and Private Investor
Director Emeritus
Thomas J. Young
OSHKOSH, WI
Community Bank Advisory Board
Steven R. Schmudlach
President, M&I Marshall & Ilsley Bank,
Oshkosh
Cristopher Bumby
President and Chief Executive Officer,
Admanco, Inc.
Jere Chapin
President, retired, M&I Central State Bank
Dennis Elmer
Food Broker
H. Andersen Lyke
President, Lyke Corporation
Dennis E. Schwab
President, Coldwell Banker - Schwab
Realty Ltd.
Affi l iate Boards
t h i r t y
51162 M&I 3/1/05 7:48 AM Page 32

RACINE, WI
Community Bank Advisory Board
Timothy J. Majcen
President, M&I Marshall & Ilsley Bank,
Racine
Matthew L. Andis
President, Andis Company
Thomas L. Beck
President, Unico, Inc.
James O. Parrish
Vice President, Finance, retired, Twin Disc, Inc.
David B. Rayburn
President, Modine Manufacturing
Company
Directors Emeriti
Kenneth JensenDavid J. MunroeEarl E. Richter
Ernest C. Styberg, Jr.Willard T. Walker, Sr.
Harold C. Weiss
RHINELANDER, WI
Community Bank Advisory Board
Dale J. Opperman
President, M&I Marshall & Ilsley Bank,
Rhinelander
Ted S. Baginski, Jr.
President, Ted Baginski and Sons Inc.
Fred A. Berner
Editor, Antigo Daily Journal
Officer, Berner Bros. Publishing
William J. Cousineau
President, Cousineau Auto Parts, Inc.
Kirby H. Roen
Director - Sector Planning,Citizens Communications
Irving Schiek III, M.D.
Retired
Dr. Martin R. Smith
President, Foster & Smith, Inc.
SHAWANO, WI
Community Bank Advisory Board
Jeffrey P. Mace
President, M&I Marshall & Ilsley Bank,
Shawano
James A. Kasten
Vice President - Fluid Milk,Employee & Member Services,
Foremost Farms
Russell L. Obermeier
Owner, Maple Creek Wildlife
President and Owner, Obermeier & Associates
President and Owner, Cloverleaf Sand and Gravel, Inc.
Larry J. Rose
CPA/PFS, Shareholder, Kerber, Rose & Associates, S.C.
Financial Consultant, First Choice Financial
Services, LLC
Russell P. Schmidt
Retired
Jerry J. Senzig
President and Owner, retired, Senzig’s, Inc.
Gary J. Tauchen
Treasurer, Tauchen Harmony Valley, Inc.
SHEBOYGAN, WI
Community Bank Advisory Board
Gary D. Maples
President, M&I Marshall & Ilsley Bank,
Sheboygan
Ronald E. Begalke
Executive Vice President,retired, Sargento Cheese Co.
Terence P. Fox
Attorney at Law, Kummer, Lambert & Fox, LLP
Reynolds K. Honold
President, retired, Aldag/Honold Mechanical, Inc.
Michael D. Muth
Chairman of the Board andChief Executive Officer, K. W. Muth Company
David Quasius
President, Quasius Construction, Inc.
Affi l iate Boards
t h i r t y - o n e
51162 M&I 3/1/05 7:48 AM Page 33

STEVENS POINT, WI
Community Bank Advisory Board
Robert A. Schmidt
President, M&I Marshall & Ilsley Bank,
Stevens Point
James E. Anderson
President, Ellis Stone Construction
Company, Inc.
Marilynn J.
Chesbrough
Robert L. Cooper
President, Cooper Dental
Jeffrey L. Martin
President and CEO, St. Michael’s Hospital
Richard W. Okray
Secretary, Okray Family Farms, Inc.
Thomas W. Rause
President and Chief Executive Officer,
Rause Management, Inc.
Ronald T. Skrenes
Attorney, Anderson, O’Brien,
Bertz, Skrenes & Golla
Herbert M. Theisen
President, Theisen’s Lumber and
Millwork, Inc.
Directors Emeriti
Leonard F. DeBakerBennett C. Katz
David Ross MillerGerald M. O’BrienJoseph J. Okray Robert W. Worth
SUPERIOR, WI/
DULUTH, MN
Community Bank Advisory Board
James E. Zastrow
President, M&I Marshall & Ilsley Bank,
Superior/Duluth
James Banks
President and Chief Executive Officer,
Allouez Marine Supply, Inc.
John H. Hendricks
Of Counsel, Knudson, Gee & Torvinen, S.C.
Mary Millard
President, Millard & Associates, Inc.
Fred Shusterich
President, Midwest Energy Resources
Directors Emeriti
Richard ButhJames Tracy
WATERTOWN, WI
Community Bank Advisory Board
John H. Ebert
President, M&I Marshall & Ilsley Bank,
Watertown
Richard Baker
Baker-Rullman Mfg., Inc.
Robert A. Bender
Attorney
William J. Kwapil, Jr.
Seven-Up Bottling Co.
Directors Emeriti
V. R. BaumanE. W. McFarland
WAUSAU, WI
Community Bank Advisory Board
Hugh E. Jones
President,M&I Marshall & Ilsley Bank,
Wausau
Edward J. Creske
Chief Executive Officer,Wausau Tile, Inc.
Dwight E. Davis
President and Chief Executive Officer,
Greenheck Fan Corporation
Richard D. Dudley
Chairman, Dudley Investments LLC
David L. Eisenreich
President, Regal-Beloit Motor Technologies Group
Thomas J. Howatt
President and Chief ExecutiveOfficer, Wausau-Mosinee
Paper Corporation
Ronald L. Klimisch
President, Wausau Supply Company
Alfred P. Moore
Division President, Fiserv Health
San W. Orr, Jr.
Chairman of the Board,Wausau-Mosinee Paper Corporation
Floyd G. Shelton
President, Superior Floor Company, Inc.
John L. Skoug
Chairman and Chief Executive Officer,
Marathon Cheese Corporation
Neil F. Slamka
Vice President and General Manager,
Green Bay Packaging, Inc.
Paul A. Spaude
Chief Administrative Officer,Aspirus, Inc.
Stanley F. Staples, Jr.
Chairman of the Board,Alexander Properties, Inc.
Affi l iate Boards
t h i r t y - tw o
51162 M&I 3/1/05 7:48 AM Page 34

WEST BEND, WI
Community Bank Advisory Board
Richard L. Leitheiser
President, M&I Marshall & Ilsley Bank,
West Bend
Thomas R. Bast
Chairman of the Board, retired,M&I First National Bank
Mark A. Hauser
Partner, Kieckhafer Dietzler
Hauser & Co.
Steven C. Johnson
President, Johnson School Bus Service, Inc.
Thomas W. Kieckhafer
Retired
Mark A. Nielsen
President, Cochran Sign Company, Inc.
Director Emeritus
Charles H. Johnson
M&I BANK FSB
3993 Howard Hughes ParkwaySuite 100
Las Vegas, NV 89109(702) 737-3910
Directors
Thomas J. O’Neill
President, M&I Bank FSB
Senior Vice President, Marshall & Ilsley Corporation
Executive Vice President, M&I Marshall & Ilsley Bank
Randall J. Erickson
Senior Vice President, General Counsel, and Corporate Secretary,
Marshall & Ilsley Corporation
Patricia R. Justiliano
Senior Vice President andCorporate Controller,
Marshall & Ilsley Corporation
John L. Roberts
Senior Vice President, Marshall & Ilsley Corporation
President, M&I Support Services Corp.
Donald H. Wilson
Senior Vice President andCorporate Treasurer,
Marshall & Ilsley Corporation
SOUTHWEST BANK
OF ST. LOUIS
2301 South Kingshighway St. Louis, MO 63110
(314) 776-5200 www.mysouthwestbank.com
Directors
Andrew N. Baur
Chairman, Southwest Bank of St. Louis
Andrew S. Baur
President and Chief Executive Officer,Community Banking,
Southwest Bank of St. Louis
Robert J. Witterschein
President and Chief Executive Officer,Commercial Banking,
Southwest Bank of St. Louis
Halvor B. Anderson
Retired, Manufacturing Executive
John T. Baumstark
President, Archway Sales, Inc.
John G. Brunner
Chief Executive Officer, Vi-Jon Laboratories, Inc.
William H. T. Bush
Chairman, Bush-O’Donnell & Co., Inc.
Francis C. Cunetto
President, Cunetto House of Pasta, Inc.
Donald Danforth III
President, City Academy
Robert E. Flynn III
President, Berry Grant Company
Peter S. Frane
Vice President, Olympic Marine, Inc.
Richard A. Grebel
President, KCI Construction
Frederick O. Hanser
Vice Chairman, St. Louis Cardinals, L.P.
Richard G. Millman
President, Millman Lumber Co.
Edward T. Noland
President, Pharma Tech Industries, Inc.
Almira B. Sant
Retired, Publisher
Directors Emeriti
Linn H. BealkeEdward C. Berra
William J. FreschiG. Fred Heimburger
Charles W. Hrebec, Jr.Charles A. Zone
Affi l iate Boards
t h i r t y - t h r e e
51162 M&I 3/1/05 7:48 AM Page 35

MARSHALL &
ILSLEY TRUST
COMPANY N.A.
1000 North Water Street Milwaukee, WI 53202
(414) 287-8700
Directors
Kenneth C. Krei
Chairman of the Board,President and Chief Executive
Officer, Marshall & IlsleyTrust Company N.A.
Chief Executive Officer, M&IInvestment Management Corp.
Senior Vice President, Marshall & Ilsley Corporation
Thomas R. Ellis
Senior Vice President, Marshall & Ilsley Corporation
Executive Vice President, M&I Marshall & Ilsley Bank
Mark F. Furlong
Executive Vice President, Marshall & Ilsley Corporation
President, M&I Marshall & Ilsley Bank
Daniel L. Kaminski
Vice President, Chief FinancialOfficer, and Secretary,
Marshall & Ilsley Trust Company N.A.
Dennis J. Kuester
Chairman of the Board,President and
Chief Executive Officer, Marshall & Ilsley Corporation
Chairman of the Board andChief Executive Officer,
M&I Marshall & Ilsley Bank
Chairman of the Board,Metavante Corporation
Thomas J. O’Neill
Senior Vice President, Marshall & Ilsley Corporation
Executive Vice President, M&I Marshall & Ilsley Bank
President, M&I Bank FSB
John M. Presley
Senior Vice President and Chief Financial Officer,
Marshall & Ilsley Corporation
Daryl J. Waszak, CFA
Senior Vice President,Wealth Management,
Marshall & Ilsley Trust Company N.A.
ARIZONA
Community Trust Advisory Board
Kenneth C. Krei
Chairman of the Board,President and Chief Executive
Officer, Marshall & IlsleyTrust Company N.A.
Chief Executive Officer, M&IInvestment Management Corp.
Senior Vice President, Marshall & Ilsley Corporation
Mark B. Bonsall
Chief Financial Executive andAssociate General Manager of
Commercial and CustomerServices, Salt River Project
Joseph J. Campanella
President and Chief ExecutiveOfficer, retired, Jet Aviation
Anthony V. Carollo
Chairman and Chief Executive Officer,
retired, Syntellect
P. Robert Fannin
Attorney, Steptoe & Johnson LLP
Jack B. Jewett
Senior Vice President of PublicPolicy, TMC Healthcare
Dennis R. Jones
Chairman and President, M&I Marshall & Ilsley Bank,
Arizona
Thomas C. Lathrop
Chairman, retired, M&I Thunderbird Bank
The Honorable
John C. Pritzlaff, Jr.
Chairman of the Board and President,
Rockmount Corporation
Robert E. Templin
Executive Vice President, retired, Northwestern Mutual Life
Insurance Company
FLORIDA
Community Trust Advisory Board
Kenneth C. Krei
Chairman of the Board,President and Chief Executive
Officer, Marshall & IlsleyTrust Company N.A.
Chief Executive Officer, M&IInvestment Management Corp.
Senior Vice President, Marshall & Ilsley Corporation
Morry L. Birnbaum
Chairman Emeritus, Marshall & Ilsley Trust
Company N.A.
Glen R. Bomberger
Executive Vice President andChief Financial Officer, retired,
A. O. Smith & Company
Dennis D. Finnigan
Vice President, retired, M&I Marshall & Ilsley Bank
William B. French
Senior Vice President, retired,M&I Marshall & Ilsley Bank
Charlotte A. Friede
Community Volunteer
Barbara W. Moore
Director, DSLT, Inc.
Stephen A. Saldanha
Chairman and Chief Executive Officer,
MTS Telecommunications, Inc.
Chairman, Pacer International Holding, Inc.
William A. Wade
President, Marshall & Ilsley TrustCompany N.A., Florida
Jeffrey V. Williams
Chairman of the Board, retired, Marshall & Ilsley
Trust Company N.A.
Affi l iate Boards
t h i r t y - f o u r
51162 M&I 3/1/05 7:48 AM Page 36

M&I INVESTMENT
MANAGEMENT CORP.
1000 North Water Street Milwaukee, WI 53202
(414) 287-7300
Directors
Kenneth C. Krei
Chief Executive Officer, M&IInvestment Management Corp.
Chairman of the Board,President and Chief Executive
Officer, Marshall & IlsleyTrust Company N.A.
Senior Vice President, Marshall & Ilsley Corporation
Tommy O. Huie, CFA
President and Chief Investment Officer,
M&I Investment Management Corp.
Daniel L. Kaminski
Vice President, Chief FinancialOfficer, and Secretary,
Marshall & Ilsley Trust Company N.A.
Daryl J. Waszak, CFA
Senior Vice President,Wealth Management,
Marshall & Ilsley Trust Company N.A.
METAVANTE
CORPORATION
4900 West Brown Deer RoadMilwaukee, WI 53223
(800) 236-3282 www.metavante.com
Directors
Dennis J. Kuester
Chairman of the Board,Metavante Corporation
Chairman of the Board,President and
Chief Executive Officer,Marshall & Ilsley Corporation
Chairman of the Board andChief Executive Officer,
M&I Marshall & Ilsley Bank
Frank R. Martire
President and Chief ExecutiveOfficer, Metavante Corporation
Senior Vice President, Marshall & Ilsley Corporation
Randall J. Erickson
Senior Vice President,General Counsel, and Corporate Secretary,
Marshall & Ilsley Corporation
Mark F. Furlong
Executive Vice President,Marshall & Ilsley Corporation
President, M&I Marshall & Ilsley Bank
Michael D. Hayford
Senior Executive Vice Presidentand Chief Financial Officer,
Metavante Corporation
M&I SUPPORT
SERVICES CORP.
770 North Water StreetMilwaukee, WI 53202
(414) 765-7700
Directors
John L. Roberts
President, M&I Support Services Corp.
Senior Vice President, Marshall & Ilsley Corporation
Thomas R. Ellis
Senior Vice President, Marshall & Ilsley Corporation
Executive Vice President,M&I Marshall & Ilsley Bank
Kenneth C. Krei
Chairman of the Board,President and Chief Executive
Officer, Marshall & IlsleyTrust Company N.A.
Chief Executive Officer, M&IInvestment Management Corp.
Senior Vice President, Marshall & Ilsley Corporation
Thomas J. O’Neill
Senior Vice President, Marshall & Ilsley Corporation
Executive Vice President, M&I Marshall & Ilsley Bank
President, M&I Bank FSB
M&I COMMUNITY
DEVELOPMENT
CORPORATION
933 North Mayfair Road, Suite 211Wauwatosa, WI 53226
(414) 256-6355
Directors
Robert J. Nicol
President, M&I Community Development
Corporation
Randall J. Erickson
Senior Vice President, General Counsel, and Corporate Secretary,
Marshall & Ilsley Corporation
Thomas J. O’Neill
Senior Vice President,Marshall & Ilsley Corporation
Executive Vice President, M&I Marshall & Ilsley Bank
President, M&I Bank FSB
Scott O. Sheaffer
Vice President, M&I Marshall & Ilsley Bank
James A. Urdan
Partner, retired, Quarles & Brady
Donald H. Wilson
Senior Vice President andCorporate Treasurer,
Marshall & Ilsley Corporation
Affi l iate Boards
t h i r t y - f i v e
51162 M&I 3/1/05 7:48 AM Page 37
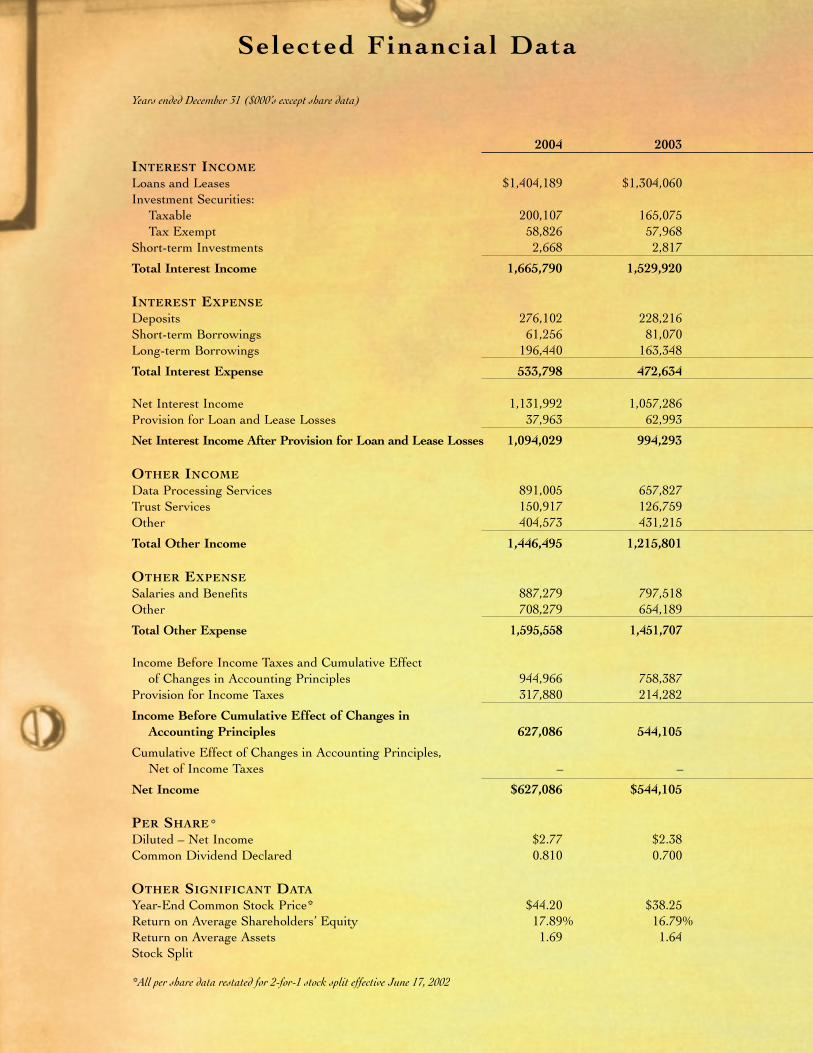
Years ended December 31 ($000’s except share data)
2004 2003
INTEREST INCOME
Loans and Leases $1,404,189 $1,304,060Investment Securities:
Taxable 200,107 165,075Tax Exempt 58,826 57,968
Short-term Investments 2,668 2,817
Total Interest Income 1,665,790 1,529,920
INTEREST EXPENSE
Deposits 276,102 228,216Short-term Borrowings 61,256 81,070Long-term Borrowings 196,440 163,348
Total Interest Expense 533,798 472,634
Net Interest Income 1,131,992 1,057,286Provision for Loan and Lease Losses 37,963 62,993
Net Interest Income After Provision for Loan and Lease Losses 1,094,029 994,293
OTHER INCOME
Data Processing Services 891,005 657,827Trust Services 150,917 126,759Other 404,573 431,215
Total Other Income 1,446,495 1,215,801
OTHER EXPENSE
Salaries and Benefits 887,279 797,518Other 708,279 654,189
Total Other Expense 1,595,558 1,451,707
Income Before Income Taxes and Cumulative Effectof Changes in Accounting Principles 944,966 758,387
Provision for Income Taxes 317,880 214,282
Income Before Cumulative Effect of Changes in
Accounting Principles 627,086 544,105
Cumulative Effect of Changes in Accounting Principles,Net of Income Taxes – –
Net Income $627,086 $544,105
PER SHARE*
Diluted – Net Income $2.77 $2.38Common Dividend Declared 0.810 0.700
OTHER SIGNIFICANT DATA
Year-End Common Stock Price* $44.20 $38.25Return on Average Shareholders’ Equity 17.89% 16.79%Return on Average Assets 1.69 1.64Stock Split
*All per share data restated for 2-for-1 stock split effective June 17, 2002
Selected Financial Data
51162 M&I 3/1/05 7:49 AM Page 38
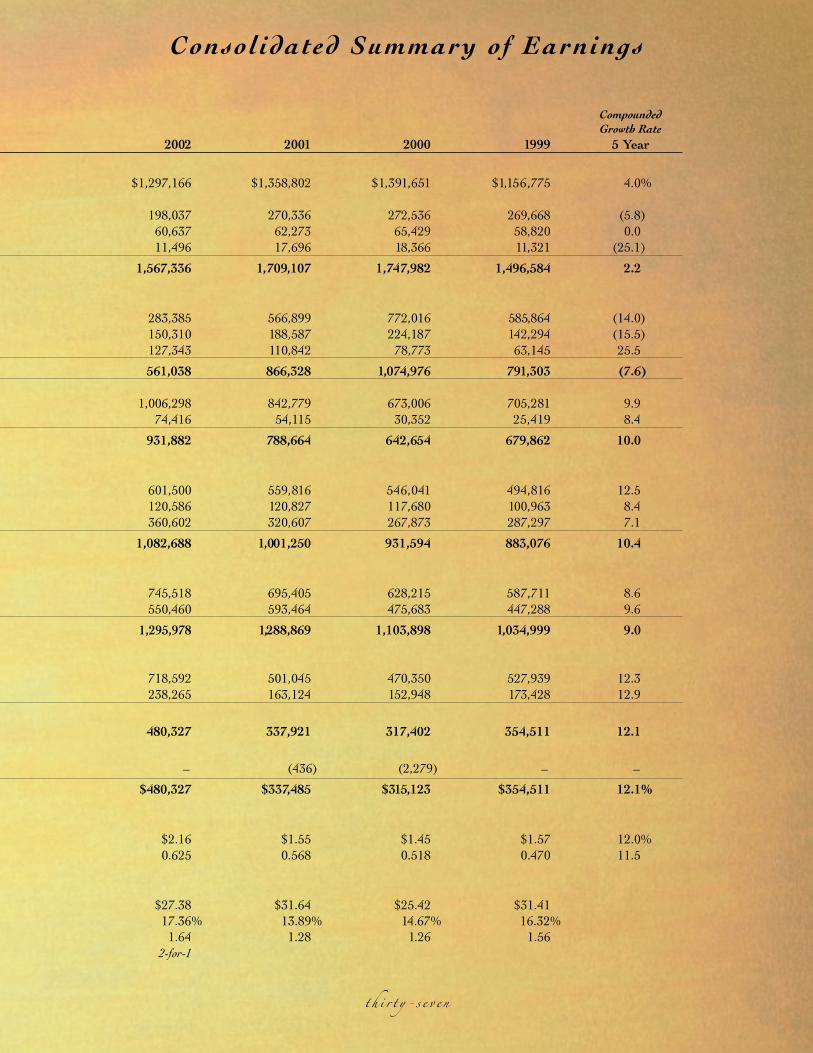
Compounded
Growth Rate
2002 2001 2000 1999 5 Year
$1,297,166 $1,358,802 $1,391,651 $1,156,775 4.0%
198,037 270,336 272,536 269,668 (5.8)60,637 62,273 65,429 58,820 0.011,496 17,696 18,366 11,321 (25.1)
1,567,336 1,709,107 1,747,982 1,496,584 2.2
283,385 566,899 772,016 585,864 (14.0)150,310 188,587 224,187 142,294 (15.5)127,343 110,842 78,773 63,145 25.5
561,038 866,328 1,074,976 791,303 (7.6)
1,006,298 842,779 673,006 705,281 9.974,416 54,115 30,352 25,419 8.4
931,882 788,664 642,654 679,862 10.0
601,500 559,816 546,041 494,816 12.5120,586 120,827 117,680 100,963 8.4360,602 320,607 267,873 287,297 7.1
1,082,688 1,001,250 931,594 883,076 10.4
745,518 695,405 628,215 587,711 8.6550,460 593,464 475,683 447,288 9.6
1,295,978 1,288,869 1,103,898 1,034,999 9.0
718,592 501,045 470,350 527,939 12.3238,265 163,124 152,948 173,428 12.9
480,327 337,921 317,402 354,511 12.1
– (436) (2,279) – –
$480,327 $337,485 $315,123 $354,511 12.1%
$2.16 $1.55 $1.45 $1.57 12.0%0.625 0.568 0.518 0.470 11.5
$27.38 $31.64 $25.42 $31.4117.36% 13.89% 14.67% 16.32%
1.64 1.28 1.26 1.562-for-1
Consolidated Summary of Earnings
t h i r t y - s e v e n
51162 M&I 3/1/05 7:49 AM Page 39

Years ended December 31 ($000’s except share data)
2004 2003
ASSETS
Cash and Due From Banks $835,391 $752,215Short-term Investments 171,057 264,254Trading Securities 22,297 23,017Investment Securities:
Taxable 4,672,741 4,038,579Tax Exempt 1,199,139 1,173,466
Loans and Leases:Commercial 7,621,040 6,905,323Commercial Real Estate 8,755,559 7,900,505Residential Real Estate 3,695,077 2,928,146Home Equity Loans and Lines 4,764,831 4,109,431Personal 1,632,440 1,874,315Lease Financing 552,551 674,871
Total Loans and Leases 27,021,498 24,392,591Allowance for Loan and Lease Losses 360,408 347,838
Net Loans and Leases 26,661,090 24,044,753Other Assets 3,600,879 2,971,737
Total Assets $37,162,594 $33,268,021
LIABILITIES AND SHAREHOLDERS’ EQUITY
Deposits:Noninterest Bearing Deposits $4,585,628 $4,189,724Bank Issued Interest Bearing Activity Accounts 9,960,645 10,084,996Bank Issued Time Deposits 3,384,120 3,399,734
Total Bank Issued Deposits 17,930,393 17,674,454Wholesale Deposits 6,057,542 4,311,424
Total Deposits 23,987,935 21,985,878Short-term Borrowings 2,908,168 3,138,752Long-term Borrowings 5,329,571 3,798,851Other Liabilities 1,432,134 1,103,886Shareholders’ Equity 3,504,786 3,240,654
Total Liabilities and Shareholders’ Equity $37,162,594 $33,268,021
OTHER SIGNIFICANT DATA
Book Value at Year-End** $17.24 $15.00Average Common Shares Outstanding** 223,123,866 226,342,764Shareholders of Record at Year End 18,913 19,708Employees at Year End 13,345 12,244
CREDIT QUALITY RATIOS
Net Charge-Offs to Average Loans and Leases 0.11% 0.21%
Total Nonperforming Loans* and OREO to End of Period Loans, Leases and OREO 0.48 0.74
Allowance for Loan and Lease Losses to End of Period Loans and Leases 1.21 1.39
Allowance for Loan and Lease Losses to Total Nonperforming Loans* 271 202
* Loans and leases nonaccrual, restructured, and past due 90 days or more
** Restated for 2-for-1 stock split effective June 17, 2002
Selected Financial Data
51162 M&I 3/1/05 7:49 AM Page 40

CompoundedGrowth Rate
2002 2001 2000 1999 5 Year
$708,256 $651,367 $615,015 $638,399 5.5%717,129 503,857 265,487 186,106 (1.7)
15,247 21,284 30,926 37,276 (9.8)
3,325,568 3,926,737 4,063,773 4,208,498 2.11,224,737 1,269,175 1,327,159 1,217,847 (0.3)
6,143,862 5,478,342 4,975,482 4,359,880 11.86,457,981 5,262,590 4,615,859 4,175,148 16.02,645,625 2,512,508 3,059,715 2,561,831 7.63,529,602 2,739,438 2,282,590 1,902,381 20.21,388,447 1,182,049 1,245,738 1,204,931 6.3
862,927 1,026,215 938,525 705,054 (4.8)
21,028,444 18,201,142 17,117,909 14,909,225 12.6302,664 253,089 233,466 228,500 9.5
20,725,780 17,948,053 16,884,443 14,680,725 12.72,485,933 2,049,836 1,854,974 1,732,112 15.8
$29,202,650 $26,370,309 $25,041,777 $22,700,963 10.4%
$3,509,133 $2,895,083 $2,648,419 $2,663,609 11.5%8,996,778 7,833,126 6,836,132 6,595,060 8.63,540,124 3,975,253 4,291,005 4,254,869 (4.5)
16,046,035 14,703,462 13,775,556 13,513,538 5.82,596,952 2,487,129 3,722,227 2,643,364 18.0
18,642,987 17,190,591 17,497,783 16,156,902 8.24,188,339 3,944,160 3,538,846 2,803,834 0.72,693,447 1,962,801 1,178,805 1,009,132 39.5
911,187 843,198 678,269 558,978 20.72,766,690 2,429,559 2,148,074 2,172,117 10.0
$29,202,650 $26,370,309 $25,041,777 $22,700,963 10.4%
$13.51 $11.65 $10.60 $9.74 12.1%212,799,996 208,587,816 208,201,304 209,881,574 –
19,141 19,311 17,061 20,549 –12,625 11,657 11,753 11,433 –
5 Year Average
0.21% 0.21% 0.22% 0.12% 0.17% 0.17%
0.85 0.94 0.76 0.75 0.75
1.42 1.39 1.34 1.38 1.35
174 154 182 193 197
Consolidated Average Balance Sheets
t h i r t y - n i n e
51162 M&I 3/1/05 7:49 AM Page 41

51162 M&I 3/1/05 7:49 AM Page 42
Management’s Discussion and Analysis of Financial Position and Results of Operations
Consolidated Financial Statements
Management’s Report on Internal Control Over Financial Reporting
Reports of Independent Registered Public Accounting Firm
41
Consolidated Financial Information


MANAGEMENT’S DISCUSSION AND ANALYSIS OF FINANCIAL POSITION ANDRESULTS OF OPERATIONS
Overview
The year ended December 31, 2004 was a significant year for the Corporation in terms of growth and successacross all of its segments and reporting units. Strong sales efforts and an improving economy resulted in solid loanand demand deposit growth in all of the Corporation’s markets, resulting in an increase in net interest income in2004 compared to 2003. The Corporation’s loan customers continued to successfully manage their businessesthrough the recent economic downturn. The Corporation’s historically sound credit quality continued to improve,which resulted in a lower provision for loan and lease losses in 2004 compared to the prior year. An activeacquisition and cross-sale strategy coupled with strong outsourcing contract renewals enabled Metavante to sustaindouble-digit growth in segment earnings. Strong sales efforts and improving equity markets resulted in solid growthin fee income for Trust Services. Mortgage loan production, which was very robust in 2003 and 2002, slowed due torising interest rates in 2004. Although an unpredictable source of earnings, the Corporation’s Capital MarketsGroup recognized investment securities gains for the second year in a row. These factors along with continuedexpense management, all contributed to the consolidated earnings growth in 2004.
Net income in 2004 amounted to $627.1 million or $2.77 per share on a diluted basis. The return on averageassets and return on average equity were 1.69% and 17.89%, respectively. By comparison, 2003 net income was$544.1 million, diluted earnings per share was $2.38, the return on average assets was 1.64% and the return onaverage equity was 16.79%. For the year ended December 31, 2002, net income was $480.3 million or $2.16 perdiluted share and the returns on average assets and average equity were 1.64% and 17.36%, respectively.
As more fully described below, net income and diluted earnings per share for the year ended December 31,2004 included a net unrealized gain recognized in the fourth quarter associated with the Corporation’s CapitalMarkets Group investments, charitable foundation expense higher than historical levels and other accrualadjustments and two divestitures by Metavante for a loss that in the aggregate increased net income byapproximately $13.5 million or $0.06 per diluted share.
With regard to the outlook in 2005 for the Banking Segment, management expects that commercial loangrowth (as a percentage) will be in the low double digits and personal loan growth (as a percentage) will be in themid single digits. Overall, noninterest bearing deposit growth is expected to be in the mid single digits. Based on thegeneral improvement in various segments of the loan portfolio, nonperforming loans and leases as a percentage oftotal loans and leases outstanding are expected to be in the 50-60 basis point range. Mortgage loan production isexpected to continue at the volumes experienced in the second half of 2004. In the Data Services Segment,management expects Metavante’s 2005 organic revenue growth (as a percentage) to be in the mid single digits, andsegment income growth is expected to continue to improve. The Corporation’s actual results for 2005 could differmaterially from those expected by management. See “Forward-Looking Statements” in Item 1 in the Corporation’sAnnual Report on Form 10-K for a discussion of the various risk factors that could cause actual results to bedifferent than expected results.
The results of operations and financial position for the periods presented include the effects of the acquisitionsby Metavante as well as the banking-related acquisition from the dates of consummation of the acquisitions. Alltransactions were accounted for using the purchase method of accounting. See Note 4 in Notes to ConsolidatedFinancial Statements for a discussion of the Corporation’s acquisition activities in 2004, 2003 and 2002.
Significant Transactions
Some of the more significant transactions in 2004, 2003 and 2002 consisted of the following:
During 2004, net gains associated with the Corporation’s Capital Markets Group investments amounted to$34.6 million. As announced in the Corporation’s Form 8-K filed on November 12, 2004, approximately $34.1million of the net gain in 2004 was from a net unrealized gain recognized in the fourth quarter of 2004 due to the netincrease in market value of certain fund investments.
The net unrealized gain recognized in the fourth quarter of 2004 was offset by charitable foundation expensehigher than historical levels and other accrual adjustments that amounted to approximately $6.8 million.
4 3
During 2004, Metavante sold its small business 401k Retirement Plan Services operations. In conjunction withan expanded processing relationship, Metavante also sold the direct customer base of Paytrust.com in 2004. Thesetransactions resulted in an aggregate loss of approximately $7.1 million.
During 2004, the Corporation issued 3.6 million shares of its common stock in a public offering that resulted innet proceeds to the Corporation of approximately $149.9 million. Also during 2004, the Corporation issued $400million of equity units (referred to as Common SPACESSM) that resulted in net proceeds to the Corporation ofapproximately $389.2 million. Each Common SPACES consists of (i) a stock purchase contract under which theinvestor agrees to purchase for $25.00, a fraction of a share of the Corporation’s common stock on the stockpurchase date and (ii) a 1/40, or 2.5%, undivided beneficial interest in a preferred security of M&I Capital Trust B(also referred to as the STACKSSM) with each share having an initial liquidation value of $1,000. The stockpurchase date is expected to be August 15, 2007 but could be deferred for quarterly periods until August 15, 2008.On the stock purchase date, the number of shares of common stock the Corporation will issue upon settlement ofthe stock purchase contracts depends on the applicable market value per share of the Corporation’s common stock,which will be determined just prior to the stock purchase date, and other factors. The Corporation currentlyestimates that it will issue approximately 8.7 million to 10.9 million common shares to settle shares issuablepursuant to the stock purchase contracts. The proceeds from these issuances together with proceeds from theissuance of $600.0 million of senior notes were used for general corporate purposes, including maintaining capital atdesired levels and providing long-term financing for the acquisitions completed by Metavante in 2004.
During 2004, the Corporation’s banking segment prepaid and retired certain higher cost long-term debt andterminated some related receive floating / pay fixed interest rate swaps designated as cash flow hedges. The totaldebt retired amounted to $355.0 million and the charge to earnings amounted to a loss of $6.9 million.
During 2003, gains recognized by the Corporation’s Capital Markets Group amounted to $20.0 million.Approximately $16.2 million of the gain was from the sale of an investment in the third quarter of 2003.
Also during 2003, several income tax audits covering multiple tax jurisdictions were resolved which positivelyaffected the banking segment by approximately $28.6 million and Metavante by $10.7 million and resulted in alower provision for income taxes in the Consolidated Statements of Income for the year ended December 31, 2003.
The Corporation used the unanticipated Capital Markets Group gains and the impact from resolving incometax audits to take advantage of the low interest rate environment in 2003. The Corporation prepaid and retiredcertain higher cost long-term debt and terminated some related receive floating / pay fixed interest rate swapsdesignated as cash flow hedges. The total debt retired amounted to $744.6 million and the charge to earningsamounted to $56.7 million.
As a result of a shift in product strategy, Metavante wrote-off certain purchased and internally developedsoftware in 2003 that will no longer be used, resulting in losses of $22.8 million in 2003.
For the years ended December 31, 2003 and 2002, Metavante incurred integration costs associated with theJuly 29, 2002 acquisition of Paytrust, Inc. (“Paytrust”) an online bill management company. Such costs were theresult of operating duplicate platforms, which included duplicate facilities, personnel and processing costs, andcontinued through the first quarter of 2003. Total integration costs incurred amounted to $9.6 million. Costsincurred in 2002 amounted to $7.1 million and costs incurred in the first quarter of 2003 amounted to $2.5 million.
Net Interest Income
Net interest income, which is the difference between interest earned on earning assets and interest owed oninterest bearing liabilities, represents almost half of the Corporation’s source of revenues.
Net interest income in 2004 amounted to $1,132.0 million compared with net interest income of $1,057.3million in 2003, an increase of $74.7 million or 7.1%. Loan growth and growth in lower cost deposits, increasedspreads on certain loan products and the impact of the early retirement of some higher cost long-term borrowings in
4 4

2003 and 2004 were positive contributors to the increase in net interest income in 2004. Net interest income in 2004was negatively affected by the continued lengthening of liabilities in order to reduce future volatility in net interestincome as a result of interest rate movements and cash expenditures for common share buybacks and acquisitions.
Average earning assets in 2004 amounted to $33.1 billion compared to $29.9 billion in 2003, an increase of $3.2billion or 10.7%. Increases in average loans and leases accounted for the majority of the growth in average earning assets.
Average interest bearing liabilities increased $2.9 billion or 11.8% in 2004 compared to 2003. Approximately$1.6 billion or 55.3% of the growth in average interest bearing liabilities was attributable to interest bearing depositsand the remainder of the growth in average interest bearing liabilities was attributable to long term borrowings.
Average noninterest bearing deposits increased $0.4 billion or 9.4% in 2004 compared to the prior year.
The growth and composition of the Corporation’s average loan and lease portfolio for the current year andprior two years are reflected in the following table ($ in millions):
Percent Growth
2004 2003 2002
2004vs
2003
2003vs
2002
Commercial:Commercial . . . . . . . . . . . . . . . . . . . . . . . . . . . . . . . . . . . . . . . $ 7,621.0 $ 6,905.3 $ 6,143.8 10.4% 12.4%Commercial real estate:
Commercial mortgages . . . . . . . . . . . . . . . . . . . . . . . . . . . . 7,658.2 6,901.0 5,703.2 11.0 21.0Construction . . . . . . . . . . . . . . . . . . . . . . . . . . . . . . . . . . . . . 1,097.4 999.5 754.8 9.8 32.4
Total commercial real estate . . . . . . . . . . . . . . . . . . . . . . . . . . 8,755.6 7,900.5 6,458.0 10.8 22.3Commercial lease financing . . . . . . . . . . . . . . . . . . . . . . . . . . . 397.0 390.0 395.2 1.8 (1.3)
Total commercial . . . . . . . . . . . . . . . . . . . . . . . . . . . . . . . . . . . . 16,773.6 15,195.8 12,997.0 10.4 16.9Personal:
Residential real estate:Residential mortgages . . . . . . . . . . . . . . . . . . . . . . . . . . . . . 2,855.3 2,335.2 2,170.7 22.3 7.6Construction . . . . . . . . . . . . . . . . . . . . . . . . . . . . . . . . . . . . . 839.8 593.0 474.9 41.6 24.9
Total residential real estate . . . . . . . . . . . . . . . . . . . . . . . . . . . 3,695.1 2,928.2 2,645.6 26.2 10.7Consumer loans:
Student . . . . . . . . . . . . . . . . . . . . . . . . . . . . . . . . . . . . . . . . . 87.2 95.8 103.4 (9.0) (7.3)Credit card . . . . . . . . . . . . . . . . . . . . . . . . . . . . . . . . . . . . . . 224.0 198.0 170.2 13.1 16.3Home equity loans and lines . . . . . . . . . . . . . . . . . . . . . . . . 4,764.8 4,109.4 3,529.6 15.9 16.4Other . . . . . . . . . . . . . . . . . . . . . . . . . . . . . . . . . . . . . . . . . . . 1,321.3 1,580.5 1,114.9 (16.4) 41.8
Total consumer loans . . . . . . . . . . . . . . . . . . . . . . . . . . . . . . . . 6,397.3 5,983.7 4,918.1 6.9 21.7Personal lease financing . . . . . . . . . . . . . . . . . . . . . . . . . . . . . . 155.5 284.9 467.7 (45.4) (39.1)
Total personal . . . . . . . . . . . . . . . . . . . . . . . . . . . . . . . . . . . . . . . 10,247.9 9,196.8 8,031.4 11.4 14.5
Total consolidated average loans and leases . . . . . . . . . . . . . . $27,021.5 $24,392.6 $21,028.4 10.8% 16.0%
Average loans and leases increased $2.6 billion or 10.8% in 2004 compared to 2003. Total average commercialloan growth amounted to $1.6 billion. Total average commercial loan growth in 2004 compared to 2003 consisted ofaverage commercial real estate and commercial real estate construction loan growth which contributed $0.9 billionand average commercial loan growth which contributed $0.7 billion. Total average personal loan growth amountedto $1.1 billion in 2004 compared to 2003. Total average personal loan growth in 2004 compared to 2003 was drivenby growth in average home equity loans and lines which increased $0.7 billion and growth in average residentialreal estate and residential real estate construction loan growth which increased $0.8 billion. From a productionstandpoint, residential real estate loan closings in 2004 were $1.3 billion or 23.6% lower than residential real estateloan closings in 2003. Average indirect auto loans and leases declined approximately $0.4 billion in 2004 comparedto 2003 which reflects, in part, the effect of the sale and securitization of indirect auto loans in 2004 and 2003.
4 5
The strong growth in commercial loans in 2004 generally occurred somewhat evenly throughout the year, wasexperienced in all of the Corporation’s markets, and came from both new customers and existing customers across avariety of industries.
Management expects that commercial loan growth (as a percentage) will reach the low double digits in 2005.The basis for this expectation includes continued success in attracting new customers in all of the Corporation’smarkets and continued modest economic growth that will strengthen over the next few quarters in the primarymarkets that the Corporation serves. Management expects that personal loan growth (as a percentage) will be inthe mid single digits in 2005. With respect to residential real estate production, early indications (as measured byapplication volume) suggest that quarterly residential real estate closings in the near term may approximate thevolume of closings experienced in the third and fourth quarters of 2004. Home equity loans and lines, which includeM&I’s wholesale activity, continue to be the primary consumer loan product. Management anticipates theseproducts will continue to drive growth in the consumer side of its banking activities.
The Corporation periodically sells residential real estate loan production in the secondary market servicingreleased, although selected loans with wider interest spreads and adjustable rate characteristics are periodicallyretained in the portfolio. Residential real estate loans originated and sold to the secondary market amounted to $1.6billion in 2004 compared to $3.5 billion in 2003. Approximately $0.3 billion of loans sold in 2004 were attributableto the AmerUs Home Lending, Inc. (“AmerUs”) acquisition. At December 31, 2004 and 2003, mortgage loans heldfor sale were insignificant. Gains from the sale of mortgage loans amounted to $27.2 million in 2004 compared to$54.1 million in 2003. Approximately $6.2 million of the gain in 2004 was attributable to the AmerUs acquisition.
Auto loans securitized and sold amounted to $0.5 billion in 2004 compared to $0.8 billion in 2003. Losses fromthe sale and securitization of auto loans, including write-downs of auto loans held for sale, amounted to $3.0 millionin 2004 compared to gains from the sale and securitization of auto loans of $2.7 million in 2003. The losses incurredin 2004 were primarily due to lower loan interest rate spreads associated with new auto loan production in a risinginterest rate environment. See Note 9 in Notes to Consolidated Financial Statements for further discussion of theCorporation’s securitization activities.
The Corporation anticipates that it will continue to divest of narrower interest spread assets through sale orsecuritization in future periods.
4 6

The growth and composition of the Corporation’s consolidated average deposits for the current year and priortwo years are reflected below ($ in millions):
Percent Growth
2004 2003 2002
2004vs
2003
2003vs
2002
Bank issued deposits:Noninterest bearing:
Commercial . . . . . . . . . . . . . . . . . . . . . . . . . . . . . . . . . . . . . . $ 3,210.5 $ 2,903.3 $ 2,423.9 10.6% 19.8%Personal . . . . . . . . . . . . . . . . . . . . . . . . . . . . . . . . . . . . . . . . . 897.1 815.9 711.4 10.0 14.7Other . . . . . . . . . . . . . . . . . . . . . . . . . . . . . . . . . . . . . . . . . . . 478.0 470.5 373.8 1.6 25.9
Total noninterest bearing . . . . . . . . . . . . . . . . . . . . . . . . . . . . . . 4,585.6 4,189.7 3,509.1 9.4 19.4Interest bearing:
Activity accounts:Savings and NOW . . . . . . . . . . . . . . . . . . . . . . . . . . . . . . . 3,388.4 3,148.7 2,352.3 7.6 33.9Money market . . . . . . . . . . . . . . . . . . . . . . . . . . . . . . . . . . 5,675.6 6,115.3 5,892.9 (7.2) 3.8Foreign activity . . . . . . . . . . . . . . . . . . . . . . . . . . . . . . . . . 896.7 821.0 751.6 9.2 9.2
Total activity accounts . . . . . . . . . . . . . . . . . . . . . . . . . . . . . . 9,960.7 10,085.0 8,996.8 (1.2) 12.1Time deposits:
Other CDs and time . . . . . . . . . . . . . . . . . . . . . . . . . . . . . 2,632.7 2,764.7 2,884.7 (4.8) (4.2)CDs $100,000 and over . . . . . . . . . . . . . . . . . . . . . . . . . . . 751.4 635.1 655.4 18.3 (3.1)
Total time deposits . . . . . . . . . . . . . . . . . . . . . . . . . . . . . . . . . 3,384.1 3,399.8 3,540.1 (0.5) (4.0)
Total interest bearing . . . . . . . . . . . . . . . . . . . . . . . . . . . . . . . 13,344.8 13,484.8 12,536.9 (1.0) 7.6
Total bank issued deposits . . . . . . . . . . . . . . . . . . . . . . . . . . . . . . 17,930.4 17,674.5 16,046.0 1.4 10.1Wholesale deposits:
Money market . . . . . . . . . . . . . . . . . . . . . . . . . . . . . . . . . . 499.8 74.6 76.6 569.9 (2.6)Brokered CDs . . . . . . . . . . . . . . . . . . . . . . . . . . . . . . . . . . 4,582.8 2,986.0 1,465.5 53.5 103.8Foreign time . . . . . . . . . . . . . . . . . . . . . . . . . . . . . . . . . . . . 974.9 1,250.8 1,054.9 (22.1) 18.6
Total wholesale deposits . . . . . . . . . . . . . . . . . . . . . . . . . . . . . . . 6,057.5 4,311.4 2,597.0 40.5 66.0
Total consolidated average deposits . . . . . . . . . . . . . . . . . . . . . . $23,987.9 $21,985.9 $18,643.0 9.1% 17.9%
Average bank issued deposits increased $0.3 billion or 1.4% in 2004 compared with 2003. Average noninterestbearing deposits increased $0.4 billion and average interest bearing activity accounts decreased $0.1 billion. Savingsand NOW accounts, especially NOW accounts, exhibited the greatest growth in bank issued interest bearingactivity deposits in 2004 compared to 2003. This growth was offset in part by a decline in money market depositscompared to the prior year. Average bank issued time deposits were relatively unchanged in 2004 compared to2003. As interest rates increased, the Corporation began to experience some success in competing for time depositswithout pricing above comparable wholesale levels in the second half of 2004.
The growth in bank issued deposits includes both commercial and retail banking and the effect of the lowerinterest rate environment. The growth in noninterest and interest-bearing activity accounts and the shift in depositmix of average bank issued deposits provided a benefit to net interest income and the net interest margin in 2004.Noninterest deposit balances tend to exhibit some seasonality with a trend of balances declining somewhat in theearly part of the year followed by growth in balances throughout the remainder of the year. A portion of thenoninterest balances is sensitive to the interest rate environment. Larger balances tend to be maintained whenoverall interest rates are low and smaller balances tend to be maintained as overall interest rates increase.Management expects these trends to continue and expects noninterest bearing deposit growth (as a percentage) tobe in the mid to high single digits and bank issued interest bearing deposit growth to be in the low to mid singledigits in 2005. In commercial banking, the focus remains on developing deeper relationships through the sale oftreasury management products and services along with revised incentive plans focused on growing deposits. Theretail banking strategy continues to focus on aggressively selling the right products to meet the needs of customersand enhance the Corporation’s profitability.
4 7
Average wholesale deposits increased $1.7 billion which reflects the Corporation’s greater use of wholesalefunding alternatives, especially institutional CDs. These deposits are funds in the form of deposits generatedthrough distribution channels other than the Corporation’s own banking branches. These deposits allow theCorporation’s bank subsidiaries to gather funds across a wider geographic base and at pricing levels consideredattractive. The underlying depositor may be retail or institutional. Access to and use of these funding sources alsoprovide the Corporation added flexibility not to pursue unprofitable single service time deposit relationships.
During 2004, the Corporation issued $100.0 million of Series E medium-term notes with an interest rate of1.72% and $17.0 million of MiNotes (which are medium-term notes issued in smaller denominations to attract retailinvestors) with a weighted average interest rate of 4.21%. During 2004, MiNotes in the amount of $7.2 million withan annual weighted average interest rate of 5.85% were called by or put to the Corporation in accordance with theexisting terms of the MiNote agreements and $1.0 million of medium-term notes Series D with an annual interestrate of 7.20% matured. During the third quarter of 2004, the Corporation completed two financing transactionsaggregating $1.0 billion that consisted of $600.0 million of 4.375% Senior Notes and 16,000,000 units of CommonSPACESSM. Each unit has a stated value of $25.00 for an aggregate value of $400.0 million. The net proceeds wereused for general corporate purposes, including the long-term financing for the Metavante acquisitions completed in2004.
During 2004, the Corporation’s lead bank, M&I Marshall & Ilsley Bank (“M&I Bank”) issued $425.0 millionof senior notes with a weighted average interest rate of 3.35%. In addition, M&I Bank issued $200.0 million ofamortizing senior bank notes with a semi-annual coupon interest rate of 2.90% and issued $300.0 million ofsubordinated notes at an interest rate of 5.00%. New Federal Home Loan Bank (“FHLB”) advances in 2004amounted to $1.0 billion. Approximately $650.0 million of the new FHLB advances were fixed rate advances with aweighted average interest rate of 3.01% and the remainder were floating rate advances. In December 2004, $1.0billion of existing senior bank notes (puttable reset securities) were remarketed.
During 2004, M&I Bank prepaid $300.0 million of floating rate FHLB advances and terminated receivefloating / pay fixed interest rate swaps designated as cash flow hedges against the FHLB advances. The terminationof the interest rate swaps resulted in a charge to earnings of $2.0 million. Also during 2004, a fixed rate advancefrom the FHLB aggregating $55.0 million with an annual coupon interest rate of 5.06% was prepaid and retiredresulting in a charge to earnings of $4.9 million. The charge to earnings resulting from these transactions is reportedin other expense in the Consolidated Statements of Income.
The net interest margin on a fully taxable equivalent basis (“FTE”) as a percent of average earning assets was3.52% in 2004 compared to 3.65% in 2003, a decrease of 13 basis points. The Corporation estimates that theadditional interest expense associated with the $1.0 billion of debt issued in late July 2004 to finance Metavante’s2004 acquisitions lowered the net interest margin on a FTE basis by approximately 6 basis points, or approximately13 basis points on an annualized basis. Unlike a bank acquisition or loan growth, where the primary source ofrevenue is interest income, the revenue impact of Metavante’s acquisitions is reported in other income and is not acomponent of the net interest margin statistic.
The yield on average earning assets was 5.14% in 2004 compared to 5.24% in 2003, a decrease of 10 basispoints. The growth in average earning assets, primarily loans, contributed approximately $168.7 million to interestincome while the decline in the yield adversely impacted interest income (FTE) by approximately $32.4 million.
The cost of interest bearing liabilities was 1.93% in 2004 compared to 1.91% in 2003, an increase of 2 basispoints. The increase in average volume of interest bearing liabilities, primarily wholesale deposits and long-termborrowings, increased interest expense by approximately $55.5 million in 2004 compared to 2003.
The Corporation actively manages the repricing characteristics of its liabilities so as to minimize the long-termimpact on net interest income when interest rates begin to rise. Management expects the net interest margin FTE asa percent of average earning assets will continue to have modest downward pressure in 2005. A full year of interestexpense associated with the $1.0 billion of debt issued in late July 2004 to finance Metavante’s 2004 acquisitionswill continue to lower the net interest margin on a FTE basis in 2005. In addition, management anticipates that loanspreads will most likely narrow, particularly in a rising interest rate environment, and as the economy improves, the
4 8

Corporation’s capacity to generate loans may exceed its ability to generate appropriately priced deposits. The netinterest margin will continue to be influenced by product spreads as well as loan and deposit growth and the generalinterest rate environment.
Net interest income in 2003 amounted to $1,057.3 million compared with net interest income of $1,006.3million in 2002, an increase of $51.0 million or 5.1%. Solid balance sheet growth fueled in part by the impact of the2002 acquisitions, organic growth in loans and lower cost deposits, increased spreads on certain loan products and,to a lesser extent due to the timing of the transactions, the early retirement of some higher cost long-termborrowings were positive contributors to the increase in net interest income in 2003. Net interest income in 2003was negatively impacted by accelerated prepayments across all earning asset classes that were predominantlyexperienced in the first three quarters of 2003, asset repricing in excess of deposit repricing, the impact fromlengthening liabilities in order to reduce future volatility in net interest income due to interest rate movements andthe cash expenditures for common share buybacks and acquisitions.
Average earning assets in 2003 amounted to $29.9 billion compared to $26.3 billion in 2002, an increase of $3.6billion or 13.6%. Average loans and leases accounted for the majority of the growth in average earning assets.
Average interest bearing liabilities increased $2.7 billion or 12.3% in 2003 compared to 2002. The growth inaverage interest bearing deposits accounted for all of the growth in average interest bearing liabilities.
Average noninterest bearing deposits increased $0.7 billion or 19.4% in 2003 compared to the prior year.
Average earning assets and average interest bearing liabilities in 2003 and 2002 reflect the impact of theCorporation’s banking acquisitions which were all accounted for as purchases and therefore are included in theCorporation’s financial position and results of operations since the date the acquisitions were completed. While thebanking acquisitions are fully reflected in 2003, the acquisitions of Richfield State Agency, Inc. and CenturyBancshares, Inc. have been included for ten months in 2002 and the acquisition of Mississippi Valley Bancshares,Inc. has been included for three months in 2002.
Compared to 2002, average loans and leases increased $3.4 billion or 16.0% in 2003. Approximately $1.3billion of average loan growth was due to the banking acquisitions previously discussed. Excluding the acquisitions,total average commercial loan growth amounted to $1.0 billion, which was driven by commercial real estate loanand commercial real estate construction loan growth of $0.8 billion. Excluding the effects of acquisitions, averagepersonal loans also grew approximately $1.0 billion. Home equity loans and lines contributed approximately $0.5billion of the personal loan growth. Indirect auto loans and leases and residential real estate loans each contributedapproximately $0.2 billion to the annual average growth in personal loans, excluding the acquisitions.
The rate of growth in commercial loans in 2003, excluding acquisitions, was largely the result of attracting newcustomers and increased borrowing from existing customers in all of the Corporation’s markets. Existing customerswere generally not increasing their credit needs but were successfully managing their businesses through the slowereconomic conditions and using cash flow to pay down loan balances. The strong cash flow of the underlyingcustomer base that resulted in the pay down of loan balances contributed to the improvement in nonperformingloans.
The Corporation sells residential real estate loan production in the secondary market servicing released,although selected loans with wider interest spreads and adjustable rate characteristics are periodically retained inthe portfolio. Residential real estate loans originated and sold to the secondary market amounted to $3.5 billion in2003 compared to $3.1 billion in 2002. In the first three quarters of 2003, residential real estate loans originated andsold to the secondary market averaged $1.1 billion per quarter and declined approximately 78% to $0.2 billion inthe fourth quarter of 2003. At December 31, 2003, mortgage loans held for sale were insignificant compared to $0.3billion at December 31, 2002. Auto loans securitized and sold in 2003 amounted to $0.8 billion. Gains from the saleof mortgage loans amounted to $54.1 million in 2003 compared to $39.7 million in 2002. Gains from the sale andsecuritization of auto loans amounted to $2.7 million in 2003 and $7.2 million in 2002.
Average bank issued deposits increased $1.6 billion or 10.1% in 2003 compared to 2002. Approximately $1.4billion of the average growth was attributable to acquisitions. Excluding the impact of acquisitions, average
4 9
noninterest bearing deposits increased $0.5 billion and interest bearing activity accounts increased $0.2 billion.Savings and NOW accounts, especially NOW accounts, exhibited the greatest growth in bank issued interestbearing activity deposits in 2003 compared to 2002. This growth was offset in part by a decline in money marketdeposits compared to the prior year. Excluding acquisitions, average bank issued time deposits declined $0.5 billion.
The growth in bank issued deposits included both commercial and retail banking and the effect of the lowerinterest rate environment. The growth in noninterest and interest-bearing activity accounts and the shift in depositmix of average bank issued deposits provided a benefit to net interest income and the net interest margin in 2003.
Average wholesale deposits increased $1.7 billion in 2003 which reflects the Corporation’s greater use ofwholesale funding alternatives, especially institutional CDs. These deposits are funds in the form of depositsgenerated through distribution channels other than the Corporation’s own banking branches.
During 2003, the Corporation issued $80.0 million of Series E medium-term notes with a weighted averageinterest rate of 4.92% and $99.2 million of MiNotes (which are medium-term notes issued in smaller denominationsto attract retail investors) with a weighted average interest rate of 4.82%. New FHLB advances in 2003 amountedto $1.1 billion. Approximately $0.5 billion of the new FHLB advances were fixed rate advances and the remainderwere floating rate advances. In December 2003, $1.0 billion of existing senior bank notes (puttable reset securities)were remarketed.
The Corporation’s 6.375% subordinated notes in the amount of $100.0 million matured in the third quarter of2003. Series D medium-term notes aggregating $13.0 million with a weighted average interest rate of 6.99%matured at various times in 2003.
During 2003, the Corporation acquired through open-market purchases $51.6 million of its 5.75% Series Enotes that were scheduled to mature in 2006. The Corporation also retired the floating rate debentures that were thesole asset of MVBI Capital Trust, which in turn redeemed its floating rate trust preferred securities. In conjunctionwith this transaction, the receive floating / pay fixed interest rate swap designated as a cash flow hedge on theforecasted interest payments on the retired subordinated debt was terminated. Also in 2003, the Corporation’sbanking segment acquired through open-market purchases $13.2 million of 4.125% senior bank notes that werescheduled to mature in 2007 and $22.3 million of 6.375% subordinated bank notes that were scheduled to mature in2011. In addition, FHLB fixed rate advances aggregating $33.2 million with a weighted average interest rate of6.08% and $610.0 million of FHLB floating rate advances were retired. Receive floating / pay fixed interest rateswaps designated as cash flow hedges on the forecasted interest payments on the retired FHLB floating rateadvances were terminated. The aggregate charge associated with these transactions in 2003 amounted to $56.7million and is reported in other expense in the Consolidated Statements of Income.
The net interest margin on a FTE basis as a percent of average earning assets was 3.65% in 2003 compared to3.96% in 2002, a decrease of 31 basis points.
The yield on average earning assets was 5.24% in 2003 compared to 6.10% in 2002, a decrease of 86 basispoints. The growth in average earning assets, primarily loans, contributed approximately $220.2 million to interestincome while the decline in the yield adversely impacted interest income (FTE) by approximately $258.0 million.
The cost of interest bearing liabilities was 1.91% in 2003 compared to 2.55% in 2002, a decrease of 64 basispoints. The decrease in the rates paid on interest bearing liabilities contributed approximately $157.7 million of thedecrease in interest expense while the increase in volume partially offset the benefit by approximately $69.3 millionin 2003 compared to the prior year.
5 0

Average Balance Sheets and Analysis of Net Interest Income
The Corporation’s consolidated average balance sheets, interest earned and interest paid, and the averageinterest rates earned and paid for each of the last three years are presented in the following table ($ in thousands):
2004 2003 2002
AverageBalance
InterestEarned/
Paid
AverageYield orCost (3)
AverageBalance
InterestEarned/
Paid
AverageYield orCost (3)
AverageBalance
InterestEarned/
Paid
AverageYield orCost (3)
Loans and leases (1)(2) . . . . . . . . . . . . $27,021,498 $1,406,825 5.21% $24,392,591 $1,306,565 5.36% $21,028,444 $1,299,416 6.18%Investment securities:
Taxable . . . . . . . . . . . . . . . . . . . . . 4,672,741 200,107 4.30 4,038,579 165,075 4.13 3,325,568 198,037 6.11Tax-exempt (1) . . . . . . . . . . . . . . 1,199,139 88,425 7.53 1,173,466 87,194 7.58 1,224,737 90,539 7.49
Interest bearing deposits in otherbanks . . . . . . . . . . . . . . . . . . . . . . . . 26,824 628 2.34 27,022 528 1.95 44,420 1,075 2.42
Federal funds sold and security resaleagreements . . . . . . . . . . . . . . . . . . . . 53,675 857 1.60 28,692 395 1.38 31,219 623 2.00
Trading securities (1) . . . . . . . . . . . . . 22,297 281 1.26 23,017 266 1.16 15,247 337 2.21Other short-term investments . . . . . . . 90,558 912 1.01 208,540 1,636 0.79 641,490 9,470 1.48
Total interest earning assets . . 33,086,732 1,698,035 5.14% 29,891,907 1,561,659 5.24% 26,311,125 1,599,497 6.10%Cash and demand deposits due from
banks . . . . . . . . . . . . . . . . . . . . . . . . 835,391 752,215 708,256Premises and equipment, net . . . . . . . . 448,134 440,492 418,042Other assets . . . . . . . . . . . . . . . . . . . . . 3,152,745 2,531,245 2,067,891Allowance for loan and lease losses . . . (360,408) (347,838) (302,664)
Total assets . . . . . . . . . . . . . . . . $37,162,594 $33,268,021 $29,202,650
Interest bearing deposits:Bank issued deposits:
Bank issued interest bearingactivity deposits . . . . . . . . . . . . $ 9,960,645 $ 77,621 0.78% $10,084,996 $ 75,221 0.75% $ 8,996,778 $ 109,483 1.22%
Bank issued time deposits . . . . . . 3,384,120 82,938 2.45 3,399,734 85,472 2.51 3,540,124 115,072 3.25
Total bank issued deposits . . . . . . 13,344,765 160,559 1.20 13,484,730 160,693 1.19 12,536,902 224,555 1.79Wholesale deposits . . . . . . . . . . . . 6,057,542 115,543 1.91 4,311,424 67,523 1.57 2,596,952 58,830 2.27
Total interest bearing deposits . . . . . . 19,402,307 276,102 1.42 17,796,154 228,216 1.28 15,133,854 283,385 1.87Short-term borrowings . . . . . . . . . . . . 2,908,168 61,256 2.11 3,138,752 81,070 2.58 4,188,339 150,310 3.59Long-term borrowings . . . . . . . . . . . . . 5,329,571 196,440 3.69 3,798,851 163,348 4.30 2,693,447 127,343 4.73
Total interest bearingliabilities . . . . . . . . . . . . . . . . 27,640,046 533,798 1.93% 24,733,757 472,634 1.91% 22,015,640 561,038 2.55%
Noninterest bearing deposits . . . . . . . . 4,585,628 4,189,724 3,509,133Other liabilities . . . . . . . . . . . . . . . . . . . 1,432,134 1,103,886 911,187Shareholders’ equity . . . . . . . . . . . . . . 3,504,786 3,240,654 2,766,690
Total liabilities andshareholders’ equity . . . . . . . $37,162,594 $33,268,021 $29,202,650
Net interest income . . . . . . . $1,164,237 $1,089,025 $1,038,459
Net yield on interest earningassets . . . . . . . . . . . . . . . . . 3.52% 3.65% 3.96%
Notes:
(1) Fully taxable equivalent basis, assuming a Federal income tax rate of 35% for all years presented, andexcluding disallowed interest expense.
(2) Loans and leases on nonaccrual status have been included in the computation of average balances.(3) Based on average balances excluding fair value adjustments for available for sale securities.
5 1

Analysis of Changes in Interest Income and Interest Expense
The effect on interest income and interest expense due to volume and rate changes in 2004 and 2003 areoutlined in the following table. Changes not due solely to either volume or rate are allocated to rate ($ inthousands):
2004 versus 2003 2003 versus 2002
Increase (Decrease)Due to Change in
Increase (Decrease)Due to Change in
AverageVolume (2)
AverageRate
Increase(Decrease)
AverageVolume (2)
AverageRate
Increase(Decrease)
Interest on earning assets:Loans and leases (1) . . . . . . . . . . . . . . . . . . . . $140,909 $(40,649) $100,260 $207,904 $(200,755) $ 7,149Investment securities:
Taxable . . . . . . . . . . . . . . . . . . . . . . . . . . 27,347 7,685 35,032 45,786 (78,748) (32,962)Tax-exempt (1) . . . . . . . . . . . . . . . . . . . . 1,751 (520) 1,231 (4,386) 1,041 (3,345)
Interest bearing deposits in other banks . . . . (4) 104 100 (421) (126) (547)Federal funds sold and security resale
agreements . . . . . . . . . . . . . . . . . . . . . . . . . . 345 117 462 (51) (177) (228)Trading securities (1) . . . . . . . . . . . . . . . . . . . (8) 23 15 172 (243) (71)Other short-term investments . . . . . . . . . . . . (920) 196 (724) (6,408) (1,426) (7,834)
Total interest income change . . . . . $168,741 $(32,365) $136,376 $220,200 $(258,038) $(37,838)Expense on interest bearing liabilities:Interest bearing deposits:
Bank issued deposits:Bank issued interest bearing activity
deposits . . . . . . . . . . . . . . . . . . . . . . . . $ (933) $ 3,333 $ 2,400 $ 13,276 $ (47,538) $(34,262)Bank issued time deposits . . . . . . . . . . . . (392) (2,142) (2,534) (4,563) (25,037) (29,600)Total bank issued deposits . . . . . . . . . . . (1,666) 1,532 (134) 16,966 (80,828) (63,862)Wholesale deposits . . . . . . . . . . . . . . . . . 27,414 20,606 48,020 38,919 (30,226) 8,693
Total interest bearing deposits . . . . . . . . . . . . 20,559 27,327 47,886 49,785 (104,954) (55,169)Short-term borrowings . . . . . . . . . . . . . . . . . . (5,949) (13,865) (19,814) (37,680) (31,560) (69,240)Long-term borrowings . . . . . . . . . . . . . . . . . . 65,821 (32,729) 33,092 52,286 (16,281) 36,005
Total interest expense change . . . . $ 55,510 $ 5,654 $ 61,164 $ 69,312 $(157,716) $(88,404)
5 2
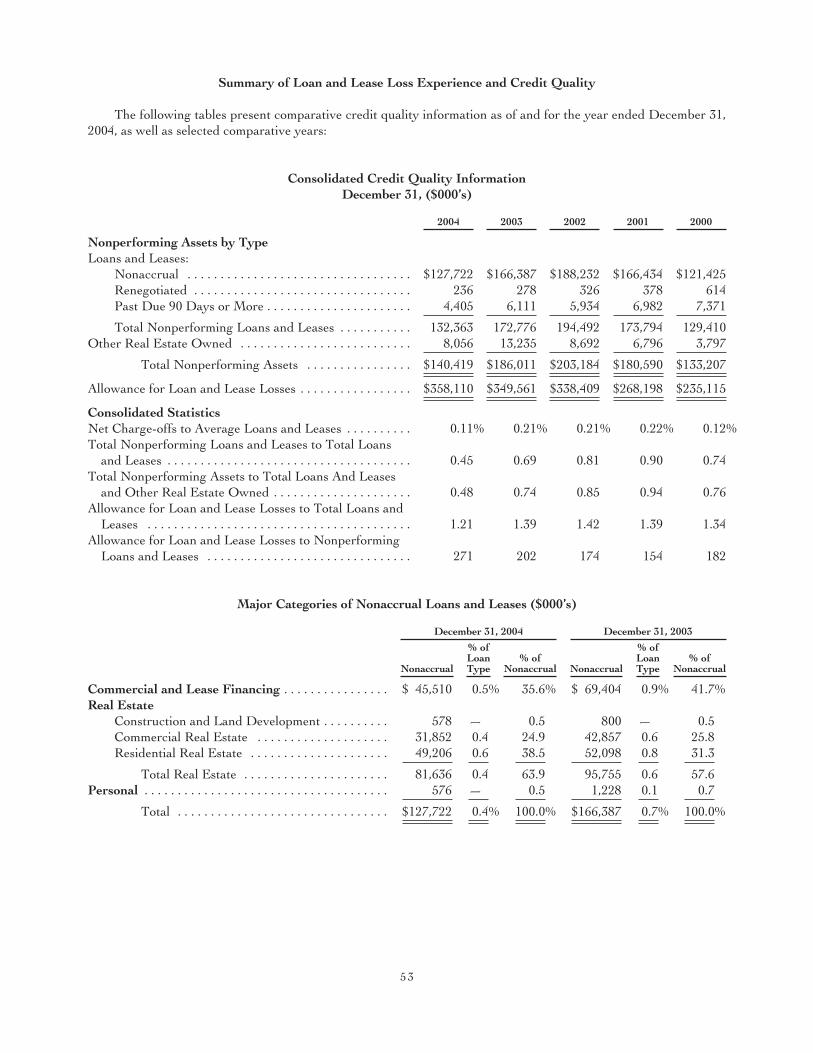
Summary of Loan and Lease Loss Experience and Credit Quality
The following tables present comparative credit quality information as of and for the year ended December 31,2004, as well as selected comparative years:
Consolidated Credit Quality InformationDecember 31, ($000’s)
2004 2003 2002 2001 2000
Nonperforming Assets by TypeLoans and Leases:
Nonaccrual . . . . . . . . . . . . . . . . . . . . . . . . . . . . . . . . . . $127,722 $166,387 $188,232 $166,434 $121,425Renegotiated . . . . . . . . . . . . . . . . . . . . . . . . . . . . . . . . . 236 278 326 378 614Past Due 90 Days or More . . . . . . . . . . . . . . . . . . . . . . 4,405 6,111 5,934 6,982 7,371
Total Nonperforming Loans and Leases . . . . . . . . . . . 132,363 172,776 194,492 173,794 129,410Other Real Estate Owned . . . . . . . . . . . . . . . . . . . . . . . . . . 8,056 13,235 8,692 6,796 3,797
Total Nonperforming Assets . . . . . . . . . . . . . . . . $140,419 $186,011 $203,184 $180,590 $133,207
Allowance for Loan and Lease Losses . . . . . . . . . . . . . . . . . $358,110 $349,561 $338,409 $268,198 $235,115
Consolidated StatisticsNet Charge-offs to Average Loans and Leases . . . . . . . . . . 0.11% 0.21% 0.21% 0.22% 0.12%Total Nonperforming Loans and Leases to Total Loans
and Leases . . . . . . . . . . . . . . . . . . . . . . . . . . . . . . . . . . . . . 0.45 0.69 0.81 0.90 0.74Total Nonperforming Assets to Total Loans And Leases
and Other Real Estate Owned . . . . . . . . . . . . . . . . . . . . . 0.48 0.74 0.85 0.94 0.76Allowance for Loan and Lease Losses to Total Loans and
Leases . . . . . . . . . . . . . . . . . . . . . . . . . . . . . . . . . . . . . . . . 1.21 1.39 1.42 1.39 1.34Allowance for Loan and Lease Losses to Nonperforming
Loans and Leases . . . . . . . . . . . . . . . . . . . . . . . . . . . . . . . 271 202 174 154 182
Major Categories of Nonaccrual Loans and Leases ($000’s)
December 31, 2004 December 31, 2003
Nonaccrual
% ofLoanType
% ofNonaccrual Nonaccrual
% ofLoanType
% ofNonaccrual
Commercial and Lease Financing . . . . . . . . . . . . . . . . $ 45,510 0.5% 35.6% $ 69,404 0.9% 41.7%Real Estate
Construction and Land Development . . . . . . . . . . 578 — 0.5 800 — 0.5Commercial Real Estate . . . . . . . . . . . . . . . . . . . . 31,852 0.4 24.9 42,857 0.6 25.8Residential Real Estate . . . . . . . . . . . . . . . . . . . . . 49,206 0.6 38.5 52,098 0.8 31.3
Total Real Estate . . . . . . . . . . . . . . . . . . . . . . 81,636 0.4 63.9 95,755 0.6 57.6Personal . . . . . . . . . . . . . . . . . . . . . . . . . . . . . . . . . . . . . 576 — 0.5 1,228 0.1 0.7
Total . . . . . . . . . . . . . . . . . . . . . . . . . . . . . . . . $127,722 0.4% 100.0% $166,387 0.7% 100.0%
5 3

Allocation of the Allowance for Loan and Lease Losses ($000’s)December 31, 2004 December 31, 2003 December 31, 2002
Amount
Percent ofLoans andLeases to
Total Loansand Leases Amount
Percent ofLoans andLeases to
Total Loansand Leases Amount
Percent ofLoans andLeases to
Total Loansand Leases
Balance at end of period applicable to:Commercial Financial & Agricultural . . . . . $244,042 28.7% $237,510 28.2% $234,980 28.7%Real Estate
Residential Mortgage . . . . . . . . . . . . . . . . 12,311 32.6 28,369 29.9 35,518 28.9Commercial Mortgage . . . . . . . . . . . . . . . 49,965 31.7 37,013 32.7 22,141 31.3
Personal . . . . . . . . . . . . . . . . . . . . . . . . . . . . . 14,252 5.2 18,213 6.9 18,394 7.8Lease Financing . . . . . . . . . . . . . . . . . . . . . . 37,540 1.8 28,456 2.3 27,376 3.3
Total . . . . . . . . . . . . . . . . . . . . . . . . . . . . . . $358,110 100.0% $349,561 100.0% $338,409 100.0%
December 31, 2001 December 31, 2000
Amount
Percent ofLoans andLeases to
Total Loansand Leases Amount
Percent ofLoans andLeases to
Total Loansand Leases
Balance at end of period applicable to:Commercial Financial & Agricultural . . . . . . . . . . . . . . . . . . . . . . . . . $190,542 29.7% $120,712 30.1%Real Estate
Residential Mortgage . . . . . . . . . . . . . . . . . . . . . . . . . . . . . . . . . . . . 26,916 29.5 22,732 29.4Commercial Mortgage . . . . . . . . . . . . . . . . . . . . . . . . . . . . . . . . . . . 14,336 29.5 69,592 27.6
Personal . . . . . . . . . . . . . . . . . . . . . . . . . . . . . . . . . . . . . . . . . . . . . . . . . 21,468 6.3 12,911 6.7Lease Financing . . . . . . . . . . . . . . . . . . . . . . . . . . . . . . . . . . . . . . . . . . 14,936 5.0 9,168 6.2
Total . . . . . . . . . . . . . . . . . . . . . . . . . . . . . . . . . . . . . . . . . . . . . . . . . . $268,198 100.0% $235,115 100.0%
Reconciliation of Consolidated Allowance for Loan and Lease Losses ($000’s)2004 2003 2002 2001 2000
Allowance for Loan and Lease Losses at Beginning ofYear . . . . . . . . . . . . . . . . . . . . . . . . . . . . . . . . . . . . . . . . . . $349,561 $338,409 $268,198 $235,115 $225,862
Provision for Loan and Lease Losses . . . . . . . . . . . . . . . . . 37,963 62,993 74,416 54,115 30,352Allowance of Banks and Loans Acquired . . . . . . . . . . . . . . 27 — 39,813 19,151 1,270Allowance Transfer for Loan Securitizations . . . . . . . . . . . — — — — (1,022)Loans and Leases Charged-off:
Commercial . . . . . . . . . . . . . . . . . . . . . . . . . . . . . . . . . . 16,775 17,689 23,003 22,773 10,623Real Estate—Construction . . . . . . . . . . . . . . . . . . . . . . 33 57 94 186 4Real Estate—Mortgage . . . . . . . . . . . . . . . . . . . . . . . . 13,259 15,192 10,681 11,795 9,848Personal . . . . . . . . . . . . . . . . . . . . . . . . . . . . . . . . . . . . . 12,821 12,100 12,265 10,965 8,216Leases . . . . . . . . . . . . . . . . . . . . . . . . . . . . . . . . . . . . . . 7,967 24,625 9,246 2,890 1,327
Total Charge-offs . . . . . . . . . . . . . . . . . . . . . . . . . . . . . . . . . 50,855 69,663 55,289 48,609 30,018Recoveries on Loans and Leases:
Commercial . . . . . . . . . . . . . . . . . . . . . . . . . . . . . . . . . . 12,631 8,736 3,819 4,135 4,696Real Estate—Construction . . . . . . . . . . . . . . . . . . . . . . 2 88 96 43 57Real Estate—Mortgage . . . . . . . . . . . . . . . . . . . . . . . . 3,887 4,278 2,462 1,419 1,458Personal . . . . . . . . . . . . . . . . . . . . . . . . . . . . . . . . . . . . . 3,327 3,058 3,053 2,567 2,199Leases . . . . . . . . . . . . . . . . . . . . . . . . . . . . . . . . . . . . . . 1,567 1,662 1,841 262 261
Total Recoveries . . . . . . . . . . . . . . . . . . . . . . . . . . . . . . . . . . 21,414 17,822 11,271 8,426 8,671
Net Loans and Leases Charged-off . . . . . . . . . . . . . . . . . . . 29,441 51,841 44,018 40,183 21,347
Allowance for Loan and Lease Losses at End of Year . . . . $358,110 $349,561 $338,409 $268,198 $235,115
5 4
Nonperforming assets consist of nonperforming loans and leases and other real estate owned (“OREO”). Theamount of nonperforming assets is affected by acquisitions accounted for under the purchase method of accounting.The assets and liabilities, including the nonperforming assets, of the acquired entity are included in theCorporation’s consolidated balance sheets from the date the business combination is completed, which impactsperiod-to-period comparisons.
OREO is principally comprised of commercial and residential properties acquired in partial or totalsatisfaction of problem loans and amounted to $8.1 million, $13.2 million and $8.7 million at December 31, 2004,2003 and 2002, respectively.
Nonperforming loans and leases consist of nonaccrual, renegotiated or restructured loans, and loans and leasesthat are delinquent 90 days or more and still accruing interest. The balance of nonperforming loans and leases areaffected by acquisitions and may be subject to fluctuation based on the timing of cash collections, renegotiations andrenewals.
Generally, loans that are 90 days or more past due as to interest or principal are placed on nonaccrual.Exceptions to these rules are generally only for loans fully collateralized by readily marketable securities or otherrelatively risk free collateral. In addition, a loan may be placed on nonaccrual when management makes adetermination that the facts and circumstances warrant such classification irrespective of the current paymentstatus.
Maintaining nonperforming assets at an acceptable level is important to the ongoing success of a financialservices institution. The Corporation’s comprehensive credit review and approval process is critical to ensuring thatthe amount of nonperforming assets on a long-term basis is minimized within the overall framework of acceptablelevels of credit risk. In addition to the negative impact on net interest income and credit losses, nonperformingassets also increase operating costs due to the expense associated with collection efforts.
At December 31, 2004, nonperforming loans and leases amounted to $132.4 million or 0.45% of consolidatedloans and leases compared to $172.8 million or 0.69% at December 31, 2003 and $194.5 million or 0.81% atDecember 31, 2002. Nonperforming loans and leases have declined in each of the past seven consecutive quarters.Nonaccrual loans and leases decreased $38.7 million or 23.2% at year-end 2004 compared to year-end 2003. Thenet decrease was primarily due to reductions and positive resolutions in several portfolio segments and across allloan types.
Delinquency can be an indicator of potential problem loans. At December 31, 2004, loans past due 60-89 daysand still accruing interest amounted to $19.4 million or 0.07% of total loans and leases outstanding compared to$41.9 million or 0.17% of total loans and leases outstanding at December 31, 2003.
In addition to its nonperforming loans and leases, the Corporation has loans and leases for which payments arepresently current; however, management believes such loans could possibly be classified as nonperforming in thenear future. These loans are subject to constant management attention and their classification is reviewed on anongoing basis. At December 31, 2004, such loans amounted to $72.4 million compared to $72.8 million at December31, 2003.
Net charge-offs amounted to $29.4 million or 0.11% of average loans and leases in 2004 compared with $51.8million or 0.21% of average loans and leases in 2003 and $44.0 million or 0.21% of average loans and leases in 2002.Included in net charge-offs for 2003 was a $19.0 million charge-off related to the carrying value of lease obligationsfor airplanes leased to Midwest Airlines, Inc.
In general the Corporation’s borrowing customers appear to have successfully managed their businessesthrough the slower economic conditions. There are signs of improvement in the economy and the Corporation’scustomer base is beginning to see some signs of increased business activity. The Corporation continues to believethat the long-term impact of the previous recession may still provide some unanticipated losses in the loan and leaseportfolio. During the past three-year period, net charge-offs have remained in a narrow range of approximately 20basis points which is somewhat higher than historical levels. Net charge-offs in 2004 were better than managementhad expected and to some extent reflect a higher than normal level of recoveries. It is uncertain whether the higherthan normal level of recoveries will continue.
5 5

Negative economic events, an adverse development in industry segments within the portfolio or deteriorationof a large loan or loans could have significant adverse impacts on the actual loss levels.
Consistent with the improvement in credit quality trends noted above, the provision for loan and lease lossesamounted to $38.0 million in 2004. By comparison, the provision for loan and lease losses amounted to $63.0 millionand $74.4 million in 2003 and 2002, respectively. The provisions for loan and lease losses are the amounts requiredto establish the allowance for loan and lease losses at the required level after considering charge-offs and recoveries.
Other Income
Total other income amounted to $1,446.5 million in 2004 compared to $1,215.8 million in 2003, an increase of$230.7 million or 19.0%. The growth in other income was driven by data processing services and trust servicesrevenues and an increase in investment securities gains recognized primarily by the Corporation’s Capital MarketsGroup. Fee income growth in 2004 was offset by a decline in mortgage banking income. Mortgage banking incomewas very robust in 2003 due in part to the increased refinancing activity in the low interest rate environment.
Total data processing services revenue amounted to $891.0 million in 2004 compared to $657.8 million in 2003,an increase of $233.2 million or 35.5%. This strong annual revenue growth reflects the effect of Metavante’s sixacquisitions completed in 2004, a full year of revenue from the acquisition completed in November of 2003 andorganic revenue growth. Approximately $178.9 million of the increase in revenues in 2004 compared to 2003 wasdue to the acquisitions completed in 2004 and a full year of revenue from the acquisition completed in November of2003. Metavante had a very strong year in 2004 in terms of core outsourcing contract renewals and cross-saleresults. Total buyout revenue, which varies from period to period, amounted to $7.9 million in 2004 compared to$6.9 million in 2003.
Metavante expects 2005 organic revenue growth to be in the mid-single digits, which is slightly lower than thatexperienced in 2004. Total revenues (internal and external) are expected to range from $1.1 billion to $1.2 billion in2005. While the contract renewals completed in 2004 resulted in a longer average contract life and increased cross-sale opportunities, some contracts were re-priced due to the highly aggressive core-processing marketplace in whichpricing generally declined from existing run-rates. In addition, as previously discussed, in any given year there issome customer attrition due to banking consolidations. Metavante also expects that due to the focus of some of theacquired companies on software sales and the retail marketplace, revenue will become more cyclical and seasonal innature especially in the fourth quarter in future periods.
Fees from trust services were $150.9 million in 2004 compared to $126.8 million in 2003, an increase of $24.1million or 19.1%. Revenue associated with the segments of the employee benefit plan business purchased from anational banking association located in Missouri contributed approximately $10.0 million to the revenue growth in2004 compared to 2003. Assets under management were $18.3 billion at December 31, 2004 compared to $15.7billion at December 31, 2003, an increase of $2.6 billion or 16.5%. Assets under administration increased by $9.0billion or 13.4% and amounted to $75.9 billion at December 31, 2004. Sales activity, emphasizing cross-selling,integrated delivery and account retention and positive equity performance were the primary contributors to revenuegrowth in 2004.
Total mortgage banking revenue was $35.1 million in 2004 compared with $70.3 million in 2003, a decrease of$35.2 million. The decline in gains from the sale of mortgage loans was the primary contributor to the lowermortgage banking revenue. During 2004, the Corporation sold $1.6 billion of loans to the secondary market.Retained interests in the form of mortgage servicing rights amounted to $1.4 million. Approximately $0.3 billion ofthe loans sold and $6.2 million of the gain on sale of mortgage loans recognized in 2004 was attributable to theAmerUs acquisition. During 2003, the Corporation sold $3.5 billion of loans to the secondary market. Retainedinterests in the form of mortgage servicing rights amounted to $2.1 million. As previously discussed, residential realestate loan closings in 2004 were $1.3 billion or 23.6% lower than residential real estate loan closings in 2003. Theincrease in residential real estate loan closings and residential real estate loans sold to the secondary market in 2003and 2002 was due to the significant increase in refinancing activity due to the low interest rate environment.Management expects the quarterly volume of mortgage production in 2005 to be about the same as thatexperienced in the third and fourth quarters of 2004.
5 6
Net investment securities gains amounted to $35.4 million in 2004 compared to $21.6 million in 2003. During2004, net gains associated with the Corporation’s Capital Markets Group investments amounted to $34.6 million.As announced in the Corporation’s Form 8-K filed on November 12, 2004, approximately $34.1 million of the netgain in 2004 was from a net unrealized gain recognized in the fourth quarter of 2004 due to the net increase inmarket value of certain fund investments. During 2003, gains recognized by the Corporation’s Capital MarketsGroup amounted to $20.0 million. Approximately $16.2 million of the gain was from the sale of an investment in thethird quarter of 2003. During 2003, the Corporation’s banking segment sold $48.0 million of available for saleinvestment securities and recognized a gain of approximately $4.2 million. Impairment losses associated withretained interests held in the form of interest-only strips associated with its auto securitization activities amountedto $4.1 million in 2003.
Other noninterest income amounted to $164.0 million in 2004 compared to $163.5 million in 2003. Loan fees,which include prepayment charges, and other commissions and fees increased $12.8 million. Losses from the saleand securitization of auto loans including write-downs of auto loans held for sale amounted to $3.0 million in 2004compared to gains from the sale and securitization of auto loans of $2.7 million in 2003. The losses incurred in 2004were primarily due to lower interest rate spreads associated with new auto loan production in a rising interest rateenvironment. Auto loans securitized and sold amounted to $0.5 billion in 2004 compared to $0.8 billion in 2003.During 2003, the Corporation sold six branches and recognized $5.0 million in gains.
Total other income amounted to $1,215.8 million in 2003 compared to $1,082.7 million in 2002, an increase of$133.1 million or 12.3%. All sources of other income increased in 2003 compared to 2002. The growth reflected afull year’s results from the 2002 acquisitions, growth in data processing services and trust services revenues,increases in loan prepayment fees and mortgage banking income due to the low interest rate environment andinvestment securities gains realized primarily by the Corporation’s Capital Markets Group.
Total data processing services revenue amounted to $657.8 million in 2003 compared to $601.5 million in 2002,an increase of $56.3 million or 9.4%. Approximately $12.2 million of the increase was due to acquisitions. Theremaining increase was attributable to revenue growth from several significant customer conversions to the corefinancial account processing systems during the second half of 2003. Electronic funds revenue growth was alsoderived from these conversions along with volume growth from the existing customers and other new customers.Additional revenue growth resulted from increased consumer payment volume from new large financial institutioncustomers and increased adoption of electronic bill presentment and payment in the existing customer base. Totalbuyout revenue, which varies from period to period, amounted to $6.9 million in 2003 compared to $11.9 million in2002.
Item processing revenue increased $3.7 million or 9.6% in 2003 compared to 2002. The revenue increase wasdue to increased volumes of payment services from existing customers and new customers.
Fees from trust services were $126.8 million in 2003 compared to $120.6 million in 2002, an increase of $6.2million or 5.1%. Revenue growth in 2003 compared to 2002 was driven by commercial trust, which increased 7.5%,and to a lesser extent increased fees from outsourcing services and securities lending. Assets under managementwere $15.7 billion at December 31, 2003 compared to $12.9 billion at December 31, 2002, an increase of $2.8 billionor 22.0%. Money transferred in from the acquisition and other commercial customers as well as marketappreciation contributed to the increase in assets under management. Sales activity and account retention waspositive in 2003. Positive equity performance resulted in some shift of funds into equities which representedapproximately 35% of assets under management at December 31, 2003.
Total mortgage banking revenue was $70.3 million in 2003 compared with $55.2 million in 2002, an increase of$15.1 million. Gains from sales of mortgages to the secondary market and mortgage related fees accounted for theincrease. During 2003, the Corporation sold $3.5 billion of loans to the secondary market. Retained interests in theform of mortgage servicing rights amounted to $2.1 million. During 2002, the Corporation sold $3.1 billion of loansto the secondary market. Retained interests in the form of mortgage servicing rights amounted to $3.2 million.
Net investment securities gains amounted to $21.6 million in 2003 compared to net investment securities lossesof $6.3 million in 2002. During 2003, gains recognized by the Corporation’s Capital Markets Group amounted to
5 7
$20.0 million. Approximately $16.2 million of the gain was from the sale of an investment in the third quarter of2003. Net losses associated with investments held by the Corporation’s Capital Markets Group amounted to $4.7million in 2002. During 2003, the Corporation’s banking segment sold $48.0 million of available for sale investmentsecurities and recognized a gain of approximately $4.2 million. Impairment losses associated with retained interestsheld in the form of interest-only strips associated with its auto securitization activities amounted to $4.1 million and$1.5 million in 2003 and 2002, respectively.
Other noninterest income amounted to $163.5 million in 2003 compared to $142.0 million in 2002, an increaseof $21.5 million or 15.2%. Approximately $2.5 million of the increase was attributable to the 2002 bankingacquisitions. Loan fees, which include prepayment charges, and other commissions and fees, excluding the 2002banking acquisitions, increased $20.3 million. Auto securitization income decreased $2.6 million in 2003 comparedto 2002. The decline was primarily due to lower gains from the sale of auto loans which was offset by increasedservicing income. Auto loans securitized in 2003 amounted to $0.8 billion compared to $0.6 billion in 2002. During2003, the Corporation sold six branches and recognized $5.0 million in gains. Gains from the sale of other realestate increased $2.8 million in 2003 compared to 2002. The increase was primarily due to the sale of one largeproperty in the first quarter of 2003. Trading income in 2003, excluding the 2002 banking acquisitions, decreased$5.3 million compared to the prior year and was primarily due to lower income from fair value adjustments on freestanding derivative instruments associated with auto loans sold to the multi-seller revolving conduit. Beginning inthe second half of 2002 and throughout 2003, the Corporation had employed freestanding interest rate futures toeconomically hedge the market value volatility from the auto-related derivative instrument due to changes ininterest rates.
Other Expense
Total other expense amounted to $1,595.6 million in 2004 compared to $1,451.7 million in 2003, an increase of$143.9 million or 9.9%.
The acquisitions by both Metavante and the banking segment had an impact on the year-to-year comparabilityof operating expenses in 2004 compared to 2003. Approximately $148.9 million of the 2004 versus 2003 operatingexpense growth was attributable to the acquisitions. As all acquisitions were accounted for using the purchasemethod of accounting, the operating expenses of the acquired entities are included in the consolidated operatingexpenses from the dates the acquisitions were completed. Operating expenses associated with acquisitionscompleted in 2003 are reflected for the full year in 2004 as opposed to a partial year in 2003. Acquisitions completedin 2004 directly affect the current year but have no impact on the prior year.
Certain transactions as previously described herein under “Significant Transactions” also affected the year-to-year comparability of operating expenses in 2004 compared to 2003. For the years ended December 31, 2004 and2003, those transactions increased other expense by $20.8 million and $82.2 million, respectively.
The Corporation estimates that its expense growth in 2004 compared to 2003, excluding the effect of theacquisitions and the impact of the significant transactions previously discussed, was approximately $56.3 million or4.1%.
Expense control is sometimes measured in the financial services industry by the efficiency ratio statistic. Theefficiency ratio is calculated by dividing total other expense by the sum of total other income (including CapitalMarkets Group related investment gains but excluding other securities gains and losses) and net interest income ona fully taxable equivalent basis. The Corporation’s efficiency ratios for the years ended December 31, 2004, 2003,and 2002 were:
Efficiency Ratios 2004 2003 2002
Consolidated Corporation . . . . . . . . . . . . . . . . . . . . . . . . . . . . . . . . . . . . . . . . . . . . . . . . . . . . . . 61.1% 63.0% 61.0%Consolidated Corporation Excluding Metavante . . . . . . . . . . . . . . . . . . . . . . . . . . . . . . . . . . . . 48.4 52.4 50.1
5 8

Salaries and employee benefits expense amounted to $887.3 million in 2004 compared to $797.5 million in2003, an increase of $89.8 million or 11.3%. Salaries and benefits expense related to the Metavante and bankingacquisitions contributed approximately $65.1 million to the expense growth in 2004 compared to 2003. The impactof the Paytrust transition costs to salaries and employee benefits expense amounted to $2.7 million in 2003. In 2003,the Corporation restructured certain split dollar life insurance benefits due to a change in tax laws. Of the total netcharge from this restructuring, $8.4 million was recorded in salaries and benefits. Also included in salaries andemployee benefits expense in 2003 is a reversal of $2.4 million of accrued severance associated with the decision tokeep a facility operational that previously had been identified for closure.
Net occupancy and equipment expense amounted to $192.9 million in 2004 compared to $179.0 million in2003, an increase of $13.9 million. Net occupancy and equipment expense related to the Metavante and bankingacquisitions contributed approximately $13.8 million to the expense growth in 2004 compared to 2003. The impactof the Paytrust transition costs to net occupancy and equipment expense amounted to $0.8 million in 2003. During2003, $6.1 million of accrued lease termination costs were reversed as a result of the decision to keep a facilityoperational as previously discussed.
Software expenses amounted to $50.0 million in 2004 compared to $44.7 million in 2003, an increase of $5.3million or 11.8%. Software expense related to the Metavante and banking acquisitions contributed approximately$2.2 million to the expense growth in 2004 compared to 2003. Excluding the expense growth due to acquisitions,Metavante and the banking segment contributed $1.7 million and $0.9 million, respectively to the growth insoftware expenses in 2004 compared to 2003.
Processing charges amounted to $52.2 million in 2004 compared to $48.3 million in 2003, an increase of $3.9million or 8.2%. Processing charges related to the Metavante and banking acquisitions contributed approximately$5.5 million to the expense growth in 2004 compared to 2003. Third-party processing charges associated withwholesale loan activity were lower in 2004 compared to 2003.
Supplies and printing expense, professional services expense and shipping and handling expense amounted to$135.1 million in 2004 compared to $118.3 million in 2003, an increase of $16.8 million or 14.2%. The Metavanteand banking acquisitions net of Paytrust integration expenses contributed approximately $13.7 million to theexpense growth in 2004 compared to 2003. The remainder of the increase was primarily due to Metavante’sincrease in these expenses that was offset by the decrease in costs associated with the lower volume of mortgageloan production in 2004 compared to 2003.
Amortization of intangibles amounted to $27.9 million in 2004 compared to $23.8 million in 2003. Amortizationand valuation reserves associated with mortgage servicing rights declined $0.7 million. At December 31, 2004, thecarrying value of mortgage servicing rights amounted to $3.5 million. Amortization associated with the 2004acquisitions amounted to $7.6 million in the current year. Goodwill is subject to periodic tests for impairment. TheCorporation has elected to perform its annual test for impairment during the second quarter. Accordingly, theCorporation updated the analysis to June 30, 2004 and concluded that there continues to be no impairment withrespect to goodwill at any reporting unit. At December 31, 2004, none of the Corporation’s other intangible assetswere determined to have indefinite lives. For the year ended December 31, 2004, $2.0 million of goodwill and $8.5million of customer intangibles were included by Metavante in the determination of the loss associated with the saleof the small business 401k Retirement Plan Services operations and the direct customer base of Paytrust.com.
Other noninterest expenses amounted to $250.2 million in 2004 compared to $240.1 million in the prior year,an increase of $10.1 million. The Metavante and banking acquisitions net of Paytrust integration expensescontributed approximately $38.7 million to the expense growth in 2004 compared to 2003. As previously discussed,during 2004 and 2003 the Corporation prepaid and retired certain higher cost long-term debt and terminated somerelated receive floating / pay fixed interest rate swaps designated as cash flow hedges. The total debt retired in 2004amounted to $355.0 million and the charge to earnings amounted to $6.9 million. The total debt retired in 2003amounted to $744.6 million and the charge to earnings amounted to $56.7 million. During 2004, Metavante sold itssmall business 401k Retirement Plan Services operations and also sold the direct customer base of Paytrust.com in2004. These transactions resulted in an aggregate loss of approximately $7.1 million. Offsetting the net unrealizedsecurities gain recognized in the fourth quarter of 2004 as previously discussed was charitable foundation expenseover and above normal levels that amounted to approximately $5.0 million.
5 9
Other expense is affected by the capitalization of costs, net of amortization, associated with softwaredevelopment and data processing conversions. A lower amount of capitalized software development costs andcapitalized conversion costs net of their respective amortization, write-offs of software and the amortizationassociated with the software obtained in the acquisitions resulted in an increase in other noninterest expense andaccounted for approximately $8.8 million of the total increase in other operating expense in 2004 compared to 2003.During 2004 and 2003, Metavante determined that certain purchased and internally developed software will nolonger be used or was impaired and such software was written off. Capitalized software costs written off as a resultof these decisions, amounted to $8.7 million in 2004 and $22.8 million in 2003 and are included in other noninterestexpense for the respective periods.
Total other expense amounted to $1,451.7 million in 2003, an increase of $155.7 million or 12.0% from$1,296.0 million in 2002.
For the years ended December 31, 2003 and 2002, Metavante incurred integration costs associated with theJuly 29, 2002 acquisition of Paytrust. Such costs were the result of operating duplicate platforms, which includedduplicate facilities, personnel and processing costs, and continued through the first quarter of 2003. Totalintegration costs included in other expense amounted to $7.1 million in 2002 and $2.5 million in 2003.
The acquisitions by both the banking segment and Metavante had an impact on the year-to-year comparabilityof operating expenses in 2003 compared to 2002. Approximately $26.6 million or 17.1% of the 2003 versus 2002operating expense growth was attributable to the acquisitions. As all acquisitions were accounted for using thepurchase method of accounting, the operating expenses of the acquired entities are included in the consolidatedoperating expenses from the dates the acquisitions were completed. Operating expenses associated with acquisitionscompleted in 2002 are reflected for the full year in 2003 as opposed to a partial year in 2002. Acquisitions completedin 2003 directly affect the current year but have no impact on the prior year.
Salaries and employee benefits expense amounted to $797.5 million in 2003 compared to $745.5 million in2002. The impact of the Paytrust transition costs to salaries and employee benefits expense amounted to $2.7 millionin 2003 and $4.1 million in 2002. Salaries and benefits related to the banking and Metavante acquisitionscontributed approximately $10.8 million to the expense growth. In 2003, the Corporation restructured certain splitdollar life insurance benefits due to a change in tax laws. Of the total net charge from this restructuring, $8.4million was recorded in salaries and benefits. Variable incentive compensation and commissions increasedapproximately $27.2 million or 40.1% in 2003 compared to 2002.
Net occupancy and equipment expense amounted to $179.0 million in 2003 compared to $191.5 million in2002. The impact of the Paytrust transition costs to net occupancy and equipment expense amounted to $0.8 millionin 2003 and $2.2 million in 2002. During 2003, Metavante reversed $6.1 million of accrued lease termination costsas a result of a decision to keep a facility operational that previously had been identified for closure.
Processing charges amounted to $48.3 million in 2003 compared to $39.3 million in 2002, an increase of $9.0million or 22.8%. Processing charges related to the banking and Metavante acquisitions contributed approximately$1.1 million to the expense growth. Third-party charges associated with the item processing business and wholesaleloan activity accounted for $6.2 million of the year over year increase.
Supplies and printing expense, professional services expense and shipping and handling expense amounted to$118.3 million in 2003 compared to $104.3 million in 2002, an increase of $14.0 million or 13.5%. The acquisitionscontributed approximately $0.8 million to the growth in these expenses. The remainder of the increase wasprimarily due to the additional costs associated with the increased volume of mortgage loan production in 2003 andMetavante’s increase in these expenses.
Amortization of intangibles amounted to $23.8 million in 2003 compared to $25.1 million in 2002. Acceleratedamortization and valuation reserves associated with mortgage servicing rights declined $2.4 million. At December31, 2003, the carrying value of mortgage servicing rights amounted to $5.1 million. Goodwill is subject to periodictests for impairment. The Corporation has elected to perform its annual test for impairment during the secondquarter. Accordingly, the Corporation updated the analysis to June 30, 2003 and concluded that there continues tobe no impairment with respect to goodwill at any reporting unit. At December 31, 2003, none of the Corporation’sother intangible assets were determined to have indefinite lives.
6 0
Other noninterest expenses amounted to $240.1 million in 2003 compared to $146.1 million in the prior year,an increase of $94.0 million. Acquisitions contributed approximately $5.9 million to the growth in other expense. Aspreviously discussed, during 2003 the Corporation prepaid and retired certain higher cost long-term debt andterminated some related receive floating / pay fixed interest rate swaps designated as cash flow hedges. The totaldebt retired amounted to $744.6 million and the charge to earnings amounted to $56.7 million. Increases in the costsof business related insurance coverage, increased costs associated with Metavante’s card solutions and equipmentsales and increased costs associated with mortgage loan production added approximately $15.9 million to theexpense growth in 2003 compared to 2002. During 2003, an insurance related credit associated with restructuringcertain split dollar life insurance policies due to a change in tax laws amounted to $2.1 million. In 2002, theCorporation’s commercial leasing subsidiary recorded a residual impairment loss of $6.8 million that is included inother expense. Litigation, environmental clean-up and other losses recorded in 2002 offset the comparable year overyear expense growth.
Other expense is affected by the capitalization of costs, net of amortization, associated with softwaredevelopment and data processing conversions. A lower amount of capitalized software development costs andcapitalized conversion costs net of their respective amortization and software write-offs resulted in an increase inother noninterest expense and accounted for approximately $9.3 million of the total increase in other operatingexpense in 2003 compared to 2002. As a result of a change in product strategies, Metavante determined that certainpurchased and internally developed software will no longer be used and such software was written off in 2003.Total capitalized software costs written off as a result of these decisions, amounted to $22.8 million and is includedin other noninterest expense in 2003.
Income Tax Provision
The provision for income taxes was $317.9 million in 2004, $214.3 million in 2003, and $238.3 million in 2002.The effective tax rate in 2004 was 33.6% compared to 28.3% in 2003 and 33.2% in 2002.
In the normal course of business, the Corporation and its affiliates are routinely subject to examinations fromFederal and state tax authorities. During 2003, several income tax audits covering multiple tax jurisdictions wereresolved which positively affected the banking segment by approximately $28.6 million and Metavante by $10.7million and resulted in a lower provision for income taxes in the Consolidated Statements of Income for the yearended December 31, 2003. Excluding the impact of the income tax audits, the pro forma effective income tax ratefor year ended December 31, 2003 would have been 33.4%.
Liquidity and Capital Resources
Shareholders’ equity was $3.89 billion or 9.6% of total consolidated assets at December 31, 2004, compared to$3.33 billion or 9.7% of total consolidated assets at December 31, 2003. The increase at December 31, 2004 wasprimarily due to earnings net of dividends paid.
During the third quarter of 2004, the Corporation and M&I Capital Trust B issued 16,000,000 units ofCommon SPACESSM that resulted in net proceeds to the Corporation of approximately $389.2 million. Each unithas a stated value of $25.00 for an aggregate value of $400.0 million. Each Common SPACES consists of (i) a stockpurchase contract under which the investor agrees to purchase for $25, a fraction of a share of the Corporation’scommon stock on the stock purchase date and (ii) a 1/40, or 2.5%, undivided beneficial interest in a preferredsecurity of M&I Capital Trust B, also referred to as the STACKSSM, with each share having an initial liquidationamount of $1,000. The stock purchase date is expected to be August 15, 2007, but could be deferred for quarterlyperiods until August 15, 2008.
On the stock purchase date, the number of shares of common stock the Corporation will issue upon settlementof the stock purchase contracts depends on the applicable market value per share of the Corporation’s commonstock, which will be determined just prior to the stock purchase date, and other factors. The Corporation currentlyestimates that it will issue approximately 8.7 million to 10.9 million common shares to settle shares issuable
6 1

pursuant to the stock purchase contracts. Before issuance of the common shares upon settlement of the stockpurchase contracts, the stock purchase contracts will be reflected in diluted earnings per share calculations usingthe treasury stock method. Under the treasury stock method, the Corporation expects there will be some dilutiveeffect on earnings per share for periods when the average market price of the Corporation’s common stock for thereporting period is above $46.28 and that there could be some dilutive effect on earnings per share for periods whenthe average market price of the Corporation’s common stock for the reporting period is above the average marketprice of the Corporation’s common stock for the twenty trading days ending on the third trading day immediatelypreceding the end of the reporting period. There was no dilutive effect on earnings per share in any interim periodor for the year ended December 31, 2004.
The Common SPACES qualify as “Tier 1” capital for regulatory capital purposes.
Holders of the STACKS are entitled to receive quarterly cumulative cash distributions through the stockpurchase date fixed initially at an annual rate of 3.90% of the liquidation amount of $1,000 per STACKS. Inaddition, the Corporation will make quarterly contract payments under the stock purchase contract at the annualrate of 2.60% of the stated amount of $25 per stock purchase contract. The Corporation recognized the presentvalue of the quarterly contract payments under the stock purchase contract as a liability with an offsetting reductionin shareholders’ equity. That liability along with the allocated portion of the fees and expenses incurred for theoffering of Common SPACES resulted in a reduction in shareholders’ equity of $34.0 million.
During 2004, the Corporation issued 3.6 million shares of its common stock in a public offering that resulted innet proceeds to the Corporation of approximately $149.9 million.
The proceeds from these issuances together with proceeds from the issuance of $600 million of senior noteswere used for general corporate purposes, including maintaining capital at desired levels and providing long-termfinancing for the acquisitions completed by Metavante in 2004.
At December 31, 2004, the net gain in accumulated other comprehensive income amounted to $23.3 millionwhich represents a positive change in accumulated other comprehensive income of $20.6 million since December31, 2003. Net accumulated other comprehensive income associated with available for sale investment securities wasa net gain of $31.1 million at December 31, 2004, compared to a net gain of $41.8 million at December 31, 2003,resulting in a net loss of $10.7 million over the twelve month period. The unrealized loss associated with the changein fair value of the Corporation’s derivative financial instruments designated as cash flow hedges declined $31.3million since December 31, 2003, resulting in the net increase in shareholders’ equity. The change in fair value ofthe Corporation’s derivative financial instruments designated as cash flow hedges since December 31, 2003 reflectsin part the termination of certain interest rate swaps associated with the debt retirement in 2004.
The Corporation has a Stock Repurchase Program under which up to 12 million shares can be repurchasedannually. During 2004, 2.3 million common shares were acquired at an aggregate cost of $88.5 million or an averageprice of $38.98 per common share. During 2003 and 2002, the Corporation repurchased 6.0 million and 5.1 millionshares at an aggregate cost of $210.9 million and $159.3 million, respectively. As a result of the Metavanteacquisitions, the Corporation does not expect that it will acquire common shares under the Stock RepurchaseProgram in the near term.
Federal and state banking laws place certain restrictions on the amount of dividends and loans which a bankmay make to its parent company. Such restrictions have not had, and are not expected to have, any material effecton the Corporation’s ability to meet its cash obligations.
M&I manages its liquidity to ensure that funds are available to each of its banks to satisfy the cash flowrequirements of depositors and borrowers and to ensure the Corporation’s own cash requirements are met. M&Imaintains liquidity by obtaining funds from several sources.
The Corporation’s most readily available source of liquidity is its investment portfolio. Investment securitiesavailable for sale, which totaled $5.4 billion at December 31, 2004, represent a highly accessible source of liquidity.The Corporation’s portfolio of held-to-maturity investment securities, which totaled $0.7 billion at December 31,
6 2

2004, provides liquidity from maturities and interest payments. The Corporation’s mortgage loans held for saleprovide additional liquidity. These loans represent recently funded home mortgage loans that are prepared fordelivery to investors, which generally occurs within thirty to ninety days after the loan has been funded.
Depositors within M&I’s defined markets are another source of liquidity. Core deposits (demand, savings,money market and consumer time deposits) averaged $16.3 billion in 2004. The Corporation’s banking affiliatesmay also access the Federal funds markets or utilize collateralized borrowings such as treasury demand notes orFHLB advances.
The banking affiliates may use wholesale deposits, which include foreign (Eurodollar) deposits. Wholesaledeposits, which averaged $6.1 billion in 2004, are funds in the form of deposits generated through distributionchannels other than the Corporation’s own banking branches. These deposits allow the Corporation’s bankingaffiliates to gather funds across a national geographic base and at pricing levels considered attractive, where theunderlying depositor may be retail or institutional. Access to wholesale deposits also provides the Corporation withthe flexibility to not pursue single service time deposit relationships in markets that have experienced someunprofitable pricing levels.
The Corporation utilizes certain financing arrangements to meet its balance sheet management, funding,liquidity, and market or credit risk management needs. The majority of these activities are basic term or revolvingsecuritization vehicles. These vehicles are generally funded through term-amortizing debt structures or with short-term commercial paper designed to be paid off based on the underlying cash flows of the assets securitized. Thesefacilities provide access to funding sources substantially separate from the general credit risk of the Corporation andits subsidiaries.
M&I Bank has implemented a bank note program which permits it to issue up to $7.0 billion of short-term andmedium-term notes which are offered and sold only to institutional investors. This program is intended to enhanceliquidity by enabling M&I Bank to sell its debt instruments in private markets in the future without the delayswhich would otherwise be incurred. As shown and discussed in Note 14 in the Notes to the Consolidated FinancialStatements, longer-term bank notes outstanding at December 31, 2004, amounted to $3.1 billion of which $0.9billion is subordinated and qualifies as supplementary capital for regulatory capital purposes.
The national capital markets represent a further source of liquidity for M&I. M&I has filed a number of shelfregistration statements that are intended to permit M&I to raise funds through sales of corporate debt and/or equitysecurities with a relatively short lead time.
During the second quarter of 2004, the Corporation filed a shelf registration statement with the Securities andExchange Commission which will enable the Corporation to issue various securities, including debt securities,common stock, preferred stock, depositary shares, purchase contracts, units, warrants, and trust preferredsecurities, up to an aggregate amount of $3.0 billion. On July 29, 2004, the Corporation issued $600 million ofsenior notes and $400 million of Common SPACESSM under the shelf registration statement. During 2004, theCorporation issued 3.6 million shares of its common stock under the shelf registration statement in a public offeringthat resulted in gross proceeds to the Corporation of $150.0 million. At December 31, 2004, approximately $1.45billion was available under the shelf registration statement for future securities issuances.
During the fourth quarter of 2004, the Corporation filed a shelf registration statement with the Securities andExchange Commission which will enable the Corporation to issue up to 6.0 million shares of its common stockwhich may be offered and issued from time to time in connection with the acquisition by M&I, Metavante and/orother consolidated subsidiaries of businesses that the Corporation determines to be to its advantage as they becomeavailable. At December 31, 2004, 6.0 million shares of common stock were available under the shelf registrationstatement for future issuances.
Under another shelf registration statement, the Corporation may issue up to $0.6 billion of medium-term SeriesF notes with maturities ranging from 9 months to 30 years and at fixed or floating rates. At December 31, 2004, noSeries F notes had been issued. The Corporation may issue up to $0.5 billion of medium-term MiNotes withmaturities ranging from 9 months to 30 years and at fixed or floating rates. The MiNotes are issued in smaller
6 3

denominations to attract retail investors. At December 31, 2004, MiNotes issued amounted to $0.2 billion.Additionally, the Corporation has a commercial paper program. At December 31, 2004, commercial paperoutstanding amounted to $0.3 billion.
Contractual Obligations
The following table summarizes the Corporation’s more significant contractual obligations at December 31,2004. Excluded from the following table are a number of obligations to be settled in cash. These items are reflectedin the Corporation’s consolidated balance sheet and include deposits with no stated maturity, trade payables,accrued interest payable and derivative payables that do not require physical delivery of the underlying instrument.
Payments Due by Period ($ in millions)
Contractual ObligationsNoteRef Total
Less thanOne Year
One toThree Years
Three toFive Years
More thanFive Years
Certificate of Deposit and Other TimeDeposit Obligations . . . . . . . . . . . . . . (a) $11,458,668 $ 8,199,804 $2,234,469 $1,024,395 $ —
Short-term Debt Obligations . . . . . . . . . (b) 1,934,240 1,934,240 — — —Long-term Debt Obligations . . . . . . . . . (c) 8,669,928 1,845,620 2,421,287 1,298,756 3,104,265Capital Lease Obligations . . . . . . . . . . . . 4,088 2,363 1,725 — —Minimum Operating Lease
Obligations . . . . . . . . . . . . . . . . . . . . . 155,729 39,297 50,749 28,857 36,826Obligations to Purchase Foreign
Currencies . . . . . . . . . . . . . . . . . . . . . . (d) 487,656 484,876 2,780 — —Purchase Obligations—Facilities
(Additions, Repairs andMaintenance) . . . . . . . . . . . . . . . . . . . . 21,859 21,586 245 28 —
Purchase Obligations—Technology . . . 77,544 52,617 24,691 236 —Purchase Obligations—Other . . . . . . . . 7,517 4,996 2,521 — —Other Obligations:
Unfunded Investment Obligations . . . (e) 506 208 245 53 —Acquisition Obligations . . . . . . . . . . . (f) — — — — —Wholesale Loan Purchase
Obligations . . . . . . . . . . . . . . . . . . . (g) 800,000 400,000 400,000 — —Defined Contribution Pension
Obligations . . . . . . . . . . . . . . . . . . . (h) 53,789 53,789 — — —Health and Welfare Benefits . . . . . . . (i) — — — — —Postretirement Benefit Obligations . . (i) 7,000 7,000 — — —
Total . . . . . . . . . . . . . . . . . . . . . . . . . . . . . $23,678,524 $13,046,396 $5,138,712 $2,352,325 $3,141,091
Notes:
In the banking industry, interest-bearing obligations are principally utilized to fund interest-bearing assets. Assuch, interest charges on certificate of deposit and other time deposit obligations and short-term debt obligationswere excluded from amounts reported, as the potential cash outflows would have corresponding cash inflows frominterest-bearing assets. The same, although to a lesser extent, is the case with respect to interest charges on long-term debt obligations. As long-term debt obligations may be used for purposes other than to fund interest-bearingassets, an estimate of interest charges is included in the amounts reported.
(a) Certain retail certificates of deposit and other time deposits give customers rights to early withdrawal. Earlywithdrawals may be subject to penalties. The penalty amount depends on the remaining time to maturity at thetime of early withdrawal. Brokered certificates of deposits may be redeemed early upon the death oradjudication of incompetency of the holder.
(b) See Note 13 in Notes to Consolidated Financial Statements for a description of the Corporation’s variousshort-term borrowings. Many short-term borrowings such as Federal funds purchased and security repurchaseagreements and commercial paper are expected to be reissued and, therefore, do not necessarily represent animmediate need for cash.
6 4

(c) See Note 14 in Notes to Consolidated Financial Statements for a description of the Corporation’s various long-term borrowings. The amounts shown in the table includes interest on both fixed and variable rate obligations.The interest associated with variable rate obligations is based upon rates in effect at December 31, 2004. Thecontractual amounts to be paid on variable rate obligations are affected by changes in market interest rates.Future changes in market interest rates could materially affect the contractual amounts to be paid.
(d) See Note 20 in Notes to Consolidated Financial Statements for a description of the Corporation’s foreignexchange activities. The Corporation generally matches commitments to deliver foreign currencies withobligations to purchase foreign currencies which minimizes the immediate need for cash.
(e) The Corporation also has unfunded obligations for certain investments in investment funds and obligations topurchase when-issued securities. Under the obligations for certain investments in investment funds theCorporation could be required to invest an additional $53.7 million if the investment funds identify and committo invest in additional qualifying investments. The investment funds have limited lives and defined periods forinvesting in new qualifying investments or providing additional funds to existing investments. As a result, thetiming and amount of the funding requirements for these obligations are uncertain and could expire with noadditional funding requirements.
(f) Does not include contingent consideration. See Note 4 in Notes to Consolidated Financial Statements.(g) Represents an estimate of the minimum purchase obligation amount. The obligation to sell is on a best-efforts
basis and may result in no purchases or more purchases than shown in the table in any given period. Inaddition, the actual purchase price will be determined at the time of purchase.
(h) See Note 18 in Notes to Consolidated Financial Statements for a description of the Corporation’s definedcontribution program. The amount shown represents the unfunded contribution for the year ended December31, 2004.
(i) The health and welfare benefit plans are periodically funded throughout each plan year with participantcontributions and the Corporation’s portion of benefits expected to be paid.
The Corporation has generally financed its growth through the retention of earnings and the issuance of debt.It is expected that future growth can be financed through internal earnings retention, additional debt offerings, orthe issuance of additional common or preferred stock or other capital instruments.
OFF-BALANCE SHEET ARRANGEMENTS
The term off-balance sheet arrangement describes the means through which companies typically structure off-balance sheet transactions or otherwise incur risks of loss that are not fully transparent to investors or other users offinancial information. For example, in many cases, in order to facilitate transfer of assets or otherwise finance theactivities of an unconsolidated entity, a company may be required to provide financial support designed to reducethe risks to the entity or other third parties. That financial support may take many different forms such as financialguarantees, subordinated retained interests, derivative instruments or other contingent arrangements that exposethe company to continuing risks or contingent liabilities regardless of whether or not they are recorded on thebalance sheet.
Certain guarantees may be a source of potential risk to future liquidity, capital resources and results ofoperations. Guarantees may be in the form of contracts that contingently require the guarantor to make payments tothe guaranteed party based on: (1) changes in an underlying instrument or variable such as a financial standbyletter of credit; (2) failure to perform under an obligating agreement such as a performance standby letter of credit;and (3) indemnification agreements that require the indemnifying party to make payments to the indemnified partybased on changes in an underlying instrument or variable that is related to an asset, a liability or an equity securityof the indemnified party, such as an adverse judgment in a lawsuit. The Corporation, for a fee, regularly enters intostandby letters of credit transactions and provides certain indemnifications against loss in conjunction with softwaresales, merchant credit card processing and securities lending activities which are described in detail in Notes 19 and24 in Notes to Consolidated Financial Statements.
Companies may structure and facilitate off-balance sheet arrangements by retaining an interest in assetstransferred to an unconsolidated entity. Such interests may be in the form of a subordinated retained interest in apool of receivables transferred to an unconsolidated entity, cash collateral accounts, recourse obligations or other
6 5
forms of credit, liquidity, or market risk support. These subordinated interests protect the senior interests in theunconsolidated entity in the event a portion of the underlying transferred assets becomes uncollectible or there areinsufficient funds to repay senior interest obligations. The Corporation uses such arrangements primarily inconjunction with its indirect automobile lending activities which are described in detail in Note 9 in Notes toConsolidated Financial Statements and in the discussion of critical accounting policies which follows thisdiscussion.
During the third quarter of 2004, the Corporation and M&I Capital Trust B issued 16,000,000 units ofCommon SPACESSM that resulted in net proceeds to the Corporation of approximately $389.2 million. Each unithas a stated value of $25.00 for an aggregate value of $400.0 million. Each Common SPACES consists of (i) a stockpurchase contract under which the investor agrees to purchase for $25, a fraction of a share of the Corporation’scommon stock on the stock purchase date and (ii) a 1/40, or 2.5%, undivided beneficial interest in a preferredsecurity of M&I Capital Trust B, also referred to as the STACKSSM, with each share having an initial liquidationamount of $1,000. The stock purchase date is expected to be August 15, 2007, but could be deferred for quarterlyperiods until August 15, 2008.
On the stock purchase date, the number of shares of common stock the Corporation will issue upon settlementof the stock purchase contracts depends on the applicable market value per share of the Corporation’s commonstock, which will be determined just prior to the stock purchase date, and other factors. The Corporation currentlyestimates that it will issue approximately 8.7 million to 10.9 million common shares to settle shares issuablepursuant to the stock purchase contracts.
Holders of the STACKS are entitled to receive quarterly cumulative cash distributions through the stockpurchase date fixed initially at an annual rate of 3.90% of the liquidation amount of $1,000 per STACKS. Inaddition, the Corporation will make quarterly contract payments under the stock purchase contract at the annualrate of 2.60% of the stated amount of $25 per stock purchase contract. The Corporation recognized the presentvalue of the quarterly contract payments under the stock purchase contract as a liability with an offsetting reductionin shareholders’ equity. That liability along with the allocated portion of the fees and expenses incurred for theoffering of Common SPACES resulted in a reduction in shareholders’ equity of $34.0 million.
Also at December 31, 2004, the Corporation did not hold any material variable interests in entities that provideit liquidity, market risk or credit risk support, or engage in leasing, hedging or research and development serviceswith the Corporation. As described in Notes 2 and 14 in Notes to Consolidated Financial Statements, theCorporation holds all of the common interest in M&I Capital Trust A and M&I Capital Trust B which issuedcumulative preferred capital securities which are supported by junior subordinated deferrable interest debenturesand a full guarantee issued by the Corporation. As a result of adopting FIN 46R, the Corporation deconsolidatedM&I Capital Trust A at December 31, 2003 and does not consolidate M&I Capital Trust B.
Based on the off-balance sheet arrangements with which it is presently involved, the Corporation does notbelieve that such off-balance sheet arrangements either have, or are reasonably likely to have, a material impact toits current or future financial condition, results of operations, liquidity or capital.
CRITICAL ACCOUNTING POLICIES
The Corporation has established various accounting policies which govern the application of accountingprinciples generally accepted in the United States in the preparation of the Corporation’s consolidated financialstatements. The significant accounting policies of the Corporation are described in the footnotes to the consolidatedfinancial statements contained herein and updated as necessary in its Quarterly Reports on Form 10-Q. Certainaccounting policies involve significant judgments and assumptions by management that may have a material impacton the carrying value of certain assets and liabilities. Management considers such accounting policies to be criticalaccounting policies. The judgments and assumptions used by management are based on historical experience andother factors, which are believed to be reasonable under the circumstances. Because of the nature of judgments andassumptions made by management, actual results could differ from these judgments and estimates which could have
6 6

a material impact on the carrying values of assets and liabilities and the results of the operations of the Corporation.Management considers the following to be those accounting policies that require significant judgments andassumptions:
Allowance for Loan and Lease Losses
The allowance for loan and lease losses represents management’s estimate of probable losses inherent in theCorporation’s loan and lease portfolio. Management evaluates the allowance each quarter to determine that it isadequate to absorb these inherent losses. This evaluation is supported by a methodology that identifies estimatedlosses based on assessments of individual problem loans and historical loss patterns of homogeneous loan pools. Inaddition, environmental factors, including economic conditions and regulatory guidance, unique to eachmeasurement date are also considered. This reserving methodology has the following components:
Specific Reserve. The Corporation’s internal risk rating system is used to identify loans and leases that meet thecriteria as being “impaired” under the definition in SFAS 114. A loan is impaired when, based on currentinformation and events, it is probable that a creditor will be unable to collect all amounts due according to thecontractual terms of the loan agreement. For impaired loans, impairment is measured using one of threealternatives: (1) the present value of expected future cash flows discounted at the loan’s effective interest rate;(2) the loan’s observable market price, if available; or (3) the fair value of the collateral for collateral dependentloans and loans for which foreclosure is deemed to be probable. In general, these loans have been internallyidentified as credits requiring management’s attention due to underlying problems in the borrower’s businessor collateral concerns. Subject to a minimum size, a quarterly review of these loans is performed to identify thespecific reserve necessary to be allocated to each of these loans. This analysis considers expected future cashflows, the value of collateral and also other factors that may impact the borrower’s ability to make paymentswhen due.
Collective Loan Impairment. This component of the allowance for loan and lease losses is comprised of twoelements. First, the Corporation makes a significant number of loans and leases, which due to their underlyingsimilar characteristics, are assessed for loss as homogeneous pools. Included in the homogeneous pools areloans and leases from the retail sector and commercial loans under a certain size that have been excluded fromthe specific reserve allocation previously discussed. The Corporation segments the pools by type of loan orlease and, using historical loss information, estimates a loss reserve for each pool.
The second element reflects management’s recognition of the uncertainty and imprecision underlying theprocess of estimating losses. The internal risk rating system is used to identify those loans within certainindustry segments that based on financial, payment or collateral performance, warrant closer ongoingmonitoring by management. The specific loans mentioned earlier are excluded from this analysis. Based onmanagement’s judgment, reserve ranges are allocated to industry segments due to environmental conditionsunique to the measurement period. Consideration is given to both internal and external environmental factorssuch as economic conditions in certain geographic or industry segments of the portfolio, economic trends, riskprofile, and portfolio composition. Reserve ranges are then allocated using estimates of loss exposure thatmanagement has identified based on these economic trends or conditions.
The following factors were taken into consideration in determining the adequacy of the allowance for loan andlease losses at December 31, 2004:
In general, the Corporation’s borrowing customers appear to have successfully managed their businessesthrough the slower economic conditions, the economy is improving and the Corporation’s customer base isbeginning to see some signs of increased business activity. Management continues to be concerned that thelong-term impact of the previous recession may still provide some unanticipated losses within the loan andlease portfolio.
At December 31, 2004, allowances for loan and lease losses continue to be carried for exposures tomanufacturing, healthcare, production agriculture (including dairy and cropping operations), trucktransportation, accommodation and the airline industries. The majority of the commercial charge-offs incurredduring the past two years were in these industry segments. While most loans in these categories are stillperforming, the Corporation continues to believe these sectors have been more adversely affected by the
6 7

economic slowdown. Reduced revenues causing a declining utilization of the industry’s capacity levels haveimpacted manufacturing. As a result, collateral values and the amounts realized through the sale or liquidationof manufacturing plant and equipment have declined accordingly.
During the fourth quarter of 2004, the Corporation’s commitments to Shared National Credits wereapproximately $2.5 billion with usage averaging around 38%. Many of the Corporation’s largest charge-offshave come from the Shared National Credit portfolio. Approximately $3.1 million of the net charge-offs in2003 related to Shared National Credits. Although these factors result in an increased risk profile, as ofDecember 31, 2004, there were no Shared National Credit nonperforming loans. The Corporation’s exposureto Shared National Credits is monitored closely given this lending group’s loss experience.
The Corporation’s primary lending areas are Wisconsin, Arizona, Minnesota and Missouri. The acquisitions inMinnesota and Missouri continue to represent relatively new geographic regions for the Corporation. Each ofthese regions has cultural and environmental factors that are unique to them. The uncertainty regarding theinherent losses in their respective loan portfolios continue to present increased risks which have been mitigatedby the implementation of the Corporation’s credit underwriting and monitoring processes. At December 31,2004, total nonperforming loans and leases as a percent of total loans and leases for the Minnesota andMissouri regions combined was somewhat higher than nonperforming loans and leases as a percent of totalloans and leases for the other regions and the consolidated total.
At December 31, 2004, nonperforming loans and leases amounted to $132.4 million or 0.45% of consolidatedloans and leases compared to $172.8 million or 0.69% at December 31, 2003 and $194.5 million or 0.81% atDecember 31, 2002. Nonperforming loans have declined in each of the past seven consecutive quarters.Nonaccrual loans decreased $38.7 million or 23.2% at year-end 2004 compared to year-end 2003. The netdecrease was primarily due to reductions and positive resolutions in several portfolio segments and across allloan types.
Net charge-offs amounted to $29.4 million or 0.11% of average loans and leases in 2004 compared to $51.8million or 0.21% of average loans and leases in 2003 and $44.0 million or 0.21% of average loans and leases in2002. Included in net charge-offs for 2003 was a $19.0 million charge-off related to the carrying value of leaseobligations for airplanes leased to Midwest Airlines, Inc.
During the past three-year period, net charge-offs have remained in a narrow range of approximately 20 basispoints, which is somewhat higher than historical levels. Net charge-offs in 2004 were better than managementhad expected and to some extent reflect a higher than normal level of recoveries. It is uncertain whether thehigher than normal level of recoveries will continue.
Negative economic events, an adverse development in industry segments within the portfolio or deteriorationof a large loan or loans could have significant adverse impacts on the actual loss levels. At the present time,there are no other known specific issues, industries of concern or material loans believed to be in imminentdanger of deteriorating or defaulting which would give rise to a large near-term charge-off.
Based on the above loss estimates, management determined its best estimate of the required allowance forloans and leases. Management’s evaluation of the factors described above resulted in an allowance for loan andlease losses of $358.1 million or 1.21% of loans and leases outstanding at December 31, 2004. The allowance forloan and lease losses was $349.6 million or 1.39% of loans and leases outstanding at December 31, 2003. Consistentwith the improvement in credit quality trends noted above, the provision for loan and lease losses amounted to$38.0 million in 2004. By comparison, the provision for loan and lease losses amounted to $63.0 million and $74.4million in 2003 and 2002, respectively. The resulting provisions for loan and lease losses are the amounts required toestablish the allowance for loan and lease losses at the required level after considering charge-offs and recoveries.Management recognizes there are significant estimates in the process and the ultimate losses could be significantlydifferent from those currently estimated.
The Corporation has not materially changed any aspect of its overall approach in the determination of theallowance for loan and lease losses. There have been no material changes in assumptions or estimation techniques ascompared to prior periods that impacted the determination of the current period allowance. However, on anon-going basis the Corporation continues to refine the methods used in determining management’s best estimate ofthe allowance for loan and lease losses.
6 8
Capitalized Software and Conversion Costs
Direct costs associated with the production of computer software that will be licensed externally or used in aservice bureau environment are capitalized. Capitalization of such costs is subject to strict accounting policycriteria, although the appropriate time to initiate capitalization requires management judgment. Once the specificcapitalized project is put into production, the software cost is amortized over its estimated useful life, generally fouryears. Each quarter, the Corporation performs net realizable value tests to ensure the assets are recoverable. Suchtests require management judgment as to the future sales and profitability of a particular product which involves, insome cases, multi-year projections. Technology changes and changes in customer requirements can have asignificant impact on the recoverability of these assets and can be difficult to predict. Should significant adversechanges occur, estimates of useful life may have to be revised or write-offs would be required to recognizeimpairment. For the years ended December 31, 2004 and 2003, the amount of software costs capitalized amountedto $38.1 million and $54.1 million, respectively. Amortization expense of software costs amounted to $50.4 millionand $43.8 million for the years ended December 31, 2004 and 2003, respectively.
During 2004, Metavante determined that certain products had limited growth potential. As a result of strategicproduct reviews and the results of net realizable tests on these products, Metavante determined that the capitalizedsoftware and other assets associated with the products were impaired. Total capitalized software costs written offamounted to $8.7 million and is included in other noninterest expense in 2004.
As a result of a change in product strategies, Metavante determined that certain purchased and internallydeveloped software will no longer be used and such software was written off in 2003. Total capitalized softwarecosts written off as a result of these decisions amounted to $22.8 million and is included in other noninterestexpense in 2003.
Direct costs associated with customer system conversions to the data processing operations are capitalized andamortized on a straight-line basis over the terms, generally five to seven years, of the related servicing contracts.
Capitalization only occurs when management is satisfied that such costs are recoverable through futureoperations or buyout fees in case of early termination. For the years ended December 31, 2004 and 2003, theamount of conversion costs capitalized amounted to $9.4 million and $11.7 million, respectively. Amortizationexpense of conversion costs amounted to $13.5 million and $17.0 million for the years ended December 31, 2004and 2003, respectively.
Net unamortized costs, which are included in Accrued Interest and Other Assets in the Consolidated BalanceSheets, at December 31, were ($ in millions):
2004 2003
Software . . . . . . . . . . . . . . . . . . . . . . . . . . . . . . . . . $161.1 $133.6Conversions . . . . . . . . . . . . . . . . . . . . . . . . . . . . . . 26.5 30.7
Total . . . . . . . . . . . . . . . . . . . . . . . . . . . . . . . . $187.6 $164.3
The Corporation has not substantively changed any aspect to its overall approach in the determination of theamount of costs that are capitalized for software development or conversion activities. There have been no materialchanges in assumptions or estimation techniques as compared to prior periods that impacted the determination ofthe periodic amortization of such costs.
Financial Asset Sales and Securitizations
The Corporation utilizes certain financing arrangements to meet its balance sheet management, funding,liquidity, and market or credit risk management needs. The majority of these activities are basic term or revolvingsecuritization vehicles. These vehicles are generally funded through term-amortizing debt structures or with short-term commercial paper designed to be paid off based on the underlying cash flows of the assets securitized. These
6 9

financing entities are contractually limited to a narrow range of activities that facilitate the transfer of or access tovarious types of assets or financial instruments. In certain situations, the Corporation provides liquidity and/or lossprotection agreements. In determining whether the financing entity should be consolidated, the Corporationconsiders whether the entity is a qualifying special-purpose entity (“QSPE”) as defined in Statement of FinancialAccounting Standards (“SFAS”) No. 140, Accounting for Transfers and Servicing of Financial Assets andExtinguishments of Liabilities. For non-consolidation, a QSPE must be demonstrably distinct, have significantlylimited permitted activities, hold assets that are restricted to transferred financial assets and related assets, and cansell or dispose of non-cash financial assets only in response to specified conditions.
In December 2003, the Corporation adopted Financial Accounting Standards Board Interpretation No. 46(“FIN 46R”), Consolidation of Variable Interest Entities (revised December 2003). This interpretation addressesconsolidation by business enterprises of variable interest entities. Under current practice, entities generally havebeen included in consolidated financial statements because they are controlled through voting interests. Thisinterpretation explains how to identify variable interest entities and how an entity assesses its interests in a variableinterest entity to decide whether to consolidate that entity. FIN 46R requires existing unconsolidated variableinterest entities to be consolidated by their primary beneficiaries if the entities do not effectively disperse risksamong parties involved. Variable interest entities that effectively disperse risks will not be consolidated unless asingle party holds an interest or combination of interests that effectively recombines risks that were previouslydispersed. Transferors to QSPEs and “grandfathered” QSPEs subject to the reporting requirements of SFAS 140are outside the scope of FIN 46R and do not consolidate those entities. FIN 46R also requires certain disclosures bythe primary beneficiary of a variable interest entity or an entity that holds a significant variable interest in a variableinterest entity.
With respect to the Corporation’s securitization activities, the adoption of FIN 46R did not have an impact onits consolidated financial statements because its transfers are generally to QSPEs.
The Corporation sells financial assets in a two-step process that results in a surrender of control over the assetsas evidenced by true-sale opinions from legal counsel, to unconsolidated entities that securitize the assets. TheCorporation retains interests in the securitized assets in the form of interest-only strips and a cash reserve account.Gain or loss on sale of the assets depends in part on the carrying amount assigned to the assets sold allocatedbetween the asset sold and retained interests based on their relative fair values at the date of transfer. The value ofthe retained interests is based on the present value of expected cash flows estimated using management’s bestestimates of the key assumptions—credit losses, prepayment speeds, forward yield curves and discount ratescommensurate with the risks involved. Actual results can differ from expected results.
The Corporation reviews the carrying values of the retained interests monthly to determine if there is a declinein value that is other than temporary and periodically reviews the propriety of the assumptions used based oncurrent historical experience as well as the sensitivities of the carrying value of the retained interests to adversechanges in the key assumptions. The Corporation believes that its estimates result in a reasonable carrying value ofthe retained interests.
During 2003, the Corporation recognized impairment losses of $4.1 million that is included in net investmentsecurities gains (losses) in the Consolidated Statements of Income. The impairment was a result of the differencesbetween actual prepayments and credit losses experienced compared to the expected prepayments and credit lossesused in measuring the initial retained interests. The impairments on the retained interests, held in the form ofinterest-only strips, were deemed to be other than temporary. No impairment losses were recognized in 2004.
The Corporation regularly sells automobile loans to an unconsolidated multi-seller special purpose entitycommercial paper conduit in securitization transactions in which servicing responsibilities and subordinatedinterests are retained. The outstanding balances of automobile loans sold in these securitization transactions were$1,003.0 million and $1,050.4 million at December 31, 2004 and 2003, respectively. At December 31, 2004 and2003, the carrying amount of retained interests amounted to $42.2 million and $42.0 million, respectively.
The Corporation also sells, from time to time, debt securities classified as available for sale that are highly ratedto an unconsolidated bankruptcy remote QSPE whose activities are limited to issuing highly rated asset-backed
7 0
commercial paper with maturities up to 180 days which is used to finance the purchase of the investment securities.The Corporation provides liquidity back-up in the form of Liquidity Purchase Agreements. In addition, theCorporation acts as counterparty to interest rate swaps that enable the QSPE to hedge its interest rate risk. Suchswaps are designated as free-standing derivative financial instruments in the Corporation’s Consolidated BalanceSheet.
At December 31, 2004, highly rated investment securities in the amount of $280.2 million were outstanding inthe QSPE to support the outstanding commercial paper.
Income Taxes
Income taxes are accounted for using the asset and liability method. Under this method, deferred tax assetsand liabilities are recognized for the future tax consequences attributable to differences between the financialstatement carrying amounts of existing assets and liabilities and their respective tax basis. Deferred tax assets andliabilities are measured using enacted tax rates expected to apply to taxable income in the years in which thosetemporary differences are expected to be recovered or settled. The effect on tax assets and liabilities of a change intax rates is recognized in the income statement in the period that includes the enactment date.
The determination of current and deferred income taxes is based on complex analyses of many factors,including interpretation of Federal and state income tax laws, the difference between tax and financial reportingbasis of assets and liabilities (temporary differences), estimates of amounts currently due or owed, such as thetiming of reversals of temporary differences and current accounting standards. The Federal and state taxingauthorities who make assessments based on their determination of tax laws periodically review the Corporation’sinterpretation of Federal and state income tax laws. Tax liabilities could differ significantly from the estimates andinterpretations used in determining the current and deferred income tax liabilities based on the completion of taxingauthority examinations.
During 2003, several income tax audits covering multiple tax jurisdictions were resolved which positivelyaffected the banking segment by $28.6 million and Metavante by $10.7 million and resulted in a lower provision forincome taxes in the Consolidated Statements of Income for the year ended December 31, 2003.
QUANTITATIVE AND QUALITATIVE DISCLOSURES ABOUT MARKET RISK
Market risk arises from exposure to changes in interest rates, exchange rates, commodity prices, and otherrelevant market rate or price risk. The Corporation faces market risk through trading and other than tradingactivities. While market risk that arises from trading activities in the form of foreign exchange and interest rate riskis immaterial to the Corporation, market risk from other than trading activities in the form of interest rate risk ismeasured and managed through a number of methods.
Interest Rate Risk
The Corporation uses financial modeling techniques to identify potential changes in income under a variety ofpossible interest rate scenarios. Financial institutions, by their nature, bear interest rate and liquidity risk as anecessary part of the business of managing financial assets and liabilities. The Corporation has designed strategiesto limit these risks within prudent parameters and identify appropriate risk/reward tradeoffs in the financialstructure of the balance sheet.
The financial models identify the specific cash flows, repricing timing and embedded option characteristics ofthe assets and liabilities held by the Corporation. Policies are in place to assure that neither earnings nor fair valueat risk exceed appropriate limits. The use of a limited array of derivative financial instruments has allowed theCorporation to achieve the desired balance sheet repricing structure while simultaneously meeting the desiredobjectives of both its borrowing and depositing customers.
The models used include measures of the expected repricing characteristics of administered rate (NOW,savings and money market accounts) and non-rate related products (demand deposit accounts, other assets and
7 1
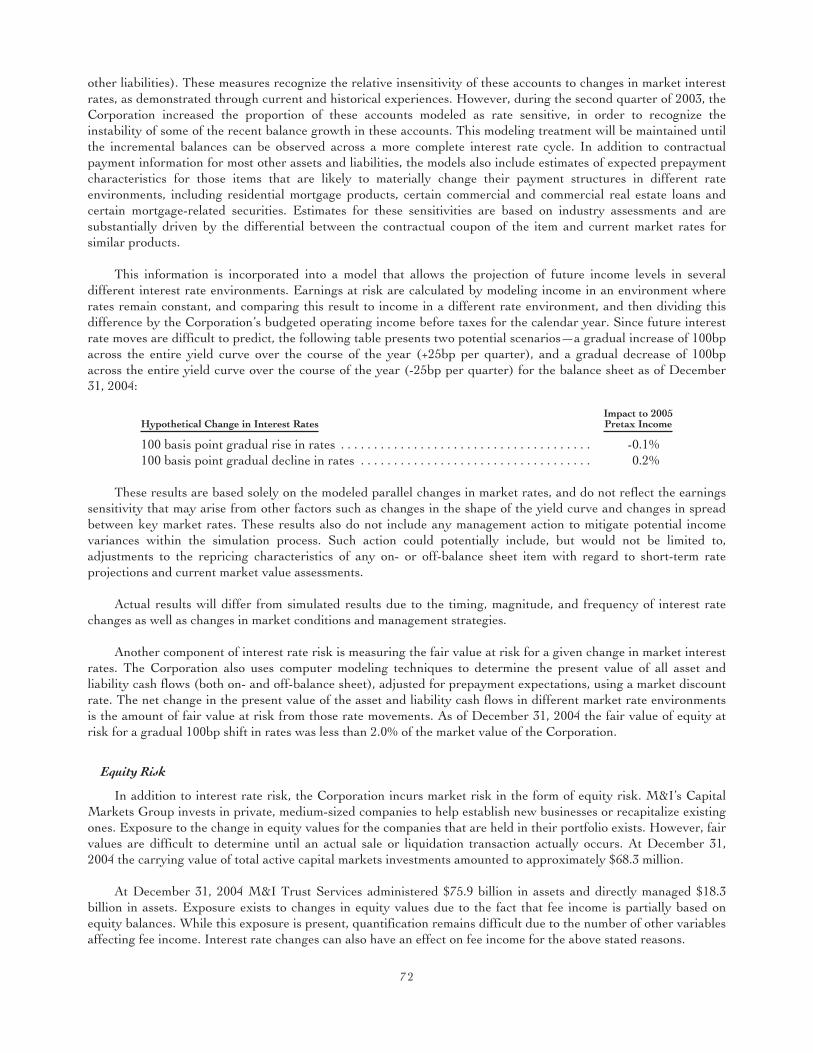
other liabilities). These measures recognize the relative insensitivity of these accounts to changes in market interestrates, as demonstrated through current and historical experiences. However, during the second quarter of 2003, theCorporation increased the proportion of these accounts modeled as rate sensitive, in order to recognize theinstability of some of the recent balance growth in these accounts. This modeling treatment will be maintained untilthe incremental balances can be observed across a more complete interest rate cycle. In addition to contractualpayment information for most other assets and liabilities, the models also include estimates of expected prepaymentcharacteristics for those items that are likely to materially change their payment structures in different rateenvironments, including residential mortgage products, certain commercial and commercial real estate loans andcertain mortgage-related securities. Estimates for these sensitivities are based on industry assessments and aresubstantially driven by the differential between the contractual coupon of the item and current market rates forsimilar products.
This information is incorporated into a model that allows the projection of future income levels in severaldifferent interest rate environments. Earnings at risk are calculated by modeling income in an environment whererates remain constant, and comparing this result to income in a different rate environment, and then dividing thisdifference by the Corporation’s budgeted operating income before taxes for the calendar year. Since future interestrate moves are difficult to predict, the following table presents two potential scenarios—a gradual increase of 100bpacross the entire yield curve over the course of the year (+25bp per quarter), and a gradual decrease of 100bpacross the entire yield curve over the course of the year (-25bp per quarter) for the balance sheet as of December31, 2004:
Hypothetical Change in Interest RatesImpact to 2005Pretax Income
100 basis point gradual rise in rates . . . . . . . . . . . . . . . . . . . . . . . . . . . . . . . . . . . . . . -0.1%100 basis point gradual decline in rates . . . . . . . . . . . . . . . . . . . . . . . . . . . . . . . . . . . 0.2%
These results are based solely on the modeled parallel changes in market rates, and do not reflect the earningssensitivity that may arise from other factors such as changes in the shape of the yield curve and changes in spreadbetween key market rates. These results also do not include any management action to mitigate potential incomevariances within the simulation process. Such action could potentially include, but would not be limited to,adjustments to the repricing characteristics of any on- or off-balance sheet item with regard to short-term rateprojections and current market value assessments.
Actual results will differ from simulated results due to the timing, magnitude, and frequency of interest ratechanges as well as changes in market conditions and management strategies.
Another component of interest rate risk is measuring the fair value at risk for a given change in market interestrates. The Corporation also uses computer modeling techniques to determine the present value of all asset andliability cash flows (both on- and off-balance sheet), adjusted for prepayment expectations, using a market discountrate. The net change in the present value of the asset and liability cash flows in different market rate environmentsis the amount of fair value at risk from those rate movements. As of December 31, 2004 the fair value of equity atrisk for a gradual 100bp shift in rates was less than 2.0% of the market value of the Corporation.
Equity Risk
In addition to interest rate risk, the Corporation incurs market risk in the form of equity risk. M&I’s CapitalMarkets Group invests in private, medium-sized companies to help establish new businesses or recapitalize existingones. Exposure to the change in equity values for the companies that are held in their portfolio exists. However, fairvalues are difficult to determine until an actual sale or liquidation transaction actually occurs. At December 31,2004 the carrying value of total active capital markets investments amounted to approximately $68.3 million.
At December 31, 2004 M&I Trust Services administered $75.9 billion in assets and directly managed $18.3billion in assets. Exposure exists to changes in equity values due to the fact that fee income is partially based onequity balances. While this exposure is present, quantification remains difficult due to the number of other variablesaffecting fee income. Interest rate changes can also have an effect on fee income for the above stated reasons.
7 2
FORWARD-LOOKING STATEMENTS
Statements made in this Annual Report that are not statements of historical fact are forward-lookingstatements, including, without limitation, statements regarding the Corporation’s expected financial and operatingresults for 2005. Forward-looking statements are subject to significant risks and uncertainties, and theCorporation’s actual results may differ materially from the results discussed in such forward-looking statements.These statements speak of M&I’s plans, goals, beliefs or expectations, refer to estimates or use similar terms. Theinformation under the heading “Forward-Looking Statements” in M&I’s Annual Report on Form 10-K for the yearended December 31, 2004, which information is incorporated herein by reference, provides cautionary statementsidentifying important factors that could cause M&I’s actual results to differ materially from those contained in theforward-looking statements. All forward-looking statements contained in this Annual Report are based uponinformation available at the time the statement is made, and M&I assumes no obligation to update any forward-looking statement.
NEW YORK STOCK EXCHANGE CERTIFICATION
In 2004, Dennis J. Kuester, M&I’s Chief Executive Officer, submitted a certification to the New York StockExchange in accordance with Section 303A.12 of the New York Stock Exchange Listed Company Manual statingthat, as of the date of the certification, he was not aware of any violation by M&I of the New York StockExchange’s corporate governance listing standards.
7 3
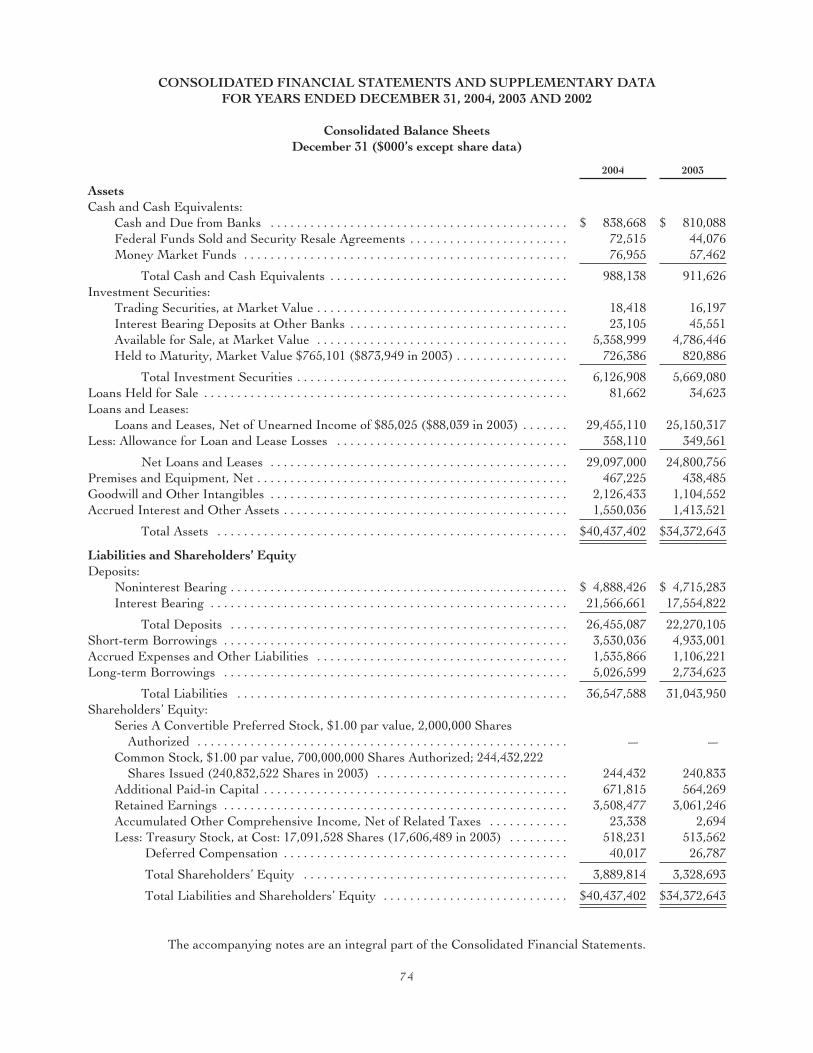
CONSOLIDATED FINANCIAL STATEMENTS AND SUPPLEMENTARY DATAFOR YEARS ENDED DECEMBER 31, 2004, 2003 AND 2002
Consolidated Balance SheetsDecember 31 ($000’s except share data)
2004 2003
AssetsCash and Cash Equivalents:
Cash and Due from Banks . . . . . . . . . . . . . . . . . . . . . . . . . . . . . . . . . . . . . . . . . . . . . $ 838,668 $ 810,088Federal Funds Sold and Security Resale Agreements . . . . . . . . . . . . . . . . . . . . . . . . 72,515 44,076Money Market Funds . . . . . . . . . . . . . . . . . . . . . . . . . . . . . . . . . . . . . . . . . . . . . . . . . 76,955 57,462
Total Cash and Cash Equivalents . . . . . . . . . . . . . . . . . . . . . . . . . . . . . . . . . . . . 988,138 911,626Investment Securities:
Trading Securities, at Market Value . . . . . . . . . . . . . . . . . . . . . . . . . . . . . . . . . . . . . . 18,418 16,197Interest Bearing Deposits at Other Banks . . . . . . . . . . . . . . . . . . . . . . . . . . . . . . . . . 23,105 45,551Available for Sale, at Market Value . . . . . . . . . . . . . . . . . . . . . . . . . . . . . . . . . . . . . . 5,358,999 4,786,446Held to Maturity, Market Value $765,101 ($873,949 in 2003) . . . . . . . . . . . . . . . . . 726,386 820,886
Total Investment Securities . . . . . . . . . . . . . . . . . . . . . . . . . . . . . . . . . . . . . . . . . 6,126,908 5,669,080Loans Held for Sale . . . . . . . . . . . . . . . . . . . . . . . . . . . . . . . . . . . . . . . . . . . . . . . . . . . . . . . 81,662 34,623Loans and Leases:
Loans and Leases, Net of Unearned Income of $85,025 ($88,039 in 2003) . . . . . . . 29,455,110 25,150,317Less: Allowance for Loan and Lease Losses . . . . . . . . . . . . . . . . . . . . . . . . . . . . . . . . . . . 358,110 349,561
Net Loans and Leases . . . . . . . . . . . . . . . . . . . . . . . . . . . . . . . . . . . . . . . . . . . . . 29,097,000 24,800,756Premises and Equipment, Net . . . . . . . . . . . . . . . . . . . . . . . . . . . . . . . . . . . . . . . . . . . . . . . 467,225 438,485Goodwill and Other Intangibles . . . . . . . . . . . . . . . . . . . . . . . . . . . . . . . . . . . . . . . . . . . . . 2,126,433 1,104,552Accrued Interest and Other Assets . . . . . . . . . . . . . . . . . . . . . . . . . . . . . . . . . . . . . . . . . . . 1,550,036 1,413,521
Total Assets . . . . . . . . . . . . . . . . . . . . . . . . . . . . . . . . . . . . . . . . . . . . . . . . . . . . . $40,437,402 $34,372,643
Liabilities and Shareholders’ EquityDeposits:
Noninterest Bearing . . . . . . . . . . . . . . . . . . . . . . . . . . . . . . . . . . . . . . . . . . . . . . . . . . . $ 4,888,426 $ 4,715,283Interest Bearing . . . . . . . . . . . . . . . . . . . . . . . . . . . . . . . . . . . . . . . . . . . . . . . . . . . . . . 21,566,661 17,554,822
Total Deposits . . . . . . . . . . . . . . . . . . . . . . . . . . . . . . . . . . . . . . . . . . . . . . . . . . . 26,455,087 22,270,105Short-term Borrowings . . . . . . . . . . . . . . . . . . . . . . . . . . . . . . . . . . . . . . . . . . . . . . . . . . . . 3,530,036 4,933,001Accrued Expenses and Other Liabilities . . . . . . . . . . . . . . . . . . . . . . . . . . . . . . . . . . . . . . 1,535,866 1,106,221Long-term Borrowings . . . . . . . . . . . . . . . . . . . . . . . . . . . . . . . . . . . . . . . . . . . . . . . . . . . . 5,026,599 2,734,623
Total Liabilities . . . . . . . . . . . . . . . . . . . . . . . . . . . . . . . . . . . . . . . . . . . . . . . . . . 36,547,588 31,043,950Shareholders’ Equity:
Series A Convertible Preferred Stock, $1.00 par value, 2,000,000 SharesAuthorized . . . . . . . . . . . . . . . . . . . . . . . . . . . . . . . . . . . . . . . . . . . . . . . . . . . . . . . . — —
Common Stock, $1.00 par value, 700,000,000 Shares Authorized; 244,432,222Shares Issued (240,832,522 Shares in 2003) . . . . . . . . . . . . . . . . . . . . . . . . . . . . . 244,432 240,833
Additional Paid-in Capital . . . . . . . . . . . . . . . . . . . . . . . . . . . . . . . . . . . . . . . . . . . . . . 671,815 564,269Retained Earnings . . . . . . . . . . . . . . . . . . . . . . . . . . . . . . . . . . . . . . . . . . . . . . . . . . . . 3,508,477 3,061,246Accumulated Other Comprehensive Income, Net of Related Taxes . . . . . . . . . . . . 23,338 2,694Less: Treasury Stock, at Cost: 17,091,528 Shares (17,606,489 in 2003) . . . . . . . . . 518,231 513,562
Deferred Compensation . . . . . . . . . . . . . . . . . . . . . . . . . . . . . . . . . . . . . . . . . . . 40,017 26,787
Total Shareholders’ Equity . . . . . . . . . . . . . . . . . . . . . . . . . . . . . . . . . . . . . . . . 3,889,814 3,328,693
Total Liabilities and Shareholders’ Equity . . . . . . . . . . . . . . . . . . . . . . . . . . . . $40,437,402 $34,372,643
The accompanying notes are an integral part of the Consolidated Financial Statements.
7 4
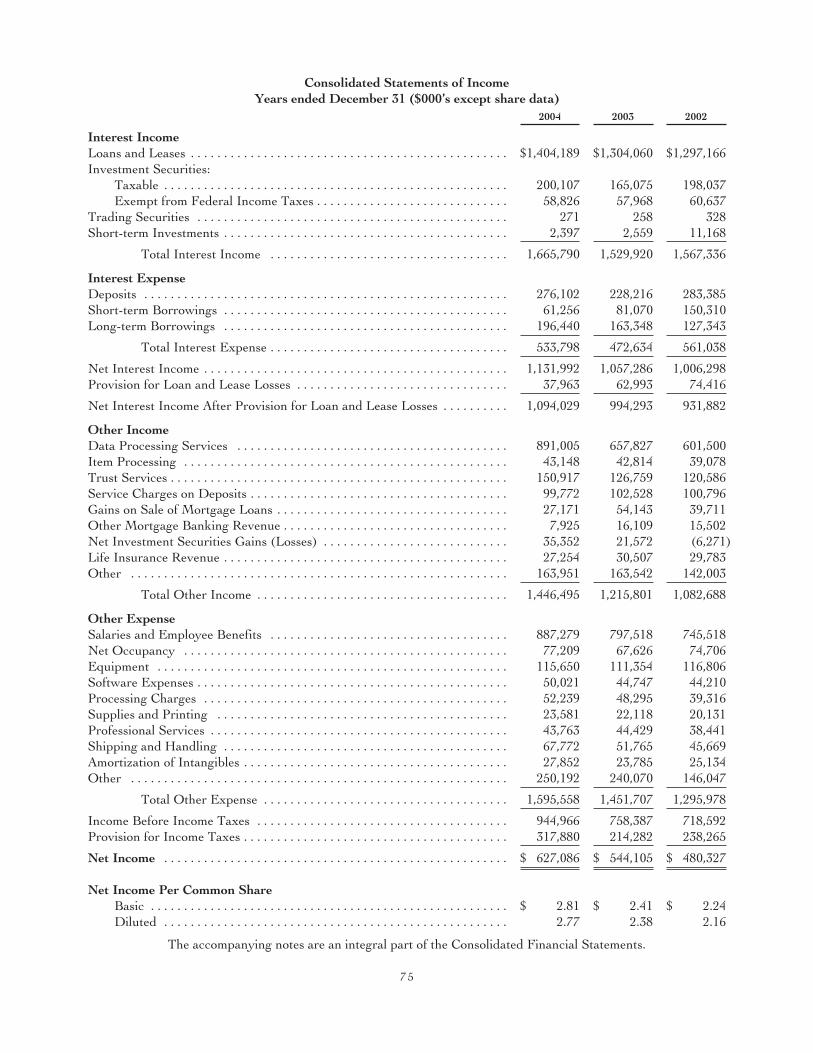
Consolidated Statements of IncomeYears ended December 31 ($000’s except share data)
2004 2003 2002
Interest IncomeLoans and Leases . . . . . . . . . . . . . . . . . . . . . . . . . . . . . . . . . . . . . . . . . . . . . . . . $1,404,189 $1,304,060 $1,297,166Investment Securities:
Taxable . . . . . . . . . . . . . . . . . . . . . . . . . . . . . . . . . . . . . . . . . . . . . . . . . . . . 200,107 165,075 198,037Exempt from Federal Income Taxes . . . . . . . . . . . . . . . . . . . . . . . . . . . . . 58,826 57,968 60,637
Trading Securities . . . . . . . . . . . . . . . . . . . . . . . . . . . . . . . . . . . . . . . . . . . . . . . 271 258 328Short-term Investments . . . . . . . . . . . . . . . . . . . . . . . . . . . . . . . . . . . . . . . . . . . 2,397 2,559 11,168
Total Interest Income . . . . . . . . . . . . . . . . . . . . . . . . . . . . . . . . . . . . 1,665,790 1,529,920 1,567,336
Interest ExpenseDeposits . . . . . . . . . . . . . . . . . . . . . . . . . . . . . . . . . . . . . . . . . . . . . . . . . . . . . . . 276,102 228,216 283,385Short-term Borrowings . . . . . . . . . . . . . . . . . . . . . . . . . . . . . . . . . . . . . . . . . . . 61,256 81,070 150,310Long-term Borrowings . . . . . . . . . . . . . . . . . . . . . . . . . . . . . . . . . . . . . . . . . . . 196,440 163,348 127,343
Total Interest Expense . . . . . . . . . . . . . . . . . . . . . . . . . . . . . . . . . . . . 533,798 472,634 561,038
Net Interest Income . . . . . . . . . . . . . . . . . . . . . . . . . . . . . . . . . . . . . . . . . . . . . . 1,131,992 1,057,286 1,006,298Provision for Loan and Lease Losses . . . . . . . . . . . . . . . . . . . . . . . . . . . . . . . . 37,963 62,993 74,416
Net Interest Income After Provision for Loan and Lease Losses . . . . . . . . . . 1,094,029 994,293 931,882
Other IncomeData Processing Services . . . . . . . . . . . . . . . . . . . . . . . . . . . . . . . . . . . . . . . . . 891,005 657,827 601,500Item Processing . . . . . . . . . . . . . . . . . . . . . . . . . . . . . . . . . . . . . . . . . . . . . . . . . 43,148 42,814 39,078Trust Services . . . . . . . . . . . . . . . . . . . . . . . . . . . . . . . . . . . . . . . . . . . . . . . . . . . 150,917 126,759 120,586Service Charges on Deposits . . . . . . . . . . . . . . . . . . . . . . . . . . . . . . . . . . . . . . . 99,772 102,528 100,796Gains on Sale of Mortgage Loans . . . . . . . . . . . . . . . . . . . . . . . . . . . . . . . . . . . 27,171 54,143 39,711Other Mortgage Banking Revenue . . . . . . . . . . . . . . . . . . . . . . . . . . . . . . . . . . 7,925 16,109 15,502Net Investment Securities Gains (Losses) . . . . . . . . . . . . . . . . . . . . . . . . . . . . 35,352 21,572 (6,271)Life Insurance Revenue . . . . . . . . . . . . . . . . . . . . . . . . . . . . . . . . . . . . . . . . . . . 27,254 30,507 29,783Other . . . . . . . . . . . . . . . . . . . . . . . . . . . . . . . . . . . . . . . . . . . . . . . . . . . . . . . . . 163,951 163,542 142,003
Total Other Income . . . . . . . . . . . . . . . . . . . . . . . . . . . . . . . . . . . . . . 1,446,495 1,215,801 1,082,688
Other ExpenseSalaries and Employee Benefits . . . . . . . . . . . . . . . . . . . . . . . . . . . . . . . . . . . . 887,279 797,518 745,518Net Occupancy . . . . . . . . . . . . . . . . . . . . . . . . . . . . . . . . . . . . . . . . . . . . . . . . . 77,209 67,626 74,706Equipment . . . . . . . . . . . . . . . . . . . . . . . . . . . . . . . . . . . . . . . . . . . . . . . . . . . . . 115,650 111,354 116,806Software Expenses . . . . . . . . . . . . . . . . . . . . . . . . . . . . . . . . . . . . . . . . . . . . . . . 50,021 44,747 44,210Processing Charges . . . . . . . . . . . . . . . . . . . . . . . . . . . . . . . . . . . . . . . . . . . . . . 52,239 48,295 39,316Supplies and Printing . . . . . . . . . . . . . . . . . . . . . . . . . . . . . . . . . . . . . . . . . . . . 23,581 22,118 20,131Professional Services . . . . . . . . . . . . . . . . . . . . . . . . . . . . . . . . . . . . . . . . . . . . . 43,763 44,429 38,441Shipping and Handling . . . . . . . . . . . . . . . . . . . . . . . . . . . . . . . . . . . . . . . . . . . 67,772 51,765 45,669Amortization of Intangibles . . . . . . . . . . . . . . . . . . . . . . . . . . . . . . . . . . . . . . . . 27,852 23,785 25,134Other . . . . . . . . . . . . . . . . . . . . . . . . . . . . . . . . . . . . . . . . . . . . . . . . . . . . . . . . . 250,192 240,070 146,047
Total Other Expense . . . . . . . . . . . . . . . . . . . . . . . . . . . . . . . . . . . . . 1,595,558 1,451,707 1,295,978
Income Before Income Taxes . . . . . . . . . . . . . . . . . . . . . . . . . . . . . . . . . . . . . . 944,966 758,387 718,592Provision for Income Taxes . . . . . . . . . . . . . . . . . . . . . . . . . . . . . . . . . . . . . . . . 317,880 214,282 238,265
Net Income . . . . . . . . . . . . . . . . . . . . . . . . . . . . . . . . . . . . . . . . . . . . . . . . . . . . $ 627,086 $ 544,105 $ 480,327
Net Income Per Common ShareBasic . . . . . . . . . . . . . . . . . . . . . . . . . . . . . . . . . . . . . . . . . . . . . . . . . . . . . . $ 2.81 $ 2.41 $ 2.24Diluted . . . . . . . . . . . . . . . . . . . . . . . . . . . . . . . . . . . . . . . . . . . . . . . . . . . . 2.77 2.38 2.16
The accompanying notes are an integral part of the Consolidated Financial Statements.
7 5
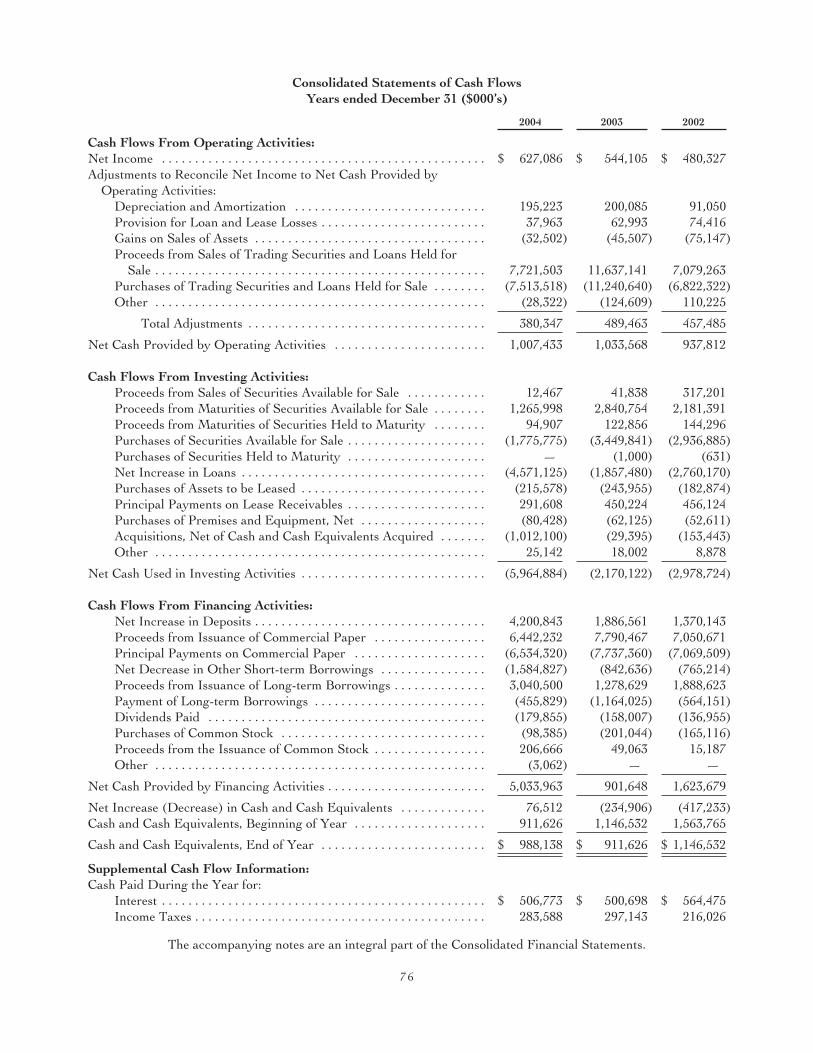
Consolidated Statements of Cash FlowsYears ended December 31 ($000’s)
2004 2003 2002
Cash Flows From Operating Activities:Net Income . . . . . . . . . . . . . . . . . . . . . . . . . . . . . . . . . . . . . . . . . . . . . . . . . $ 627,086 $ 544,105 $ 480,327Adjustments to Reconcile Net Income to Net Cash Provided by
Operating Activities:Depreciation and Amortization . . . . . . . . . . . . . . . . . . . . . . . . . . . . . 195,223 200,085 91,050Provision for Loan and Lease Losses . . . . . . . . . . . . . . . . . . . . . . . . . 37,963 62,993 74,416Gains on Sales of Assets . . . . . . . . . . . . . . . . . . . . . . . . . . . . . . . . . . . (32,502) (45,507) (75,147)Proceeds from Sales of Trading Securities and Loans Held for
Sale . . . . . . . . . . . . . . . . . . . . . . . . . . . . . . . . . . . . . . . . . . . . . . . . . . 7,721,503 11,637,141 7,079,263Purchases of Trading Securities and Loans Held for Sale . . . . . . . . (7,513,518) (11,240,640) (6,822,322)Other . . . . . . . . . . . . . . . . . . . . . . . . . . . . . . . . . . . . . . . . . . . . . . . . . . (28,322) (124,609) 110,225
Total Adjustments . . . . . . . . . . . . . . . . . . . . . . . . . . . . . . . . . . . . 380,347 489,463 457,485
Net Cash Provided by Operating Activities . . . . . . . . . . . . . . . . . . . . . . . 1,007,433 1,033,568 937,812
Cash Flows From Investing Activities:Proceeds from Sales of Securities Available for Sale . . . . . . . . . . . . 12,467 41,838 317,201Proceeds from Maturities of Securities Available for Sale . . . . . . . . 1,265,998 2,840,754 2,181,391Proceeds from Maturities of Securities Held to Maturity . . . . . . . . 94,907 122,856 144,296Purchases of Securities Available for Sale . . . . . . . . . . . . . . . . . . . . . (1,775,775) (3,449,841) (2,936,885)Purchases of Securities Held to Maturity . . . . . . . . . . . . . . . . . . . . . — (1,000) (631)Net Increase in Loans . . . . . . . . . . . . . . . . . . . . . . . . . . . . . . . . . . . . . (4,571,125) (1,857,480) (2,760,170)Purchases of Assets to be Leased . . . . . . . . . . . . . . . . . . . . . . . . . . . . (215,578) (243,955) (182,874)Principal Payments on Lease Receivables . . . . . . . . . . . . . . . . . . . . . 291,608 450,224 456,124Purchases of Premises and Equipment, Net . . . . . . . . . . . . . . . . . . . (80,428) (62,125) (52,611)Acquisitions, Net of Cash and Cash Equivalents Acquired . . . . . . . (1,012,100) (29,395) (153,443)Other . . . . . . . . . . . . . . . . . . . . . . . . . . . . . . . . . . . . . . . . . . . . . . . . . . 25,142 18,002 8,878
Net Cash Used in Investing Activities . . . . . . . . . . . . . . . . . . . . . . . . . . . . (5,964,884) (2,170,122) (2,978,724)
Cash Flows From Financing Activities:Net Increase in Deposits . . . . . . . . . . . . . . . . . . . . . . . . . . . . . . . . . . . 4,200,843 1,886,561 1,370,143Proceeds from Issuance of Commercial Paper . . . . . . . . . . . . . . . . . 6,442,232 7,790,467 7,050,671Principal Payments on Commercial Paper . . . . . . . . . . . . . . . . . . . . (6,534,320) (7,737,360) (7,069,509)Net Decrease in Other Short-term Borrowings . . . . . . . . . . . . . . . . (1,584,827) (842,636) (765,214)Proceeds from Issuance of Long-term Borrowings . . . . . . . . . . . . . . 3,040,500 1,278,629 1,888,623Payment of Long-term Borrowings . . . . . . . . . . . . . . . . . . . . . . . . . . (455,829) (1,164,025) (564,151)Dividends Paid . . . . . . . . . . . . . . . . . . . . . . . . . . . . . . . . . . . . . . . . . . (179,855) (158,007) (136,955)Purchases of Common Stock . . . . . . . . . . . . . . . . . . . . . . . . . . . . . . . (98,385) (201,044) (165,116)Proceeds from the Issuance of Common Stock . . . . . . . . . . . . . . . . . 206,666 49,063 15,187Other . . . . . . . . . . . . . . . . . . . . . . . . . . . . . . . . . . . . . . . . . . . . . . . . . . (3,062) — —
Net Cash Provided by Financing Activities . . . . . . . . . . . . . . . . . . . . . . . . 5,033,963 901,648 1,623,679
Net Increase (Decrease) in Cash and Cash Equivalents . . . . . . . . . . . . . 76,512 (234,906) (417,233)Cash and Cash Equivalents, Beginning of Year . . . . . . . . . . . . . . . . . . . . 911,626 1,146,532 1,563,765
Cash and Cash Equivalents, End of Year . . . . . . . . . . . . . . . . . . . . . . . . . $ 988,138 $ 911,626 $ 1,146,532
Supplemental Cash Flow Information:Cash Paid During the Year for:
Interest . . . . . . . . . . . . . . . . . . . . . . . . . . . . . . . . . . . . . . . . . . . . . . . . . $ 506,773 $ 500,698 $ 564,475Income Taxes . . . . . . . . . . . . . . . . . . . . . . . . . . . . . . . . . . . . . . . . . . . . 283,588 297,143 216,026
The accompanying notes are an integral part of the Consolidated Financial Statements.
7 6
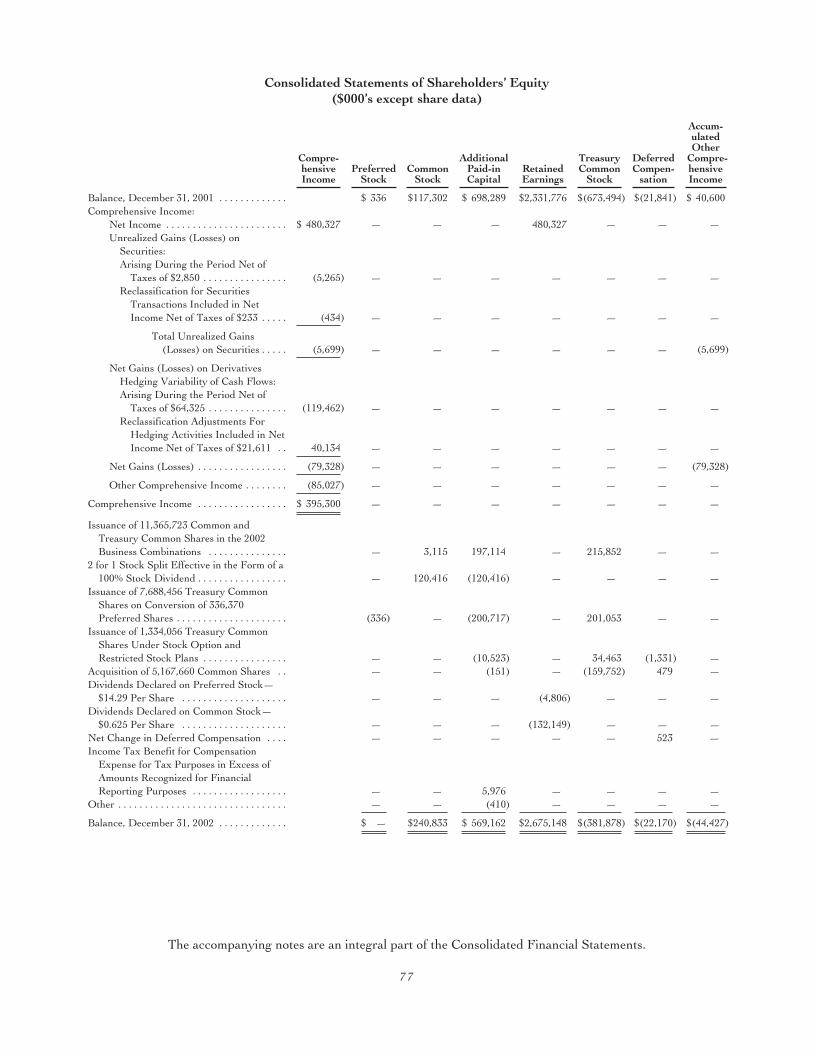
Consolidated Statements of Shareholders’ Equity($000’s except share data)
Compre-hensiveIncome
PreferredStock
CommonStock
AdditionalPaid-inCapital
RetainedEarnings
TreasuryCommon
Stock
DeferredCompen-
sation
Accum-ulatedOther
Compre-hensiveIncome
Balance, December 31, 2001 . . . . . . . . . . . . . $ 336 $117,302 $ 698,289 $2,331,776 $(673,494) $(21,841) $ 40,600Comprehensive Income:
Net Income . . . . . . . . . . . . . . . . . . . . . . . $ 480,327 — — — 480,327 — — —Unrealized Gains (Losses) on
Securities:Arising During the Period Net of
Taxes of $2,850 . . . . . . . . . . . . . . . . (5,265) — — — — — — —Reclassification for Securities
Transactions Included in NetIncome Net of Taxes of $233 . . . . . (434) — — — — — — —
Total Unrealized Gains(Losses) on Securities . . . . . (5,699) — — — — — — (5,699)
Net Gains (Losses) on DerivativesHedging Variability of Cash Flows:Arising During the Period Net of
Taxes of $64,325 . . . . . . . . . . . . . . . (119,462) — — — — — — —Reclassification Adjustments For
Hedging Activities Included in NetIncome Net of Taxes of $21,611 . . 40,134 — — — — — — —
Net Gains (Losses) . . . . . . . . . . . . . . . . . (79,328) — — — — — — (79,328)
Other Comprehensive Income . . . . . . . . (85,027) — — — — — — —
Comprehensive Income . . . . . . . . . . . . . . . . . $ 395,300 — — — — — — —
Issuance of 11,365,723 Common andTreasury Common Shares in the 2002Business Combinations . . . . . . . . . . . . . . . — 3,115 197,114 — 215,852 — —
2 for 1 Stock Split Effective in the Form of a100% Stock Dividend . . . . . . . . . . . . . . . . . — 120,416 (120,416) — — — —
Issuance of 7,688,456 Treasury CommonShares on Conversion of 336,370Preferred Shares . . . . . . . . . . . . . . . . . . . . . (336) — (200,717) — 201,053 — —
Issuance of 1,334,056 Treasury CommonShares Under Stock Option andRestricted Stock Plans . . . . . . . . . . . . . . . . — — (10,523) — 34,463 (1,331) —
Acquisition of 5,167,660 Common Shares . . — — (151) — (159,752) 479 —Dividends Declared on Preferred Stock—
$14.29 Per Share . . . . . . . . . . . . . . . . . . . . — — — (4,806) — — —Dividends Declared on Common Stock—
$0.625 Per Share . . . . . . . . . . . . . . . . . . . . — — — (132,149) — — —Net Change in Deferred Compensation . . . . — — — — — 523 —Income Tax Benefit for Compensation
Expense for Tax Purposes in Excess ofAmounts Recognized for FinancialReporting Purposes . . . . . . . . . . . . . . . . . . — — 5,976 — — — —
Other . . . . . . . . . . . . . . . . . . . . . . . . . . . . . . . . — — (410) — — — —
Balance, December 31, 2002 . . . . . . . . . . . . . $ — $240,833 $ 569,162 $2,675,148 $(381,878) $(22,170) $(44,427)
The accompanying notes are an integral part of the Consolidated Financial Statements.
7 7
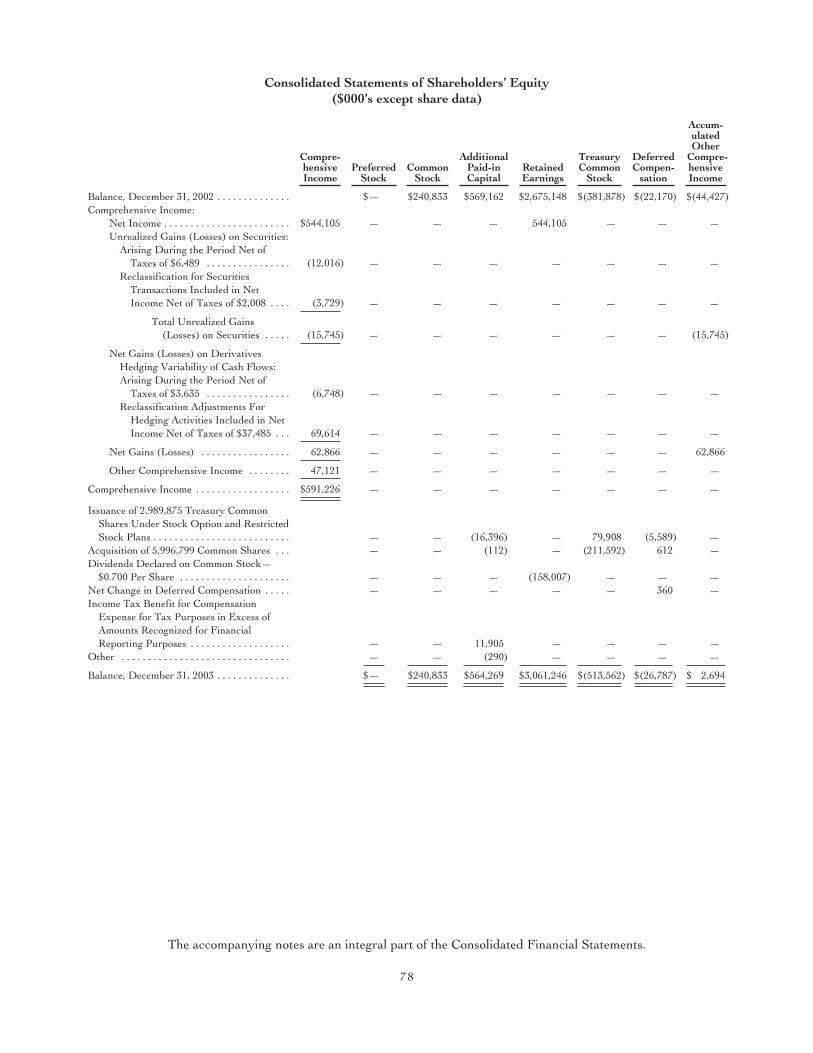
Consolidated Statements of Shareholders’ Equity($000’s except share data)
Compre-hensiveIncome
PreferredStock
CommonStock
AdditionalPaid-inCapital
RetainedEarnings
TreasuryCommon
Stock
DeferredCompen-
sation
Accum-ulatedOther
Compre-hensiveIncome
Balance, December 31, 2002 . . . . . . . . . . . . . . $— $240,833 $569,162 $2,675,148 $(381,878) $(22,170) $(44,427)Comprehensive Income:
Net Income . . . . . . . . . . . . . . . . . . . . . . . . $544,105 — — — 544,105 — — —Unrealized Gains (Losses) on Securities:
Arising During the Period Net ofTaxes of $6,489 . . . . . . . . . . . . . . . . (12,016) — — — — — — —
Reclassification for SecuritiesTransactions Included in NetIncome Net of Taxes of $2,008 . . . . (3,729) — — — — — — —
Total Unrealized Gains(Losses) on Securities . . . . . (15,745) — — — — — — (15,745)
Net Gains (Losses) on DerivativesHedging Variability of Cash Flows:Arising During the Period Net of
Taxes of $3,635 . . . . . . . . . . . . . . . . (6,748) — — — — — — —Reclassification Adjustments For
Hedging Activities Included in NetIncome Net of Taxes of $37,485 . . . 69,614 — — — — — — —
Net Gains (Losses) . . . . . . . . . . . . . . . . . 62,866 — — — — — — 62,866
Other Comprehensive Income . . . . . . . . 47,121 — — — — — — —
Comprehensive Income . . . . . . . . . . . . . . . . . . $591,226 — — — — — — —
Issuance of 2,989,875 Treasury CommonShares Under Stock Option and RestrictedStock Plans . . . . . . . . . . . . . . . . . . . . . . . . . . — — (16,396) — 79,908 (5,589) —
Acquisition of 5,996,799 Common Shares . . . — — (112) — (211,592) 612 —Dividends Declared on Common Stock—
$0.700 Per Share . . . . . . . . . . . . . . . . . . . . . — — — (158,007) — — —Net Change in Deferred Compensation . . . . . — — — — — 360 —Income Tax Benefit for Compensation
Expense for Tax Purposes in Excess ofAmounts Recognized for FinancialReporting Purposes . . . . . . . . . . . . . . . . . . . — — 11,905 — — — —
Other . . . . . . . . . . . . . . . . . . . . . . . . . . . . . . . . — — (290) — — — —
Balance, December 31, 2003 . . . . . . . . . . . . . . $— $240,833 $564,269 $3,061,246 $(513,562) $(26,787) $ 2,694
The accompanying notes are an integral part of the Consolidated Financial Statements.
7 8
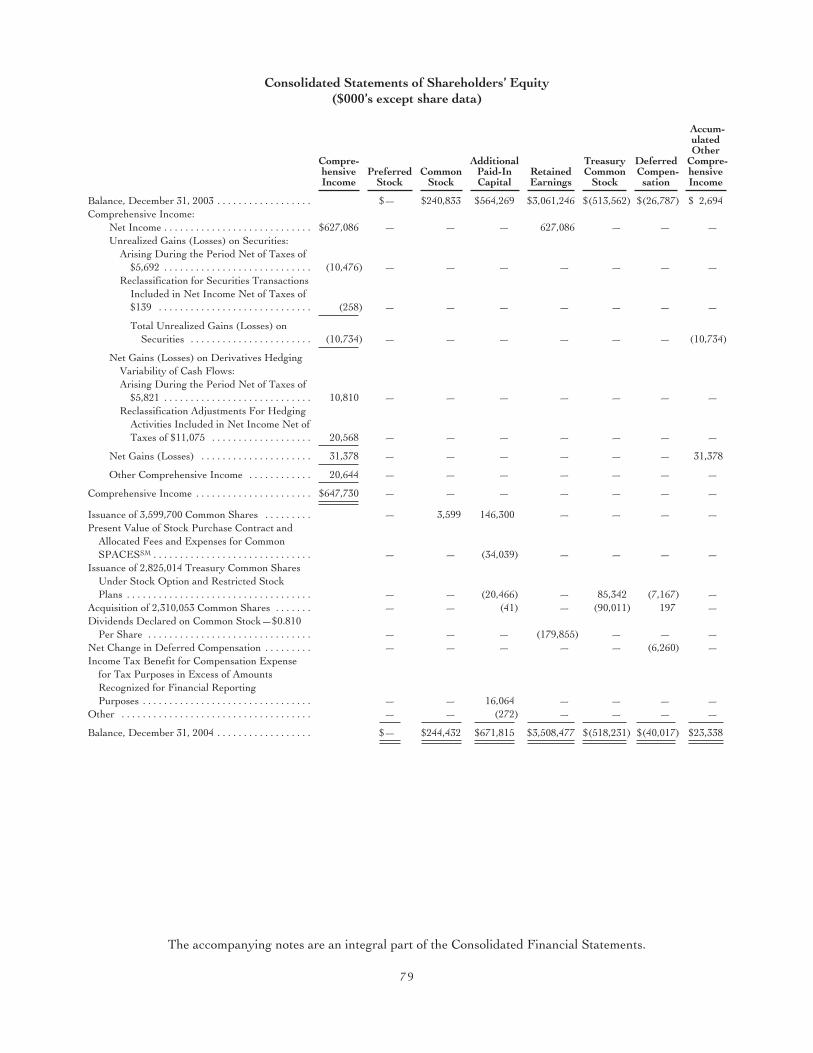
Consolidated Statements of Shareholders’ Equity($000’s except share data)
Compre-hensiveIncome
PreferredStock
CommonStock
AdditionalPaid-InCapital
RetainedEarnings
TreasuryCommon
Stock
DeferredCompen-sation
Accum-ulatedOther
Compre-hensiveIncome
Balance, December 31, 2003 . . . . . . . . . . . . . . . . . . $— $240,833 $564,269 $3,061,246 $(513,562) $(26,787) $ 2,694Comprehensive Income:
Net Income . . . . . . . . . . . . . . . . . . . . . . . . . . . . $627,086 — — — 627,086 — — —Unrealized Gains (Losses) on Securities:
Arising During the Period Net of Taxes of$5,692 . . . . . . . . . . . . . . . . . . . . . . . . . . . . (10,476) — — — — — — —
Reclassification for Securities TransactionsIncluded in Net Income Net of Taxes of$139 . . . . . . . . . . . . . . . . . . . . . . . . . . . . . (258) — — — — — — —
Total Unrealized Gains (Losses) onSecurities . . . . . . . . . . . . . . . . . . . . . . . (10,734) — — — — — — (10,734)
Net Gains (Losses) on Derivatives HedgingVariability of Cash Flows:Arising During the Period Net of Taxes of
$5,821 . . . . . . . . . . . . . . . . . . . . . . . . . . . . 10,810 — — — — — — —Reclassification Adjustments For Hedging
Activities Included in Net Income Net ofTaxes of $11,075 . . . . . . . . . . . . . . . . . . . 20,568 — — — — — — —
Net Gains (Losses) . . . . . . . . . . . . . . . . . . . . . 31,378 — — — — — — 31,378
Other Comprehensive Income . . . . . . . . . . . . 20,644 — — — — — — —
Comprehensive Income . . . . . . . . . . . . . . . . . . . . . . $647,730 — — — — — — —
Issuance of 3,599,700 Common Shares . . . . . . . . . — 3,599 146,300 — — — —Present Value of Stock Purchase Contract and
Allocated Fees and Expenses for CommonSPACESSM . . . . . . . . . . . . . . . . . . . . . . . . . . . . . . — — (34,039) — — — —
Issuance of 2,825,014 Treasury Common SharesUnder Stock Option and Restricted StockPlans . . . . . . . . . . . . . . . . . . . . . . . . . . . . . . . . . . . — — (20,466) — 85,342 (7,167) —
Acquisition of 2,310,053 Common Shares . . . . . . . — — (41) — (90,011) 197 —Dividends Declared on Common Stock—$0.810
Per Share . . . . . . . . . . . . . . . . . . . . . . . . . . . . . . . — — — (179,855) — — —Net Change in Deferred Compensation . . . . . . . . . — — — — — (6,260) —Income Tax Benefit for Compensation Expense
for Tax Purposes in Excess of AmountsRecognized for Financial ReportingPurposes . . . . . . . . . . . . . . . . . . . . . . . . . . . . . . . . — — 16,064 — — — —
Other . . . . . . . . . . . . . . . . . . . . . . . . . . . . . . . . . . . . — — (272) — — — —
Balance, December 31, 2004 . . . . . . . . . . . . . . . . . . $— $244,432 $671,815 $3,508,477 $(518,231) $(40,017) $23,338
The accompanying notes are an integral part of the Consolidated Financial Statements.
7 9
Notes to Consolidated Financial Statements
December 31, 2004, 2003, and 2002 ($000’s except share data)
Marshall & Ilsley Corporation (“M&I” or the “Corporation”) is a bank holding company that providesdiversified financial services to a wide variety of corporate, institutional, government and individual customers.M&I’s largest affiliates and principal operations are in Wisconsin; however, it has activities in other markets,particularly in certain neighboring midwestern states, and in Arizona, Nevada and Florida. The Corporation’sprincipal activities consist of banking and data processing services. Banking services, lending and acceptingdeposits from retail and commercial customers are provided through its lead bank, M&I Marshall & Ilsley Bank(“M&I Bank”), which is headquartered in Wisconsin, one federally chartered thrift headquartered in Nevada, onestate chartered bank headquartered in St. Louis, Missouri, and an asset-based lending subsidiary headquartered inMinneapolis, Minnesota. In addition to branches located throughout Wisconsin, banking services are provided inbranches located throughout Arizona, the Minneapolis, Minnesota and St. Louis, Missouri metropolitan areas,Belleville, Illinois, Las Vegas, Nevada and Naples and Bonita Springs, Florida, as well as on the Internet. Financialand data processing services and software sales are provided through the Corporation’s subsidiary MetavanteCorporation (“Metavante”) and its nonbank subsidiaries primarily to financial institutions throughout the UnitedStates. Other financial services provided by M&I include: personal property lease financing to consumer andcommercial customers; investment management and advisory services; commercial and residential mortgagebanking; venture capital and financial advisory services; trust services to residents of Wisconsin, Arizona,Minnesota, Missouri, Florida, North Carolina, Nevada and Illinois; and brokerage and insurance services.
1. Summary of Significant Accounting Policies
Estimates—The preparation of financial statements in conformity with accounting principles generally acceptedin the United States requires management to make estimates and assumptions that affect the reported amounts ofassets and liabilities and disclosure of contingent assets and liabilities at the date of the financial statements and thereported amounts of revenues and expenses during the reported periods. Actual results could differ from thoseestimates.
Consolidation principles—The Consolidated Financial Statements include the accounts of the Corporation, itssubsidiaries that are wholly or majority owned and/or over which it exercises substantive control and significantvariable interest entities for which the Corporation has determined that, based on the variable interests it holds, it isthe primary beneficiary in accordance with Financial Accounting Standards Board (“FASB”) Interpretation No. 46(“FIN 46R”), Consolidation of Variable Interest Entities an interpretation of Accounting Research Board (“ARB”)No. 51 (revised December 2003). The primary beneficiary of a variable interest entity is the party that absorbs amajority of an entity’s expected losses, receives a majority of an entity’s expected residual returns, or both, as aresult of holding variable interests. Variable interests are the ownership, contractual or other pecuniary interests inan entity. Investments in unconsolidated affiliates, in which the Corporation has 20 percent or more ownershipinterest and has the ability to exercise significant influence, but not substantive control, over the affiliates’ operatingand financial policies, are accounted for using the equity method of accounting, unless the investment has beendetermined to be temporary. All significant intercompany balances and transactions are eliminated in consolidation.
The Corporation utilizes certain financing arrangements to meet its balance sheet management, funding,liquidity, and market or credit risk management needs. The majority of these activities are basic term or revolvingsecuritization facilities. These facilities are generally funded through term-amortizing debt structures or with short-term commercial paper designed to be paid off based on the underlying cash flows of the assets securitized. Thesefinancing entities are contractually limited to a narrow range of activities that facilitate the transfer of or access tovarious types of assets or financial instruments. In certain situations, the Corporation provides liquidity and/or lossprotection agreements. In determining whether the financing entity should be consolidated, the Corporationconsiders whether the entity is a qualifying special-purpose entity (“QSPE”) as defined in Statement of FinancialAccounting Standards No. 140 (“SFAS 140”), Accounting for Transfers and Servicing of Financial Assets andExtinguishments of Liabilities. For non-consolidation, a QSPE must be demonstrably distinct, have significantlylimited permitted activities, hold assets that are restricted to transferred financial assets and related assets, and cansell or dispose of non-cash financial assets only in response to specified conditions.
8 0
Notes to Consolidated Financial Statements—(Continued)
December 31, 2004, 2003, and 2002 ($000’s except share data)
Certain amounts in the 2003 and 2002 Consolidated Financial Statements have been reclassified to conform tothe 2004 presentation.
Cash and cash equivalents—For purposes of the Consolidated Financial Statements, the Corporation defines cashand cash equivalents as short-term investments, which have an original maturity of three months or less and arereadily convertible into cash.
Securities—Securities, when purchased, are designated as Trading, Investment Securities Held to Maturity, orInvestment Securities Available for Sale and remain in that category until they are sold or mature. The specificidentification method is used in determining the cost of securities sold.
Trading Securities are carried at fair value, with adjustments to the carrying value reflected in theConsolidated Statements of Income. Investment Securities Held to Maturity are carried at cost, adjusted foramortization of premiums and accretion of discounts. The Corporation designates investment securities as held tomaturity only when it has the positive intent and ability to hold them to maturity. All other securities are classifiedas Investment Securities Available for Sale and are carried at fair value with fair value adjustments net of therelated income tax effects reported as a component of Accumulated Other Comprehensive Income in theConsolidated Balance Sheets.
Loans held for sale—Loans held for sale are carried at the lower of cost or market, determined on an aggregatebasis, based on outstanding firm commitments received for such loans or on current market prices.
Loans and leases—Interest on loans, other than direct financing leases, is recognized as income based on the loanprincipal outstanding during the period. Unearned income on financing leases is recognized over the lease term on abasis that results in an approximate level rate of return on the lease investment. Loans are generally placed onnonaccrual status when they are past due 90 days as to either interest or principal. When a loan is placed onnonaccrual status, previously accrued and uncollected interest is charged to interest income on loans. A nonaccrualloan may be restored to an accrual basis when interest and principal payments are brought current and collectibilityof future payments is not in doubt.
The Corporation defers and amortizes fees and certain incremental direct costs, primarily salary and employeebenefit expenses, over the contractual term of the loan or lease as an adjustment to the yield. The unamortized netfees and costs are reported as part of the loan or lease balance outstanding.
The Corporation periodically reviews the residual values associated with its leasing portfolios. Declines inresidual values that are judged to be other than temporary are recognized as a loss resulting in a reduction in the netinvestment in the lease.
Loan servicing—Fees related to the servicing of mortgage loans are recorded as income when payments arereceived from mortgagors. Fees related to the servicing of other loans are recorded as income when earned. TheCorporation recognizes as separate assets rights to service loans when the loans are originated and sold withservicing retained, unless the contractual servicing fee is deemed to be adequate compensation. Since mostresidential loans have been sold with servicing released, loan servicing rights were not significant at December 31,2004 or 2003.
Allowance for loan and lease losses—The allowance for loan and lease losses is maintained at a level believedadequate by management to absorb estimated probable losses in the loan and lease portfolio including loans thathave been determined to be impaired. For impaired loans, impairment is measured using one of three alternatives:(1) the present value of expected future cash flows discounted at the loan’s effective interest rate; (2) the loan’sobservable market price, if available; or (3) the fair value of the collateral for collateral dependent loans and loansfor which foreclosure is deemed to be probable. Management’s determination of the adequacy of the allowance is
8 1

Notes to Consolidated Financial Statements—(Continued)
December 31, 2004, 2003, and 2002 ($000’s except share data)
based on a continual review of the loan and lease portfolio, loan and lease loss experience, economic conditions,growth and composition of the portfolio, and other relevant factors. As a result of management’s continual review,the allowance is adjusted through provisions for loan and lease losses charged against income.
Financial asset sales—The Corporation sells financial assets, in a two-step process that results in a surrender ofcontrol over the assets as evidenced by true-sale opinions from legal counsel, to unconsolidated entities thatsecuritize the assets. The Corporation retains interests in the securitized assets in the form of interest-only stripsand a cash reserve account. Gain or loss on sale of the assets depends in part on the carrying amount assigned to theassets sold allocated between the asset sold and retained interests based on their relative fair values at the date oftransfer. The value of the retained interests is based on the present value of expected cash flows estimated usingmanagement’s best estimates of the key assumptions—credit losses, prepayment speeds, forward yield curves anddiscount rates commensurate with the risks involved.
Premises and equipment—Land is recorded at cost. Premises and equipment are recorded at cost and depreciatedprincipally on the straight-line method with annual rates varying from 10 to 50 years for buildings and 3 to 10 yearsfor equipment. Long-lived assets which are impaired are carried at fair value and long-lived assets to be disposed ofare carried at the lower of the carrying amount or fair value less cost to sell. Maintenance and repairs are charged toexpense and betterments are capitalized.
Other real estate owned—Other real estate owned consists primarily of assets that have been acquired insatisfaction of debts. Other real estate owned is recorded at fair value, less estimated selling costs, at the date oftransfer. Valuation adjustments required at the date of transfer for assets acquired in satisfaction of debts arecharged to the allowance for loan and lease losses. Subsequent to transfer, other real estate owned is carried at thelower of cost or fair value, less estimated selling costs, based upon periodic evaluations. Rental income fromproperties and gains on sales are included in other income, and property expenses, which include carrying costs,required valuation adjustments and losses on sales, are recorded in other expense. At December 31, 2004 and 2003,total other real estate owned amounted to $8,056 and $13,235, respectively.
Data processing services—Data processing and related revenues are recognized as services are performed basedon amounts billable under the contracts. Processing services performed that have not been billed to customers areaccrued. Revenue includes shipping and handling costs associated with such income producing activities.
Revenues attributable to the licensing of software are generally recognized upon delivery and performance ofcertain contractual obligations, provided that no significant vendor obligations remain and collection of the resultingreceivable is deemed probable. Service revenues from customer maintenance fees for ongoing customer support andproduct updates are recognized ratably over the term of the maintenance period. Service revenues from trainingand consulting are recognized when the services are performed. Conversion revenues associated with theconversion of customers’ processing systems to Metavante’s processing systems are deferred and amortized over theperiod of the related processing contract, which on average is approximately five years. Deferred revenues, whichare included in Accrued Expenses and Other Liabilities in the Consolidated Balance Sheets, amounted to $97,434and $48,620 at December 31, 2004 and 2003, respectively.
Capitalized software and conversions—Direct costs associated with the production of computer software which willbe licensed externally or used in a service bureau environment are capitalized and amortized on the straight-linemethod over the estimated economic life of the product, generally four years. Such capitalized costs are periodicallyevaluated for impairment and adjusted to net realizable value when impairment is indicated. Direct costs associatedwith customer system conversions to the data services operations are capitalized and amortized on the straight-linemethod over the terms of the related servicing contract. Routine maintenance of software products, design costs anddevelopment costs incurred prior to establishment of a product’s technological feasibility for software to be sold, areexpensed as incurred.
8 2

Notes to Consolidated Financial Statements—(Continued)
December 31, 2004, 2003, and 2002 ($000’s except share data)
Net unamortized costs, which are included in Accrued Interest and Other Assets in the Consolidated BalanceSheets, at December 31 were:
2004 2003
Software . . . . . . . . . . . . . . . . . . . . . . . . . . . . . . . . . . . . . . . . . . . . . . . . . . . . . . . . . . . . . $161,078 $133,602Conversions . . . . . . . . . . . . . . . . . . . . . . . . . . . . . . . . . . . . . . . . . . . . . . . . . . . . . . . . . . 26,524 30,678
Total . . . . . . . . . . . . . . . . . . . . . . . . . . . . . . . . . . . . . . . . . . . . . . . . . . . . . . . . . . . . $187,602 $164,280
Amortization expense, which includes software write-downs, was $72,527, $82,076 and $53,507, for 2004, 2003and 2002, respectively. During 2004, Metavante determined that certain products had limited growth potential. Basedon strategic product reviews and the results of net realizable tests performed on these products, it was determined thatthe capitalized software and other assets associated with those products were impaired. Total capitalized softwarecosts written off amounted to $8,662 for the year ended December 31, 2004. As a result of a shift in product strategy,Metavante determined that certain internally developed software would no longer be used and wrote-off $21,236 ofsuch software in 2003. There were no significant write-downs or impairment charges in 2002.
Goodwill and other intangibles—Goodwill arising from business combinations ceased to be amortized on January1, 2002 upon the adoption of Statement of Financial Accounting Standards No. 142 (“SFAS 142”), Goodwill andOther Intangible Assets.
The Corporation annually tests goodwill for impairment using a two-step process that begins with anestimation of the fair value of a reporting unit. For purposes of the test, the Corporation’s reporting units are theoperating segments as defined in Statement of Financial Accounting Standards No. 131, Disclosures about Segmentsof an Enterprise and Related Information. The first step is a screen for potential impairment and the second stepmeasures the amount of impairment, if any. See Note 11 for additional information.
Identifiable intangibles arising from purchase acquisitions with a finite useful life are amortized over theiruseful lives and consist of core deposit intangibles, contract rights, tradenames and customer lists.
Identifiable intangibles that have been determined to have an indefinite useful life are not amortized but aresubject to periodic tests for impairment. At December 31, 2004, the Corporation did not have any identifiableintangibles that have been determined to have an indefinite useful life.
Derivative financial instruments—Derivative financial instruments, including certain derivative instrumentsembedded in other contracts, are carried in the Consolidated Balance Sheets as either an asset or liability measuredat its fair value. The fair value of the Corporation’s derivative financial instruments is determined based on quotedmarket prices for comparable transactions, if available, or a valuation model that calculates the present value ofexpected future cash flows.
Changes in the fair value of derivative financial instruments are recognized currently in earnings unless specifichedge accounting criteria are met. For derivative financial instruments designated as hedging the exposure tochanges in the fair value of a recognized asset or liability (fair value hedge), the gain or loss is recognized inearnings in the period of change together with the offsetting loss or gain on the hedged item attributable to the riskbeing hedged. For derivative financial instruments designated as hedging the exposure to variable cash flows of aforecasted transaction (cash flow hedge), the effective portion of the derivative financial instrument’s gain or loss isinitially reported as a component of accumulated other comprehensive income and is subsequently reclassified intoearnings when the forecasted transaction affects earnings. The ineffective portion of the gain or loss is reported inearnings immediately.
At inception of a hedge, the Corporation formally documents the hedging relationship as well as theCorporation’s risk management objective and strategy for undertaking the hedge, including identification of thehedging instrument, the hedged transaction, the nature of the risk being hedged, and how the hedging instrument’seffectiveness in hedging the exposure will be assessed.
8 3

Notes to Consolidated Financial Statements—(Continued)
December 31, 2004, 2003, and 2002 ($000’s except share data)
The adjustment of the carrying amount of an interest bearing hedged asset or liability in a fair value hedge isamortized into earnings when the hedged item ceases to be adjusted for changes in its fair value attributable to therisk being hedged.
If a cash flow hedge is discontinued because it is probable that the original forecasted transaction will notoccur, the net gain or loss in accumulated other comprehensive income is immediately reclassified into earnings. Ifthe cash flow hedge is sold, terminated, expires or the designation of the cash flow hedge is removed, the net gain orloss in accumulated other comprehensive income is reclassified into earnings in the same period or periods duringwhich the hedged forecasted transaction affects earnings.
Cash flows from derivative financial instruments are reported in the Consolidated Statements of Cash Flows asoperating activities.
Foreign exchange contracts—Foreign exchange contracts include such commitments as foreign currency spot,forward, future and option contracts. Foreign exchange contracts and the premiums on options written or sold arecarried at market value with changes in market value included in other income.
Treasury stock—Treasury stock acquired is recorded at cost and is carried as a reduction of shareholders’ equityin the Consolidated Balance Sheets. Treasury stock issued is valued based on average cost. The difference betweenthe consideration received upon issuance and the average cost is charged or credited to additional paid-in capital.
New accounting pronouncements—In December 2004, the FASB issued Statement of Financial AccountingStandards No. 123 (revised 2004), Share-Based Payment (“SFAS 123(R)”). SFAS 123(R) replaces FASBstatement No.123, Accounting for Stock-Based Compensation (“SFAS 123”), and supercedes Accounting PrinciplesBoard Opinion No. 25 (“APBO 25”), Accounting for Stock Issued to Employees. Statement 123(R) requires thatcompensation cost relating to share-based payment transactions be recognized in financial statements. That cost ismeasured based on the fair value of the equity or liability instruments issued. Statement 123(R) covers a wide rangeof share-based compensation arrangements including share options, restricted share plans, performance-basedawards, share appreciation rights, and employee share purchase plans. Statement 123(R) also provides guidance onmeasuring the fair value of share-based payment awards. The Corporation will be required to adopt Statement123(R) beginning in the third quarter of 2005.
As permitted under SFAS 123, the Corporation elected to measure and account for share-based compensationcost using the intrinsic value based method of accounting prescribed in APBO 25 and provide the required proforma disclosures. Under the intrinsic value based method, compensation cost is the excess, if any, of the quotedmarket price of the stock at grant date or other measurement date over the amount paid to acquire the stock.
The largest differences between SFAS 123(R) and APBO 25 as it relates to the Corporation is the amount ofcompensation cost attributable to the Corporation’s fixed stock option plans and employee stock purchase plan(“ESPP”). Under APBO 25 no compensation cost is recognized for fixed stock option plans because the exerciseprice is equal to the quoted market price at the date of grant and therefore there is no intrinsic value. SFAS 123(R)compensation cost would equal the calculated fair value of the options granted. Under APBO 25 no compensationcost is recognized for the ESPP because the discount and the plan meets the definition of a qualified plan of theInternal Revenue Code and meets the requirements of APBO 25. Under SFAS 123(R) the Corporation’s ESPP iscompensatory because the plan has a provision that establishes the purchase price as an amount based on the lesserof the Corporation’s common stock price at date of grant or at date of purchase. SFAS 123(R) compensation costwould be approximately equal to the initial discount (15% of beginning of plan period price per share) plus thevalue of a one year call option on 85% of a share of common stock for each share purchased.
In contemplation of the adoption of SFAS 123(R) the Corporation, with the assistance of an independentvaluation firm, reviewed the various permitted methods of determining the estimated fair value of its fixed stockoption plans and concluded that a form of lattice stock option pricing model produces the most representative
8 4
Notes to Consolidated Financial Statements—(Continued)
December 31, 2004, 2003, and 2002 ($000’s except share data)
estimate of fair value for its fixed stock option plans. For purposes of providing the required pro forma disclosuresunder SFAS 123 and recording compensation cost under SFAS 123(R), all fixed stock options granted afterSeptember 30, 2004 were valued using the form of lattice stock option pricing model. Fixed stock options grantedbefore September 30, 2004 were valued using a Black-Scholes closed form option-pricing model.
The Corporation has not yet determined if it will elect the Modified Retrospective Application which wouldresult in adjustments to financial statements for all prior periods for which SFAS 123 was effective to give effect tothe fair-value-based method of accounting for awards granted, modified, or settled in cash in fiscal years beginningafter December 15, 1994. Such adjustments must be on a basis consistent with the pro forma disclosures previouslyprovided.
See Note 17, Stock Option, Restricted Stock and Employee Stock Purchase Plans, for a description of theCorporation’s plans and the pro forma effect of the fair-value-based method of accounting for awards granted,modified, or settled in cash in fiscal years beginning after December 15,1994.
On March 31, 2004, the Financial Accounting Standards Board (“FASB”) ratified the consensuses reached bythe Emerging Issues Task Force (“EITF”) in EITF Issue No. 03-1, The Meaning of Other-Than-TemporaryImpairment and Its Application to Certain Investments (“Issue 03-1”). Issue 03-1 provides guidance that should beused to determine when an investment is considered impaired, whether that impairment is other than temporary,and the measurement of an impairment loss. The guidance also includes accounting considerations subsequent torecognition of an other-than-temporary impairment and requires certain disclosures about unrealized losses thathave not been recognized as other-than-temporary impairments.
For equity securities (including cost method investments) and debt securities that can be contractually prepaidor otherwise settled in such a way that the investor would not recover substantially all of its cost, an impairmentshould be deemed other than temporary unless (a) the investor has the ability and intent to hold an investment for areasonable period of time sufficient for a forecasted recovery of fair value up to the cost of the investment, and (b)evidence indicating the cost of the investment is recoverable within a reasonable period of time outweighs evidenceto the contrary.
For debt securities that can not be contractually prepaid or otherwise settled in such a way that the investorwould not recover substantially all of its cost, an impairment should be deemed other than temporary if (a) theinvestor does not have the ability and intent to hold an investment until a forecasted recovery of fair value up to thecost of the investment, which in certain cases may mean until maturity, or (b) it is probable that the investor will beunable to collect all amounts due according to the contractual terms of the debt security.
Although not presumptive, a pattern of selling investments prior to the forecasted recovery of fair value maycall into question the investor’s intent.
The guidance for evaluating whether an investment is other-than-temporarily impaired was to be applied toother-than-temporary impairment evaluations made in reporting periods beginning after June 15, 2004. OnSeptember 30, 2004, the FASB voted unanimously to defer the effective date of certain paragraphs of Issue 03-1which effectively deferred application of Issue 03-1’s guidance on how to evaluate and recognize an impairment lossthat is other than temporary which includes debt securities that are impaired solely because of interest rate and/orsector spread increases.
The deferral is not a suspension of the accounting requirements that currently exist. The disclosurerequirements were not affected by the deferral. The delay of the effective date of certain paragraphs of Issue 03-1will be superseded concurrent with the final issuance of a FASB Staff Position that will provide implementationguidance for securities analyzed for impairment under those paragraphs of Issue 03-1.
As shown in Note 6, at December 31, 2004 the Corporation had gross unrealized losses associated with itsinvestment securities portfolios of $16.0 million. Of that amount, $12.3 million has been in a continuous unrealized
8 5
Notes to Consolidated Financial Statements—(Continued)
December 31, 2004, 2003, and 2002 ($000’s except share data)
loss position for less than twelve months. The Corporation believes that the unrealized losses are predominantly theresult of increases in market interest rates and it is probable that the Corporation will collect all amounts dueaccording to the contractual terms of the investment securities.
In December 2003, the Accounting Standards Executive Committee issued Statement of Position 03-3 (“SOP03-3”), Accounting for Certain Loans or Debt Securities Acquired in a Transfer. SOP 03-3 addresses accounting fordifferences between contractual cash flows and cash flows expected to be collected from an investor’s initialinvestment in loans or debt securities acquired in a transfer if those differences are attributable, at least in part, tocredit quality. It includes loans or debt securities acquired individually, in a pool or group or in a purchase businesscombination. SOP 03-3 does not apply to loans originated by an entity. SOP 03-3 limits the yield that may beaccreted (accretable yield) to the excess of the investor’s estimate of undiscounted expected principal, interest andother cash flows over the investor’s initial investment in the loan. The excess of contractual cash flows over theestimated expected cash flows to be collected (nonaccretable difference) cannot be recognized as an adjustment ofthe yield, loss accrual or valuation allowance at the date of transfer. Subsequent increases in cash flows expected tobe collected generally will be recognized prospectively through an adjustment to the yield over the remaining life.Subsequent decreases in cash flows expected to be collected will be recognized as impairment.
SOP 03-3 prohibits investors from displaying accretable yield or nonaccretable difference in the balance sheetand also prohibits carrying over or creation of a valuation allowance in the initial accounting of all loans acquired ina transfer that are within the scope of SOP 03-3. The prohibition of the valuation allowance carryover applies to thepurchase of an individual loan, pool or group of loans and loans acquired in a business combination.
SOP 03-3 is effective for loans acquired in fiscal years beginning after December 15, 2004. The Corporationanticipates that earnings volatility could increase based on the periodic changes in accretable yield and non-accretable difference that can arise from revised cash flow projections.
2. Changes in Method of Accounting
On December 31, 2003, the Corporation adopted FIN 46 and FIN 46R, Consolidation of Variable InterestEntities an interpretation of ARB No. 51 (revised December 2003). While the Corporation determined it had variableinterests in variable interest entities, the Corporation concluded that it was not the primary beneficiary as thoseterms are defined in FIN 46 and FIN 46R and therefore, no new entities were required to be included in theconsolidated financial statements of the Corporation as of December 31, 2003. However, the Corporationconcluded that it should de-consolidate the special purpose entity, M&I Capital Trust A (the “Trust”), that wasformed in 1996 to issue cumulative preferred capital securities and holds, as its sole asset, junior subordinateddeferrable interest debentures (subordinated debt) issued by the Corporation. As a matter of policy, theCorporation has always elected to classify the guaranteed preferred beneficial interests in the Trust as long-termborrowings and the semi-annual distributions as interest expense for financial reporting purposes in prior periodswhen the accounts of the Trust were included in the Corporation’s consolidated financial statements. At December31, 2003, the junior subordinated deferrable interest debentures (subordinated debt) issued by the Corporation areincluded in long-term borrowings (see Note 14) and are shown net of the portion attributable to the commoninterest in the Trust which is held by the Corporation. Therefore, there was no significant impact on theconsolidated financial statements from de-consolidating the Trust.
For further discussion relating to the variable interests the Corporation holds in variable interest entities seeNote 9.
8 6
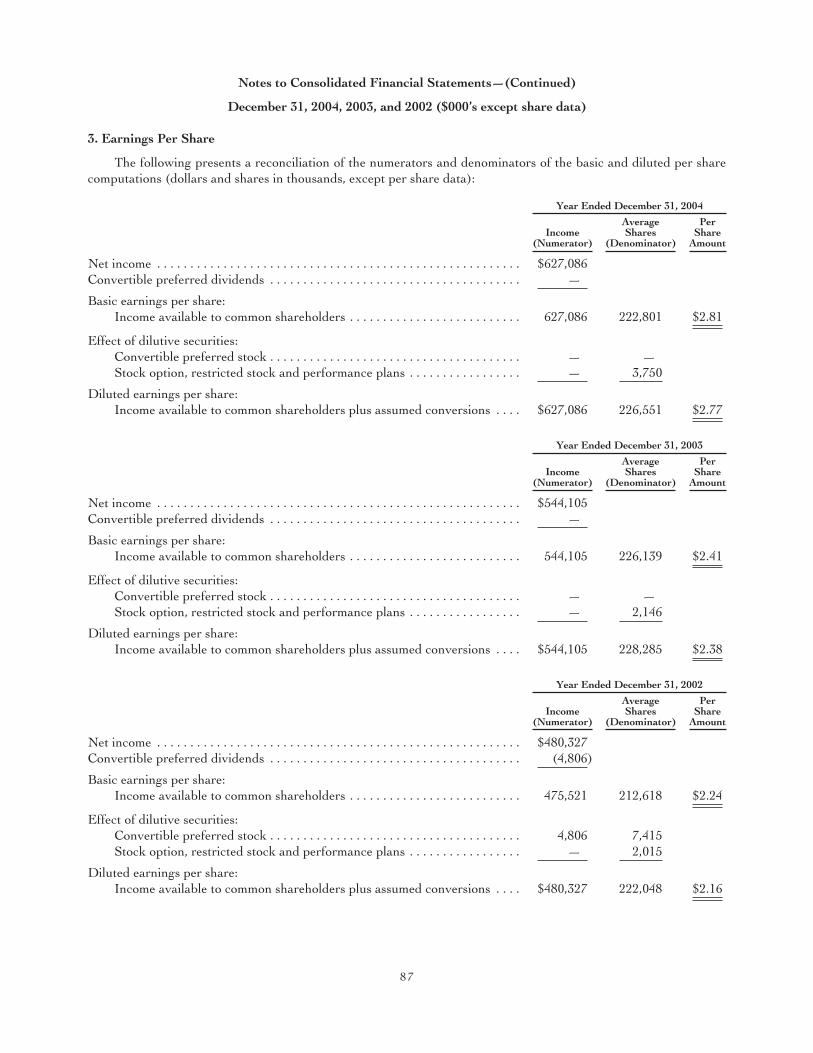
Notes to Consolidated Financial Statements—(Continued)
December 31, 2004, 2003, and 2002 ($000’s except share data)
3. Earnings Per Share
The following presents a reconciliation of the numerators and denominators of the basic and diluted per sharecomputations (dollars and shares in thousands, except per share data):
Year Ended December 31, 2004
Income(Numerator)
AverageShares
(Denominator)
PerShare
Amount
Net income . . . . . . . . . . . . . . . . . . . . . . . . . . . . . . . . . . . . . . . . . . . . . . . . . . . . . . . $627,086Convertible preferred dividends . . . . . . . . . . . . . . . . . . . . . . . . . . . . . . . . . . . . . . —
Basic earnings per share:Income available to common shareholders . . . . . . . . . . . . . . . . . . . . . . . . . . 627,086 222,801 $2.81
Effect of dilutive securities:Convertible preferred stock . . . . . . . . . . . . . . . . . . . . . . . . . . . . . . . . . . . . . . — —Stock option, restricted stock and performance plans . . . . . . . . . . . . . . . . . — 3,750
Diluted earnings per share:Income available to common shareholders plus assumed conversions . . . . $627,086 226,551 $2.77
Year Ended December 31, 2003
Income(Numerator)
AverageShares
(Denominator)
PerShare
Amount
Net income . . . . . . . . . . . . . . . . . . . . . . . . . . . . . . . . . . . . . . . . . . . . . . . . . . . . . . . $544,105Convertible preferred dividends . . . . . . . . . . . . . . . . . . . . . . . . . . . . . . . . . . . . . . —
Basic earnings per share:Income available to common shareholders . . . . . . . . . . . . . . . . . . . . . . . . . . 544,105 226,139 $2.41
Effect of dilutive securities:Convertible preferred stock . . . . . . . . . . . . . . . . . . . . . . . . . . . . . . . . . . . . . . — —Stock option, restricted stock and performance plans . . . . . . . . . . . . . . . . . — 2,146
Diluted earnings per share:Income available to common shareholders plus assumed conversions . . . . $544,105 228,285 $2.38
Year Ended December 31, 2002
Income(Numerator)
AverageShares
(Denominator)
PerShare
Amount
Net income . . . . . . . . . . . . . . . . . . . . . . . . . . . . . . . . . . . . . . . . . . . . . . . . . . . . . . . $480,327Convertible preferred dividends . . . . . . . . . . . . . . . . . . . . . . . . . . . . . . . . . . . . . . (4,806)
Basic earnings per share:Income available to common shareholders . . . . . . . . . . . . . . . . . . . . . . . . . . 475,521 212,618 $2.24
Effect of dilutive securities:Convertible preferred stock . . . . . . . . . . . . . . . . . . . . . . . . . . . . . . . . . . . . . . 4,806 7,415Stock option, restricted stock and performance plans . . . . . . . . . . . . . . . . . — 2,015
Diluted earnings per share:Income available to common shareholders plus assumed conversions . . . . $480,327 222,048 $2.16
8 7
Notes to Consolidated Financial Statements—(Continued)
December 31, 2004, 2003, and 2002 ($000’s except share data)
Options to purchase shares of common stock not included in the computation of diluted net income per sharebecause the options’ exercise price was greater than the average market price of the common shares for the yearsended December 31, are as follows:
Year Ended December 31, Price Range Shares
2004 . . . . . . . . . . . . . . . . . . . . . . . . . . . . . . . . . . . . . . . . . . . . . . . . . . . . . . . . . . . . $39.910—$44.200 3,4742003 . . . . . . . . . . . . . . . . . . . . . . . . . . . . . . . . . . . . . . . . . . . . . . . . . . . . . . . . . . . . 31.045— 38.250 7,0212002 . . . . . . . . . . . . . . . . . . . . . . . . . . . . . . . . . . . . . . . . . . . . . . . . . . . . . . . . . . . . 29.700— 33.938 6,411
4. Business Combinations
The following acquisitions, which were not considered material business combinations individually or in theaggregate, were completed during 2004:
On November 22, 2004, Metavante completed the acquisition of all of the outstanding common stock ofVECTORsgi Holdings, Inc. (“VECTORsgi”). VECTORsgi, based in Addison, Texas, is a provider of bankingtransaction applications, including electronic check-image processing and image exchange, item processing, disputeresolution and e-commerce for financial institutions and corporations. It is expected that this acquisition willcomplement the recently completed acquisition of Advanced Financial Solutions, Inc. and its affiliated companies,as both companies specialize in providing electronic check-imaging technology. The aggregate cash purchase pricefor VECTORsgi was $100.0 million, with up to an additional $35.0 million to be paid based on meeting certainperformance criteria. Initial goodwill, subject to the completion of appraisals and valuation of the assets acquiredand liabilities assumed, amounted to $82.0 million. The estimated identifiable intangible asset to be amortized(customer relationships) with an estimated useful life of 12 years amounted to $13.0 million. The goodwill andintangibles resulting from this transaction are not deductible for tax purposes.
On October 20, 2004, Metavante acquired all of the outstanding membership interests of NuEdge SystemsLLC (“NuEdge”) for approximately $1.4 million in cash. NuEdge is engaged in the business of providing customerrelationship management solutions for enterprise marketing automation. The estimated identifiable intangible assetto be amortized (customer relationships) with an estimated useful life of 8 years amounted to $1.5 million.
On September 8, 2004, Metavante acquired certain assets of Response Data Corp. (“RDC”), forapproximately $35.0 million in cash. RDC is a New Jersey-based provider of credit card balance transfer, bill payand convenience check processing. It is expected that this acquisition will enable Metavante to expand its paymentsolutions product offerings by adding credit card balance transfer bill payment. Initial goodwill, subject to thecompletion of appraisals and valuations of the assets acquired and liabilities assumed, amounted to $26.8 million.The estimated identifiable intangible asset to be amortized (customer relationships) with an estimated useful life of10 years amounted to $6.4 million. The goodwill and intangibles resulting from this transaction are deductible fortax purposes.
On July 30, 2004, Metavante completed the acquisition of all of the outstanding common stock of the NYCECorporation (“NYCE”), for $610.7 million in cash, subject to certain adjustments that may include a return of aportion of the purchase price based on certain future revenue measures. NYCE owns and operates one of thelargest electronic funds transfer networks in the United States and provides debit card authorization processingservices for automated teller machines (ATMs) and on-line and off-line signature based debit card transactions. It isexpected that this acquisition will enable Metavante to expand its electronic funds transfer (EFT) business. Initialgoodwill, subject to the completion of appraisals and valuation of the assets acquired and liabilities assumed,amounted to $454.7 million. The estimated identifiable intangible asset to be amortized (customer relationships)with an estimated useful life of 15 years amounted to $172.1 million. The goodwill and intangibles resulting fromthis transaction are not deductible for tax purposes.
On July 1, 2004, Metavante completed the acquisition of all of the outstanding common stock of AdvancedFinancial Solutions, Inc. and its affiliated companies (collectively “AFS”), of Oklahoma City, Oklahoma for $141.7
8 8

Notes to Consolidated Financial Statements—(Continued)
December 31, 2004, 2003, and 2002 ($000’s except share data)
million in cash. AFS is a provider of image-based payment, transaction and document software technologies. AFSalso operates an electronic check-clearing network through one of its affiliates. It is expected that this acquisitionwill allow Metavante to expand its current product offerings in payment and transaction processing and imagerelated services, provide the technology and expertise to help banks facilitate the necessary change to comply withthe Check Clearing for the 21st Century Act (known as Check 21) and capture another leg in the paymentssegment-electronic check image exchange. Additional contingent consideration may be paid based on theattainment of certain performance objectives each year, beginning on the date of closing and ending December 31,2004, and each year thereafter through 2007. Contingent payments, if made, would be reflected as adjustments togoodwill. Initial goodwill, subject to the completion of appraisals and valuations of the assets acquired and liabilitiesassumed, amounted to $105.1 million. The estimated identifiable intangible assets to be amortized (customerrelationships and non-compete agreements) with an estimated useful life of 12 years for customer relationships and4 years for non-compete agreements, amounted to $21.5 million. The goodwill and intangibles resulting from thistransaction are partially deductible for tax purposes.
On May 27, 2004, Metavante completed the purchase of certain assets and the assumption of certain liabilitiesof Kirchman Corporation (“Kirchman”), of Orlando, Florida for $157.4 million in cash, subject to certainadjustments. Kirchman is a provider of automation software and compliance services to the banking industry. Theacquisition of Kirchman provides Metavante with core-processing software that financial institutions can runin-house, a solution that Metavante previously did not offer. Initial goodwill, subject to completion of appraisals andvaluations of the assets acquired and liabilities assumed, amounted to $155.4 million. The estimated identifiableintangible assets to be amortized (customer relationships and non-compete agreements) with an estimated useful lifeof 10 years for customer relationships and 5 years for non-compete agreements amounted to $15.8 million. Thegoodwill and intangibles resulting from this transaction are deductible for tax purposes.
There was no in-process research and development acquired in any of the acquisitions completed byMetavante for the year ended December 31, 2004.
On January 1, 2004, the Banking segment completed the purchase of certain assets and the assumption ofcertain liabilities of AmerUs Home Lending, Inc. (“AmerUs”), an Iowa-based corporation engaged in the businessof brokering and servicing mortgage and home equity loans for $15.0 million in cash. This acquisition enhances theCorporation’s wholesale lending activities by expanding its broker network. Initial goodwill, subject to thecompletion of appraisals and valuations of the assets acquired and liabilities assumed, amounted to $5.3 million. Theestimated identifiable intangible asset to be amortized (customer relationships) with an estimated useful life of 3years amounted to $0.3 million. The goodwill and intangibles resulting from this transaction are deductible for taxpurposes.
The following acquisitions, which were not considered material business combinations individually or in theaggregate, were completed during 2003:
In November 2003, Metavante acquired the assets of Printing For Systems, Inc., a Connecticut corporationengaged in the business of printing and delivery of identification cards and other documents for the healthcareinsurance industry, including non-financial data processing and direct mail services in connection with suchservices. Metavante believes this acquisition leverages its financial technology servicing expertise into thehealthcare insurance industry and demonstrates its commitment to supporting the growth in the market forelectronic funds transfer and card solutions. The total cost of this acquisition was $25.0 million which was paid incash. For three years beginning in 2004, additional contingent payments may be made each year if certain annualrevenue and profitability targets are achieved subject to certain other conditions. The maximum total contingentconsideration over the three-year contingency period is $25.0 million. Approximately $3.8 million of the aggregatepurchase price paid has been placed in escrow to absorb contingencies adverse to Metavante. The contingencyperiod is eighteen months. Contingent payments, if made or returned from escrow, will be reflected as anadjustment to goodwill. There was no in-process research and development acquired in this acquisition. The
8 9
Notes to Consolidated Financial Statements—(Continued)
December 31, 2004, 2003, and 2002 ($000’s except share data)
estimated identifiable intangible to be amortized (customer list) with an estimated life of 8.0 years amounted to $4.0million. Initial goodwill amounted to $18.4 million. The goodwill and intangibles resulting from this transaction aredeductible for tax purposes.
In May 2003, the Corporation’s Trust subsidiary entered into an agreement to purchase for cash certainsegments of the employee benefit plan business of a national banking association located in Missouri. Thisacquisition enhances the Trust subsidiary’s presence in Missouri and complements the Missouri acquisition by theBanking segment in October 2002. The acquired segments will be transferred to the Corporation’s Trust subsidiaryin accordance with an established conversion schedule that was completed in the first quarter of 2004. The total costof this acquisition was $4.0 million. The total purchase price is further subject to additional payments up to $7.0million contingent upon certain revenue targets achieved one year from the completion date of the acquisition.Contingent payments, if made, will be reflected as adjustments to goodwill. The identifiable intangible to beamortized (customer list) with an estimated life of 6.2 years amounted to $4.0 million. Goodwill recorded in thistransaction was $0.7 million. The intangibles resulting from this transaction are deductible for tax purposes.
The following acquisitions, which were not considered material business combinations individually or in theaggregate, were completed during 2002:
On October 1, 2002, the Corporation acquired 100 percent of the outstanding common shares of MississippiValley Bancshares, Inc. (“Mississippi Valley”). Mississippi Valley, a bank holding company headquartered in St.Louis, Missouri consisted of three bank subsidiaries with eight offices located in St. Louis, Missouri; Belleville,Illinois; and Phoenix, Arizona and had total consolidated assets of $2.1 billion and total consolidated shareholders’equity of $178.9 million at September 30, 2002. The Corporation believes that the merger presents a uniqueopportunity to expand its operations into the St. Louis, Missouri area and to expand its current operations in thePhoenix, Arizona area. The aggregate purchase price was $486.0 million including $255.2 million of cash and 8.25million shares of common stock valued at $230.8 million based on the average price over the contractual pricingperiod. Identifiable intangibles to be amortized (core deposit and tradename) with a weighted average life of 8.5years amounted to $72.7 million. Goodwill amounted to $285.0 million and was assigned to the Corporation’sbanking segment. The goodwill and intangibles are not deductible for tax purposes. In January 2003, the Arizonabank subsidiary was merged into M&I Bank, and in November 2003, the Belleville bank subsidiary was mergedinto the St. Louis bank subsidiary.
On March 1, 2002 the Corporation acquired 100 percent of the outstanding common stock of Richfield StateAgency, Inc. (“Richfield”) and Century Bancshares, Inc. (“Century”), both Minnesota bank holding companies.Richfield and Century provide retail and commercial loan and deposit services. In addition, Richfield providedfiduciary and agency trust services. Richfield and Century serve customers within the Minneapolis, Minnesotametropolitan area. The Corporation believes that these mergers present a unique opportunity to expand its currentoperations in the Minneapolis, Minnesota metropolitan area. Richfield and Century had combined totalconsolidated assets of approximately $1.1 billion and combined total consolidated shareholders’ equity of $84.8million at the time the mergers were consummated. The aggregate purchase price was $216.5 million including$29.9 million of cash and 6.2 million shares of common stock valued at $186.6 million based on the average priceover their respective contractual pricing periods. Identifiable intangibles to be amortized (core deposit and trustcustomer) with a weighted average life of 6.1 years amounted to $24.1 million. Goodwill amounted to $132.6million. Goodwill assigned to the Corporation’s banking segment amounted to $129.2 million and the remainder wasassigned to the Corporation’s Trust reporting unit. The goodwill and intangibles resulting from each transaction arenot deductible for tax purposes. In June 2002, the former bank subsidiaries of Richfield and Century were mergedinto M&I Bank.
In 2002, Metavante acquired the assets of the following three entities for a total cost of $20.6 million which waspaid in cash:
In July 2002, Metavante acquired substantially all the assets of Paytrust, Inc. a privately held online billmanagement company based in Lawrenceville, New Jersey. Through this acquisition, Metavante consolidated its
9 0

Notes to Consolidated Financial Statements—(Continued)
December 31, 2004, 2003, and 2002 ($000’s except share data)
consumer service provider operations onto one technology platform with the technology acquired in 2001 fromCyberbills, Inc. Integration costs, primarily related to operating duplicated platforms during transition, amounted to$5.7 million after-tax and were incurred over the nine-month period ending in the first quarter of 2003. Such after-tax costs amounted to $4.2 million in 2002 and $1.5 million in 2003.
In August 2002, Metavante acquired the assets of Spectrum EBP, LLC. Through this acquisition Metavanteacquired an open interoperable switch for exchanging online bills and payments. This link will enable the deliveryof bills from many billers to more consumers.
In May 2002, Metavante acquired the assets of BenePlan, Inc., a provider of third party plan administrationservices for retirement benefit plans.
There was no in-process research and development acquired in any of Metavante’s acquisitions in 2002.Identifiable intangibles to be amortized (customer lists and contracts) with a weighted average life of 9.8 yearsamounted to $6.7 million. Goodwill amounted to $14.4 million. The goodwill and intangibles resulting from eachtransaction are deductible for tax purposes.
The results of operations of the acquired entities have been included in the consolidated results since the datesthe transactions were closed.
5. Cash and Due from Banks
At December 31, 2004 and 2003, $106,911 and $46,762, respectively of cash and due from banks wasrestricted, primarily due to requirements of the Federal Reserve System to maintain certain reserve balances.
6. Securities
The book and market values of selected securities at December 31 were:
2004 2003
AmortizedCost
MarketValue
AmortizedCost
MarketValue
Investment Securities Available for Sale:U.S. Treasury and government agencies . . . . . . . . . . . . . . $4,147,593 $4,157,374 $3,856,069 $3,886,278States and political subdivisions . . . . . . . . . . . . . . . . . . . . . 479,326 504,027 274,968 299,321Mortgage backed securities . . . . . . . . . . . . . . . . . . . . . . . . . 151,061 150,658 147,868 149,990Other . . . . . . . . . . . . . . . . . . . . . . . . . . . . . . . . . . . . . . . . . . 533,229 546,940 443,186 450,857
Total . . . . . . . . . . . . . . . . . . . . . . . . . . . . . . . . . . . . . . . $5,311,209 $5,358,999 $4,722,091 $4,786,446
Investment Securities Held to Maturity:States and political subdivisions . . . . . . . . . . . . . . . . . . . . . $ 724,086 $ 762,801 $ 818,065 $ 871,128Other . . . . . . . . . . . . . . . . . . . . . . . . . . . . . . . . . . . . . . . . . . 2,300 2,300 2,821 2,821
Total . . . . . . . . . . . . . . . . . . . . . . . . . . . . . . . . . . . . . . . $ 726,386 $ 765,101 $ 820,886 $ 873,949
9 1
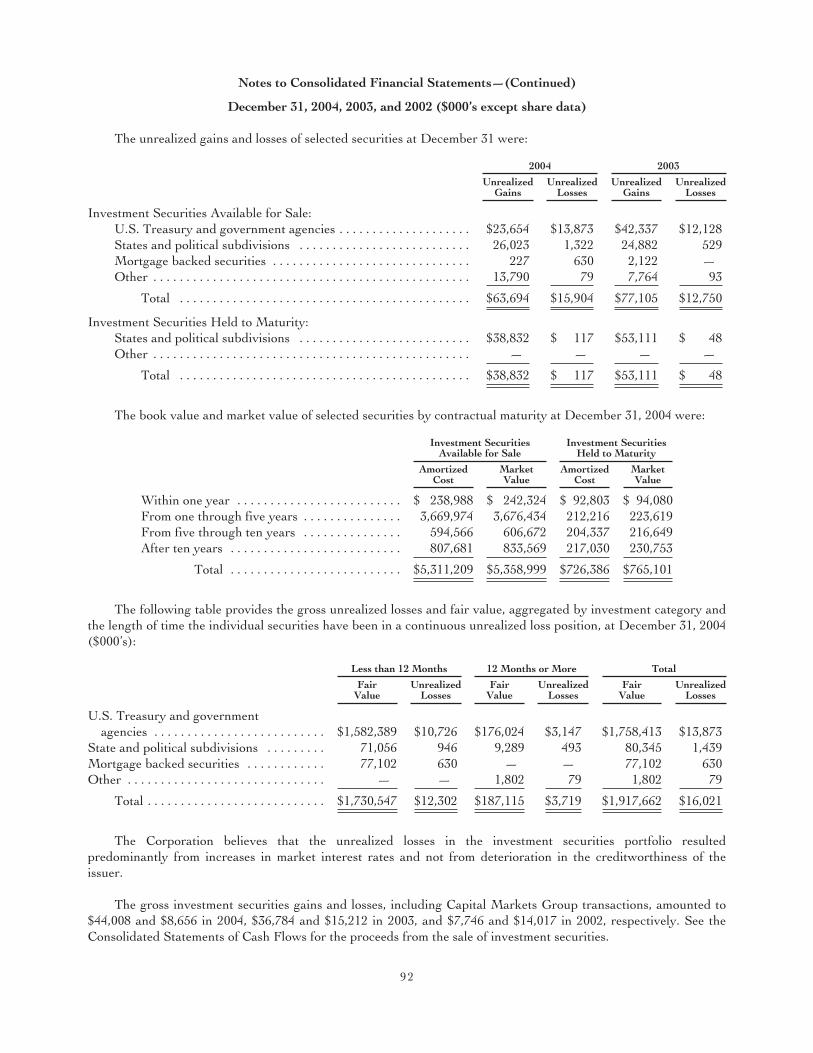
Notes to Consolidated Financial Statements—(Continued)
December 31, 2004, 2003, and 2002 ($000’s except share data)
The unrealized gains and losses of selected securities at December 31 were:
2004 2003
UnrealizedGains
UnrealizedLosses
UnrealizedGains
UnrealizedLosses
Investment Securities Available for Sale:U.S. Treasury and government agencies . . . . . . . . . . . . . . . . . . . . $23,654 $13,873 $42,337 $12,128States and political subdivisions . . . . . . . . . . . . . . . . . . . . . . . . . . 26,023 1,322 24,882 529Mortgage backed securities . . . . . . . . . . . . . . . . . . . . . . . . . . . . . . 227 630 2,122 —Other . . . . . . . . . . . . . . . . . . . . . . . . . . . . . . . . . . . . . . . . . . . . . . . . 13,790 79 7,764 93
Total . . . . . . . . . . . . . . . . . . . . . . . . . . . . . . . . . . . . . . . . . . . . $63,694 $15,904 $77,105 $12,750
Investment Securities Held to Maturity:States and political subdivisions . . . . . . . . . . . . . . . . . . . . . . . . . . $38,832 $ 117 $53,111 $ 48Other . . . . . . . . . . . . . . . . . . . . . . . . . . . . . . . . . . . . . . . . . . . . . . . . — — — —
Total . . . . . . . . . . . . . . . . . . . . . . . . . . . . . . . . . . . . . . . . . . . . $38,832 $ 117 $53,111 $ 48
The book value and market value of selected securities by contractual maturity at December 31, 2004 were:
Investment SecuritiesAvailable for Sale
Investment SecuritiesHeld to Maturity
AmortizedCost
MarketValue
AmortizedCost
MarketValue
Within one year . . . . . . . . . . . . . . . . . . . . . . . . . $ 238,988 $ 242,324 $ 92,803 $ 94,080From one through five years . . . . . . . . . . . . . . . 3,669,974 3,676,434 212,216 223,619From five through ten years . . . . . . . . . . . . . . . 594,566 606,672 204,337 216,649After ten years . . . . . . . . . . . . . . . . . . . . . . . . . . 807,681 833,569 217,030 230,753
Total . . . . . . . . . . . . . . . . . . . . . . . . . . $5,311,209 $5,358,999 $726,386 $765,101
The following table provides the gross unrealized losses and fair value, aggregated by investment category andthe length of time the individual securities have been in a continuous unrealized loss position, at December 31, 2004($000’s):
Less than 12 Months 12 Months or More Total
FairValue
UnrealizedLosses
FairValue
UnrealizedLosses
FairValue
UnrealizedLosses
U.S. Treasury and governmentagencies . . . . . . . . . . . . . . . . . . . . . . . . . . $1,582,389 $10,726 $176,024 $3,147 $1,758,413 $13,873
State and political subdivisions . . . . . . . . . 71,056 946 9,289 493 80,345 1,439Mortgage backed securities . . . . . . . . . . . . 77,102 630 — — 77,102 630Other . . . . . . . . . . . . . . . . . . . . . . . . . . . . . . — — 1,802 79 1,802 79
Total . . . . . . . . . . . . . . . . . . . . . . . . . . . $1,730,547 $12,302 $187,115 $3,719 $1,917,662 $16,021
The Corporation believes that the unrealized losses in the investment securities portfolio resultedpredominantly from increases in market interest rates and not from deterioration in the creditworthiness of theissuer.
The gross investment securities gains and losses, including Capital Markets Group transactions, amounted to$44,008 and $8,656 in 2004, $36,784 and $15,212 in 2003, and $7,746 and $14,017 in 2002, respectively. See theConsolidated Statements of Cash Flows for the proceeds from the sale of investment securities.
9 2

Notes to Consolidated Financial Statements—(Continued)
December 31, 2004, 2003, and 2002 ($000’s except share data)
Income tax (expense) or benefit related to net securities transactions amounted to $(12,373), $(7,543), and$2,195 in 2004, 2003, and 2002, respectively.
At December 31, 2004, securities with a value of approximately $1,476,480 were pledged to secure publicdeposits, short-term borrowings, and for other purposes required by law.
7. Loans and Leases
Loans and leases at December 31 were:2004 2003
Commercial, financial and agricultural . . . . . . . . . . . . . . . . . . . . . . . . . . . . . . . . . . . . . . . . $ 8,483,046 $ 7,104,844Cash flow hedging instruments at fair value . . . . . . . . . . . . . . . . . . . . . . . . . . . . . . . . . . . (1,583) 5,830
Commercial, financial and agricultural . . . . . . . . . . . . . . . . . . . . . . . . . . . . . . . . . . . . 8,481,463 7,110,674Real estate:
Construction . . . . . . . . . . . . . . . . . . . . . . . . . . . . . . . . . . . . . . . . . . . . . . . . . . . . . . . . . 2,265,227 1,766,697Residential mortgage . . . . . . . . . . . . . . . . . . . . . . . . . . . . . . . . . . . . . . . . . . . . . . . . . . 8,548,029 6,834,360Commercial mortgage . . . . . . . . . . . . . . . . . . . . . . . . . . . . . . . . . . . . . . . . . . . . . . . . . 8,164,099 7,149,149
Personal . . . . . . . . . . . . . . . . . . . . . . . . . . . . . . . . . . . . . . . . . . . . . . . . . . . . . . . . . . . . . . . . 1,540,024 1,747,738Lease financing . . . . . . . . . . . . . . . . . . . . . . . . . . . . . . . . . . . . . . . . . . . . . . . . . . . . . . . . . . . 537,930 576,322
Total loans and leases . . . . . . . . . . . . . . . . . . . . . . . . . . . . . . . . . . . . . . . . . . . . . $29,536,772 $25,184,940
Included in residential mortgages in the table previously presented are residential mortgage loans held for sale.Residential mortgage loans held for sale amounted to $67,897 and $34,623 at December 31, 2004 and 2003,respectively. At December 31, 2004 auto loans held for sale, which are included in personal loans in the tablepreviously presented, amounted to $13,765.
The Corporation’s lending activities are concentrated primarily in the Midwest. Approximately 11% of itsportfolio consists of loans granted to customers located in Arizona, 11% of the loans are to customers in Minnesotaand 5% to customers located in Missouri. The Corporation’s loan portfolio consists of business loans extendingacross many industry types, as well as loans to individuals. As of December 31, 2004, total loans to any group ofcustomers engaged in similar activities and having similar economic characteristics, as defined by the NorthAmerican Industry Classification System, did not exceed 10% of total loans.
The Corporation evaluates the credit risk of each customer on an individual basis and, where deemedappropriate, collateral is obtained. Collateral varies by individual loan customer but may include accountsreceivable, inventory, real estate, equipment, deposits, personal and government guaranties, and general securityagreements. Access to collateral is dependent upon the type of collateral obtained. On an on-going basis, theCorporation monitors its collateral and the collateral value related to the loan balance outstanding.
The Corporation periodically reviews the residual values associated with its leasing portfolios. Declines inresidual values that are judged to be other than temporary are recognized as a loss resulting in a reduction in the netinvestment in the lease. No residual impairment losses were incurred for the years ended December 31, 2004 and2003. During 2002, the Corporation’s commercial leasing subsidiary recorded a residual impairment loss of $6,848.
An analysis of loans outstanding to directors and officers, including their related interests, of the Corporationand its significant subsidiaries for 2004 is presented in the following table. All of these loans were made in theordinary course of business with normal credit terms, including interest rates and collateral. The beginning balancehas been adjusted to reflect the activity of newly-appointed directors and executive officers.
9 3
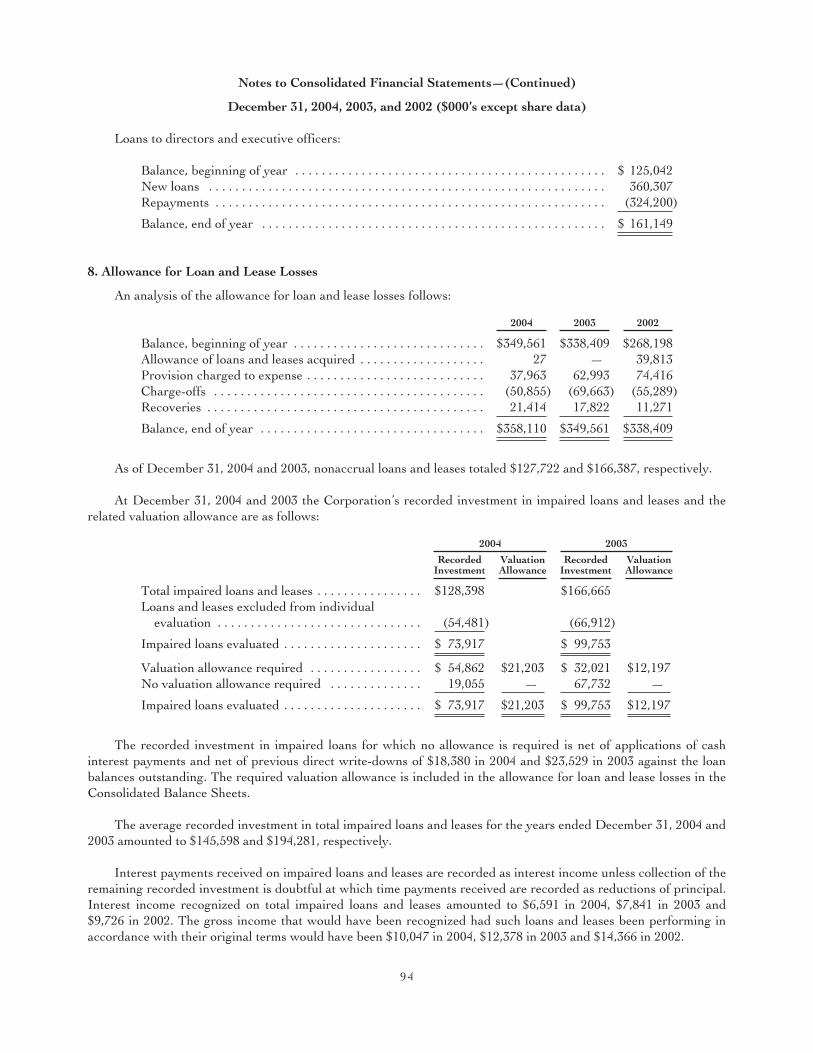
Notes to Consolidated Financial Statements—(Continued)
December 31, 2004, 2003, and 2002 ($000’s except share data)
Loans to directors and executive officers:
Balance, beginning of year . . . . . . . . . . . . . . . . . . . . . . . . . . . . . . . . . . . . . . . . . . . . . . . $ 125,042New loans . . . . . . . . . . . . . . . . . . . . . . . . . . . . . . . . . . . . . . . . . . . . . . . . . . . . . . . . . . . . 360,307Repayments . . . . . . . . . . . . . . . . . . . . . . . . . . . . . . . . . . . . . . . . . . . . . . . . . . . . . . . . . . . (324,200)
Balance, end of year . . . . . . . . . . . . . . . . . . . . . . . . . . . . . . . . . . . . . . . . . . . . . . . . . . . . $ 161,149
8. Allowance for Loan and Lease Losses
An analysis of the allowance for loan and lease losses follows:
2004 2003 2002
Balance, beginning of year . . . . . . . . . . . . . . . . . . . . . . . . . . . . . $349,561 $338,409 $268,198Allowance of loans and leases acquired . . . . . . . . . . . . . . . . . . . 27 — 39,813Provision charged to expense . . . . . . . . . . . . . . . . . . . . . . . . . . . 37,963 62,993 74,416Charge-offs . . . . . . . . . . . . . . . . . . . . . . . . . . . . . . . . . . . . . . . . . (50,855) (69,663) (55,289)Recoveries . . . . . . . . . . . . . . . . . . . . . . . . . . . . . . . . . . . . . . . . . . 21,414 17,822 11,271
Balance, end of year . . . . . . . . . . . . . . . . . . . . . . . . . . . . . . . . . . $358,110 $349,561 $338,409
As of December 31, 2004 and 2003, nonaccrual loans and leases totaled $127,722 and $166,387, respectively.
At December 31, 2004 and 2003 the Corporation’s recorded investment in impaired loans and leases and therelated valuation allowance are as follows:
2004 2003
RecordedInvestment
ValuationAllowance
RecordedInvestment
ValuationAllowance
Total impaired loans and leases . . . . . . . . . . . . . . . . $128,398 $166,665Loans and leases excluded from individual
evaluation . . . . . . . . . . . . . . . . . . . . . . . . . . . . . . . (54,481) (66,912)
Impaired loans evaluated . . . . . . . . . . . . . . . . . . . . . $ 73,917 $ 99,753
Valuation allowance required . . . . . . . . . . . . . . . . . $ 54,862 $21,203 $ 32,021 $12,197No valuation allowance required . . . . . . . . . . . . . . 19,055 — 67,732 —
Impaired loans evaluated . . . . . . . . . . . . . . . . . . . . . $ 73,917 $21,203 $ 99,753 $12,197
The recorded investment in impaired loans for which no allowance is required is net of applications of cashinterest payments and net of previous direct write-downs of $18,380 in 2004 and $23,529 in 2003 against the loanbalances outstanding. The required valuation allowance is included in the allowance for loan and lease losses in theConsolidated Balance Sheets.
The average recorded investment in total impaired loans and leases for the years ended December 31, 2004 and2003 amounted to $145,598 and $194,281, respectively.
Interest payments received on impaired loans and leases are recorded as interest income unless collection of theremaining recorded investment is doubtful at which time payments received are recorded as reductions of principal.Interest income recognized on total impaired loans and leases amounted to $6,591 in 2004, $7,841 in 2003 and$9,726 in 2002. The gross income that would have been recognized had such loans and leases been performing inaccordance with their original terms would have been $10,047 in 2004, $12,378 in 2003 and $14,366 in 2002.
9 4
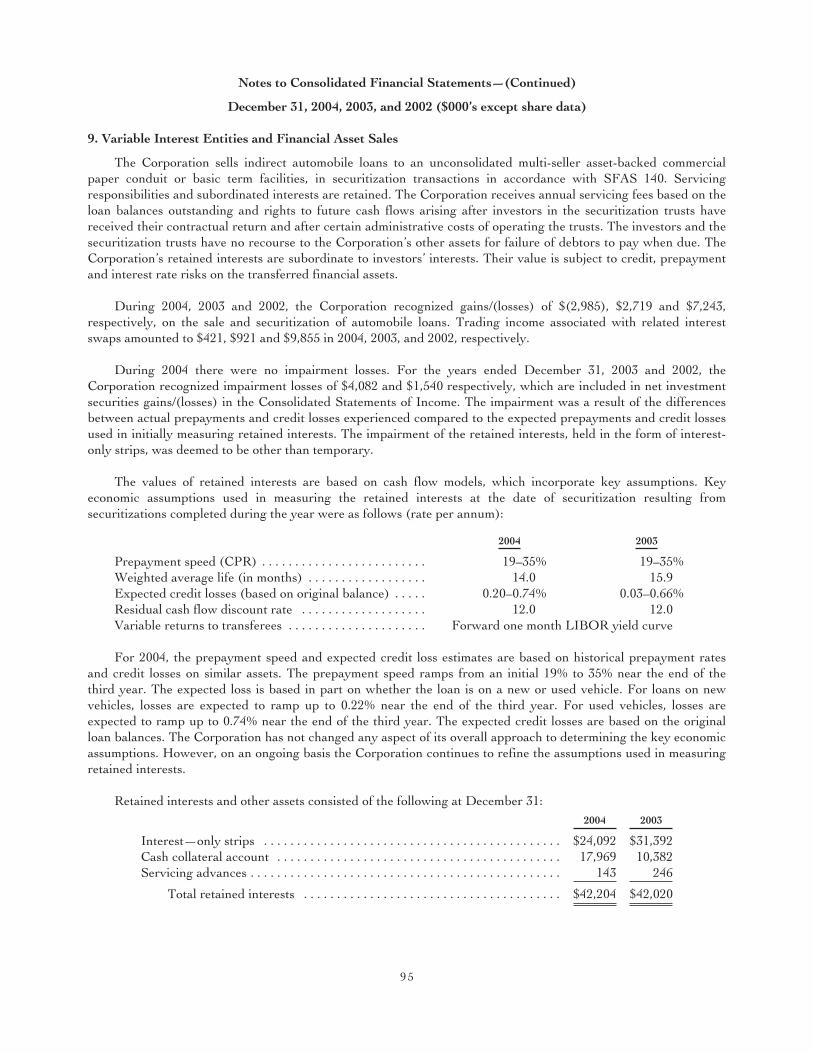
Notes to Consolidated Financial Statements—(Continued)
December 31, 2004, 2003, and 2002 ($000’s except share data)
9. Variable Interest Entities and Financial Asset Sales
The Corporation sells indirect automobile loans to an unconsolidated multi-seller asset-backed commercialpaper conduit or basic term facilities, in securitization transactions in accordance with SFAS 140. Servicingresponsibilities and subordinated interests are retained. The Corporation receives annual servicing fees based on theloan balances outstanding and rights to future cash flows arising after investors in the securitization trusts havereceived their contractual return and after certain administrative costs of operating the trusts. The investors and thesecuritization trusts have no recourse to the Corporation’s other assets for failure of debtors to pay when due. TheCorporation’s retained interests are subordinate to investors’ interests. Their value is subject to credit, prepaymentand interest rate risks on the transferred financial assets.
During 2004, 2003 and 2002, the Corporation recognized gains/(losses) of $(2,985), $2,719 and $7,243,respectively, on the sale and securitization of automobile loans. Trading income associated with related interestswaps amounted to $421, $921 and $9,855 in 2004, 2003, and 2002, respectively.
During 2004 there were no impairment losses. For the years ended December 31, 2003 and 2002, theCorporation recognized impairment losses of $4,082 and $1,540 respectively, which are included in net investmentsecurities gains/(losses) in the Consolidated Statements of Income. The impairment was a result of the differencesbetween actual prepayments and credit losses experienced compared to the expected prepayments and credit lossesused in initially measuring retained interests. The impairment of the retained interests, held in the form of interest-only strips, was deemed to be other than temporary.
The values of retained interests are based on cash flow models, which incorporate key assumptions. Keyeconomic assumptions used in measuring the retained interests at the date of securitization resulting fromsecuritizations completed during the year were as follows (rate per annum):
2004 2003
Prepayment speed (CPR) . . . . . . . . . . . . . . . . . . . . . . . . . 19–35% 19–35%Weighted average life (in months) . . . . . . . . . . . . . . . . . . 14.0 15.9Expected credit losses (based on original balance) . . . . . 0.20–0.74% 0.03–0.66%Residual cash flow discount rate . . . . . . . . . . . . . . . . . . . 12.0 12.0Variable returns to transferees . . . . . . . . . . . . . . . . . . . . . Forward one month LIBOR yield curve
For 2004, the prepayment speed and expected credit loss estimates are based on historical prepayment ratesand credit losses on similar assets. The prepayment speed ramps from an initial 19% to 35% near the end of thethird year. The expected loss is based in part on whether the loan is on a new or used vehicle. For loans on newvehicles, losses are expected to ramp up to 0.22% near the end of the third year. For used vehicles, losses areexpected to ramp up to 0.74% near the end of the third year. The expected credit losses are based on the originalloan balances. The Corporation has not changed any aspect of its overall approach to determining the key economicassumptions. However, on an ongoing basis the Corporation continues to refine the assumptions used in measuringretained interests.
Retained interests and other assets consisted of the following at December 31:2004 2003
Interest—only strips . . . . . . . . . . . . . . . . . . . . . . . . . . . . . . . . . . . . . . . . . . . . . $24,092 $31,392Cash collateral account . . . . . . . . . . . . . . . . . . . . . . . . . . . . . . . . . . . . . . . . . . . 17,969 10,382Servicing advances . . . . . . . . . . . . . . . . . . . . . . . . . . . . . . . . . . . . . . . . . . . . . . . 143 246
Total retained interests . . . . . . . . . . . . . . . . . . . . . . . . . . . . . . . . . . . . . . . $42,204 $42,020
9 5
Notes to Consolidated Financial Statements—(Continued)
December 31, 2004, 2003, and 2002 ($000’s except share data)
At December 31, 2004 key economic assumptions and the sensitivity of the current fair value of residual cashflows to immediate 10 percent and 20 percent adverse changes in those assumptions are as follows ($ in millions):
Adverse Changein Assumptions
10% 20%
Weighted average life (in months) . . . . . . . . . . . . . . . . . . . . 14.0Prepayment speed . . . . . . . . . . . . . . . . . . . . . . . . . . . . . . . . . 19–35%
Impact on fair value of adverse change . . . . . . . . . . . . $1.0 $1.8Expected credit losses (based on original balance) . . . . . . . 0.20–0.74%
Impact on fair value of adverse change . . . . . . . . . . . . 0.4 0.9Residual cash flows discount rate (annual) . . . . . . . . . . . . . 12.0%
These sensitivities are hypothetical and should be used with caution. As the figures indicate, changes in fairvalue based on a 10 percent adverse variation in assumptions generally can not be extrapolated because therelationship of the change in assumption to the change in fair value may not be linear. Also, the effect of an adversevariation in a particular assumption on the fair value of the retained interest is calculated without changing anyother assumption. Realistically, changes in one factor may result in changes in another (for example, increases inmarket interest rates may result in lower prepayments and increased credit losses), which might magnify orcounteract the sensitivities.
Actual and projected net credit losses represented 0.50% of total automobile loans that have been securitized atDecember 31, 2004, based on balances at the time of the initial securitization.
The following table summarizes certain cash flows received from and paid to the securitization trusts for theyears ended December 31:
2004 2003
Proceeds from new securitizations . . . . . . . . . . . . . . . . . . . . . . . . . . . . . . . . $494,624 $784,465Servicing fees received . . . . . . . . . . . . . . . . . . . . . . . . . . . . . . . . . . . . . . . . . . 6,176 4,682Net charge-offs . . . . . . . . . . . . . . . . . . . . . . . . . . . . . . . . . . . . . . . . . . . . . . . . (2,298) (2,074)Cash collateral account transfers, net . . . . . . . . . . . . . . . . . . . . . . . . . . . . . (7,587) (2,987)Other cash flows received on retained interests, net . . . . . . . . . . . . . . . . . . 32,748 32,919
At December 31, 2004 securitized automobile loans and other automobile loans managed together with themalong with delinquency and credit loss information consisted of the following:
Securitized Portfolio Managed
Loan balances . . . . . . . . . . . . . . . . . . . . . . . . . . . . . . . . . . . . $1,003,025 $255,143 $1,258,168Principal amounts of loans 60 days or more past due . . . . . 906 169 1,075Net credit losses . . . . . . . . . . . . . . . . . . . . . . . . . . . . . . . . . . 2,435 164 2,599
The Corporation also sells, from time to time, debt securities classified as available for sale that are highly ratedto an unconsolidated bankruptcy remote qualifying special purpose entity (“QSPE”) whose activities are limited toissuing highly rated asset-backed commercial paper with maturities up to 180 days which is used to finance thepurchase of the investment securities. The Corporation provides liquidity back-up in the form of Liquidity PurchaseAgreements. In addition, the Corporation acts as counterparty to interest rate swaps that enable the QSPE to hedgeits interest rate risk. Such swaps are designated as trading in the Corporation’s Consolidated Balance Sheets.
Under the terms of the Administration Agreement, the Corporation, as administrator of the QSPE, is required tosell interests in the securities funded by the QSPE to the Corporation as the liquidity purchaser under the liquidityagreements, if at any time (after giving effect to any issuance of new commercial paper notes and the receipt ofpayments under any swap agreement) the QSPE has insufficient funds to repay any maturing commercial paper noteand the Corporation, as liquidity agent, has received a notice of such deficiency. The Corporation, as the liquidity
9 6
Notes to Consolidated Financial Statements—(Continued)
December 31, 2004, 2003, and 2002 ($000’s except share data)
provider, will be obligated to purchase interests in such securities under the terms of the liquidity agreement to repaythe maturing commercial paper notes unless (i) after giving effect to such purchase, the aggregate of securities,purchased under the relevant liquidity agreement would exceed the aggregate maximum liquidity purchase amountunder such liquidity agreement or (ii) certain bankruptcy events with respect to the QSPE have occurred; providedthat the Corporation is not required to purchase any defaulted security. For this purpose, a defaulted security is anysecurity that is rated below “Caa2” by Moody’s and below “CCC” by Standard & Poors. To date, the Corporation hasnever acquired interests in any securities under the terms of the liquidity agreements.
A subsidiary of the Corporation has entered into interest rate swaps with the QSPE designed to counteract theinterest rate risk associated with third party beneficial interest (commercial paper) and the transferred assets. Thebeneficial interests in the form of commercial paper have been issued by the QSPE to parties other than theCorporation and its subsidiary or any other affiliates. The notional amounts do not exceed the amount of beneficialinterests. The swap agreements do not provide the QSPE or its administrative agent any decision-making authorityother than those specified in the standard ISDA Master Agreement.
Highly rated investment securities in the amount of $280.2 million and $204.9 million were outstanding atDecember 31, 2004 and 2003, respectively, in the QSPE to support the outstanding commercial paper.
The Corporation also holds other variable interests in variable interest entities.
The Corporation is committed to community reinvestment and is required under federal law to take affirmativesteps to meet the credit needs of the local communities it serves. The Corporation regularly invests in or lends toentities that own residential facilities that provide housing for low-to-moderate income families (affordable housingprojects) or own commercial properties that are involved in historical preservations (rehabilitation projects). Theseprojects are generally located within the geographic markets served by the Corporation’s banking segment. TheCorporation’s involvement in these entities is limited to providing funding in the form of subordinated debt orequity interests. At December 31, 2004, investments in the form of subordinated debt represented an insignificantinvolvement in four unrelated entities.
Generally, the economic benefit from the equity investments consists of the income tax benefits obtained fromthe Corporation’s allocated operating losses from the partnership that are tax deductible, allocated income taxcredits for projects that qualify under the Internal Revenue Code and in some cases, participation in the proceedsfrom the eventual disposition of the property. The Corporation uses the equity method of accounting to account forthese investments. To the extent a project qualifies for income tax credits, the project must continue to qualify as anaffordable housing project for fifteen years or a rehabilitation project for five years in order to avoid recapture ofthe income tax credit which generally defines the time the Corporation will be involved in a project.
The Corporation’s maximum exposure to loss as a result of its involvement with these entities is generallylimited to the carrying value of these investments plus any unfunded commitments on projects that are notcompleted. At December 31, 2004, the aggregate carrying value of the subordinated debt and equity investmentswas $17,618 and the amount of unfunded commitments outstanding was $6,469.
10. Premises and Equipment
The composition of premises and equipment at December 31 was:2004 2003
Land . . . . . . . . . . . . . . . . . . . . . . . . . . . . . . . . . . . . . . . . . . . . . . . . . . . . . $ 77,211 $ 68,517Building and leasehold improvements . . . . . . . . . . . . . . . . . . . . . . . . . . 488,586 458,637Furniture and equipment . . . . . . . . . . . . . . . . . . . . . . . . . . . . . . . . . . . . . 519,969 498,426
1,085,766 1,025,580Less: Accumulated depreciation . . . . . . . . . . . . . . . . . . . . . . . . . . . . . . . 618,541 587,095
Total premises and equipment . . . . . . . . . . . . . . . . . . . . . . . . . . . . . $ 467,225 $ 438,485
9 7

Notes to Consolidated Financial Statements—(Continued)
December 31, 2004, 2003, and 2002 ($000’s except share data)
Depreciation expense was $71,489 in 2004, $68,247 in 2003, and $71,455 in 2002.
The Corporation leases certain of its facilities and equipment. Rent expense under such operating leases was$70,644 in 2004, $68,882 in 2003, and $71,594 in 2002, respectively.
The future minimum lease payments under operating leases that have initial or remaining noncancellable leaseterms in excess of one year for 2005 through 2009 are $39,297, $28,388, $22,361, $16,300, and $12,557,respectively.
11. Goodwill and Intangibles
SFAS 142, Goodwill and Other Intangible Assets adopts an aggregate view of goodwill and bases the accountingfor goodwill on the units of the combined entity into which an acquired entity is integrated (those units are referredto as Reporting Units). A Reporting Unit is an operating segment as defined in SFAS 131 or one level below anoperating segment.
SFAS 142 provides specific guidance for testing goodwill and intangible assets that are not amortized forimpairment. Goodwill is tested for impairment at least annually using a two-step process that begins with anestimation of the fair value of a Reporting Unit. The first step is a screen for potential impairment and the secondstep measures the amount of impairment, if any. Intangible assets that are not amortized are also tested annually.
With the assistance of a nationally recognized independent appraisal firm, the Corporation has elected toperform its annual test for impairment during the second quarter. Accordingly, the Corporation updated theanalysis to June 30, 2004 and concluded that there continues to be no impairment with respect to goodwill at anyreporting unit.
The changes in the carrying amount of goodwill for the twelve months ended December 31, 2004 and 2003 areas follows:
Banking Metavante Others Total
Goodwill balance as of December 31, 2002 . . . . . . . . . . . . . . . $801,977 $136,672 $4,687 $ 943,336Goodwill acquired during the period . . . . . . . . . . . . . . . . . . . . — 17,254 — 17,254Purchase accounting adjustments . . . . . . . . . . . . . . . . . . . . . . 7,795 1,403 — 9,198
Goodwill balance as of December 31, 2003 . . . . . . . . . . . . . . . 809,772 155,329 4,687 969,788Goodwill acquired during the period . . . . . . . . . . . . . . . . . . . . 5,314 823,989 — 829,303Purchase accounting adjustments . . . . . . . . . . . . . . . . . . . . . . — (900) 725 (175)
Goodwill balance as of December 31, 2004 . . . . . . . . . . . . . . . $815,086 $978,418 $5,412 $1,798,916
Purchase accounting adjustments are the adjustments to the initial goodwill recorded at the time an acquisitionis completed. Such adjustments generally consist of adjustments to the assigned fair value of the assets acquired andliabilities assumed resulting from the completion of appraisals or other valuations, adjustments to initial estimatesrecorded for transaction costs or exit liabilities, if any, contingent consideration when paid or received from escrowarrangements at the end of a contractual contingency period and the reduction of goodwill allocated to saletransactions. For the year ended December 31, 2003, the net contingent consideration with respect to Metavante’sacquisitions amounted to $2,379. For 2004, the reduction of goodwill relating to Metavante’s divestures was $2,014.For 2003, the reduction of goodwill relating to the sale of banking branches was $556.
9 8
Notes to Consolidated Financial Statements—(Continued)
December 31, 2004, 2003, and 2002 ($000’s except share data)
The Corporation’s other intangible assets consisted of the following at December 31, 2004:
GrossCarrying
ValueAccumulatedAmortization
NetCarrying
Value
WeightedAverage
AmortizationPeriod (Yrs)
Other intangible assets:Core deposit intangible . . . . . . . . . . . . . . . . . . . . . . . . . . . . . . . $159,474 $76,024 $ 83,450 6.4Data processing contract rights/customer lists . . . . . . . . . . . . 252,088 17,428 234,660 13.8Trust customers . . . . . . . . . . . . . . . . . . . . . . . . . . . . . . . . . . . . . 4,750 792 3,958 6.8Tradename . . . . . . . . . . . . . . . . . . . . . . . . . . . . . . . . . . . . . . . . . 2,775 1,967 808 3.0Other intangibles . . . . . . . . . . . . . . . . . . . . . . . . . . . . . . . . . . . . 1,250 140 1,110 4.6
$420,337 $96,351 $323,986 10.8
Mortgage loan servicing rights . . . . . . . . . . . . . . . . . . . . . . . . . . . . . $ 3,531 2.0
Amortization expense of other intangible assets amounted to $27,852, $23,785 and $25,134 in 2004, 2003 and2002, respectively.
The estimated amortization expense of other intangible assets and mortgage loan servicing rights for the nextfive years are:
2005 . . . . . . . . . . . . . . . . . . . . . . . . . . . . . . . . . . . . . . . . . . . . . . . . . . . . . . . . . . . . . . . . . . . $31,8562006 . . . . . . . . . . . . . . . . . . . . . . . . . . . . . . . . . . . . . . . . . . . . . . . . . . . . . . . . . . . . . . . . . . . 29,1562007 . . . . . . . . . . . . . . . . . . . . . . . . . . . . . . . . . . . . . . . . . . . . . . . . . . . . . . . . . . . . . . . . . . . 27,1752008 . . . . . . . . . . . . . . . . . . . . . . . . . . . . . . . . . . . . . . . . . . . . . . . . . . . . . . . . . . . . . . . . . . . 25,4332009 . . . . . . . . . . . . . . . . . . . . . . . . . . . . . . . . . . . . . . . . . . . . . . . . . . . . . . . . . . . . . . . . . . . 24,321
Mortgage loan servicing rights are subject to the prepayment risk inherent in the underlying loans that arebeing serviced. The weighted average amortization period as shown in the above table for mortgage loan servicingrights represents the estimated expected weighted average remaining life of the servicing rights at December 31,2004. The actual remaining life could be significantly different due to actual prepayment experience in futureperiods.
At December 31, 2004 and 2003, none of the Corporation’s other intangible assets were determined to haveindefinite lives.
12. Deposits
The composition of deposits at December 31 was:
2004 2003
Noninterest bearing demand . . . . . . . . . . . . . . . . . . . . . . . . . . . . . . . . . . . . . . . . $ 4,888,426 $ 4,715,283Savings and NOW . . . . . . . . . . . . . . . . . . . . . . . . . . . . . . . . . . . . . . . . . . . . . . . . 10,118,415 9,301,744Cash flow hedge—Brokered MMDA . . . . . . . . . . . . . . . . . . . . . . . . . . . . . . . . (1,445) —
Total Savings and NOW . . . . . . . . . . . . . . . . . . . . . . . . . . . . . . . . . . . . . . . 10,116,970 9,301,744CDs $100,000 and over . . . . . . . . . . . . . . . . . . . . . . . . . . . . . . . . . . . . . . . . . . . . 5,592,947 4,480,111Cash flow hedge—Institutional CDs . . . . . . . . . . . . . . . . . . . . . . . . . . . . . . . . . (8,977) 13,071
Total CDs $100,000 and over . . . . . . . . . . . . . . . . . . . . . . . . . . . . . . . . . . . 5,583,970 4,493,182Other time deposits . . . . . . . . . . . . . . . . . . . . . . . . . . . . . . . . . . . . . . . . . . . . . . . 2,721,214 2,646,639Foreign deposits . . . . . . . . . . . . . . . . . . . . . . . . . . . . . . . . . . . . . . . . . . . . . . . . . . 3,144,507 1,113,257
Total deposits . . . . . . . . . . . . . . . . . . . . . . . . . . . . . . . . . . . . . . . . . . . . . . . . $26,455,087 $22,270,105
9 9
Notes to Consolidated Financial Statements—(Continued)
December 31, 2004, 2003, and 2002 ($000’s except share data)
At December 31, 2004 and 2003, brokered deposits amounted to $5,737 million and $3,966 million,respectively.
At December 31, 2004, the scheduled maturities for CDs $100,000 and over, other time deposits, and foreigndeposits were:
2005 . . . . . . . . . . . . . . . . . . . . . . . . . . . . . . . . . . . . . . . . . . . . . . . . . . . . . . . . . . . . . . . . . . . . . . . . $ 8,199,8042006 . . . . . . . . . . . . . . . . . . . . . . . . . . . . . . . . . . . . . . . . . . . . . . . . . . . . . . . . . . . . . . . . . . . . . . . . 1,489,4682007 . . . . . . . . . . . . . . . . . . . . . . . . . . . . . . . . . . . . . . . . . . . . . . . . . . . . . . . . . . . . . . . . . . . . . . . . 745,0012008 . . . . . . . . . . . . . . . . . . . . . . . . . . . . . . . . . . . . . . . . . . . . . . . . . . . . . . . . . . . . . . . . . . . . . . . . 132,3652009 and thereafter . . . . . . . . . . . . . . . . . . . . . . . . . . . . . . . . . . . . . . . . . . . . . . . . . . . . . . . . . . . 892,030
$11,458,668
13. Short-term Borrowings
Short-term borrowings at December 31 were:
2004 2003
Federal funds purchased and security repurchase agreements . . . . . . . . . . . . . . . $1,478,103 $ 741,646Cash flow hedge—Federal funds . . . . . . . . . . . . . . . . . . . . . . . . . . . . . . . . . . . . . . 10,752 23,426
Federal funds purchased and security repurchase agreements . . . . . . . . . . . . . . . 1,488,855 765,072
U.S. Treasury demand notes . . . . . . . . . . . . . . . . . . . . . . . . . . . . . . . . . . . . . . . . . . 98,369 214,222U.S. Treasury demand notes—special direct . . . . . . . . . . . . . . . . . . . . . . . . . . . . . — 2,236,828Commercial paper . . . . . . . . . . . . . . . . . . . . . . . . . . . . . . . . . . . . . . . . . . . . . . . . . . 312,098 404,186Other . . . . . . . . . . . . . . . . . . . . . . . . . . . . . . . . . . . . . . . . . . . . . . . . . . . . . . . . . . . . 34,918 1,722
1,934,240 3,622,030Current maturities of long-term borrowings . . . . . . . . . . . . . . . . . . . . . . . . . . . . . 1,595,796 1,310,971
Total short-term borrowings . . . . . . . . . . . . . . . . . . . . . . . . . . . . . . . . . . . . . . $3,530,036 $4,933,001
U.S. Treasury demand notes—special direct represent secured borrowings of the lead banking subsidiary witha maximum term of 21 days.
Unused lines of credit, primarily to support commercial paper borrowings, were $75.0 million at December 31,2004 and 2003.
1 0 0
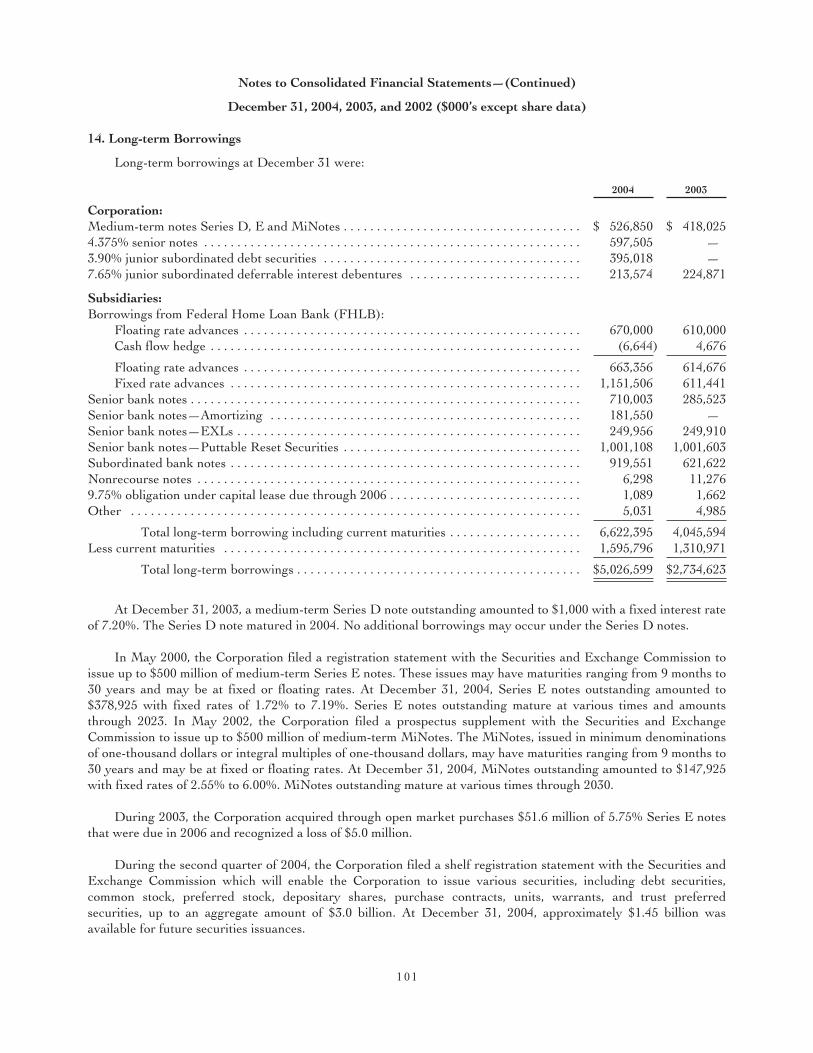
Notes to Consolidated Financial Statements—(Continued)
December 31, 2004, 2003, and 2002 ($000’s except share data)
14. Long-term Borrowings
Long-term borrowings at December 31 were:
2004 2003
Corporation:Medium-term notes Series D, E and MiNotes . . . . . . . . . . . . . . . . . . . . . . . . . . . . . . . . . . . . $ 526,850 $ 418,0254.375% senior notes . . . . . . . . . . . . . . . . . . . . . . . . . . . . . . . . . . . . . . . . . . . . . . . . . . . . . . . . . 597,505 —3.90% junior subordinated debt securities . . . . . . . . . . . . . . . . . . . . . . . . . . . . . . . . . . . . . . . 395,018 —7.65% junior subordinated deferrable interest debentures . . . . . . . . . . . . . . . . . . . . . . . . . . 213,574 224,871
Subsidiaries:Borrowings from Federal Home Loan Bank (FHLB):
Floating rate advances . . . . . . . . . . . . . . . . . . . . . . . . . . . . . . . . . . . . . . . . . . . . . . . . . . . 670,000 610,000Cash flow hedge . . . . . . . . . . . . . . . . . . . . . . . . . . . . . . . . . . . . . . . . . . . . . . . . . . . . . . . . (6,644) 4,676
Floating rate advances . . . . . . . . . . . . . . . . . . . . . . . . . . . . . . . . . . . . . . . . . . . . . . . . . . . 663,356 614,676Fixed rate advances . . . . . . . . . . . . . . . . . . . . . . . . . . . . . . . . . . . . . . . . . . . . . . . . . . . . . 1,151,506 611,441
Senior bank notes . . . . . . . . . . . . . . . . . . . . . . . . . . . . . . . . . . . . . . . . . . . . . . . . . . . . . . . . . . . 710,003 285,523Senior bank notes—Amortizing . . . . . . . . . . . . . . . . . . . . . . . . . . . . . . . . . . . . . . . . . . . . . . . 181,550 —Senior bank notes—EXLs . . . . . . . . . . . . . . . . . . . . . . . . . . . . . . . . . . . . . . . . . . . . . . . . . . . . 249,956 249,910Senior bank notes—Puttable Reset Securities . . . . . . . . . . . . . . . . . . . . . . . . . . . . . . . . . . . . 1,001,108 1,001,603Subordinated bank notes . . . . . . . . . . . . . . . . . . . . . . . . . . . . . . . . . . . . . . . . . . . . . . . . . . . . . 919,551 621,622Nonrecourse notes . . . . . . . . . . . . . . . . . . . . . . . . . . . . . . . . . . . . . . . . . . . . . . . . . . . . . . . . . . 6,298 11,2769.75% obligation under capital lease due through 2006 . . . . . . . . . . . . . . . . . . . . . . . . . . . . . 1,089 1,662Other . . . . . . . . . . . . . . . . . . . . . . . . . . . . . . . . . . . . . . . . . . . . . . . . . . . . . . . . . . . . . . . . . . . . 5,031 4,985
Total long-term borrowing including current maturities . . . . . . . . . . . . . . . . . . . . 6,622,395 4,045,594Less current maturities . . . . . . . . . . . . . . . . . . . . . . . . . . . . . . . . . . . . . . . . . . . . . . . . . . . . . . 1,595,796 1,310,971
Total long-term borrowings . . . . . . . . . . . . . . . . . . . . . . . . . . . . . . . . . . . . . . . . . . . $5,026,599 $2,734,623
At December 31, 2003, a medium-term Series D note outstanding amounted to $1,000 with a fixed interest rateof 7.20%. The Series D note matured in 2004. No additional borrowings may occur under the Series D notes.
In May 2000, the Corporation filed a registration statement with the Securities and Exchange Commission toissue up to $500 million of medium-term Series E notes. These issues may have maturities ranging from 9 months to30 years and may be at fixed or floating rates. At December 31, 2004, Series E notes outstanding amounted to$378,925 with fixed rates of 1.72% to 7.19%. Series E notes outstanding mature at various times and amountsthrough 2023. In May 2002, the Corporation filed a prospectus supplement with the Securities and ExchangeCommission to issue up to $500 million of medium-term MiNotes. The MiNotes, issued in minimum denominationsof one-thousand dollars or integral multiples of one-thousand dollars, may have maturities ranging from 9 months to30 years and may be at fixed or floating rates. At December 31, 2004, MiNotes outstanding amounted to $147,925with fixed rates of 2.55% to 6.00%. MiNotes outstanding mature at various times through 2030.
During 2003, the Corporation acquired through open market purchases $51.6 million of 5.75% Series E notesthat were due in 2006 and recognized a loss of $5.0 million.
During the second quarter of 2004, the Corporation filed a shelf registration statement with the Securities andExchange Commission which will enable the Corporation to issue various securities, including debt securities,common stock, preferred stock, depositary shares, purchase contracts, units, warrants, and trust preferredsecurities, up to an aggregate amount of $3.0 billion. At December 31, 2004, approximately $1.45 billion wasavailable for future securities issuances.
1 0 1

Notes to Consolidated Financial Statements—(Continued)
December 31, 2004, 2003, and 2002 ($000’s except share data)
On July 29, 2004, the Corporation issued $600 million of 4.375% senior notes. Interest is paid semi-annuallyand the notes mature on August 1, 2009.
During the third quarter of 2004, the Corporation and M&I Capital Trust B issued 16,000,000 units ofCommon SPACESSM. Each unit has a stated value of $25 for an aggregate value of $400.0 million. Each CommonSPACES consists of (i) a stock purchase contract under which the investor agrees to purchase for $25, a fraction ofa share of the Corporation’s common stock on the stock purchase date and (ii) a 1/40, or 2.5%, undivided beneficialinterest in a preferred security of M&I Capital Trust B, also referred to as the STACKSSM, with each share havingan initial liquidation amount of $1,000. The stock purchase date is expected to be August 15, 2007, but could bedeferred for quarterly periods until August 15, 2008. Holders of the STACKS are entitled to receive quarterlycumulative cash distributions through the stock purchase date fixed initially at an annual rate of 3.90% of theliquidation amount of $1,000 per STACKS. In addition, the Corporation will make quarterly contract paymentsunder the stock purchase contract at the annual rate of 2.60% of the stated amount of $25 per stock purchasecontract.
Concurrently with the issuance of the STACKS, M&I Capital Trust B invested the proceeds in juniorsubordinated debt securities that were issued by the Corporation. The subordinated debt, which represents the soleasset of M&I Capital Trust B bears interest at an initial annual rate of 3.90% payable quarterly and matures onAugust 15, 2038.
The interest payment provisions for the junior subordinated debt securities correspond to the distributionprovisions of the STACKS and automatically reset to equal the distribution rate on the STACKS as and when thedistribution rate on the STACKS is reset. In addition, the interest payment dates on the junior subordinated debtsecurities may be changed, and the maturity of the junior subordinated debt securities may be shortened inconnection with a remarketing of the STACKS, in which case the distribution payment dates and final redemptiondate of the STACKS will automatically change as well.
The Corporation has the right to defer payments of interest on the junior subordinated debt securities at anytime or from time to time. The Corporation may not defer interest payments for any period of time that exceeds fiveyears with respect to any deferral period or that extends beyond the stated final maturity date of the juniorsubordinated debt securities. As a consequence of the Corporation’s extension of the interest payment period,distributions on the STACKS would be deferred. In the event the Corporation exercises its right to extend aninterest payment period, the Corporation is prohibited from paying dividends or making any distributions on, orredeeming, purchasing, acquiring or making a liquidation payment with respect to, shares of the Corporation’scapital stock.
The junior subordinated debt securities are junior in right of payment to all present and future seniorindebtedness of the Corporation. The Corporation may elect at any time effective on or after the stock purchasedate, including in connection with a remarketing of the STACKS, that the Corporation’s obligations under thejunior subordinated debt securities and under the Corporation’s guarantee of the STACKS shall be seniorobligations instead of subordinated obligations.
The payment of distributions, liquidation of M&I Capital Trust B and payment upon the redemption of thecapital securities of M&I Capital Trust B are guaranteed by the Corporation.
The junior subordinated debt securities qualify as “Tier 1” capital for regulatory capital purposes.
In December 1996, the Corporation formed M&I Capital Trust A (the “Trust”), which issued $200 million inliquidation or principal amount of cumulative preferred capital securities. Holders of the capital securities areentitled to receive cumulative cash distributions at an annual rate of 7.65% payable semiannually.
Concurrently with the issuance of the capital securities, the Trust invested the proceeds, together with theconsideration paid by the Corporation for the common interest in the Trust, in junior subordinated deferrable interest
1 0 2
Notes to Consolidated Financial Statements—(Continued)
December 31, 2004, 2003, and 2002 ($000’s except share data)
debentures (“subordinated debt”) issued by the Corporation. The subordinated debt, which represents the sole asset ofthe Trust, bears interest at an annual rate of 7.65% payable semiannually and matures on December 1, 2026.
The subordinated debt is junior in right of payment to all present and future senior indebtedness of theCorporation. The Corporation may redeem the subordinated debt in whole or in part at any time on or afterDecember 1, 2006 at specified call premiums, and at par on or after December 1, 2016. In addition, in certaincircumstances the subordinated debt may be redeemed at par upon the occurrence of certain events. TheCorporation’s right to redeem the subordinated debt is subject to regulatory approval.
The Corporation has the right, subject to certain conditions, to defer payments of interest on the subordinateddebt for extension periods, each period not exceeding ten consecutive semiannual periods. As a consequence of theCorporation’s extension of the interest payment period, distributions on the capital securities would be deferred. Inthe event the Corporation exercises its right to extend an interest payment period, the Corporation is prohibitedfrom making dividend or any other equity distributions during such extension period.
The payment of distributions, liquidation of the Trust and payment upon the redemption of the capitalsecurities of the Trust are guaranteed by the Corporation.
The junior subordinated deferrable interest debentures qualify as “Tier 1” capital for regulatory capitalpurposes.
Floating rate FHLB advances mature at various times between 2006 and 2008. The interest rate is resetmonthly based on the London Interbank Offered Rate (“LIBOR”). During 2004, M&I Bank prepaid $300.0 millionof floating rate FHLB advances and terminated certain receive floating / pay fixed interest rate swaps designated ascash flow hedges against the forecasted interest payments on certain FHLB advances. The termination of theinterest rate swaps resulted in a charge to earnings of $2.0 million. During 2003, M&I Bank prepaid $610.0 millionof floating rate FHLB advances and terminated certain receive floating / pay fixed interest rate swaps designated ascash flow hedges against the forecasted interest payments on certain FHLB advances. The termination of theinterest rate swaps resulted in a charge to earnings of $40.5 million in 2003. The charge to earnings resulting fromthese transactions is reported in other expense in the Consolidated Statements of Income for the years endedDecember 31, 2004 and 2003, respectively.
Fixed rate FHLB advances have interest rates, which range from 1.90% to 8.47% and mature at various timesin 2005 through 2017. During 2004, a fixed rate advance from the FHLB aggregating $55.0 million with an annualcoupon interest rate of 5.06% was prepaid and retired resulting in a charge to earnings of $4.9 million. During 2003,fixed rate advances from the FHLB aggregating $33.2 million with interest rates ranging from 5.82% to 7.03% wereprepaid and retired resulting in a charge to earnings of $5.2 million. The charge to earnings resulting from thesetransactions is reported in other expense in the Consolidated Statements of Income for the years ended December31, 2004 and 2003, respectively.
The Corporation is required to maintain unencumbered first mortgage loans and mortgage-related securitiessuch that the outstanding balance of FHLB advances does not exceed 60% of the book value of this collateral. Inaddition, a portion of these advances are collaterized by all FHLB stock.
The senior bank notes have fixed interest rates, which range from 2.63% to 4.67% and pay interest semi-annually. The senior bank notes outstanding mature at various times and amounts from 2007 through 2015. During2003, M&I Bank acquired through open market purchases $13.2 million of 4.125% senior bank notes that were duein 2007 and recognized a loss of $0.6 million. The charge to earnings resulting from this transaction is reported inother expense in the Consolidated Statements of Income for the year ended December 31, 2003.
The senior bank notes—Amortizing have a maturity date of August 18, 2009. The senior bank notes payinterest semi-annually at a fixed semi-annual coupon interest rate of 2.90%. In addition, principal in the amount of$18,182 is paid every coupon payment period beginning on August 18, 2004 and ending on August 18, 2009.
1 0 3
Notes to Consolidated Financial Statements—(Continued)
December 31, 2004, 2003, and 2002 ($000’s except share data)
The senior bank notes—Extendible Liquidity Securities (“EXLs”) are indexed to one month LIBOR plus astated spread. EXL noteholders have the ability to extend the maturity date through 2006. The stated spread isinitially 0.01%, 0.04% in year two, 0.07% in year three and 0.10% to maturity in 2006.
The senior bank notes—Puttable Reset Securities have a maturity date of December 15, 2016. However incertain circumstances, the notes will be put back to the issuing bank at par prior to final maturity. The notes arealso subject to the exercise of a call option by a certain broker-dealer. Beginning December 15, 2003 and eachDecember 15 thereafter until and including December 15, 2015, the broker-dealer has the right to purchase all ofthe outstanding notes from the noteholders at a price equal to 100% of the principal amount of the notes and thenremarket the notes. However, if the broker-dealer does not purchase the notes on the aforementioned date(s), eachholder of outstanding notes will be deemed to have put all of the holder’s notes to the issuing bank at a price equalto 100% of the principal amount of the notes and the notes will be completely retired. The current interest rate is5.209% and, to the extent the notes are purchased and remarketed, the interest rate will reset each date the notesare remarketed, subject to a floor of 5.17%. The call and put are considered clearly and closely related for purposesof recognition and measurement under SFAS 133. The fair value of the call option at December 31, 2004 and 2003was approximately $84 million and $94 million, respectively, as determined by the holder of the call option.
The subordinated bank notes have fixed rates that range from 5.00% to 7.88% and mature at various times in2010 through 2017. Interest is paid semi-annually. During 2003, M&I Bank acquired through open marketpurchases $22.3 million of 6.375% subordinated bank notes which were due in 2011 and recognized a loss of $3.4million. The charge to earnings resulting from this transaction is reported in other expense in the ConsolidatedStatements of Income for the year ended December 31, 2003. The subordinated bank notes qualify as “Tier 2” orsupplementary capital for regulatory capital purposes.
The nonrecourse notes are reported net of prepaid interest and represent borrowings by the commercialleasing subsidiary from banks and other financial institutions. These notes have a weighted average interest rate of6.56% at December 31, 2004 and are due in installments over varying periods through 2009. Lease financingreceivables at least equal to the amount of the notes are pledged as collateral.
Scheduled maturities of long-term borrowings are $1,106,831, $981,192, $193,522, and $847,096 for 2006through 2009, respectively.
15. Shareholders’ Equity
The Corporation has 5,000,000 shares of preferred stock authorized, of which the Board of Directors hasdesignated 2,000,000 shares as Series A Convertible Preferred Stock (the “Series A”), with a $100 value per sharefor conversion and liquidation purposes. Series A is nonvoting preferred stock. The same cash dividends will bepaid on Series A as would have been paid on the common stock exchanged for Series A.
At December 31, 2004 and 2003 there were no shares of Series A outstanding.
The preferred stock is treated as a common stock equivalent in all applicable per share calculations.
During the third quarter of 2004, the Corporation and M&I Capital Trust B issued 16,000,000 units ofCommon SPACESSM. Each unit has a stated value of $25.00 for an aggregate value of $400.0 million. EachCommon SPACES consists of (i) a stock purchase contract under which the investor agrees to purchase for $25, afraction of a share of the Corporation’s common stock on the stock purchase date and (ii) a 1/40, or 2.5%, undividedbeneficial interest in a preferred security of M&I Capital Trust B, also referred to as the STACKSSM, with eachshare having an initial liquidation amount of $1,000. The stock purchase date is expected to be August 15, 2007, butcould be deferred for quarterly periods until August 15, 2008. Holders of the STACKS are entitled to receivequarterly cumulative cash distributions through the stock purchase date fixed initially at an annual rate of 3.90% of
1 0 4
Notes to Consolidated Financial Statements—(Continued)
December 31, 2004, 2003, and 2002 ($000’s except share data)
the liquidation amount of $1,000 per STACKS. In addition, the Corporation will make quarterly contract paymentsunder the stock purchase contract at the annual rate of 2.60% of the stated amount of $25 per stock purchasecontract.
The Corporation recognized the present value of the quarterly contract payments under the stock purchasecontract as a liability with an offsetting reduction in shareholders’ equity. That liability along with the allocatedportion of the fees and expenses incurred for the offering of Common SPACES resulted in a reduction inshareholders’ equity of $34,039.
On the stock purchase date, the number of shares of common stock the Corporation will issue upon settlementof the stock purchase contracts depends on the applicable market value per share of the Corporation’s commonstock, which will be determined just prior to the stock purchase date, and other factors. The Corporation currentlyestimates that it will issue approximately 8.7 million to 10.9 million common shares to settle shares issuablepursuant to the stock purchase contracts.
Holders of Common SPACES have pledged their ownership interests in the STACKS as collateral for thebenefit of the Corporation to secure their obligations under the stock purchase contract. Holders of CommonSPACES have the option to elect to substitute pledged treasury securities for the pledged ownership interests in theSTACKS.
The Corporation sponsors a deferred compensation plan for its non-employee directors and the non-employeedirectors and advisory board members of its affiliates. Participants may elect to have their deferred fees used topurchase M&I common stock with dividend reinvestment. Such shares will be distributed to plan participants inaccordance with the plan provisions. At December 31, 2004 and 2003, 620,624 and 624,620 shares of M&I commonstock, respectively, were held in a grantor trust. The aggregate cost of such shares is included in DeferredCompensation as a reduction of Shareholders’ equity in the Consolidated Balance Sheets and amounted to $16,735at December 31, 2004 and $16,443 at December 31, 2003.
During 2003, the Corporation amended its deferred compensation plan for its non-employee directors andselected key employees to permit participants to defer the gain from the exercise of nonqualified stock options. Inaddition, the gain upon vesting of restricted common stock to participating executive officers may be deferred.Shares of M&I common stock, which represent the aggregate value of the gains deferred are maintained in agrantor trust with dividend reinvestment. Such shares will be distributed to plan participants in accordance with theplan provisions. At December 31, 2004 and 2003, 270,352 and 33,600 shares of M&I common stock, respectively,were held in the grantor trust. The aggregate cost of such shares is included in Deferred Compensation as areduction of Shareholders’ equity in the Consolidated Balance Sheets and amounted to $10,731 at December 31,2004 and $1,094 at December 31, 2003.
In conjunction with previous acquisitions, the Corporation assumed certain deferred compensation andnonqualified retirement plans for former directors and executive officers of acquired companies. At December 31,2004 and 2003, 87,557 and 114,383 common shares of M&I stock, respectively, were maintained in a grantor trustwith such shares to be distributed to plan participants in accordance with the provisions of the plans. The aggregatecost of such shares of $1,824 and $2,340 at December 31, 2004 and 2003, respectively, is included in DeferredCompensation as a reduction of Shareholders’ equity in the Consolidated Balance Sheets.
The Corporation issues treasury common stock in conjunction with exercises of stock options and restrictedstock, acquisitions, and conversions of convertible securities. Treasury shares are acquired from restricted stockforfeitures, shares tendered to cover tax withholding associated with stock option exercises and vesting of keyrestricted stock, mature shares tendered for stock option exercises in lieu of cash and open market purchases inaccordance with the Corporation’s approved share repurchase program. The Corporation is currently authorized torepurchase up to 12 million shares per year. Shares repurchased in accordance with the approved plan amounted to2.3 million shares with an aggregate cost of $88.5 million in 2004 and 6.0 million shares with an aggregate cost of$210.9 million in 2003.
1 0 5
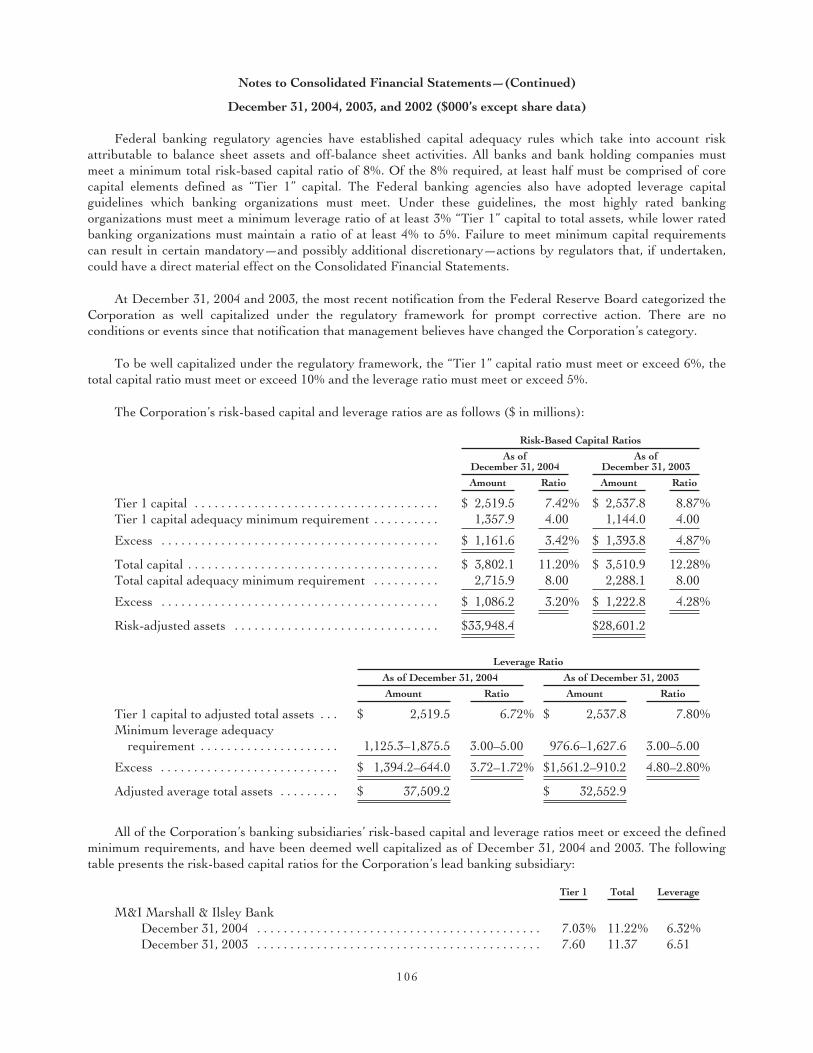
Notes to Consolidated Financial Statements—(Continued)
December 31, 2004, 2003, and 2002 ($000’s except share data)
Federal banking regulatory agencies have established capital adequacy rules which take into account riskattributable to balance sheet assets and off-balance sheet activities. All banks and bank holding companies mustmeet a minimum total risk-based capital ratio of 8%. Of the 8% required, at least half must be comprised of corecapital elements defined as “Tier 1” capital. The Federal banking agencies also have adopted leverage capitalguidelines which banking organizations must meet. Under these guidelines, the most highly rated bankingorganizations must meet a minimum leverage ratio of at least 3% “Tier 1” capital to total assets, while lower ratedbanking organizations must maintain a ratio of at least 4% to 5%. Failure to meet minimum capital requirementscan result in certain mandatory—and possibly additional discretionary—actions by regulators that, if undertaken,could have a direct material effect on the Consolidated Financial Statements.
At December 31, 2004 and 2003, the most recent notification from the Federal Reserve Board categorized theCorporation as well capitalized under the regulatory framework for prompt corrective action. There are noconditions or events since that notification that management believes have changed the Corporation’s category.
To be well capitalized under the regulatory framework, the “Tier 1” capital ratio must meet or exceed 6%, thetotal capital ratio must meet or exceed 10% and the leverage ratio must meet or exceed 5%.
The Corporation’s risk-based capital and leverage ratios are as follows ($ in millions):
Risk-Based Capital Ratios
As ofDecember 31, 2004
As ofDecember 31, 2003
Amount Ratio Amount Ratio
Tier 1 capital . . . . . . . . . . . . . . . . . . . . . . . . . . . . . . . . . . . . . $ 2,519.5 7.42% $ 2,537.8 8.87%Tier 1 capital adequacy minimum requirement . . . . . . . . . . 1,357.9 4.00 1,144.0 4.00
Excess . . . . . . . . . . . . . . . . . . . . . . . . . . . . . . . . . . . . . . . . . . $ 1,161.6 3.42% $ 1,393.8 4.87%
Total capital . . . . . . . . . . . . . . . . . . . . . . . . . . . . . . . . . . . . . . $ 3,802.1 11.20% $ 3,510.9 12.28%Total capital adequacy minimum requirement . . . . . . . . . . 2,715.9 8.00 2,288.1 8.00
Excess . . . . . . . . . . . . . . . . . . . . . . . . . . . . . . . . . . . . . . . . . . $ 1,086.2 3.20% $ 1,222.8 4.28%
Risk-adjusted assets . . . . . . . . . . . . . . . . . . . . . . . . . . . . . . . $33,948.4 $28,601.2
Leverage Ratio
As of December 31, 2004 As of December 31, 2003
Amount Ratio Amount Ratio
Tier 1 capital to adjusted total assets . . . $ 2,519.5 6.72% $ 2,537.8 7.80%Minimum leverage adequacy
requirement . . . . . . . . . . . . . . . . . . . . . 1,125.3–1,875.5 3.00–5.00 976.6–1,627.6 3.00–5.00
Excess . . . . . . . . . . . . . . . . . . . . . . . . . . . $ 1,394.2–644.0 3.72–1.72% $1,561.2–910.2 4.80–2.80%
Adjusted average total assets . . . . . . . . . $ 37,509.2 $ 32,552.9
All of the Corporation’s banking subsidiaries’ risk-based capital and leverage ratios meet or exceed the definedminimum requirements, and have been deemed well capitalized as of December 31, 2004 and 2003. The followingtable presents the risk-based capital ratios for the Corporation’s lead banking subsidiary:
Tier 1 Total Leverage
M&I Marshall & Ilsley BankDecember 31, 2004 . . . . . . . . . . . . . . . . . . . . . . . . . . . . . . . . . . . . . . . . . . . 7.03% 11.22% 6.32%December 31, 2003 . . . . . . . . . . . . . . . . . . . . . . . . . . . . . . . . . . . . . . . . . . . 7.60 11.37 6.51
1 0 6
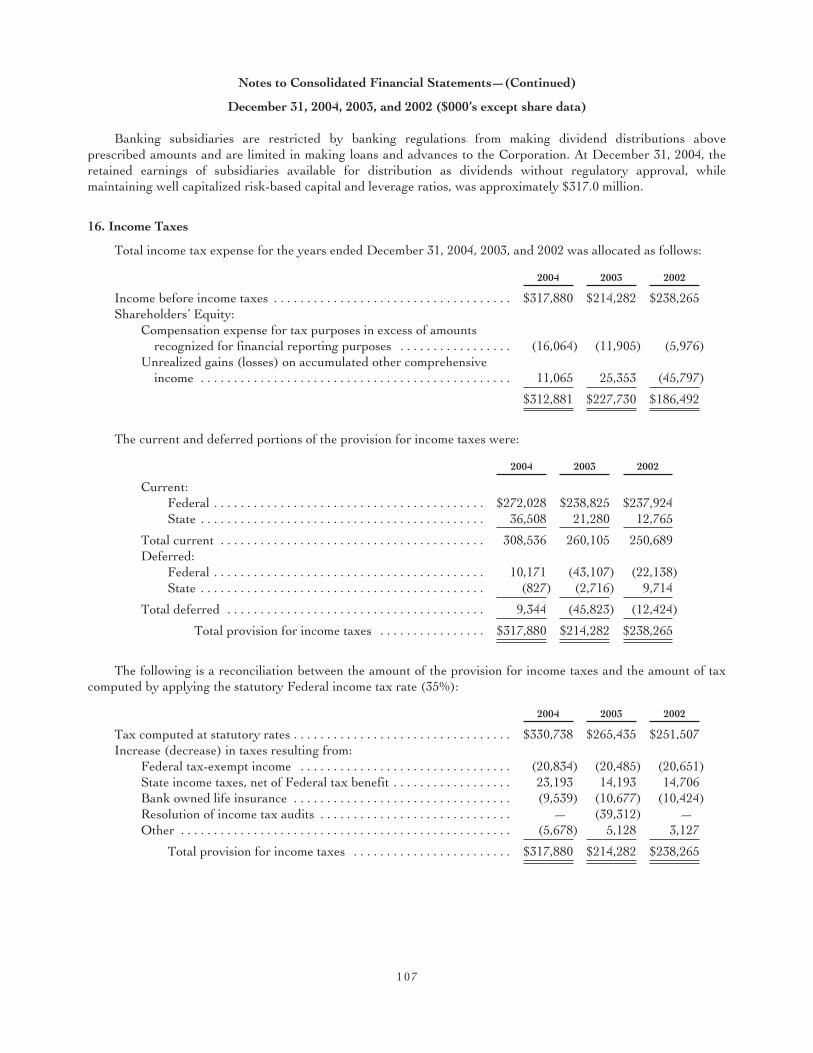
Notes to Consolidated Financial Statements—(Continued)
December 31, 2004, 2003, and 2002 ($000’s except share data)
Banking subsidiaries are restricted by banking regulations from making dividend distributions aboveprescribed amounts and are limited in making loans and advances to the Corporation. At December 31, 2004, theretained earnings of subsidiaries available for distribution as dividends without regulatory approval, whilemaintaining well capitalized risk-based capital and leverage ratios, was approximately $317.0 million.
16. Income Taxes
Total income tax expense for the years ended December 31, 2004, 2003, and 2002 was allocated as follows:
2004 2003 2002
Income before income taxes . . . . . . . . . . . . . . . . . . . . . . . . . . . . . . . . . . . . $317,880 $214,282 $238,265Shareholders’ Equity:
Compensation expense for tax purposes in excess of amountsrecognized for financial reporting purposes . . . . . . . . . . . . . . . . . (16,064) (11,905) (5,976)
Unrealized gains (losses) on accumulated other comprehensiveincome . . . . . . . . . . . . . . . . . . . . . . . . . . . . . . . . . . . . . . . . . . . . . . . 11,065 25,353 (45,797)
$312,881 $227,730 $186,492
The current and deferred portions of the provision for income taxes were:
2004 2003 2002
Current:Federal . . . . . . . . . . . . . . . . . . . . . . . . . . . . . . . . . . . . . . . . . $272,028 $238,825 $237,924State . . . . . . . . . . . . . . . . . . . . . . . . . . . . . . . . . . . . . . . . . . . 36,508 21,280 12,765
Total current . . . . . . . . . . . . . . . . . . . . . . . . . . . . . . . . . . . . . . . . 308,536 260,105 250,689Deferred:
Federal . . . . . . . . . . . . . . . . . . . . . . . . . . . . . . . . . . . . . . . . . 10,171 (43,107) (22,138)State . . . . . . . . . . . . . . . . . . . . . . . . . . . . . . . . . . . . . . . . . . . (827) (2,716) 9,714
Total deferred . . . . . . . . . . . . . . . . . . . . . . . . . . . . . . . . . . . . . . . 9,344 (45,823) (12,424)
Total provision for income taxes . . . . . . . . . . . . . . . . $317,880 $214,282 $238,265
The following is a reconciliation between the amount of the provision for income taxes and the amount of taxcomputed by applying the statutory Federal income tax rate (35%):
2004 2003 2002
Tax computed at statutory rates . . . . . . . . . . . . . . . . . . . . . . . . . . . . . . . . . $330,738 $265,435 $251,507Increase (decrease) in taxes resulting from:
Federal tax-exempt income . . . . . . . . . . . . . . . . . . . . . . . . . . . . . . . . (20,834) (20,485) (20,651)State income taxes, net of Federal tax benefit . . . . . . . . . . . . . . . . . . 23,193 14,193 14,706Bank owned life insurance . . . . . . . . . . . . . . . . . . . . . . . . . . . . . . . . . (9,539) (10,677) (10,424)Resolution of income tax audits . . . . . . . . . . . . . . . . . . . . . . . . . . . . . — (39,312) —Other . . . . . . . . . . . . . . . . . . . . . . . . . . . . . . . . . . . . . . . . . . . . . . . . . . (5,678) 5,128 3,127
Total provision for income taxes . . . . . . . . . . . . . . . . . . . . . . . . $317,880 $214,282 $238,265
1 0 7

Notes to Consolidated Financial Statements—(Continued)
December 31, 2004, 2003, and 2002 ($000’s except share data)
The tax effects of temporary differences that give rise to significant elements of the deferred tax assets anddeferred tax liabilities at December 31 are as follows:
2004 2003
Deferred tax assets:Deferred compensation . . . . . . . . . . . . . . . . . . . . . . . . . . . . . . . . . . . . . . . . . . . . . $ 51,400 $ 45,631Allowance for loan and lease losses . . . . . . . . . . . . . . . . . . . . . . . . . . . . . . . . . . . . 142,651 141,030Accrued postretirement benefits . . . . . . . . . . . . . . . . . . . . . . . . . . . . . . . . . . . . . . 31,452 32,401Accrued expenses . . . . . . . . . . . . . . . . . . . . . . . . . . . . . . . . . . . . . . . . . . . . . . . . . . 32,552 33,103State NOLs . . . . . . . . . . . . . . . . . . . . . . . . . . . . . . . . . . . . . . . . . . . . . . . . . . . . . . 36,099 45,833Other . . . . . . . . . . . . . . . . . . . . . . . . . . . . . . . . . . . . . . . . . . . . . . . . . . . . . . . . . . . 63,768 65,019
Total deferred tax assets before valuation allowance . . . . . . . . . . . . . . . . . . 357,922 363,017Valuation allowance . . . . . . . . . . . . . . . . . . . . . . . . . . . . . . . . . . . . . . . . . . . . . . . . (40,228) (43,871)
Net deferred tax assets . . . . . . . . . . . . . . . . . . . . . . . . . . . . . . . . . . . . . . . . . 317,694 319,146Deferred tax liabilities:
Lease revenue reporting . . . . . . . . . . . . . . . . . . . . . . . . . . . . . . . . . . . . . . . . . . . . 132,967 129,811Conversion cost deferred . . . . . . . . . . . . . . . . . . . . . . . . . . . . . . . . . . . . . . . . . . . . 60,806 57,099Premises and equipment, principally due to depreciation . . . . . . . . . . . . . . . . . . 17,371 5,532Purchase accounting adjustments . . . . . . . . . . . . . . . . . . . . . . . . . . . . . . . . . . . . . 115,646 34,390Accumulated other comprehensive income . . . . . . . . . . . . . . . . . . . . . . . . . . . . . 12,549 1,484Other . . . . . . . . . . . . . . . . . . . . . . . . . . . . . . . . . . . . . . . . . . . . . . . . . . . . . . . . . . . 54,611 61,418
Total deferred tax liabilities . . . . . . . . . . . . . . . . . . . . . . . . . . . . . . . . . . . . . . 393,950 289,734
Net deferred tax (liability) asset . . . . . . . . . . . . . . . . . . . . . . . . . . . . . . . . . . $(76,256) $ 29,412
The Corporation continues to carry a valuation allowance to reduce certain state deferred tax assets whichinclude, in part, certain state net operating loss carryforwards which expire at various times through 2017. AtDecember 31, 2004, the Corporation believes it is more likely than not that these items will not be realized.However, as time passes the Corporation will be able to better assess the amount of tax benefit it will realize fromusing these items.
17. Stock Option, Restricted Stock and Employee Stock Purchase Plans
The Corporation has Executive Stock Option and Restricted Stock Plans which provide for the grant ofnonqualified and incentive stock options, stock appreciation rights and rights to purchase restricted shares to keyemployees and directors of the Corporation at prices ranging from zero to the market value of the shares at the dateof grant.
The Corporation also has a qualified employee stock purchase plan which gives employees, who elect toparticipate in the plan, the right to acquire shares of the Corporation’s Common Stock at the purchase price whichis 85 percent of the lesser of the fair market value of the Corporation’s Common Stock on the first or last day of theone-year offering period.
The nonqualified and incentive stock option plans generally provide for the grant of options to purchase sharesof the Corporation’s common stock for a period of ten years from the date of grant. Options granted generallybecome exercisable over a period of three years from the date of grant. However, options granted to directors of theCorporation vest immediately and options granted after 1996 provide accelerated or immediate vesting for grants toindividuals who meet certain age and years of service criteria at the date of grant.
1 0 8

Notes to Consolidated Financial Statements—(Continued)
December 31, 2004, 2003, and 2002 ($000’s except share data)
Activity relating to nonqualified and incentive stock options was:
Number ofShares
Option PricePer Share
Weighted-AverageExercise
Price
Shares under option at December 31, 2001 . . . . . . . . . . . . . . . . . . . 17,504,264 $ 6.20–35.03 $24.81Options granted . . . . . . . . . . . . . . . . . . . . . . . . . . . . . . . . . . . . . . . . . 4,803,042 12.87–31.78 27.04Options lapsed or surrendered . . . . . . . . . . . . . . . . . . . . . . . . . . . . . (375,658) 15.94–35.03 28.68Options exercised . . . . . . . . . . . . . . . . . . . . . . . . . . . . . . . . . . . . . . . (985,247) 6.20–30.75 15.58
Shares under option at December 31, 2002 . . . . . . . . . . . . . . . . . . . 20,946,401 $ 7.69–33.94 $25.69Options granted . . . . . . . . . . . . . . . . . . . . . . . . . . . . . . . . . . . . . . . . . 3,794,250 25.93–38.25 34.48Options lapsed or surrendered . . . . . . . . . . . . . . . . . . . . . . . . . . . . . (478,454) 9.63–34.79 29.42Options exercised . . . . . . . . . . . . . . . . . . . . . . . . . . . . . . . . . . . . . . . (2,479,381) 7.69–34.79 19.75
Shares under option at December 31, 2003 . . . . . . . . . . . . . . . . . . . 21,782,816 $ 9.63–38.25 $27.81Options granted . . . . . . . . . . . . . . . . . . . . . . . . . . . . . . . . . . . . . . . . . 3,758,145 36.76–44.20 41.64Options lapsed or surrendered . . . . . . . . . . . . . . . . . . . . . . . . . . . . . (343,070) 15.94–41.95 32.12Options exercised . . . . . . . . . . . . . . . . . . . . . . . . . . . . . . . . . . . . . . . (2,319,794) 9.63–34.79 21.09
Shares under option at December 31, 2004 . . . . . . . . . . . . . . . . . . . 22,878,097 $10.13–44.20 $30.70
The range of options outstanding at December 31, 2004 were:
Price Range
Number of SharesWeighted-Average
Exercise Price
Weighted-Average
RemainingContractual
Life (In Years)Outstanding Exercisable Outstanding Exercisable
$10.00–20.49 . . . . . . . . . . . . . . . . . . . . . 1,102,463 1,102,463 $14.62 $14.62 1.920.50–23.99 . . . . . . . . . . . . . . . . . . . . . 2,452,191 2,452,191 21.93 21.93 5.824.00–28.49 . . . . . . . . . . . . . . . . . . . . . 2,046,052 1,977,431 25.91 25.87 4.528.50–28.99 . . . . . . . . . . . . . . . . . . . . . 4,450,700 3,610,790 28.54 28.54 6.429.00–31.99 . . . . . . . . . . . . . . . . . . . . . 5,593,967 5,465,432 31.32 31.35 6.232.00–34.99 . . . . . . . . . . . . . . . . . . . . . 3,439,379 1,619,649 34.75 34.71 8.7
Over $35.00 . . . . . . . . . . . . . . . . . . . . . . 3,793,345 617,574 41.57 41.04 9.8
22,878,097 16,845,530 $30.70 $28.32 6.8
Options exercisable at December 31, 2003 and 2002 were 15,810,384 and 14,933,431, respectively. Theweighted-average exercise price for options exercisable was $26.19 at December 31, 2003 and $24.48 at December31, 2002.
Statement of Financial Accounting Standards No. 123 (“SFAS 123”), Accounting for Stock-BasedCompensation,” establishes financial accounting and reporting standards for stock based employee compensationplans.
SFAS 123 defines a fair value based method of accounting for employee stock option or similar equityinstruments. Under the fair value based method, compensation cost is measured at the grant date based on the fairvalue of the award using an option-pricing model that takes into account the stock price at the grant date, theexercise price, the expected life of the option, the volatility of the underlying stock, expected dividends and the risk-free interest rate over the expected life of the option. The resulting compensation cost is recognized over the serviceperiod, which is usually the vesting period.
Compensation cost can also be measured and accounted for using the intrinsic value based method ofaccounting prescribed in Accounting Principles Board Opinion No. 25 (“APBO 25”), Accounting for Stock Issued to
1 0 9

Notes to Consolidated Financial Statements—(Continued)
December 31, 2004, 2003, and 2002 ($000’s except share data)
Employees. Under the intrinsic value based method, compensation cost is the excess, if any, of the quoted marketprice of the stock at grant date or other measurement date over the amount paid to acquire the stock.
The largest differences between SFAS 123 and APBO 25 as it relates to the Corporation is the amount ofcompensation cost attributable to the Corporation’s fixed stock option plans and employee stock purchase plan(“ESPP”). Under APBO 25 no compensation cost is recognized for fixed stock option plans because the exerciseprice is equal to the quoted market price at the date of grant and therefore there is no intrinsic value. SFAS 123compensation cost would equal the calculated fair value of the options granted. Under APBO 25 no compensationcost is recognized for the ESPP because the discount (15%) and the plan meets the definition of a qualified plan ofthe Internal Revenue Code and meets the requirements of APBO 25. Under SFAS 123 the safe-harbor discountthreshold is 5% for a plan to be non-compensatory. SFAS 123 compensation cost would be approximately equal tothe initial discount (15% of beginning of plan period price per share) plus the value of a one year call option on 85%of a share of stock for each share purchased.
As permitted by SFAS 123, the Corporation continues to measure compensation cost for such plans using theaccounting method prescribed by APBO 25.
Had compensation cost for the Corporation’s ESPP and options granted after January 1, 1995 beendetermined consistent with SFAS 123, the Corporation’s net income and earnings per share would have beenreduced to the following pro forma amounts:
For the Years EndedDecember 31,
2004 2003 2002
Net income as reported . . . . . . . . . . . . . . . . . . . . . . . . . . . . . . . . $627,086 $544,105 $480,327Add: Stock-based employee compensation expense included
in reported net income, net of tax . . . . . . . . . . . . . . . . . 9,466 7,139 1,673Less: Total stock-based employee compensation expense
determined under fair value based method for allawards, net of tax . . . . . . . . . . . . . . . . . . . . . . . . . . . . . . (31,041) (29,452) (23,819)
Pro forma net income . . . . . . . . . . . . . . . . . . . . . . . . . . . . . . . . . $605,511 $521,792 $458,181
Basic earnings per share:As reported . . . . . . . . . . . . . . . . . . . . . . . . . . . . . . . . . . . . . $ 2.81 $ 2.41 $ 2.24Pro forma . . . . . . . . . . . . . . . . . . . . . . . . . . . . . . . . . . . . . . . 2.72 2.31 2.13
Diluted earnings per share:As reported . . . . . . . . . . . . . . . . . . . . . . . . . . . . . . . . . . . . . $ 2.77 $ 2.38 $ 2.16Pro forma . . . . . . . . . . . . . . . . . . . . . . . . . . . . . . . . . . . . . . . 2.66 2.29 2.07
The fair value of each option grant was estimated as of the date of grant using the Black-Scholes closed formoption-pricing model for options granted prior to September 30, 2004. A form of a lattice option-pricing model wasused for options granted after September 30, 2004.
The grant date fair values and assumptions used to determine such value are as follows:
2004 2003 2002
Weighted-average grant date fair value . . . . . . . . $ 7.48 $ 10.00 $ 8.15Assumptions:
Risk-free interest rates . . . . . . . . . . . . . . . . . . 3.17– 4.45% 2.54– 3.83% 3.11– 5.16%Expected volatility . . . . . . . . . . . . . . . . . . . . . 18.00–30.33% 30.23–31.19% 30.95–31.25%Expected term (in years) . . . . . . . . . . . . . . . . 6.0 6.0 6.0Expected dividend yield . . . . . . . . . . . . . . . . 1.93% 2.19% 2.10%
1 1 0

Notes to Consolidated Financial Statements—(Continued)
December 31, 2004, 2003, and 2002 ($000’s except share data)
The estimated compensation cost per share for the ESPP was $8.04 and $5.75 for 2004 and 2003, respectively.During 2004 and 2003, common shares purchased by employees under the ESPP amounted to 332,520 and347,194, respectively.
Activity relating to the Corporation’s Restricted Stock Purchase Rights was:
December 31
2004 2003 2002
Restricted stock purchase rights outstanding—Beginning of Year . . . . . . . . . . . . . . . . . . . . . . . . . . . . . . . . — — —
Restricted stock purchase rights granted . . . . . . . . . . . . . . . . 172,700 163,300 46,000Restricted stock purchase rights exercised . . . . . . . . . . . . . . . (172,700) (163,300) (46,000)
Restricted stock purchase rights outstanding—End of Year . . . . . . . . . . . . . . . . . . . . . . . . . . . . . . . . . . . . . — — —
Weighted-average grant date market value . . . . . . . . . . . . . . $ 41.50 $ 34.28 $ 29.76Aggregate compensation expense . . . . . . . . . . . . . . . . . . . . . . $ 3,153 $ 1,111 $ 779Unamortized deferred compensation . . . . . . . . . . . . . . . . . . . $ 10,727 $ 6,910 $ 3,045
Restrictions on stock issued pursuant to the exercise of stock purchase rights generally lapse within a three toseven year period. Accordingly, the compensation related to issuance of the rights is deferred and amortized overthe vesting period. Unamortized deferred compensation is reflected as a reduction of Shareholders’ equity.
Shares reserved for the granting of options and stock purchase rights at December 31, 2004 were 7,992,362.
The Corporation also has a Long-Term Incentive Plan. Under the plan, performance units may be awardedfrom time to time. Once awarded, additional performance units will be credited to each participant based ondividends paid by the Corporation on its common stock. At the end of a designated vesting period, participants willreceive an amount equal to some percent (0%–275%) of the initial performance units credited plus those additionalunits credited as dividends based on the established performance criteria. Units awarded to certain executives of theCorporation were 121,500 in 2004, 133,500 in 2003, and 117,000 in 2002. The vesting period is three years from thedate the performance units were awarded. At December 31, 2004, based on the performance criteria, approximately$11,903 would be due to the participants under the 2002 and 2003 awards. In addition, the amount payable toparticipants under the 2001 award, which was fully vested, was $6,770 at December 31, 2004.
See Note 1, New accounting pronouncement, for a discussion of SFAS 123(R), Share-Based Payment whichthe Corporation will be required to adopt beginning in the third quarter of 2005.
18. Employee Retirement and Health Plans
The Corporation has a defined contribution program that consists of a retirement plan and employee stockownership plan for substantially all employees. The retirement plan provides for a guaranteed contribution toeligible participants equal to 2% of compensation. At the Corporation’s option, an additional profit sharing amountmay also be contributed to the retirement plan and may vary from year to year up to a maximum of 6% of eligiblecompensation. Under the employee stock ownership plan, employee contributions into the retirement plan of up to6% of eligible compensation are matched up to 50% by the Corporation based on the Corporation’s return on equityas defined by the plan. Total expense relating to these plans was $52,065, $52,946, and $49,586 in 2004, 2003, and2002, respectively.
The Corporation also has supplemental retirement plans to provide retirement benefits to certain of its keyexecutives. Total expense relating to these plans amounted to $3,213 in 2004, $10,779 in 2003, and $1,484 in 2002.
1 1 1

Notes to Consolidated Financial Statements—(Continued)
December 31, 2004, 2003, and 2002 ($000’s except share data)
The Corporation sponsors a defined benefit health plan that provides health care benefits to eligible currentand retired employees. Eligibility for retiree benefits is dependent upon age, years of service, and participation inthe health plan during active service. The plan is contributory and in 1997 and 2002 the plan was amended.Employees hired or retained from mergers after September 1, 1997 will be granted access to the Corporation’s planupon becoming an eligible retiree; however, such retirees must pay 100% of the cost of health care benefits. Theplan continues to contain other cost-sharing features such as deductibles and coinsurance. In addition to the normalmonthly funding for claims, the Corporation expects to make an additional contribution to its plan of approximately$7.0 million in 2005.
The changes during the year of the accumulated postretirement benefit obligation (“APBO”) for retiree healthbenefits are as follows:
2004 2003
Change in Benefit ObligationAPBO, beginning of year . . . . . . . . . . . . . . . . . . . . . . . . . . . . . . . . . . . . . . . . . . . . $ 83,337 $ 81,442Service cost . . . . . . . . . . . . . . . . . . . . . . . . . . . . . . . . . . . . . . . . . . . . . . . . . . . . . . . 2,523 2,140Interest cost on APBO . . . . . . . . . . . . . . . . . . . . . . . . . . . . . . . . . . . . . . . . . . . . . . 5,008 5,340Actuarial gains . . . . . . . . . . . . . . . . . . . . . . . . . . . . . . . . . . . . . . . . . . . . . . . . . . . . (5,785) (2,216)Other Events (Medicare Part D) . . . . . . . . . . . . . . . . . . . . . . . . . . . . . . . . . . . . . (7,842) —Benefits paid . . . . . . . . . . . . . . . . . . . . . . . . . . . . . . . . . . . . . . . . . . . . . . . . . . . . . . (3,589) (3,369)
APBO, end of year . . . . . . . . . . . . . . . . . . . . . . . . . . . . . . . . . . . . . . . . . . . . . . . . . 73,652 83,337
Change in Plan AssetsFair value of plan assets, beginning of year . . . . . . . . . . . . . . . . . . . . . . . . . . . . . . — —Actual return on plan assets . . . . . . . . . . . . . . . . . . . . . . . . . . . . . . . . . . . . . . . . . . 407 —Employer contribution/payments . . . . . . . . . . . . . . . . . . . . . . . . . . . . . . . . . . . . . . 11,008 3,369Benefits paid . . . . . . . . . . . . . . . . . . . . . . . . . . . . . . . . . . . . . . . . . . . . . . . . . . . . . . (3,589) (3,369)
Fair value of plan assets, end of year . . . . . . . . . . . . . . . . . . . . . . . . . . . . . . . . . . . 7,826 —
Unfunded status . . . . . . . . . . . . . . . . . . . . . . . . . . . . . . . . . . . . . . . . . . . . . . . . . . . 65,826 83,337Unrecognized actuarial net loss . . . . . . . . . . . . . . . . . . . . . . . . . . . . . . . . . . . . . . . (20,008) (35,406)Unrecognized prior service cost . . . . . . . . . . . . . . . . . . . . . . . . . . . . . . . . . . . . . . . 25,563 28,284
Accrued postretirement benefit cost . . . . . . . . . . . . . . . . . . . . . . . . . . . . . . . . . . . $ 71,381 $ 76,215
Weighted average discount rate used in determining APBO . . . . . . . . . . . . . . . . 6.25% 6.50%
The assumed health care cost trend for 2005 was 10.00% for pre-age 65 and post-age 65 retirees. The rate wasassumed to decrease gradually to 5.00% for pre-age 65 and post-age 65 retirees in 2010 and remain at that levelthereafter.
Net periodic postretirement benefit cost for the years ended December 31, 2004, 2003 and 2002 includes thefollowing components:
2004 2003 2002
Service cost . . . . . . . . . . . . . . . . . . . . . . . . . . . . . . . . . . . . . . . . . . . . . . . . . . . . . $ 2,523 $ 2,140 $ 1,182Interest cost on APBO . . . . . . . . . . . . . . . . . . . . . . . . . . . . . . . . . . . . . . . . . . . . 5,008 5,340 5,491Expected return on plan assets . . . . . . . . . . . . . . . . . . . . . . . . . . . . . . . . . . . . . (300) — —Prior service amortization . . . . . . . . . . . . . . . . . . . . . . . . . . . . . . . . . . . . . . . . . (2,721) (2,721) (2,721)Actuarial loss amortization . . . . . . . . . . . . . . . . . . . . . . . . . . . . . . . . . . . . . . . . 1,664 2,005 2,495Other . . . . . . . . . . . . . . . . . . . . . . . . . . . . . . . . . . . . . . . . . . . . . . . . . . . . . . . . . . — 660 —
Net periodic postretirement (benefit)/cost . . . . . . . . . . . . . . . . . . . . . . . . . . . . $ 6,174 $ 7,424 $ 6,447
1 1 2

Notes to Consolidated Financial Statements—(Continued)
December 31, 2004, 2003, and 2002 ($000’s except share data)
The assumed health care cost trend rate has a significant effect on the amounts reported for the health careplans. A one-percentage point change on assumed health care cost trend rates would have the following effects:
OnePercentage
PointIncrease
OnePercentage
PointDecrease
Effect on total of service and interest cost components . . . . . . . . . . . . . . . . . . . . . . . $ 970 $ (833)Effect on accumulated postretirement benefit obligation . . . . . . . . . . . . . . . . . . . . . . 7,978 (7,061)
Postretirement medical plan weighted–average asset allocations at December 31, 2004 by asset category are asfollows:
Plan Assets by Category
Equity securities . . . . . . . . . . . . . . . . . . . . . . . . . . . . . . . . . . . . . . . . . . . . . . . . . . . . . . . . . . . . . 48%Tax exempt debt securities . . . . . . . . . . . . . . . . . . . . . . . . . . . . . . . . . . . . . . . . . . . . . . . . . . . . 45Cash . . . . . . . . . . . . . . . . . . . . . . . . . . . . . . . . . . . . . . . . . . . . . . . . . . . . . . . . . . . . . . . . . . . . . . 7
Total . . . . . . . . . . . . . . . . . . . . . . . . . . . . . . . . . . . . . . . . . . . . . . . . . . . . . . . . . . . . . . . . . . 100%
The plan was not funded in 2003.
The Corporation’s primary investment objective is to achieve a combination of capital appreciation and currentincome. The long-term target asset mix is 50% fixed income and 50% equity securities. Individual fixed incomesecurities may be taxable or tax-exempt and will have maturities of thirty years or less. The average maturity of theportfolio will not exceed ten years.
The following benefit payments, which reflect expected future service, as appropriate, are expected to be paid:
Total WithoutMedicare Part D
EstimatedMedicare
Part D Subsidy
2005 . . . . . . . . . . . . . . . . . . . . . . . . . . . . . . . . . . . . . . . . . . . . . . . . . $ 4,057 $ —2006 . . . . . . . . . . . . . . . . . . . . . . . . . . . . . . . . . . . . . . . . . . . . . . . . . 4,640 (521)2007 . . . . . . . . . . . . . . . . . . . . . . . . . . . . . . . . . . . . . . . . . . . . . . . . . 5,285 (587)2008 . . . . . . . . . . . . . . . . . . . . . . . . . . . . . . . . . . . . . . . . . . . . . . . . . 5,886 (639)2009 . . . . . . . . . . . . . . . . . . . . . . . . . . . . . . . . . . . . . . . . . . . . . . . . . 6,503 (676)2010–2014 . . . . . . . . . . . . . . . . . . . . . . . . . . . . . . . . . . . . . . . . . . . . 38,389 (3,613)
On December 8, 2003 the Medicare Prescription Drug, Improvement and Modernization Act of 2003 (the“Act”) was signed into law. The Act introduces a prescription drug benefit program under Medicare (MedicarePart D) as well as a 28% Federal subsidy to sponsors of retiree health care benefit plans that provide a benefit thatis at least actuarially equivalent to Medicare Part D.
In May 2004, the Financial Accounting Standards Board issued FSP 106-2, Accounting and DisclosureRequirements Related to the Medicare Prescription Drug, Improvement and Modernization Act of 2003. FSP 106-2requires companies to account for the effect of the subsidy on benefits attributable to past service as an actuarialexperience gain and as a reduction of the service cost component of net postretirement health care costs for amountsattributable to current service, if the benefit provided is at least actuarially equivalent to Medicare Part D.
During the third quarter of 2004, the Corporation elected to adopt FSP 106-2 and to retroactively recognizethe Act from January 1, 2004. The Corporation and its actuarial advisors determined that benefits provided tocertain participants are expected to be at least actuarially equivalent to Medicare Part D, and, accordingly the
1 1 3

Notes to Consolidated Financial Statements—(Continued)
December 31, 2004, 2003, and 2002 ($000’s except share data)
Corporation will be entitled to some subsidy. The expected subsidy reduced the accumulated postretirement benefitobligation at January 1, 2004 by approximately $7.8 million and net periodic cost for the year ended December 31,2004 by approximately $1.3 million as compared with the amount determined without considering the effects of thesubsidy.
Assumptions used to develop this reduction included those used in the determination of the annualpostretirement health care expense and also include expectations of how the Federal program will ultimatelyoperate.
On January 21, 2005 final regulations establishing how Medicare Part B will operate were published. TheCorporation is presently evaluating the final regulations and is assessing the impact, if any, of the regulations on itspostretirement costs. That assessment includes determining whether the issuance of the final regulations may beconsidered a significant event for accounting purposes. A significant event under applicable accounting standardsrequires a re-measurement of such costs.
19. Financial Instruments with Off-Balance Sheet Risk
Financial instruments with off-balance sheet risk at December 31 were:
2004 2003
Financial instruments whose amounts represent credit risk:Commitments to extend credit:
To commercial customers . . . . . . . . . . . . . . . . . . . . . . . . . . . . . . . . . . . $11,407,915 $9,200,839To individuals . . . . . . . . . . . . . . . . . . . . . . . . . . . . . . . . . . . . . . . . . . . . . 2,637,837 2,584,560
Commercial letters of credit . . . . . . . . . . . . . . . . . . . . . . . . . . . . . . . . . . . . . 87,428 63,368Mortgage loans sold with recourse . . . . . . . . . . . . . . . . . . . . . . . . . . . . . . . . 152,042 464
Commitments to extend credit are agreements to lend to a customer as long as there is no violation of anycondition established in the contract. Commitments generally have fixed expiration dates and may require paymentof a fee. The majority of the Corporation’s commitments to extend credit generally provide for the interest rate to bedetermined at the time the commitment is utilized. Since many of the commitments are expected to expire withoutbeing drawn upon, the total commitment amounts do not necessarily represent future cash requirements.
The Corporation evaluates each customer’s credit worthiness on an individual basis. Collateral obtained, if any,upon extension of credit, is based upon management’s credit evaluation of the customer. Collateral requirementsand the ability to access collateral is generally similar to that required on loans outstanding as discussed in Note 7.
Commercial letters of credit are contingent commitments issued by the Corporation to support the financialobligations of a customer to a third party. Commercial letters of credit are issued to support payment obligations ofa customer as buyer in a commercial contract for the purchase of goods. Letters of credit have maturities whichgenerally reflect the maturities of the underlying obligations. The credit risk involved in issuing letters of credit isthe same as that involved in extending loans to customers. If deemed necessary, the Corporation holds variousforms of collateral to support letters of credit.
Certain mortgage loans sold have limited recourse provisions. The Corporation expects losses arising from thelimited recourse provisions to be insignificant.
20. Foreign Exchange Contracts
Foreign exchange contracts are commitments to purchase or deliver foreign currency at a specified exchangerate. The Corporation enters into foreign exchange contracts primarily in connection with trading activities toenable customers involved in international trade to hedge their exposure to foreign currency fluctuations and to
1 1 4
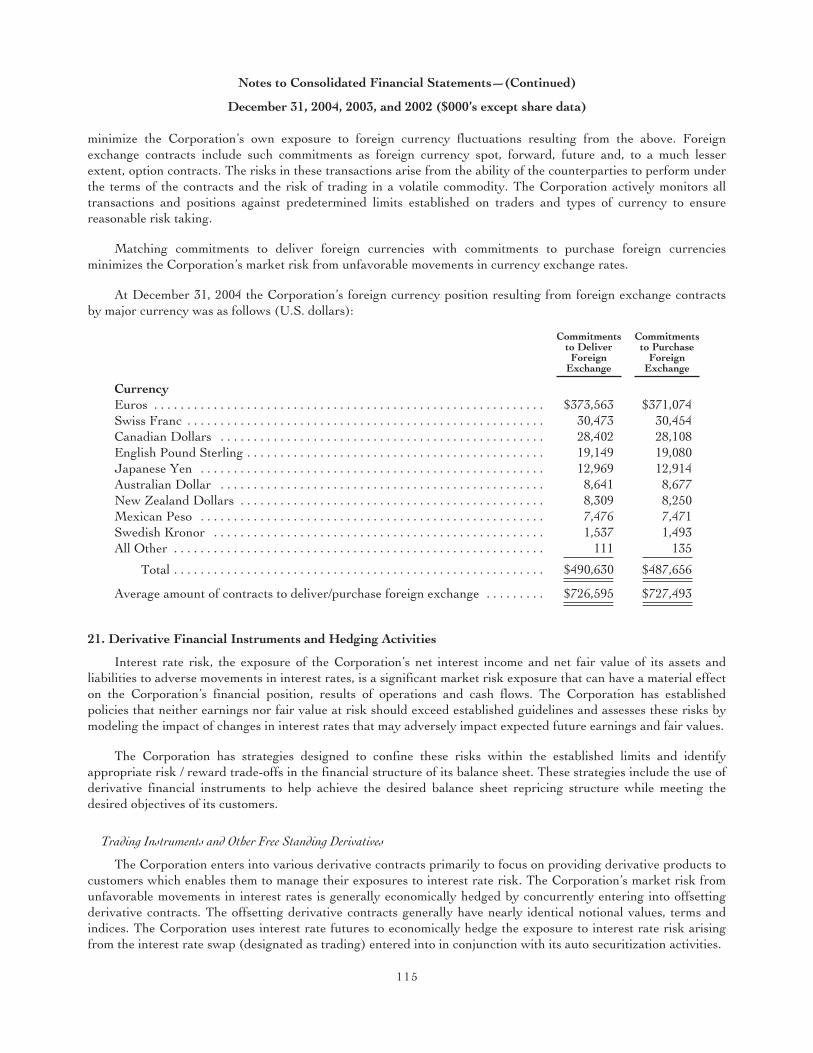
Notes to Consolidated Financial Statements—(Continued)
December 31, 2004, 2003, and 2002 ($000’s except share data)
minimize the Corporation’s own exposure to foreign currency fluctuations resulting from the above. Foreignexchange contracts include such commitments as foreign currency spot, forward, future and, to a much lesserextent, option contracts. The risks in these transactions arise from the ability of the counterparties to perform underthe terms of the contracts and the risk of trading in a volatile commodity. The Corporation actively monitors alltransactions and positions against predetermined limits established on traders and types of currency to ensurereasonable risk taking.
Matching commitments to deliver foreign currencies with commitments to purchase foreign currenciesminimizes the Corporation’s market risk from unfavorable movements in currency exchange rates.
At December 31, 2004 the Corporation’s foreign currency position resulting from foreign exchange contractsby major currency was as follows (U.S. dollars):
Commitmentsto DeliverForeign
Exchange
Commitmentsto Purchase
ForeignExchange
CurrencyEuros . . . . . . . . . . . . . . . . . . . . . . . . . . . . . . . . . . . . . . . . . . . . . . . . . . . . . . . . . . . $373,563 $371,074Swiss Franc . . . . . . . . . . . . . . . . . . . . . . . . . . . . . . . . . . . . . . . . . . . . . . . . . . . . . . 30,473 30,454Canadian Dollars . . . . . . . . . . . . . . . . . . . . . . . . . . . . . . . . . . . . . . . . . . . . . . . . . 28,402 28,108English Pound Sterling . . . . . . . . . . . . . . . . . . . . . . . . . . . . . . . . . . . . . . . . . . . . . 19,149 19,080Japanese Yen . . . . . . . . . . . . . . . . . . . . . . . . . . . . . . . . . . . . . . . . . . . . . . . . . . . . 12,969 12,914Australian Dollar . . . . . . . . . . . . . . . . . . . . . . . . . . . . . . . . . . . . . . . . . . . . . . . . . 8,641 8,677New Zealand Dollars . . . . . . . . . . . . . . . . . . . . . . . . . . . . . . . . . . . . . . . . . . . . . . 8,309 8,250Mexican Peso . . . . . . . . . . . . . . . . . . . . . . . . . . . . . . . . . . . . . . . . . . . . . . . . . . . . 7,476 7,471Swedish Kronor . . . . . . . . . . . . . . . . . . . . . . . . . . . . . . . . . . . . . . . . . . . . . . . . . . 1,537 1,493All Other . . . . . . . . . . . . . . . . . . . . . . . . . . . . . . . . . . . . . . . . . . . . . . . . . . . . . . . . 111 135
Total . . . . . . . . . . . . . . . . . . . . . . . . . . . . . . . . . . . . . . . . . . . . . . . . . . . . . . . . $490,630 $487,656
Average amount of contracts to deliver/purchase foreign exchange . . . . . . . . . $726,595 $727,493
21. Derivative Financial Instruments and Hedging Activities
Interest rate risk, the exposure of the Corporation’s net interest income and net fair value of its assets andliabilities to adverse movements in interest rates, is a significant market risk exposure that can have a material effecton the Corporation’s financial position, results of operations and cash flows. The Corporation has establishedpolicies that neither earnings nor fair value at risk should exceed established guidelines and assesses these risks bymodeling the impact of changes in interest rates that may adversely impact expected future earnings and fair values.
The Corporation has strategies designed to confine these risks within the established limits and identifyappropriate risk / reward trade-offs in the financial structure of its balance sheet. These strategies include the use ofderivative financial instruments to help achieve the desired balance sheet repricing structure while meeting thedesired objectives of its customers.
Trading Instruments and Other Free Standing Derivatives
The Corporation enters into various derivative contracts primarily to focus on providing derivative products tocustomers which enables them to manage their exposures to interest rate risk. The Corporation’s market risk fromunfavorable movements in interest rates is generally economically hedged by concurrently entering into offsettingderivative contracts. The offsetting derivative contracts generally have nearly identical notional values, terms andindices. The Corporation uses interest rate futures to economically hedge the exposure to interest rate risk arisingfrom the interest rate swap (designated as trading) entered into in conjunction with its auto securitization activities.
1 1 5
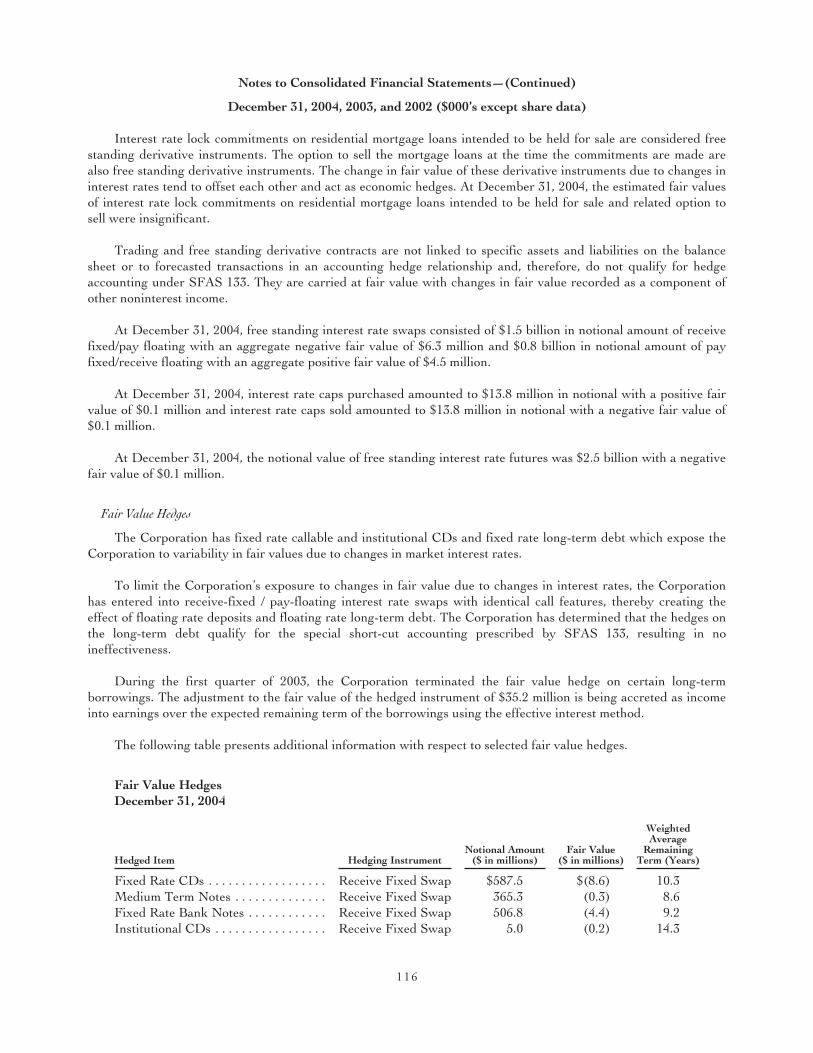
Notes to Consolidated Financial Statements—(Continued)
December 31, 2004, 2003, and 2002 ($000’s except share data)
Interest rate lock commitments on residential mortgage loans intended to be held for sale are considered freestanding derivative instruments. The option to sell the mortgage loans at the time the commitments are made arealso free standing derivative instruments. The change in fair value of these derivative instruments due to changes ininterest rates tend to offset each other and act as economic hedges. At December 31, 2004, the estimated fair valuesof interest rate lock commitments on residential mortgage loans intended to be held for sale and related option tosell were insignificant.
Trading and free standing derivative contracts are not linked to specific assets and liabilities on the balancesheet or to forecasted transactions in an accounting hedge relationship and, therefore, do not qualify for hedgeaccounting under SFAS 133. They are carried at fair value with changes in fair value recorded as a component ofother noninterest income.
At December 31, 2004, free standing interest rate swaps consisted of $1.5 billion in notional amount of receivefixed/pay floating with an aggregate negative fair value of $6.3 million and $0.8 billion in notional amount of payfixed/receive floating with an aggregate positive fair value of $4.5 million.
At December 31, 2004, interest rate caps purchased amounted to $13.8 million in notional with a positive fairvalue of $0.1 million and interest rate caps sold amounted to $13.8 million in notional with a negative fair value of$0.1 million.
At December 31, 2004, the notional value of free standing interest rate futures was $2.5 billion with a negativefair value of $0.1 million.
Fair Value Hedges
The Corporation has fixed rate callable and institutional CDs and fixed rate long-term debt which expose theCorporation to variability in fair values due to changes in market interest rates.
To limit the Corporation’s exposure to changes in fair value due to changes in interest rates, the Corporationhas entered into receive-fixed / pay-floating interest rate swaps with identical call features, thereby creating theeffect of floating rate deposits and floating rate long-term debt. The Corporation has determined that the hedges onthe long-term debt qualify for the special short-cut accounting prescribed by SFAS 133, resulting in noineffectiveness.
During the first quarter of 2003, the Corporation terminated the fair value hedge on certain long-termborrowings. The adjustment to the fair value of the hedged instrument of $35.2 million is being accreted as incomeinto earnings over the expected remaining term of the borrowings using the effective interest method.
The following table presents additional information with respect to selected fair value hedges.
Fair Value HedgesDecember 31, 2004
Hedged Item Hedging InstrumentNotional Amount
($ in millions)Fair Value
($ in millions)
WeightedAverage
RemainingTerm (Years)
Fixed Rate CDs . . . . . . . . . . . . . . . . . . Receive Fixed Swap $587.5 $(8.6) 10.3Medium Term Notes . . . . . . . . . . . . . . Receive Fixed Swap 365.3 (0.3) 8.6Fixed Rate Bank Notes . . . . . . . . . . . . Receive Fixed Swap 506.8 (4.4) 9.2Institutional CDs . . . . . . . . . . . . . . . . . Receive Fixed Swap 5.0 (0.2) 14.3
1 1 6
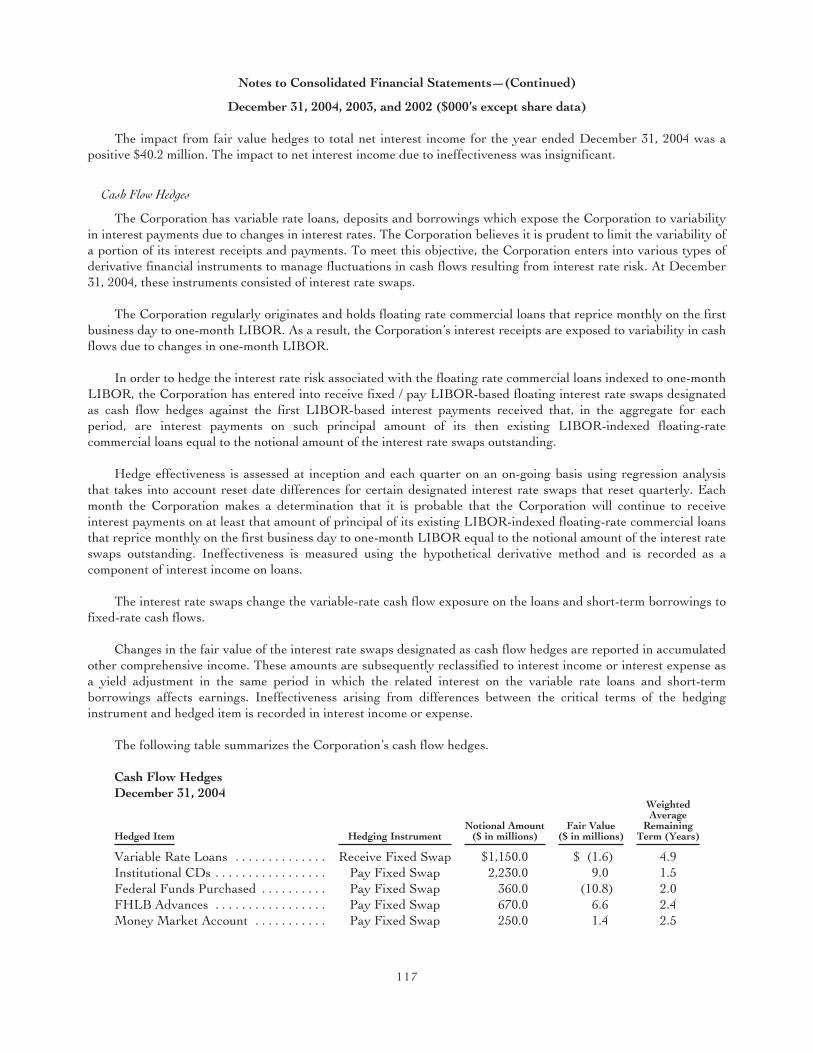
Notes to Consolidated Financial Statements—(Continued)
December 31, 2004, 2003, and 2002 ($000’s except share data)
The impact from fair value hedges to total net interest income for the year ended December 31, 2004 was apositive $40.2 million. The impact to net interest income due to ineffectiveness was insignificant.
Cash Flow Hedges
The Corporation has variable rate loans, deposits and borrowings which expose the Corporation to variabilityin interest payments due to changes in interest rates. The Corporation believes it is prudent to limit the variability ofa portion of its interest receipts and payments. To meet this objective, the Corporation enters into various types ofderivative financial instruments to manage fluctuations in cash flows resulting from interest rate risk. At December31, 2004, these instruments consisted of interest rate swaps.
The Corporation regularly originates and holds floating rate commercial loans that reprice monthly on the firstbusiness day to one-month LIBOR. As a result, the Corporation’s interest receipts are exposed to variability in cashflows due to changes in one-month LIBOR.
In order to hedge the interest rate risk associated with the floating rate commercial loans indexed to one-monthLIBOR, the Corporation has entered into receive fixed / pay LIBOR-based floating interest rate swaps designatedas cash flow hedges against the first LIBOR-based interest payments received that, in the aggregate for eachperiod, are interest payments on such principal amount of its then existing LIBOR-indexed floating-ratecommercial loans equal to the notional amount of the interest rate swaps outstanding.
Hedge effectiveness is assessed at inception and each quarter on an on-going basis using regression analysisthat takes into account reset date differences for certain designated interest rate swaps that reset quarterly. Eachmonth the Corporation makes a determination that it is probable that the Corporation will continue to receiveinterest payments on at least that amount of principal of its existing LIBOR-indexed floating-rate commercial loansthat reprice monthly on the first business day to one-month LIBOR equal to the notional amount of the interest rateswaps outstanding. Ineffectiveness is measured using the hypothetical derivative method and is recorded as acomponent of interest income on loans.
The interest rate swaps change the variable-rate cash flow exposure on the loans and short-term borrowings tofixed-rate cash flows.
Changes in the fair value of the interest rate swaps designated as cash flow hedges are reported in accumulatedother comprehensive income. These amounts are subsequently reclassified to interest income or interest expense asa yield adjustment in the same period in which the related interest on the variable rate loans and short-termborrowings affects earnings. Ineffectiveness arising from differences between the critical terms of the hedginginstrument and hedged item is recorded in interest income or expense.
The following table summarizes the Corporation’s cash flow hedges.
Cash Flow HedgesDecember 31, 2004
Hedged Item Hedging InstrumentNotional Amount
($ in millions)Fair Value
($ in millions)
WeightedAverage
RemainingTerm (Years)
Variable Rate Loans . . . . . . . . . . . . . . Receive Fixed Swap $1,150.0 $ (1.6) 4.9Institutional CDs . . . . . . . . . . . . . . . . . Pay Fixed Swap 2,230.0 9.0 1.5Federal Funds Purchased . . . . . . . . . . Pay Fixed Swap 360.0 (10.8) 2.0FHLB Advances . . . . . . . . . . . . . . . . . Pay Fixed Swap 670.0 6.6 2.4Money Market Account . . . . . . . . . . . Pay Fixed Swap 250.0 1.4 2.5
1 1 7
Notes to Consolidated Financial Statements—(Continued)
December 31, 2004, 2003, and 2002 ($000’s except share data)
During 2004, $300 million of FHLB floating rate advances were retired. In conjunction with the retirement ofdebt, $300 million in notional value of receive floating / pay fixed interest rate swaps designated as cash flow hedgesagainst the retired floating rate advances were terminated. The loss in accumulated other comprehensive incomeaggregating $2.0 million ($1.3 million after tax) was charged to other expense.
During 2003, $610.0 million of FHLB floating rate advances were retired. In conjunction with the retirementof debt, $610.0 million in notional value of received floating / pay fixed interest rate swaps designated as cash flowhedges against the retired floating rate advances were terminated. The loss in accumulated other comprehensiveincome aggregating $40.5 million ($26.3 million after tax) was charged to other expense.
During 2003, the Corporation redeemed all of the Floating Rate Debentures held by its subsidiary, MVBICapital Trust, and MVBI Capital Trust redeemed all of its currently outstanding Floating Rate Trust PreferredSecurities at an aggregate liquidation amount of $14.95 million. In conjunction with the redemption the Corporationterminated the associated interest rate swap designated as a cash flow hedge. The loss in accumulated othercomprehensive income aggregating $1.4 million ($0.9 million after tax) was charged to other expense.
During 2003, the cash flow hedge on commercial paper was terminated. The $32.6 million in accumulatedother comprehensive income at the time of termination is being amortized as expense into earnings in the remainingperiods during which the hedged forecasted transaction affects earnings.
During 2002, the Corporation entered into a forward starting interest rate swap for the forecasted issuance ofM&I Bank notes. M&I Bank notes in the amount of $0.5 billion were issued during the third quarter of 2002 andthe interest rate swap was terminated. The negative $1.3 million in accumulated other comprehensive income attermination is being amortized into interest expense over the term of the M&I Bank notes using the effectiveinterest method.
The impact to total net interest income from cash flow hedges, including amortization of terminated cash flowhedges, for the year ended December 31, 2004 was a negative $31.6 million. The impact due to ineffectiveness wasimmaterial. The estimated reclassification from accumulated other comprehensive income in the next twelve monthsis approximately $9.2 million.
Credit risk arises from the potential failure of counterparties to perform in accordance with the terms of thecontracts. The Corporation maintains risk management policies that define parameters of acceptable market riskwithin the framework of its overall asset/liability management strategies and monitor and limit exposure to creditrisk. The Corporation believes its credit and settlement procedures serve to minimize its exposure to credit risk.Credit exposure resulting from derivative financial instruments is represented by their fair value amounts, increasedby an estimate of potential adverse position exposure arising from changes over time in interest rates, maturities andother relevant factors. At December 31, 2004 the estimated credit exposure arising from derivative financialinstruments was approximately $50.7 million.
For the years ended December 31, 2003 and 2002, the total effect on net interest income resulting fromderivative financial instruments, was a negative $34.6 million and a negative $27.6 million including theamortization of terminated derivative financial instruments, respectively.
22. Fair Value of Financial Instruments
The book values and estimated fair values for on and off-balance sheet financial instruments as of December31, 2004 and 2003 are presented in the following table. Derivative financial instruments designated as hedginginstruments are included in the book values and fair values presented for the related hedged items. Derivativefinancial instruments designated as trading and other free standing derivatives are included in Trading securities.
1 1 8
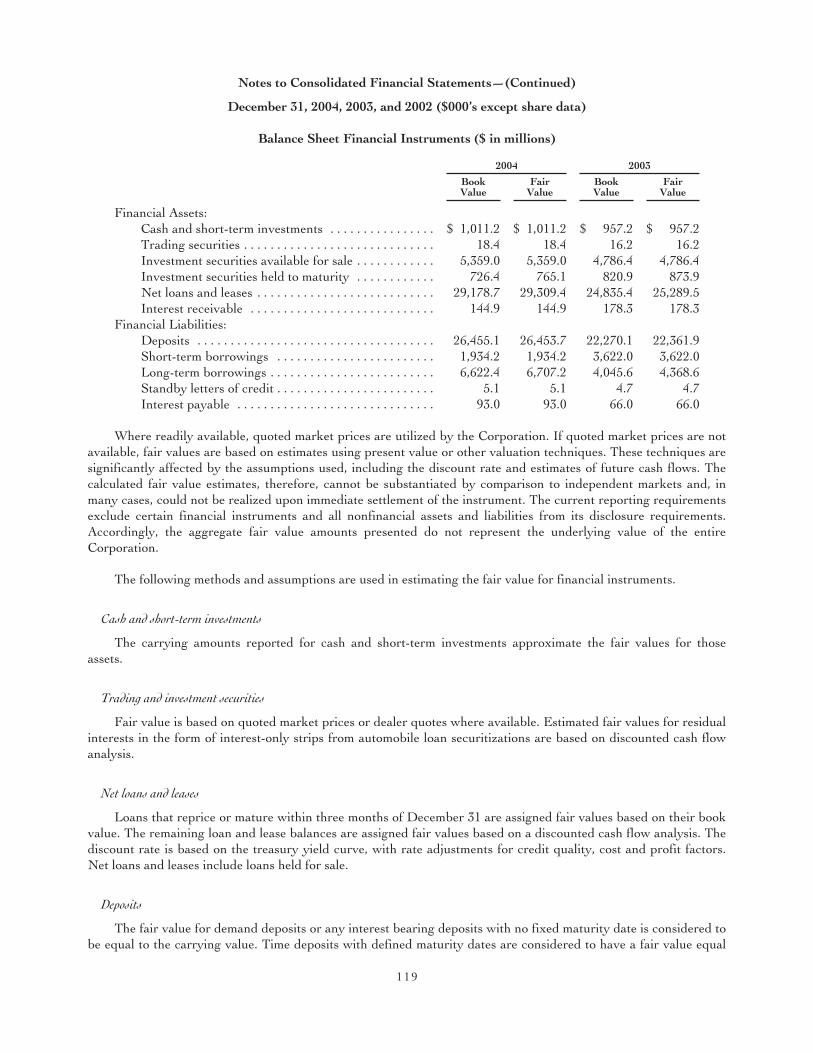
Notes to Consolidated Financial Statements—(Continued)
December 31, 2004, 2003, and 2002 ($000’s except share data)
Balance Sheet Financial Instruments ($ in millions)
2004 2003
BookValue
FairValue
BookValue
FairValue
Financial Assets:Cash and short-term investments . . . . . . . . . . . . . . . . $ 1,011.2 $ 1,011.2 $ 957.2 $ 957.2Trading securities . . . . . . . . . . . . . . . . . . . . . . . . . . . . . 18.4 18.4 16.2 16.2Investment securities available for sale . . . . . . . . . . . . 5,359.0 5,359.0 4,786.4 4,786.4Investment securities held to maturity . . . . . . . . . . . . 726.4 765.1 820.9 873.9Net loans and leases . . . . . . . . . . . . . . . . . . . . . . . . . . . 29,178.7 29,309.4 24,835.4 25,289.5Interest receivable . . . . . . . . . . . . . . . . . . . . . . . . . . . . 144.9 144.9 178.3 178.3
Financial Liabilities:Deposits . . . . . . . . . . . . . . . . . . . . . . . . . . . . . . . . . . . . 26,455.1 26,453.7 22,270.1 22,361.9Short-term borrowings . . . . . . . . . . . . . . . . . . . . . . . . 1,934.2 1,934.2 3,622.0 3,622.0Long-term borrowings . . . . . . . . . . . . . . . . . . . . . . . . . 6,622.4 6,707.2 4,045.6 4,368.6Standby letters of credit . . . . . . . . . . . . . . . . . . . . . . . . 5.1 5.1 4.7 4.7Interest payable . . . . . . . . . . . . . . . . . . . . . . . . . . . . . . 93.0 93.0 66.0 66.0
Where readily available, quoted market prices are utilized by the Corporation. If quoted market prices are notavailable, fair values are based on estimates using present value or other valuation techniques. These techniques aresignificantly affected by the assumptions used, including the discount rate and estimates of future cash flows. Thecalculated fair value estimates, therefore, cannot be substantiated by comparison to independent markets and, inmany cases, could not be realized upon immediate settlement of the instrument. The current reporting requirementsexclude certain financial instruments and all nonfinancial assets and liabilities from its disclosure requirements.Accordingly, the aggregate fair value amounts presented do not represent the underlying value of the entireCorporation.
The following methods and assumptions are used in estimating the fair value for financial instruments.
Cash and short-term investments
The carrying amounts reported for cash and short-term investments approximate the fair values for thoseassets.
Trading and investment securities
Fair value is based on quoted market prices or dealer quotes where available. Estimated fair values for residualinterests in the form of interest-only strips from automobile loan securitizations are based on discounted cash flowanalysis.
Net loans and leases
Loans that reprice or mature within three months of December 31 are assigned fair values based on their bookvalue. The remaining loan and lease balances are assigned fair values based on a discounted cash flow analysis. Thediscount rate is based on the treasury yield curve, with rate adjustments for credit quality, cost and profit factors.Net loans and leases include loans held for sale.
Deposits
The fair value for demand deposits or any interest bearing deposits with no fixed maturity date is considered tobe equal to the carrying value. Time deposits with defined maturity dates are considered to have a fair value equal
1 1 9

Notes to Consolidated Financial Statements—(Continued)
December 31, 2004, 2003, and 2002 ($000’s except share data)
to the book value if the maturity date was within three months of December 31. The remaining time deposits areassigned fair values based on a discounted cash flow analysis using discount rates that approximate interest ratescurrently being offered on time deposits with comparable maturities.
Borrowings
Short-term borrowings are carried at cost that approximates fair value. Long-term debt is generally valuedusing a discounted cash flow analysis with a discount rate based on current incremental borrowing rates for similartypes of arrangements or, if not readily available, based on a build up approach similar to that used for loans anddeposits. Long-term borrowings include their related current maturities.
Standby letters of credit
The book value and fair value of standby letters of credit is based on the unamortized premium (fees paid bycustomers).
Off-Balance Sheet Financial Instruments ($ in millions)
Fair values of loan commitments and commercial letters of credit have been estimated based on the equivalentfees, net of expenses, that would be charged for similar contracts and customers at December 31:
2004 2003
Loan commitments . . . . . . . . . . . . . . . . . . . . . . . . . . . . . . . . . . . . . . . . . . . . . . . . . . . . $13.2 $9.3Commercial letters of credit . . . . . . . . . . . . . . . . . . . . . . . . . . . . . . . . . . . . . . . . . . . . 0.7 0.5
See Note 19 for additional information on off-balance sheet financial instruments.
23. Business Segments
Generally, the Corporation organizes its segments based on legal entities. Each entity offers a variety ofproducts and services to meet the needs of its customers and the particular market served. Each entity has its ownpresident and is separately managed subject to adherence to corporate policies. Discrete financial information isreviewed by senior management to assess performance on a monthly basis. Certain segments are combined andconsolidated for purposes of assessing financial performance.
The accounting policies of the Corporation’s segments are the same as those described in Note 1. Intersegmentrevenues may be based on cost, current market prices or negotiated prices between the providers and receivers ofservices.
Based on the way the Corporation organizes its segments, the Corporation has determined that it has tworeportable segments.
Banking
Banking represents the aggregation of two separately chartered banks headquartered in Wisconsin, onefederally chartered thrift headquartered in Nevada, one separately chartered bank headquartered in St. Louis,Missouri, an asset-based lending subsidiary headquartered in Minnesota and an operational support subsidiary.Banking consists of accepting deposits, making loans and providing other services such as cash management,foreign exchange and correspondent banking to a variety of commercial and retail customers. Products and servicesare provided through a variety of delivery channels including traditional branches, supermarket branches,telephone centers, ATMs and the Internet.
1 2 0
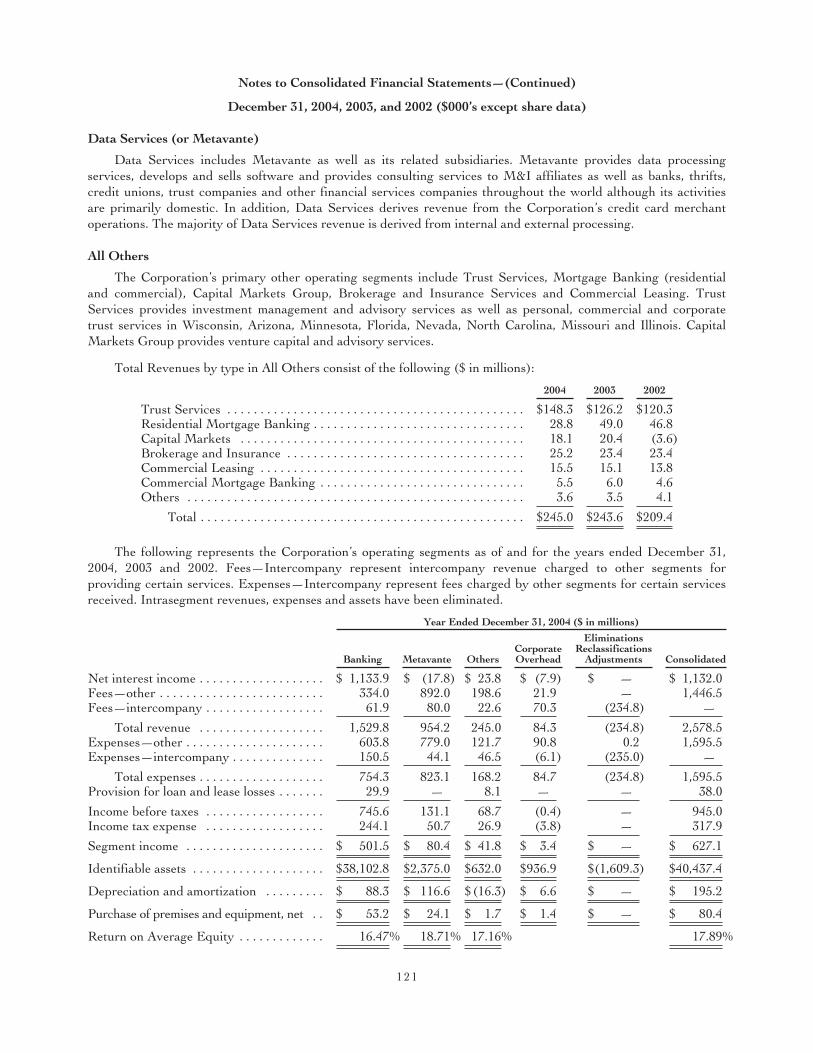
Notes to Consolidated Financial Statements—(Continued)
December 31, 2004, 2003, and 2002 ($000’s except share data)
Data Services (or Metavante)
Data Services includes Metavante as well as its related subsidiaries. Metavante provides data processingservices, develops and sells software and provides consulting services to M&I affiliates as well as banks, thrifts,credit unions, trust companies and other financial services companies throughout the world although its activitiesare primarily domestic. In addition, Data Services derives revenue from the Corporation’s credit card merchantoperations. The majority of Data Services revenue is derived from internal and external processing.
All Others
The Corporation’s primary other operating segments include Trust Services, Mortgage Banking (residentialand commercial), Capital Markets Group, Brokerage and Insurance Services and Commercial Leasing. TrustServices provides investment management and advisory services as well as personal, commercial and corporatetrust services in Wisconsin, Arizona, Minnesota, Florida, Nevada, North Carolina, Missouri and Illinois. CapitalMarkets Group provides venture capital and advisory services.
Total Revenues by type in All Others consist of the following ($ in millions):
2004 2003 2002
Trust Services . . . . . . . . . . . . . . . . . . . . . . . . . . . . . . . . . . . . . . . . . . . . . $148.3 $126.2 $120.3Residential Mortgage Banking . . . . . . . . . . . . . . . . . . . . . . . . . . . . . . . . 28.8 49.0 46.8Capital Markets . . . . . . . . . . . . . . . . . . . . . . . . . . . . . . . . . . . . . . . . . . . 18.1 20.4 (3.6)Brokerage and Insurance . . . . . . . . . . . . . . . . . . . . . . . . . . . . . . . . . . . . 25.2 23.4 23.4Commercial Leasing . . . . . . . . . . . . . . . . . . . . . . . . . . . . . . . . . . . . . . . . 15.5 15.1 13.8Commercial Mortgage Banking . . . . . . . . . . . . . . . . . . . . . . . . . . . . . . . 5.5 6.0 4.6Others . . . . . . . . . . . . . . . . . . . . . . . . . . . . . . . . . . . . . . . . . . . . . . . . . . . 3.6 3.5 4.1
Total . . . . . . . . . . . . . . . . . . . . . . . . . . . . . . . . . . . . . . . . . . . . . . . . . $245.0 $243.6 $209.4
The following represents the Corporation’s operating segments as of and for the years ended December 31,2004, 2003 and 2002. Fees—Intercompany represent intercompany revenue charged to other segments forproviding certain services. Expenses—Intercompany represent fees charged by other segments for certain servicesreceived. Intrasegment revenues, expenses and assets have been eliminated.
Year Ended December 31, 2004 ($ in millions)
Banking Metavante OthersCorporateOverhead
EliminationsReclassifications
Adjustments Consolidated
Net interest income . . . . . . . . . . . . . . . . . . . $ 1,133.9 $ (17.8) $ 23.8 $ (7.9) $ — $ 1,132.0Fees—other . . . . . . . . . . . . . . . . . . . . . . . . . 334.0 892.0 198.6 21.9 — 1,446.5Fees—intercompany . . . . . . . . . . . . . . . . . . 61.9 80.0 22.6 70.3 (234.8) —
Total revenue . . . . . . . . . . . . . . . . . . . 1,529.8 954.2 245.0 84.3 (234.8) 2,578.5Expenses—other . . . . . . . . . . . . . . . . . . . . . 603.8 779.0 121.7 90.8 0.2 1,595.5Expenses—intercompany . . . . . . . . . . . . . . 150.5 44.1 46.5 (6.1) (235.0) —
Total expenses . . . . . . . . . . . . . . . . . . . 754.3 823.1 168.2 84.7 (234.8) 1,595.5Provision for loan and lease losses . . . . . . . 29.9 — 8.1 — — 38.0
Income before taxes . . . . . . . . . . . . . . . . . . 745.6 131.1 68.7 (0.4) — 945.0Income tax expense . . . . . . . . . . . . . . . . . . 244.1 50.7 26.9 (3.8) — 317.9
Segment income . . . . . . . . . . . . . . . . . . . . . $ 501.5 $ 80.4 $ 41.8 $ 3.4 $ — $ 627.1
Identifiable assets . . . . . . . . . . . . . . . . . . . . $38,102.8 $2,375.0 $632.0 $936.9 $(1,609.3) $40,437.4
Depreciation and amortization . . . . . . . . . $ 88.3 $ 116.6 $(16.3) $ 6.6 $ — $ 195.2
Purchase of premises and equipment, net . . $ 53.2 $ 24.1 $ 1.7 $ 1.4 $ — $ 80.4
Return on Average Equity . . . . . . . . . . . . . 16.47% 18.71% 17.16% 17.89%
1 2 1
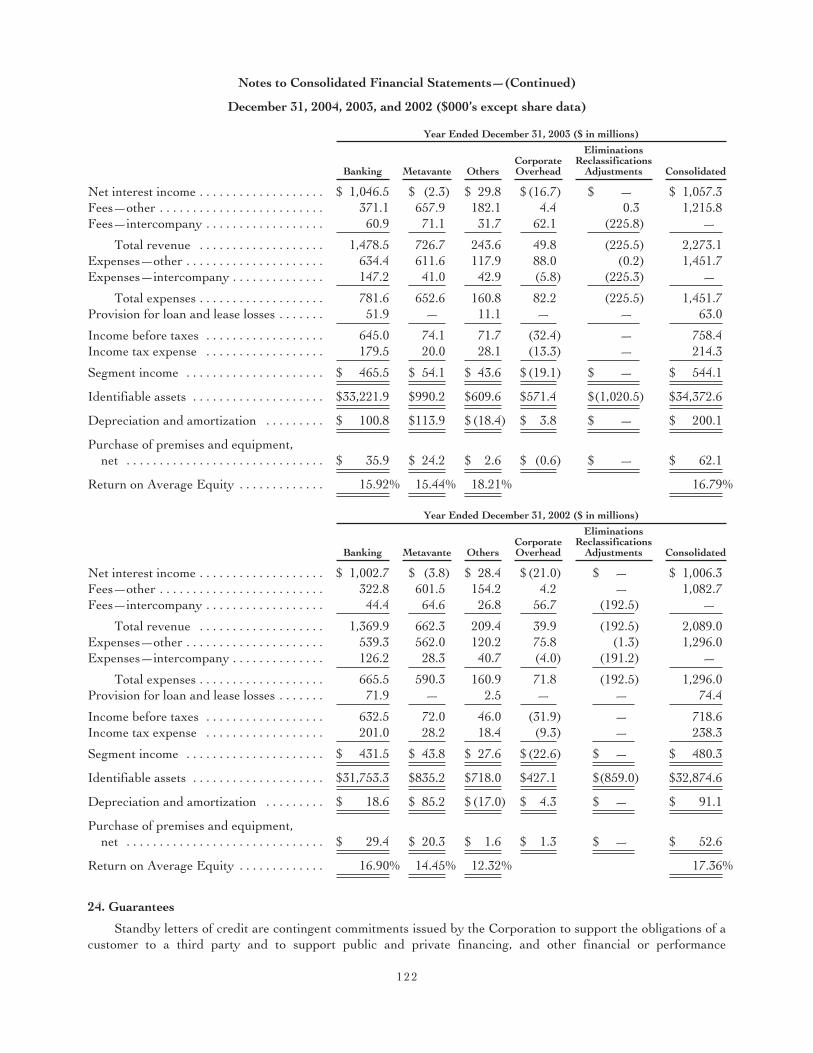
Notes to Consolidated Financial Statements—(Continued)
December 31, 2004, 2003, and 2002 ($000’s except share data)
Year Ended December 31, 2003 ($ in millions)
Banking Metavante OthersCorporateOverhead
EliminationsReclassifications
Adjustments Consolidated
Net interest income . . . . . . . . . . . . . . . . . . . $ 1,046.5 $ (2.3) $ 29.8 $(16.7) $ — $ 1,057.3Fees—other . . . . . . . . . . . . . . . . . . . . . . . . . 371.1 657.9 182.1 4.4 0.3 1,215.8Fees—intercompany . . . . . . . . . . . . . . . . . . 60.9 71.1 31.7 62.1 (225.8) —
Total revenue . . . . . . . . . . . . . . . . . . . 1,478.5 726.7 243.6 49.8 (225.5) 2,273.1Expenses—other . . . . . . . . . . . . . . . . . . . . . 634.4 611.6 117.9 88.0 (0.2) 1,451.7Expenses—intercompany . . . . . . . . . . . . . . 147.2 41.0 42.9 (5.8) (225.3) —
Total expenses . . . . . . . . . . . . . . . . . . . 781.6 652.6 160.8 82.2 (225.5) 1,451.7Provision for loan and lease losses . . . . . . . 51.9 — 11.1 — — 63.0
Income before taxes . . . . . . . . . . . . . . . . . . 645.0 74.1 71.7 (32.4) — 758.4Income tax expense . . . . . . . . . . . . . . . . . . 179.5 20.0 28.1 (13.3) — 214.3
Segment income . . . . . . . . . . . . . . . . . . . . . $ 465.5 $ 54.1 $ 43.6 $(19.1) $ — $ 544.1
Identifiable assets . . . . . . . . . . . . . . . . . . . . $33,221.9 $990.2 $609.6 $571.4 $(1,020.5) $34,372.6
Depreciation and amortization . . . . . . . . . $ 100.8 $113.9 $(18.4) $ 3.8 $ — $ 200.1
Purchase of premises and equipment,net . . . . . . . . . . . . . . . . . . . . . . . . . . . . . . $ 35.9 $ 24.2 $ 2.6 $ (0.6) $ — $ 62.1
Return on Average Equity . . . . . . . . . . . . . 15.92% 15.44% 18.21% 16.79%
Year Ended December 31, 2002 ($ in millions)
Banking Metavante OthersCorporateOverhead
EliminationsReclassifications
Adjustments Consolidated
Net interest income . . . . . . . . . . . . . . . . . . . $ 1,002.7 $ (3.8) $ 28.4 $(21.0) $ — $ 1,006.3Fees—other . . . . . . . . . . . . . . . . . . . . . . . . . 322.8 601.5 154.2 4.2 — 1,082.7Fees—intercompany . . . . . . . . . . . . . . . . . . 44.4 64.6 26.8 56.7 (192.5) —
Total revenue . . . . . . . . . . . . . . . . . . . 1,369.9 662.3 209.4 39.9 (192.5) 2,089.0Expenses—other . . . . . . . . . . . . . . . . . . . . . 539.3 562.0 120.2 75.8 (1.3) 1,296.0Expenses—intercompany . . . . . . . . . . . . . . 126.2 28.3 40.7 (4.0) (191.2) —
Total expenses . . . . . . . . . . . . . . . . . . . 665.5 590.3 160.9 71.8 (192.5) 1,296.0Provision for loan and lease losses . . . . . . . 71.9 — 2.5 — — 74.4
Income before taxes . . . . . . . . . . . . . . . . . . 632.5 72.0 46.0 (31.9) — 718.6Income tax expense . . . . . . . . . . . . . . . . . . 201.0 28.2 18.4 (9.3) — 238.3
Segment income . . . . . . . . . . . . . . . . . . . . . $ 431.5 $ 43.8 $ 27.6 $(22.6) $ — $ 480.3
Identifiable assets . . . . . . . . . . . . . . . . . . . . $31,753.3 $835.2 $718.0 $427.1 $(859.0) $32,874.6
Depreciation and amortization . . . . . . . . . $ 18.6 $ 85.2 $(17.0) $ 4.3 $ — $ 91.1
Purchase of premises and equipment,net . . . . . . . . . . . . . . . . . . . . . . . . . . . . . . $ 29.4 $ 20.3 $ 1.6 $ 1.3 $ — $ 52.6
Return on Average Equity . . . . . . . . . . . . . 16.90% 14.45% 12.32% 17.36%
24. Guarantees
Standby letters of credit are contingent commitments issued by the Corporation to support the obligations of acustomer to a third party and to support public and private financing, and other financial or performance
1 2 2
Notes to Consolidated Financial Statements—(Continued)
December 31, 2004, 2003, and 2002 ($000’s except share data)
obligations of customers. Standby letters of credit have maturities that generally reflect the maturities of theunderlying obligations. The credit risk involved in issuing standby letters of credit is the same as that involved inextending loans to customers. If deemed necessary, the Corporation holds various forms of collateral to support thestandby letters of credit. The gross amount of standby letters of credit issued at December 31, 2004 was $1.5 billion.Of the amount outstanding at December 31, 2004, standby letters of credit conveyed to others in the form ofparticipations amounted to $76.3 million. Since many of the standby letters of credit are expected to expire withoutbeing drawn upon, the amounts outstanding do not necessarily represent future cash requirements. At December31, 2004, the estimated fair value associated with letters of credit amounted to $5.1 million.
Metavante offers credit card processing to its customers. Under the rules of the credit card associations,Metavante has certain contingent liabilities for card transactions acquired from merchants. This contingent liabilityarises in the event of a billing dispute between the merchant and a cardholder that is ultimately resolved in thecardholder’s favor. In such case, Metavante charges the transaction back (“chargeback”) to the merchant and thedisputed amount is credited or otherwise refunded to the cardholder. If Metavante is unable to collect this amountfrom the merchant, due to the merchant’s insolvency or other reasons, Metavante will bear the loss for the amountof the refund paid to the cardholder. In most cases this contingent liability situation is unlikely to arise because mostproducts or services are delivered when purchased, and credits are issued by the merchant on returned items.However, where the product or service is not provided until some time following the purchase, the contingentliability may be more likely. This credit loss exposure is within the scope of the recognition and measurementprovisions of FIN 45. The Corporation has concluded that the fair value of the contingent liability was immaterialdue to the following factors: (1) merchants are evaluated for credit risk in a manner similar to that employed inmaking lending decisions; (2) if deemed appropriate, the Corporation obtains collateral which includes holdingfunds until the product or service is delivered or severs its relationship with a merchant; and (3) compensation, ifany, received for providing the guarantee is minimal.
Metavante assesses the contingent liability and records credit losses for known losses and a provision for lossesincurred but not reported which are based on historical chargeback loss experience. For the year endedDecember 31, 2004, such losses amounted to $300.
Metavante’s master license agreement includes an indemnification clause that indemnifies the licensee againstclaims, suits or other proceedings (including reasonable attorneys’ fees and payment of any final settlement orjudgment) brought by third parties against the licensee alleging that a software product, by itself and not incombination with any other hardware, software or services, when used by licensee as authorized under the masterlicense agreement, infringes a U.S. patent or U.S. copyright issued or registered as of the date the master licenseagreement is executed. Metavante’s obligation to indemnify a licensee is contingent on the licensee providingprompt written notice of the claim, full authority and control of the defense and settlement of the claim andreasonable assistance at Metavante’s request and expense, to defend or settle such claim.
In the event a software product becomes, or in Metavante’s opinion is likely to become, the subject of aninfringement claim, Metavante may, at its option and expense, either procure for the licensee the right to continueusing the software product, modify the software product so that it becomes non-infringing, substitute the softwareproduct with other software of the same material capability and functionality or where none of these options arereasonably available, terminate the license granted and refund the unearned portion of the initial license fee.
Metavante’s obligation is subject to certain exceptions and Metavante will have no obligation to anyinfringement claim based upon any failure to use the software product in accordance with the license agreement orfor purposes not intended by Metavante, Metavante’s modification of the software product in compliance withspecifications or requirements provided by the licensee, use of any part of the software product in conjunction withthird party software, hardware or data not authorized in the license agreement, modification, addition or change toany part of the software product by the licensee or its agents or any registered user, use of any release of thesoftware product other than the most current release made available to the licensee and any claim of infringementarising more than five years after the delivery date of the applicable software product.
1 2 3
Notes to Consolidated Financial Statements—(Continued)
December 31, 2004, 2003, and 2002 ($000’s except share data)
At December 31, 2004 and 2003 there were no liabilities reflected on the Consolidated Balance Sheets relatedto these indemnifications.
As of December 31, 2004, the Corporation has fully and unconditionally guaranteed $200 million of certainlong-term borrowing obligations issued by M&I Capital Trust A that was deconsolidated upon the adoption of theprovisions of FIN 46R. See Note 2 and Note 14 for further discussion. In addition, at December 31, 2004 theCorporation has fully and unconditionally guaranteed $400 million of certain long-term borrowing obligationsissued by M&I Capital Trust B.
As part of securities custody activities and at the direction of trust clients, the Corporation’s trust subsidiary,Marshall & Ilsley Trust Company N.A. (“M&I Trust”) lends securities owned by trust clients to borrowers whohave been evaluated for credit risk in a manner similar to that employed in making lending decisions. In connectionwith these activities, M&I Trust has issued certain indemnifications against loss resulting from the default by aborrower under the master securities loan agreement, such as the failure of the borrower to return loaned securitieswhen due or the borrower’s bankruptcy or receivership. The borrowing party is required to fully collateralizesecurities received with cash or marketable securities. As securities are loaned, collateral is maintained at aminimum of 100 percent of the fair value of the securities plus accrued interest and the collateral is revalued on adaily basis. The amount of securities loaned subject to indemnification was $5.0 billion at December 31, 2004 and$5.0 billion at December 31, 2003. Because of the requirement to fully collateralize securities borrowed,management believes that the exposure to credit loss from this activity is remote and there are no liabilities reflectedon the Consolidated Balance Sheets at December 31, 2004 and December 31, 2003, related to theseindemnifications.
1 2 4
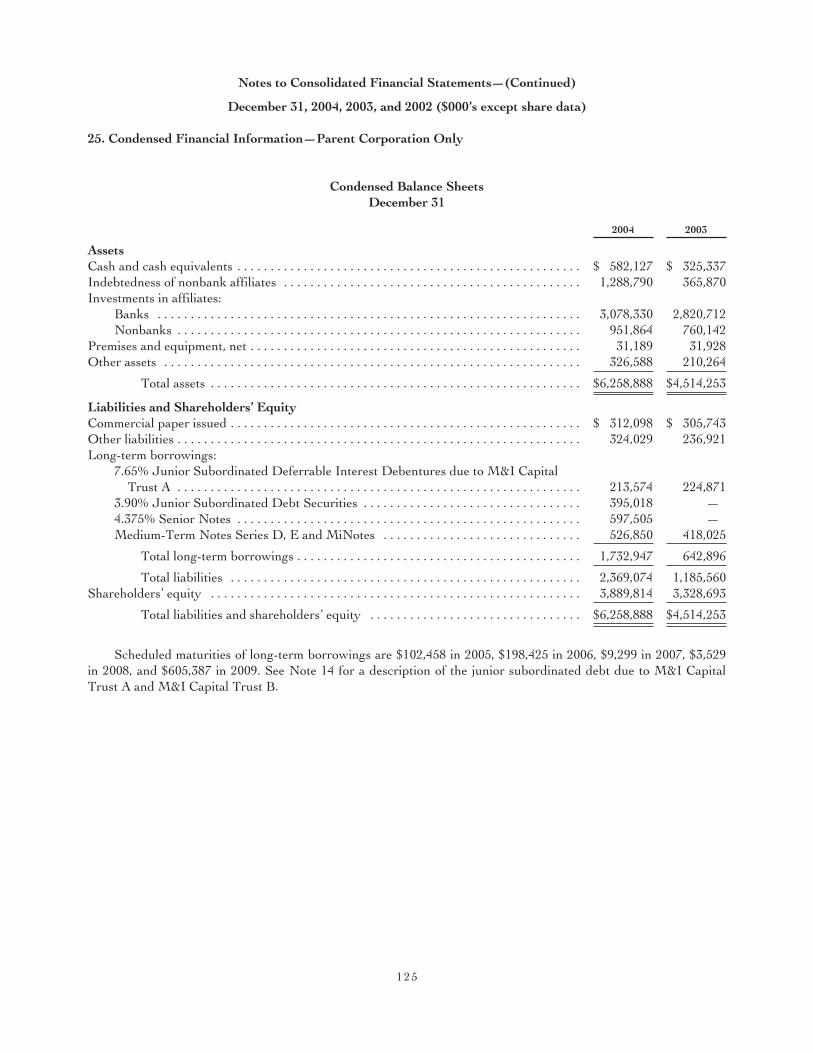
Notes to Consolidated Financial Statements—(Continued)
December 31, 2004, 2003, and 2002 ($000’s except share data)
25. Condensed Financial Information—Parent Corporation Only
Condensed Balance SheetsDecember 31
2004 2003
AssetsCash and cash equivalents . . . . . . . . . . . . . . . . . . . . . . . . . . . . . . . . . . . . . . . . . . . . . . . . . . . . $ 582,127 $ 325,337Indebtedness of nonbank affiliates . . . . . . . . . . . . . . . . . . . . . . . . . . . . . . . . . . . . . . . . . . . . . 1,288,790 365,870Investments in affiliates:
Banks . . . . . . . . . . . . . . . . . . . . . . . . . . . . . . . . . . . . . . . . . . . . . . . . . . . . . . . . . . . . . . . . 3,078,330 2,820,712Nonbanks . . . . . . . . . . . . . . . . . . . . . . . . . . . . . . . . . . . . . . . . . . . . . . . . . . . . . . . . . . . . . 951,864 760,142
Premises and equipment, net . . . . . . . . . . . . . . . . . . . . . . . . . . . . . . . . . . . . . . . . . . . . . . . . . . 31,189 31,928Other assets . . . . . . . . . . . . . . . . . . . . . . . . . . . . . . . . . . . . . . . . . . . . . . . . . . . . . . . . . . . . . . . 326,588 210,264
Total assets . . . . . . . . . . . . . . . . . . . . . . . . . . . . . . . . . . . . . . . . . . . . . . . . . . . . . . . . $6,258,888 $4,514,253
Liabilities and Shareholders’ EquityCommercial paper issued . . . . . . . . . . . . . . . . . . . . . . . . . . . . . . . . . . . . . . . . . . . . . . . . . . . . . $ 312,098 $ 305,743Other liabilities . . . . . . . . . . . . . . . . . . . . . . . . . . . . . . . . . . . . . . . . . . . . . . . . . . . . . . . . . . . . . 324,029 236,921Long-term borrowings:
7.65% Junior Subordinated Deferrable Interest Debentures due to M&I CapitalTrust A . . . . . . . . . . . . . . . . . . . . . . . . . . . . . . . . . . . . . . . . . . . . . . . . . . . . . . . . . . . . . 213,574 224,871
3.90% Junior Subordinated Debt Securities . . . . . . . . . . . . . . . . . . . . . . . . . . . . . . . . . 395,018 —4.375% Senior Notes . . . . . . . . . . . . . . . . . . . . . . . . . . . . . . . . . . . . . . . . . . . . . . . . . . . . 597,505 —Medium-Term Notes Series D, E and MiNotes . . . . . . . . . . . . . . . . . . . . . . . . . . . . . . 526,850 418,025
Total long-term borrowings . . . . . . . . . . . . . . . . . . . . . . . . . . . . . . . . . . . . . . . . . . . 1,732,947 642,896
Total liabilities . . . . . . . . . . . . . . . . . . . . . . . . . . . . . . . . . . . . . . . . . . . . . . . . . . . . . 2,369,074 1,185,560Shareholders’ equity . . . . . . . . . . . . . . . . . . . . . . . . . . . . . . . . . . . . . . . . . . . . . . . . . . . . . . . . 3,889,814 3,328,693
Total liabilities and shareholders’ equity . . . . . . . . . . . . . . . . . . . . . . . . . . . . . . . . $6,258,888 $4,514,253
Scheduled maturities of long-term borrowings are $102,458 in 2005, $198,425 in 2006, $9,299 in 2007, $3,529in 2008, and $605,387 in 2009. See Note 14 for a description of the junior subordinated debt due to M&I CapitalTrust A and M&I Capital Trust B.
1 2 5
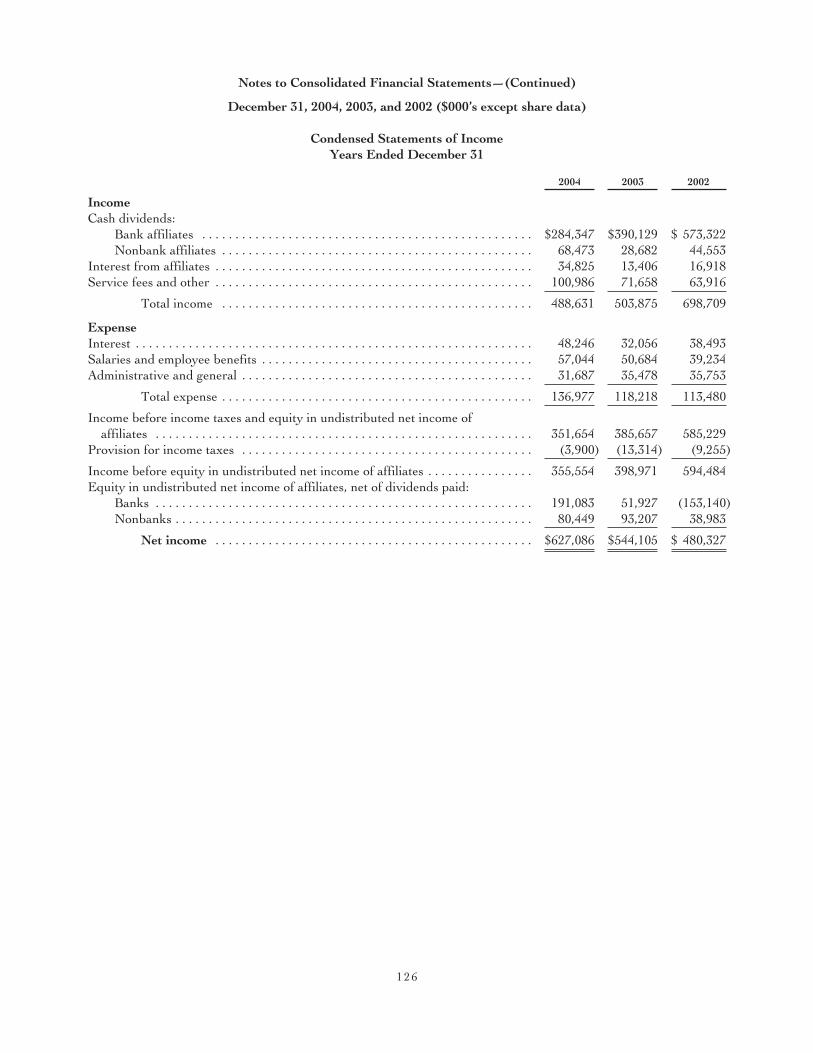
Notes to Consolidated Financial Statements—(Continued)
December 31, 2004, 2003, and 2002 ($000’s except share data)
Condensed Statements of IncomeYears Ended December 31
2004 2003 2002
IncomeCash dividends:
Bank affiliates . . . . . . . . . . . . . . . . . . . . . . . . . . . . . . . . . . . . . . . . . . . . . . . . . . $284,347 $390,129 $ 573,322Nonbank affiliates . . . . . . . . . . . . . . . . . . . . . . . . . . . . . . . . . . . . . . . . . . . . . . . 68,473 28,682 44,553
Interest from affiliates . . . . . . . . . . . . . . . . . . . . . . . . . . . . . . . . . . . . . . . . . . . . . . . . 34,825 13,406 16,918Service fees and other . . . . . . . . . . . . . . . . . . . . . . . . . . . . . . . . . . . . . . . . . . . . . . . . 100,986 71,658 63,916
Total income . . . . . . . . . . . . . . . . . . . . . . . . . . . . . . . . . . . . . . . . . . . . . . . 488,631 503,875 698,709
ExpenseInterest . . . . . . . . . . . . . . . . . . . . . . . . . . . . . . . . . . . . . . . . . . . . . . . . . . . . . . . . . . . . 48,246 32,056 38,493Salaries and employee benefits . . . . . . . . . . . . . . . . . . . . . . . . . . . . . . . . . . . . . . . . . 57,044 50,684 39,234Administrative and general . . . . . . . . . . . . . . . . . . . . . . . . . . . . . . . . . . . . . . . . . . . . 31,687 35,478 35,753
Total expense . . . . . . . . . . . . . . . . . . . . . . . . . . . . . . . . . . . . . . . . . . . . . . . 136,977 118,218 113,480
Income before income taxes and equity in undistributed net income ofaffiliates . . . . . . . . . . . . . . . . . . . . . . . . . . . . . . . . . . . . . . . . . . . . . . . . . . . . . . . . . 351,654 385,657 585,229
Provision for income taxes . . . . . . . . . . . . . . . . . . . . . . . . . . . . . . . . . . . . . . . . . . . . (3,900) (13,314) (9,255)
Income before equity in undistributed net income of affiliates . . . . . . . . . . . . . . . . 355,554 398,971 594,484Equity in undistributed net income of affiliates, net of dividends paid:
Banks . . . . . . . . . . . . . . . . . . . . . . . . . . . . . . . . . . . . . . . . . . . . . . . . . . . . . . . . . 191,083 51,927 (153,140)Nonbanks . . . . . . . . . . . . . . . . . . . . . . . . . . . . . . . . . . . . . . . . . . . . . . . . . . . . . . 80,449 93,207 38,983
Net income . . . . . . . . . . . . . . . . . . . . . . . . . . . . . . . . . . . . . . . . . . . . . . . . $627,086 $544,105 $ 480,327
1 2 6

Notes to Consolidated Financial Statements
December 31, 2004, 2003, and 2002 ($000’s except share data)
Condensed Statements of Cash FlowsYears Ended December 31
2004 2003 2002
Cash Flows From Operating Activities:Net income . . . . . . . . . . . . . . . . . . . . . . . . . . . . . . . . . . . . . . . . . . . . . . . . . . . $ 627,086 $ 544,105 $ 480,327Noncash items included in income:
Equity in undistributed net income of affiliates . . . . . . . . . . . . . . . . . . (271,532) (145,134) 114,157Depreciation and amortization . . . . . . . . . . . . . . . . . . . . . . . . . . . . . . . 6,670 3,831 4,633Other . . . . . . . . . . . . . . . . . . . . . . . . . . . . . . . . . . . . . . . . . . . . . . . . . . . (6,593) 21,244 43,765
Net cash provided by operating activities . . . . . . . . . . . . . . . . . . . . . . . . . . 355,631 424,046 642,882
Cash Flows From Investing Activities:Increases in indebtedness of affiliates . . . . . . . . . . . . . . . . . . . . . . . . . (1,522,750) (1,104,749) (3,162,784)Decreases in indebtedness of affiliates . . . . . . . . . . . . . . . . . . . . . . . . . 599,830 1,125,657 3,172,852Decreases (increases) in investments in affiliates . . . . . . . . . . . . . . . . (147,329) 2,829 (44,662)Net capital expenditures . . . . . . . . . . . . . . . . . . . . . . . . . . . . . . . . . . . . (1,456) 622 (1,296)Acquisitions accounted for as purchases, net of cash and cash
equivalents acquired . . . . . . . . . . . . . . . . . . . . . . . . . . . . . . . . . . . . . — — (303,344)Other . . . . . . . . . . . . . . . . . . . . . . . . . . . . . . . . . . . . . . . . . . . . . . . . . . . (59,570) (21,374) (10,108)
Net cash (used in) provided by investing activities . . . . . . . . . . . . . . . . . . . (1,131,275) 2,985 (349,342)
Cash Flows From Financing Activities:Dividends paid . . . . . . . . . . . . . . . . . . . . . . . . . . . . . . . . . . . . . . . . . . . (179,855) (158,007) (136,955)Proceeds from issuance of commercial paper . . . . . . . . . . . . . . . . . . . 4,280,021 4,638,514 4,662,909Principal payments on commercial paper . . . . . . . . . . . . . . . . . . . . . . (4,273,666) (4,652,968) (4,657,700)Proceeds from issuance of long-term borrowings . . . . . . . . . . . . . . . . 1,108,956 179,166 38,959Payments on long-term borrowings . . . . . . . . . . . . . . . . . . . . . . . . . . . (8,241) (186,460) (79,453)Purchases of common stock . . . . . . . . . . . . . . . . . . . . . . . . . . . . . . . . . (98,385) (201,044) (165,116)Proceeds from issuance of common stock . . . . . . . . . . . . . . . . . . . . . . 206,666 49,063 15,187Other . . . . . . . . . . . . . . . . . . . . . . . . . . . . . . . . . . . . . . . . . . . . . . . . . . . (3,062) — —
Net cash provided by (used in) financing activities . . . . . . . . . . . . . . . . . . 1,032,434 (331,736) (322,169)
Net increase (decrease) in cash and cash equivalents . . . . . . . . . . . . . . . . . 256,790 95,295 (28,629)Cash and cash equivalents, beginning of year . . . . . . . . . . . . . . . . . . . . . . . 325,337 230,042 258,671
Cash and cash equivalents, end of year . . . . . . . . . . . . . . . . . . . . . . . . . . . . $ 582,127 $ 325,337 $ 230,042
1 2 7
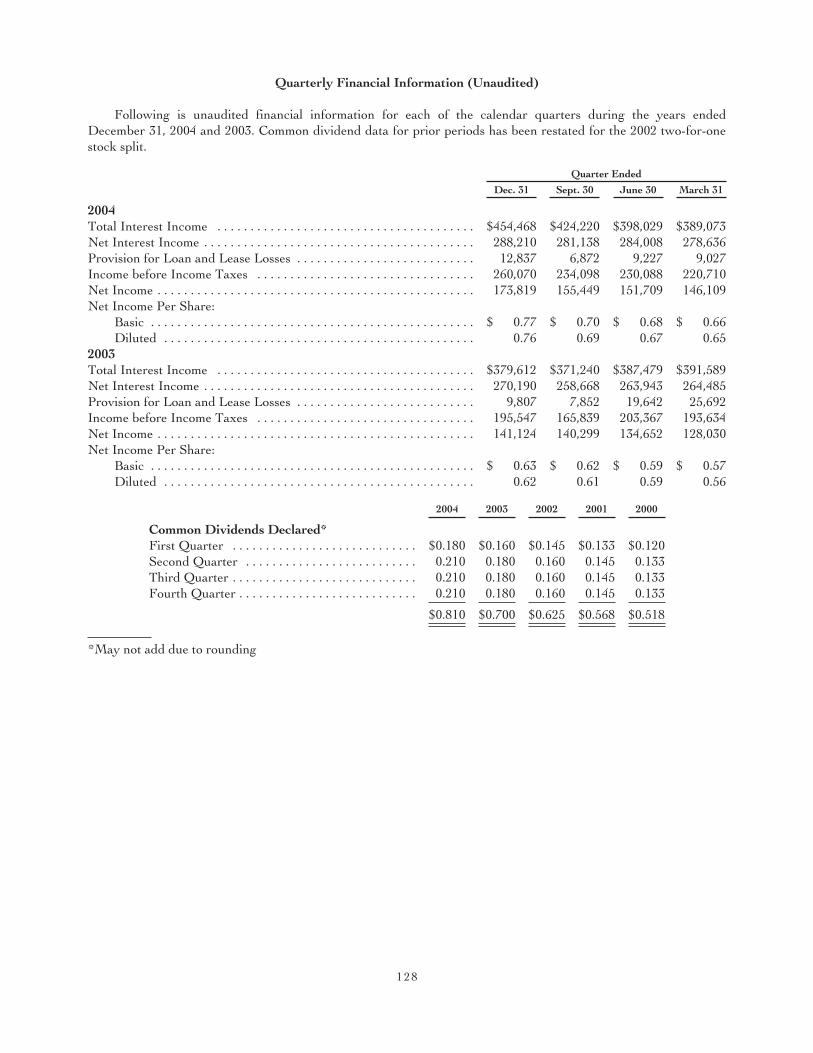
Quarterly Financial Information (Unaudited)
Following is unaudited financial information for each of the calendar quarters during the years endedDecember 31, 2004 and 2003. Common dividend data for prior periods has been restated for the 2002 two-for-onestock split.
Quarter Ended
Dec. 31 Sept. 30 June 30 March 31
2004Total Interest Income . . . . . . . . . . . . . . . . . . . . . . . . . . . . . . . . . . . . . . . $454,468 $424,220 $398,029 $389,073Net Interest Income . . . . . . . . . . . . . . . . . . . . . . . . . . . . . . . . . . . . . . . . . 288,210 281,138 284,008 278,636Provision for Loan and Lease Losses . . . . . . . . . . . . . . . . . . . . . . . . . . . 12,837 6,872 9,227 9,027Income before Income Taxes . . . . . . . . . . . . . . . . . . . . . . . . . . . . . . . . . 260,070 234,098 230,088 220,710Net Income . . . . . . . . . . . . . . . . . . . . . . . . . . . . . . . . . . . . . . . . . . . . . . . . 173,819 155,449 151,709 146,109Net Income Per Share:
Basic . . . . . . . . . . . . . . . . . . . . . . . . . . . . . . . . . . . . . . . . . . . . . . . . . $ 0.77 $ 0.70 $ 0.68 $ 0.66Diluted . . . . . . . . . . . . . . . . . . . . . . . . . . . . . . . . . . . . . . . . . . . . . . . 0.76 0.69 0.67 0.65
2003Total Interest Income . . . . . . . . . . . . . . . . . . . . . . . . . . . . . . . . . . . . . . . $379,612 $371,240 $387,479 $391,589Net Interest Income . . . . . . . . . . . . . . . . . . . . . . . . . . . . . . . . . . . . . . . . . 270,190 258,668 263,943 264,485Provision for Loan and Lease Losses . . . . . . . . . . . . . . . . . . . . . . . . . . . 9,807 7,852 19,642 25,692Income before Income Taxes . . . . . . . . . . . . . . . . . . . . . . . . . . . . . . . . . 195,547 165,839 203,367 193,634Net Income . . . . . . . . . . . . . . . . . . . . . . . . . . . . . . . . . . . . . . . . . . . . . . . . 141,124 140,299 134,652 128,030Net Income Per Share:
Basic . . . . . . . . . . . . . . . . . . . . . . . . . . . . . . . . . . . . . . . . . . . . . . . . . $ 0.63 $ 0.62 $ 0.59 $ 0.57Diluted . . . . . . . . . . . . . . . . . . . . . . . . . . . . . . . . . . . . . . . . . . . . . . . 0.62 0.61 0.59 0.56
2004 2003 2002 2001 2000
Common Dividends Declared*First Quarter . . . . . . . . . . . . . . . . . . . . . . . . . . . . $0.180 $0.160 $0.145 $0.133 $0.120Second Quarter . . . . . . . . . . . . . . . . . . . . . . . . . . 0.210 0.180 0.160 0.145 0.133Third Quarter . . . . . . . . . . . . . . . . . . . . . . . . . . . . 0.210 0.180 0.160 0.145 0.133Fourth Quarter . . . . . . . . . . . . . . . . . . . . . . . . . . . 0.210 0.180 0.160 0.145 0.133
$0.810 $0.700 $0.625 $0.568 $0.518
*May not add due to rounding
1 2 8

Price Range of Stock(Low and High Close-Restated for 2002 Two-for-One Stock Split)
2004 2003 2002 2001 2000
First QuarterLow . . . . . . . . . . . . . . . . . . . . . . . . . . . . . . . . . . . . . . . . . . . . . . . . . . $36.18 $25.07 $28.90 $24.02 $21.94High . . . . . . . . . . . . . . . . . . . . . . . . . . . . . . . . . . . . . . . . . . . . . . . . . . 40.39 29.15 31.68 27.60 30.22
Second QuarterLow . . . . . . . . . . . . . . . . . . . . . . . . . . . . . . . . . . . . . . . . . . . . . . . . . . 36.60 25.79 29.52 24.46 20.76High . . . . . . . . . . . . . . . . . . . . . . . . . . . . . . . . . . . . . . . . . . . . . . . . . . 41.15 31.75 31.96 27.18 27.66
Third QuarterLow . . . . . . . . . . . . . . . . . . . . . . . . . . . . . . . . . . . . . . . . . . . . . . . . . . 37.32 30.13 25.69 25.50 21.78High . . . . . . . . . . . . . . . . . . . . . . . . . . . . . . . . . . . . . . . . . . . . . . . . . . 41.21 32.74 30.97 29.78 25.81
Fourth QuarterLow . . . . . . . . . . . . . . . . . . . . . . . . . . . . . . . . . . . . . . . . . . . . . . . . . . 40.28 32.53 23.25 26.33 19.31High . . . . . . . . . . . . . . . . . . . . . . . . . . . . . . . . . . . . . . . . . . . . . . . . . . 44.43 38.40 29.20 32.06 25.75
1 2 9

MANAGEMENT’S REPORT ON INTERNAL CONTROL OVER FINANCIAL REPORTING
Management is responsible for establishing and maintaining adequate internal control over financial reporting.As such term is defined in Exchange Act Rule 13a-15(f), internal control over financial reporting is a processdesigned by, or under the supervision of, the principal executive and principal financial officers, or personsperforming similar functions, and effected by the board of directors, management and other personnel, to providereasonable assurance regarding the reliability of financial reporting and the preparation of financial statements forexternal purposes in accordance with accounting principles generally accepted in the United States. Internal controlover financial reporting includes those policies and procedures that:
(1) pertain to the maintenance of records that, in reasonable detail, accurately and fairly reflect thetransactions and dispositions of assets of the Corporation;
(2) provide reasonable assurance that transactions are recorded as necessary to permit preparation of thefinancial statements in accordance with accounting principles generally accepted in the United States, andthat receipts and expenditures of the Corporation are being made only in accordance with authorizationsof management and the directors of the Corporation; and
(3) provide reasonable assurance regarding prevention of unauthorized acquisition, use, or disposition of theCorporation’s assets that could have a material effect on the financial statements.
Management conducted an evaluation of the effectiveness of the Corporation’s internal control over financialreporting based on the criteria in Internal Control—Integrated Framework issued by the Committee of SponsoringOrganizations of the Treadway Commission. Based on this evaluation under the criteria in Internal Control —Integrated Framework, management concluded that internal control over financial reporting was effective as ofDecember 31, 2004.
Management’s assessment of the effectiveness of internal control over financial reporting as of December 31,2004 has been audited by Deloitte & Touche LLP, an independent registered public accounting firm, as stated intheir report dated February 28, 2005, which is included herein.
1 3 0
REPORT OF INDEPENDENT REGISTERED PUBLIC ACCOUNTING FIRM
To the Shareholders and Board of Directors of Marshall & Ilsley Corporation:We have audited management’s assessment, included in the accompanying Management’s Report on Internal
Control Over Financial Reporting, that Marshall & Ilsley Corporation and Subsidiaries (the “Corporation”)maintained effective internal control over financial reporting as of December 31, 2004, based on criteria establishedin Internal Control—Integrated Framework issued by the Committee of Sponsoring Organizations of the TreadwayCommission. Because management’s assessment and our audit were conducted to meet the reporting requirementsof Section 112 of the Federal Deposit Insurance Corporation Improvement Act (FDICIA), management’sassessment and our audit of the Corporation’s internal control over financial reporting included controls over thepreparation of the schedules equivalent to the basic financial statements in accordance with the instructions for theConsolidated Financial Statements for Bank Holding Companies (Form FR Y-9C). The Corporation’s management isresponsible for maintaining effective internal control over financial reporting and for its assessment of theeffectiveness of internal control over financial reporting. Our responsibility is to express an opinion onmanagement’s assessment and an opinion on the effectiveness of the Corporation’s internal control over financialreporting based on our audit.
We conducted our audit in accordance with the standards of the Public Company Accounting Oversight Board(United States). Those standards require that we plan and perform the audit to obtain reasonable assurance aboutwhether effective internal control over financial reporting was maintained in all material respects. Our audit includedobtaining an understanding of internal control over financial reporting, evaluating management’s assessment, testingand evaluating the design and operating effectiveness of internal control, and performing such other procedures as weconsidered necessary in the circumstances. We believe that our audit provides a reasonable basis for our opinions.
A company’s internal control over financial reporting is a process designed by, or under the supervision of, thecompany’s principal executive and principal financial officers, or persons performing similar functions, and effectedby the company’s board of directors, management, and other personnel to provide reasonable assurance regardingthe reliability of financial reporting and the preparation of financial statements for external purposes in accordancewith generally accepted accounting principles. A company’s internal control over financial reporting includes thosepolicies and procedures that (1) pertain to the maintenance of records that, in reasonable detail, accurately andfairly reflect the transactions and dispositions of the assets of the company; (2) provide reasonable assurance thattransactions are recorded as necessary to permit preparation of financial statements in accordance with generallyaccepted accounting principles, and that receipts and expenditures of the company are being made only inaccordance with authorizations of management and directors of the company and (3) provide reasonable assuranceregarding prevention or timely detection of unauthorized acquisition, use, or disposition of the company’s assetsthat could have a material effect on the financial statements.
Because of the inherent limitations of internal control over financial reporting, including the possibility ofcollusion or improper management override of controls, material misstatements due to error or fraud may not beprevented or detected on a timely basis. Also, projections of any evaluation of the effectiveness of the internalcontrol over financial reporting to future periods are subject to the risk that the controls may become inadequatebecause of changes in conditions, or that the degree of compliance with the policies or procedures may deteriorate.
In our opinion, management’s assessment that the Corporation maintained effective internal control overfinancial reporting as of December 31, 2004, is fairly stated, in all material respects, based on the criteria establishedin Internal Control—Integrated Framework issued by the Committee of Sponsoring Organizations of the TreadwayCommission. Also in our opinion, the Corporation maintained, in all material respects, effective internal controlover financial reporting as of December 31, 2004, based on the criteria established in Internal Control—IntegratedFramework issued by the Committee of Sponsoring Organizations of the Treadway Commission.
We have also audited, in accordance with the standards of the Public Company Accounting Oversight Board(United States), the consolidated financial statements as of and for the year ended December 31, 2004 of theCorporation and our report dated February 28, 2005 expressed an unqualified opinion on those financial statements.
Milwaukee, WisconsinFebruary 28, 2005
1 3 1
REPORT OF INDEPENDENT REGISTERED PUBLIC ACCOUNTING FIRM
To the Shareholders and Board of Directors of Marshall & Ilsley Corporation:
We have audited the accompanying consolidated balance sheets of Marshall & Ilsley Corporation andsubsidiaries (the “Corporation”) as of December 31, 2004 and 2003, and the related consolidated statements ofincome, shareholders’ equity and cash flows for each of the three years in the period ended December 31, 2004.These financial statements are the responsibility of the Corporation’s management. Our responsibility is to expressan opinion on these financial statements based on our audits.
We conducted our audits in accordance with standards of the Public Company Accounting Oversight Board(United States). Those standards require that we plan and perform the audit to obtain reasonable assurance aboutwhether the financial statements are free of material misstatement. An audit includes examining, on a test basis,evidence supporting the amounts and disclosures in the financial statements. An audit also includes assessing theaccounting principles used and significant estimates made by management, as well as evaluating the overall financialstatement presentation. We believe that our audits provide a reasonable basis for our opinion.
In our opinion, such consolidated financial statements present fairly, in all material respects, the financialposition of Marshall & Ilsley Corporation and subsidiaries as of December 31, 2004 and 2003, and the results oftheir operations and their cash flows for each of the three years in the period ended December 31, 2004 inconformity with accounting principles generally accepted in the United States of America.
We have also audited, in accordance with the standards of the Public Company Accounting Oversight Board(United States), the effectiveness of the Corporation’s internal control over financial reporting as of December 31,2004, based on the criteria established in Internal Control—Integrated Framework issued by the Committee ofSponsoring Organizations of the Treadway Commission and our report dated February 28, 2005 expressed anunqualified opinion on management’s assessment of the effectiveness of the Corporation’s internal control overfinancial reporting and an unqualified opinion on the effectiveness of the Corporation’s internal control overfinancial reporting.
Milwaukee, WisconsinFebruary 28, 2005
1 3 2
SHAREHOLDERS’ MEETING The Annual Meeting of Shareholders will be held on Tuesday, April 26, 2005, at 10:00 a.m. at the Pabst Theater, 144 East Wells Street, Milwaukee,Wisconsin.
REGISTRAR AND TRANSFER AGENT Continental Stock Transfer & Trust Company17 Battery Place – 8th Floor, New York, NY 10004(800) 529-3163
NYSE SYMBOL M&I common stock is traded on the New York StockExchange under the symbol MI.
For the closing price of M&I common stock, currentstock prices (with a 20-minute delay), and historicalstock prices, go to www.micorp.com.
ANNUAL REPORT ON FORM 10-K Shareholders and other interested persons may obtaina copy of M&I’s 2004 Annual Report on Form 10-Kfree of charge by calling the M&I ShareholderInformation Line at (800) 318-0208 or upon writtenrequest to:
Marshall & Ilsley Corporation Shareholder Relations,770 North Water Street, Milwaukee, WI 53202.
M&I has filed the Chief Executive Officer/Chief Financial Officer certifications that are requiredby Section 302 of the Sarbanes-Oxley Act of 2002 asexhibits to its Annual Report on Form 10-K.
INVESTOR RELATIONS WEBSITE For current corporate and investor information,including certain documents related to Marshall &Ilsley Corporation’s corporate governance, go towww.micorp.com.
Shareholder Information
51162 M&I 3/1/05 7:49 AM Page 43

Marshall & Ilsley Corporation
770 North Water Street, Milwaukee, WI 53202
(414) 765-7700 www.micorp.com
51162 M&I 3/1/05 7:49 AM Page 44