2004 2005 c. p. van tassell, g. r. wiggans, and l. l. m. thornton animal improvement programs...
TRANSCRIPT

2004
2004
2005
C. P. Van Tassell, G. R. Wiggans, and L. L. M. ThorntonAnimal Improvement Programs LaboratoryAgricultural Research Service, USDA, Beltsville, MD
Investigation of Herds Years with Abnormal Distributions
of Calving Ease Scores

2004
2005
The Problem Herds with unusual distributions of data affect
evaluations of bulls
Worst case is when large share of records for a bull are in one “bad” herd
Herd reporting changes over time
0
20
40
60
80
100
1 2 3 4 5
Calving Ease Scores - Herd 1
Scor
e by
Her
d (%
)
Parity 1Parity 2
0
20
40
60
80
100
1 2 3 4 5
Calving Ease Scores - Herd 2
Scor
e by
Her
d (%
)

2004
2005
Percentage of Score by Parity In All Herds
0102030405060708090
100
1 2 3 4 5
Calving Ease Score
Cou
nts
by H
erd
-Pari
ty (
%)
Parity 1
Parity 2+

Frequency of CE Scores by herd for HOUSA0000XXXXXXXX
Herd 1 2 3 4 5 Total
-------- -------- -------- -------- -------- -------- --------
23050186 2 (100) 0 ( 0) 0 ( 0) 0 ( 0) 0 ( 0) 2 ( 1)
23380528 1 (100) 0 ( 0) 0 ( 0) 0 ( 0) 0 ( 0) 1 ( 1)
23600003 1 (100) 0 ( 0) 0 ( 0) 0 ( 0) 0 ( 0) 1 ( 1)
23600175 1 (100) 0 ( 0) 0 ( 0) 0 ( 0) 0 ( 0) 1 ( 1)
32460821 12 ( 18) 0 ( 0) 5 ( 8) 1 ( 2) 48 ( 73) 66 ( 34)
-----------------------------------------------------------------------------------------------
1380 ( 57) 467 ( 19) 410 ( 17) 76 ( 3) 78 ( 3) 2411
-----------------------------------------------------------------------------------------------
33130011 1 ( 14) 2 ( 29) 4 ( 57) 0 ( 0) 0 ( 0) 7 ( 4)
33130548 4 (100) 0 ( 0) 0 ( 0) 0 ( 0) 0 ( 0) 4 ( 2)
33980149 2 ( 67) 1 ( 33) 0 ( 0) 0 ( 0) 0 ( 0) 3 ( 2)
34470727 1 (100) 0 ( 0) 0 ( 0) 0 ( 0) 0 ( 0) 1 ( 1)
35100522 0 ( 0) 1 ( 50) 0 ( 0) 1 ( 50) 0 ( 0) 2 ( 1)
35100639 4 ( 67) 2 ( 33) 0 ( 0) 0 ( 0) 0 ( 0) 6 ( 3)
. . . . . . .
. . . . . . .
. . . . . . .
Example of a Problem Bull

2004
2005
Concept
Identify ‘outlier’ herds
Remove that data
Determine if evaluation is ‘better’
Trade-off between edits for bad data and overall loss of data

2004
2005
Test Edits Exclude herds with abnormal
distributions of scores
Abnormal herds defined by multinomial likelihood
Population frequencies for parity groups (1 vs. 2+) used for expected values
Herd test statistics calculated within parity (1 vs. 2+) and summed
2004
2005
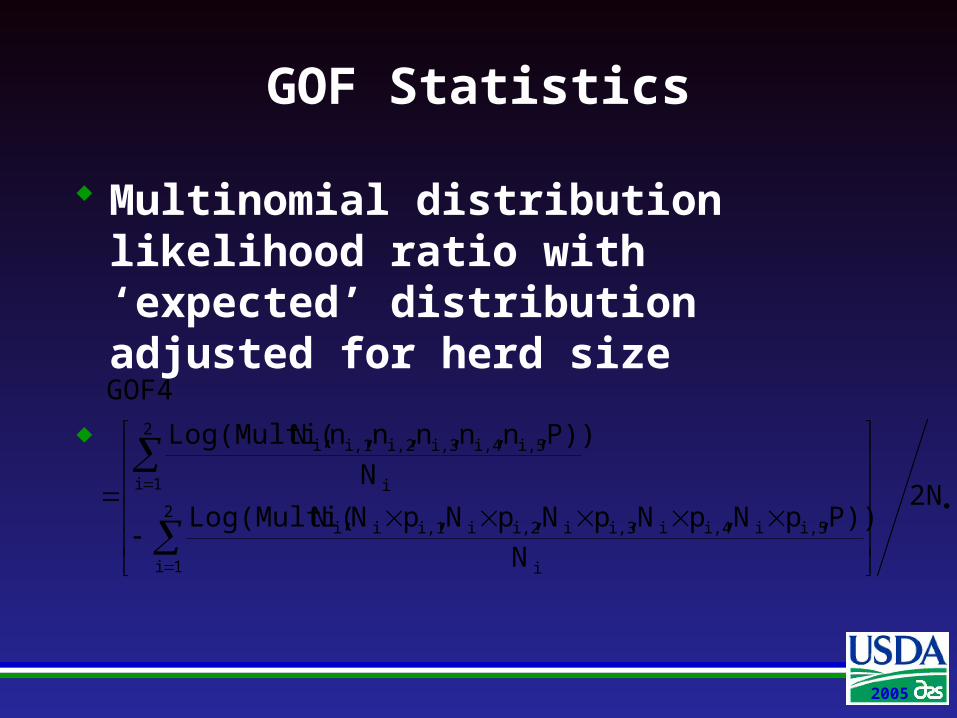
GOF Statistics
Multinomial distribution likelihood ratio with ‘expected’ distribution adjusted for herd size
2N
N
P)),pN,pN,pN,pN,pN,NLog(Multi(
N
P)),n,n,n,n,n,NLog(Multi(
GOF4
2
1 i i
i,5ii,4ii,3ii,2ii,1ii
2
1 i i
i,5i,4i,3i,2i,1i

2004
2005
Predictability of Future Evaluations
Compare evaluations from complete data to evaluations from partial data
Partial data truncated by:Date of calvingGoodness of Fit (GOF) exclusion

2004
2005
Strategy for Herd Exclusions
Adjacent herd-years also excluded if exceed a less extreme threshold
5-fold difference in likelihood
A future evaluation could potentially have fewer records than a previous run!

2004
2005
Example Herd 1
year c1_1 c1_2 c1_3 c1_4 c1_5 sumh1 c2_1 c2_2 c2_3 c2_4 c2_5 sumh2 gof drop
1996 0 0 0 0 1 1 0 1 79 0 2 82 -214.07 11997 0 0 0 0 0 0 0 0 224 1 8 233 -1190.18 11998 0 0 34 0 0 34 0 0 304 0 3 307 -866.92 11999 0 0 60 0 4 64 0 0 290 0 3 293 -862.84 12000 0 0 3 0 0 3 0 0 213 0 0 213 -545.39 12002 21 0 0 0 0 21 87 0 150 0 0 237 -241.89 12003 100 15 8 4 1 128 322 6 7 2 0 337 -59.50 02004 148 15 13 3 1 180 273 8 0 0 0 281 -72.15 0
2004
2005
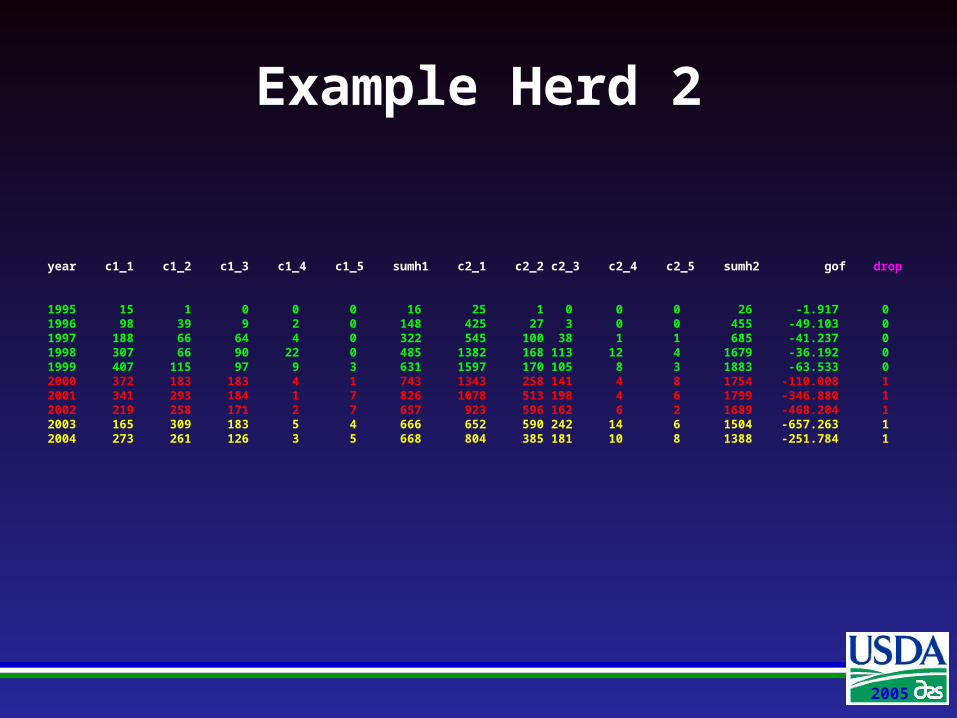
Example Herd 2
year c1_1 c1_2 c1_3 c1_4 c1_5 sumh1 c2_1 c2_2 c2_3 c2_4 c2_5 sumh2 gof drop
1995 15 1 0 0 0 16 25 1 0 0 0 26 -1.917 01996 98 39 9 2 0 148 425 27 3 0 0 455 -49.103 01997 188 66 64 4 0 322 545 100 38 1 1 685 -41.237 01998 307 66 90 22 0 485 1382 168 113 12 4 1679 -36.192 01999 407 115 97 9 3 631 1597 170 105 8 3 1883 -63.533 02000 372 183 183 4 1 743 1343 258 141 4 8 1754 -110.008 12001 341 293 184 1 7 826 1078 513 198 4 6 1799 -346.880 12002 219 258 171 2 7 657 923 596 162 6 2 1689 -468.204 12003 165 309 183 5 4 666 652 590 242 14 6 1504 -657.263 12004 273 261 126 3 5 668 804 385 181 10 8 1388 -251.784 1

2004
2005
Percentage of Score by Parity In All (AN) and GOF4 Excluded
(AG) Herds
0102030405060708090
100
1 2 3 4 5
Calving Ease Score
Cou
nts
by H
erd
-Pari
ty (
%)
Parity 1 - AN
Parity 2 - AN
Parity 1 - AG
Parity 2 - AG

2004
2005
Conclusions
GOF test excludes herds with poor score distribution uniformly across herd size
Exclusion of herds results in loss of evaluations for some bulls
Exclusion of data is expected to improve run to run stability

2004
2005
Remaining Issues
Optimum amount of data to exclude
Evaluate different fractions of data removal
Recently submitted test run to InterBull with 1.5% data excluded
Will likely move to 7% data discardedWill conduct sensitivity analysis to assess optimal data discard
Current InterBull test run for calving ease

2004
2005
Frequency of Codes in Combined Interbull File
Code
SourceOfficial Report
Frequency PercentCumulative
Frequency Percent
Sire Calving Ease
CFrom correlation
No 5367 4.77 5367 4.77
D Domestic No 15,073 13.40 20,440 18.17
D Domestic Yes 26,049 23.15 46,489 41.32
I Interbull Yes 22,809 20.27 69,298 61.59
PSire MGS Indices
Yes 43,208 38.41 112,506 100.00
Daughter Calving Ease
CFrom correlation
Yes 10,792 9.59 10,792 9.59
D Domestic No 15,073 13.40 25,865 22.99
D Domestic Yes 26,049 23.15 51,914 46.14
I Interbull Yes 17,384 15.45 69,298 61.59
PSire MGS Indices
Yes 43,208 38.41 112,506 100.00