2003nutthawutthisitt - university of wisconsin-stout
TRANSCRIPT

THE COMPARISONS OF APPEARANCE MANAGEMENT, BODY
SATISFACTION AND BUYING BEHAVIORS BETWEEN ASIAN
NATIONAL AND ASIAN AMERICAN FEMALE STUDENTS
By
Theeranart Nutthawutthisit
A Research Paper
Submitted in Partial Fulfillment of the Requirement for the
Master of Science Degree With a Major in
Home Economics
Approved: 2 Semester Credits
_______________________________
Investigation Advisor
The Graduate School University of Wisconsin-Stout
August, 2003
The Graduate College University of Wisconsin – Stout
Menomonie, WI 54751

ii
ABSTRACT
Nutthawutthisit Theeranart (Writer) (Last Name) (First) (Initial) The Comparisons of Appearance Management, Body Satisfaction and Buying Behaviors Between Asian National and Asian American Female Students (Title) Home Economics Dr. Rita Christoffersen August, 2003 68 (Graduate Major) (Research Advisor) (Month/ Year) (No. of Pages) American Psychological Association (APA) Publication Manual: Fifth Edition
(Name of Style Manual Used in this Study)
The purpose of this study was to examine the appearance management, body
satisfaction and buying behaviors of Asian nationals and Asian Americans female
students attending University of Wisconsin- Stout during academic year 2002-2003.
The survey consisted of demographic information, clothing preferences, hair
management care, and adornment, accessory and cosmetic preferences. Results were
analyzed by using mean, percentage distribution and frequency count.
Four nationalities were studied: Chinese, Korean, Japanese, and Hmong. The ages
ranged from 18-31 for Asian nationals and 18-34 for Asian Americans. The respondents
were about the same height and somewhat different in weight.
Differences and similarities between Asian nationals and Asian Americans were
found in the study. Although the average weight for Asian Americans was higher than
Asian nationals’, they were more satisfied with their bodies. Asian nationals worried
about their weight and body proportion more often than Asian Americans. Differences in

iii
cultural background and perception of beauty were also reflected in Asian respondents’
different appearance-management activities such as whitening lotion applied by Asian
nationals and skin-tanning lotion applied by Asian Americans. One could speculate that
Asian Americans were more relaxed and casual than Asian nationals.
Asian nationals preferred expensive brand named clothing and accessories. They tended
to select clothing items because of fashion and brand name, whereas Asian Americans
preferred clothing that were comfortable and showed their individual identity. Asian
nationals preferred Asian brands, especially in skin care and hair care products.
The majority of Asian nationals were described as fashionable or quite
fashionable persons. However, they were also conservative. This factor could result
Asian national respondents in dressing more conservative in their dress. Asian Americans
were casual and natural types of persons and were not as quite fashion conscious. They
tended to wear clothes that reflected their identity.

iv
ACHKNOWLEDGEMENT
I wish to thank Dr. Rita Christoffersen for her valuable time and her willingness
to offer expertise, for guidance and patience during the development of this study. Thank
you to Amy Gillet in teaching me the right research technique, and another thanks to
Christine Ness in helping me with data analysis.
I also want to give special thanks to my family, and my fiancé; Charles Hannasch,
for the extreme support and motivation. Big thanks to Amanda, Amy and Mei Lin for
cooking meals for me and keeping the house peaceful while I was working on the
research. Thank you Tanner for entertaining me and be a good boy.
Theeranart Nutthawutthisit

v
DEDICATION
To my parents, sister, brother, nanny, and my fiancé.
I love you all.
Theeranart

vi
Table of Contents
Page
Abstract……………………………………………………………………………………ii
List of tables……………………………………………………………...…………….....ix
Chapter I – Introduction…………………………………………………………………...1
Statement of Problem……………………………………………………………...2
Objectives…………………………………………………………………………2
Assumptions…………………………………………………………………….…3
Limitations………………………………………………………………….……..3
Chapter II – Review of Literature………………………………………………………....4
Demographic Information of Asian Americans…………………………………...4
Demographic Information of Asian Nationals…………………………………….7
China……………………………………………………………………....7
Japan……………………………………………………………………....8
Korea (Republic of Korea)………………………………………………..9
Laos (The Lao People’s Democratic Republic)………………………….10
Buying Behaviors of Americans…………………………………………...….....11
Buying Behaviors of Asian Americans and Asian nationals……………...……..12
Chapter III – Methodology………………………………………………………………15
Development of the Survey………………………...……………………………15
Selection of Sample……………………………………………………...………16
Administration of Survey………………………………………………………...16
Statistical Treatment of Data…..……………...…………………………………16

vii
Chapter IV – Results……………………………………………………………………..18
Demographic Information………………………………………………………..18
Body Satisfaction………………………………………………………………...19
Satisfaction toward Sizes of Body parts……………………...………….20
Appearance Management and Buying Behaviors………………………………..24
General Clothing Preferences…………………………………………....28
Type of Fabric…………………………………………………....28
Clothing Colors…………………………………………………..30
Clothing Sizes……………………………………………………31
Type of Garments………………………………………………..32
Brand Preferences………………………………………………..33
Hair Care and Management Preferences…………………………………34
Hair Condition…………………………………………………...34
Stylist Services during the Past Three Month……………………35
Shampoo Preferences………………………………………….....37
Length of Hair……………………………………………………37
The Care and Management of the Body…………………………………38
Accessory, Adornment, Cosmetic Management………………………...39
Typically-worn Accessories and Adornments…………………..39
Jewelry Preferences……………………………………………..39
Cosmetic Preferences and the Management……………………41
Most-Worn Cosmetic…………………………………….………42
Perfume……………………………………………………….….44

viii
Skin Products………………………………………………….…45
Reasons for Using Skin Products……………………………..….46
Nails Management…………………………………………….…48
Attitudes toward Self Image………………………………………….….50
Chapter V – Summary, Conclusions and Recommendation……………………………..53
Introduction……………………………………………………………………....53
Summary………………………………………………………………………....53
Conclusions………………………………………………………………………53
Recommendations to Retailers…………………………………………………..56
Recommendations for future study………………………………………………57
References……………………………………………………………………………..58
Appendix A: Appearance Management Survey…………………………………………60
Appendix B: Cover Letter……………………………………………………………….67

ix
LIST OF TABLES
Table Page
Table 1 The Frequency and Percentage Distribution of Asian Nationals’ Satisfaction With Sizes of Body Parts……………………………………………………....21
Table 2 The Frequency and Percentage Distribution of Asian Americans’ Satisfaction
With Sizes of Body Parts…………………………………………………...….22 Table 3 The Average Rating of Responses towards the Aspects of Body……………...24 Table 4 The Average Rating Scores of Asian nationals towards Reasons Why They
Chose Clothing Items to Manage Their Bodily Appearance…………………..26 Table 5 The Average Rating Scores of Asian Americans towards Reasons Why They
Chose Clothing Items to Manage Their Bodily Appearance…………………..27 Table 6 The Frequency and Percentage Distribution of The Responses towards Fabric
Preferences…………………………………………………………………….29 Table 7 The Frequency and Percentage Distribution of the Responses towards Clothing Color Preferences……………………………………………………30 Table 8 The Frequency and Percentage Distribution of the Responses towards Clothing Size Preferences……………………………………………………..31 Table 9 The Frequency and Percentage Distribution of the Responses towards Preferences of Categories of Garments……………………………………..…33 Table 10 The Frequency and Percentage Distribution of the Responses towards Brand Preferences of Clothing and Accessories………………………………34 Table 11 The Frequency and Percentage Distribution of the Responses towards Hair Condition…………………………………………………………………35 Table 12 The Frequency and Percentage Distribution of the Responses towards Preferences of Hair Length…………………………………………………….38 Table 13 The Frequency and Percentage Distribution of the Responses towards Jewelry Preferences……………………………………………………………40

x
Table 14 The Frequency and Percentage Distribution of the Responses towards The Frequency of Wearing Make Up………………………………………….41 Table 15 The Frequency and Percentage Distribution of the Responses towards The Overall Facial Cosmetics Mostly Worn………………………………….42 Table 16 The Frequency and Percentage Distribution of the Responses towards The Eye Cosmetic Mostly Worn………………………………………………43 Table 17 The Frequency and Percentage Distribution of the Responses towards The Frequency of Wearing Perfume…………………………………………..44 Table 18 The Frequency and Percentage Distribution of the Responses towards Application of Skin Products to Body Area…………………………………...46 Table 19 The Frequency and Percentage Distribution of the Responses towards Reasons for Using Skin Products………………………………………………47 Table 20 The Frequency and Percentage Distribution of the Responses towards The Frequency of Painting Nails………………………………………………48 Table 21 The Frequency and Percentage Distribution of the Responses towards Preferences of Nail-Polish Colors……………………………………………..49 Table 22 The Frequency and Percentage Distribution of the Responses towards Fashion Consciousness………………………………………………………..51

1
CHAPTER I
Introduction
Although the Asian population is, at the current time, considered a minority group
in the United States, Asians have significant implications for the nation’s retailers and
manufacturers.
The United States is undergoing a demographic transition. After the Civil Rights
Act of 1964 and the Immigration Act of 1965, the United States gained increasing
numbers of immigrants and has rapidly become a multicultural society. The Immigration
Act of 1965 allowed higher quotas, which in turn encouraged the immigration of
Japanese, Chinese, Koreans, Filipino, and other Asian nationals to America. During the
1980s, the U.S. received six million legal immigrants and among those, nearly half (2.4
million) came from Asia (Hsia, 1988).
In the 21st century, the entire population growth of the nation is predicted to slow
to approximately 1.4 million per year compared to 1.8 million in the 1990s. Asian
Americans and Asian nationals who have moved to the United States are believed to have
higher concerns for education and professional jobs. They tend to have larger households
with more than one income earner, resulting in their having above average incomes.
Asian nationals tend to live in such metropolitan areas as Chicago, New York, Los
Angeles, and other major cities of America. Most Asian nationals come to the United
States for educational and career purposes (O’ Hare, 1990).
Asian Americans are the fastest growing minority group in America. Businesses
should become more concerned with meeting the needs and wants of this minority.

2
The various Asian populations living in America are culturally and
demographically diverse. These diversities include differences in acculturation, language,
values, and such basic socio demographics as geographic residence, age distribution,
national origin, economic level, and educational levels (Mokuau, 1991). All these factors
affect their preferences in appearance management and buying behavior towards clothing
and adornmentation.
The survey of appearance management in this study will help manufacturers and
retailers to determine buying behavior and to better serve the needs of Asian American
and Asian national consumers. The findings will, as well, help educators to further their
research interests and students to gain a greater understanding of the product and service
needs of this particular population.
Statement of Problem
The purpose of this study was to compare preferences of overall appearance
management and satisfaction with their body image between Asian Americans and Asian
nationals enrolled in University of Wisconsin-Stout. The Asian nationalities will include
Chinese, Korean, Japanese, and Hmong students. This research was conducted to indicate
buying behavior of this particular population. Data was collected during Spring of 2003
by survey.
Objectives
The objectives of this study were:
1. To examine the demographic background of Asian Americans and Asian
nationals.

3
2. To investigate apparel and adornment preferences and shopping behavior, as
well as, appearance management and satisfaction with body image of selected Asian
American and Asian national female students attending the University of Wisconsin-
Stout.
3. To compare the factors above among Asian nationals and Asian Americans, in
an aim to point out the differences in buying behavior and satisfaction with body image
including appearance management.
Assumption
The assumption of this study is that there are differences of appearance
management, body satisfaction and buying behaviors between Asian Americans and
Asian nationals.
Limitations
This study has limitations as follow;
1. The sample is limited to female students who are Asian nationals and Asian
Americans attending University of Wisconsin- Stout.
2. Asian nationals and Asian Americans in the study are limited to only four
nationalities: Chinese, Korean, Japanese, and Hmong, therefore, the result cannot be
applied to other Asian groups such as Filipino and Pacific Islanders.
3. Asian nationals are limited to those students who have been in the U.S. less
than 2 years.
4. The finding of this study should not be generalized to the whole Asian female
population found in the United States.

4
CHAPTER II
Review of Literature
This review of literature will discuss the following topics:
1) Demographic information of Asian Americans, as well as of specific country origin of
selected Asian nationals, 2) buying behaviors of Americans in general, and 3) buying
behaviors of Asian American and Asian nationals.
Demographic information of Asian Americans
Due to the Civil Rights Act of 1964 and the Immigration Act of 1965, the United
States gained increasing numbers of immigrants since it allowed the influx of more
Asians and Hispanics than North European immigrants (Block & Walker, 1981). The
Civil Rights Act of 1964 banned discrimination on the basis of anyone’s race, color,
national origin, religion, or sex in the use of public facilities, the right to vote, or to seek
work. The law further directed the Office of Education, now the Department of
Education, to desegregate schools. In 1968, the Civil Rights Act was extended to prohibit
discrimination in the sales or rental of housing. In addition, the Immigration Act of 1965
amended the McCarran-Walter Act of 1952, which perpetuated a restrictive national
origins system of the 1924 Immigration Act with tiny quotas for Asians. The 1965
amendments required one quota for the Western Hemisphere and one for the Eastern
Hemisphere. With the change in Asian immigrant quotas, increasing numbers of Chinese,
Koreans, Asian Indians, Filipinos, and other Asians have left their homelands voluntarily
for educational and economic opportunities in the United States (Hsia, 1988).
In addition, since 1975, more than 800,000 Southeast Asian refugees have arrived
in North America through a series of parole authorizations granted by the Attorney

5
General under the Immigration and Nationality Act. Therefore, between 1970 and 1985,
Asian Americans have quadrupled in number from 1.4 million in 1970 to 3.5 million in
1980. In 1990, there were more than a million Southeast Asians in the United States
especially Vietnamese and Laotians, who are known as Hmongs. The settlement of the
Hmong came to be concentrated in a few areas of California, New England, Minnesota,
Washington, Colorado, North Carolina, and Wisconsin. (Hsia 1988; O’Hare & Felt,
1991; Walker-Moffat, 1995).
According to American Demographics, if current trends in immigration and birth
rates persist, U.S. residents who are minorities (Blacks, Hispanics, and Asians) will be
nearly 115 million by the year 2020, while the white population will increase at a much
lower rate. With these trends, America is becoming a more multiethnic or multicultural
society (Henry III, 1990; Riche, 1991)
During the 1980s, Asian American population’s growth rate was approximately
80 percent. According to the 1988 U.S. Bureau of Census, the total Asian American
population in 1980 was about 3.7 million, among whom the Chinese were the largest
group with 812,000, followed by 716,000 Japanese, 387,000 Asian Indians, 357,000
Koreans, and 243,000 Pacific Islander Americans (O’Hare, 1990; Makuau, 1991).
Furthermore, the 2001 U.S. Bureau of Census has recorded that the total number of
Asian Americans in the year 2001 were 10,990,000, and are predicted to be 12,497,000
by the year 2005, and 14,436,000 by the year 2010. Asians are the fastest growing
minority, enjoying a 31 percent increase in number between 2001 and 2010 (New
Strategist Publications, 2001).

6
Asian Americans concentrate in metropolitan areas in the West and Mid-Atlantic
states of Illinois, New York, California, and in major cities of America, while other U.S.
born minorities and older immigrants can be found more in suburban areas. Asian
immigrants tended to settle around university centers both small and large due to their
desire for higher education. They also persistently searched for fresh social and economic
opportunities (Riche, 1991).
Asians did not originally decide to come to the United States for an education.
Most left their homelands in order to escape war, poverty, unemployment, political and
religious persecution, and other human misfortune. They emigrated because it was a new
land with the ability to start a new life and have more opportunity (Hsia, 1988).
Education for Asian Americans in the earliest days was rarely at issue. Asian
children seldom had access to public schools, although parents involuntarily supported
public schools at higher rates than other Americans through a series of repressive taxes.
However, since World War II, opportunities for education have become widely available.
Asian Americans have been historically among the most committed to higher education.
Chinese, Japanese, and Korean women have reported substantially higher college
completion rates than white women. The right to any sort of education has been so dearly
won by each of the Asian immigrant groups that most still regard a college education as a
privilege, albeit one essential for their full acceptance and success in American society
(Walker-Moffat, 1995).

7
Demographic information of Asian Nationals
China
China, known as the world’s most populous country, is located in the east central
part of Asia, with Beijing as its capital. According to the 1999 Encyclopedia of Global
Population and Demographics, it is the world’s third largest country besides Russia and
Canada, with total land area of 3,705,390 square miles (9,596,960 square kilometers).
The nation is governed by the Communist Party, that gained power in the 1949 revolution
that defeated the Chinese nationals. Since the late 1970s, the Communist Party has
opened the economy to foreign trade and investment and implemented market reforms
that have eroded many social protections. Since 1978, China has undergone enormous
economic change. Both in agriculture and industry, a socialist market economy has been
created (Weinberg, 1997).
China’s open opportunity for foreign trade and investment has led to a lack of
regulations, which in turn degraded the physical environment. Though the economy has
industrialized rapidly, poverty, particularly in rural areas, increased dramatically. By the
mid-1990s, up to 100 million migrant workers left the countryside and moved into cities
in search of work. In 1995, China was the world’s most populous country, with
1,210,004,956 people. The country has instituted one of the most Draconian birth-control
policies in the world, leading its population to decline 1.5 percent in 1953 and 1.0 percent
in 1995, though equivalent to growth rates in most industrialized countries (Ciment,
1999)
In China, women tend to have fewer educational opportunities than men. This is a
result of the historic, structural, and cultural components. Chinese women are expected to

8
take care of the household and children. Therefore, education is not as important as for
men who have to work and support the family. Moreover, in many rural areas, school
attendance was said to be declining as farmers kept their children on the farm to meet
output goals. This behavior resulted in less opportunity for Chinese children to go to
school (Weinberg, 1997). In 1995, only 5 percent of the total population possessed higher
education, while 67 percent had completed secondary education (Ciment, 1999).
Japan
Japan is an island country located in East Asia surrounded by the East China Sea,
Pacific Ocean, and Sea of Japan. Tokyo is Japan’s capital and it has other major cities
such as Osaka, Nagoya, Sapporo and Kobe. The country’s neighbors are the Korean
Peninsula to the west and the Russian Federation to the northwest. The total land area is
144,689 square miles. The country has a democratic system of government dominated by
the Liberal Democratic Party (Ciment, 1999).
Japan is also known as one of the world’s leading economic powers, with a
modern and highly efficient industrial sector. The Japanese government plays an
important role in assisting industrial growth. In 1990, the nation faced a financial crisis
and was enduring a long economic recession. This occurred in part because of high levels
of speculation on real estate and equities (Hsia, 1988; Weinberg, 1997).
Japan’s leading industries have historically provided workers with a cradle-to-
grave safety net. Its people are the healthiest people in the world, with a comprehensive
and accessible medical care system. In 1995, the nation’s population of nearly 125.5
million was growing at the slow rate of 0.2 percent, due to a declining birth rate. The
country also has high life expectancy at birth of nearly 80 years and the lowest infant

9
mortality rate in the world with 4.4 deaths per 1,000 live births (Ciment, 1999; Cohen,
2002).
Japanese women are among those who have high education attainment.
According to the 1997 World Fact book, up to 40 percent of Japanese women had higher
education by the year 1995, meanwhile 99 percent completed their secondary level
education degree.
Korea (Republic of Korea)
The Republic of Korea is also known as South Korea. South Korea is located in
East Asia on the southern half of the Korean Peninsula between the Sea of Japan and the
Yellow Sea. Its total land area is 38,023 square miles with North Korea to the north and
Japan to the southeast, across the Korea Strait (Ciment, 1999).
South Korea gained independence in August of 1948 and had developed its
economy quickly. The country has a modern industrial economy, with a highly trained
and skilled labor force. The South Korean government played an important role in
developing the economy in terms of planning and investment. Its startling industrial
advance has been accompanied by the development of an autonomous workers’
movement demanding higher wages and improved working conditions (Hsia, 1988;
Ciment, 1999).
From the 1960s to the 1980s, South Korea faced one of the most dramatic social,
economic, and political transformations of any country on the face of the earth. It went
from a primarily rural and agricultural society to a largely industrialized and urban one.
Between 1965 and 1995, the country’s population increased from more than 16.2 million
to 45.5 million. Moreover, as the economy modernized and became more urbanized, the

10
population growth rate stabilized and gradually declined to less than half the earlier
growth rate. The country also has high a life expectancy and a low infant mortality rate
(Ciment, 1999).
As recorded in the 1997 World Fact book, in the year 1995, over 50 percent of
Korean women had earned a higher education degree, and up to 97 percent had finished
secondary school.
Laos (The Lao People’s Democratic Republic)
Laos is located in Southeast Asia. Vietnam is on its eastern and northeastern
boarders, China to its north, Myanmar on the northwestern, and Thailand and Cambodia
to its southwest. The nation was a territory of France and gained its independence in July
1949 (Ciment, 1999).
Laos is considered an agricultural country, with a largely undeveloped
infrastructure that is in great need of expansion. Its per capita gross domestic product
(GDP) was only $1,100 in 1995. At that time, the country’s population of nearly 5
million was growing at an annual rate of 2.8 percent, primarily due to high birth rate. The
country’s 1995 infant mortality rate approached 96.8 deaths per 1,000 live births
(Weinberg, 1997).
The Hmong who number 8 percent of Laos’ population in 1995, are those who
fled China during the 19th and 20th centuries. They lived exclusively in mountainous areas
with a lack of education and career opportunity. In 1975 and 1984, the Hmong refugees
arrived in the United States through a series of parole authorizations granted by the
Attorney General under the Immigration and Nationality Act (Walker-Moffat, 1995).

11
In Laos, the rate of literacy is extremely low. In 1995, only 3 percent of the total
population could read a newspaper and 7 percent had television. This has led to low
completion of education among the Lao population. Hmong women lived in the mountain
regions and had the least chance for education. Moreover, only 18 percent of Lao females
finished secondary school and none of them had completed higher level of education
(Ciment, 1999).
Buying behaviors of Americans
According to 1999 New Strategist Publications, the American household income
stands at a record high today, with the median reaching $37,005 in 1997. Besides, nearly
one in ten households had an income of $100,000 or more. In 1967, fewer than 2 million
households had incomes of $100,000 or more (in 1997 dollars). By the year 1997, the
number had risen to nearly 10 million, which was more than five times the 1967 figure.
Consumer behavior is highly related to household income. Consumer behavior is
defined as the study of the buying units and the exchange processes involved in
acquiring, consuming, and disposing of goods, services, experiences, and ideas (Mowen,
1995). Americans in general are more likely to have less brand loyalty, but value quality
and are price conscious. They look more for better deals with better quality, especially
among women ages 30 to 45, while having low store loyalty. There are several reasons
that people purchase products, such as needs and wants of consumption, and enhancing
physical attractiveness. Many factors influence the buying process, such as peer pressure,
cultural background, advertisement, etc. According to New Strategist Publications of
1999, Americans spend most on food and beverages, followed by apparel, health care,

12
electronics equipment, and personal care products and services. In addition, female
consumers spend 50 percent more on apparel than males (Riche, 1993).
It appears that most female American students pay higher attention to their
appearance than male students. In 2000, college students, especially female students,
were reported spending 9,244,278 dollars on food and beverage and up to 7,771,330
dollars on apparel. (New Strategist Publications, 1999). The buying behaviors of college
students are highly impacted by feelings and emotions. Almost 80 percent of their apparel
expense is impulsive buying. They also rely heavily on image and social situations, such
as peer pressure. Their strong emotional elements drive them to engage in actions that
have high levels of symbolic meaning, such as wearing certain types of jewelry to create
a tough image (Mowen, 1995).
In addition, the improvement of household income in the midwest since 1990 has
reflected in midwestern spending habits. In Wisconsin in 2001, total consumer buying
power was 97,744,759,000 dollars. Milwaukee County had the biggest consumer buying
power at 16,452,495 dollars followed by Dane County at 8,892,690,000 dollars, and
Waukesha County at 8,837,603,000 dollars (Claritus, 2002).
However, people in the midwest tend to consume products and services based
largely on their wants and needs, rather than feelings and emotions. Teenagers in the
midwest tend to be more relaxed in their appearance, which in turn reflects on their less
spending on apparel and adornment (New Strategist Publications, 1999).
Buying behaviors of Asian Americans and Asian nationals
Asian Americans and Asian nationals possess more household income because of
higher educational attainment and greater career success. They also respect and keep the

13
family as first priority. These factors, as well as their cultural background and cultural
differences, affect their purchasing decisions (Hartnett, 1992).
Asians are more likely to have high brand loyalty. However there is a difference
between Asian Americans’ and Asian nationals’ buying behavior. Asian Americans
seems to be more price-, selection-, and location-conscious, while Asian nationals are
more willing to pay higher price for products. They put more emphasis on brand and
store names. Most Asian nationals, especially those with higher education, are more
likely to buy apparel, shoes, and health and beauty aids that are designer brands. On the
other hand, many Asian Americans have their own loyalties. As they become
acculturated and confront a greater multitude of new and different brands, the previous
loyalty for certain products is diminished and they turn to new buying habits (Miller,
1991). According to the American Management Association (1987), all of the sources of
product information and advertising have a great effect on Asian American buying
decisions.
Asians also have high loyalty to their home country’s brands. For example,
Japanese people will be more likely to buy Japanese cars, and Colgate toothpaste is
popular in California because these items were popular in Asia. This is also applied to
apparel and adornment. Ninety percent of Asian nationals prefer to buy clothing from
designer brands that were advertised or had their branches in their home country.
However, some Asian Americans who used to consume certain American brands would
rather buy products from their homeland after they moved to the United States. They
think it shows their loyalty to their home country (American Management Association,
1987).

14
According to American Management Association (1987), in 1985, Asian
Americans made over 40 percent of their purchases due to impulse buying. Apparel and
shoes were considered to be the most frequently purchased items, followed by cosmetics,
jewelry, and handbags. However, Asian Americans are more careful in choosing products
than Asian nationals. This may be due to lack of product information. Asian Americans
are those who are better English speakers and have a higher chance of being informed
about products. It is more complicated for Asian nationals to choose particular products.

15
CHAPTER III
Methodology
This study primarily compared the differences of appearance management, body
image satisfaction and buying behavior between Asian national and Asian American
female students. The research also studied four nationalities including Chinese, Korean,
Japanese and Hmong. The respondents were attending the University of Wisconsin-Stout.
Development of the Survey
The surveys consisted of four categories with 57 questions. The categories
included self perception, body satisfaction, appearance management, and buying
behaviors and preferences. The survey questions also included basic demographic
characteristics descriptive of the respondents. Some questions were based on a research
project conducted by Dr. Renee Lynch (1989).
The surveys consisted of Likert Scales with response options from 1- too small to
5- too big, and 1- very dissatisfied to 5- very satisfied. These were designed to perceive
the body image satisfaction of the respondents. Closed- ended and partially closed-ended
questions with ordered and unordered response selection were also included. These were
designed to examine respondents’ perceptions of their bodies, appearance management
and buying behaviors and preferences. Some questions with short answer were included
in order to examine personal preferences in regard to their buying behaviors. In addition,
demographic information was gathered by using short answer and closed-ended
questions. A copy of the survey is shown in Appendix A.

16
Selection of the Sample
The sample group consisted of female Asian national and Asian American
students enrolled in University of Wisconsin- Stout. The respondents were limited to four
nationalities: Chinese, Korean, Japanese and Hmong. Asian nationals were limited to
those who had been in the United States for two years or less. A list of name of the
sample group was obtained from Registration and Records office of UW- Stout. The list
was randomly selected from the students meeting the research criteria.
Administration of Survey
A completion of Human Subject Protection training was required prior to a
process of sending out surveys. Consent for the research was obtained from the UW-
Stout Institutional Review Board for the Protection of Human Subjects in Research
(IRB). After an approval, a cover letter was attached to the survey explaining the purpose
of the study and inviting the subjects’ response. The letter appears in Appendix B. A total
of 100 surveys were sent out between May 7, 2003 and May 9, 2003. Sixty seven surveys
out of the total were emailed to the respondents, and 33 surveys were sent out by mail.
There were divided into 50 surveys for Asian nationals and Asian Americans. Self-
addressed, stamped return envelopes were also included with the surveys sent by mail.
The request was made to complete the survey and return it by May 30, 2003. The last
surveys were returned on June 4, 2003.
Statistical Treatment of the Data
The data collected from usable surveys was analyzed by the Academic Computer
Services Center at the University of Wisconsin- Stout. Mean, frequency count and
17
percentage were used for a comparison among Asian national and Asian American
female students.

18
CHAPTER IV
Results
This chapter will include the results of surveys comparing appearance
management, body image satisfaction and buying behavior between Asian national and
Asian American female students. It also includes demographic information of the
respondents.
One hundred surveys were sent to identified Asian national and Asian American
female students enrolled in University of Wisconsin-Stout. Sixty-seven surveys were
emailed and 33 surveys were sent by mail. A total of 62 surveys were returned, 58 of
which were usable. Of the 58 usable, 27 surveys were from Asian nationals and 31
surveys from Asian Americans. This resulted in an overall return rate of 58 percent.
Demographic information
Of the 58 participants, 46.6 percent (n = 27) indicated they were Asian national,
and 53.4 percent (n = 31) indicated they were Asian American. Of the total groups of
students, 32.8 percent (n = 19) said they were Chinese origin, 25.9 percent (n = 15)
indicated they were Korean origin, 24.1 percent (n = 14) said they were Japanese origin,
and 17.2 percent (n = 10) said they were Hmong origin. There were 2.32 percent of
respondents who identified themselves as Asian, though they did not fit into the above
groups.
Of the 27 Asian national respondents, 37 percent (n = 10) were of Chinese origin,
25.9 percent (n = 7) said they were of Korea origin, 25.9 percent (n = 7) indicated they
were of Japanese origin and 11.1 percent (n = 3) said they were of Hmong origin. Out of
31 Asian American respondents, 29 percent (n = 9) said they were of Chinese origin, 25.8
19
percent (n = 8) indicated they were of Korean origin, 22.6 percent (n = 7) indicated they
were of Japanese origin and 22.6 percent (n = 7) said they were of Hmong origin.
Of the 58 respondents, the average age for Asian nationals was 24 years old, and
of Asian Americans was 22 years old. The ages ranged from 18 to 31 for Asian nationals
and 18 to 34 for Asian Americans. The average reported height for Asian nationals was 5
feet 2 inches, and 5 feet 1 inch for Asian Americans. The range in height for Asian
nationals was from 4 feet 9 inches to 5 feet 6 inches, and for Asian Americans was from
4 feet 8 inches to 5 feet 6 inches. The average reported weight for Asian nationals was
109 pounds and 123 pounds for Asian Americans. The weights of the Asian nationals
ranged from 98 to 125 pounds. Asian Americans’ weights ranged from 85 to 246 pounds.
According to the surveys, the different percentage of each Asian origin might result in the
differences of body build.
Body Satisfaction
Respondents were asked to indicate their feeling and concerns about their
appearance and body image, in relation to the society they are in right now. Of all the
respondents, the largest number of Asian nationals (58.6 percent) weighed themselves
weekly and the majority of Asian Americans (62.1 percent) measured their body parts
every few months. In addition, 48.1 percent of Asian nationals indicated they were 5-10
pounds overweight and 33.3 percent always worried about their weight. Most of Asian
Americans, 41.9 percent thought their weight was just about right and 45.2 percent
worried about their weight once in a while. Thirty seven percent of Asian national
respondents indicated that from looking at them, most people thought they were normal
weight, 33.3 percent said people thought they were somewhat underweight, and 25.9

20
percent said people thought they were somewhat overweight (between normal weight and
very overweight). Most Asian American respondents (61.3 percent) indicated people
thought they were normal weight.
Although average weight of Asian nationals was lower that Asian American, they
tended to worry more about their body and weight.
Satisfaction toward sizes of body parts
Items 10 and 11 in the surveys addressed satisfaction with body proportion. According to
item 10, most of Asian nationals (81.5 percent) were satisfied with size of their breasts.
Size of shoulders was the second in satisfaction by Asian nationals (74.1 percent). The
sizes of other body parts Asian nationals were satisfied with included feet (70.4 percent),
calves (59.3 percent), and height (51.9 percent). There were several parts of the body
fewer Asian nationals were unsatisfied with. Approximately 48.2 percent revealed they
were satisfied with their face, while 40.8 said their arms met their satisfaction. Buttocks
were satisfied by 29.7 percent of Asian nationals. Approximately 26 percent of Asian
nationals were satisfied with their hips, and 26 percent of Asian nationals were also
satisfied with their thighs. The body parts least Asian nationals were satisfied with was
the waist (11.2 percent).
Asian Americans were most satisfied with the size of their shoulders (86.7
percent). It was also indicated that Asian Americans were satisfied with their feet (83.9
percent). The percentage of satisfaction towards sizes of shoulders and feet for Asian
Americans was only 2.8 percent different. Asian Americans were also satisfied with their
face (71.0 percent), arm (67.7 percent), hips (64.5 percent), buttocks (58.1 percent), and
weight (54.9 percent). Less than half of Asian American respondents were satisfied with

21
following body parts; calves (48.5 percent), thighs (48.5 percent), waist (30.3 percent),
chests (26.1 percent), and height was least satisfied (19.7 percent).
However, when being asked about their satisfaction toward overall appearance,
46.2 percent of Asian nationals said they were satisfied, whereas 64.5 percent of Asian
Americans indicated that they were satisfied with their overall appearance.
Table 1 and 2 list the respondents’ satisfaction with their sizes of body parts.
Table 1
The Frequency and Percentage Distribution of Asian Nationals’ Satisfaction with Sizes of
Body Parts
Body parts Frequency count Percentage
Chests/ breasts 22 81.5
Shoulders 20 74.1
Feet 19 70.4
Calves 16 59.3
Height 14 51.9
Face 13 48.2
Arms 11 40.8
Buttocks 7 29.7
Hips 6 26.0
Thighs 6 26.0
Weight 5 22.3
Waist/ stomach 2 11.2

22
Table 2
The Frequency and Percentage Distribution of Asian Americans’ Satisfaction with Sizes
of Body Parts
Body parts Frequency count Percentage
Shoulders 27 86.7
Feet 25 83.9
Face 22 71.0
Arm 21 67.7
Hips 20 64.5
Buttocks 18 58.1
Weight 17 54.9
Calves 15 48.5
Thighs 15 48.5
Waist/ stomach 10 32.5
Chests/ breasts 8 26.1
Height 6 19.7
Asian nationals were less satisfied with the size of their lower body parts than
Asian Americans. It could be seen that some differences existed between Asian nationals’
satisfaction and Asian Americans’ satisfaction with body parts. Both groups expressed
less satisfaction with waist/ stomach and thigh. Satisfaction with height was also different
between the two groups. Asian nationals seemed to be more satisfied with height than

23
Asian Americans. However, from the results, it could be noted that Asian Americans
were more satisfied with sizes of their body parts than Asian nationals.
According to item11, the respondents were asked to rate their satisfaction with the
following aspects of their body; face (facial features, complexion), hair (color, thickness,
texture), lower torso (buttocks, hips, thighs, legs), mid torso (waist, stomach), upper torso
(chest or breast, shoulders, arms), muscle tone, weight and height. The rating scales were
from 1- very dissatisfied to 5- very satisfied.
Asian Americans were more satisfied with these aspects of body than Asian
nationals. The average rating scores for most areas of the body were higher for Asian
Americans than for Asian nationals. Asian Americans had an average rating score of 4.5
for hair and 4.3 for face, which indicated that they were almost very satisfied (5
represents “very satisfied”). The highest rating score for Asian nationals was for hair (4.1
average rating) which indicated they were mostly satisfied. However, more Asian
nationals were satisfied with their upper torso (2.5 average rating) than Asian Americans
who had 2.0 average rating. Asian Americans (2.7 average rating) were more satisfied
with lower torso than Asian nationals (1.5 average rating). The body part for which Asian
nationals were least satisfied was weight which they rated average on 1.1, and for Asian
Americans was mid torso with a mean rating of 1.1.
Table 3 shows an average rating of the responses toward satisfaction of the
aspects of body.

24
Table 3
The Average Rating of Responses towards the Aspects of Body.
Areas of body Asian nationals Asian Americans
Hair (color, thickness, texture) 4.1 4.5
Face (facial features, complexion) 3.5 4.3
Upper torso (breasts, shoulders, arms) 2.5 2.0
Lower torso (buttocks, hips, thighs, legs) 1.5 2.7
Muscle tone 1.5 1.4
Height 1.5 2.2
Mid torso (waist, stomach) 1.3 1.1
Weight 1.1 3.7
1- very satisfied, 2- mostly dissatisfied, 3- Neither satisfied nor dissatisfied, 4- mostly satisfied, 5- very satisfied.
Although, Asian Americans’ average weight was heavier, they tended to have
higher satisfactions toward their weight. Asian nationals were more satisfied with their
upper torso and mid torso, while Asian Americans seemed to be more satisfied with their
lower torso, Respondents’ origin and cultural background could affect their satisfaction.
Appearance Management and Buying Behavior
The respondents were asked to describe their choice of clothing to manage or
enhance their appearance. They were requested to respond to given reasons why they
chose clothing items to manage their bodily appearance. Most Asian nationals strongly
agreed that “looking good on a model” was the most important reason when choosing
certain type of clothing. They selected clothing because it was a well- known brand with
higher price (4.5 average rating), made them look taller (4.1 average rating), and also
because it was fashionable (4.1average rating). Asian nationals neither agreed nor

25
disagreed on the following reasons; it is comfortable (3.3 average rating), it is suitable to
my culture (3.2 average rating), it makes my hip, thighs and buttocks slimmer (3.2
average rating), it makes my skin brighter (3.2 average rating), and it makes me feel
national pride (2.9 average rating). Several reasons were considered less than important
reasons. These were: it shows my individual identity (1.7 average rating), it covers
unwanted scar or mark on body (1.6 average rating), it makes my neck look longer (1.4
average rating), it makes my arms look longer/ slimmer (1.4 average rating), and it makes
my chests look bigger (1.2 average rating).
Most Asian Americans strongly agreed that comfort was the most important
reason for choosing certain clothing (4.9 average rating). They indicated that selecting a
well- known and expensive brand was very important (4.7 average rating). Most Asian
Americans revealed it is important that certain clothing should make them look taller (4.6
average rating). Asian American respondents also agreed that certain types of clothing
should make their chests look bigger (4.1 average rating), and their legs look longer (3.8
average rating). They neither agreed nor disagreed that the clothing should make their
hips, thighs and buttocks look slimmer (2.8 average rating). Other reasons that were not
strong selection factors for Asian Americans when choosing clothing items were: it
covers scar or unwanted mark on my body (2.3 average rating), it looks good on a model
(2.2 average rating), it is fashionable (2.2 average rating), it makes my neck look longer
(2.1 average rating), it makes my arms longer (1.9 average rating), it is well-known or
popular brand with higher price (1.8 average rating), it makes me feel national pride (1.8
average rating), it is suitable to my culture (1.5 average rating), and it makes my skin

26
look brighter (1.2 average rating). Table 4 and 5 shows average rating scores of the
respondents toward reasons why they chose clothing items to manage bodily appearance.
Table 4
The Average Rating Scores of Asian Nationals towards Reasons Why They Chose
Clothing Items to Manage Their Bodily Appearance.
Given reasons Average rating score
Looks good on a model 4.8
Is popular or well-know brand with high price 4.5
Makes me look taller 4.1
Is fashionable 4.1
Is comfortable 3.3
Is suitable to my culture 3.2
Makes my hip, thighs, and buttocks slimmer 3.2
Makes my skin look brighter 3.1
Makes me feel national pride 2.9
Makes my legs look longer 2.1
Makes my waist look slimmer 2.0
Shows my individual identity 1.7
Covers unwanted scars 1.6
Makes my neck look longer 1.4
Makes my arms look longer or slimmer 1.4
Makes my chests look bigger 1.2
1- strongly disagree, 2- disagree, 3- neutral, 4- agree, 5- strongly agree

27
Table 5
The Average Rating Scores of Asian Americans towards Reasons Why They Chose a
Certain Type of Clothing to Manage Their Bodily Appearance.
Given reasons Average rating score
Is comfortable 4.9
Shows my individual identity 4.7
Makes me look taller 4.6
Makes my waist look slimmer 4.3
Makes my chests look bigger 4.1
Makes my legs look longer 3.8
Makes my hips, thighs and buttocks slimmer 2.8
Covers scar or unwanted mark on my body 2.3
Looks good on a model 2.2
Is fashionable 2.2
Makes my neck look longer 2.1
Makes my arms longer 1.9
Is well-known or popular brand with higher price 1.8
Makes me feel national pride 1.8
Is suitable to my culture 1.5
Makes my skin look brighter 1.2
1- strongly disagree, 2- disagree, 3- neutral, 4- agree, 5- strongly agree

28
Most Asian Americans selected comfort over other reasons when choosing types
of clothing to wear. Asian nationals seemed to be more concerned about fashion and
brand name. Asian nationals neither agreed nor disagreed that comfort was important,
while Asian Americans strongly agreed that comfort was a very important reason for
selecting clothing. Asian Americans agreed that certain type of clothing should make
their chests look bigger. However, Asian nationals were least concerned about their chest.
Moreover, Asian Americans were concerned more about their individual identity than
Asian nationals. Most of the respondents had no concern towards clothing enhancing
their neck and arms. Several factors could affect their decision when choosing clothing
items, such as cultural background, origin, economy, and individual appearance.
General Clothing Preferences
Items 28- 35 addressed what the respondents’ preferences for fabric, size, clothing
color and type of garments.
Type of Fabric
Most of Asian nationals (44.0 percent) had no preferences towards type of fabric
they prefer to wear. Only 33.3 percent of them liked solid color fabrics more and 22.2
percent preferred print. As for Asian Americans, 48.4 percent said they had no
preferences while 35.5 percent indicated they preferred solid color and 16.1 percent
preferred print. Table 6 shows the frequency and percentage distribution of the responses
by fabric preference.

29
Table 6
The Frequency and Percentage Distribution of The Responses towards Fabric Preference.
Asian nationals Asian Americans Type of fabric
N % N %
Solid 9 33.3 11 35.5
Print 6 22.2 5 16.1
No preferences 12 44.4 15 48.4
Both groups were similar in preferences of type of fabric. The respondents
preferred solid fabric over print fabric. However, the majority did not have any
preferences.
In addition, respondents who preferred print fabric were also asked to indicate
what size and what type of print they would most likely wear. The results are as follow,
66.7 percent of Asian nationals preferred medium size print, while 33.3 percent chose
small print. Thirty-three percent of Asian nationals also preferred plaids and florals,
followed with 16.7 percent who preferred stripes and dots. Forty percent of Asian
Americans who chose prints would prefer to wear small prints and 40 percent preferred
medium print. Meanwhile 20 percent of Asian Americans had no preferences for size of
print fabric. None of the respondents chose large print. Forty percent of Asian Americans
chose stripes, 40 percent indicated they preferred floral patterns. Only 20% said they
would wear all the styles; plaids, stripes, dots, floral, and paisleys.
Preferences for small and medium prints could be because most Asian
respondents were of small body size. Large prints might be disproportionate to the body.

30
Clothing Colors
Light and pastel clothing colors were most preferred by Asian nationals (33.3
percent), followed by 22.2 percent who preferred bright, 22.2 percent preferred dark, 7.4
percent said they preferred earth tone and 14.8 percent had no preferences. Dark colors
were most preferred by the largest number of Asian American respondents ( 41.9
percent), while 16.1 percent indicated they liked earth tone, 6.5 percent chose light/
pastel, 3.2 percent preferred bright and 32.2 percent has no preferences. Table 7 shows
the frequency and percentage distribution of the responses towards clothing color they
most preferred to wear.
Table 7
The Frequency and Percentage Distribution of the Responses towards Clothing Color
Preferences.
Asian nationals Asian Americans Clothing colors
N % N %
Bright 6 22.2 1 3.2
Dark 6 22.2 13 41.9
Earth tone 2 7.4 5 16.1
Light and pastel 9 33.3 2 6.5
No preferences 4 14.8 10 32.3
Most Asian nationals preferred light and pastel colors, while the majority of Asian
Americans selected dark color. More Asian Americans than Asian nationals had no
preferences.

31
Clothing Sizes
Approximately 48 percent of Asian nationals indicated they wore junior sizes,
while 29.6 percent wore petites’ sizes, 18.5 percent said they wore misses' sizes and only
3.7 percent chose women’s sizes. None of Asian nationals wore half sizes. There were
45.1 percent of Asian Americans who wore petites’ sizes while 32.2 percent wore
juniors’ sizes, 12.9 percent wore misses’ sizes, 6.5 percent wore women’s sizes and 3.2
percent wore half sizes. Table 8 reveals the frequency and percentage distribution of
responses towards their preferences of clothing size.
Table 8
The Frequency and Percentage Distribution of the Responses towards Clothing Size
Preferences.
Asian nationals Asian Americans Clothing sizes
N % N %
Juniors 13 48.1 10 32.2
Misses 5 18.5 4 12.9
Women’s 1 3.7 2 6.5
Half sizes 0 0.0 1 3.2
Petites 8 29.6 14 45.1
The majority of both groups tended to wear juniors’ sizes and petites’ sizes most
often. The reason could be their small and short stature reflecting their body build, since
juniors and petites are sized for a shorter body.

32
Type of Garments
The respondents were also asked about type of garments they most preferred to
wear. The majority of Asian national respondents (48.1 percent) selected ready-made
clothing, while 37.0 percent selected almost-ready made clothing ( ready- made clothing
with some alteration ), and 14.8 percent chose tailor-made clothing. Approximately 77
percent of Asian Americans chose ready-made clothing and only 22.6 percent selected
almost-ready made clothing. The selection of almost-ready-made clothing may suggest
available ready-made clothing often did not fit the Asian women figure.
In addition, most of Asian nationals preferred to wear dressy-casual clothes (66.7
percent), followed by casual clothes (22.2 percent), and 3.7 percent of each said they
preferred to wear sport-casual clothes, professional attire and other. More than 50 percent
of Asian Americans said they preferred casual clothes, 29.0 percent chose dressy-casual
clothes, 9.7 percent preferred sport-casual clothes and only 6.5 percent preferred multiple
styles.
There was a large difference in the preferred style between Asian nationals and
Asian Americans. Since Asian Americans chose comfort over fashion, therefore, they
might be more casual when wearing clothes. It could also be speculated that most Asian
nationals were from very big cities and their countries might not have adopted a relaxed
American mode, resulting in the preference for dressy casual style.
Table 9 shows the frequency and percentage distribution of responses towards
their preference of categories of garments.

33
Table 9
The Frequency and Percentage Distribution of the Responses towards Preference of
Categories of Garments.
Asian nationals Asian Americans Categories of garments
N % N %
Casual 6 22.2 17 54.8
Dressy casual 18 66.7 9 29.0
Sporty casual 1 3.7 3 9.7
Professional attire 1 3.7 0 0.0
Other 1 3.7 0 0.0
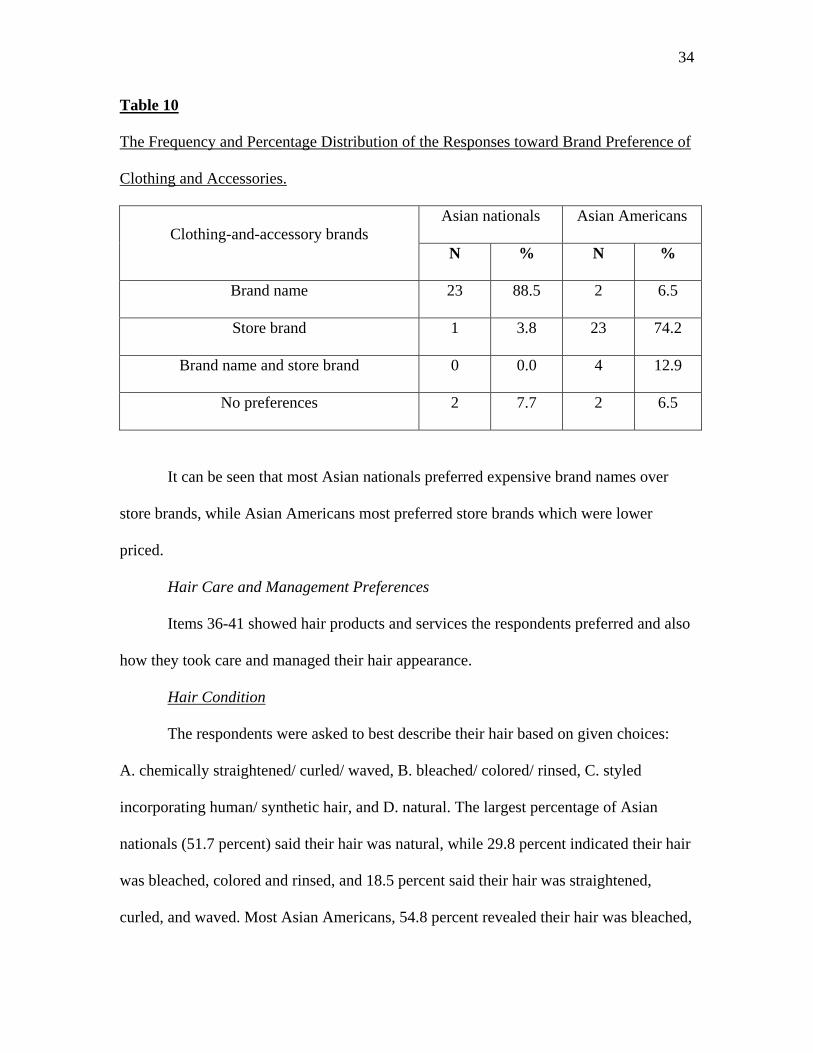
Brand Preferences
The highest percentage of Asian nationals (88.5 percent) preferred brand-name
clothing and accessories. The brands they mentioned included Polo Ralph Lauren,
Tommy Jeans, Prada, Chanel etc. Only 3.8 percent of them chose store brands and 7.7
percent did not have any preferences. On the other hand, 74.2 percent of Asian
Americans chose store-brand clothing, followed by 12.9 percent who chose both store
brand and brand name. Approximately 6 percent of Asian Americans preferred only
brand-name clothing and only 6.5 percent said they had no preferences. The store brands
Asian Americans most mentioned were Gap, Abercrombie, and Old Navy, and also
indicated they like to shop at Kohl’s and Target. Table 10 shows the frequency and
percentage distribution of the responses towards preference of clothing and apparel
accessory brand.
34
Table 10
The Frequency and Percentage Distribution of the Responses toward Brand Preference of
Clothing and Accessories.
Asian nationals Asian Americans Clothing-and-accessory brands
N % N %
Brand name 23 88.5 2 6.5
Store brand 1 3.8 23 74.2
Brand name and store brand 0 0.0 4 12.9
No preferences 2 7.7 2 6.5
It can be seen that most Asian nationals preferred expensive brand names over
store brands, while Asian Americans most preferred store brands which were lower
priced.
Hair Care and Management Preferences
Items 36-41 showed hair products and services the respondents preferred and also
how they took care and managed their hair appearance.
Hair Condition
The respondents were asked to best describe their hair based on given choices:
A. chemically straightened/ curled/ waved, B. bleached/ colored/ rinsed, C. styled
incorporating human/ synthetic hair, and D. natural. The largest percentage of Asian
nationals (51.7 percent) said their hair was natural, while 29.8 percent indicated their hair
was bleached, colored and rinsed, and 18.5 percent said their hair was straightened,
curled, and waved. Most Asian Americans, 54.8 percent revealed their hair was bleached,

35
colored and rinsed. Only 25.8 percent indicated their hair was natural, and 19.4 percent
said they chemically straightened, curled and also had their hair waved. None of the
respondents chose styled incorporating human synthetic hair. Table 11 shows the
frequency and percentage distribution of the responses towards their hair condition.
Table 11
The Frequency and Percentage Distribution of the Responses towards Hair Condition.
Asian nationals Asian Americans Hair condition
N % N %
Chemically straightened, curled, waved 14 18.5 6 19.4
Bleached, colored, rinsed 8 29.8 17 54.8
Styled incorporating human-synthetic hair 0 0.0 0 0.0
Natural 5 51.7 8 25.8
Most Asian nationals tended to prefer natural hair. Asian nationals were more
reserved, while Asian Americans very concerned about their individual identity (in Table
5), this could be the reason why Asian Americans chemically treated their hair more than
Asian nationals.
Stylist Services during the Past Three Months
Respondents were asked to indicate the services their hair stylist had performed
for them during the past three months. They were allowed to circle all the choices that
applied. The selections for hair category included A. shampoo/ condition/ style (curl,
crimp, braid, twist), B. special treatment (heat treat to make hair stronger etc.), C. cut/
shape/ trim, D. perm, and E. color.

36
The service most respondents chose was cut, shape and trim. There were 74.1
percent of Asian nationals and 61.3 percent of Asian Americans who chose the service.
Asian nationals also had following services: shampoo/ condition/ style (22.7 percent),
and color (3.2 percent). Perm was not chosen by Asian nationals at all. Color was also
selected by Asian Americans (32.3percent), followed by perm (3.percent), and shampoo/
condition/ style (3.2percent). Special treatment was not selected by the respondents.
Some of the respondents indicated they had several services.
The respondents were also asked to indicate how they preferred to have their hair
colored or permed. Most Asian national respondents said they preferred the salon (70.4
percent), while 18.5 percent would have hair done by non-professional. Persons selecting
the non-professional option did so because of price (57.1 percent), and they did not trust
beautician (28.6 percent). Approximately 14 percent revealed they knew someone who
could perform better than the beautician. Moreover, 7.4 percent said they preferred to
color or perm hair by themselves, while only 3.7 percent had no preferences.
More than half of Asian American respondents (51.6 percent) also preferred their
hair colored or permed by the salon, followed by non-professional (22.6 percent), and
themselves (3.2 percent). There were 22.6 percent who had no preferences. Those who
preferred non-professional service selected this option because of price (75.0 percent) or
because they knew someone else who could perform better than the beautician (25.0
percent).
Asian nations had fewer services than Asian Americans, especially perms. It
could be said that perms might not be popular in Asian countries, or not a current popular
fashion trend.

37
Shampoo Preferences
In response to the question regarding the kind of shampoo, conditioner and other
hair styling products the respondents preferred to use, the majority of Asian national
respondents (57.7 percent) preferred American brand, followed by imported brand (38.5
percent) and 3.8 percent selected both American and imported brand. For those who
preferred imported brands, the most-mentioned brand was an Asian brand, such as
Shiseido and Shokubuse. Other imported brands mentioned were Clinique, Chanel, and
Faesa. All of the Asian Americans chose American brands. The most mentioned brand
was Pantene, followed by Herbal Essence and Dove. Other mentioned brands were
Neutrogena, Aveda, Salon Selective, Bedhead and Bath &Body.
Length of Hair
A question about length of hair was also asked; most of the respondents preferred
their hair to be at shoulder length or longer. Only a few people preferred wearing their
hair very short.
Approximately 60 percent of the Asian national respondents preferred very long
hair; while 37.0 percent chose shoulder length and only one person (3.7 percent) said she
like bobbed hair. Of the Asian American respondents, 51.6 percent chose shoulder length,
35.5 percent liked very long hair, 6.5 percent preferred short hair (above ears), and only
3.2 percent chose other, which they did not specify. Extremely short hair (almost shaved)
was not selected by the respondents at all. Table 12 shows the frequency and percentage
distribution of the responses towards length of hair they most prefer to wear.

38
Table 12
The Frequency and Percentage Distribution of the Responses towards Preference of Hair
Length.
Asian nationals Asian Americans Hair length
N % N %
Extremely short (almost shaved) 0 0.0 0 0.0
Short (above ears) 0 0.0 2 6.5
Shoulder length 10 37.0 16 51.6
Very long (below shoulder) 16 59.3 11 35.5
Other 0 0.0 0 0.0
The majority of both groups preferred very long and shoulder length hair. Short
hair might not appear popular among Asian people.
The Care and Management of the body
Responses related to the care and management of the body included manicure,
pedicure, facial and makeover, skin tanning and waxing. Asian national respondents
performed fewer activities in care and management of body than Asian American
respondents. There were only three activities chosen by Asian nationals; manicure (11.1
percent), facial and makeover (11.1 percent) and pedicure (3.7 percent). The majority
(74.1 percent) did not have any services during the past three months.
Of the total Asian American respondents, 35.5 percent performed skin tanning,
32.2 percent performed waxing, 22.6 percent performed manicure, and 6.5 percent had
pedicure services. However, none of Asian Americans had facial/ makeover services.

39
There was a large difference of skin tanning and waxing between both sample
groups. Asian did not have any of those services at all, while about one-third of the Asian
Americans had skin tanning and waxing. Cultural background could affect the above
results. Beauty might be perceived differently by Asian nationals and Asian Americans.
As a result, they tended to manage their body and appearance differently.
Accessory, Adornment, Cosmetic Management
Typically-worn Accessories and Adornments
The accessory typically worn by both Asian nationals and Asian American was a
watch (51.9 percent of Asian nationals, and 41.9 percent of Asian Americans). The
second most-worn accessory was jewelry. Almost one- third, 29.1 percent, of Asian
nationals and 25.8 percent of Asian Americans chose jewelry. Approximately 14.8
percent of Asian nationals typically wore belts, and 7.4 percent indicated they wore other
accessories but did not specify. None of Asian nationals wore hats. Of the Asian
American respondents, 25.8 percent typically wore belts and only 3.2 percent wore hats.
Some respondents also selected multiple answers.
Watches might be necessities, therefore, more respondents tended to wear them.
Only about one-quarter to one-third of the respondents wore jewelry. Hats were often
seasonal adornment items (mostly worn in winter) and might not be popular accessories.
Jewelry Preferences
A question about jewelry preferences was also asked. The selections were gold,
white gold, silver, and costume or art jewelry. Most Asian nationals (40.7 percent)
preferred white gold jewelry, while 25.9 percent preferred gold jewelry, 22.2 percent
chose silver jewelry and 11.1 percent preferred costume or art jewelry. Silver was the

40
most preferred by Asian Americans (35.5 percent). There were 22.6 percent of Asian
Americans who selected gold jewelry, 25.4 percent selected white gold jewelry, and
approximately 16 percent preferred costume or art jewelry. Table 13 indicates the
frequency and percentage distribution of responses regarding their jewelry preferences.
Table 13
The Frequency and Percentage Distribution of Responses towards Jewelry Ppreferences.
Asian nationals Asian Americans Jewelry preferences
N % N %
Gold 7 25.9 7 22.6
White gold 11 40.7 8 25.4
Silver 6 22.2 11 35.5
Costume or art 3 11.1 5 16.1
White gold jewelry and silver jewelry are very similar in their appearance.
However, silver jewelry might be more affordable for Asian Americans.
There were several styles of jewelry the respondents prefer to wear. The
selections included modern design, very feminine design, ethnic design, antique design,
and religious or inspirational design. Most Asian nationals, 44.4 percent, chose modern
designs, followed by very feminine design (33.3 percent), religious or inspirational
designs (11.1 percent), antique designs (7.4 percent), and ethnic designs (3.7 percent).
Most Asian Americans, 60.0 percent, preferred modern designs, 13.3 percent preferred
very feminine designs, another 13.3 percent chose ethnic designs, and 10.0 percent chose
religious or inspirational designs. Both of the sample groups preferred modern and

41
feminine designs. They tended to posses similar preferences for jewelry design. However,
ethnic design was more preferred by Asian Americans.
Cosmetic Preferences and the management
Most of the respondents said they sometimes wore make up. Of the Asian national
respondents, 22.2 percent indicated they very often wore make up, while 14.8 percent
said they often wore make up, 37.0 percent said they sometime wore make up, and 25.9
percent indicated they rarely wore make up. None of Asian nationals indicated that they
never wore make up.
Approximately 23 percent of Asian American respondents very often wore make
up, 25.8 percent often wore make up, 29.0 percent sometimes wore make up, 19.4 percent
rarely wore make up, and only 3.2 percent never wore make up. The results are also
revealed in Table 14.
Table 14
The Frequency and Percentage Distribution of the Responses towards the Frequency of
Wearing Make Up.
Asian nationals Asian Americans Frequency of wearing make up
N % N %
Very often 6 22.2 7 22.6
Often 4 14.8 8 25.8
Sometimes 10 37.0 9 29.0
Rarely 7 25.9 6 19.4
Never 0 0.00 1 3.2

42
Asian Americans more frequently wore make up than Asian nationals. There
could be cultural differences and personal facial features which resulted in these
differences.
Most–worn Cosmetics
The cosmetics were divided into two groups; overall face, and eyes area. In the
overall face area, lipstick and blush were most selected by both groups. Most Asian
nationals (74.1 percent) wore lipstick. Blush was selected by Asian national as the second
highest percentage (63.0 percent). Other selected cosmetics were as follows: powder
(51.9 percent), foundation (37.0 percent), and concealer (11.1 percent).
Of all Asian American respondents, the highest percentage wore lipstick (86.7
percent). Other cosmetics Asian Americans wore were: blush (80.0 percent), powder
(60.0 percent), foundation (36.7 percent), and concealer (20.0 percent). The results and
comparison are shown in Table 15.
Table 15
The Frequency and Percentage Distribution of the Responses towards the Overall Facial
Cosmetics Mostly Worn.
Asian nationals Asian Americans Cosmetics
N % N %
Lipstick 20 74.1 26 86.7
Blush 17 63.0 24 80.0
Foundation 10 37.0 11 36.7
Powder 14 51.9 18 60.0
Concealer 3 11.1 6 20.0

43
Most of the respondents mostly wore lipstick, blush, and powder. Concealer was
not popular among Asian respondents.
A large percentage of respondents frequently wore eye cosmetics such as eye
shadow, eye liner, mascara, artificial eyelashes, and contact lens (for purpose of changing
eye color). Eye shadow was the cosmetic most worn by both groups. Approximately 93.0
percent of Asian American respondents and 74.1 percent of Asian nationals wore eye
shadow. Sixty three percent of Asian nationals, and 70.0 percent of Asian Americans
chose mascara. Sixty percent of Asian Americans and 48.1 percent of Asian nationals
chose eye liner. Only one Asian national wore artificial eyelashes, while none of Asian
Americans did. Contact lenses were worn by 22.2 percent of Asian nationals and 16.7
percent of Asian Americans. Most of the respondents selected more than one cosmetic.
The comparison of the results regarding eye cosmetics is shown in Table 16.
Table 16
The Frequency and Percentage Distribution of the Responses towards the Eye Cosmetics
Mostly Worn.
Asian nationals Asian Americans Cosmetics
N % N %
Eye shadow 20 74.1 28 93.3
Eye liner 13 48.1 18 60.0
Mascara 17 63.0 21 70.0
Artificial eyelashes 1 3.7 0 0.00
Contact lens 6 22.2 5 16.7

44
Most respondents concentrated on the same eye cosmetics, especially eye shadow,
mascara and eye liner. Only a few of them wore artificial eyelashes.
Perfume
The respondents were asked to indicate how often they wore perfume. The
selections were as follows; very often, often, sometimes, rarely and never.
Forty four percent of Asian nationals very often wore the perfume, while 25.9 percent
often wore perfume, 18.5 percent sometimes wore perfume, 7.4 percent said they rarely
wore perfume and only 3.7 percent never wore perfume at all. Of all Asian Americans,
12.9 said they very often wore perfume while 19.4 percent indicated they often wore
perfume. There were an equal number (29.0 percent) of Asian Americans who selected
“sometimes”, and “rarely. Only 9.7 percent never wore perfume. Table 17 reveals the
frequency and percentage distribution of responses toward their frequency of wearing
perfume.
Table 17
The Frequency and Percentage Distribution of Responses towards the Frequency of
Wearing Perfume
Asian nationals Asian Americans Frequency of wearing perfume
N % N %
Very often 12 44.4 4 12.9
Often 7 25.9 6 19.4
Sometimes 5 18.5 9 29.0
Rarely 2 7.4 9 29.0
Never 1 3.7 3 9.7

45
Asian nationals wore perfume more often than Asian American. One could
speculate that Asian nationals preferred to wear dressy-casual clothing; as a result, they
tended to wear perfume together with their dressy style. Most Asian Americans were
more casual and relax, reflecting their tendency to wear perfume less often.
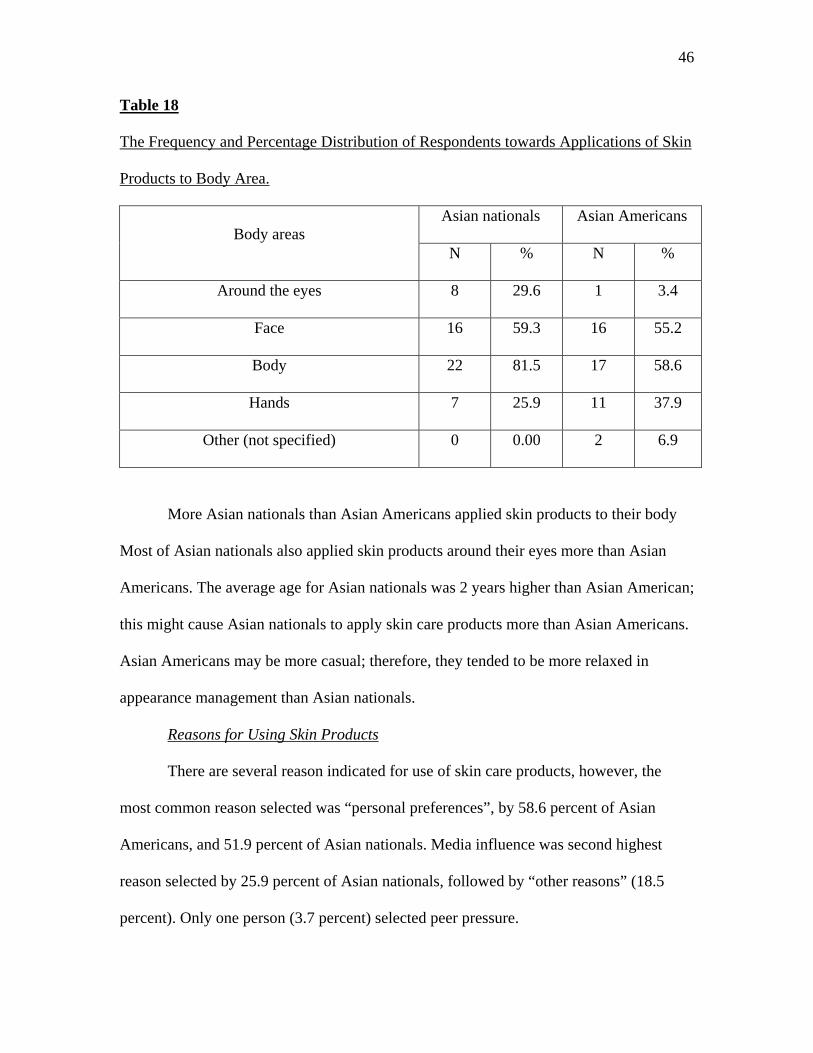
Skin Products
All of Asian national respondents and 93.5 percent of Asian American
respondents used skin care products. Most of the respondents indicated they used
whitening lotion, moisturizing lotion, firming lotion, sunscreen, and tanning lotion. One
Asian national said she used facial masks. According to the survey, most Asian nationals
(81.5 percent) and Asian Americans (58.6 percent) applied skin products on their bodies.
Approximately 55 percent of Asian Americans also applied skin care products to their
face. Asian national respondents also applied skin care products on face (59.3 percent),
around eyes (29.6 percent), and hands (25.9 percent). Asian Americans also applied skin
products to hands (37.9 percent), other areas (not specified-6.9percent), and around eyes
(3.4 percent). However, most of the respondents applied skin product on more than one
area. These areas were face and eyes, body, face and hands. The comparisons are made
and presented in Table 18. Many respondents selected multiple answers.
46
Table 18
The Frequency and Percentage Distribution of Respondents towards Applications of Skin
Products to Body Area.
Asian nationals Asian Americans Body areas
N % N %
Around the eyes 8 29.6 1 3.4
Face 16 59.3 16 55.2
Body 22 81.5 17 58.6
Hands 7 25.9 11 37.9
Other (not specified) 0 0.00 2 6.9
More Asian nationals than Asian Americans applied skin products to their body
Most of Asian nationals also applied skin products around their eyes more than Asian
Americans. The average age for Asian nationals was 2 years higher than Asian American;
this might cause Asian nationals to apply skin care products more than Asian Americans.
Asian Americans may be more casual; therefore, they tended to be more relaxed in
appearance management than Asian nationals.
Reasons for Using Skin Products
There are several reason indicated for use of skin care products, however, the
most common reason selected was “personal preferences”, by 58.6 percent of Asian
Americans, and 51.9 percent of Asian nationals. Media influence was second highest
reason selected by 25.9 percent of Asian nationals, followed by “other reasons” (18.5
percent). Only one person (3.7 percent) selected peer pressure.

47
Those who selected “others” specified several reasons for using skin care
products. Nearly one-third of Asian Americans used skin products mainly because of
other reasons such as blemishes, dry skin, tanning, and firming their skin. The other
reason Asian nationals used skin care products was because of very dry skin.
Asian nationals’ skin might be very dry due to the weather condition in
Wisconsin. Asian Americans tended to applied skin products less than Asian nationals.
Skin type could also reflect the application of skin products.
Most Asian nationals also preferred Asian brands over American or imported
brand of skin care products, while approximately 83 percent of Asian Americans
preferred American brands. The most popular brand among the Asian nationals was
Shiseido, while Clinique was the most popular brand among Asian American
respondents. Table 19 shows the frequency and percentage distribution of preferences
towards the reasons of using skin care products.
Table 19
The Frequency and Percentage distribution of Responses towards Reasons for Using Skin
Products
Asian nationals Asian Americans Reasons
N % N %
Media influences 3 25.9 3 10.3
Personal preference 16 59.3 16 55.2
Peer pressure 1 3.7 0 0.00
Others 5 18.5 9 31.0

48
Nails management
According to the survey results, only 3.7 percent of Asian nationals and 9.7
percent of Asian Americans very often painted their nails. Approximately 11 percent of
Asian nationals indicated they often painted their nails, while 16.1 percent of Asian
American often painted their nails. The largest percentage of Asian nationals (40.7
percent) and Asian Americans (35.5) sometimes painted their nails. Almost one- fourth of
Asian nationals rarely painted their nails, while 16.1 percent of Asian Americans revealed
they rarely painted their nails. Approximately 15 percent of Asian nationals and 23
percent of Asian Americans never painted their nails at all. Table 20 shows the frequency
and percentage distribution towards the frequency of painting nails.
Table 20
The Frequency and Percentage Distribution of Responses towards the Frequency of
Painting Nails
Asian nationals Asian Americans Frequency of painting nails
N % N %
Very often 1 3.7 3 9.7
Often 3 11.1 5 16.1
Sometimes 11 40.7 11 35.5
Rarely 8 29.6 5 16.1
Never 4 14.8 7 22.6
Most of the respondents sometimes painted their nails. Some of the respondents
rarely or never painted their nails. However, Asian nationals seemed to paint nails less

49
often that Asian Americans. Painting nails might not be a popular activity among Asian
nationals.
Color of nail polish most preferred by both groups was clear and natural color.
Forty eight percent of Asian nationals chose the clear and natural color, followed by light
and pastel (39.1 percent), and bright (8.7 percent), while 4.3 percent had no preferences.
Approximately 38.0 percent of Asian Americans selected clear and natural color, while
25.0 percent selected light and pastel, 20.8 percent chose dark color, 12.5 percent chose
bright, while 4.2 percent has no preferences. Most of the respondents preferred to wear
clear/ natural, and light/ pastel colors of nail polish. Table 21 indicates the frequency and
percentage distribution toward preferences of nail-polish colors.
Table 21
The Frequency and Percentage Distribution of Responses towards Preferences of Nail-
Polish Colors
Asian nationals Asian Americans Nail-polish colors
N % N %
Clear and natural 11 47.8 9 37.5
Light and pastel 9 39.1 6 25.0
Bright 2 8.7 3 12.5
Dark 0 0.0 5 20.8
No preferences 1 4.3 1 4.2

50
Clear and natural color seemed to be most popular among both groups, as well as
light and pastel. Dark was not selected by Asian nationals at all. In Asian countries, dark
could be an unlucky color or unpopular.
In addition, the majority of respondents did not prefer to go to beauty salon for
nail services. However, a higher percentage of Asian Americans (29.2 percent) than
Asian nationals (13.0 percent) chose to go to the salon.
One could speculate that painting nails at the salon was more popular for Asian
Americans than Asian nationals.
Attitudes towards self image
Most of Asian national respondents were more fashion conscious than Asian
Americans. There were 55.6 percent of Asian nationals who rated themselves quite
fashion conscious, while only 16.1 percent of Asian Americans rated themselves quite
fashion conscious. In addition, 22.2 percent of Asian nationals were extremely conscious
about fashion, followed by “not very”(14.8 percent) and “somewhat” (7.4 percent). The
most frequent responses of Asian Americans, 41.9 percent, said they were somewhat
fashion conscious. Approximately one- third of Asian Americans, 29.0 percent, said they
were not very conscious about fashion, 9.7 percent said they were extremely fashion
conscious and only 3.2 percent were not conscious about fashion at all. The complete
results are shown in table 22.

51
Table 22
The Frequency and Percentage Distribution of Responses towards Fashion Consciousness
Asian nationals Asian Americans Extend of fashion consciousness
N % N %
Extremely 6 22.2 3 9.7
Quite 15 55.6 5 16.1
Somewhat 2 7.4 13 41.9
Not very 4 14.8 9 29.0
Not at all 0 0.00 1 3.2
Since Asian nationals preferred to wear dressy casual clothing, they might have
more awareness of fashion. Most Asian nationals could be from big cities, causing them
to be more fashion conscious than Asian Americans.
Most Asian nationals described their own personalities as flexible (63.0 percent),
followed by social butterfly (37.0 percent), sophisticated (37.0 percent) and futuristic
(25.9 percent). Asian Americans indicated they were flexible (83.9 percent), social
butterfly (41.9 percent), futuristic (12.9 percent), and sophisticated (9.7 percent). The
respondents often chose multiple selections.
In addition, 70.4 percent of Asian nationals said they were determined, followed
by sensitive (66.7 percent), conservative (18.5 percent) and reserved (18.5 percent).
Most of Asian Americans respondents (53.8 percent) had sensitive personalities, followed
by determined (41.9 percent), reserved (35.5 percent), and conservative (22.6 percent).
Both groups again chose multiple selections.

52
Personality differences could be a result of cultural influences. Asian Americans
who had strong Asian family background might be taught in an Asian way, although they
were living in America.
Most Asian nationals responded that most of their friends would describe them as
a fashionable person (51.9 percent), casual and natural (29.6 percent), conservative (11.1
percent), and sophisticated (7.4 percent). Asian American respondents thought they were
most described by friends as a casual and natural person (64.5 percent), followed by
fashionable (32.3 percent), sophisticated (6.5 percent), conservative (6.5 percent), and
fashion disaster (6.5 percent).
Most Asian nationals believed friend considered them as fashionable persons
while Asian Americans selected casual-natural. It could be speculated that Asian
nationals were fashion conscious and tended to wear dressy clothing. This may be a
reflection of the more urban background of Asian nationals. Most Asian nationals were
described as conservative persons, possibly as a result of their cultural background.

53
CHAPTER V
Summary, Conclusion, and Recommendation
Introduction
This study compared appearance management, body satisfaction, and buying
behavior of Asian national and Asian American female students. The purpose of this
chapter is to summarize the finding of the research, draw conclusion, and offer
recommendation for retailers as well as future study in this area.
Summary
The objective of this study was to investigate apparel and adornment preferences
and shopping behavior, as well as appearance management of selected Asian American
and Asian national female students attending the University of Wisconsin-Stout during
2002-2003 academic year. The study also explored differences in satisfaction with body
image between the two Asian groups. Demographic information of Asian nationals and
Asian Americans was also presented.
Fifty seven surveys consisting of short answer, Likert scales, closed-ended and
partially closed-ended questions with ordered and unordered response selections were
analyzed. The surveys were sent to fifty Asian national and fifty Asian American female
students enrolled in University of Wisconsin-Stout by email and mail. Fifty eight surveys
were returned, a 58 percent returned rate. Descriptive statistics, frequency counts,
percentage distribution, and means were used on comparisons of the two sample groups.
Conclusions
This study focused on three objectives.
1. To examine the demographic background of Asian Americans and Asian nationals.

54
Asians are the fastest growing minority group in the United States: due to the
Civil Rights Act 1964, and the Immigration Act of 1965 (Block & Walker, 1981). Asians
tend to have higher education and higher buying power than other minority groups. In
fact, some Asian Americans tend to settle around university areas due to their desire for
higher education. They also live in major metropolitan areas of the nation (O’ Hare,
1990). In addition, most Asian national come to the country to pursue a Master’s degree.
Some of them were also allowed to work in the United Stated after their graduation.
The 58 participants in the study were represented by four nationalities: Chinese
(32.8 percent), Koreans (25.9 percent), Japanese (24.1 percent), and Hmong (17.2
percent). Twenty seven surveys were returned from Asian nationals and 31 surveys were
returned from Asian Americans. The average age for Asian nationals was 24 years old
and Asian Americans was 22 years old. Average reported height for Asian nationals was
5 feet and 2 inches, while average height for Asian Americans was 5 feet and 1 inch.
Average reported weight was 109 pounds for Asian nationals and 123 pounds for Asian
Americans.
2. To investigate apparel and adornment preferences and shopping behaviors, as well
as appearance management and satisfaction with body image of selected Asian American
and Asian national female students attending the University of Wisconsin-Stout.
Asian nationals and Asian Americans shared similarities in activities and
preferences towards their appearance management and shopping behavior. Both groups
tended to manage their bodily appearance in the same way, such as wearing long hair,
putting more make up around their eye areas and choosing certain clothing items due to
the same reasons (to make them look taller). Both groups of respondents seemed to

55
mange their bodily appearance in order to correct the same body parts, such as legs, waist
and stomach, and hips/ thighs/ buttocks. However, they were somewhat different in the
attitudes toward their appearance. Although Asian Americans were heavier than Asian
nationals as well as an inch shorter on the average, they seemed to be more satisfied with
their weight and body parts.
Cultural background may be a factor causing the two sample groups to view
certain things differently, such as a perception of “beauty”. As a result, they performed
different activities in managing their appearance. Asian Americans tended to go to salons
for tanning, waxing, or even applied skin-tanning lotion to their body, while Asian
nationals tended to avoid those activities. They used whitening lotion and did not perform
waxing as often as Asian Americans.
3. To compare the differences in buying behavior and satisfaction with body image,
including appearance management among Asian nationals and Asian Americans.
This study indicated that Asian Americans were more satisfied with their body
than Asian nationals, especially their lower parts of body such as waist, hips, thighs etc.
They weighed themselves fewer times than Asian national respondents, and rarely or
never measured their body. Although the majority group was heavier than Asian
nationals, they indicated they were normal weight while most of Asian nationals said they
were 5-10 pounds over weight. Asian nationals weighed themselves weekly; most of
them worried about their body and weight all the time. It could be speculated that cultural
background resulted in different cultural attitudes and perception about “a perfect body”.
Asian nationals seemed to be more sensitive toward their body. As a result, Asian
nationals were more careful than Asian Americans when choosing certain kinds of
56
clothes. Most Asian nationals preferred expensive brand named clothing and accessories.
Most Asian nationals were quite fashion conscious, dressed in dressy-casual clothing,
often wore perfume and used skin products. Unlike Asian Americans, Asian nationals
dressed to impress rather than to be comfortable and show their individual identity. Some
Asian nationals tended to come from big cities; they may be more fashion conscious than
Asian Americans. Since Asian nationals were in a country rather than their home
country, their skin and health might be affected by different weather, and environment.
Their skin could be very dry causing them to apply skin products more often.
Asian Americans were more casual than Asian nationals. They liked to wear
casual clothing such as jeans and T shirt, preferred store brands, and mostly wore
necessary accessory such as watches and belts. It can be concluded that Asian American
respondents were more relaxed towards their appearance. Asian Americans’ first criterion
for selecting clothes was comfort, and second, to show their individual identity rather
than price and fashion aspects. Asian Americans tended to buy less expensive clothes and
accessories, and had friends or someone they knew perform hair care and management.
Recommendations to Retailers
The following suggestion may aid retailers in providing good and services for
Asian women.
1. Target Asian nationals as a market for brand name and fashionable clothing and
accessories.
2. Order clothing specifically designed for Asian females’ taste and to fit their body
proportion without the need of alteration.

57
3. Understand the perception of beauty of Asian nationals and Asian Americans, in
order to design appropriate marketing methods.
4. Provide clothing alteration services for Asian consumers.
5. Use information from this study to better understand Asian consumers.
Recommendations for Future Study
From this study, there are several suggested directions for future study.
1. Conduct a similar study for Asian male consumers.
2. Conduct a similar study comparing Asian and Caucasian consumers.
3. Investigate the concept of “beauty” among different cultures.
4. Compare buying behaviors of Asian nationals and/or Asian Americans with other
demographic groups.

58
Bibliography
Block, W. E. , & Walker, M. A. (1987). Successful Marketing to U.S. Hispanics and Asians. New York : Author. Claritas. (2002). Consumer Buying Power. Demographics U.S.A. (country edition). pp. 12-46. Cohen, W. I. (2002). The Asian American Century. Massachusetts : Harvard University Press. Demographics and Spending Patterns (fifth edition). American Market Place (fifth edition) New York : New Strategist Publications. Fehrenbacher, M. (1998). Clothing Style and Color Preferences for the Socially Active Mature Female (Thesis Collection). University of Wisconsin-Stout. Hartnett, M. (1992, May 18). Merchandising through the Ages: 25-44 : Minority Customers to Become a Major MarketingTarget. Discount Store News, pp. 100. Henry III, W. A. (1990, April). Beyond the Melting Pot. Time, pp. 28-31. Hsia, J. (1998). Asian Americans in Higher Education and at Work. Hillsdale, New Jersey : Lawrence Erlbaum Associations. Hsia, J. (1988). Asian American in Higher Education and at Work. pp. 5-15. Hsia, J. Hirono-Nakanishi, M. (1989). The Demographics of Diversity: Asian Americans and Higher Education. Change, pp. 20-27. Miller, C. (1991, January). Hot Asian-American Market not starting much of a Fire Yet. Marketing News, pp. 12. Mokuau, N. (1991). Preface. In N. Mokuau (Ed.) , Handbook of Social Services for Asian and Pacific Islanders. Westport : Greenwood Press. Pp. 18-36. Mowen, J. (1995). Consumer Behaviors, New Jersey : Prentice Hall. Pp. 7-25. O’Hare, W. P. (1990, October). A New Look at Asian Americans. American Demographics, pp. 26-31. O’Hare, W. P. (1992, January). Reaching for the Dream. American Demographics, pp. 32-36.

59
O’Hare, W. P. & Felt, J. C. (1991, September-October) Asian Americans increase Rapidly. The Futurist, pp. 51-52. Priscilla A. W. (1993, August). Appearance Management Practices of African American and European American women (Thesis Collection). University of Wisconsin-Stout. Riche, M. F. (1991, October). We’re All Minorities. American Demographics. pp. 26-34. Ciment, N. (1999). The Encyclopedia of Global Population and Demographics (volume 1 and 2). pp. 272, 479, 502, 505, 519. Walker - Moffat, W. (1995). The Other of the Asian American Success Story. San Francisco : Jossey-Bass Publishers. Weinberg, M. (1997). Asian-American Education. New Jersy : Lawrence Erlbaum Associates Publishers.

60
APPENDIX A:
Appearance Management Survey

61
APPEARANCE MANAGEMENT SURVEY
University of Wisconsin – Stout
This survey is part of a graduate study designed to examine differences of appearance management; body image satisfaction, and buying behaviors between Asian nationals and Asian Americans. Your cooperation in the study would be of great help. Please answer all of the following questions to the best of your ability. All of your answers are kept confidential. Personal Background
1. Age: ________________ Gender: Male________Female________ 2. Race/Ethnic Origin (circle one)
a. Asian/Asian American/ Pacific Islander (please mark below according to your nationality (for Asian nationals) or your original nationality (for Asian Americans). ____Chinese ____Korean ____Japanese ____Hmong ____Others (please specify___________________________)
b. African American c. Caucasian/ White (non-Hispanic) d. Hispanic/ Latino e. Native American/ American Indian/ Aleutian f. Other (please specify_________________________________) 3. Height______Feet and______inches 4. Actual weight_________pounds These questions are concerning how you feel about your appearance, in relation to the society you are in right now. DIRECTION: Circle the best answer that most accurately describes how you feel about yourself. 5. How often do you weigh yourself? a. Daily b. Weekly c. Monthly d. Every few months e. Rarely or never 6.What do you think about your weight?
a. More than 10 pounds underweight b. 5-10 pounds underweight c. Just about the right weight d. 5-10 pounds overweight e. More than 10 pounds overweight
7.Do you worry about your weight? a. Almost never b. Once in a while c. Often d. Almost always e. Always
8. How often do you measure any part of your body? a. Daily b. Weekly c. Monthly d. Every few months e. Rarely or never
9. From looking at me, most other people would think I am
a. Very underweight b. Somewhat underweight c. Normal weight d. Somewhat overweight e. Very overweight
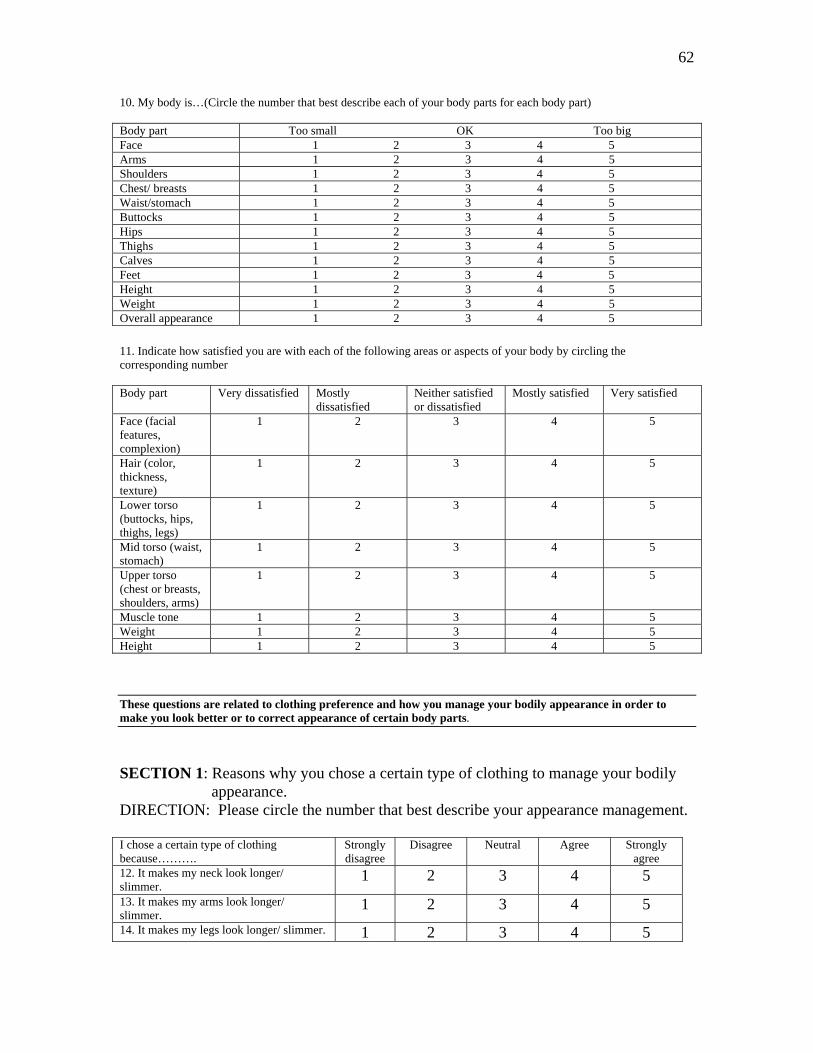
62
10. My body is…(Circle the number that best describe each of your body parts for each body part) Body part Too small OK Too big Face 1 2 3 4 5 Arms 1 2 3 4 5 Shoulders 1 2 3 4 5 Chest/ breasts 1 2 3 4 5 Waist/stomach 1 2 3 4 5 Buttocks 1 2 3 4 5 Hips 1 2 3 4 5 Thighs 1 2 3 4 5 Calves 1 2 3 4 5 Feet 1 2 3 4 5 Height 1 2 3 4 5 Weight 1 2 3 4 5 Overall appearance 1 2 3 4 5 11. Indicate how satisfied you are with each of the following areas or aspects of your body by circling the corresponding number Body part Very dissatisfied Mostly
dissatisfied Neither satisfied or dissatisfied
Mostly satisfied Very satisfied
Face (facial features, complexion)
1 2 3 4 5
Hair (color, thickness, texture)
1 2 3 4 5
Lower torso (buttocks, hips, thighs, legs)
1 2 3 4 5
Mid torso (waist, stomach)
1 2 3 4 5
Upper torso (chest or breasts, shoulders, arms)
1 2 3 4 5
Muscle tone 1 2 3 4 5 Weight 1 2 3 4 5 Height 1 2 3 4 5 These questions are related to clothing preference and how you manage your bodily appearance in order to make you look better or to correct appearance of certain body parts.
SECTION 1: Reasons why you chose a certain type of clothing to manage your bodily appearance. DIRECTION: Please circle the number that best describe your appearance management. I chose a certain type of clothing because……….
Strongly disagree
Disagree Neutral Agree Strongly agree
12. It makes my neck look longer/ slimmer.
1 2 3 4 5 13. It makes my arms look longer/ slimmer.
1 2 3 4 5 14. It makes my legs look longer/ slimmer. 1 2 3 4 5

63
Strongly Disagree
Disagree Neutral Agree Strongly Agree
15. It makes my waist look slimmer
1 2 3 4 5 16. It makes my chest look bigger. 1 2 3 4 5 17. It makes my hip, thighs and buttocks slimmer.
1 2 3 4 5 18. It makes me look taller. 1 2 3 4 5 19. It makes my skin looks brighter. 1 2 3 4 5 20. It covers scar or unwanted mark on my body.
1 2 3 4 5 21. It looks good on a model. 1 2 3 4 5 22. Only it is comfortable. 1 2 3 4 5 23. Only it is fashionable. 1 2 3 4 5 24. It is suitable to my culture. 1 2 3 4 5 25. It shows my individual identity. 1 2 3 4 5 26. It is a well-known or popular brand (with higher price).
1 2 3 4 5 27. The brand is nationally recognized clothing brand, which makes me feel national pride.
1 2 3 4 5
SECTION 2: General Clothing preferences. DIRECTION: Circle the most accurate answer and write answer in blanks where indicated. 28. What type of fabric do you most prefer?
a. Solid color (go to question 31) b. Print c. No preferences (go to question 31)
29. What size of print do you most prefer to wear? a. Small b. Medium c. Large d. No preferences
30. If you prefer print fabric, what type would you most prefer?
a. Plaids b. Stripes c. Dots d. Floral e. Paisleys f. Other (Please specify_______________)
31. Please specify which clothing colors you most prefer to wear:
a. Bright (e.g. yellow, orange, bright green, etc.) b. Dark (e.g. black, navy blue, gray, etc.) c. Earth tone d. Light and pastel e. No preferences
32. Which of the following clothing sizes most accurately describe you?
a. Juniors b. Misses c. Women’s d. Half Sizes e. Petites
33. Which type of garments do you most prefer to wear?
a. Ready-made clothing (clothing that are ready made and available at any store)
b. Almost ready-made clothing (ready-made clothing with some alteration)
c. Tailor-made clothing (made by dressmaker or someone you know, only for you)
d. No preferences
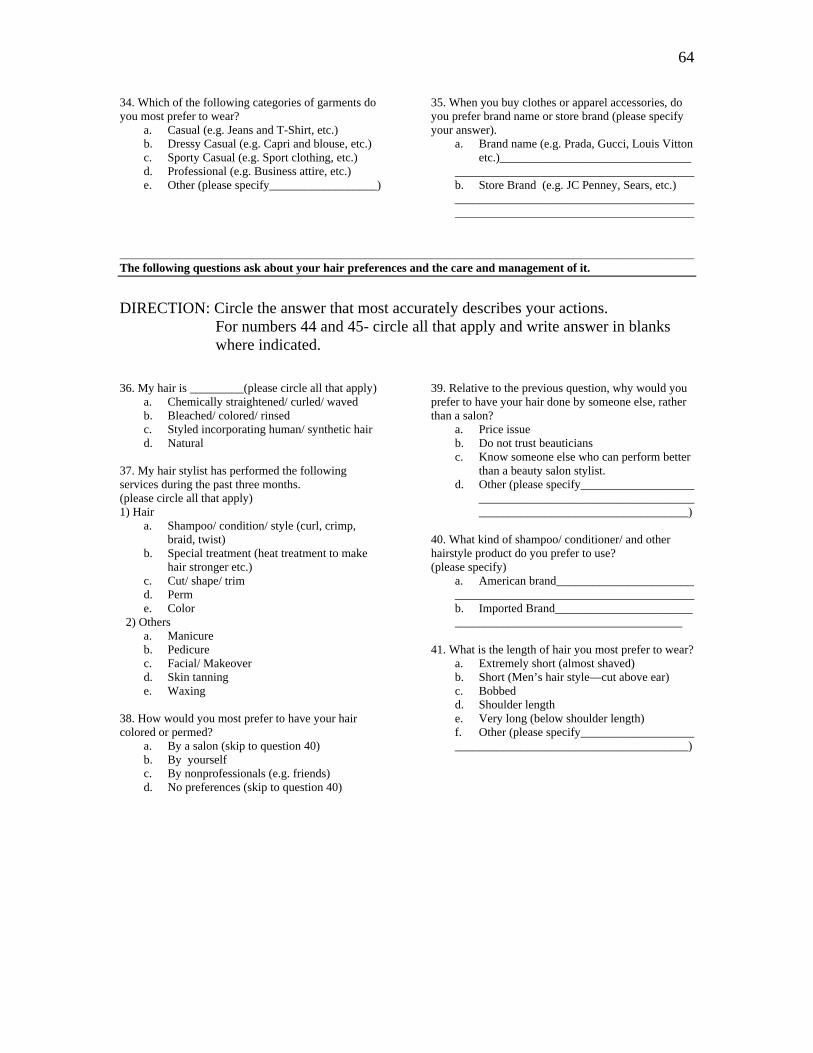
64
34. Which of the following categories of garments do you most prefer to wear?
a. Casual (e.g. Jeans and T-Shirt, etc.) b. Dressy Casual (e.g. Capri and blouse, etc.) c. Sporty Casual (e.g. Sport clothing, etc.) d. Professional (e.g. Business attire, etc.) e. Other (please specify__________________)
35. When you buy clothes or apparel accessories, do you prefer brand name or store brand (please specify your answer).
a. Brand name (e.g. Prada, Gucci, Louis Vitton etc.)________________________________
________________________________________ b. Store Brand (e.g. JC Penney, Sears, etc.) ________________________________________ ________________________________________
________________________________________________________________________________________________ The following questions ask about your hair preferences and the care and management of it.
DIRECTION: Circle the answer that most accurately describes your actions. For numbers 44 and 45- circle all that apply and write answer in blanks where indicated. 36. My hair is _________(please circle all that apply)
a. Chemically straightened/ curled/ waved b. Bleached/ colored/ rinsed c. Styled incorporating human/ synthetic hair d. Natural
37. My hair stylist has performed the following services during the past three months. (please circle all that apply) 1) Hair
a. Shampoo/ condition/ style (curl, crimp, braid, twist)
b. Special treatment (heat treatment to make hair stronger etc.)
c. Cut/ shape/ trim d. Perm e. Color
2) Others a. Manicure b. Pedicure c. Facial/ Makeover d. Skin tanning e. Waxing
38. How would you most prefer to have your hair colored or permed?
a. By a salon (skip to question 40) b. By yourself c. By nonprofessionals (e.g. friends) d. No preferences (skip to question 40)
39. Relative to the previous question, why would you prefer to have your hair done by someone else, rather than a salon?
a. Price issue b. Do not trust beauticians c. Know someone else who can perform better
than a beauty salon stylist. d. Other (please specify___________________
____________________________________ ___________________________________) 40. What kind of shampoo/ conditioner/ and other hairstyle product do you prefer to use? (please specify)
a. American brand_______________________ ________________________________________ b. Imported Brand_______________________
______________________________________ 41. What is the length of hair you most prefer to wear?
a. Extremely short (almost shaved) b. Short (Men’s hair style—cut above ear) c. Bobbed d. Shoulder length e. Very long (below shoulder length) f. Other (please specify___________________ _______________________________________)

65
________________________________________________________________________________________________ These questions concern your preferences towards accessories, adornments and cosmetics. They examine the use of these items in modifying and managing your appearance in order to create the most desired outcome possible.
DIRECTION: Circle the most appropriate answer and complete the blanks where indicated. 42. Which accessories do you typically wear?
a. Watch b. Hats c. Belts d. Jewelry e. Others (please specify)____________ __________________________________
43. What kind of jewelry do you most prefer?
a. Gold b. White gold c. Silver d. Costume or Art
44. What styles of jewelry do you most prefer?
a. Modern b. Very feminine design c. Ethnic design d. Antique e. Religious or Inspirational
45. How often do you wear make up?
a. Very often b. Often c. Sometimes d. Rarely e. Never
46. Which types of cosmetics do you wear the most?
(please circle all that apply)
1) Overall face
a. Foundation b. Powder c. Concealers d. Lipstick e. Blush
2) Eyes area
a. Eye shadow b. Eye liner c. Mascara d. Artificial eyelashes e. Contact lens (for purpose of changing eye color)
47. How often do you wear perfume/ cologne?
a. Very often b. Often c. Sometimes d. Rarely e. Never
48. Do you use any skin products?
a. Yes (please specify____________________ ________________________________________
________________________________________
b. No
49. Where on your body do you apply skin products?
a. Around the eyes b. Face c. Body d. Hands e. Other (please specify__________________ _______________________________________)
50. What is your reason for using skin products?
a. Media influence (models with smooth skin and flawless face.)
b. Personal preference ( I like the way it makes my skin look and feel.)
c. Peer pressure d. Other (please specify__________________ _______________________________________)
51. What brand name of skin products do you most prefer to use? (please also specify)
a. American brand name_________________ _______________________________________
b. European name_______________________
_______________________________________
c. Asian brand name_____________________
_______________________________________
d. Other_______________________________ ________________________________________ e. No preferences
52. How often do you paint/ polish your nails?
a. Very often b. Often c. Sometimes d. Rarely e. Never
53. What color of nail polish do you prefer to wear?
a. Bright (e.g. yellow, orange, red etc.) b. Dark (e.g. black, gray, navy blue etc.) c. Light and Pastel d. Clear or natural e. No preferences
54. Do you normally go to a beauty salon for nail services?
a. Yes b. No
55. I consider myself to be_______fashion conscious.
a. Extremely b. Quite c. Somewhat d. Not very e. Not at all

66
56. Check words that best describe your personality. (please check all that apply) 1) Group 1
a. Futuristic b. Sophisticated c. Social butterfly d. Flexible e. None
2) Group 2 a. Conservative b. Determined c. Sensitive d. Reserved e. None
57. Check words that a close friend would use to describe your total look a. Fashionable b. Professional / Sophisticated c. Conservative d. Casual / Natural e. Fashion disaster

67
APPENDIX B:
Cover Letter

68
University Of Wisconsin-Stout Theeranart Nutthawutthisit 711 4th St. East Menomonie, WI. 54751 May 3, 2003 Dear_____________________: I am a graduate student at University of Wisconsin-Stout, majoring in Home Economics (Apparel Design, Manufacturing and Retailing). Currently I am working on my thesis as a requirement for Master’s Degree. My thesis topic is Comparisons of Appearance Management, Body Satisfaction and Buying Behavior between Asian National and Asian American Female Students. I would like your corporation in filling out the survey and reply back to my email address no later than May 30th. Survey sent by mail can be returned to the address above. Stamped-self addressed envelop was already enclosed. It should take approximately 30 minutes in completing the survey. Your answers will be kept confidential and destroyed after the data analysis is finished. Your support would be greatly appreciated and helpful to the apparel and retail industries. Any questions please call at 715-233-1421. Thank You, Theeranart Nutthawutthisit