2003 first quarter report - oakmark advised by harris associates l.p. p.o. box 8510 boston,...
TRANSCRIPT
1-8 0 0-OA K MA R Kwww.oakmark.com
Advised by Harris Associates L.P.
P.O. Box 8510Boston, MA 02266-8510
D E C E M B E R 3 1 , 2 0 0 2
F I R S T Q U A R T E R R E P O R T
The Oakmark Funds are distributed by HarrisAssociates Securities L.P., member NASD. Dateof first use: January 2003.
Merrill Corporation - Harris/Oakmark 1st QR ED/E N30B2 1/2003 | jscott | 21-Jan-03 17:44 | 03chi1023.a | Sequence: 1CLEANCHKSUM Content: 36095 Layout: 9741 Graphics: 3130
NAME: Harris/Oakmark 1st QR ED/E N30B2 1/2003PROJ: p1009chi03 JOB: 03chi1023 CYCLE#;BL#: 9; 0 TRIM: 15.5" x 9.75" DOC TYPE: OtherAS: Merrill Chicago: 312-786-6300
COMPOSITECOLORS: Black, Cyan, Magenta, PANTONE 484 cmyk, PANTONE 548 cmyk, Yellow, Yellow copy, ~note-color 1, ~note-color 2GRAPHICS: LogoCMYK, TRAPTYPE, TWIG2
Investment AdviserHarris Associates L.P.Two North LaSalle StreetChicago, Illinois 60602-3790
Transfer AgentCDC IXIS Asset Management Services, Inc.Attention: The Oakmark Family of FundsP.O. Box 8510Boston, Massachusetts 02266-8510
Legal CounselBell, Boyd & Lloyd LLCChicago, Illinois
Independent AuditorsDeloitte & Touche LLPChicago, Illinois
For More Information:Please call 1-800-OAKMARK(1-800-625-6275)or 617-449-6274
Websitewww.oakmark.com
Other Information
THE OAKMARK FAMILY OF FUNDS
This report is submitted for the general information of the shareholders of the Funds. The report is notauthorized for distribution to prospective investors in the Funds unless it is accompanied or preceded by acurrently effective prospectus of the Funds. No sales charge to the shareholder or to the new investor is made inoffering the shares of the Funds.
Letter from the President . . . . . . . . . . . . . . . . . . . . . . . . . . . . . . . . . . . . . . . . . . . . . . . . . 1
Summary Information. . . . . . . . . . . . . . . . . . . . . . . . . . . . . . . . . . . . . . . . . . . . . . . . . . . . 2
Commentary on The Oakmark and Oakmark Select Funds . . . . . . . . . . . . . . . . . . . . 4
The Oakmark FundLetter from the Portfolio Managers. . . . . . . . . . . . . . . . . . . . . . . . . . . . . . . . . . . . . . . . . . 6
Schedule of Investments . . . . . . . . . . . . . . . . . . . . . . . . . . . . . . . . . . . . . . . . . . . . . . . . . . 7
The Oakmark Select FundLetter from the Portfolio Managers. . . . . . . . . . . . . . . . . . . . . . . . . . . . . . . . . . . . . . . . . 11
Schedule of Investments . . . . . . . . . . . . . . . . . . . . . . . . . . . . . . . . . . . . . . . . . . . . . . . . . 12
The Oakmark Small Cap FundLetter from the Portfolio Managers. . . . . . . . . . . . . . . . . . . . . . . . . . . . . . . . . . . . . . . . . 14
Schedule of Investments . . . . . . . . . . . . . . . . . . . . . . . . . . . . . . . . . . . . . . . . . . . . . . . . . 16
The Oakmark Equity and Income FundLetter from the Portfolio Managers. . . . . . . . . . . . . . . . . . . . . . . . . . . . . . . . . . . . . . . . . 20
Schedule of Investments . . . . . . . . . . . . . . . . . . . . . . . . . . . . . . . . . . . . . . . . . . . . . . . . . 23
The Oakmark Global FundLetter from the Portfolio Managers. . . . . . . . . . . . . . . . . . . . . . . . . . . . . . . . . . . . . . . . . 30
Global Diversification Chart . . . . . . . . . . . . . . . . . . . . . . . . . . . . . . . . . . . . . . . . . . . . . . 32
Schedule of Investments . . . . . . . . . . . . . . . . . . . . . . . . . . . . . . . . . . . . . . . . . . . . . . . . . 33
Commentary on The International and International Small Cap Funds . . . . . . . . 38
The Oakmark International FundLetter from the Portfolio Managers. . . . . . . . . . . . . . . . . . . . . . . . . . . . . . . . . . . . . . . . . 39
International Diversification Chart . . . . . . . . . . . . . . . . . . . . . . . . . . . . . . . . . . . . . . . . 41
Schedule of Investments . . . . . . . . . . . . . . . . . . . . . . . . . . . . . . . . . . . . . . . . . . . . . . . . . 42
The Oakmark International Small Cap FundLetter from the Portfolio Managers. . . . . . . . . . . . . . . . . . . . . . . . . . . . . . . . . . . . . . . . . 48
International Diversification Chart . . . . . . . . . . . . . . . . . . . . . . . . . . . . . . . . . . . . . . . . 50
Schedule of Investments . . . . . . . . . . . . . . . . . . . . . . . . . . . . . . . . . . . . . . . . . . . . . . . . . 51
Trustees and Officers . . . . . . . . . . . . . . . . . . . . . . . . . . . . . . . . . . . . . . . . . . . . . . . . . . . . 58
Oakmark Philosophy and Process . . . . . . . . . . . . . . . . . . . . . . . . . . . . . . . . . . . . . . . . . 61
The Oakmark Glossary. . . . . . . . . . . . . . . . . . . . . . . . . . . . . . . . . . . . . . . . . . . . . . . . . . . 62
For More Information
Access our web site at www.oakmark.com to obtain a prospectus, an application orperiodic reports, or call 1-800-OAKMARK (1-800-625-6275) or (617) 449-6274.
2003 First Quarter Report
THE OAKMARK FAMILY OF FUNDS
Turn to the end of this report to read about Oakmark’s Philosophyand Process and look up financial terms in the Oakmark Glossary.
Merrill Corporation - Harris/Oakmark 1st QR ED/E N30B2 1/2003 | jscott | 21-Jan-03 17:44 | 03chi1023.a | Sequence: 2CLEANCHKSUM Content: 11923 Layout: 25311 Graphics: No Graphics
NAME: Harris/Oakmark 1st QR ED/E N30B2 1/2003PROJ: p1009chi03 JOB: 03chi1023 CYCLE#;BL#: 9; 0 TRIM: 15.5" x 9.75" DOC TYPE: OtherAS: Merrill Chicago: 312-786-6300
COMPOSITECOLORS: Black, PANTONE 364 CVU, PANTONE 541 CVUGRAPHICS: none
Letter from the President
1
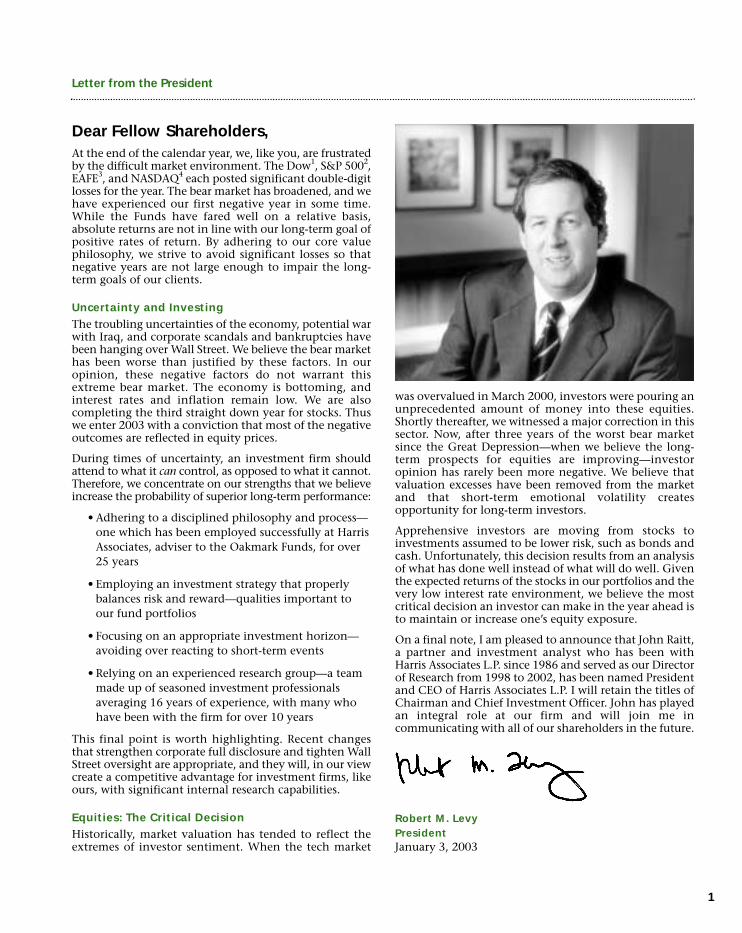
Dear Fellow Shareholders,At the end of the calendar year, we, like you, are frustratedby the difficult market environment. The Dow1, S&P 5002,EAFE3, and NASDAQ4 each posted significant double-digitlosses for the year. The bear market has broadened, and wehave experienced our first negative year in some time.While the Funds have fared well on a relative basis,absolute returns are not in line with our long-term goal ofpositive rates of return. By adhering to our core valuephilosophy, we strive to avoid significant losses so thatnegative years are not large enough to impair the long-term goals of our clients.
Uncertainty and InvestingThe troubling uncertainties of the economy, potential warwith Iraq, and corporate scandals and bankruptcies havebeen hanging over Wall Street. We believe the bear markethas been worse than justified by these factors. In ouropinion, these negative factors do not warrant thisextreme bear market. The economy is bottoming, andinterest rates and inflation remain low. We are alsocompleting the third straight down year for stocks. Thuswe enter 2003 with a conviction that most of the negativeoutcomes are reflected in equity prices.
During times of uncertainty, an investment firm shouldattend to what it can control, as opposed to what it cannot.Therefore, we concentrate on our strengths that we believeincrease the probability of superior long-term performance:
• Adhering to a disciplined philosophy and process—one which has been employed successfully at HarrisAssociates, adviser to the Oakmark Funds, for over25 years
• Employing an investment strategy that properlybalances risk and reward—qualities important toour fund portfolios
• Focusing on an appropriate investment horizon—avoiding over reacting to short-term events
• Relying on an experienced research group—a teammade up of seasoned investment professionalsaveraging 16 years of experience, with many whohave been with the firm for over 10 years
This final point is worth highlighting. Recent changesthat strengthen corporate full disclosure and tighten WallStreet oversight are appropriate, and they will, in our viewcreate a competitive advantage for investment firms, likeours, with significant internal research capabilities.
Equities: The Critical DecisionHistorically, market valuation has tended to reflect theextremes of investor sentiment. When the tech market
was overvalued in March 2000, investors were pouring anunprecedented amount of money into these equities.Shortly thereafter, we witnessed a major correction in thissector. Now, after three years of the worst bear marketsince the Great Depression—when we believe the long-term prospects for equities are improving—investoropinion has rarely been more negative. We believe thatvaluation excesses have been removed from the marketand that short-term emotional volatility createsopportunity for long-term investors.
Apprehensive investors are moving from stocks toinvestments assumed to be lower risk, such as bonds andcash. Unfortunately, this decision results from an analysisof what has done well instead of what will do well. Giventhe expected returns of the stocks in our portfolios and thevery low interest rate environment, we believe the mostcritical decision an investor can make in the year ahead isto maintain or increase one’s equity exposure.
On a final note, I am pleased to announce that John Raitt,a partner and investment analyst who has been withHarris Associates L.P. since 1986 and served as our Directorof Research from 1998 to 2002, has been named Presidentand CEO of Harris Associates L.P. I will retain the titles ofChairman and Chief Investment Officer. John has playedan integral role at our firm and will join me incommunicating with all of our shareholders in the future.
Robert M. LevyPresidentJanuary 3, 2003

Summary Information
THE OAKMARK FAMILY OF FUNDS
2 T H E O A K M A R K F A M I LY O F F U N D S
Performance for Period Ended December 31, 20025
The OakmarkFund
(OAKMX)
The OakmarkSelectFund
(OAKLX)
The OakmarkSmall Cap
Fund(OAKSX)
3 Months* 7.51% 10.02% 6.60%
6 Months* -10.34% -7.12% -16.87%
1 Year -14.41% -12.47% -13.07%
Average Annual TotalReturn for:
3 Year 4.21% 11.54% 4.65%
5 Year 1.00% 13.05% -1.73%
10 Year 11.36% N/A N/A
Since inception 16.46% 21.17% 9.03%
Value of $10,000from inception date $56,902 $32,699 $18,595
(8/5/91) (11/1/96) (11/1/95)
Washington Washington SureBeam Corporation,Mutual, Inc. 3.6% Mutual, Inc. 17.8% Class A 4.5%
H&R Block, Inc. 3.2% H&R Block, Inc. 9.1% Ralcorp Holdings, Inc. 4.0%The Home Depot, Inc. 2.3% Yum! Brands, Inc. 4.9% Catellus DevelopmentFannie Mae 2.3% First Data Corporation 4.8% Corporation 3.6%Yum! Brands, Inc. 2.2% Burlington Tupperware
Resources Inc. 4.3% Corporation 3.5%Insituform
Technologies, Inc.,Class A 3.5%
Retail 10.6% Banks & Thrifts 17.8% Computer Software 6.9%Pharmaceuticals 9.6% Other Consumer Food & Beverage 6.6%Other Consumer Goods & Services 13.0% Medical Products 6.6%
Goods & Services 7.3% Retail 10.9% Banks & Thrifts 6.2%Cable Systems & Information Services 7.2% Other Consumer
Satellite TV 6.1% Computer Services 6.7% Goods & Services 5.7%Food & Beverage 6.1%
Top Five Holdings as of December 31,20026
Company and % of TotalNet Assets
Top Five Industries as of December 31, 2002
Industries and % of TotalNet Assets
Past performance is no guarantee of future results. Investment return and principal value vary, and you may have a gain or loss when you sell shares. Average annual total return measures annualized change, while total return measures aggregate change.
* Not annualized
The OakmarkEquity and
Income Fund(OAKBX)
The OakmarkGlobalFund
(OAKGX)
The OakmarkInternational
Fund(OAKIX)
The OakmarkInternational
Small Cap Fund(OAKEX)
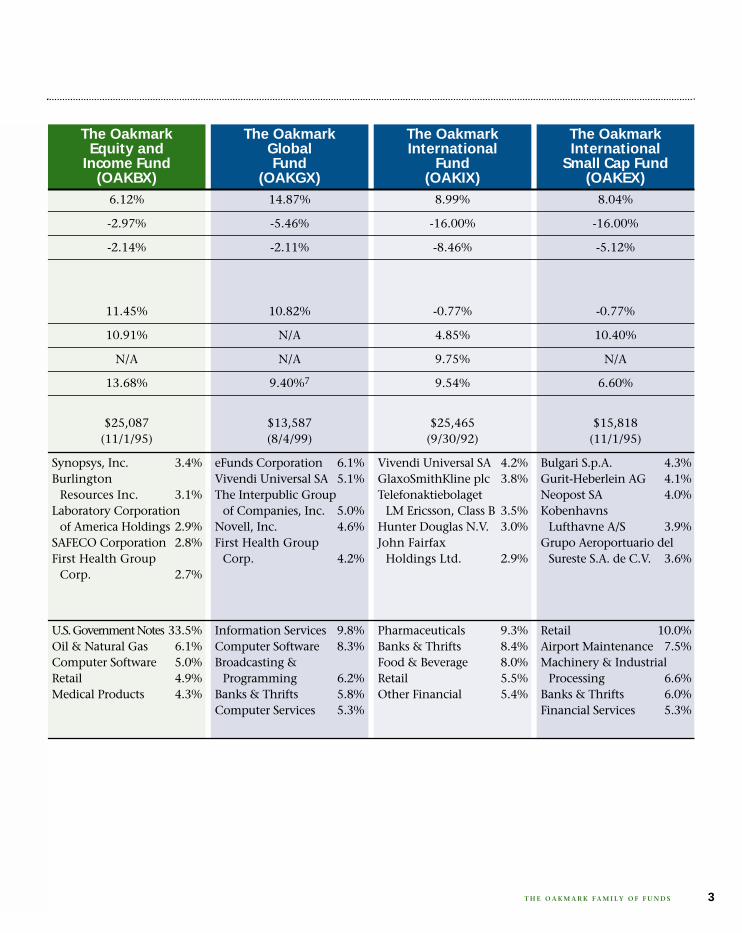
3T H E O A K M A R K F A M I LY O F F U N D S
6.12% 14.87% 8.99% 8.04%
-2.97% -5.46% -16.00% -16.00%
-2.14% -2.11% -8.46% -5.12%
11.45% 10.82% -0.77% -0.77%
10.91% N/A 4.85% 10.40%
N/A N/A 9.75% N/A
13.68% 9.40%7 9.54% 6.60%
$25,087 $13,587 $25,465 $15,818(11/1/95) (8/4/99) (9/30/92) (11/1/95)
Synopsys, Inc. 3.4% eFunds Corporation 6.1% Vivendi Universal SA 4.2% Bulgari S.p.A. 4.3%Burlington Vivendi Universal SA 5.1% GlaxoSmithKline plc 3.8% Gurit-Heberlein AG 4.1%
Resources Inc. 3.1% The Interpublic Group Telefonaktiebolaget Neopost SA 4.0%Laboratory Corporation of Companies, Inc. 5.0% LM Ericsson, Class B 3.5% Kobenhavns
of America Holdings 2.9% Novell, Inc. 4.6% Hunter Douglas N.V. 3.0% Lufthavne A/S 3.9%SAFECO Corporation 2.8% First Health Group John Fairfax Grupo Aeroportuario delFirst Health Group Corp. 4.2% Holdings Ltd. 2.9% Sureste S.A. de C.V. 3.6%
Corp. 2.7%
U.S. Government Notes 33.5% Information Services 9.8% Pharmaceuticals 9.3% Retail 10.0%Oil & Natural Gas 6.1% Computer Software 8.3% Banks & Thrifts 8.4% Airport Maintenance 7.5%Computer Software 5.0% Broadcasting & Food & Beverage 8.0% Machinery & IndustrialRetail 4.9% Programming 6.2% Retail 5.5% Processing 6.6%Medical Products 4.3% Banks & Thrifts 5.8% Other Financial 5.4% Banks & Thrifts 6.0%
Computer Services 5.3% Financial Services 5.3%
The New York Times began theNew Year with a businesssection headlined “Wall StreetDown a Third Year, LeavingFewer Optimists.” Yes, themarket had its third losing yearin succession, and yes, 2002was the worst in both breadthand magnitude. But no, threedown years does not increasethe probability of sufferingfurther losses. That logic isbackwards—lower pricesincrease the probability of
achieving good returns. Realizing the difficulty of viewinglower prices as an opportunity, Warren Buffett used ananalogy to a mundane consumer product:
“If you plan to eat hamburgers throughout your lifeand are not a cattle producer, should you wish forhigher or lower prices for beef? If you expect to be a netsaver during the next five years, should you hope for ahigher or lower stock market during that period? Manyinvestors get this one wrong. Even though they aregoing to be net buyers of stocks for many years to come,they are elated when stock prices rise and depressedwhen they fall. In effect, they rejoice because priceshave risen for the ‘hamburgers’ they will soon bebuying. This reaction makes no sense.”
Last quarter, we were presented with an opportunity toacquire inexpensive “hamburgers”. H&R Block (HRB) hasbeen one of our largest holdings for several years. Thebusiness has performed well, as has the stock. In November,a small independent research firm published a sell reportthat was highly critical of HRB. They highlighted a likely endto the rapid growth of the company’s cyclical mortgageorigination business and touted that HRB was being suedfor an amount that exceeded its shareholders’ equity.
When reading any research report, one has to sort carefullythrough what is factual and what is opinion. In addition,while most scenarios are “possible,” one needs to considerhow likely those possibilities really are. Last year we wereall reminded of the obvious conflicts between research andinvestment banking and the tendency for reports onbanking clients to have a positive spin. Most businessschools even teach students to be suspicious of opinionsexpressed in research on banking clients. Because of thatinherent conflict, “independent” research, meaning noinvestment banking ties, has been put on a pedestal. Butthe lack of banking ties by no means insures thatindependent research is unbiased. Some “independent”
firms are funded largely by short-sellers, and their reportsoften have the goal of scaring investors out of stocks theirclients are already short. We believe the chance thatinvestors will be misled by these reports is higher becausetheir conflict is less obvious. The sell report on HRBknocked the stock down from $40 to $29 in just a fewdays. Our first reaction was less thinking about WarrenBuffett’s hamburgers and more thinking of RandyNewman’s lyrics “short people got no reason to live.”
The Wall Street Journal piled on with a negative article onHRB (on the very day it hit its low!) that stateddisparagingly that in the prior year, their tax business “grewjust 23%.” Just 23%? We would be happy if most of ourholdings grew half that fast! After fighting through thefrustration, and sorting out the misinformation, we asked,“Does HRB still fit our investment criteria? Is it selling below60% of a growing value, and does its management act inour interest?” Answering those questions with enthusiasticyesses, we concluded the price drop was uncalled for andwe added substantially to our position.
In previous letters, we have addressed our willingness tohave extremely long holding periods, our criteria formanagements, and our calculation of business value. UsingHRB as an example, let’s look at how we project businessvalue growth. Why do we want businesses that grow? A bigrisk of value investing is that the statistically cheapest stocksare frequently structurally disadvantaged companies. Theymay be facing market share losses, declining sales prices orunusually high capital expenditures. Their value five yearsfrom now may be less than today. To avoid that “valuetrap,” we look for companies whose value is likely to growat above average rates. This growth gives us the luxury ofinvesting for a longer timeframe than most of ourcompetitors. How do we find undervalued stocks in whichper-share business value is growing at above average rates?Although the market is reasonably efficient at pricing salesgrowth, we think it is less efficient at differentiating
4 T H E O A K M A R K A N D O A K M A R K S E L E C T F U N D S
THE OAKMARK AND OAKMARK SELECT FUNDS
At Oakmark, we look for stocks with prices less than 60% of intrinsic value, with intrinsic value thatis likely to grow and with management that acts in the interest of outside shareholders. Thecombination of these factors creates our biggest competitive advantage—the ability to be more patientthan most investors.
• Lower stock prices have increased theprobability of good returns.
• Buying growing businesses gives us the luxuryof a long timeframe.
• Biased stock research highlights the value ofdepending on our own research.
Highlights
between cyclical and secular growth, evaluating multi-division companies, and translating balance sheet changeinto per-share value change.
HRB has a great tax preparation business. It has strongsecular growth resulting from growth in the number of taxreturns, growth in the percentage of filers who use paidpreparers, and growth in its industry leading market share.Combine that with its strong cash generation—it is one offew businesses that can grow revenues ten percent withoutneeding either higher capital expenditures or moreworking capital—and you get a business we believe isdeserving of a very high multiple.
Skeptics argue that HRB’s mortgage origination businesssharply increases the risk of owning the stock. Thatdivision has performed so well over the past several years,primarily due to the cyclic refinancing boom, that a rapidreturn to trendline earnings might cause a one year declinein HRB’s reported EPS8. We acknowledge that possibilityand even agree it is likely. But we are not focused on EPSgrowth. Instead, we look at business value growth.
To see how the value of a company changes over time, wemake projections for each of its divisions, and then sum upthe values. We project the HRB tax business will continuegrowing at an above-average rate, albeit probably less thanthe “only 23%” it achieved last year. We expect HRB’s totalincome to grow more slowly than its tax income growssince we are not forecasting growth in the mortgagebusiness. The multiple we use to value the mortgagebusiness—a competitive, commodity-like business—ismuch lower than the multiple we use for the tax business.Because the percentage of HRB’s earnings coming from thetax business will be increasing, the multiple we think isappropriate for the entire company will also be increasing.Finally, the mortgage business and the tax business eachproduce large amounts of cash beyond what needs to bereinvested in the business. Management expects tocontinue using that cash to repurchase stock. So, lookingout five years, we see higher earnings, a mix shift towarda higher multiple business, and fewer shares outstanding.These factors combine to produce an expected rate of per-share value growth that is far above average.
After purchasing our “hamburgers” on sale, we gotsomething we don’t experience very often—near instantgratification. HRB settled its lawsuit for a small amount ofmoney – which is consistent with what we and thecompany had always expected. HRB’s stock price, whichhit $29 the day the Journal wrote their negative story,topped $39 five trading days later. In the long run, businessvalue always wins out over attempts to drive stock pricesaway from underlying value. As much as we knew that tobe true, the market’s quick reaction was still comforting.
One last comment on HRB—not H&R Block, but ratherHenry R. Berghoef—co-manager of The Oakmark SelectFund. For the last several years, Henry has served as ourAssociate Director of Research in addition to contributingmany of the stock recommendations that have drivenOakmark’s performance. Effective the first of the year,Henry became Director of Research, assuming fullresponsibility for our research department. The researchgroup Henry inherits is, I believe, the best in the business.His leadership assures a continuation of Oakmark’s strongresearch heritage. We will continue to benefit from Henry’sinput as an analyst and co-manager of The Oakmark SelectFund. In addition, we will now benefit from the imprint heputs on all of our research. Congratulations Henry!
William C. Nygren, CFAPortfolio Manager
January 6, 2003
5T H E O A K M A R K A N D O A K M A R K S E L E C T F U N D S

Report from Bill Nygren and Kevin Grant, Portfolio Managers
THE OAKMARK FUND
6 T H E O A K M A R K F U N D
THE VALUE OF A $10,000 INVESTMENT IN THEOAKMARK FUND FROM ITS INCEPTION (8/5/91) TOPRESENT (12/31/02) AS COMPARED TO THE STANDARD & POOR’S 500 INDEX2
Average Annual Total Returns5
(as of 12/31/02)
Total Return 1-year 5-year 10-year SinceLast 3 Months* Inception
(8/5/91)
Oakmark Fund 7.51% -14.41% 1.00% 11.36% 16.46%
S&P 500 8.44% -22.10% -0.59% 9.34% 9.67%
Dow Jones Average1
10.38% -15.13% 2.82% 12.02% 11.74%
Lipper Large Cap 8.64% -19.68% -0.39% 8.71% 9.29%
Value Index9
The graph and table do not reflect the deduction of taxes that a shareholder would payon fund distributions or the redemption of fund shares.
Past performance is no guarantee of future results. Investment return andprincipal value vary, and you may have a gain or loss when you sell shares. Averageannual total return measures annualized change, while total return measures aggregatechange.
* Not annualized
8/91
$20,000
$30,000
$40,000
$50,000
$70,000
The OakmarkFund$56,902
S & P 500$28,686
12/92 12/94
$10,000
$60,000
12/93 12/0112/0012/95 12/96 12/97 12/98 12/99 12/0212/91
The Oakmark Fund increased in value by 8% lastquarter, reducing the loss for the year to 14%.Despite suffering our largest calendar year loss sincethe fund’s inception in 1991, our performance wasstrong relative to other equity investors. With theS&P 500 down 22% for the year, achieving positivereturns was nearly impossible. The Oakmark Fundlost less money than did 86% of the 827 fundsMorningstar10 classifies as Large Cap Value funds,and according to a recent Wall Street Journal articlethe average equity mutual fund lost 22% which is50% more than we lost. In the most recent Berk-shire Hathaway annual report, Warren Buffettstated: “Some people disagree with our focus on rel-ative figures, arguing that ‘you can’t eat relative per-formance!’ But, if you expect that owning theS&P 500 will produce reasonably satisfactory resultsover time, it follows that, for long-term investors,gaining small advantages annually over that indexmust prove rewarding.” Another great investor,Peter Lynch, was asked about his “poor” perform-ance which occurred in a very weak equity market.Lynch responded “Let’s say you play golf. You shoot72 and everybody else shoots in the 80s. The nextday, the winds are blowing twenty miles an hourand it’s raining. You shoot a 78 and everybody elseshoots in the 90s. Do people say ‘What happened toyour golf game?”
Losing less than other investors never feels as satis-fying as does making money, but it is just as impor-tant as we work toward our goal of producingexcellent long-term returns. Over the past threeyears, we are up while the market has seriouslydeclined. Over the past decade, The Oakmark Fundhas achieved a 11% annualized return. Not only hasthat beaten the market and most of our peers, butcompounding that return for a decade more thantripled our investors’ capital.
During the quarter, we did not add any new posi-tions, and we eliminated two—Newell Rubbermaidand CVS. We made money on our Newell invest-ment over two years when most stocks fell dramati-cally. With CVS, we lost some of our originalinvestment (though far less than either the marketor the average retail stock), as an increasingly com-petitive environment proved our projections to betoo optimistic. In both cases, we used the proceeds toadd to existing holdings that we feel are high-qualitybusinesses that now sell at lower multiples.
Best wishes,
William C. Nygren, CFA Kevin Grant, CFAPortfolio Manager Portfolio [email protected] [email protected]
January 6, 2003
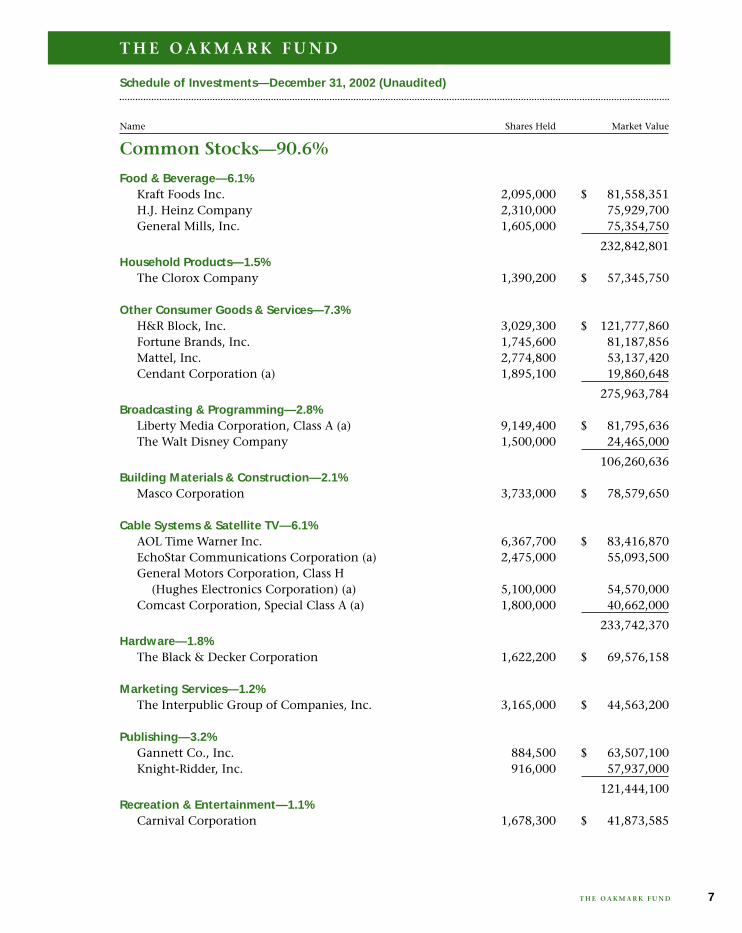
Common Stocks—90.6%
Food & Beverage—6.1%Kraft Foods Inc. 2,095,000 $ 81,558,351H.J. Heinz Company 2,310,000 75,929,700General Mills, Inc. 1,605,000 75,354,750
232,842,801Household Products—1.5%
The Clorox Company 1,390,200 $ 57,345,750
Other Consumer Goods & Services—7.3%H&R Block, Inc. 3,029,300 $ 121,777,860Fortune Brands, Inc. 1,745,600 81,187,856Mattel, Inc. 2,774,800 53,137,420Cendant Corporation (a) 1,895,100 19,860,648
275,963,784Broadcasting & Programming—2.8%
Liberty Media Corporation, Class A (a) 9,149,400 $ 81,795,636The Walt Disney Company 1,500,000 24,465,000
106,260,636Building Materials & Construction—2.1%
Masco Corporation 3,733,000 $ 78,579,650
Cable Systems & Satellite TV—6.1%AOL Time Warner Inc. 6,367,700 $ 83,416,870EchoStar Communications Corporation (a) 2,475,000 55,093,500General Motors Corporation, Class H
(Hughes Electronics Corporation) (a) 5,100,000 54,570,000Comcast Corporation, Special Class A (a) 1,800,000 40,662,000
233,742,370Hardware—1.8%
The Black & Decker Corporation 1,622,200 $ 69,576,158
Marketing Services—1.2%The Interpublic Group of Companies, Inc. 3,165,000 $ 44,563,200
Publishing—3.2%Gannett Co., Inc. 884,500 $ 63,507,100Knight-Ridder, Inc. 916,000 57,937,000
121,444,100Recreation & Entertainment—1.1%
Carnival Corporation 1,678,300 $ 41,873,585
Schedule of Investments—December 31, 2002 (Unaudited)
Name Shares Held Market Value
T H E O A K M A R K F U N D
T H E O A K M A R K F U N D 7

Common Stocks—90.6% (cont.)
Restaurants—4.4%Yum! Brands, Inc (a) 3,509,000 $ 84,987,980McDonald’s Corporation 5,000,000 80,400,000
165,387,980Retail—10.6%
The Home Depot, Inc. 3,681,500 $ 88,208,740J.C. Penney Company, Inc. 3,552,900 81,752,229Safeway Inc. (a) 3,327,000 77,718,720The Kroger Co. (a) 4,790,000 74,005,500The Gap, Inc. 3,199,000 49,648,480Toys ‘ ’ Us, Inc. (a) 3,125,000 31,250,000
402,583,669Bank & Thrifts—5.6%
Washington Mutual, Inc. 3,937,300 $ 135,954,969U.S. Bancorp 3,700,000 78,514,000
214,468,969Insurance—1.6%
MGIC Investment Corporation 1,437,900 $ 59,385,270
Other Financial—2.3%Fannie Mae 1,370,000 $ 88,132,100
Medical Products—2.2%Guidant Corporation (a) 2,671,100 $ 82,403,435
Pharmaceuticals—9.6%Merck & Co., Inc. 1,500,000 $ 84,915,000Abbott Laboratories 2,050,000 82,000,000Bristol-Myers Squibb Company 3,450,000 79,867,500Schering-Plough Corporation 3,225,000 71,595,000Chiron Corporation (a) 1,274,000 47,902,400
366,279,900Telecommunications—1.5%
Sprint Corporation 4,021,000 $ 58,224,080
Telecommunications Equipment—0.7%Motorola, Inc. 2,975,000 $ 25,733,750
R
Schedule of Investments—December 31, 2002 (Unaudited) cont.
Name Shares Held Market Value
T H E O A K M A R K F U N D
T H E O A K M A R K F U N D8

Common Stocks—90.6% (cont.)
Computer Services—4.8%First Data Corporation 2,365,500 $ 83,762,355SunGard Data Systems, Inc. (a) 2,601,600 61,293,696Electronic Data Systems Corporation 1,958,300 36,091,469
181,147,520Computer Systems—1.0%
Sun Microsystems, Inc. (a) 12,500,000 $ 38,875,000
Office Equipment—1.5%Xerox Corporation (a) 6,927,400 $ 55,765,570
Aerospace & Defense—2.9%Honeywell International, Inc. 3,050,000 $ 73,200,000The Boeing Company 1,125,000 37,113,750
110,313,750Other Industrial Goods & Services—1.0%
Illinois Tool Works Inc. 604,200 $ 39,188,412
Waste Disposal—1.7%Waste Management, Inc. 2,874,300 $ 65,878,956
Oil & Natural Gas—4.0%ConocoPhillips 1,635,335 $ 79,133,860Burlington Resources Inc. 1,671,100 71,272,415
150,406,275Electric Utilities—2.0%
Duke Energy Corporation 2,520,000 $ 49,240,800TXU Corp. 1,525,000 28,487,000
77,727,800
Total Common Stocks (Cost: $3,466,204,554) 3,444,094,470
Schedule of Investments—December 31, 2002 (Unaudited) cont.
Name Shares Held Market Value
T H E O A K M A R K F U N D
T H E O A K M A R K F U N D 9
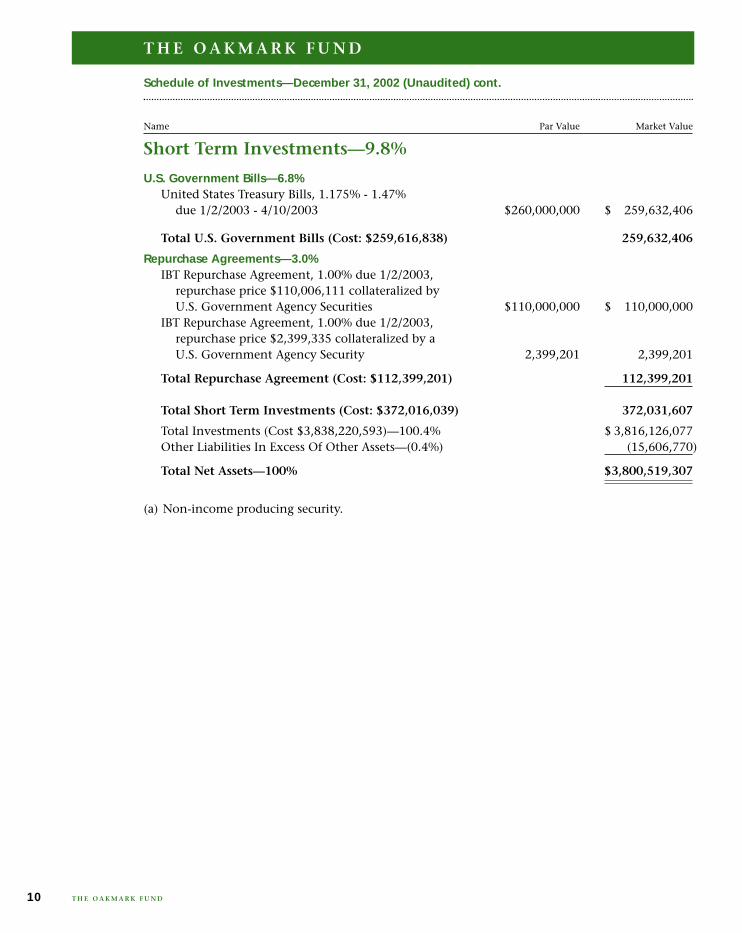
Short Term Investments—9.8%
U.S. Government Bills—6.8%United States Treasury Bills, 1.175% - 1.47%
due 1/2/2003 - 4/10/2003 $260,000,000 $ 259,632,406
Total U.S. Government Bills (Cost: $259,616,838) 259,632,406
Repurchase Agreements—3.0%IBT Repurchase Agreement, 1.00% due 1/2/2003,
repurchase price $110,006,111 collateralized by U.S. Government Agency Securities $110,000,000 $ 110,000,000
IBT Repurchase Agreement, 1.00% due 1/2/2003, repurchase price $2,399,335 collateralized by a U.S. Government Agency Security 2,399,201 2,399,201
Total Repurchase Agreement (Cost: $112,399,201) 112,399,201
Total Short Term Investments (Cost: $372,016,039) 372,031,607
Total Investments (Cost $3,838,220,593)—100.4% $ 3,816,126,077Other Liabilities In Excess Of Other Assets—(0.4%) (15,606,770)
Total Net Assets—100% $3,800,519,307
(a) Non-income producing security.
Schedule of Investments—December 31, 2002 (Unaudited) cont.
Name Par Value Market Value
T H E O A K M A R K F U N D
T H E O A K M A R K F U N D10

Report from Bill Nygren and Henry Berghoef, Portfolio Managers
THE OAKMARK SELECT FUND
11T H E O A K M A R K S E L E C T F U N D
THE VALUE OF A $10,000 INVESTMENT IN THEOAKMARK SELECT FUND FROM ITS INCEPTION(11/1/96) TO PRESENT (12/31/02) AS COMPARED TOTHE STANDARD & POOR’S 500 INDEX2
Average Annual Total Returns5
(as of 12/31/02)Total Return 1-year 5-year Since
Last 3 Months* Inception(11/1/96)
Oakmark Select Fund 10.02% -12.47% 13.05% 21.17%Return after taxes on distributions
11-12.50% 11.59% 19.83%
Return after taxes on distributionsand sale of Fund shares -7.66% 10.44% 17.80%
S&P 500 8.44% -22.10% -0.59% 5.18%S&P MidCap 400
125.83% -14.51% 6.41% 11.04%
Lipper Mid Cap 6.59% -14.66% 2.07% 6.09%Value Index
13
The graph does not reflect the deduction of taxes that a shareholder would pay onfund distributions or the redemption of fund shares.
Past performance, before and after taxes, is no guarantee of futureresults. Investment return and principal value vary, and you may have a gain or losswhen you sell shares. Average annual total return measures annualized change, whiletotal return measures aggregate change.
* Not annualized
10/96
$15,000
$20,000
$25,000
$30,000
$40,000
The OakmarkSelect Fund$32,699
S & P 500$13,653
12/97 12/99
$10,000
$35,000
12/98 12/00 12/01 12/0212/96
The Oakmark Select Fund gained 10% in the quar-ter reducing the calendar year loss to 12%. TheS&P 500 lost 22% for the year, making 2002 theworst year for the stock market since 1974. In 2000and 2001, despite the market declining a total of20%, we were able to grow our value by 59%. Inthose two years, the large capitalization stocks andtechnology stocks that dominated the market aver-ages declined sharply in price. However, the rest ofthe market, which is what most of our portfoliowas selected from, generally increased in value. Butin 2002, nearly three-quarters of the stocks in theS&P 500 declined. It was nearly impossible to over-come the market decline with good stock selec-tion. Fortunately, we enter 2003 with lowervaluation levels which we feel increases the prob-ability of good returns ahead.
We neither added nor eliminated any stocks dur-ing the quarter. The changes were limited to posi-tion size changes. As previously discussed, wetook advantage of negative mis-informationabout H&R Block to increase our position atfavorable prices. On the flip side, we sold almosta quarter of our Sprint position, because of theeighty percent increase off its October low.
The Sprint sale is an instructive example of howwe manage the portfolio for both pre-tax andafter-tax returns. When Sprint stock fell fromApril through October, we felt it was becomingmore attractive so we added several million sharesto our position. As the stock rallied this quarter,its relative attractiveness decreased, and we soldseveral million shares. These incremental pur-chases and sales were nicely additive to our pre-tax returns. Even better, from a tax perspective,instead of selling the shares we bought in thesummer, we sold shares we bought in the prioryear and realized a taxable loss on the sale.Because of transactions like the Sprint example,The Oakmark Select Fund has a realized losscarry-forward that will be used to reduce or elim-inate future taxable distributions.
Best wishes,
William C. Nygren, CFA Henry R. Berghoef, CFAPortfolio Manager Portfolio [email protected] [email protected]
January 6, 2003
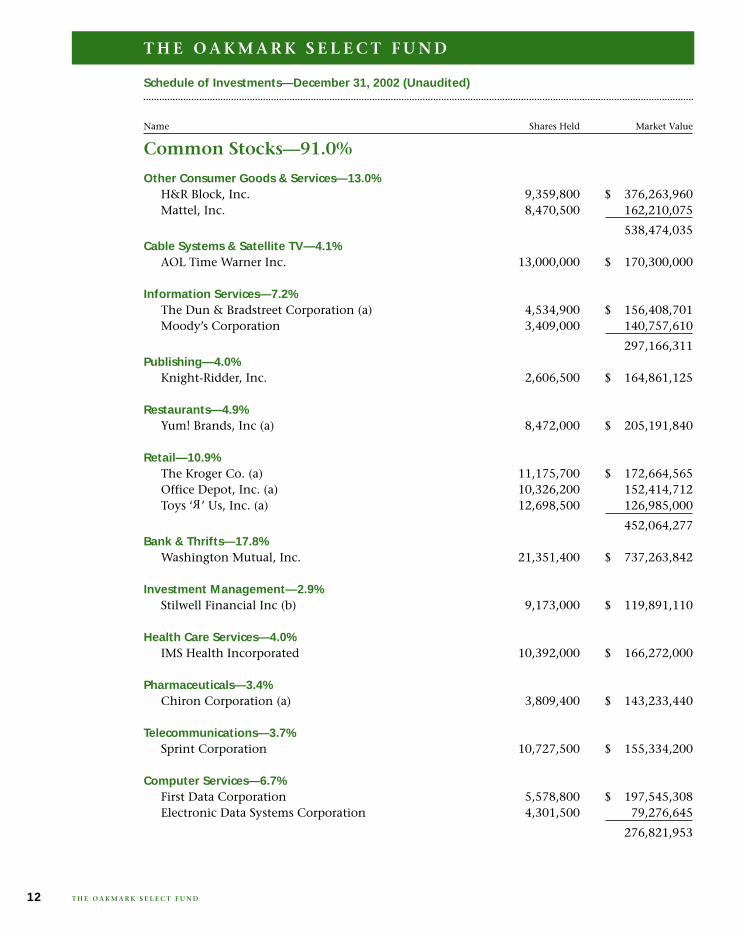
Common Stocks—91.0%
Other Consumer Goods & Services—13.0%H&R Block, Inc. 9,359,800 $ 376,263,960Mattel, Inc. 8,470,500 162,210,075
538,474,035Cable Systems & Satellite TV—4.1%
AOL Time Warner Inc. 13,000,000 $ 170,300,000
Information Services—7.2%The Dun & Bradstreet Corporation (a) 4,534,900 $ 156,408,701Moody’s Corporation 3,409,000 140,757,610
297,166,311Publishing—4.0%
Knight-Ridder, Inc. 2,606,500 $ 164,861,125
Restaurants—4.9%Yum! Brands, Inc (a) 8,472,000 $ 205,191,840
Retail—10.9%The Kroger Co. (a) 11,175,700 $ 172,664,565Office Depot, Inc. (a) 10,326,200 152,414,712Toys ‘ ’ Us, Inc. (a) 12,698,500 126,985,000
452,064,277Bank & Thrifts—17.8%
Washington Mutual, Inc. 21,351,400 $ 737,263,842
Investment Management—2.9%Stilwell Financial Inc (b) 9,173,000 $ 119,891,110
Health Care Services—4.0%IMS Health Incorporated 10,392,000 $ 166,272,000
Pharmaceuticals—3.4%Chiron Corporation (a) 3,809,400 $ 143,233,440
Telecommunications—3.7%Sprint Corporation 10,727,500 $ 155,334,200
Computer Services—6.7%First Data Corporation 5,578,800 $ 197,545,308Electronic Data Systems Corporation 4,301,500 79,276,645
276,821,953
R
Schedule of Investments—December 31, 2002 (Unaudited)
Name Shares Held Market Value
T H E O A K M A R K S E L E C T F U N D
T H E O A K M A R K S E L E C T F U N D12

Common Stocks—91.0% (cont.)
Office Equipment—4.1%Xerox Corporation (a) 21,047,700 $ 169,433,985
Oil & Natural Gas—4.3%Burlington Resources Inc. 4,201,800 $ 179,206,770
Total Common Stocks (Cost: $3,276,249,599) 3,775,514,888
Short Term Investments—9.5%
U.S. Government Bills—6.7%United States Treasury Bills, 1.17% - 1.48%
due 1/9/2003 - 5/15/2003 $280,000,000 $ 279,352,102
Total U.S. Government Bills (Cost: $279,324,547) 279,352,102
Repurchase Agreements—2.8%IBT Repurchase Agreement, 1.00% due 1/2/2003,
repurchase price $114,006,333 collateralized by U.S. Government Agency Securities $114,000,000 $ 114,000,000
IBT Repurchase Agreement, 1.00% due 1/2/2003, repurchase price $2,670,163 collateralized by a U.S. Government Agency Security 2,670,015 2,670,015
Total Repurchase Agreement (Cost: $116,670,015) 116,670,015
Total Short Term Investments (Cost: $395,994,562) 396,022,117
Total Investments (Cost $3,672,244,161)—100.5% $ 4,171,537,005Other Liabilities In Excess Of Other Assets—(0.5%) (20,821,002)
Total Net Assets—100% $4,150,716,003
(a) Non-income producing security.(b) Effective January 2, 2003, Stilwell Financial Inc changed its name to Janus Capital Group Inc.
Schedule of Investments—December 31, 2002 (Unaudited) cont.
Shares Held/Name Par Value Market Value
T H E O A K M A R K S E L E C T F U N D
T H E O A K M A R K S E L E C T F U N D 13
Report from James P. Benson and Clyde S. McGregor, Portfolio Managers
THE OAKMARK SMALL CAP FUND
14 T H E O A K M A R K S M A L L C A P F U N D
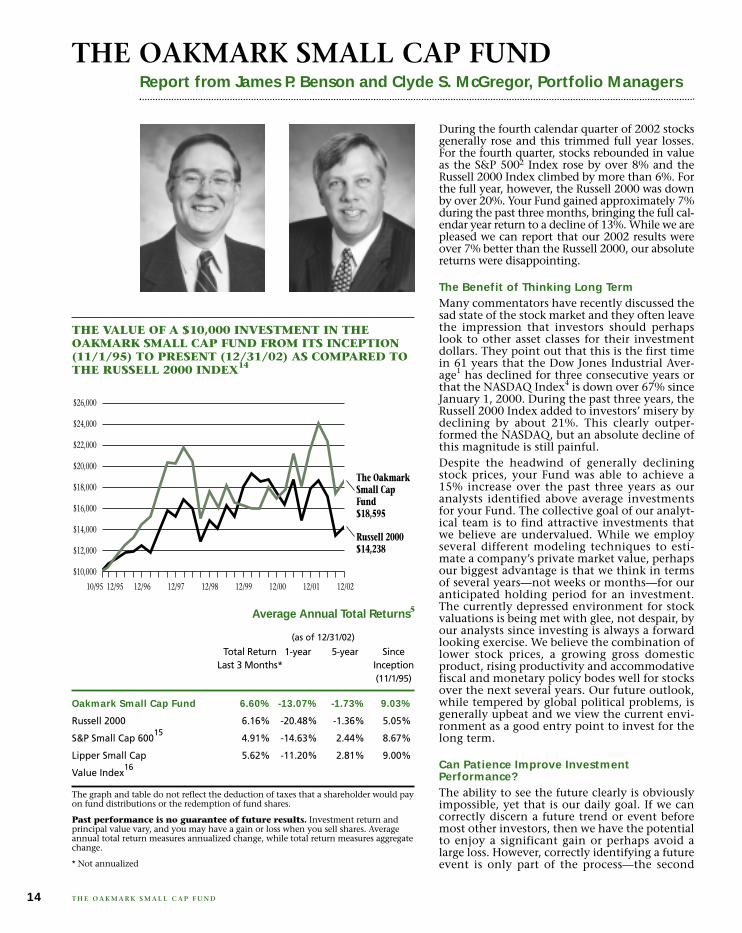
THE VALUE OF A $10,000 INVESTMENT IN THEOAKMARK SMALL CAP FUND FROM ITS INCEPTION(11/1/95) TO PRESENT (12/31/02) AS COMPARED TOTHE RUSSELL 2000 INDEX14
Average Annual Total Returns5
(as of 12/31/02)
Total Return 1-year 5-year SinceLast 3 Months* Inception
(11/1/95)
Oakmark Small Cap Fund 6.60% -13.07% -1.73% 9.03%
Russell 2000 6.16% -20.48% -1.36% 5.05%
S&P Small Cap 60015
4.91% -14.63% 2.44% 8.67%
Lipper Small Cap 5.62% -11.20% 2.81% 9.00%
Value Index16
The graph and table do not reflect the deduction of taxes that a shareholder would payon fund distributions or the redemption of fund shares.
Past performance is no guarantee of future results. Investment return andprincipal value vary, and you may have a gain or loss when you sell shares. Averageannual total return measures annualized change, while total return measures aggregatechange.
* Not annualized
10/95
$12,000
$14,000
$20,000
$22,000
$26,000
The OakmarkSmall CapFund$18,595
Russell 2000$14,238
12/96 12/97 12/98 12/99 12/00
$10,000
$24,000
12/01
$16,000
$18,000
12/0212/95
During the fourth calendar quarter of 2002 stocksgenerally rose and this trimmed full year losses.For the fourth quarter, stocks rebounded in valueas the S&P 5002 Index rose by over 8% and theRussell 2000 Index climbed by more than 6%. Forthe full year, however, the Russell 2000 was downby over 20%. Your Fund gained approximately 7%during the past three months, bringing the full cal-endar year return to a decline of 13%. While we arepleased we can report that our 2002 results wereover 7% better than the Russell 2000, our absolutereturns were disappointing.
The Benefit of Thinking Long TermMany commentators have recently discussed thesad state of the stock market and they often leavethe impression that investors should perhapslook to other asset classes for their investmentdollars. They point out that this is the first timein 61 years that the Dow Jones Industrial Aver-age1 has declined for three consecutive years orthat the NASDAQ Index4 is down over 67% sinceJanuary 1, 2000. During the past three years, theRussell 2000 Index added to investors’ misery bydeclining by about 21%. This clearly outper-formed the NASDAQ, but an absolute decline ofthis magnitude is still painful.Despite the headwind of generally decliningstock prices, your Fund was able to achieve a15% increase over the past three years as ouranalysts identified above average investmentsfor your Fund. The collective goal of our analyt-ical team is to find attractive investments thatwe believe are undervalued. While we employseveral different modeling techniques to esti-mate a company’s private market value, perhapsour biggest advantage is that we think in termsof several years—not weeks or months—for ouranticipated holding period for an investment.The currently depressed environment for stockvaluations is being met with glee, not despair, byour analysts since investing is always a forwardlooking exercise. We believe the combination oflower stock prices, a growing gross domesticproduct, rising productivity and accommodativefiscal and monetary policy bodes well for stocksover the next several years. Our future outlook,while tempered by global political problems, isgenerally upbeat and we view the current envi-ronment as a good entry point to invest for thelong term.
Can Patience Improve InvestmentPerformance?The ability to see the future clearly is obviouslyimpossible, yet that is our daily goal. If we cancorrectly discern a future trend or event beforemost other investors, then we have the potentialto enjoy a significant gain or perhaps avoid alarge loss. However, correctly identifying a futureevent is only part of the process—the second
critical step in this process is to determine which com-panies will be aided and which companies may be hurtby the event. Lastly, once the aforementioned items havebeen identified, the timing of any investment actionneeds to be considered.An example of our thought process is our investment inSurebeam. This company is a leader in food processingsafety. Their patented electron beam technology elimi-nates many food borne pathogens such as E. coli, Liste-ria Monocytogenes and Salmonella from meats, fruits,vegetables and spices. We believe this technology, whichonly costs a few cents per pound, has the possibility ofbecoming an industry standard much like pasteurizationbecame a standard for milk several decades ago. Webelieve the value of Surebeam’s technology more thancovers the current stock price even if Surebeam is unableto grow beyond a niche provider. However, if theirprocess becomes a de facto standard, Surebeam has thepotential to grow into a very large company and wewould expect its stock to do very well as a result. Exactlywhen this will happen is uncertain, as the food process-ing industry has historically been slow to adopt newtechnologies. This is where our patient, long term viewcomes into play since we are not looking for just onegood quarter, but rather a management team that cansuccessfully grow a business for many years. Surebeam’stechnology is approved for use by the U.S. governmentfor many types of food, thus regulatory approval is onelarge hurdle that has already been overcome. Adoptionof Surebeam meat products (especially ground beef) bygrocery stores began to grow rapidly in the fourth quar-ter of 2002 and we believe this growth will continue into2003. While we do not know exactly when the stockmarket will begin to reflect our estimated value of Sure-beam, we do expect that patience is likely to be a prof-itable virtue.
Portfolio UpdateDuring the past quarter we sold four stocks from yourFund’s portfolio while we added two new companies. Thestocks sold were IDEXX Laboratories, Sensient Technolo-gies, Teekay Shipping and Pathmark Stores. IDEXX, Sen-sient and Teekay had been good performers for the Fundand we elected to sell these positions so that we could rein-vest the proceeds into stocks that we believe sell at a largerdiscount to value. We sold Pathmark as we became con-cerned about the deteriorating fundamental outlook forthis regional grocery store chain.During the fourth quarter we initiated positions in Dou-bleClick Inc. and Triarc Companies. We believe both ofthese companies are robust financially since they possesslarge amounts of net cash on their balance sheets. In Triarc’scase, net cash per share exceeded our purchase price, thuswe effectively bought their operations (consisting princi-pally of the Arby’s restaurant chain) for nothing. While weremain somewhat surprised that we can occasionally buycompanies with decent operations for less than the net cashon their balance sheet, we intend to continue investing insituations such as these until the stock market takes awaythese opportunities.DoubleClick is a provider of software tools to online adver-tisers that help these companies plan, execute and analyzeonline advertising, email marketing and database market-ing. DoubleClick’s stock trades at only a modest premiumto the firm’s almost $4 per share in net cash, yet Dou-bleClick has built a leading online advertising software busi-ness that generates approximately $300 million in annualrevenues. While revenues at DoubleClick have been underpressure in recent quarters reflecting the soft economy, webelieve customized online marketing is a very cost effectiveway for companies to reach their target audience. Therefore,we believe DoubleClick is likely to be successful over timeand their strong cash position should help them weatherthe economic slowdown in good shape.
ConclusionWe would like to thank all of our shareholders for yourongoing interest in and your support of The Oakmark SmallCap Fund. We wish everyone a happy, healthy and pros-perous New Year!
James P. Benson, CFA Clyde S. McGregor, CFAPortfolio Manager Portfolio [email protected] [email protected]
January 2, 2003
• Investing is a forward-looking exercise, and ouranalysts believe the depressed environment forstock valuations offers ample opportunity.
• Of all the techniques we employ to determineprivate market value, our biggest advantage isthinking in terms of years, not weeks ormonths, for our holding period.
• During the quarter, four stocks were sold andtwo new companies added.
15T H E O A K M A R K S M A L L C A P F U N D
Highlights

Common Stocks—95.3%
Food & Beverage—6.6%Ralcorp Holdings, Inc. (a) 579,000 $ 14,556,060Del Monte Foods Company (a) 1,230,000 9,471,000
24,027,060
Household Products—3.5%Tupperware Corporation 850,000 $ 12,818,000
Other Consumer Goods & Services—5.7%Department 56, Inc. (a) 760,000 $ 9,804,000Callaway Golf Company 475,000 6,293,750Central Parking Corporation 250,000 4,715,000
20,812,750Security Systems—2.8%
Checkpoint Systems, Inc. (a) 968,300 $ 10,012,222
Apparel—3.6%Oakley, Inc. (a) 900,000 $ 9,243,000R.G. Barry Corporation (a) 900,000 3,690,000
12,933,000Automobile Rentals—1.9%
Dollar Thrifty Automotive Group, Inc. (a) 325,000 $ 6,873,750
Building Materials & Construction—3.5%Insituform Technologies, Inc., Class A (a) 750,000 $ 12,787,500
Educational Services—3.3%ITT Educational Services, Inc. (a)(b) 509,500 $ 11,998,725
Hotels & Motels—1.8%Prime Hospitality Corp. (a) 810,000 $ 6,601,500
Information Services—3.3%eFunds Corporation (a) 1,327,600 $ 12,094,436
Marketing Services—0.8%DoubleClick Inc. (a) 429,400 $ 2,430,404Grey Global Group Inc. 1,000 611,100
3,041,504Restaurants—0.9%
Triarc Companies, Inc. (a) 125,000 $ 3,280,000
Schedule of Investments—December 31, 2002 (Unaudited)
Name Shares Held Market Value
T H E O A K M A R K S M A L L C A P F U N D
T H E O A K M A R K S M A L L C A P F U N D16

Common Stocks—95.3% (cont.)
Retail—2.5%ShopKo Stores, Inc. (a) 740,000 $ 9,213,000
Bank & Thrifts—6.2%BankAtlantic Bancorp, Inc., Class A 1,000,000 $ 9,450,000People’s Bank of Bridgeport, Connecticut 360,000 9,050,400PennFed Financial Services, Inc. 150,000 4,072,500
22,572,900Insurance—3.3%
The PMI Group, Inc. 400,000 $ 12,016,000
Other Financial—2.6%NCO Group, Inc. (a) 600,000 $ 9,570,000
Real Estate—4.8%Catellus Development Corporation (a) 650,000 $ 12,902,500Trammell Crow Company (a) 495,000 4,455,000
17,357,500Medical Products—6.6%
Hanger Orthopedic Group, Inc. (a) 950,000 $ 12,492,500CONMED Corporation (a) 350,000 6,856,500Sybron Dental Specialties, Inc. (a) 300,000 4,455,000
23,804,000Pharmaceuticals—3.6%
Pharmaceutical Resources Inc (a) 424,300 $ 12,644,140Elan Corporation plc (a)(c) 115,000 282,900
12,927,040Computer Services—2.8%
CIBER, Inc. (a) 1,805,000 $ 9,295,750Interland, Inc. (a) 600,000 780,000
10,075,750Computer Software—6.9%
Sybase Inc (a) 800,000 $ 10,720,000MSC.Software Corp. (a) 1,272,100 9,820,612Mentor Graphics Corporation (a) 587,000 4,613,820
25,154,432Computer Systems—1.3%
Optimal Robotics Corp., Class A (a)(d) 763,500 $ 4,581,000
Data Storage—1.8%Imation Corp. (a) 182,000 $ 6,384,560
Schedule of Investments—December 31, 2002 (Unaudited) cont.
Name Shares Held Market Value
T H E O A K M A R K S M A L L C A P F U N D
T H E O A K M A R K S M A L L C A P F U N D 17

Common Stocks—95.3% (cont.)
Office Equipment—3.2%InFocus Corporation (a) 1,000,000 $ 6,160,000MCSi, Inc. (a) 1,125,000 5,343,750
11,503,750Instruments—0.3%
Measurement Specialties, Inc. (a) 550,000 $ 1,155,000
Machinery & Industrial Processing—4.7%SureBeam Corporation, Class A (a) 4,000,000 $ 16,160,000Columbus McKinnon Corporation (a) 254,800 973,591
17,133,591Other Industrial Goods & Services—0.7%
Integrated Electrical Services, Inc. (a) 650,000 $ 2,502,500
Chemicals—1.0%H.B. Fuller Company 140,000 $ 3,623,200
Oil & Natural Gas—5.3%St. Mary Land & Exploration Company 350,000 $ 8,750,000Cabot Oil & Gas Corporation 250,000 6,195,000Berry Petroleum Company 250,000 4,262,500
19,207,500
Total Common Stocks (Cost: $377,510,896) 346,062,170
Short Term Investments—5.3%
U.S. Government Bills—2.8%United States Treasury Bills, 1.08% - 1.155% $10,000,000 $ 9,998,640
due 1/2/2003 - 1/9/2003
Total U.S. Government Bills (Cost: $9,998,640) 9,998,640
Repurchase Agreements—2.5%IBT Repurchase Agreement, 1.00% due 1/2/2003,
repurchase price $8,000,444 collateralized by U.S. Government Agency Securities $ 8,000,000 $ 8,000,000
IBT Repurchase Agreement, 1.00% due 1/2/2003, repurchase price $1,234,236 collateralized by a U.S. Government Agency Security 1,234,167 1,234,167
Total Repurchase Agreement (Cost: $9,234,167) 9,234,167
Total Short Term Investments (Cost: $19,232,807) 19,232,807
Total Investments (Cost $396,743,703)—100.6% $ 365,294,977
Schedule of Investments—December 31, 2002 (Unaudited) cont.
Shares Held/Name Par Value Market Value
T H E O A K M A R K S M A L L C A P F U N D
T H E O A K M A R K S M A L L C A P F U N D18
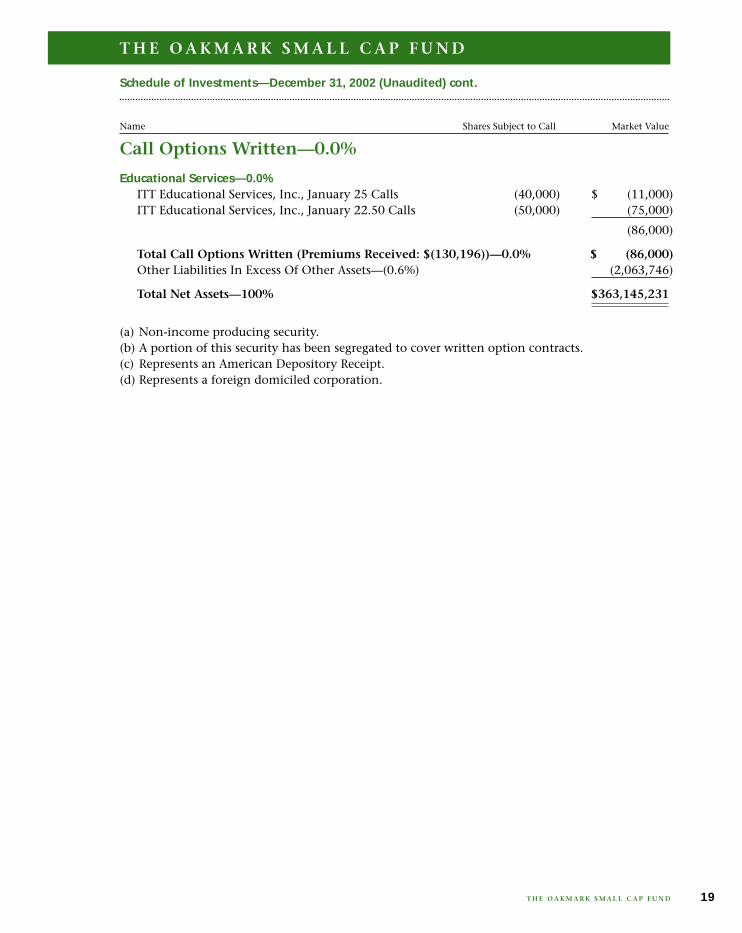
Call Options Written—0.0%
Educational Services—0.0%ITT Educational Services, Inc., January 25 Calls (40,000) $ (11,000)ITT Educational Services, Inc., January 22.50 Calls (50,000) (75,000)
(86,000)
Total Call Options Written (Premiums Received: $(130,196))—0.0% $ (86,000)Other Liabilities In Excess Of Other Assets—(0.6%) (2,063,746)
Total Net Assets—100% $363,145,231
(a) Non-income producing security.(b) A portion of this security has been segregated to cover written option contracts.(c) Represents an American Depository Receipt.(d) Represents a foreign domiciled corporation.
Schedule of Investments—December 31, 2002 (Unaudited) cont.
Name Shares Subject to Call Market Value
T H E O A K M A R K S M A L L C A P F U N D
T H E O A K M A R K S M A L L C A P F U N D 19
Report from Clyde S. McGregor and Edward A. Studzinski, Portfolio Managers
THE OAKMARK EQUITY AND INCOME FUND
THE VALUE OF A $10,000 INVESTMENT IN THE OAKMARK EQUITY AND INCOME FUND FROM ITSINCEPTION (11/1/95) TO PRESENT (12/31/02) AS COMPARED TO THE LIPPER BALANCED FUND INDEX17
10/95
$12,000
$14,000
$28,000
The OakmarkEquity andIncomeFund$25,087
LipperBalancedFund Index$15,807
12/01
$10,000
$18,000
$20,000
$16,000
$22,000
$24,000
12/9912/96 12/97 12/98
$26,000
12/00 12/0212/95
20 T H E O A K M A R K E Q U I T Y A N D I N C O M E F U N D
“The fixity of a habit is generally in direct pro-portion to its absurdity.”
Proust
Our Results
The Oakmark Equity and Income Fund increased6% for the quarter ended December 31, bringingthe calendar year loss to 2%. For the calendaryear 2002, the Fund outperformed both the mar-ket averages and our primary benchmark, theLipper Balanced Fund Index, which lost 11%during the year. Suffice it to say that we are notpleased with this result. We appreciate all toowell that it is absolute positive returns that pre-serve and grow your capital. Over time we haveachieved that growth and compounding of cap-ital for our long-term investors. Rest assured thatit remains our goal and primary focus for bothyou and ourselves.
Enough Misery To Go Around
Not too long ago, Queen Elizabeth II of GreatBritain, in her annual address, spoke about theprior year having been an “annus horribilis” orterrible year. In retrospect, it certainly was thatfor the markets. Last year was the worst year forstock mutual funds since 1974. If you were look-ing for a place to hide, they were few and farbetween. The New York Times fourth quarterMutual Funds Report cites statistics from Morn-ingstar showing only two fund groups, real estateand gold funds, had positive returns for the year.The New York Times also cites information fromLipper indicating that more than 96% of equityfunds finished the year in the red. According toMorgan Stanley research, seventy-five per cent ofall stocks in the S&P 500 Index declined in 2002,every single sector in the S&P 500 declined forthe year, and style (value or growth) or marketcapitalization (large or small) made no differencein terms of carnage.
A great deal of time, effort, and newsprint is nowbeing devoted to trying to identify the culprits toblame for this watershed year of investment deba-cles. The “usual suspects” now include greedymanagements fixated on short-term returns,investment bankers and their in-house analysts,the accounting profession, overworked andunderstaffed regulatory bodies, and governmen-tal leaders in both the legislative and executivebranches who were more than willing to acceptthe largesse flowing into their political actioncommittees from any source when the bulls wererunning through Main Street U.S.A.
Average Annual Total Returns5
(as of 12/31/02)
Total Return 1-year 5-year SinceLast 3 Months* Inception
(11/1/95)
Oakmark Equity and 6.12% -2.14% 10.91% 13.68%Income FundS&P 500
28.44% -22.10% -0.59% 7.63%
Lehman Govt./ 1.73% 11.04% 7.61% 7.52%Corp. Bond
18
Lipper Balanced 5.47% -10.69% 2.10% 6.59%Fund Index
The graph and table do not reflect the deduction of taxes that a shareholder would payon fund distributions or the redemption of fund shares.
Past performance is no guarantee of future results. Investment return andprincipal value vary, and you may have a gain or loss when you sell shares. Averageannual total return measures annualized change, while total return measures aggregatechange.
* Not annualized

We would like to suggest something radical. In our ownway all of us share some culpability for letting unreason-able expectations and an unwillingness to confront thereality of the history of long-term returns from stocks,bonds, and bills in this country blind us to where we werein investment time (or as Pogo would put it, “We havemet the enemy and he is us”). Specifically, five consecu-tive years of returns in the stock market in this country inexcess of 19% led people to expect this as the “new”norm, rather than focus on the fact that each successiveyear was another statistical outlier more than two stan-dard deviations beyond the historic norm. Thus whenregression to the mean began, it was first met with disbe-lief and ultimately shell-shock.
We again refer you to the excellent data compiled by Pro-fessor Ibbotson and Ibbotson Associates that describes indetail long-term returns from various asset classes in thiscountry. What we suggest you will find is that long-termreturns on stocks, excluding inflation, probably fall in arange of from 7 to 10% on average. A typical balancedfund with a 60% equity/40% fixed-income allocation,again excluding inflation, will probably show an averagereturn of from 6 to 8%. When returns fall outside thosebands, the causes of such deviation should be examined.
Will Godot Ever Show Up?
There is a scene in Beckett’s “Waiting for Godot” whereone of the characters, almost in despair, laments, “Noth-ing ever changes. Everything is always the same.” We haveto confess that we worry on occasion that many of youwill get bored with a certain sameness in these reports, aswe relate what we are doing and what if anything we aredoing differently. In some respects it would certainly beeasier to write these reports if we paid a great deal of atten-tion to macroeconomic forecasting and grand themes (wedon’t), for then we could regale you with charts, graphs,interesting bits of gossip, and many of the other everydayfacets of what passes for the investment research processat some firms. Well, nothing has changed. We remainfocused on selecting individual stocks to invest in whichideally we would like to buy at 60% of our assessment ofintrinsic value, where the business value is growing andthe managements actually think and act like shareholdersand stewards of capital. And if we ever tell you that some-thing has changed in terms of philosophy or implemen-tation, you should question us on it.
In practical terms, during the quarter we initiated posi-tions in Concord EFS Inc., Laboratory Corporation ofAmerica, Omnicare, Inc., and Textron when these busi-nesses were available, however briefly, at prices that metour criteria. In particular, one business which met our cri-teria and which we were able to purchase was LaboratoryCorporation of America, the #2 independent medical labtesting company in the country. The quality and compet-itive position of the business had already begun to
intrigue us when it suddenly became available at a veryattractive price when the market reacted to an earnings short-fall pre-announcement and the stock sold off more than40%. The business should benefit over time from continuedoutsourcing and as consolidation in the industry allow thelarger companies to bring to bear the benefits of scale.
Also of benefit, will be the demographics of an aging pop-ulation—we do tend to be tested more as we get older.And, the number and type of tests will increase as geneticdiscoveries revolutionize medical science with new non-invasive diagnostic tests replacing or supplementing pre-viously invasive (and with some degree of risk) proceduresfor detecting diseases such as colon and other types ofcancer. Finally, this is a business with certain barriers toentry given the Laboratory Corporation’s huge numberof contractual managed care relationships in place.
We would also like to discuss briefly the sale of oneinvestment, namely our holding in Legacy Hotel REIT.Legacy is a Canadian hotel real estate investment trustwhose primary assets are the former Canadian Pacificurban hotels in Canada. Many of those hotels are uniquein both history and setting, and they have been wellmaintained over time. In many Canadian cities such asToronto there are effective competitive barriers to entryin the form of taxes, zoning, and a lack of available land.Post-September 11th, we had the opportunity to take aposition in the company at an attractive price relative tobusiness value. Since that time both Canada’s hotels ingeneral and Legacy’s portfolio in particular, had statisti-cally outperformed the American competition in terms ofoccupancy and REVPAR (revenue per available room)growth. Legacy was also in the position of having firstright of refusal to acquire other Canadian Pacific hoteland resort assets if they were to be sold. We were pleasedwhen they exercised those rights, acquiring irreplaceableassets such as The Empress Hotel in Victoria, BC and Le
• Seventy-five percent of all stocks in the S&P 500declined in 2002; the carnage caught everymarket sector, investment style, and marketcapitalization.
• During the quarter we initiated new positions infive companies, including LaboratoryCorporation of America, the #2 independentmedical lab testing company.
• We will sell holdings if they violate our coreinvestment tenets; one such sale this pastquarter was the result of our assessment ofmanagement’s shareholder orientation.
21T H E O A K M A R K E Q U I T Y A N D I N C O M E F U N D
Highlights
Chateau Frontenac in Quebec City, Quebec. We were alsoenthusiastic when Legacy indicated it was considering atsome point in the future the acquisition of another irre-placeable asset, namely Le Chateau Whistler. While thiswas a small position relative to the overall portfolio, thecompetitive position of the properties, the growing busi-ness value, and management’s apparent shareholderfocus all met our investment criteria. All of that changedin the last quarter when management (which is also themanagement of Fairmont Hotels) announced their firstacquisition of a U.S. property in Washington, DC. One,we (and many other shareholders) found the price beingpaid to be excessive, especially as management seemed tobe overly optimistic about the dilution entailed and thecompetitive potential of the property. Two, it changedthe basic nature of the investment. Three, it appeared tous that management was not acting in the best interest ofLegacy’s shareholders. Accordingly, after considering ouroptions, we exited our position at a small loss. We will dothe same thing, whenever our assessment of manage-ment’s shareholder orientation proves to be incorrect asindicated by both action, explanation, and our inde-pendent assessment of same.
The Future
One of Mark Twain’s more entertaining essays was aboutthe variability and unpredictability of the weather in NewEngland. We feel the same way about the markets. Thegood news is that recognizing that neither we (nor anyoneelse that we know of) have any special skill in this regard,we don’t devote any time to it, preferring to continue oursearch for business values that meet our investment crite-ria. Rest assured that still is the primary focus of our dailyactivities (and we also tremendously enjoy doing it). Weare grateful to you, our shareholders and partners, forentrusting us with your capital to manage and your patience.
Clyde S. McGregor, CFA Edward A. Studzinski, CFAPortfolio Manager Portfolio [email protected] [email protected]
January 6, 2003
22 T H E O A K M A R K E Q U I T Y A N D I N C O M E F U N D
Equity and Equivalents—57.2%
Common Stocks—56.7%
Food & Beverage—0.1%UST Inc. (a) 100,000 $ 3,343,000
Broadcasting & Publishing—0.8%Gemstar-TV Guide International Inc. (a) 7,000,000 $ 22,750,000
Cable Systems & Satellite TV—1.7%General Motors Corporation, Class H
(Hughes Electronics Corporation) (a) 4,392,300 $ 46,997,610
Information Services—2.3%Ceridian Corporation (a) 4,294,600 $ 61,928,132
Marketing Services—1.0%The Interpublic Group of Companies, Inc. 2,050,000 $ 28,864,000
Recreation & Entertainment—0.9%International Game Technology (a) 345,000 $ 26,192,400
Retail—4.4%J.C. Penney Company, Inc. 2,200,000 $ 50,622,000BJ’s Wholesale Club, Inc. (a) 2,275,000 41,632,500Office Depot, Inc. (a) 1,980,000 29,224,800
121,479,300Insurance—3.0%
SAFECO Corporation 2,200,000 $ 76,274,000RenaissanceRe Holdings Ltd. (b) 150,000 5,940,000PartnerRe, Ltd. (b) 25,000 1,295,500
83,509,500Other Financial—0.9%
GATX Corporation 1,050,000 $ 23,961,000
Real Estate—1.7%Catellus Development Corporation (a) 2,031,500 $ 40,325,275Hospitality Properties Trust 200,000 7,040,000
47,365,275Health Care Services—2.4%
Caremark Rx, Inc. (a) 2,795,300 $ 45,423,625IMS Health Incorporated 1,050,000 16,800,000Omnicare, Inc. 125,000 2,978,750
65,202,375
Schedule of Investments—December 31, 2002 (Unaudited)
Name Shares Held Market Value
T H E O A K M A R K E Q U I T Y A N D I N C O M E F U N D
T H E O A K M A R K E Q U I T Y A N D I N C O M E F U N D 23
Equity and Equivalents—57.2% (cont.)
Managed Care Services—2.7%First Health Group Corp. (a) 3,000,000 $ 73,050,000
Medical Centers—2.9%Laboratory Corporation of America Holdings (a) 3,400,000 $ 79,016,000
Medical Products—4.1%Guidant Corporation (a) 1,750,000 $ 53,987,500Apogent Technologies Inc. (a) 1,750,000 36,400,000Techne Corporation (a) 525,000 14,998,200Edwards Lifesciences Corporation (a) 275,000 7,004,250
112,389,950Pharmaceuticals—2.3%
Watson Pharmaceuticals, Inc. (a) 2,225,000 $ 62,900,750
Computer Services—0.4%Concord EFS, Inc. (a) 647,900 $ 10,197,946
Computer Software—5.0%Synopsys, Inc. (a)(c) 2,000,000 $ 92,300,000Novell, Inc. (a) 8,000,000 26,720,000Mentor Graphics Corporation (a) 2,500,000 19,650,000
138,670,000Computer Systems—1.1%
The Reynolds and Reynolds Company, Class A 1,164,000 $ 29,647,080
Aerospace & Defense—3.4%Honeywell International, Inc. 2,100,000 $ 50,400,000Rockwell Collins, Inc. 1,882,900 43,796,254
94,196,254Agricultural Equipment—0.1%
Alamo Group Inc. 141,900 $ 1,738,275
Diversified Conglomerates—0.3%Textron, Inc. 215,000 $ 9,242,850
Instruments—1.7%Varian Inc. (a) 1,599,400 $ 45,886,786
Schedule of Investments—December 31, 2002 (Unaudited) cont.
Name Shares Held Market Value
T H E O A K M A R K E Q U I T Y A N D I N C O M E F U N D
T H E O A K M A R K E Q U I T Y A N D I N C O M E F U N D24

Equity and Equivalents—57.2% (cont.)
Machinery & Industrial Processing—2.9%Rockwell Automation International Corporation 2,075,000 $ 42,973,250Cooper Industries, Ltd. 1,000,000 36,450,000
79,423,250Transportation Services—0.1%
Nordic American Tanker Shipping Limited (b) 154,900 $ 2,097,346
Agricultural Operations—2.4%Monsanto Company 3,500,000 $ 67,375,000
Forestry Products—2.0%Plum Creek Timber Company, Inc. 2,309,644 $ 54,507,598
Oil & Natural Gas—6.1%Burlington Resources Inc. 2,000,000 $ 85,300,000XTO Energy, Inc. 1,528,000 37,741,600St. Mary Land & Exploration Company 1,044,300 26,107,500Cabot Oil & Gas Corporation 750,000 18,585,000
167,734,100
Total Common Stocks (Cost: $1,519,431,772) 1,559,665,777
Convertible Bonds—0.5%
Cable Systems & Satellite TV—0.5%EchoStar Communications Corporation,
4.875% due 1/1/2007 $15,000,000 $ 13,293,750
Total Convertible Bonds (Cost: $12,326,085) 13,293,750
Total Equity And Equivalents (Cost: $1,531,757,857) 1,572,959,527
Fixed Income—36.3%
Preferred Stocks—0.1%
Bank & Thrifts—0.1%Pennfed Capital Trust, Preferred, 8.90% 27,500 $ 694,100BBC Capital Trust I, Preferred, 9.50% 19,964 501,895Fidelity Capital Trust I, Preferred, 8.375% 43,500 436,305
1,632,300Telecommunications—0.0%
MediaOne Finance Trust III, Preferred, 9.04% 20,000 $ 494,000
Total Preferred Stocks (Cost: $2,048,387) 2,126,300
Schedule of Investments—December 31, 2002 (Unaudited) cont.
Shares Held/Name Par Value Market Value
T H E O A K M A R K E Q U I T Y A N D I N C O M E F U N D
T H E O A K M A R K E Q U I T Y A N D I N C O M E F U N D 25
Fixed Income—36.3% (cont.)
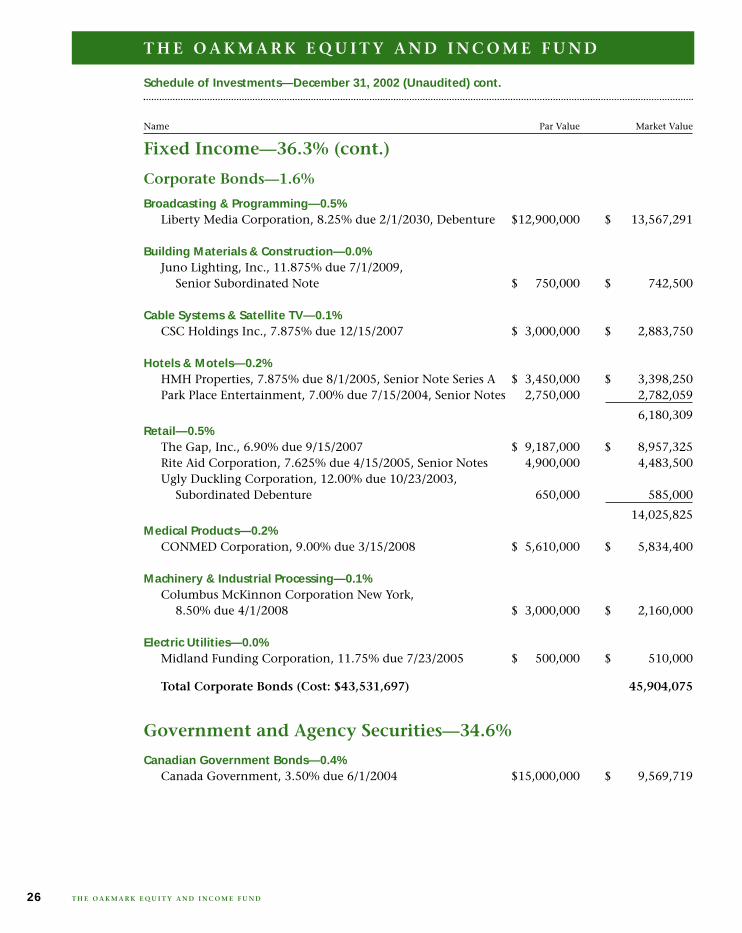
Corporate Bonds—1.6%
Broadcasting & Programming—0.5%Liberty Media Corporation, 8.25% due 2/1/2030, Debenture $12,900,000 $ 13,567,291
Building Materials & Construction—0.0%Juno Lighting, Inc., 11.875% due 7/1/2009,
Senior Subordinated Note $ 750,000 $ 742,500
Cable Systems & Satellite TV—0.1%CSC Holdings Inc., 7.875% due 12/15/2007 $ 3,000,000 $ 2,883,750
Hotels & Motels—0.2%HMH Properties, 7.875% due 8/1/2005, Senior Note Series A $ 3,450,000 $ 3,398,250Park Place Entertainment, 7.00% due 7/15/2004, Senior Notes 2,750,000 2,782,059
6,180,309Retail—0.5%
The Gap, Inc., 6.90% due 9/15/2007 $ 9,187,000 $ 8,957,325Rite Aid Corporation, 7.625% due 4/15/2005, Senior Notes 4,900,000 4,483,500Ugly Duckling Corporation, 12.00% due 10/23/2003,
Subordinated Debenture 650,000 585,000
14,025,825Medical Products—0.2%
CONMED Corporation, 9.00% due 3/15/2008 $ 5,610,000 $ 5,834,400
Machinery & Industrial Processing—0.1%Columbus McKinnon Corporation New York,
8.50% due 4/1/2008 $ 3,000,000 $ 2,160,000
Electric Utilities—0.0%Midland Funding Corporation, 11.75% due 7/23/2005 $ 500,000 $ 510,000
Total Corporate Bonds (Cost: $43,531,697) 45,904,075
Government and Agency Securities—34.6%
Canadian Government Bonds—0.4%Canada Government, 3.50% due 6/1/2004 $15,000,000 $ 9,569,719
Schedule of Investments—December 31, 2002 (Unaudited) cont.
Name Par Value Market Value
T H E O A K M A R K E Q U I T Y A N D I N C O M E F U N D
T H E O A K M A R K E Q U I T Y A N D I N C O M E F U N D26
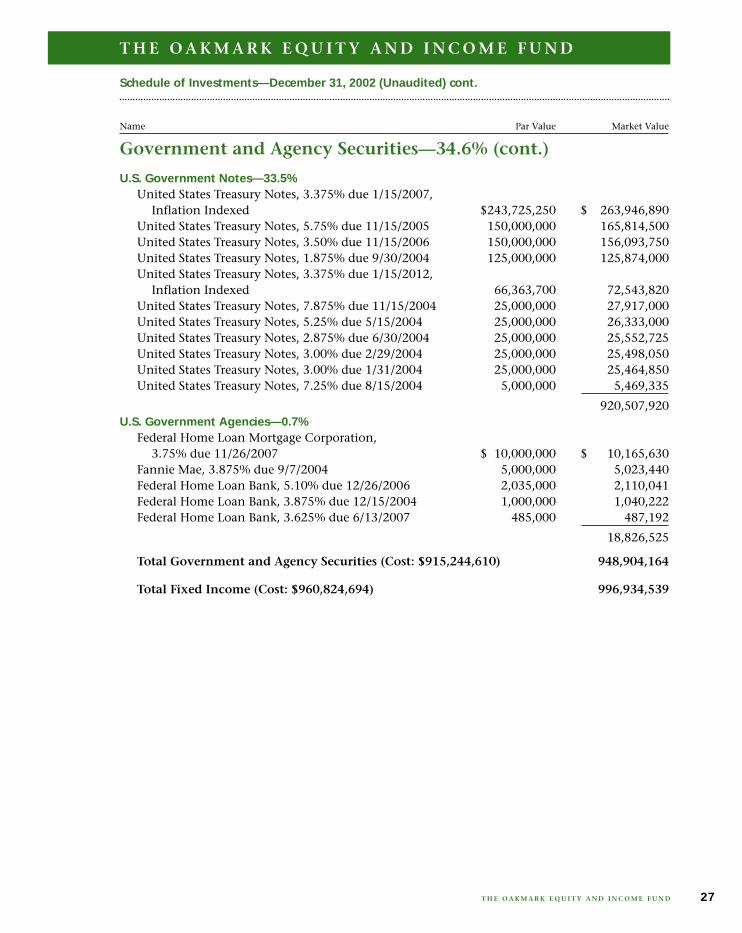
Government and Agency Securities—34.6% (cont.)
U.S. Government Notes—33.5%United States Treasury Notes, 3.375% due 1/15/2007,
Inflation Indexed $243,725,250 $ 263,946,890United States Treasury Notes, 5.75% due 11/15/2005 150,000,000 165,814,500United States Treasury Notes, 3.50% due 11/15/2006 150,000,000 156,093,750United States Treasury Notes, 1.875% due 9/30/2004 125,000,000 125,874,000United States Treasury Notes, 3.375% due 1/15/2012,
Inflation Indexed 66,363,700 72,543,820United States Treasury Notes, 7.875% due 11/15/2004 25,000,000 27,917,000United States Treasury Notes, 5.25% due 5/15/2004 25,000,000 26,333,000United States Treasury Notes, 2.875% due 6/30/2004 25,000,000 25,552,725United States Treasury Notes, 3.00% due 2/29/2004 25,000,000 25,498,050United States Treasury Notes, 3.00% due 1/31/2004 25,000,000 25,464,850United States Treasury Notes, 7.25% due 8/15/2004 5,000,000 5,469,335
920,507,920U.S. Government Agencies—0.7%
Federal Home Loan Mortgage Corporation, 3.75% due 11/26/2007 $ 10,000,000 $ 10,165,630
Fannie Mae, 3.875% due 9/7/2004 5,000,000 5,023,440Federal Home Loan Bank, 5.10% due 12/26/2006 2,035,000 2,110,041Federal Home Loan Bank, 3.875% due 12/15/2004 1,000,000 1,040,222Federal Home Loan Bank, 3.625% due 6/13/2007 485,000 487,192
18,826,525
Total Government and Agency Securities (Cost: $915,244,610) 948,904,164
Total Fixed Income (Cost: $960,824,694) 996,934,539
Schedule of Investments—December 31, 2002 (Unaudited) cont.
Name Par Value Market Value
T H E O A K M A R K E Q U I T Y A N D I N C O M E F U N D
T H E O A K M A R K E Q U I T Y A N D I N C O M E F U N D 27
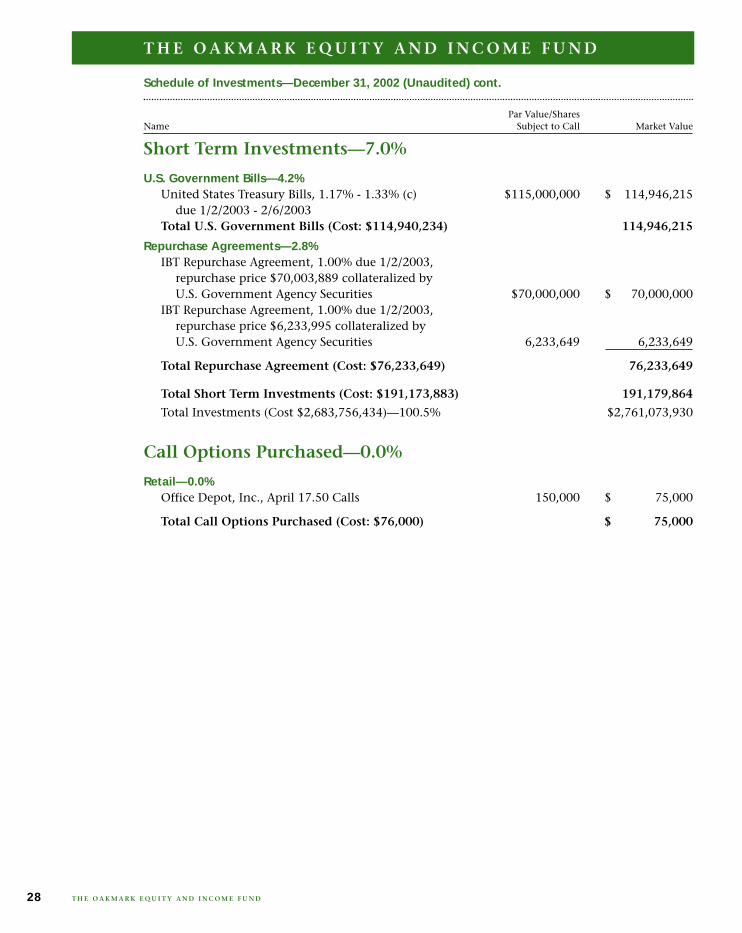
Short Term Investments—7.0%
U.S. Government Bills—4.2%United States Treasury Bills, 1.17% - 1.33% (c) $115,000,000 $ 114,946,215
due 1/2/2003 - 2/6/2003Total U.S. Government Bills (Cost: $114,940,234) 114,946,215
Repurchase Agreements—2.8%IBT Repurchase Agreement, 1.00% due 1/2/2003,
repurchase price $70,003,889 collateralized by U.S. Government Agency Securities $70,000,000 $ 70,000,000
IBT Repurchase Agreement, 1.00% due 1/2/2003, repurchase price $6,233,995 collateralized by U.S. Government Agency Securities 6,233,649 6,233,649
Total Repurchase Agreement (Cost: $76,233,649) 76,233,649
Total Short Term Investments (Cost: $191,173,883) 191,179,864
Total Investments (Cost $2,683,756,434)—100.5% $2,761,073,930
Call Options Purchased—0.0%
Retail—0.0%Office Depot, Inc., April 17.50 Calls 150,000 $ 75,000
Total Call Options Purchased (Cost: $76,000) $ 75,000
Schedule of Investments—December 31, 2002 (Unaudited) cont.
Par Value/SharesName Subject to Call Market Value
T H E O A K M A R K E Q U I T Y A N D I N C O M E F U N D
T H E O A K M A R K E Q U I T Y A N D I N C O M E F U N D28
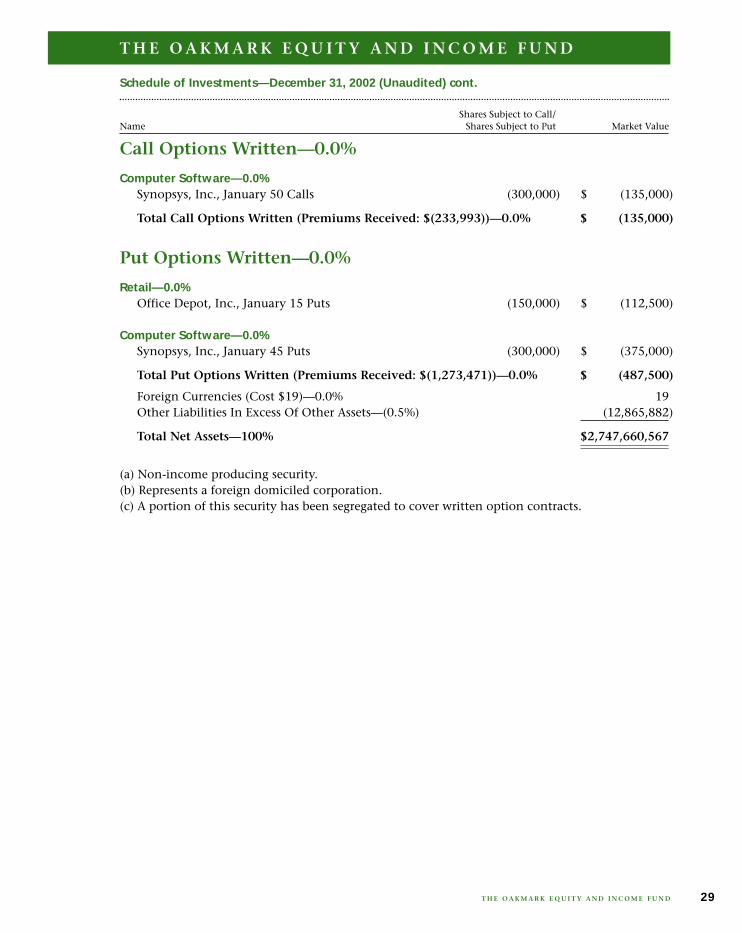
Call Options Written—0.0%
Computer Software—0.0%Synopsys, Inc., January 50 Calls (300,000) $ (135,000)
Total Call Options Written (Premiums Received: $(233,993))—0.0% $ (135,000)
Put Options Written—0.0%
Retail—0.0%Office Depot, Inc., January 15 Puts (150,000) $ (112,500)
Computer Software—0.0%Synopsys, Inc., January 45 Puts (300,000) $ (375,000)
Total Put Options Written (Premiums Received: $(1,273,471))—0.0% $ (487,500)
Foreign Currencies (Cost $19)—0.0% 19Other Liabilities In Excess Of Other Assets—(0.5%) (12,865,882)
Total Net Assets—100% $2,747,660,567
(a) Non-income producing security.(b) Represents a foreign domiciled corporation.(c) A portion of this security has been segregated to cover written option contracts.
Schedule of Investments—December 31, 2002 (Unaudited) cont.
Shares Subject to Call/Name Shares Subject to Put Market Value
T H E O A K M A R K E Q U I T Y A N D I N C O M E F U N D
T H E O A K M A R K E Q U I T Y A N D I N C O M E F U N D 29
T H E O A K M A R K G L O B A L F U N D
Fellow Shareholders,The Oakmark Global Fund had a strong quarter,gaining 15% for the three-month period endingDecember 31, 2002. This quarter’s results comparefavorably with the 8% increase for the MSCIWorld Index and the 6% increase for the LipperGlobal Fund Index.For the calendar year 2002, The Oakmark GlobalFund lost 2%, compared to the significant declinesof 20% and 19% for the MSCI World Index andthe Lipper Global Fund Index, respectively. Mostimportantly, since inception the Fund hasreturned 9% annualized compared to sizabledeclines in the above indices.
Another Interesting YearThis has been a very volatile year—has there beenany other kind since the Fund’s inception? Thisyear saw wild share price swings around the globe:the US market hit lows not seen since 1996, theGerman and UK markets retreated to mid 1990’slevels, and Japan, almost inconceivably, hit evenlower lows with the Nikkei21 retreating to levelsnot seen since the early 1980’s.Investor panic reached a crescendo this Septem-ber, when underlying business performancebecame completely irrelevant to share price per-formance. A number of our holdings which werenegatively impacted rebounded strongly in theFourth Quarter, most importantly Ericsson,Vivendi Universal, and Novell.During trying times its often heartening toremember a very positive attribute of volatile mar-kets and wild swings in investor sentiment: oppor-tunity. Greater volatility usually creates greatergaps between share prices and underlying busi-ness value. Long-term investors, in short, shouldwelcome short-term volatile markets for the betteropportunity they create.Where are we finding the most interesting oppor-tunities? We have found a group of investments,formerly classified as “growth” stocks, that wethink represent tremendous value. Many are blue-chip names we traditionally have not ownedbecause the market values them so highly. Thesestocks include Vivendi Universal (France), LMEricsson (Sweden), Grupo Televisa (Mexico), GlaxoSmithKline (UK), Liberty Media, First DataCorporation and Interpublic Group (all US-based).These holdings help illustrate our belief that thereare not two separate and distinct buckets ofgrowth stocks and value stocks—any companywith a superior growth rate can be a value stockgiven the right price.
Significant PerformersFor the second straight year, ITT Educational wasthe single biggest positive contributor to theFund’s NAV.22 As a reminder we have owned ITT
Report from Gregory L. Jackson and Michael J. Welsh, Portfolio Managers
THE OAKMARK GLOBAL FUND
THE VALUE OF A $10,000 INVESTMENT IN THEOAKMARK GLOBAL FUND FROM ITS INCEPTION(8/4/99) TO PRESENT (12/31/02) AS COMPARED TOTHE MSCI WORLD INDEX19
Average Annual Total Returns5
(as of 12/31/02)
Total Return 1-year 3-year SinceLast 3 Months* Inception
(8/4/99)
Oakmark Global Fund 14.87% -2.11% 10.82% 9.40%7
MSCI World 7.64% -19.89% -16.66% -11.13%
Lipper Global Fund Index20
6.05% -18.65% -14.40% -7.54%
The graph and table do not reflect the deduction of taxes that a shareholder would payon fund distributions or the redemption of fund shares.
Past performance is no guarantee of future results. Investment return andprincipal value vary, and you may have a gain or loss when you sell shares. Averageannual total return measures annualized change, while total return measures aggregatechange.
* Not annualized
8/99
$8,000
$9,000
$11,000
$13,000
$16,000
The OakmarkGlobal Fund$13,587
MSCI WorldIndex$6,678
9/9912/99 3/00 6/00 9/00 12/00 3/01 9/01
$6,000
$15,000
6/01 6/02
$10,000
$12,000
$14,000
12/01 12/029/02
$7,000
3/02
30
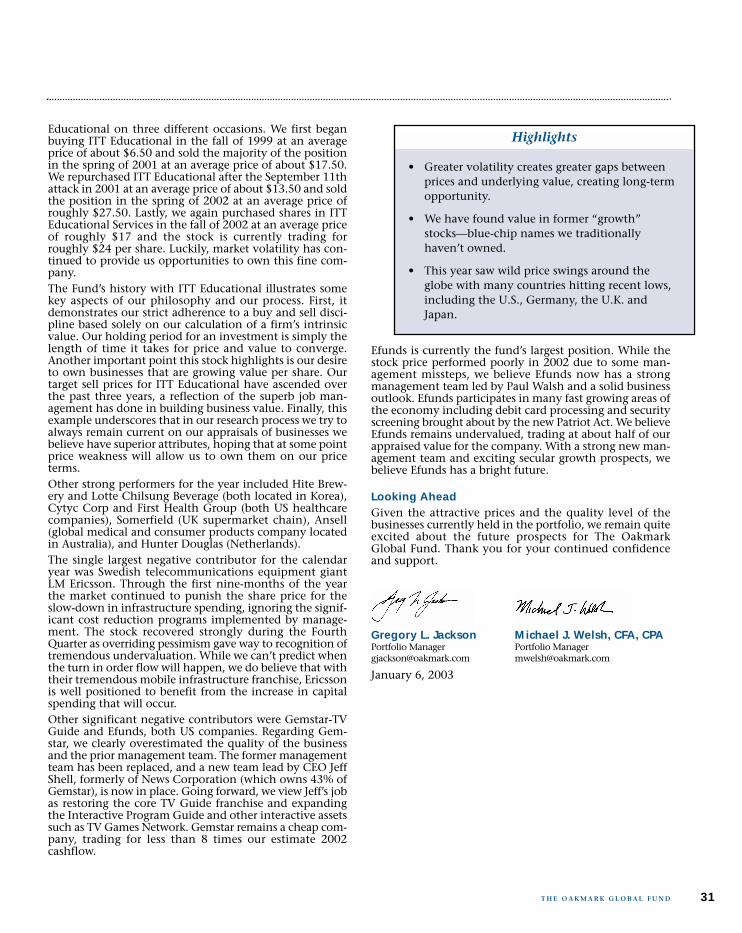
Educational on three different occasions. We first beganbuying ITT Educational in the fall of 1999 at an averageprice of about $6.50 and sold the majority of the positionin the spring of 2001 at an average price of about $17.50.We repurchased ITT Educational after the September 11thattack in 2001 at an average price of about $13.50 and soldthe position in the spring of 2002 at an average price ofroughly $27.50. Lastly, we again purchased shares in ITTEducational Services in the fall of 2002 at an average priceof roughly $17 and the stock is currently trading forroughly $24 per share. Luckily, market volatility has con-tinued to provide us opportunities to own this fine com-pany.The Fund’s history with ITT Educational illustrates somekey aspects of our philosophy and our process. First, itdemonstrates our strict adherence to a buy and sell disci-pline based solely on our calculation of a firm’s intrinsicvalue. Our holding period for an investment is simply thelength of time it takes for price and value to converge.Another important point this stock highlights is our desireto own businesses that are growing value per share. Ourtarget sell prices for ITT Educational have ascended overthe past three years, a reflection of the superb job man-agement has done in building business value. Finally, thisexample underscores that in our research process we try toalways remain current on our appraisals of businesses webelieve have superior attributes, hoping that at some pointprice weakness will allow us to own them on our priceterms.Other strong performers for the year included Hite Brew-ery and Lotte Chilsung Beverage (both located in Korea),Cytyc Corp and First Health Group (both US healthcarecompanies), Somerfield (UK supermarket chain), Ansell(global medical and consumer products company locatedin Australia), and Hunter Douglas (Netherlands).The single largest negative contributor for the calendaryear was Swedish telecommunications equipment giantLM Ericsson. Through the first nine-months of the yearthe market continued to punish the share price for theslow-down in infrastructure spending, ignoring the signif-icant cost reduction programs implemented by manage-ment. The stock recovered strongly during the FourthQuarter as overriding pessimism gave way to recognition oftremendous undervaluation. While we can’t predict whenthe turn in order flow will happen, we do believe that withtheir tremendous mobile infrastructure franchise, Ericssonis well positioned to benefit from the increase in capitalspending that will occur.Other significant negative contributors were Gemstar-TVGuide and Efunds, both US companies. Regarding Gem-star, we clearly overestimated the quality of the businessand the prior management team. The former managementteam has been replaced, and a new team lead by CEO JeffShell, formerly of News Corporation (which owns 43% ofGemstar), is now in place. Going forward, we view Jeff’s jobas restoring the core TV Guide franchise and expandingthe Interactive Program Guide and other interactive assetssuch as TV Games Network. Gemstar remains a cheap com-pany, trading for less than 8 times our estimate 2002cashflow.
Efunds is currently the fund’s largest position. While thestock price performed poorly in 2002 due to some man-agement missteps, we believe Efunds now has a strongmanagement team led by Paul Walsh and a solid businessoutlook. Efunds participates in many fast growing areas ofthe economy including debit card processing and securityscreening brought about by the new Patriot Act. We believeEfunds remains undervalued, trading at about half of ourappraised value for the company. With a strong new man-agement team and exciting secular growth prospects, webelieve Efunds has a bright future.
Looking AheadGiven the attractive prices and the quality level of thebusinesses currently held in the portfolio, we remain quiteexcited about the future prospects for The OakmarkGlobal Fund. Thank you for your continued confidenceand support.
Gregory L. Jackson Michael J. Welsh, CFA, CPAPortfolio Manager Portfolio [email protected] [email protected]
January 6, 2003
T H E O A K M A R K G L O B A L F U N D 31
Highlights
• Greater volatility creates greater gaps betweenprices and underlying value, creating long-termopportunity.
• We have found value in former “growth”stocks—blue-chip names we traditionallyhaven’t owned.
• This year saw wild price swings around theglobe with many countries hitting recent lows,including the U.S., Germany, the U.K. andJapan.

32 T H E O A K M A R K G L O B A L F U N D
Global Diversification—December 31, 2002 (Unaudited)
Pacific Rim 9.1%Japan 6.1%Australia 1.9%Korea 1.1%
Latin America 5.1%Mexico 5.1%
Other 1.5%Israel 1.5%
% of Fund EquityMarket Value
* Euro currency countries comprise 19.7% of the Fund.
% of Fund Equity Market Value
United States 46.5%
Europe 37.8% Great Britain 11.3%* Italy 7.0%* France 5.6%* Netherlands 4.4% Switzerland 3.6% Sweden 3.2%* Germany 2.7%
Latin America
Pacific Rim
Other
United States
Europe
T H E O A K M A R K G L O B A L F U N D

T H E O A K M A R K G L O B A L F U N D
Common Stocks—90.7%
Food & Beverage—3.4%Diageo plc (Great Britain) Beverages, Wines, & Spirits
Manufacturer 518,900 $ 5,637,745Lotte Chilsung Beverage
Co., Ltd. (Korea) Soft Drinks, Juices & Sports Drinks Manufacturer 4,800 2,266,346
7,904,091
Household Products—2.5%Henkel KGaA (Germany) Consumer Chemical Products
Manufacturer 104,700 $ 5,737,266
Automobiles—1.6%Ducati Motor Holding S.p.A.
(Italy) (a) Motorcycle Manufacturer 1,933,500 $ 3,639,826
Broadcasting & Programming—6.2%Liberty Media Corporation, Class A
(United States) (a) Broadcast Services & Programming 950,000 $ 8,493,000
Grupo Televisa S.A. (Mexico) (a)(b) Television Production &
Broadcasting 207,600 5,798,268
14,291,268
Broadcasting & Publishing—1.0%Gemstar-TV Guide
International Inc. (United States) (a) Electronic Program
Guide Services 700,000 $ 2,275,000
Educational Services—3.4%ITT Educational Services, Inc.
(United States) (a)(c) Postsecondary Degree Programs 333,300 $ 7,849,215
Home Furnishings—4.0%Hunter Douglas N.V.
(Netherlands) Window Coverings Manufacturer 309,800 $ 9,275,973
Human Resources—3.7%Michael Page International
plc (Great Britain) Recruitment Consultancy Services 4,786,500 $ 8,436,264
Schedule of Investments—December 31, 2002 (Unaudited)
Name Description Shares Held Market Value
T H E O A K M A R K G L O B A L F U N D 33
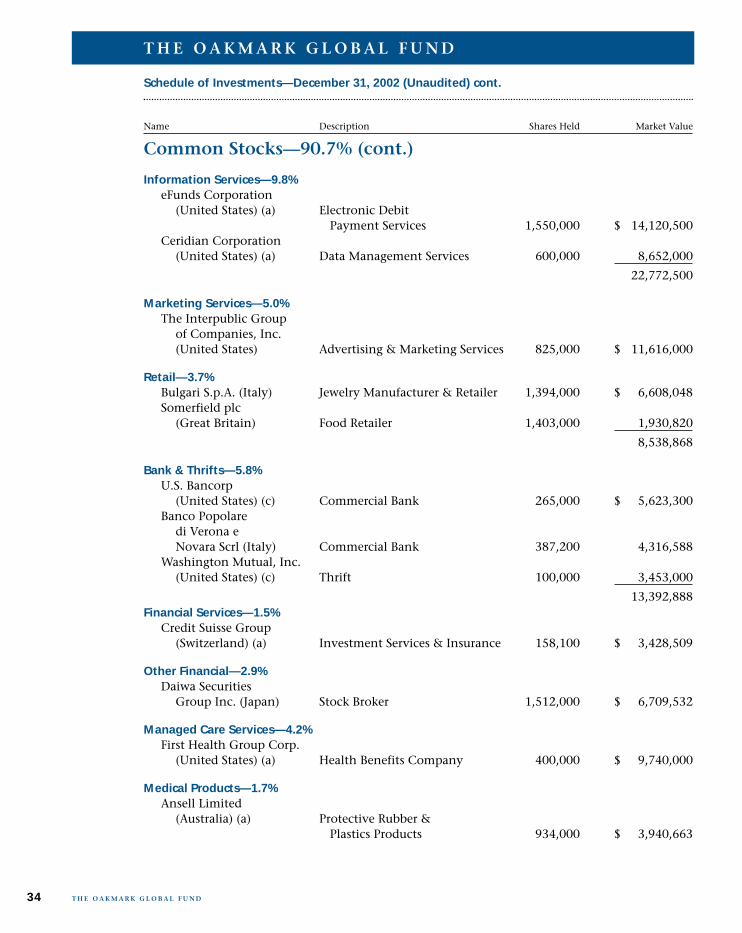
Common Stocks—90.7% (cont.)
Information Services—9.8%eFunds Corporation
(United States) (a) Electronic Debit Payment Services 1,550,000 $ 14,120,500
Ceridian Corporation (United States) (a) Data Management Services 600,000 8,652,000
22,772,500
Marketing Services—5.0%The Interpublic Group
of Companies, Inc. (United States) Advertising & Marketing Services 825,000 $ 11,616,000
Retail—3.7%Bulgari S.p.A. (Italy) Jewelry Manufacturer & Retailer 1,394,000 $ 6,608,048Somerfield plc
(Great Britain) Food Retailer 1,403,000 1,930,820
8,538,868
Bank & Thrifts—5.8%U.S. Bancorp
(United States) (c) Commercial Bank 265,000 $ 5,623,300Banco Popolare
di Verona e Novara Scrl (Italy) Commercial Bank 387,200 4,316,588
Washington Mutual, Inc. (United States) (c) Thrift 100,000 3,453,000
13,392,888Financial Services—1.5%
Credit Suisse Group (Switzerland) (a) Investment Services & Insurance 158,100 $ 3,428,509
Other Financial—2.9%Daiwa Securities
Group Inc. (Japan) Stock Broker 1,512,000 $ 6,709,532
Managed Care Services—4.2%First Health Group Corp.
(United States) (a) Health Benefits Company 400,000 $ 9,740,000
Medical Products—1.7%Ansell Limited
(Australia) (a) Protective Rubber & Plastics Products 934,000 $ 3,940,663
Schedule of Investments—December 31, 2002 (Unaudited) cont.
Name Description Shares Held Market Value
T H E O A K M A R K G L O B A L F U N D
T H E O A K M A R K G L O B A L F U N D34
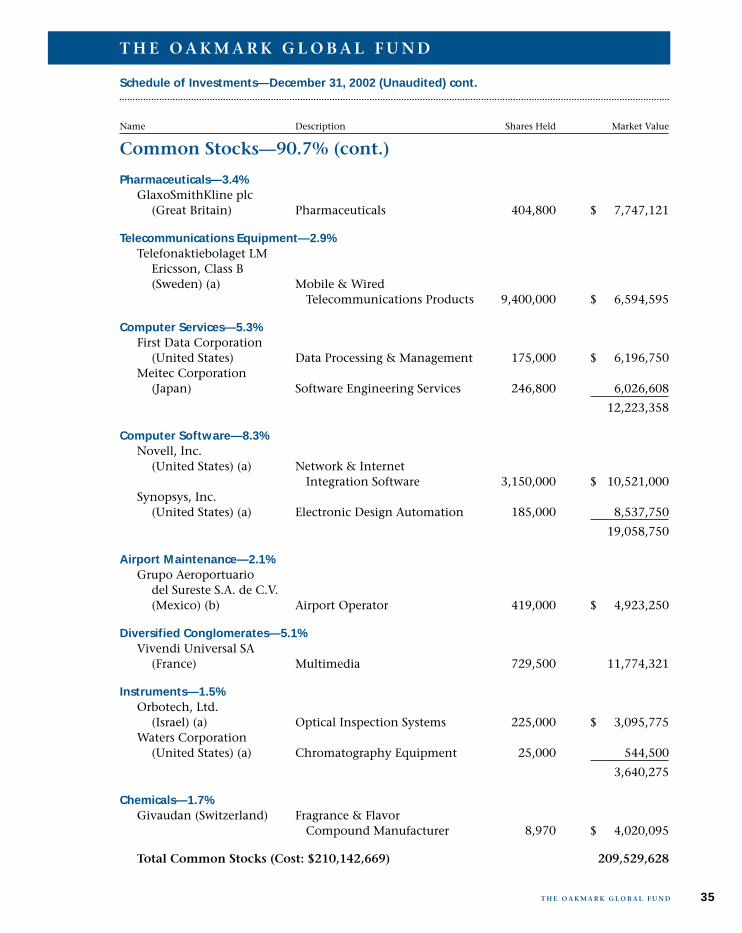
Common Stocks—90.7% (cont.)
Pharmaceuticals—3.4%GlaxoSmithKline plc
(Great Britain) Pharmaceuticals 404,800 $ 7,747,121
Telecommunications Equipment—2.9%Telefonaktiebolaget LM
Ericsson, Class B (Sweden) (a) Mobile & Wired
Telecommunications Products 9,400,000 $ 6,594,595
Computer Services—5.3%First Data Corporation
(United States) Data Processing & Management 175,000 $ 6,196,750Meitec Corporation
(Japan) Software Engineering Services 246,800 6,026,608
12,223,358
Computer Software—8.3%Novell, Inc.
(United States) (a) Network & Internet Integration Software 3,150,000 $ 10,521,000
Synopsys, Inc. (United States) (a) Electronic Design Automation 185,000 8,537,750
19,058,750
Airport Maintenance—2.1%Grupo Aeroportuario
del Sureste S.A. de C.V. (Mexico) (b) Airport Operator 419,000 $ 4,923,250
Diversified Conglomerates—5.1%Vivendi Universal SA
(France) Multimedia 729,500 11,774,321
Instruments—1.5%Orbotech, Ltd.
(Israel) (a) Optical Inspection Systems 225,000 $ 3,095,775Waters Corporation
(United States) (a) Chromatography Equipment 25,000 544,500
3,640,275
Chemicals—1.7%Givaudan (Switzerland) Fragrance & Flavor
Compound Manufacturer 8,970 $ 4,020,095
Total Common Stocks (Cost: $210,142,669) 209,529,628
Schedule of Investments—December 31, 2002 (Unaudited) cont.
Name Description Shares Held Market Value
T H E O A K M A R K G L O B A L F U N D
T H E O A K M A R K G L O B A L F U N D 35
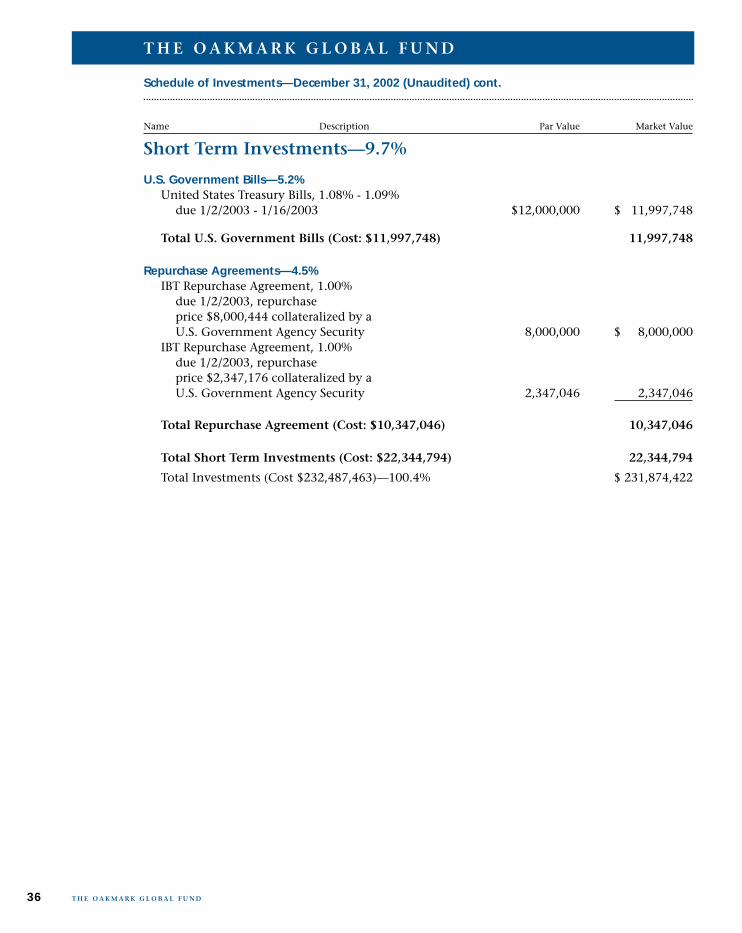
Short Term Investments—9.7%
U.S. Government Bills—5.2%United States Treasury Bills, 1.08% - 1.09%
due 1/2/2003 - 1/16/2003 $12,000,000 $ 11,997,748
Total U.S. Government Bills (Cost: $11,997,748) 11,997,748
Repurchase Agreements—4.5%IBT Repurchase Agreement, 1.00%
due 1/2/2003, repurchase price $8,000,444 collateralized by a U.S. Government Agency Security 8,000,000 $ 8,000,000
IBT Repurchase Agreement, 1.00% due 1/2/2003, repurchase price $2,347,176 collateralized by a U.S. Government Agency Security 2,347,046 2,347,046
Total Repurchase Agreement (Cost: $10,347,046) 10,347,046
Total Short Term Investments (Cost: $22,344,794) 22,344,794
Total Investments (Cost $232,487,463)—100.4% $ 231,874,422
Schedule of Investments—December 31, 2002 (Unaudited) cont.
Name Description Par Value Market Value
T H E O A K M A R K G L O B A L F U N D
T H E O A K M A R K G L O B A L F U N D36
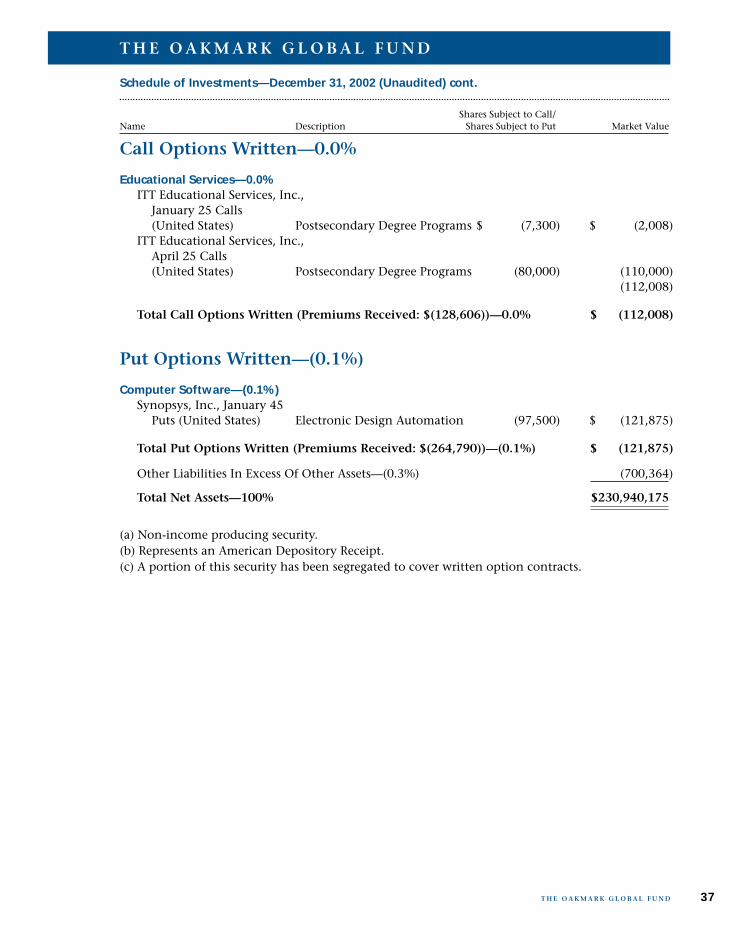
Call Options Written—0.0%
Educational Services—0.0%ITT Educational Services, Inc.,
January 25 Calls (United States) Postsecondary Degree Programs $ (7,300) $ (2,008)
ITT Educational Services, Inc., April 25 Calls (United States) Postsecondary Degree Programs (80,000) (110,000)
(112,008)
Total Call Options Written (Premiums Received: $(128,606))—0.0% $ (112,008)
Put Options Written—(0.1%)
Computer Software—(0.1%)Synopsys, Inc., January 45
Puts (United States) Electronic Design Automation (97,500) $ (121,875)
Total Put Options Written (Premiums Received: $(264,790))—(0.1%) $ (121,875)
Other Liabilities In Excess Of Other Assets—(0.3%) (700,364)
Total Net Assets—100% $230,940,175
(a) Non-income producing security.(b) Represents an American Depository Receipt.(c) A portion of this security has been segregated to cover written option contracts.
Schedule of Investments—December 31, 2002 (Unaudited) cont.
Shares Subject to Call/Name Description Shares Subject to Put Market Value
T H E O A K M A R K G L O B A L F U N D
T H E O A K M A R K G L O B A L F U N D 37
Fellow Shareholders,Your funds have ended the year on a positive note. Thoughthey both generated negative returns for the calendar year,the 4th calendar quarter showed a nice turnaround gener-ating gains for The Oakmark International and OakmarkInternational Small Cap Funds of 9% and 8%, respectively.This compares favorably to the lessor gains in the variousindices, as noted in each Funds’ respective letter. Moreimportantly, our medium and long-term performance hasbeen outstanding. The Oakmark International Fund is up10% per annum since its inception in 1992. OakmarkInternational Small Cap is up 7% per annum since itsinception in 1995. Both compare very favorably to the rel-ative indices and peer groups.
It’s been a very unique time….Please consider for a moment what has happened over thelast few years:
• a massive implosion of equity market values aroundthe world, with most major markets touchingmulti-year lows in the Third Quarter 2002, and withthe Japanese market hitting the level of the early1980’s;
• a terrorist attack that has cost the economy and theglobal insurance industry billions of dollars,
• the persistent threat of war;
• an extremely contentious presidential election inThe United States;
• a number of corporate chieftains around the globefired or forced to resigned because of poor corporateperformance; and,
• corporate governance and fraud scandals that wereinstrumental in the bankruptcies of major US firmsin the tech, telecom and energy sectors.
…. And yet…The Global economy actually grew in 2002 and at anacceptable rate. The United States ended the year growingat 3-4%, and Asia is growing 5% plus. Though Germanyand Japan are still sick, the rest of Europe is doing better.While we all feared the outcome of the Brazilian election,Luiz Inacio Lula da Silva (“Lula”), Brazil’s newly electedleader, seems at this point to be very pragmatic and in agood position to solve some of Brazil’s problems. Brazil isLatin America’s largest and most important economy. Apossibility of a turnaround could spur growth for the entireregion.The point is that the economic resilience we are seeing issetting the stage for corporate earnings and share prices to
recover around the globe. The world has sustained somemajor shocks and has handled them exceptionally well.We believe that the large increases in productivity spurredon by new technology, low interest rates and sound mon-etary policy as well as the continued development of theworld’s largest country, China, are partly behind thisresilience. With share prices at attractive valuations all overthe globe we cannot help being anything but enthusiasticabout international equity prospects in the next few years.
Our stocks…..As we do every December, we will discuss the individualstocks that had the greatest impact on each of the Funds’NAVs22 during the past twelve months. Please see the spe-cific fund write-up for details.
Going forwardWe remain focused on identifying strong absolute returnopportunities currently being created by short-term volatil-ity in the markets. We continue to find lots of companies,across countries and industries, that meet our strict invest-ment criteria.Finally, we thank our loyal shareholders who continue toplace their trust and hard earned savings with us. We willcontinue to work hard to deliver strong results.
David G. Herro, CFA Michael J. Welsh, CFA, CPAPortfolio Manager Portfolio [email protected] [email protected]
January 6, 2003
THE OAKMARK INTERNATIONAL ANDOAKMARK INTERNATIONAL SMALL CAP FUNDS
T H E O A K M A R K I N T E R N AT I O N A L A N D O A K M A R K I N T E R N AT I O N A L S M A L L C A P F U N D S38
• The global economy actually grew in 2002 at anacceptable rate: the U.S. at 3 – 4% and Asia at5% plus. And while Germany and Japan are stillsick, the rest of Europe is doing better.
• Large increases in productivity spurred on bynew technology, low interest rates, and soundmonetary policy are partly behind economicresilience.
• With global share prices at attractive valuations,we are enthusiastic about international equityprospects in the coming years.
Highlights

T H E O A K M A R K I N T E R N AT I O N A L F U N D
The Oakmark International Fund was up 9% forthe quarter, compared with 7% gains in the MSCIWorld ex-US and the Lipper International Fundindices.Over the past twelve month’s your Fund has gen-erated a loss of 8%, relative to the larger declinesof 16% in the MSCI World ex-US index and 14%in the Lipper International Fund Index.
Impact Players for 2002Givaudan, the Swiss flavors and fragrances com-pany, generated the largest positive impact on theFund’s NAV22 during 2002. Givaudan was spun-offfrom Roche Holdings in 2000, and remainedsomewhat neglected by investors. That changedthis year as management’s strong record in bothoperations and capital allocation was rewarded inthe market with a higher share price.Once again our Korean holdings were among thetop performers for the year. Lotte Chilsung Bever-age and Kumkang Korea Chemical were near thetop in positive contribution to NAV. We haveowned both of these companies for over five yearsand they continue to deliver solid price apprecia-tion. And in our view, they are still cheap.Somerfield plc, the UK supermarket operator, con-tinued to make slow but sure progress in restruc-turing their troubled Kwik Save chain. Anothersolid contributor for the year was Banco Popolaredi Verona. High quality management is exceed-ing expectations in integrating their recentNovara acquisition.By far the single biggest negative impact on NAVfor the year came from Ericsson. As discussed inthe Oakmark Global letter, the market continuedto punish the stock in 2002 for the slow-down intelecommunication infrastructure spending,ignoring the company’s strong market positionand the significant headway management hasmade on cost reductions. The stock has ralliedstrongly from its low in the third quarter, con-tributing significantly to fourth quarter perform-ance, and we continue to believe Ericsson is verywell positioned to benefit from any return intelecommunications capital spending.Another negative contributor was Unibanco, theBrazilian retail bank. The share price remainsunder pressure due to concerns about the newBrazilian government. We have sold our entireposition as we found better risk-reward opportu-nities in a number of other financial services com-panies, all of which had significant share pricedeclines. While still cheap, we felt companies suchas Credit Suisse Group, BNP-Paribas, Daiwa Secu-rities and San Paolo IMI are all more attractive atcurrent prices than Unibanco.Orbotech, the Israeli optical inspection specialist,was another negative contributor as a slump inelectronics and technology spending hurt short-term results. We remain confident about the
Report from David G. Herro and Michael J. Welsh, Portfolio Managers
THE OAKMARK INTERNATIONAL FUND
THE VALUE OF A $10,000 INVESTMENT IN THEOAKMARK INTERNATIONAL FUND FROM ITSINCEPTION (9/30/92) TO PRESENT (12/31/02)COMPARED TO THE MSCI WORLD EX U.S. INDEX23
Average Annual Total Returns5
(as of 12/31/02)
Total Return 1-year 5-year 10-year SinceLast 3 Months* Inception
(9/30/92)
Oakmark International
Fund 8.99% -8.46% 4.85% 9.75% 9.54%
MSCI World ex. U.S. 6.54% -15.80% -2.72% 4.17% 3.68%
MSCI EAFE3
6.45% -15.94% -2.89% 4.00% 3.50%
Lipper International 6.64% -13.83% -1.64% 5.55% 5.28%
Fund Index24
The graph and table do not reflect the deduction of taxes that a shareholder would payon fund distributions or the redemption of fund shares.
Past performance is no guarantee of future results. Investment return andprincipal value vary, and you may have a gain or loss when you sell shares. Averageannual total return measures annualized change, while total return measures aggregatechange.
* Not annualized
9/92
$10,000
$15,000
$20,000
$25,000
$35,000
The OakmarkInternationalFund$25,465
MSCI World exU.S. Index$14,492
12/93 12/94 12/95 12/96 12/97 12/98 12/00
$5,000
$30,000
12/99 12/01 12/0212/92
39
company’s long-term prospects and the large gap betweenbusiness value and the current market price.Finally, another loser for the Fund was Cordiant Commu-nications. As long-term shareholders will remember, wemade significant profits on our first go-round with thiscompany but, unfortunately, not this time. Though Cor-diant remains statistically cheap, we believe increasing ourownership in Publicis Groupe, a much stronger Frenchadvertising holding company, and Aegis, the UK-basedglobal media buyer, provides superior risk-reward oppor-tunities in this sector.
Looking ForwardWe remain optimistic based on the large number of attrac-tive absolute return opportunities in the portfolio. Wethank you for your continued confidence.
David G. Herro, CFA Michael J. Welsh, CFA, CPAPortfolio Manager Portfolio [email protected] [email protected]
January 6, 2003
40 T H E O A K M A R K I N T E R N AT I O N A L F U N D
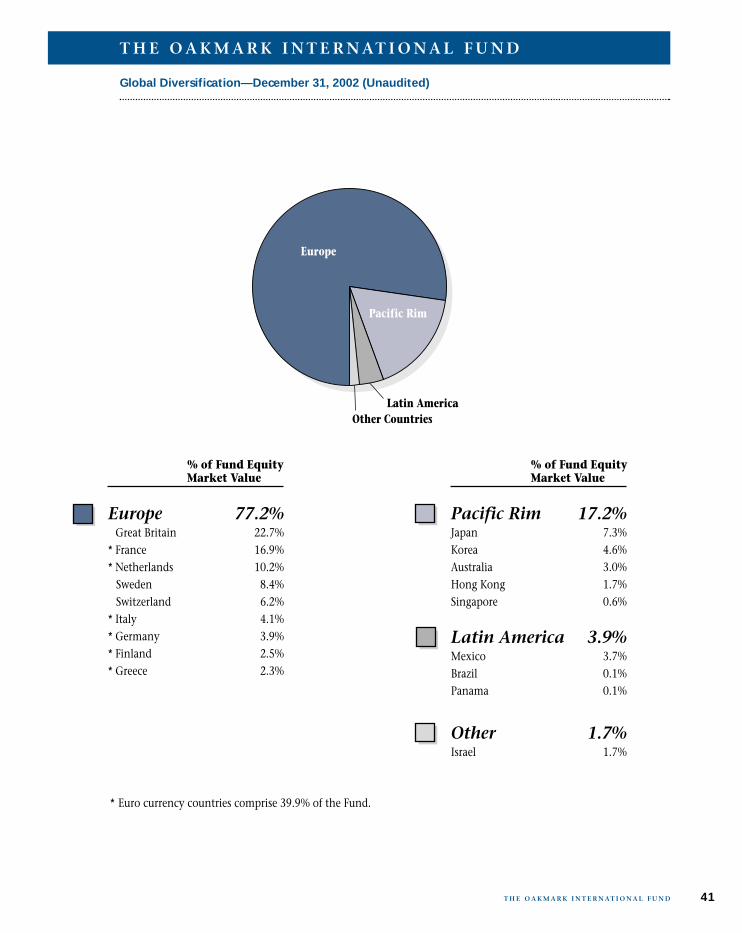
41T H E O A K M A R K I N T E R N AT I O N A L F U N D
Global Diversification—December 31, 2002 (Unaudited)
% of Fund EquityMarket Value
% of Fund EquityMarket Value
Pacific Rim 17.2%Japan 7.3%Korea 4.6%Australia 3.0%Hong Kong 1.7%Singapore 0.6%
Latin America 3.9%Mexico 3.7%Brazil 0.1%Panama 0.1%
Other 1.7%Israel 1.7%
Europe 77.2% Great Britain 22.7%* France 16.9%* Netherlands 10.2% Sweden 8.4% Switzerland 6.2%* Italy 4.1%* Germany 3.9%* Finland 2.5%* Greece 2.3%
* Euro currency countries comprise 39.9% of the Fund.
Latin AmericaOther Countries
Europe
Pacific Rim
T H E O A K M A R K I N T E R N AT I O N A L F U N D

T H E O A K M A R K I N T E R N AT I O N A L F U N D
Common Stocks—96.1%
Food & Beverage—8.0%Diageo plc (Great Britain) Beverages, Wines, &
Spirits Manufacturer 4,491,700 $ 48,801,422Pernod-Ricard SA (France) Manufactures Wines,
Spirits, & Fruit Juices 323,300 31,295,319Fomento Economico
Mexicano S.A. de C.V. (Mexico) (b) Soft Drink & Beer Manufacturer 706,800 25,741,656
Lotte Chilsung Beverage Co., Ltd. (Korea) Soft Drinks, Juices & Sports
Drinks Manufacturer 49,700 23,466,127Cadbury Schweppes plc
(Great Britain) Beverage & Confectionary Manufacturer 1,468,000 9,168,024
138,472,548
Household Products—2.4%Henkel KGaA (Germany) Consumer Chemical
Products Manufacturer 755,000 $ 41,371,877
Other Consumer Goods & Services—1.0%Swatch Group AG
(Switzerland) Watch Manufacturer 202,300 $ 16,816,900
Apparel—0.2%Fila Holding S.p.A
(Italy) (a)(b) Athletic Footwear & Apparel 2,947,380 $ 3,890,542
Automobiles—1.4%Bayerische Motoren
Werke (BMW) AG (Germany) Luxury Automobile
Manufacturer 787,200 $ 23,875,658
Automotive—3.0%Compagnie Generale
des Etablissements Michelin (France) Tire Manufacturer 770,600 $ 26,556,359
Autoliv Inc (Sweden) (c) Automotive Safety
Systems Manufacturer 1,248,000 25,620,241
52,176,600
Schedule of Investments—December 31, 2002 (Unaudited)
Name Description Shares Held Market Value
T H E O A K M A R K I N T E R N AT I O N A L F U N D42

Common Stocks—96.1% (cont.)
Broadcasting & Programming—2.0%Grupo Televisa S.A.
(Mexico) (a)(b) Television Production & Broadcasting 1,145,600 $ 31,996,608
Tokyo Broadcasting System, Inc. (Japan) Television & Radio
Broadcasting 157,000 1,972,415
33,969,023
Building Materials & Construction—0.9%Kumkang Korea Chemical
Co., Ltd. (Korea) Building Materials 162,140 $ 15,994,587
Home Furnishings—3.0%Hunter Douglas N.V.
(Netherlands) Window Coverings Manufacturer 1,718,584 $ 51,457,520
Human Resources—2.5%Michael Page International
plc (Great Britain) Recruitment Consultancy Services 24,736,600 $ 43,598,554
Marketing Services—4.7%Aegis Group plc
(Great Britain) Media Services 39,066,900 $ 49,205,229Publicis Groupe
(France) Advertising & Media Services 1,461,700 30,965,749
80,170,978
Publishing—3.0%John Fairfax Holdings
Limited (Australia) Newspaper Publisher 27,580,400 $ 49,959,440Wolters Kluwer NV
(Netherlands) Reference Material Publisher 59,552 1,036,756
50,996,196
Retail—5.5%Giordano International
Limited (Hong Kong) Pacific Rim Clothing Retailer & Manufacturer 73,240,300 $ 28,644,161
Somerfield plc (Great Britain) Food Retailer 17,297,000 23,804,270
Koninklijke Ahold NV (Netherlands) Food Retailer 1,769,000 22,448,389
Schedule of Investments—December 31, 2002 (Unaudited) cont.
Name Description Shares Held Market Value
T H E O A K M A R K I N T E R N AT I O N A L F U N D
T H E O A K M A R K I N T E R N AT I O N A L F U N D 43
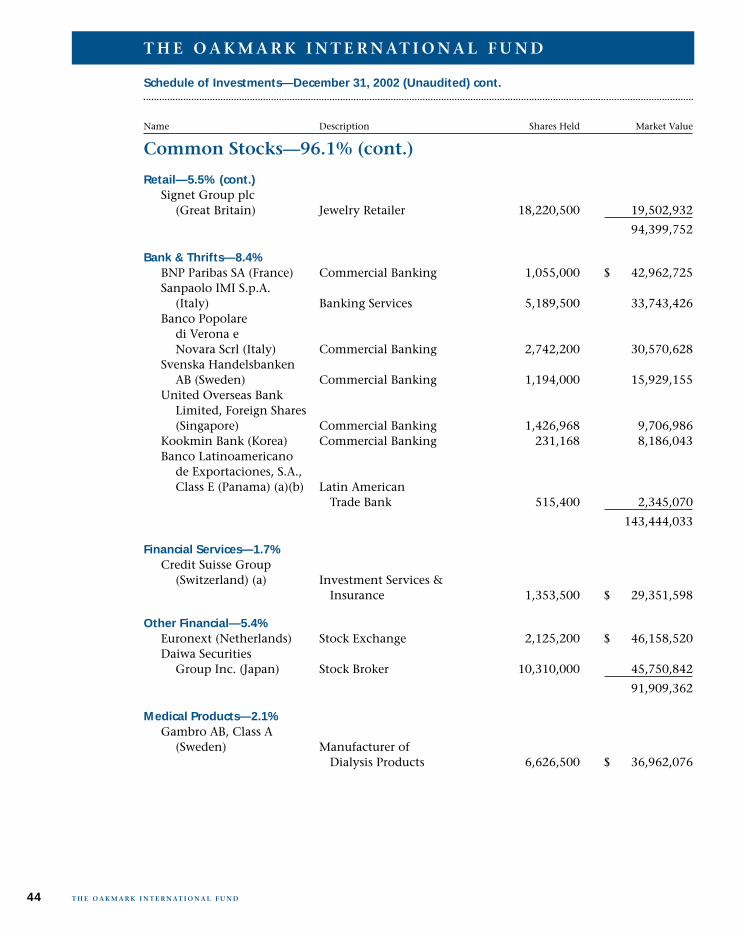
Common Stocks—96.1% (cont.)
Retail—5.5% (cont.)Signet Group plc
(Great Britain) Jewelry Retailer 18,220,500 19,502,932
94,399,752
Bank & Thrifts—8.4%BNP Paribas SA (France) Commercial Banking 1,055,000 $ 42,962,725Sanpaolo IMI S.p.A.
(Italy) Banking Services 5,189,500 33,743,426Banco Popolare
di Verona e Novara Scrl (Italy) Commercial Banking 2,742,200 30,570,628
Svenska Handelsbanken AB (Sweden) Commercial Banking 1,194,000 15,929,155
United Overseas Bank Limited, Foreign Shares (Singapore) Commercial Banking 1,426,968 9,706,986
Kookmin Bank (Korea) Commercial Banking 231,168 8,186,043Banco Latinoamericano
de Exportaciones, S.A., Class E (Panama) (a)(b) Latin American
Trade Bank 515,400 2,345,070
143,444,033
Financial Services—1.7%Credit Suisse Group
(Switzerland) (a) Investment Services & Insurance 1,353,500 $ 29,351,598
Other Financial—5.4%Euronext (Netherlands) Stock Exchange 2,125,200 $ 46,158,520Daiwa Securities
Group Inc. (Japan) Stock Broker 10,310,000 45,750,842
91,909,362
Medical Products—2.1%Gambro AB, Class A
(Sweden) Manufacturer of Dialysis Products 6,626,500 $ 36,962,076
Schedule of Investments—December 31, 2002 (Unaudited) cont.
Name Description Shares Held Market Value
T H E O A K M A R K I N T E R N AT I O N A L F U N D
T H E O A K M A R K I N T E R N AT I O N A L F U N D44
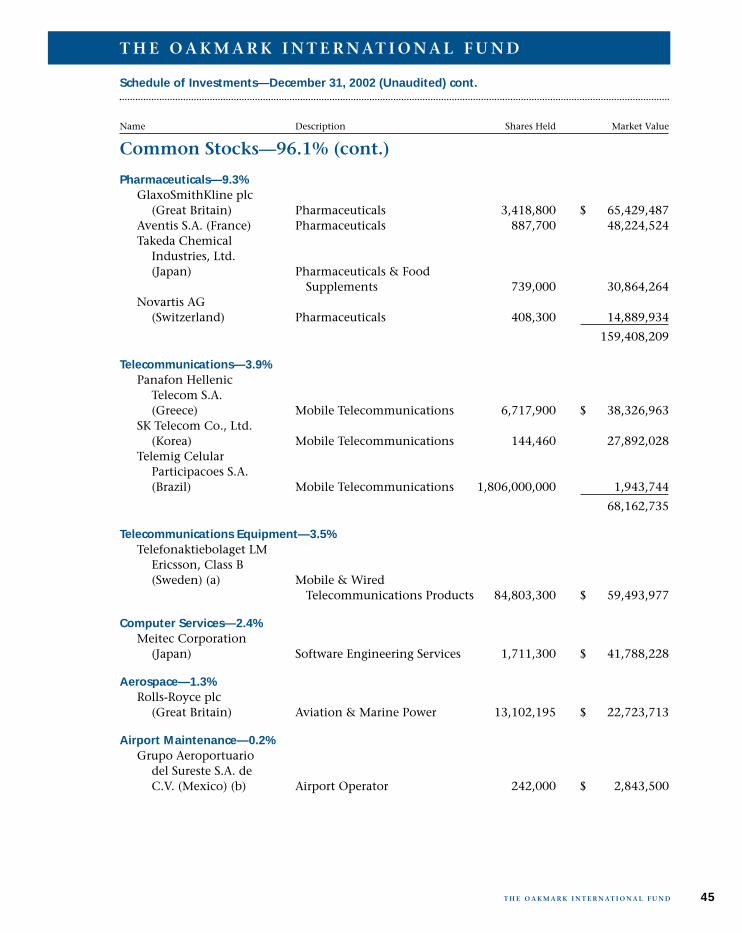
Common Stocks—96.1% (cont.)
Pharmaceuticals—9.3%GlaxoSmithKline plc
(Great Britain) Pharmaceuticals 3,418,800 $ 65,429,487Aventis S.A. (France) Pharmaceuticals 887,700 48,224,524Takeda Chemical
Industries, Ltd. (Japan) Pharmaceuticals & Food
Supplements 739,000 30,864,264Novartis AG
(Switzerland) Pharmaceuticals 408,300 14,889,934
159,408,209
Telecommunications—3.9%Panafon Hellenic
Telecom S.A. (Greece) Mobile Telecommunications 6,717,900 $ 38,326,963
SK Telecom Co., Ltd. (Korea) Mobile Telecommunications 144,460 27,892,028
Telemig Celular Participacoes S.A. (Brazil) Mobile Telecommunications 1,806,000,000 1,943,744
68,162,735
Telecommunications Equipment—3.5%Telefonaktiebolaget LM
Ericsson, Class B (Sweden) (a) Mobile & Wired
Telecommunications Products 84,803,300 $ 59,493,977
Computer Services—2.4%Meitec Corporation
(Japan) Software Engineering Services 1,711,300 $ 41,788,228
Aerospace—1.3%Rolls-Royce plc
(Great Britain) Aviation & Marine Power 13,102,195 $ 22,723,713
Airport Maintenance—0.2%Grupo Aeroportuario
del Sureste S.A. de C.V. (Mexico) (b) Airport Operator 242,000 $ 2,843,500
Schedule of Investments—December 31, 2002 (Unaudited) cont.
Name Description Shares Held Market Value
T H E O A K M A R K I N T E R N AT I O N A L F U N D
T H E O A K M A R K I N T E R N AT I O N A L F U N D 45
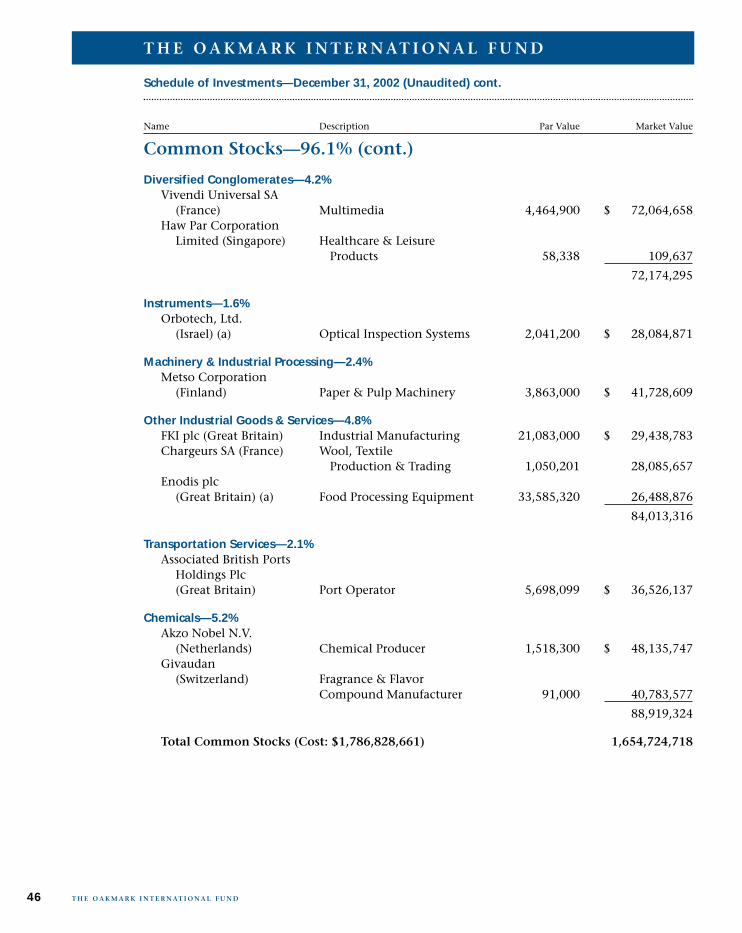
Common Stocks—96.1% (cont.)
Diversified Conglomerates—4.2%Vivendi Universal SA
(France) Multimedia 4,464,900 $ 72,064,658Haw Par Corporation
Limited (Singapore) Healthcare & Leisure Products 58,338 109,637
72,174,295
Instruments—1.6%Orbotech, Ltd.
(Israel) (a) Optical Inspection Systems 2,041,200 $ 28,084,871
Machinery & Industrial Processing—2.4%Metso Corporation
(Finland) Paper & Pulp Machinery 3,863,000 $ 41,728,609
Other Industrial Goods & Services—4.8%FKI plc (Great Britain) Industrial Manufacturing 21,083,000 $ 29,438,783Chargeurs SA (France) Wool, Textile
Production & Trading 1,050,201 28,085,657Enodis plc
(Great Britain) (a) Food Processing Equipment 33,585,320 26,488,876
84,013,316
Transportation Services—2.1%Associated British Ports
Holdings Plc (Great Britain) Port Operator 5,698,099 $ 36,526,137
Chemicals—5.2%Akzo Nobel N.V.
(Netherlands) Chemical Producer 1,518,300 $ 48,135,747Givaudan
(Switzerland) Fragrance & Flavor Compound Manufacturer 91,000 40,783,577
88,919,324
Total Common Stocks (Cost: $1,786,828,661) 1,654,724,718
Schedule of Investments—December 31, 2002 (Unaudited) cont.
Name Description Par Value Market Value
T H E O A K M A R K I N T E R N AT I O N A L F U N D
T H E O A K M A R K I N T E R N AT I O N A L F U N D46
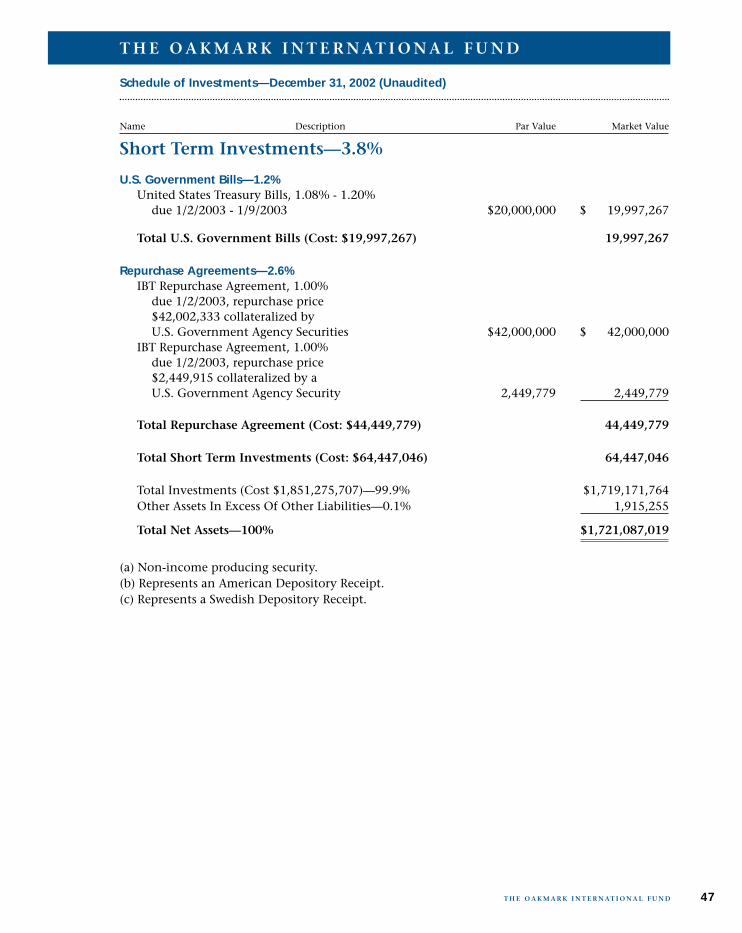
Short Term Investments—3.8%
U.S. Government Bills—1.2%United States Treasury Bills, 1.08% - 1.20%
due 1/2/2003 - 1/9/2003 $20,000,000 $ 19,997,267
Total U.S. Government Bills (Cost: $19,997,267) 19,997,267
Repurchase Agreements—2.6%IBT Repurchase Agreement, 1.00%
due 1/2/2003, repurchase price $42,002,333 collateralized by U.S. Government Agency Securities $42,000,000 $ 42,000,000
IBT Repurchase Agreement, 1.00% due 1/2/2003, repurchase price $2,449,915 collateralized by a U.S. Government Agency Security 2,449,779 2,449,779
Total Repurchase Agreement (Cost: $44,449,779) 44,449,779
Total Short Term Investments (Cost: $64,447,046) 64,447,046
Total Investments (Cost $1,851,275,707)—99.9% $1,719,171,764Other Assets In Excess Of Other Liabilities—0.1% 1,915,255
Total Net Assets—100% $1,721,087,019
(a) Non-income producing security.(b) Represents an American Depository Receipt.(c) Represents a Swedish Depository Receipt.
Schedule of Investments—December 31, 2002 (Unaudited)
Name Description Par Value Market Value
T H E O A K M A R K I N T E R N AT I O N A L F U N D
T H E O A K M A R K I N T E R N AT I O N A L F U N D 47

T H E O A K M A R K I N T E R N AT I O N A L S M A L L C A P F U N D
10/95
$10,000
$12,000
$14,000
$16,000
$20,000
The OakmarkInternationalSmall CapFund$15,818
MSCI World exU.S. Index$10,172
12/96 12/97 12/98 12/99 12/00 12/01
$8,000
$18,000
12/0212/95
48
The Oakmark International Small Cap Fund wasup 8% for the quarter, compared with gains inthe MSCI World ex-US Index and the LipperInternational Small Cap Average, of 7%, and 3%,respectively.Over the past twelve month’s your Fund gener-ated a loss of 5%, relative to the larger declines of16% in the MSCI World ex-US Index and 12% inthe Lipper International Small Cap Average.
Impact Players for 2002Restructuring stories were some of the strongestperformers for the Fund in 2002. Australiasia washome to the Fund’s two biggest positive contrib-utors to performance. Ansell, the legacy companyof restructured conglomerate Pacific Dunlop, pro-vided the biggest single positive contribution tothe Fund’s NAV.22 The process of transformingPacific Dunlop into Ansell was misunderstoodand/or ignored by the market, and our analystRob Taylor deserves a lot of credit for bringingclarity to a convoluted situation to the Fund’s ben-efit. Fletcher Building of New Zealand was also avery strong performer, as the fruits of a restructur-ing program instituted by new managementbecame apparent to the market.Other significant positive contributors were JarvisHotels (UK), where management unlocked valuehidden in the company’s real estate, and SchindlerHolding (Switzerland) as the market welcomedmoves by the new management including areturn of capital.The stock with the largest single negative impacton Fund performance this year was Bladex, theleader in Latin American trade financing. Theshare price was devastated by a number of issuesincluding Brazilian worries, the debt crisis inArgentina and a subsequent rights offering neededto preserve the company’s credit rating. In short,we underestimated credit risk and overestimatedthe company’s flexibility.Solvus, the Belgium temporary services provider,was also a very poor performer. A tough competi-tive environment confirmed that we had overes-timated the quality of their business franchise andwe have subsequently sold all our shares.Three European manufacturers had significant,though we believe temporary, negative impactson the Fund: Gurit-Heberlien, Pfeiffer VacuumTechnology, and Natuzzi. Swiss-based Gurit-Heberlien is in the midst of a restructuring thatshould eventually highlight the share’s underval-uation. Pfeiffer is suffering from the malaise thatinfects German manufacturing at present, though,unlike most of their peers, the company remainsextremely profitable. The share price of Natuzzi,the Italian furniture manufacturer, is suffering
Report from David G. Herro and Michael J. Welsh, Portfolio Managers
THE OAKMARK INTERNATIONAL SMALL CAP FUND
THE VALUE OF A $10,000 INVESTMENT IN THEOAKMARK INTERNATIONAL SMALL CAP FUND FROMITS INCEPTION (11/1/95) TO PRESENT (12/31/02) ASCOMPARED TO THE MSCI WORLD EX U.S. INDEX23
Average Annual Total Returns5
(as of 12/31/02)
Total Return 1-year 5-year SinceLast 3 Months* Inception
(11/1/95)
Oakmark International 8.04% -5.12% 10.40% 6.60%
Small Cap Fund
MSCI World ex. U.S. 6.54% -15.80% -2.72% 0.24%
Lipper International 2.92% -12.13% 2.61% 6.27%
Small Cap Average25
The graph and table do not reflect the deduction of taxes that a shareholder would payon fund distributions or the redemption of fund shares.
Past performance is no guarantee of future results. Investment return and prin-cipal value vary, and you may have a gain or loss when you sell shares. Average annualtotal return measures annualized change, while total return measures aggregate change.
* Not annualized

from worries about the overall economy and consumerconfidence.
Looking ForwardGiven the quality of the holdings and the attractive valu-ation of the portfolio, we remain quite optimistic regard-ing long-term appreciation potential. We want to thankyou for your continued confidence.
David G. Herro, CFA Michael J. Welsh, CFA, CPAPortfolio Manager Portfolio [email protected] [email protected]
January 6, 2003
49T H E O A K M A R K I N T E R N AT I O N A L S M A L L C A P F U N D

50 T H E O A K M A R K I N T E R N AT I O N A L S M A L L C A P F U N D
Global Diversification—December 31, 2002 (Unaudited)
* Euro currency countries comprise 36.1% of the Fund.
Pacific Rim 20.7%Australia 6.8%New Zealand 3.9%Japan 3.2%Hong Kong 2.1%Singapore 1.5%Korea 1.3%Philippines 1.1%Thailand 0.8%
Latin America 4.6%Mexico 4.6%
% of Fund EquityMarket Value
Europe 74.7% Switzerland 19.6%* Italy 14.5%* France 10.5% Great Britain 9.2% Denmark 6.9%* Germany 4.4%* Netherlands 2.9% Sweden 2.9%* Spain 2.2%* Finland 1.6%
% of Fund EquityMarket Value
Latin America
Europe
Pacific Rim
T H E O A K M A R K I N T E R N AT I O N A L S M A L L C A P F U N D

T H E O A K M A R K I N T E R N AT I O N A L S M A L L C A P F U N D
Common Stocks—98.7%Food & Beverage—5.3%
Campari Group (Italy) (a) Soft Drinks, Wines, &
Spirits Producer 216,800 $ 6,768,775Baron De Ley, S.A.
(Spain) (a) Wines & Spirits Manufacturer 150,985 4,338,667
Grupo Continental, S.A. (Mexico) Soft Drink Manufacturer 2,144,500 3,498,704
Hite Brewery Co., Ltd. (Korea) Brewer 57,700 2,388,660
Alaska Milk Corporation (Philippines) Milk Producer 49,394,000 2,035,531
19,030,337
Other Consumer Goods & Services—0.4%Royal Doulton plc
(Great Britain) (a) Tableware & Giftware 22,373,000 $ 1,530,492
Apparel—0.3%Kingmaker Footwear
Holdings Limited (Hong Kong) Athletic Footwear
Manufacturer 4,395,000 $ 1,155,311
Automobiles—2.6%Ducati Motor
Holding S.p.A. (Italy) (a) Motorcycle Manufacturer 5,177,200 $ 9,746,111
Broadcasting & Programming—0.5%ABS-CBN Broadcasting
Corporation (Philippines) (a) Television & Broadcasting
Operator 6,569,300 $ 1,999,647
Broadcasting & Publishing—2.6%Tamedia AG
(Switzerland) TV Broadcasting & Publishing 176,836 $ 9,459,205
Building Materials & Construction—2.6%Fletcher Building Limited
(New Zealand) Building Materials Manufacturer 5,483,200 $ 9,627,046
Schedule of Investments—December 31, 2002 (Unaudited)
Name Description Shares Held Market Value
T H E O A K M A R K I N T E R N AT I O N A L S M A L L C A P F U N D 51
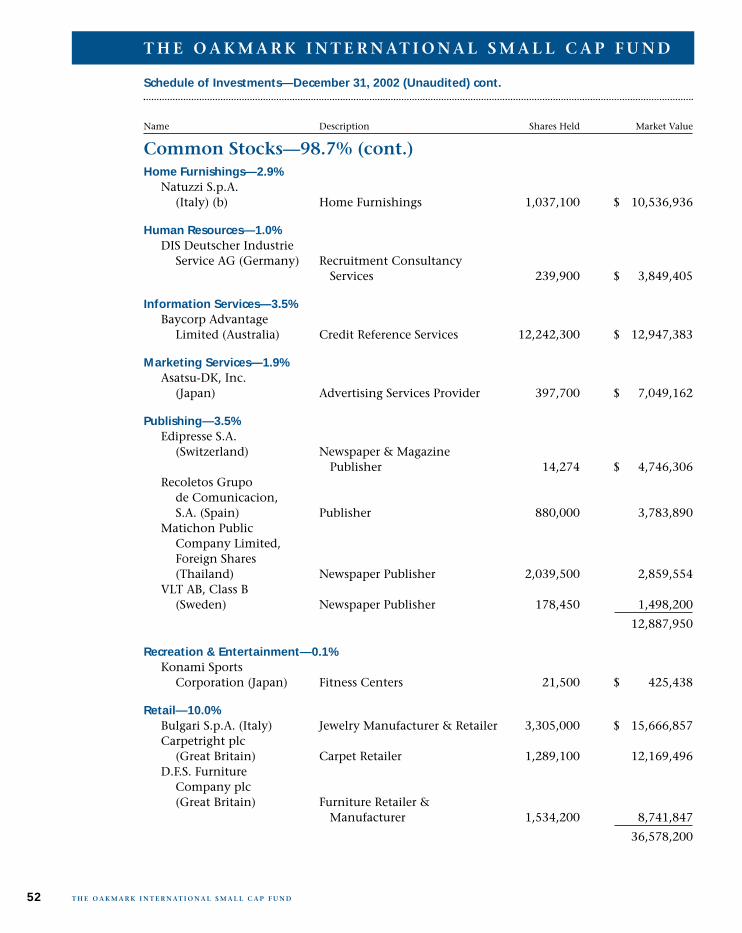
Common Stocks—98.7% (cont.)Home Furnishings—2.9%
Natuzzi S.p.A. (Italy) (b) Home Furnishings 1,037,100 $ 10,536,936
Human Resources—1.0%DIS Deutscher Industrie
Service AG (Germany) Recruitment Consultancy Services 239,900 $ 3,849,405
Information Services—3.5%Baycorp Advantage
Limited (Australia) Credit Reference Services 12,242,300 $ 12,947,383
Marketing Services—1.9%Asatsu-DK, Inc.
(Japan) Advertising Services Provider 397,700 $ 7,049,162
Publishing—3.5%Edipresse S.A.
(Switzerland) Newspaper & Magazine Publisher 14,274 $ 4,746,306
Recoletos Grupo de Comunicacion, S.A. (Spain) Publisher 880,000 3,783,890
Matichon Public Company Limited, Foreign Shares (Thailand) Newspaper Publisher 2,039,500 2,859,554
VLT AB, Class B (Sweden) Newspaper Publisher 178,450 1,498,200
12,887,950
Recreation & Entertainment—0.1%Konami Sports
Corporation (Japan) Fitness Centers 21,500 $ 425,438
Retail—10.0%Bulgari S.p.A. (Italy) Jewelry Manufacturer & Retailer 3,305,000 $ 15,666,857Carpetright plc
(Great Britain) Carpet Retailer 1,289,100 12,169,496D.F.S. Furniture
Company plc (Great Britain) Furniture Retailer &
Manufacturer 1,534,200 8,741,847
36,578,200
Schedule of Investments—December 31, 2002 (Unaudited) cont.
Name Description Shares Held Market Value
T H E O A K M A R K I N T E R N AT I O N A L S M A L L C A P F U N D
T H E O A K M A R K I N T E R N AT I O N A L S M A L L C A P F U N D52

Common Stocks—98.7% (cont.)Bank & Thrifts—6.0%
Vontobel Holding AG (Switzerland) Commercial Banking 723,686 $ 11,404,044
Jyske Bank A/S (Denmark) (a) Commercial Banking 398,500 10,799,611
22,203,655
Financial Services—5.3%Van der Moolen
Holding N.V. (Netherlands) International Trading Firm 496,100 $ 10,665,840
Julius Baer Holding Ltd., Zurich (Switzerland) Asset Management 39,900 8,652,595
19,318,435
Other Financial—2.8%JCG Holdings
Limited (Hong Kong) Consumer Finance 12,851,000 $ 6,303,104Ichiyoshi Securities
Co., Ltd. (Japan) Stock Broker 2,480,000 4,176,491
10,479,595
Medical Products—3.2%Ansell Limited
(Australia) (a) Protective Rubber & Plastics Products 2,832,925 $ 11,952,465
Computer Services—3.5%Morse Plc (Great Britain) Business & Technology
Solutions 5,310,900 $ 10,899,241Sopra Group (France) Computer Engineering 69,127 1,211,424Alten (France) (a) Systems Consulting &
Engineering 92,341 677,898
12,788,563
Computer Systems—2.1%Lectra (France) (a) Manufacturing Process Systems 1,668,500 $ 7,909,274
Office Equipment—4.0%Neopost SA (France) (a) Mailroom Equipment Supplier 460,400 $ 14,823,326
Schedule of Investments—December 31, 2002 (Unaudited) cont.
Name Description Shares Held Market Value
T H E O A K M A R K I N T E R N AT I O N A L S M A L L C A P F U N D
T H E O A K M A R K I N T E R N AT I O N A L S M A L L C A P F U N D 53

Common Stocks—98.7% (cont.)Airport Maintenance—7.5%
Kobenhavns Lufthavne A/S (Copenhagen Airports A/S) (Denmark) Airport Management &
Operations 200,600 $ 14,440,414Grupo Aeroportuario
del Sureste S.A. de C.V. (Mexico) (b) Airport Operator 1,129,000 13,265,749
27,706,163
Diversified Conglomerates—4.5%Pargesa Holding AG
(Switzerland) Diversified Operations 5,374 $ 9,711,580Financiere Marc de
Lacharriere SA (Fimalac) (France) Diversified Operations 176,200 4,680,724
Tae Young Corp. (Korea) Heavy Construction 73,000 2,338,856
16,731,160
Instruments—1.6%Vaisala Oyj, Class A
(Finland) Atmospheric Observation Equipment 241,000 $ 5,808,166
Machinery & Industrial Processing—6.6%Pfeiffer Vacuum
Technology AG (Germany) Vacuum Pump
Manufacturer 599,240 $ 12,016,021Alfa Laval (Sweden) (a) Filtration & Separation
Equipment 1,133,100 9,122,139Carbone Lorraine SA
(France) Electrical Systems Manufacturer 119,682 2,793,997
23,932,157
Other Industrial Goods & Services—4.6%Schindler Holding AG
(Switzerland) Elevator & Escalator Manufacturer 63,200 $ 11,877,982
GFI Industries SA (France) (c) Industrial Fastener
Manufacturer 241,813 5,021,308
16,899,290
Schedule of Investments—December 31, 2002 (Unaudited) cont.
Name Description Shares Held Market Value
T H E O A K M A R K I N T E R N AT I O N A L S M A L L C A P F U N D
T H E O A K M A R K I N T E R N AT I O N A L S M A L L C A P F U N D54

Common Stocks—98.7% (cont.)
Production Equipment—3.0%Interpump Group
S.p.A. (Italy) Pump & Piston Manufacturer 2,330,200 $ 9,897,379
NSC Groupe (France) Textile Equipment Manufacturer 12,316 1,059,791
10,957,170
Transportation Services—2.7%DelGro Corporation
Limited (Singapore) Bus, Taxi, & Car Leasing 4,380,700 $ 5,429,629Mainfreight Limited
(New Zealand) Logistics Services 7,765,726 4,477,019
9,906,648
Chemicals—4.1%Gurit-Heberlein AG
(Switzerland) Chemical Producer 32,734 $ 15,261,985
Total Common Stocks (Cost: $403,174,494) 363,500,675
Short Term Investments—1.1%
Repurchase Agreements—1.1%IBT Repurchase Agreement, 1.00%
due 1/2/2003, repurchase price $4,151,514 collateralized by a U.S. Government Agency Security $4,151,283 $ 4,151,283
Total Repurchase Agreement (Cost: $4,151,283) 4,151,283
Total Short Term Investments (Cost: $4,151,283) 4,151,283
Total Investments (Cost $407,325,777)—99.8% $367,651,958Other Assets In Excess Of Other Liabilities—0.2% 820,601
Total Net Assets—100% $368,472,559
(a) Non-income producing security.(b) Represents an American Depository Receipt.(c) Effective January 2, 2003, GFI Industries SA changed its name to LISI.
Schedule of Investments—December 31, 2002 (Unaudited) cont.
Shares Held/Name Description Par Value Market Value
T H E O A K M A R K I N T E R N AT I O N A L S M A L L C A P F U N D
T H E O A K M A R K I N T E R N AT I O N A L S M A L L C A P F U N D 55

This material must be preceded or accompanied by a prospectus. To order a prospectus, which explains management feesand expenses and the special risks of investing in the funds, visit www.oakmark.com or call 1-800-OAKMARK. Please readthe prospectus carefully before investing.
The discussion of investments and investment strategy of the funds represents the investments of the funds and the viewsof fund managers and Harris Associates L.P., the funds’ investment adviser, at the time of this article, and are subject tochange without notice.
Past performance is no guarantee of future results. Investment return and principal value will fluctuate so thatshares, when redeemed, may be worth more or less than original cost.
Investing in value stocks presents the risk that value stocks may fall out of favor with investors andunderperform growth stocks during given periods.
Because the Oakmark Select Fund is non-diversified, the performance of each holding will have agreater impact on the Fund’s total return, and may make the Fund’s return more volatile than a morediversified fund.
Investing in foreign securities represents risks which in some way may be greater than in U.S. invest-ments. Those risks include: currency fluctuation; different regulation, accounting standards, tradingpractices and levels of available information; generally higher transaction costs; and political risks.
The stocks of smaller companies often involve more risk than the stocks of larger companies. Stocksof small companies tend to be more volatile and have a smaller public market than stocks of larger com-panies. Small companies may have a shorter history of operations than larger companies, may not haveas great an ability to raise additional capital and may have a less diversified product line, making themmore susceptible to market pressure.
The Oakmark Equity and Income Fund invests in medium and lower-quality debt securities which havehigher yield potential but present greater investment and credit risk than higher-quality securities.
1. The Dow Jones Industrial Average is an unmanaged index that includes only 30 big companies. This index isunmanaged and investors cannot actually make investments in this index.
2. The S&P 500 Index is a broad market-weighted average of U.S. blue-chip companies. This index is unmanaged andinvestors cannot actually make investments in this index.
3. Morgan Stanley Capital International Europe, Australasia and Far East Index (“EAFE”) is an unmanaged index of com-panies throughout the world in proportion to world stock market capitalizations, excluding the U.S. and Canada.This index is unmanaged and investors cannot actually make investments in this index.
4. The NASDAQ Composite Index is a market value weighted index of all common stocks listed on NASDAQ. This indexis unmanaged and investors cannot actually make investments in this index.
5. Total return includes change in share prices and in each case includes reinvestment of any dividends and capital gaindistributions.
The performance information for The Oakmark Select Fund, The Oakmark Small Cap Fund, The Oakmark GlobalFund, The Oakmark International Fund and The Oakmark International Small Cap Fund does not reflect the impo-sition of a 2% redemption fee on shares held by an investor less than 90 days. The purpose of this redemption feeis to deter market timers.
6. Portfolio holdings are subject to change without notice and are not intended as recommendations of individualstocks.
7. During the period since inception (8/4/99 - 12/31/02), IPOs contributed an annualized 2.51% to the performanceof The Oakmark Global Fund. As the IPO environment changes and the total net assets of the Fund grow, theimpact of IPOs on performance is expected to diminish. “IPO” stands for Initial Public Offering, which is the firstsale of stock by a company to the public.
8. EPS refers to Earnings Per Share and is calculated by dividing total earnings by the number of shares outstanding.
56 T H E O A K M A R K F A M I LY O F F U N D S
9. The Lipper Large Cap Value Fund Index measures the performance of the thirty largest U.S. large-cap value fundstracked by Lipper. This index is unmanaged and investors cannot actually make investments in this index.
10. Morningstar is an independent monitor of mutual fund performance. The Oakmark Fund ranked #105 out of 827,#134 out of 482 and #9 out of 162 funds in the Large Cap Value Funds category for one, five and ten years, respec-tively, as of 12/31/02.
11. After tax returns are presented as supplemental information to comments in the report from the portfolio managers.The Fund’s “Return after taxes on distributions” shows the effect of taxable distributions, but assumes that you stillhold the Fund shares at the end of the period. The Fund’s “Return after taxes on distributions and sale of Fund shares”shows the effect of both taxable distributions and any taxable gain or loss that would be realized if the Fund shareswere purchased at the beginning and sold at the end of the specified period. After-tax returns are calculated usingthe historical individual federal marginal income tax rates in effect at the time of each distribution and assumed sale,but do not reflect the impact of local and state taxes. Actual after-tax returns depend on the investor’s tax situationand may differ from those shown, and the after-tax returns shown are not relevant to investors who hold their Fundshares through tax-deferred accounts such as 401(k) plans or individual retirement accounts. Past performance,before and after taxes, cannot predict future investment results.
12. The S&P MidCap 400 is an unmanaged broad market-weighted index of 400 stocks that are in the next tier downfrom the S&P 500 and that are chosen for market size, liquidity, and industry group representation. This index isunmanaged and investors cannot actually make investments in this index.
13. The Lipper Mid Cap Value Fund Index measures the performance of the thirty largest U.S. mid-cap value fundstracked by Lipper. This index is unmanaged and investors cannot actually make investments in this index.
14. The Russell 2000 Index is an unmanaged, market-weighted index, with dividends reinvested, of 2,000 small com-panies, formed by taking the largest 3,000 small companies and eliminating the largest 1,000 of those companies.This index is unmanaged and investors cannot actually make investments in this index.
15. The S&P Small Cap 600 Index measures the performance of selected U.S. stocks with small market capitalizations.This index is unmanaged and investors cannot actually make investments in this index.
16. The Lipper Small Cap Value Fund Index measures the performance of the thirty largest U.S. small-cap value fundstracked by Lipper. This index is unmanaged and investors cannot actually make investments in this index.
17. The Lipper Balanced Fund Index measures the performance of the thirty largest U.S. balanced funds tracked by Lip-per. This index is unmanaged and investors cannot actually make investments in this index.
18. The Lehman Govt./Corp. Bond Index is an unmanaged index that includes the Lehman Government and LehmanCorporate indices. This index is unmanaged and investors cannot actually make investments in this index.
19. The MSCI World Index is made up of 20 country sub-indexes, including the stock exchanges of the U.S., Europe,Canada, Australia and New Zealand, and the Far East. This index is unmanaged and investors cannot actually makeinvestments in this index.
20. The Lipper Global Fund Index measures the performance of the 30 largest mutual funds that invest in securitiesthroughout the world. This index is unmanaged and investors cannot actually make investments in this index.
21. The Nikkei Index is an Index of 225 leading stocks traded on the Tokyo Stock Exchange. This index is unmanagedand investors cannot actually make investments in this index.
22. NAV stands for Net Asset Value. NAV is the dollar value of a single mutual fund share, based on the value of theunderlying assets of the fund minus its liabilities divided by the number of shares outstanding.
23. The Morgan Stanley World Ex U.S. Index is made up of 19 country sub-indexes, excluding the U.S. This index isunmanaged and investors cannot actually make investments in this index.
24. The Lipper International Funds Index reflects the net asset value weighted total return of the 30 largest internationalequity funds. This index is unmanaged and investors cannot actually make investments in this index.
25. The Lipper International Small Cap Average includes 100 mutual funds that invest in securities whose primary mar-kets are outside of the U.S. This index is unmanaged and investors cannot actually make investments in this index.
57T H E O A K M A R K F A M I LY O F F U N D S

Trustees and Officers
THE OAKMARK FAMILY OF FUNDS
58 T H E O A K M A R K F A M I LY O F F U N D S
The board of trustees has overall responsibility for the conduct of the affairs of Harris Associates InvestmentTrust (“Trust”), and its seven series, The Oakmark Family of Funds. Each trustee serves until the next annualmeeting of shareholders and until the election and qualification of his or her successor, or until he or shedies, resigns or is removed. Each trustee must retire at the end of the calendar year in which the trusteeattains the age of 72. The board of trustees may fill any vacancy on the board provided that after suchappointment, at least two-thirds of the trustees have been elected by the shareholders. No person shall beappointed or elected to serve as a trustee after attaining the age of 65. The shareholders may remove a trusteeby a vote of two-thirds of the outstanding shares of the Trust at any meeting of shareholders called for thepurpose of removing such trustee.
The board of trustees elects or appoints the officers of the Trust. The president, any vice president, treas-urer and secretary serves until the election and qualification of his or her successor, or until he or she dies,resigns, or is removed or disqualified. Each other officer shall serve at the pleasure of the board of trustees.The board of trustees may remove any officer at any time, with or without cause, by the vote of a major-ity of the trustees then in office.
The names and ages of the trustees and officers, the position each holds with the Trust, the date each wasfirst elected to office, their principal business occupations during the last five years and other directorshipsheld are shown below.
Name and Age at September 30, 2002, Positions Held with the Trust, Date First Elected orAppointed to Office, Principal Occupations During Past 5 Years, Other Directorships Held
Trustee who is an “interested person”*
Peter S. Voss, 55, Trustee, 1995President and Chief Executive Officer, CDC IXIS Asset Management North America, L.P., formerly knownas Nvest Companies, L.P. and its predecessor firms (investment management); Director, Harris Associ-ates, Inc. (“HAI”). Chairman of the Board, AEW Real Estate Income Fund (an closed-end investmentcompany); Chairman of the Board and Chief Executive Officer, CDC Nvest Funds (an open-end invest-ment company—14 portfolios).
Trustees who are not “interested persons”
Victor A. Morgenstern, 59, Trustee and Chairman of the Board of Trustees, 1991Chairman of the Board and Chief Executive Officer, Resolute Advisors (private investment manage-ment firm); Principal, Valor Equity Partners, LLC (private equity fund); formerly, Chairman of the Board,HAI, 1996-2000 and President and Chief Executive Officer, prior thereto; Chairman, Harris Partners,L.L.C., 1995-2000, Director, Bio-Sante Pharmaceuticals, Inc.
Michael J. Friduss, 60, Trustee, 1995Principal, MJ Friduss & Associates, Inc. (telecommunications consultants). None.
Thomas H. Hayden, 51, Trustee, 1995Executive Vice President, Campbell Mithun (advertising and marketing communication agency). None.
Christine M. Maki, 41, Trustee, 1996Vice President—Tax, Hyatt Corporation (hotels and resorts). None.

Trustees and Officers cont.
59T H E O A K M A R K F A M I LY O F F U N D S
Allan J. Reich, 54, Trustee, 1993Vice Chairman of the law firm D’Ancona & Pflaum LLC. None.
Marv R. Rotter, 56, Trustee, 1996Senior Advisor to President and CEO of AXA Advisors, LLC (formerly named Rotter & Associates), since1999, and General Manager, prior thereto (financial services firm). None.
Burton W. Ruder, 58, Trustee, 1995President, The Academy Financial Group (venture capital investment and transaction financing firm);Manager, Cedar Green Associates (real estate management firm). None.
Gary N. Wilner, M.D., 62, Trustee, 1993Senior Attending Physician, Evanston Hospital; Medical Director—CardioPulmonary Wellness Program,Evanston Hospital Corporation. None.
Officers of the Trust
James P. Benson, 45, Vice President and Portfolio Manager (The Oakmark Small Cap Fund), 2000Portfolio Manager and Analyst, Harris Associates L.P. (“HALP”), since 1997. None.
Henry R. Berghoef, 53, Vice President and Portfolio Manager (The Oakmark Select Fund), 2000Associate Director of Research, Portfolio Manager and Analyst, HALP. None.
Kevin G. Grant, 38, Vice President and Portfolio Manager (The Oakmark Fund), 2000Portfolio Manager and Analyst, HALP. None.
David G. Herro, 41, Vice President and Portfolio Manager (The Oakmark International Fund and The Oak-mark International Small Cap Fund), 1992Portfolio Manager and Analyst, HALP. None.
Gregory L. Jackson, 36, Vice President and Portfolio Manager (The Oakmark Global Fund), 2000Portfolio Manager and Analyst, HALP, since July 1998; Portfolio Manager and Analyst, Yacktman AssetManagement Inc., prior thereto. None.
John J. Kane, 31, Assistant Treasurer, 1999Manager—Mutual Fund and Institutional Services, HALP. None.
Robert Levy, 52, President, 2001Director, President and Chief Executive Officer, HAI, since 1997; Chief Executive Officer, Harris Associ-ates Securities L.P. (“HASLP”), since 1995; Chairman of the Board and Chief Investment Officer, since2001, Chief Executive Officer, since 1997 and President, since 1996, HALP. None.
Clyde S. McGregor, 49, Vice President and Portfolio Manager (The Oakmark Small Cap Fund and The Oak-mark Equity and Income Fund), 1995Portfolio Manager and Analyst, HALP. None.
Anita M. Nagler, 46, Vice President, 2001Managing Director of Alternative & International Investing Group, HAI since 2001; formerly, ChiefOperating Officer and Vice President, HAI, General Counsel, HALP, Chief Operating Officer and GeneralCounsel, HASLP, 2000-2001; Chief Legal Officer, HASLP, prior thereto. None.
60 T H E O A K M A R K F A M I LY O F F U N D S
William C. Nygren, 43, Vice President and Portfolio Manager (The Oakmark Fund and The Oakmark SelectFund), 1996Portfolio Manager and Analyst, HALP; formerly, Director of Research, HALP, 1990-1998. None.
John R. Raitt, 47, Vice President, 2002Chief Operating Officer, HALP, since 2001; Director of Research, HALP since 1998; Associate Director ofResearch and Analyst, HALP, prior thereto. None.
Janet L. Reali, 51, Vice President and Secretary, 2001Vice President, General Counsel and Secretary, HALP, since 2001; formerly, Senior Executive Vice Presi-dent, General Counsel and Secretary, Everen Capital Corp. and Everen Securities, Inc. 1995-1999(broker/dealer). None.
Ann W. Regan, 54, Vice President—Shareholder Operations and Assistant Secretary, 1996Director of Mutual Fund Operations, HALP. None.
Kristi L. Rowsell, 36, Treasurer, 2000Director, Chief Financial Officer and Treasurer, HAI; Chief Financial Officer, HALP and HASLP, since 1999;Assistant Treasurer, HALP, prior thereto. None.
Edward A. Studzinski, 53, Vice President and Portfolio Manager (The Oakmark Equity and Income Fund),2000 Portfolio Manager and Analyst, HALP. None.
Michael J. Welsh, 39, Vice President and Portfolio Manager (The Oakmark Global Fund, The OakmarkInternational Fund and The Oakmark International Small Cap Fund), 1997Portfolio Manager and Analyst, HALP. None.
* Mr. Voss is a trustee who is an “interested person” of the Funds as defined in the Investment CompanyAct of 1940, because he is a director of HAI, the general partner and manager of HALP, the investmentadviser to the Funds. Mr. Voss is also the President and Chief Executive Officer of CDC IXIS Asset Man-agement North America, L.P. the parent company of HALP.
The business address of the officers and trustees is Two North LaSalle Street, #500, Chicago, Illinois 60602.
The Statement of Additional Information (SAI) contains further information about the trustees and is avail-able without charge upon your request by calling 1-800-625-6275.
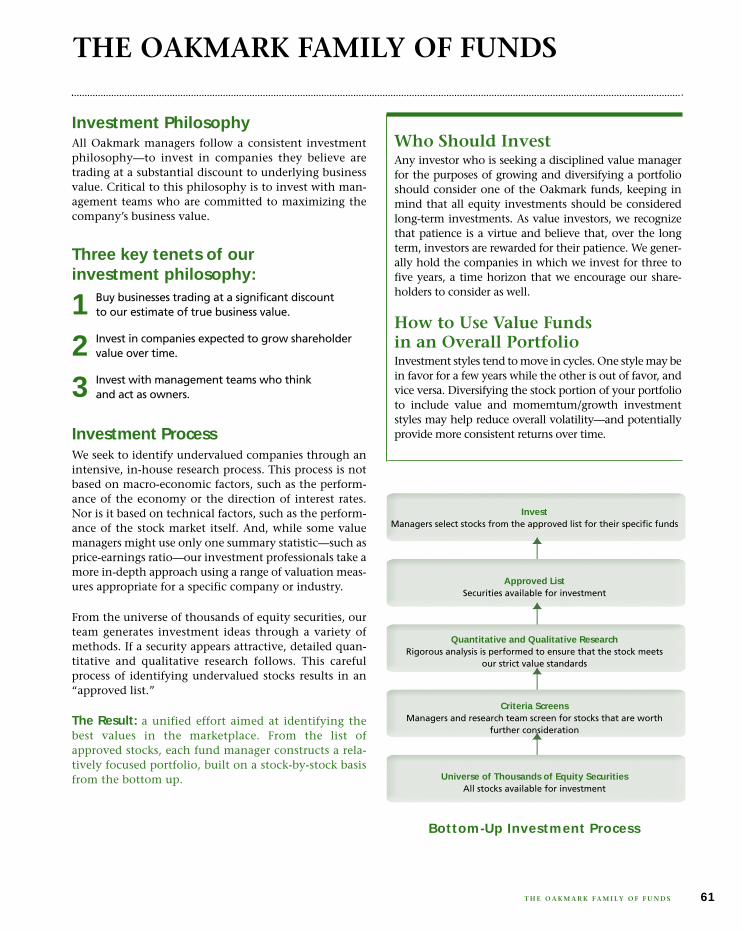
InvestManagers select stocks from the approved list for their specific funds
Approved ListSecurities available for investment
Quantitative and Qualitative ResearchRigorous analysis is performed to ensure that the stock meets
our strict value standards
Criteria ScreensManagers and research team screen for stocks that are worth
further consideration
Universe of Thousands of Equity SecuritiesAll stocks available for investment
Bottom-Up Investment Process
Who Should InvestAny investor who is seeking a disciplined value managerfor the purposes of growing and diversifying a portfolioshould consider one of the Oakmark funds, keeping inmind that all equity investments should be consideredlong-term investments. As value investors, we recognizethat patience is a virtue and believe that, over the longterm, investors are rewarded for their patience. We gener-ally hold the companies in which we invest for three tofive years, a time horizon that we encourage our share-holders to consider as well.
How to Use Value Funds in an Overall PortfolioInvestment styles tend to move in cycles. One style may bein favor for a few years while the other is out of favor, andvice versa. Diversifying the stock portion of your portfolioto include value and momemtum/growth investmentstyles may help reduce overall volatility—and potentiallyprovide more consistent returns over time.
Investment PhilosophyAll Oakmark managers follow a consistent investmentphilosophy—to invest in companies they believe aretrading at a substantial discount to underlying businessvalue. Critical to this philosophy is to invest with man-agement teams who are committed to maximizing thecompany’s business value.
Three key tenets of our investment philosophy:
1 Buy businesses trading at a significant discount to our estimate of true business value.
2 Invest in companies expected to grow shareholdervalue over time.
3 Invest with management teams who think and act as owners.
Investment ProcessWe seek to identify undervalued companies through anintensive, in-house research process. This process is notbased on macro-economic factors, such as the perform-ance of the economy or the direction of interest rates.Nor is it based on technical factors, such as the perform-ance of the stock market itself. And, while some valuemanagers might use only one summary statistic—such asprice-earnings ratio—our investment professionals take amore in-depth approach using a range of valuation meas-ures appropriate for a specific company or industry.
From the universe of thousands of equity securities, ourteam generates investment ideas through a variety ofmethods. If a security appears attractive, detailed quan-titative and qualitative research follows. This carefulprocess of identifying undervalued stocks results in an“approved list.”
The Result: a unified effort aimed at identifying thebest values in the marketplace. From the list of approved stocks, each fund manager constructs a rela-tively focused portfolio, built on a stock-by-stock basisfrom the bottom up.
THE OAKMARK FAMILY OF FUNDS
T H E O A K M A R K F A M I LY O F F U N D S 61

Multiple – A ratio used to measure a stock’s valua-tion, usually greater than 1. Sometimes used to meanprice/earnings ratio.
P/B or Price-to-Book Ratio – A stock’s capitalizationdivided by its book value. The value is the same whetherthe calculation is done for the whole company or on aper-share basis.
P/E or Price-to-Earnings Ratio – The most commonmeasure of a stock’s valuation. It is equal to a stock’scapitalization divided by its after-tax earnings over a12-month period. The value is the same whether thecalculation is done for the whole company or on aper-share basis. Equivalently, the cost an investor ina given stock must pay per dollar of current annualearnings. Also called earnings multiple.
Share repurchase – Program through which a corpo-ration buys back its own shares in the open market,typically an indication that the corporation’s man-agement believes the stock price is undervalued.
Value investing – Investors who utilize valuationmeasures such as business value (including growthrate), price/earnings ratio, price/book ratio, and yieldto gauge the attractiveness of a company. Managerswho employ a value investment style believe that thetrue, underlying value of a company is not reflectedin its current share price, and, over time, the pricehas potential to increase as the market recognizes theoverall value of the business. Value stocks sell at rel-atively low prices in relation to their underlyingbusiness value, earnings, or book value.
Stocks become undervalued for a variety of rea-sons, including an overall market decline, or when aspecific industry falls into disfavor and investors viewall companies in that industry in the same light. Con-sequently, an individual company’s stock price mayfall, even though it may be only temporarily affectedby the industry’s problems and its underlying valuehas remained unchanged.
“x times earnings” (“12 times earnings”) – Another wayto express a stock’s price-to-earnings (P/E) ratio. Astock with a P/E ratio of 12 sells at 12 times earnings.
Book value – A company’s common stock equity as itappears on a balance sheet, equal to total assets minusliabilities, preferred stock, and intangible assets such asgoodwill. A company’s book value often differs sub-stantially from economic value, especially in industriessuch as media.
Business value/Intrinsic value – The perceived or esti-mated actual value of a security, as opposed to itscurrent market price or book value. Business valuecan be evaluated based on what a knowledgeablebuyer would pay for a business if the company weresold in its entirety.
Growth investing – Investors who look for companiesbased on whether the stock of a company is growingearnings and/or revenue faster than the industry as awhole or the overall market. Growth investors gen-erally expect high rates of growth to persist, and thestock, in turn, to deliver returns exceeding the mar-ket’s. A growth mutual fund is generally one thatemphasizes stocks believed to offer above-averagegrowth prospects, with little to no emphasis on thestock’s current price.
M & A (Mergers & Acquisitions) – Merger: the com-bining of two or more entities into one, through apurchase acquisition or a pooling of interests. Acqui-sition: can also be called a takeover, and is defined asacquiring control of a corporation, called a target, bystock purchase or exchange, either hostile or friendly.
Market capitalization (market cap or cap) – The mar-ket price of an entire company on any given day, calculated by multiplying the number of shares outstanding by the price per share.
Momentum investing – Approach to investing basedon the belief that stock price trends are likely to con-tinue. Momentum investors tend to buy stocks thathave been outperforming the market and to sell thosestocks when their relative performance deteriorates.Momentum investors do not consider a company’sunderlying value or fundamentals in their invest-ment decisions.
T H E O A K M A R K F A M I LY O F F U N D S
The Oakmark Glossary
62

(This page has been intentionally left blank.)
63T H E O A K M A R K F A M I LY O F F U N D S
(This page has been intentionally left blank.)
64 T H E O A K M A R K F A M I LY O F F U N D S

Investment AdviserHarris Associates L.P.Two North LaSalle StreetChicago, Illinois 60602-3790
Transfer AgentCDC IXIS Asset Management Services, Inc.Attention: The Oakmark Family of FundsP.O. Box 8510Boston, Massachusetts 02266-8510
Legal CounselBell, Boyd & Lloyd LLCChicago, Illinois
Independent AuditorsDeloitte & Touche LLPChicago, Illinois
For More Information:Please call 1-800-OAKMARK(1-800-625-6275)or 617-449-6274
Websitewww.oakmark.com
Other Information
THE OAKMARK FAMILY OF FUNDS
This report is submitted for the general information of the shareholders of the Funds. The report is notauthorized for distribution to prospective investors in the Funds unless it is accompanied or preceded by acurrently effective prospectus of the Funds. No sales charge to the shareholder or to the new investor is made inoffering the shares of the Funds.
Letter from the President . . . . . . . . . . . . . . . . . . . . . . . . . . . . . . . . . . . . . . . . . . . . . . . . . 1
Summary Information. . . . . . . . . . . . . . . . . . . . . . . . . . . . . . . . . . . . . . . . . . . . . . . . . . . . 2
Commentary on The Oakmark and Oakmark Select Funds . . . . . . . . . . . . . . . . . . . . 4
The Oakmark FundLetter from the Portfolio Managers. . . . . . . . . . . . . . . . . . . . . . . . . . . . . . . . . . . . . . . . . . 6
Schedule of Investments . . . . . . . . . . . . . . . . . . . . . . . . . . . . . . . . . . . . . . . . . . . . . . . . . . 7
The Oakmark Select FundLetter from the Portfolio Managers. . . . . . . . . . . . . . . . . . . . . . . . . . . . . . . . . . . . . . . . . 11
Schedule of Investments . . . . . . . . . . . . . . . . . . . . . . . . . . . . . . . . . . . . . . . . . . . . . . . . . 12
The Oakmark Small Cap FundLetter from the Portfolio Managers. . . . . . . . . . . . . . . . . . . . . . . . . . . . . . . . . . . . . . . . . 14
Schedule of Investments . . . . . . . . . . . . . . . . . . . . . . . . . . . . . . . . . . . . . . . . . . . . . . . . . 16
The Oakmark Equity and Income FundLetter from the Portfolio Managers. . . . . . . . . . . . . . . . . . . . . . . . . . . . . . . . . . . . . . . . . 20
Schedule of Investments . . . . . . . . . . . . . . . . . . . . . . . . . . . . . . . . . . . . . . . . . . . . . . . . . 23
The Oakmark Global FundLetter from the Portfolio Managers. . . . . . . . . . . . . . . . . . . . . . . . . . . . . . . . . . . . . . . . . 30
Global Diversification Chart . . . . . . . . . . . . . . . . . . . . . . . . . . . . . . . . . . . . . . . . . . . . . . 32
Schedule of Investments . . . . . . . . . . . . . . . . . . . . . . . . . . . . . . . . . . . . . . . . . . . . . . . . . 33
Commentary on The International and International Small Cap Funds . . . . . . . . 38
The Oakmark International FundLetter from the Portfolio Managers. . . . . . . . . . . . . . . . . . . . . . . . . . . . . . . . . . . . . . . . . 39
International Diversification Chart . . . . . . . . . . . . . . . . . . . . . . . . . . . . . . . . . . . . . . . . 41
Schedule of Investments . . . . . . . . . . . . . . . . . . . . . . . . . . . . . . . . . . . . . . . . . . . . . . . . . 42
The Oakmark International Small Cap FundLetter from the Portfolio Managers. . . . . . . . . . . . . . . . . . . . . . . . . . . . . . . . . . . . . . . . . 48
International Diversification Chart . . . . . . . . . . . . . . . . . . . . . . . . . . . . . . . . . . . . . . . . 50
Schedule of Investments . . . . . . . . . . . . . . . . . . . . . . . . . . . . . . . . . . . . . . . . . . . . . . . . . 51
Trustees and Officers . . . . . . . . . . . . . . . . . . . . . . . . . . . . . . . . . . . . . . . . . . . . . . . . . . . . 58
Oakmark Philosophy and Process . . . . . . . . . . . . . . . . . . . . . . . . . . . . . . . . . . . . . . . . . 61
The Oakmark Glossary. . . . . . . . . . . . . . . . . . . . . . . . . . . . . . . . . . . . . . . . . . . . . . . . . . . 62
For More Information
Access our web site at www.oakmark.com to obtain a prospectus, an application orperiodic reports, or call 1-800-OAKMARK (1-800-625-6275) or (617) 449-6274.
2003 First Quarter Report
THE OAKMARK FAMILY OF FUNDS
Turn to the end of this report to read about Oakmark’s Philosophyand Process and look up financial terms in the Oakmark Glossary.
Merrill Corporation - Harris/Oakmark 1st QR ED/E N30B2 1/2003 | jscott | 21-Jan-03 17:44 | 03chi1023.a | Sequence: 2CLEANCHKSUM Content: 11923 Layout: 25311 Graphics: No Graphics
NAME: Harris/Oakmark 1st QR ED/E N30B2 1/2003PROJ: p1009chi03 JOB: 03chi1023 CYCLE#;BL#: 9; 0 TRIM: 15.5" x 9.75" DOC TYPE: OtherAS: Merrill Chicago: 312-786-6300
COMPOSITECOLORS: Black, PANTONE 364 CVU, PANTONE 541 CVUGRAPHICS: none

1-8 0 0-OA K MA R Kwww.oakmark.com
Advised by Harris Associates L.P.
P.O. Box 8510Boston, MA 02266-8510
D E C E M B E R 3 1 , 2 0 0 2
F I R S T Q U A R T E R R E P O R T
The Oakmark Funds are distributed by HarrisAssociates Securities L.P., member NASD. Dateof first use: January 2003.
Merrill Corporation - Harris/Oakmark 1st QR ED/E N30B2 1/2003 | jscott | 21-Jan-03 17:44 | 03chi1023.a | Sequence: 1CLEANCHKSUM Content: 36095 Layout: 9741 Graphics: 3130
NAME: Harris/Oakmark 1st QR ED/E N30B2 1/2003PROJ: p1009chi03 JOB: 03chi1023 CYCLE#;BL#: 9; 0 TRIM: 15.5" x 9.75" DOC TYPE: OtherAS: Merrill Chicago: 312-786-6300
COMPOSITECOLORS: Black, Cyan, Magenta, PANTONE 484 cmyk, PANTONE 548 cmyk, Yellow, Yellow copy, ~note-color 1, ~note-color 2GRAPHICS: LogoCMYK, TRAPTYPE, TWIG2