(2003) embodied energy materials
TRANSCRIPT

Centre for Building Performance Research
EMBODIED ENERGY AND CO2 COEFFICIENTS FOR NZ BUILDING MATERIALS
Andrew Alcorn Research and publication by the Centre for Building Performance Research. Victoria University of Wellington Prepared with support from Building Research Association of New Zealand Wellington March 2003

E m b o d i e d E n e r g y a n d C O 2 C o e f f i c i e n t s f o r N Z B u i l d i n g M a t e r i a l s
2
ISSN 1172-563X ISBN 0-475-11099-4 Report Series Centre for Building Performance Research Report Alcorn, Andrew Embodied Energy and CO2 Coefficients for New Zealand Building Materials Centre for Building Performance Research, Victoria University of Wellington, P.O. Box 600, Wellington, New Zealand. Phone + 64 4 802 6200 Facsimile + 64 4 802 6204 E-mail [email protected] The Document Register is provided at the rear. Word processor reference: reference info EE & CO2 report.wpd

E m b o d i e d E n e r g y a n d C O 2 C o e f f i c i e n t s f o r N Z B u i l d i n g M a t e r i a l s
C e n t r e f o r B u i l d i n g P e r f o r m a n c e R e s e a r c h , V i c t o r i a U n i v e r s i t y o f W e l l i n g t o n
3
TABLE OF CONTENTS Page 1 INTRODUCTION 5 1.1 Readership 5 1.2 Acknowledgements 5 1.3 Introduction 5 2 METHODOLOGY 6 2.1 Analysis Conventions 6 2.1.1 Convention Changes - Feedstock Energy 6 2.1.2 Conventions Used 7 2.2 Energy Input-Output Factor 8 2.2.1 Table of Energy Input-Output Factors 9 2.3 Imported Energy and Imported CO2 9 2.4 Transport Energy 9 2.4.1 Table of Transport Energy Intensities by Mode 9 2.5 Cement 10 2.6 Timber CO2 Absorption 10 2.7 Spreadsheet 11 3 CO2 EMISSION FACTORS 12 3.1 Industry Emission Factors 12 3.1.1 Table of Selected Industry Emission Factors 12 3.2 Derivation of CO2 Emission Factors 12 3.2.1 Coal 13 3.2.2 Gas 13 3.2.3 Geothermal 13 3.2.4 Electricity 14 3.2.4.1 Coal 14 3.2.4.2 Gas 14 3.2.4.3 Geothermal 14 3.2.4.4 Electricity Emission Factor 14 3.3 Table of CO2 Emission Factors 15 4 EXAMPLE ANALYSIS 16 4.1 Methodology 16 4.2 Recycled Steel in New Zealand 16 4.3 Ingredients 17 4.3.1 Spreadsheet for Recycled Steel Reinforcing and Sections 18 4.4 Energy Inputs 19 4.5 Transport 19 4.6 Capital Equipment 19 4.7 Outputs 19 4.8 Totals 20 4.9 Other Information 20

E m b o d i e d E n e r g y a n d C O 2 C o e f f i c i e n t s f o r N Z B u i l d i n g M a t e r i a l s
4
5 CONCLUSION 21 5.1 Notable Materials 21 5.2 Further Research 21 6 REFERENCES 22 APPENDIX 24 DISCLAIMER 26 DOCUMENT REGISTER 27

E m b o d i e d E n e r g y a n d C O 2 C o e f f i c i e n t s f o r N Z B u i l d i n g M a t e r i a l s
5
1 INTRODUCTION 1.1 Readership This report is intended for policy makers, building material producers. environmental engineers, environmental researchers, building designers and specifiers. 1.2 Acknowledgments It is a great pleasure to thank the Building Research Association of New Zealand (BRANZ) for the invitation to carry out this work, and to acknowledge their funding support for this project, and for the earlier embodied energy research at the CBPR. In particular I should like to thank Roman Jaques for his professional and friendly assistance. I should also like to thank my colleagues at the CBPR for their support and feedback, especially Mike Donn for his precise grasp of the issues, and Henry Skates for his friendly assistance. 1.3 Introduction Emerging environmental impacts demand detailed knowledge to progress towards sustainable practices. The embodied energy of human made objects has been used as a defacto scale to assess environmental impact and reduce unsustainable practices. Connected with the pressing issue of climate change, embodied CO2 analysis is the next step in achieving a better understanding of environmental impacts, and is directly linked with embodied energy analysis by the component of emitted carbon dioxide (CO2) from most energy sources. The principal source of CO2 in building materials is the combustion of fossil fuel in their production, or the use of ingredients or energy sources that in turn required a significant use of fossil fuel. By applying known CO2 emission rates for various fuels to the use of those fuels in producing individual building materials, an overall embodied CO2 content can be established for each material. The quantity of each fuel or energy source contributing to the final product is known from an energy analysis of that material. An accurate energy analysis method is thus a necessary precursor to a reliable CO2 analysis. A process-based hybrid energy analysis was used as the basis of this research. For a discussion of the particulars of hybrid and other analysis methods, refer to Alcorn, 1998. As part of its effort to reduce CO2 emissions, New Zealand is intending to ratify the 1997 Kyoto protocol in 2002. Of strategic importance, especially to the building industry, is accurate identification of the CO2 content of materials used in the built environment, since the energy use of buildings is typically around 50% of total national energy usage in developed countries. This report details the methods used to take data from previous embodied energy work by the CBPR and to apply CO2 emission factors to it to derive embodied CO2 coefficients for New Zealand building materials.

E m b o d i e d E n e r g y a n d C O 2 C o e f f i c i e n t s f o r N Z B u i l d i n g M a t e r i a l s
6
2 METHODOLOGY Data from a previous study (Alcorn, 1998) is used in this study, and upgraded to include embodied CO2 coefficients. Energy inputs to each process have been analysed for their CO2 content. Each material has been re-calculated, with any new readily available data included, and errors or omissions rectified. An example of the changes that have occurred is recycled aluminium, where the energy of collecting scrap aluminium has been added, along with the energy of the capital equipment. No specific data was available for these particular items, but it was decided to include proxies from closely related operations to improve the consistency of the results. 2.1 Analysis Conventions Embodied energy analysis has been noted during its history for large variation in results. The bulk of the discrepancies come about from the inherent uncertainty, distortions and variations of input-output data when it is used for energy analysis. Input-output analysis uses economic data that typically aggregates disparate materials and often several industries into one category. The (sometimes greatly) varying energy requirements for different production processes that fall within the same category cannot be reflected in the results of an input-output energy analysis unless significant extra work is done to adjust for such variations (at which point the analysis becomes a hybrid one). For example, in New Zealand there is one category for basic metal industries, which includes the production of aluminium and steel. However, because aluminium uses far more energy to produce a kilo of product, and because there is more aluminium production than any other metal in New Zealand, the energy attributed to other metals is exaggerated as they are lumped in with the higher energy use of aluminium. For all its varied and serious shortcomings, however, input-output analysis continues to be used because it is perceived as producing results quickly and easily, although they may not be any easier than those obtained by a process-based hybrid analysis. It also has the advantage of a 'global' coverage of inputs, as input-output tables account for the entire economy. Full process analysis or process-based hybrid analysis methods provide much more consistent results (Alcorn and Haslam, 1996). A process-based hybrid analysis has the advantage of being accurate, like a full process analysis, at the same time as being economical with resources, especially time. In addition to the basic method of analysis used, a number of conventions may or may not be employed that can significantly alter the results for individual materials. The particular conventions used (and why) are often difficult to discover. 2.1.1 Convention Changes - Feedstock Energy Unless otherwise noted, the methodology of this work follows established embodied energy analysis conventions, with a few departures from usual practice. One such departure that requires emphasis is that the energy of a feedstock has been treated differently in this study from the method used by the author in earlier embodied energy analyses. The change also differs from the usual methodology used by other researchers for the energy of feedstock. In this study, the calorific value of an ingredient used as a physical feedstock to a process is

E m b o d i e d E n e r g y a n d C O 2 C o e f f i c i e n t s f o r N Z B u i l d i n g M a t e r i a l s
7
not included. This contrasts with more common practice where, for example, the calorific value of the oil feedstock used to manufacture plastic would be included in the final embodied energy coefficient. This is to eliminate some fundamental inconsistencies that arise from the different treatment of materials depending on their immediate energy source, and to better reflect the underlying aim of embodied energy research, which is to understand energy use and to minimise it for environmental (and economic) reasons. The principal reason for minimizing energy use, from an environmental perspective, is to minimize emissions with a global warming potential, and to minimize resource use. It is for these reasons that the use of fossil fuels is regarded as problematic. Essentially, the stored solar energy of fossil fuels cannot be released at the current rate without significant environmental impact. Principally this comes in the form of CO2 emissions contributing to global warming. Thus, energy analysis tracks the use of fossil (and other) fuels so that the impacts can be accurately attributed to the end use. When, however, fossil fuel is acquired from the ground but not burnt, then the same CO2 impacts do not occur. Likewise, as an energy resource, if it is not burnt, it remains as an energy resource which might be burnt later. The only significant difference is that it resides on the surface of the planet, rather than beneath it. There are energy, CO2 and other environmental impact costs of getting the fossil fuel out of the ground, and converting it into a useable product, but these are accounted for. Waste plastic or other waste products embodying fossil fuels are sometimes used as fuel sources, eg, in electricity generation from municipal waste. These waste sources are sometimes regarded as having zero energy content, with the assumption that the energy use and CO2 emissions were attributed to the first use. In this instance the use of the energy potential and the release of the associated CO2 occurs when the product is burnt, and not before. Thus it is the process that uses such waste products as fuel that should incur the energy and CO2 ‘penalties’, whereas the first use should only incur the ‘penalties’ from extraction and conversion of the fossil fuel into a useable product. In this study, while the calorific value of an ingredient used as a feedstock is not included, the calorific value of an ingredient used as a fuel is included. Thus, the calorific value of bitumen used in making asphalt is not counted, but the calorific value of bitumen used as a bunker fuel is counted. (Bitumen, as a separate material, is calculated both as a fuel and as a physical feedstock.) Similarly, the calorific value of oil used as a feedstock to plastic manufacture is not counted, but the calorific value of oil used as a fuel for plastic manufacture is counted. 2.1.2 Conventions Used Energy figures, and the consequent CO2 emissions figures are based on the following methodology: • Solar energy is not included. For example, the solar energy input to the growing of trees
is not counted. • The energy of human labour is not included. For example, the muscular energy for
people to collect scrap paper for cellulose insulation, or fell trees for timber is not counted.
• The calorific value of an ingredient used as a physical feedstock to a process is not included. The calorific value of an ingredient used as a fuel is included, For example, the calorific value of bitumen used in making asphalt is not counted. (As a separate material bitumen is calculated both as a fuel and as a physical feedstock.) The calorific value of oil used as a feedstock to plastic manufacture is not counted. The calorific value of oil

E m b o d i e d E n e r g y a n d C O 2 C o e f f i c i e n t s f o r N Z B u i l d i n g M a t e r i a l s
8
used as a fuel to plastic manufacture is counted. • Secondary products have the proportion of energy used to make them included. For
example, fly-ash from the steel making process has an energy fraction from the entire steel plant attributed to it.
• The energy of waste or recycled products is treated as zero for physical ingredients, but the additional energy of collection or re-processing is attached to them. Waste products with a calorific value that are used as fuels have their calorific value as fuels included plus the energy of collection. For example, the energy of waste steel is treated as zero, but has the energy of collection included. The energy of waste lubricating oil used as a fuel has its calorific value included, as well as the energy of collection, but not the energy of extraction and processing into lubricating oil for its first use.
• The energy for international transport of ingredients is included. For example, the energy of transporting gypsum from Australia for use in cement production is counted in the cement figure, irrespective of where the ship was fueled.
• The energy of local transport to the material production site is included, but not the energy of transport from the factory gate to the point of use. For example, 1) The energy of transporting clay to the brick factory is included, but not the energy of transporting bricks to a construction site in Wellington. 2) The energy of transporting cement from the cement works to a concrete product making factory in Wellington is included, but not the energy of transporting the concrete blocks to a construction site in the Upper Hutt.
• The analysis method used is a process-based hybrid analysis as much as possible. This means that individual production processes are first analysed as far as is practical. All ingredients and energy sources used are analysed, with factors included for the production and distribution of energy, the transport of ingredients and the energy of the capital equipment used to make the material. The total energy is then divided by the output of the production facility. (See Alcorn, 1998)
• The energy to obtain energy and deliver it to the site is taken from input-output data (unless more specific data is available).
• The energy of each ingredient is taken from its own coefficient, or from reliable published sources or from input-output data, with preference in that order.
• The capital equipment energy of the production facility is accounted for. If the value of the production plant is known, an allowance based on input-output data for the MJ/$ value of that industry (or for machinery production or for buildings and construction, whichever is most appropriate to that facility) is included. If the value of the plant is not known, input-output data relating the average gross fixed capital formation to total output value for that industry is applied as a percentage of the sub-total for that product. (See Alcorn, 1998)
• The analysis is a “cradle to gate” method. That is, the limit of the analysis is the factory gate, with all inputs accounted for upstream of that point.
• All known physical inputs are included, unless noted otherwise. 2.2 Energy Input-Output Factor Each energy source requires energy to produce and deliver it to the factory. A factor to account for this is applied where such an input-out factor is not already included in the ingredient or fuel figure.
E m b o d i e d E n e r g y a n d C O 2 C o e f f i c i e n t s f o r N Z B u i l d i n g M a t e r i a l s
9
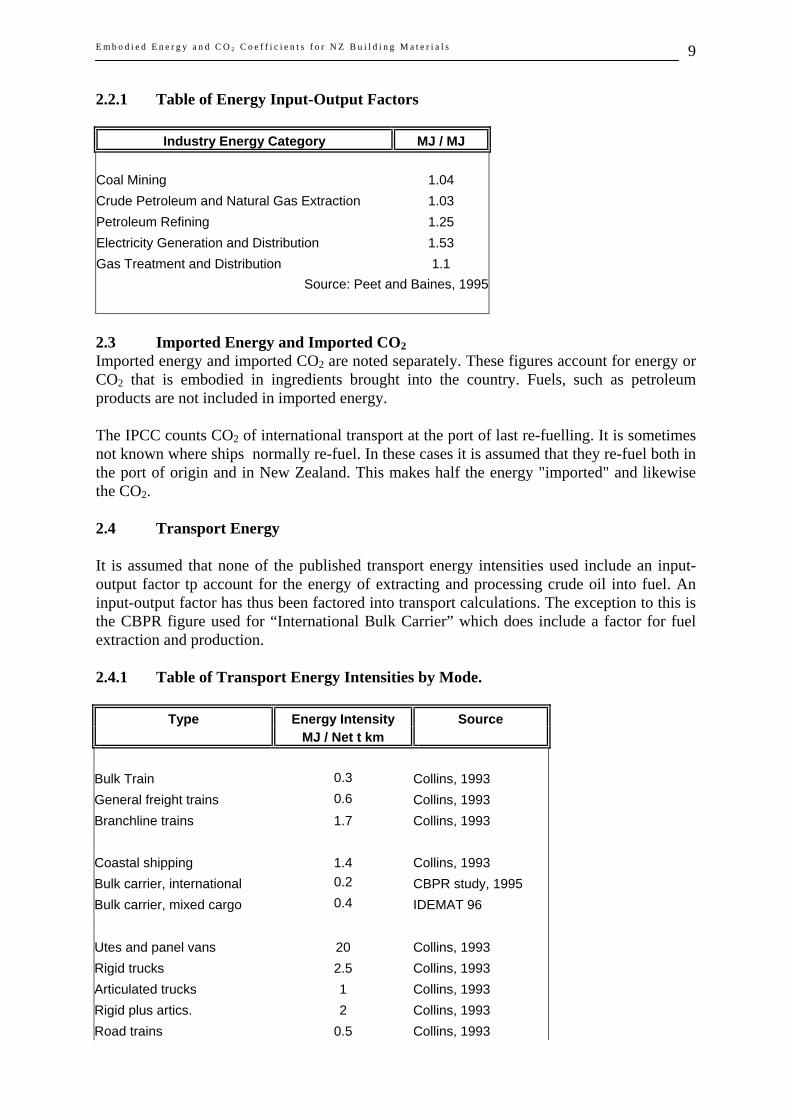
2.2.1 Table of Energy Input-Output Factors
Industry Energy Category MJ / MJ
Coal Mining 1.04 Crude Petroleum and Natural Gas Extraction 1.03 Petroleum Refining 1.25 Electricity Generation and Distribution 1.53 Gas Treatment and Distribution 1.1
Source: Peet and Baines, 1995
2.3 Imported Energy and Imported CO2 Imported energy and imported CO2 are noted separately. These figures account for energy or CO2 that is embodied in ingredients brought into the country. Fuels, such as petroleum products are not included in imported energy. The IPCC counts CO2 of international transport at the port of last re-fuelling. It is sometimes not known where ships normally re-fuel. In these cases it is assumed that they re-fuel both in the port of origin and in New Zealand. This makes half the energy "imported" and likewise the CO2. 2.4 Transport Energy It is assumed that none of the published transport energy intensities used include an input-output factor tp account for the energy of extracting and processing crude oil into fuel. An input-output factor has thus been factored into transport calculations. The exception to this is the CBPR figure used for “International Bulk Carrier” which does include a factor for fuel extraction and production. 2.4.1 Table of Transport Energy Intensities by Mode.
Type Energy Intensity Source MJ / Net t km
Bulk Train 0.3 Collins, 1993 General freight trains 0.6 Collins, 1993 Branchline trains 1.7 Collins, 1993 Coastal shipping 1.4 Collins, 1993 Bulk carrier, international 0.2 CBPR study, 1995 Bulk carrier, mixed cargo 0.4 IDEMAT 96 Utes and panel vans 20 Collins, 1993 Rigid trucks 2.5 Collins, 1993 Articulated trucks 1 Collins, 1993 Rigid plus artics. 2 Collins, 1993 Road trains 0.5 Collins, 1993

E m b o d i e d E n e r g y a n d C O 2 C o e f f i c i e n t s f o r N Z B u i l d i n g M a t e r i a l s
10
2.5 Cement As with other materials, the figures for cement manufacture have changed. Details on the changes for cement are given here as an example of the sorts of changes that have occurred since Alcorn, 1998 was published, and because cement is an especially significant building material. In New Zealand cement is produced in two plants, one which uses a wet process and the other a dry process. Dry process cement manufacture typically uses less energy. Data from a detailed analysis of cement processing in New Zealand (Jaques 2001) has been used to update the data used in Alcorn 1998. In particular this affects the results for the wet process New Zealand operation. Changes in the process method and energy sources are incorporated. The figures for wet and dry process manufacture are averaged proportionately to their national usage to arrive at the cement, average figure. The data from Jaques (2001) is used in the wet process calculations but modified by including the calorific value of waste oil used in the calcining process. The data for acquiring the limestone and marl is used in place of industry wide input-output data. The acquisition of limestone and marl is done by the manufacturer, whereas in the dry process plant, limestone and marl is mined by a separate company. Changes in the process include the use of slag and its transporting from Australia. The embodied energy coefficient used for slag assumes that slag production equals 28% of steel production, by weight, with energy being apportioned equally between the steel output and the output of the slag that gets used. The slag source is Australia, so a figure for Australian steel (Lawson, 1996) is the basis of calculations. and the use of waste lubricating oil as a fuel for the calcination process. Waste oil is used in the wet process as a fuel for calcination (Jaques, 2001). The transport energy for the collection of the waste oil is assumed to be similar to that for the collection of waste steel (Alcorn, 1998). The energy of obtaining the oil from fossil reserves is ignored, as this is accounted for in the first use (lubrication) of the oil. However, the calorific value of the oil as a fuel is included, as this has been preserved during its use as a lubricant, and would not rightly be included in an embodied energy analysis of lubricating oil. Figures for light fuel oil are used for the calorific value and emission factor. 2.6 Timber CO2 Absorption Timber products are calculated in two ways. They are calculated in the normal manner for the energy embodied up to the factory gate, and for the CO2 emitted in this production process. They are also calculated to account for the CO2 sequestered by the growing tree. This means that timber products have a negative CO2 emission coefficient, representing the net CO2 absorbed by the production of the product, including the growing of the tree (McLaren, 2001). Products that use waste timber feedstock, such as cellulose insulation, do not have the CO2 absorption benefits credited to them, as these are accounted for in the first use of that product. Calculating the net CO2 emission or absorption allows for the calculation of total emission or absorption balances of whole buildings or building systems.

E m b o d i e d E n e r g y a n d C O 2 C o e f f i c i e n t s f o r N Z B u i l d i n g M a t e r i a l s
11

E m b o d i e d E n e r g y a n d C O 2 C o e f f i c i e n t s f o r N Z B u i l d i n g M a t e r i a l s
12
2.7 Spreadsheet This study was conducted using an Excel spreadsheet. An example page is given in 4.3.1. In order to make the methodology and derivation of the coefficients as transparent as possible, details of the figures used, the assumptions and methodologies applied, and the data origin for significant cell entries are noted in the spreadsheet. To preserve the confidentiality that was a condition of obtaining much of the data, some of the spreadsheet cells are hidden.
E m b o d i e d E n e r g y a n d C O 2 C o e f f i c i e n t s f o r N Z B u i l d i n g M a t e r i a l s
13
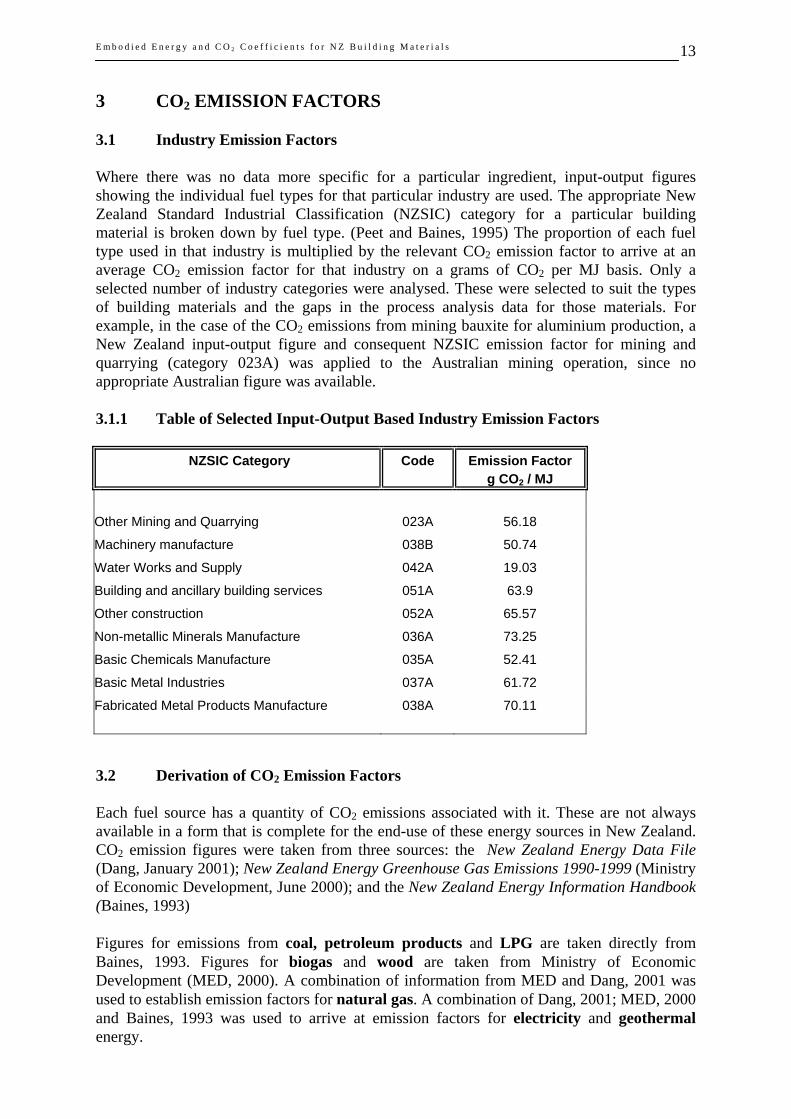
3 CO2 EMISSION FACTORS 3.1 Industry Emission Factors Where there was no data more specific for a particular ingredient, input-output figures showing the individual fuel types for that particular industry are used. The appropriate New Zealand Standard Industrial Classification (NZSIC) category for a particular building material is broken down by fuel type. (Peet and Baines, 1995) The proportion of each fuel type used in that industry is multiplied by the relevant CO2 emission factor to arrive at an average CO2 emission factor for that industry on a grams of CO2 per MJ basis. Only a selected number of industry categories were analysed. These were selected to suit the types of building materials and the gaps in the process analysis data for those materials. For example, in the case of the CO2 emissions from mining bauxite for aluminium production, a New Zealand input-output figure and consequent NZSIC emission factor for mining and quarrying (category 023A) was applied to the Australian mining operation, since no appropriate Australian figure was available. 3.1.1 Table of Selected Input-Output Based Industry Emission Factors
NZSIC Category Code Emission Factor g CO2 / MJ
Other Mining and Quarrying 023A 56.18
Machinery manufacture 038B 50.74
Water Works and Supply 042A 19.03
Building and ancillary building services 051A 63.9
Other construction 052A 65.57
Non-metallic Minerals Manufacture 036A 73.25
Basic Chemicals Manufacture 035A 52.41
Basic Metal Industries 037A 61.72
Fabricated Metal Products Manufacture 038A 70.11 3.2 Derivation of CO2 Emission Factors Each fuel source has a quantity of CO2 emissions associated with it. These are not always available in a form that is complete for the end-use of these energy sources in New Zealand. CO2 emission figures were taken from three sources: the New Zealand Energy Data File (Dang, January 2001); New Zealand Energy Greenhouse Gas Emissions 1990-1999 (Ministry of Economic Development, June 2000); and the New Zealand Energy Information Handbook (Baines, 1993) Figures for emissions from coal, petroleum products and LPG are taken directly from Baines, 1993. Figures for biogas and wood are taken from Ministry of Economic Development (MED, 2000). A combination of information from MED and Dang, 2001 was used to establish emission factors for natural gas. A combination of Dang, 2001; MED, 2000 and Baines, 1993 was used to arrive at emission factors for electricity and geothermal energy.
E m b o d i e d E n e r g y a n d C O 2 C o e f f i c i e n t s f o r N Z B u i l d i n g M a t e r i a l s
14
3.2.1 Coal Coal has various emission factors for the different grades. These are given in the table of Energy Emission Factors. While there are fugitive emissions of other greenhouse gases (CH4) associated with coal production, there are no other CO2 emissions. 3.2.2 Gas The CO2 emission factor used for gas as a fuel, 51.8 g CO2/MJ, is not that from Baines, but from Ministry of Economic Development, which averages daily flow statistics, and is thus more up to date (MED, 2000). Extracted gas shows a varying composition over both the short (daily) and long term. There has been a trend for the CO2 component of the gas stream to fall over recent years as the composition of the gas extracted changes over time (MED, 2000). Other fuel types do not display this variation in CO2 emissions. CO2 in high concentrations in the gas stream is removed from some distributed gas. Incomplete combustion while flaring, and any leakage during maintenance and distribution lead to ‘fugitive’ emissions of CO2 associated with the production and distribution of gas (MED, 2000). Energy used to extract and distribute gas through pipelines is derived from gas and is responsible for ‘own use’ emissions. Flaring/venting and distribution/transmission account for 286 kt CO2 p.a. (MED, 2000). Extraction and processing account for 363 kt CO2 p.a (Ibid.), but this must be apportioned to gas and oil in the ratio 2/3 gas and 1/3 oil (Dang, 2001). Thus 286 + (363 X 0.667) = 528 kt CO2 p.a. of fugitive and own use emissions attributable to gas. The final CO2 emission factor for gas is the sum of emissions for combustion of the gas, and the ‘fugitive’ and ‘own use’ emissions. Gas demand is 218.21 PJ p.a. Emissions for gas from flaring/venting and distribution/transmission are 528 / 218.21 = 2.42 kt CO2 / PJ, or 2.42 g CO2 / MJ. The final emission factors for gas are thus: Maui: 51.8 + 2.42 = 54.22 kt CO2 / PJ = 54.22 g CO2 / MJ Treated gas: 52.4 + 2.42 = 54.82 kt CO2 / PJ = 54.82 g CO2 / MJ Average gas: 52.1 + 2.42 = 54.52 kt CO2 / PJ = 54.52 g CO2 / MJ 3.2.3 Geothermal Because there is CO2 in the water/steam flow from geothermal fields, CO2 is released in the use of geothermal heat for electricity generation. Total CO2 emissions from geothermal energy are 386 kt CO2 p.a. (MED, 2000). Total energy use from geothermal energy is 103.94 PJ (Dang, January 2001). Thus, the overall emission factor for geothermal energy is 386 / 103.94 = 3.7 g CO2 /MJ.

E m b o d i e d E n e r g y a n d C O 2 C o e f f i c i e n t s f o r N Z B u i l d i n g M a t e r i a l s
15
3.2.4 Electricity CO2 emissions in electricity generation result from the combustion of gas and coal, from the geothermal gas stream, from flaring and transmission of gas, and from the use of gas in the extraction and processing of gas. Energy sources for electricity generation are: • Gas 23.3 % • Coal 3.9 % • Geothermal energy 6.4 % • Hydro 63.2 % Other renewables (biogas, industrial waste, wood and wind) have negligible CO2 emissions (less than 1 %) (Dang, January 2001). 3.2.4.1 Coal Coal for electricity generation (sub-bituminous) has an emission factor of 91.2 g CO2 /MJ (Baines, 1993). There are emissions of other greenhouse gases (CH4) associated with coal production, but no other fugitive CO2 emissions. The final emission factor for coal associated with electricity generation is thus: 91.2 x 0.039 = 3.56 g CO2 /MJ 3.2.4.2 Gas Gas for electricity generation is virtually all Maui gas (Baines, 1993) so has an emission factor of 54.22 g CO2/MJ. The final emission factor for electricity from burning gas is thus: 54.22 X 0.233 = 12.63 g CO2 /MJ 3.2.4.3 Geothermal Geothermal energy accounts for 6.4 % of electricity generation (Dang, Jan.2001, p100). The final emission factor for geothermal energy associated with electricity generation is thus: 3.7 X 0.064 = 0.24 g CO2 /MJ 3.2.4.4 Electricity Emission Factor The total emission factor for electricity is thus 3.56 + 12.63 + 0.24 = 16.43 g CO2 / MJ

E m b o d i e d E n e r g y a n d C O 2 C o e f f i c i e n t s f o r N Z B u i l d i n g M a t e r i a l s
16
3.3 Table of CO2 Emission Factors
Energy Source g CO2 / MJ g CO2 / l Source of Data
Coal, bituminous 88.8 Baines, 1993
Coal, sub-bituminous 91.2 Baines, 1993
Coal, lignite 95.2 Baines, 1993
Coal, All NZ production 90.4 Baines, 1993
All Petroleum Products 68 Baines, 1993
Petrol 66.6 2298 Baines, 1993
Diesel 68.7 2618 Baines, 1993
Heavy Fuel Oil 74.8 Baines, 1993
Light Fuel Oil 72.5 Baines, 1993
Electricity 16.43 Baines, 1993; MED, 2000; Dang, 2001
Gas, average 54.52 MED, 2000; Dang, January 2001
Gas, Maui 54.22 MED, 2000; Dang, January 2001
Gas, treated 54.82 MED, 2000; Dang, January 2001
LPG 60.4 1601 Baines, 1993
Geothermal 3.7 Baines, 1993; MED, 2000; Dang, 2001
Biogas 101 MED, 2000 (IPCC)
Wood 104.2 MED, 2000 (IPCC)

E m b o d i e d E n e r g y a n d C O 2 C o e f f i c i e n t s f o r N Z B u i l d i n g M a t e r i a l s
17
4 EXAMPLE ANALYSIS - RECYCLED STEEL The method of calculating the coefficients follows that used to calculate the embodied energy coefficients in Alcorn, 1998. The materials appearing in this report have, however, all been freshly calculated, and any new data that was available has been included. Additionally, any errors or omissions that were discovered have been corrected. The resultant changes in the embodied energy coefficients for some materials are recorded by notes appended to the materials database on an Excel spreadsheet. For example, recycled aluminium shows an embodied energy coefficient of 9 MJ/kg in comparison to the figure of 8.1 MJ/kg appearing in Alcorn, 1998. This is due to the inclusion of diesel for scrap collection, and an allowance for the energy of capital equipment, both of which were missing in the 1998 study. Recycled steel reinforcing and sections provides a typical example material to illustrate the method used. Calculations were done using an Excel spreadsheet. 4.1 Methodology This study treats the whole process of producing a material as one operation. It organizes the analysis into ingredients, energy inputs, transport, capital equipment, outputs, and extra information. This differs from other methods which breakdown the analysis into production stages (eg. raw materials extraction, transportation and various production stages). The ingredients, energy inputs, and transport are listed. Embodied energy coefficients for ingredients are calculated or taken from other sources. The majority of materials in this study use embodied energy coefficients from Alcorn, 1998. Where necessary, an input-output factor is applied to account for any incomplete portion of a process analysis. The embodied energy coefficient for an ingredient is converted to a coefficient per kilogram of product by relating it to the output of the operation studied. Emission factors are applied, using the method described in section 3, to arrive at an emission per kilogram of product for each ingredient. Where some or all of this is from imported energy or imported ingredients it is noted separately. A sub total of the energy and CO2 coefficients is used to calculate the capital equipment energy. This is the energy to build and maintain the plant used for the manufacturing operation. The gross fixed capital formation column of the input-output tables is calculated as a percentage of the total output for a particular industry. Applying this percentage to the sub total of energy and CO2 coefficients is a crude calculation but is better than no figure where there is no useful information available on the energy or economic value of the plant. The percentage is generally less than 5%. Other available information is noted. 4.2 Recycled Steel in New Zealand In New Zealand steel is produced by BHP New Zealand Steel from local iron sands. Pacific Steel Ltd. produces steel from mainly New Zealand sourced scrap. Between 80% and 90% (allowing for annual variations) of structural steel for building is imported. The collection and recycling of steel within New Zealand is an involved process. Alcorn, 1998 includes a detailed energy analysis of the scrap collection process.
E m b o d i e d E n e r g y a n d C O 2 C o e f f i c i e n t s f o r N Z B u i l d i n g M a t e r i a l s
18
In New Zealand scrap steel is collected countrywide for recycling into reinforcing bars, structural sections (angles, channels and flats) and wire rod which is subsequently re-manufactured into wire products, such as nails and reinforcing mesh. Some of the scrap is shredded by machines at Christchurch and Auckland. Larger scrap items are gas cut to a size suitable for the furnace. Balers compress the scrap ready for transporting from collection points. 4.3 Ingredients For discussion of the recycled steel calculation, references to cells in this section (e.g. B5) refer to 4.3.1 The embodied energy of scrap, entirely due to the collection and transporting of the scrap, comprises 80% liquid fuels (diesel and bunker fuel) and 20% electricity. The CO2 emission factor (F9) used to derive the CO2 emissions for the scrap component of recycled steel is the emission factor for All Petroleum Products (Table 3.3) times 0.8, plus the emission factor for Electricity (Table 3.3) times 0.2. The total CO2 emissions from scrap for one kilogram of recycled steel (G9, Fig.1) is the product of the CO2 emission factor (F9) and the embodied energy coefficient of recycled steel for scrap (E9). Calculation for Silico-Manganese (SiMn), Ferro-Silicon (FeSi), Lime and Burnt Lime follow the same pattern as scrap. A factor taken from input-output data for coal mining (Table 2.2.1) is applied to the carbon input to account for the energy of extracting the carbon for use in the process. The embodied energy coefficient for one kilogram of product from carbon is the quantity of carbon (B14), times the embodied energy coefficient for carbon (C14), times the input-output factor for extracting the coal (D14), all divided by the output from the steel plant (B21). This is then multiplied by the input from the steel plant to the bar mill (B17), since the bar mill is producing the reinforcing bars and sections, and divided by the output from the bar mill (B44) and then divided by 1000 to get from units of tonnes (used in the quantities of inputs and outputs) to kilograms for the final units. CO2 emissions for the carbon ingredient are treated in the same way as for the earlier ingredients. Oxygen is treated in the same way as carbon, except that an input-output value (D15) is used in MJ/$ (Peet and Baines, 1995), since there was no data available on the energy to produce a cubic metre of oxygen. The value of oxygen per cubic metre is placed in the embodied energy coefficient column (C15). The rest of the calculation for oxygen is the same as that for earlier ingredients. Water is calculated using only an input-output value, since only the dollar value of the water used was known.

E m b o d i e d E n e r g y a n d C O 2 C o e f f i c i e n t s f o r N Z B u i l d i n g M a t e r i a l s
19
4.3.1. Spreadsheet for Recycled Steel Reinforcing and Sections
A B C D E F G H I
1 Steel, recycled, reinforcing and sections 2 Total Energy Total CO2 Total Imported 3 MJ/kg: 8.55 g/kg: 352.4 CO2,
/k87.5
4 MJ/m3: 67143.70 kg/m3: 2766.0 MJ/kg: 1.6
5 EE coefficient of I/O factor EE coefficient CO2 emission CO2
emissions Imported Imported
6 ingredient of product factor of product energy CO2
7
Quantity
(MJ/kg)(or other) (MJ/MJ) (MJ/kg) (g/MJ) (g/kg) (MJ/kg) (g/kg)
8 Ingredients
9 Scrap steel (t) 157500 704 0.7 57.7 41.7
10 SiMn (t) 4200 42700 1.2 56.2 65.6 1.2 65.6
11 FeSi (t) 1400 42700 0.4 56.2 21.9 0.4 21.9
12 Lime (t) 2170 1280 0.0 56.2 1.0
13 Burnt Lime (t) 750 7430 0.0 73.3 2.7
14 Carbon (t) 1800 29700 1.04 0.4 90.4 32.7
15 Oxygen (m3) 1900000 1 43.71 0.5 52.4 25.5
16 Water ($) 1700 6.27 0.0 19.0 0.0
17 Billets, steel plant to bar mill (t) 116270
18
19 Output from steel plant
20 Slag (t) 5020
21 Billets to rod and bar mills (t) 170510
22
23 Energy sources
24 Electricity (kWh/t) 520 4 1.53 2.9 16.4 48.4
25 Electricity (MJ) 31000000 1.53 0.5 16.4 7.4
26
27 Natural Gas (MJ) 134000000 1.13 1.5 54.5 79.1
28
29 Transport
30
31 Sub Total 8.0 326.1
32
33 Capital equipt. energy
34 Steel plant (MJ) 30517200 0.2 50.7 10.1
35 Bar mill (MJ) 33410000 0.3 50.7 16.2
36 CFC
37 GFCF, as percentage
38
39 Total 8.6 352.4 1.6 87.5
40
41 Other Information
42 Prices ($)
43 Annual Output, NZ (t)
44 Output, bar mill (t) 104680
45 % of National Output
46 Density of Material (kg/m3) 7850
47 Other Physical Characteristics
48 Manufacturers/Players
49 Manufacturing Process
50 Age of Data 1995
51 Source of Data Pacific Steel . .
52 Confidentiality No
53 Comparative Data
54 Other notes

E m b o d i e d E n e r g y a n d C O 2 C o e f f i c i e n t s f o r N Z B u i l d i n g M a t e r i a l s
20

E m b o d i e d E n e r g y a n d C O 2 C o e f f i c i e n t s f o r N Z B u i l d i n g M a t e r i a l s
21
4.4 Energy Inputs For recycled steel reinforcing and sections two plants are utilized. For the initial steel plant electricity was known in kWh/t, while for the bar mill electricity was known in MJ per annum. Consequently there are two entries, with separate units, for electricity to the production of recycled steel reinforcing and sections (B24, B25). The kWh/t figure is converted into MJ (C24). Both electricity figures are multiplied by an input-output factor (D24, D25) to account for the energy of generating and distributing the electricity to the factory (Table 2.2.1). To calculate the embodied energy coefficient per kilogram of product due to electricity (E24), the electricity to the steel plant (B24 times C24 times D24) is multiplied by the sum of the steel plant output of billets and slag (B20, B21), since, as an energy per tonne input, there is an equivalent input of electricity to produce a tonne of output, be it steel or slag. The electricity input is divided by the output of steel only from the steel plant (B21), since all the energy used needs to be attributed to the useful product. If the slag were used as a material, it would attract an embodied energy coefficient reflecting the inputs to the steel plant. The electricity input is finally divided by 1000 to translate tonnes to kilograms for the units of the final coefficient (MJ/kg). Electricity to the bar mill is already in MJ. The rest of the procedure is the same as for the steel plant electricity calculations, except that the result is divided by the out put from the bar mill, and slag is not considered. Natural gas is used in the bar mill. It is calculated in the same way as electricity to the bar mill.
The CO2 emissions due to electricity and gas (F24, F25, F27) come from Table 3.3. The CO2 emissions per kilogram of product (G24, G24, G27) are a simple product of the relevant embodied energy coefficients (column E) and the CO2 emission factors (column F) 4.5 Transport For the calculation of recycled steel the energy of transport is included in the embodied energy coefficient of scrap.(C9) 4.6 Capital Equipment For the calculation of recycled steel a MJ figure for the two plants was available from Alcorn, 1998, based on good estimates of the value of the plants in dollars. 4.7 Outputs For recycled steel, outputs for the steel plant are recorded, with a breakdown for steel billets and slag (B20, B21). For most materials, where only one plant is used in the manufacturing process, there is only one output. The output from the bar mill (B44) is used to divide the energy of each ingredient or energy source to arrive at a MJ/kg figure.

E m b o d i e d E n e r g y a n d C O 2 C o e f f i c i e n t s f o r N Z B u i l d i n g M a t e r i a l s
22
4.8 Totals Subtotals for the embodied energy coefficient and CO2 emissions coefficient are used to calculate the capital equipment energy where this is a percentage figure. This is the case for most materials, but not for recycled steel. Totals are the sum of the subtotal and capital equipment energy. The final coefficient is the total with decimal places reduced to one significant figure. The final embodied energy coefficient is expressed in terms of MJ/kg (D3) and MJ/m3 (D4). The final CO2 emissions coefficient is expressed in g/kg (G3) and kg/m3 (G4). Imported energy is expressed in MJ/kg and imported CO2 in g/kg. 4.9 Other Information Other information is recorded as available. For recycled steel the output of the bar mill (B44) and density (B46) are used for calculating other figures. The age of data (B50), source of data (B46) and confidentiality status of the information for this material (B52) are recorded for reference.

E m b o d i e d E n e r g y a n d C O 2 C o e f f i c i e n t s f o r N Z B u i l d i n g M a t e r i a l s
23
5 CONCLUSIONS Energy has been used as a de-facto measure of environmental impact, on the basis that whenever a process is undertaken, there is some consequent impact, and energy used for the process. However, some energy sources have less environmental impact than others. In particular, with the current focus on global warming and consequent climate change, it is important to know the CO2 implications of each energy source, since this is globally the principal greenhouse gas. CO2 emission associated with individual processes and operations may thus be regarded as a superior de-facto measure of environmental impact. Given that in developed countries the energy use associated with buildings is in the region of half the total energy usage, it is valuable to know the status of CO2 emissions embodied in building materials. This report provides, by use of a process-based hybrid analysis technique, embodied CO2 coefficients for building materials that reflect the specific inputs of ingredients and energy sources and the CO2 emissions associated with them. This, in association with the embodied energy coefficients, provides a basis for detailed analysis of buildings and building elements beyond the simple, and inaccurate, stand-by of converting national energy figures into CO2 figures, or making inevitable but misleading assumptions about fuel types for particular materials. The embodied CO2 coefficients show a different pattern from the embodied energy coefficients, with less of a gap between the highest group and the next highest, and at the other end of the scale some materials having negative values. 5.1 Notable Materials In a comparison of materials analysed for embodied energy and embodied CO2, aluminium stands out less when considered for CO2. While aluminium in various forms (raw, extruded, painted, anodized) occupies the top four positions in both embodied energy and embodied CO2, there is a smaller gap back to the next entry, copper sheet, in the CO2 index. In the energy index, there are another five materials that may be considered at the high end of the range, above 50 MJ/kg: HDPE; extruded PVC; stainless steel; copper wire and rod; and copper sheet. In the CO2 index there are eight materials, all timber products, that have negative values, representing a net absorption of CO2, which may be regarded as having low embodied CO2. At the top of the CO2 index the aluminium products, apart from recycled aluminium, again stand out. In addition, another seven materials, above 2000 g CO2/kg, may be regarded as having high embodied CO2: polystyrene; HDPE; LDPE; extruded PVC; stainless steel; copper wire and rod; and copper sheet. Bitumen as a fuel also falls within this range, but is excluded, as are other fuels. 5.2 Further Research The range of materials included in this report covers the most common and significant building materials used in New Zealand. Further research is needed to extend the materials covered to include the majority of commonly used building materials. Statistical analysis of the relative importance of each material in the wider context of New Zealand’s energy usage and CO2 emissions position is needed. As other data on environmental impacts becomes available from manufacturers, this needs to be collected and analysed to form a more precise perspective of the impacts of building materials in New Zealand. The impacts that need to be covered would include other greenhouse gases; resource depletion; emissions to air causing effects other than the greenhouse effect; acidification of water and soil; eutrophication of water and soil; emission of toxins to soil, water and air; waster disposal, and other site-specific effects. Still further work is needed to adapt weighting and rating systems for

E m b o d i e d E n e r g y a n d C O 2 C o e f f i c i e n t s f o r N Z B u i l d i n g M a t e r i a l s
24
comparing these effects to the New Zealand context.
E m b o d i e d E n e r g y a n d C O 2 C o e f f i c i e n t s f o r N Z B u i l d i n g M a t e r i a l s
25
6 REFERENCES Alcorn, Andrew, Embodied Energy Coefficients of Building Materials, Centre for Building Performance Research, School of Architecture, Victoria University of Wellington, 1998. (3rd Ed.) Alcorn, J. A. and Haslam, P.J., The Embodied Energy of a Standard House, Then and Now, Proceedings, Embodied Energy: the current state of play, Seminar of the Australian Sustainable Materials Group, School of Architecture and Building, Deakin University, Geelong, 1996. The American Institute of Architects, Environmental Resource Guide. The American Institute of Architects, Washington, D.C., 1994. ASHRAE, 1989 ASHRAE Handbook Fundamentals, SI Edition, American Society of Heating, Refrigerating and Air Conditioning Engineers, Inc., Atlanta, 1989. Baines, J.T., New Zealand Energy Information Handbook. Energy Data Conversion Factors, Definitions, Taylor Baines and Associates, Christchurch, 1993. Baines, J.T., and Peet, N.J., 1991 Input-Output Energy Analysis Coefficients, Commissioned by the CBPR from Taylor Baines and Associates, 1995 BUWAL, BUWAL 250 Database, SimaPro 4 Okinventare fur Verpackungen BUWAL, BUWAL 132 Database, SimaPro 4, Oekobilanz von Packstoffen, Schriftenreihe Umwelt 250, 1990. Coal Research Association of New Zealand, Coal Research Analysis Update 1991, Coal Research Association of New Zealand (Inc.), Lower Hutt, 1991 Collins, Chris, Transport Energy Management Policies: Potential in New Zealand. Energy Efficiency and Conservation Authority, Wellington, 1993. Dang, Hien D. T., New Zealand Energy Data File, Ministry of Economic Development, Wellington, January 2001. Gifford, J.S., Hooper, R.J., Horgan, G.P. and Jamieson, F., Energy Use in the New Zealand Forest Processing Industry, New Zealand Forest Research Institute Limited, Rotorua, 1997. Hansen Products, NZ Ltd., PVC and the Environment, Hansen Products NZ Ltd., 1996 IDEMAT, IDEMAT 96 Database, SimaPro 4, 1996. I.F.I.A.S., Workshop on Energy Analysis and Economics. Workshop Report 9, International Federation of Institutes for Advanced Study, Stockholm, 1975. Jaques, Roman, Environmental Impacts Associated with New Zealand Concrete Manufacture, Building Research Association of New Zealand, Porirua, 2001. Jaques, Roman, Study Report No. 68 (1998), Environmental Impacts Associated with New Zealand Cement Manufacture, Building Research Association of New Zealand, Porirua, 1998.

E m b o d i e d E n e r g y a n d C O 2 C o e f f i c i e n t s f o r N Z B u i l d i n g M a t e r i a l s
26
Lawson, Bill, Building Materials Energy and the Environment. Towards Ecologically Sustainable Development The Royal Australian Institute of Architects, Red Hill, Australia, 1996. Loos, B, De produktie van glas, glasvezel en glaswol, RIVM, SPIN Glass, SimaPro 4, 1992. McLaren, P. Personal communication. Forest Research, Rotorua, 2001. Ministry of Economic Development, New Zealand Energy Greenhouse Gas Emissions 1990-1999, Ministry of Economic Development, Wellington, June 2000. PWMI, Ecoprofiles of the European Plastics Industry, Report 2, Olefin Feedstock Resources, 1993. Statistics New Zealand, Inter-Industry Transaction Study at the 80 Industry Level for 1991, Statistics New Zealand, Wellington, 1995. Van den Bergh en Jurgens, Van den Bergh en Jurgens Database, SimaPro 4, 1990. Whitney, R.S. and Hennessy, W.W., The Greenhouse Effect. Contribution from New Zealand Coal and Lignite, Coal Research Association of New Zealand (Inc) Lower Hutt, 1990.

E m b o d i e d E n e r g y a n d C O 2 C o e f f i c i e n t s f o r N Z B u i l d i n g M a t e r i a l s
27
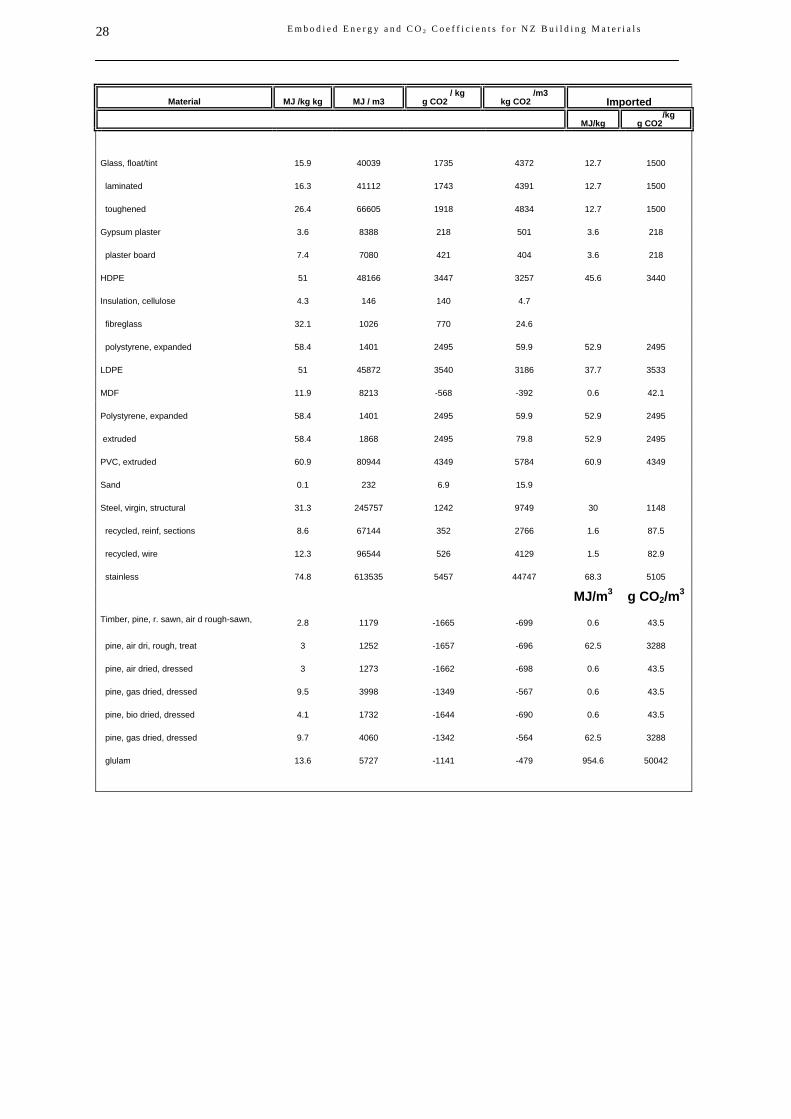
APPENDIX Embodied Energy and CO2 Coefficients of New Zealand Building Materials
Material MJ /kg kgkgkg MJ / m3 g CO
2 / kg kg CO2
/m3 Imported
MJ/kg g CO2/kg
Aggregate, general 0.04 65 2.3 3.5
river 0.03 46.7 1.6 2.4
virgin rock 0.06 83.3 3.1 4.6
Aluminium, virgin 192 517185 8000 21600 57.9 4294
extruded 202 544685 8354 22555 57.9 4294
extruded, anodized 226 611224 9359 25270 57.9 4294
extruded, powder coat 218 587940 9205 24855 57.9 4294
Aluminium, recycled 9 24397 622 1679
extruded 14.6 39318 721 1946
extruded, anodized 23.8 64340 887 2393
extruded, powder coat 15.2 40928 731 1975
Asphalt (paving) 0.2 335 14.6 22.8
Bitumen (feedstock) 2.4 2475 171 176
Bitumen (fuel) 44.3 45632 3020 3111
Cellulose pulp 19.6 1057 612 33
Cement, average 6.2 12005 994 1939 0.2 14.5
dry 5.8 11393 967 1885 0.2 10.9
wet 6.5 12594 1021 1990 0.3 17.9
Cement fibre board 9.4 13286 629 894
Ceramic brick, new tech. 2.7 5310 138 271
brick, old tech, av. 6.7 13188 518 1021
brick, old tech, coal 7.6 14885 684 1348
brick, old tech, gas 5.8 11491 353 695
Clay, unfired 0.07 69 4.7 4.7
Concrete, block, 200 0.9 12.5/unit 106 1.6/unit
block fill 1.2 2546 156 345
block fill, pump mix 1.2 2732 163 375
precast double T 1.9 4546 214 526
grout 1.5 3496 209 496
17.5 MPa 0.9 2019 114 268
30 MPa 1.2 2762 159 376
40 MPa 1.4 3282 189 452 Copper, virgin, sheet 97.6 872924 7738 69173 97.6 7738
virgin, rod, wire 92.5 827316 7477 66844 92.5 7477
recycled, tube 2.4 21217 112 1002
E m b o d i e d E n e r g y a n d C O 2 C o e f f i c i e n t s f o r N Z B u i l d i n g M a t e r i a l s
28
Material MJ /kg kg MJ / m3 g CO2 / kg kg CO2
/m3 Imported
MJ/kg g CO2/kg
Glass, float/tint 15.9 40039 1735 4372 12.7 1500
laminated 16.3 41112 1743 4391 12.7 1500
toughened 26.4 66605 1918 4834 12.7 1500
Gypsum plaster 3.6 8388 218 501 3.6 218
plaster board 7.4 7080 421 404 3.6 218
HDPE 51 48166 3447 3257 45.6 3440
Insulation, cellulose 4.3 146 140 4.7
fibreglass 32.1 1026 770 24.6
polystyrene, expanded 58.4 1401 2495 59.9 52.9 2495
LDPE 51 45872 3540 3186 37.7 3533
MDF 11.9 8213 -568 -392 0.6 42.1
Polystyrene, expanded 58.4 1401 2495 59.9 52.9 2495
extruded 58.4 1868 2495 79.8 52.9 2495
PVC, extruded 60.9 80944 4349 5784 60.9 4349
Sand 0.1 232 6.9 15.9
Steel, virgin, structural 31.3 245757 1242 9749 30 1148
recycled, reinf, sections 8.6 67144 352 2766 1.6 87.5
recycled, wire 12.3 96544 526 4129 1.5 82.9
stainless 74.8 613535 5457 44747 68.3 5105
MJ/m3 g CO2/m3 Timber, pine, r. sawn, air d rough-sawn, 2.8 1179 -1665 -699 0.6 43.5
pine, air dri, rough, treat 3 1252 -1657 -696 62.5 3288
pine, air dried, dressed 3 1273 -1662 -698 0.6 43.5
pine, gas dried, dressed 9.5 3998 -1349 -567 0.6 43.5
pine, bio dried, dressed 4.1 1732 -1644 -690 0.6 43.5
pine, gas dried, dressed 9.7 4060 -1342 -564 62.5 3288
glulam 13.6 5727 -1141 -479 954.6 50042

E m b o d i e d E n e r g y a n d C O 2 C o e f f i c i e n t s f o r N Z B u i l d i n g M a t e r i a l s
29
DISCLAIMER
The best efforts of the author and publisher have been applied to the preparation of this report, however, neither author nor
publisher make any warranty of any kind, expressed or implied, with regard to the information contained in this report. No
warranty is made as to the accuracy, completeness or usefulness for any particular purpose of the information. No liability is
accepted for any loss or damage, however caused, arising from reliance on or use of any information or arising from the absence of
information or any particular information in this report.

E m b o d i e d E n e r g y a n d C O 2 C o e f f i c i e n t s f o r N Z B u i l d i n g M a t e r i a l s
30
Victoria University of Wellington Document Register
School of Architecture
LOGO OR ACRONYM
CBPR Centre for Building Performance Research
(CBPR Report Series)
RECIPIENT'S REF/CODE
85092
AUTHOR'S REF/CODE
R452 TITLE
Embodied Energy and CO2 Coefficients for New Zealand Building Materials
SERIES TITLE
Centre for Building Performance Research Report
SPONSOR'S REF/CODE
85092
REPORT DATE
March 2003
AUTHOR
Andrew Alcorn
ISSN/ISBN NUMBER
ISSN 1172-563X
ISBN 0-475-11099-4 AUTHOR ORGANISATION
Centre for Building Performance Research,
Victoria University of Wellington,
P.O. Box 600, Wellington, New Zealand
DISTRIBUTION
CBPR; Sponsor
SPONSORING ORGANISATION
Building Research Association of New Zealand,
Moonshine Rd, Judgeford,
Wellington.
-report available from:
CBPR; Sponsor organisation
KEYWORDS
CO2; embodied CO
2; embodied energy; CO
2 emissions; energy analysis; CO
2 analysis; embodied carbon;
building materials; NZ building; environmental impact; building energy; building CO2
ENQUIRES/COMMENT TO:
Director, Centre for Building Performance Research,
Victoria University of Wellington,
P.O. Box 600, Wellington, N.Z. PAGES: 27
ABSTRACT
In 1995 and 1998 the Centre for Building Performance Research (CBPR) conducted research on the embodied energy coefficients of building materials in New Zealand. Reports
containing tables of the coefficients were published in 1995, 1996 and 1998. (Alcorn, 1998) This report details the methods used to take data from those embodied energy
coefficients and to apply CO2
emission factors to them to derive embodied CO2 coefficients for New Zealand building materials. The conventions used and departed from are
listed. Tables are included for: input-output factors for energy sources; transport mode intensities; CO2 emission factors for some NZSIC industries; CO
2 emission factors for
energy sources; and an appendix of embodied energy and CO2
emission coefficients.
Tables & References provided.
November 2001 REPRODUCTION OF COMPLETED PAGE IS AUTHORISED

E m b o d i e d E n e r g y a n d C O 2 C o e f f i c i e n t s f o r N Z B u i l d i n g M a t e r i a l s
31
Centre for
Building
Performance
Research
Published by: Centre for Building Performance Research, Victoria University of Wellington, P.O. Box 600, Wellington, New Zealand
Telephone (64)(4) 463 6249 Facsimile (64)(4) 463 6204 [email protected]