2002 leatherback program report - conserveturtles.org astorga, research assistant nel beaumont,...
TRANSCRIPT

REPORT
ON THE 2002 LEATHERBACK PROGRAM
AT TORTUGUERO, COSTA RICA
Submitted to:Caribbean Conservation Corporation, the Ministry of Environment and Energy of Costa Rica
and Care For the Wild International23 January 2003
byEmma Harrison, Field Coordinator
andSebastian Troëng, Research Coordinator
with the assistance ofCarolina Arancibia, Research Assistant
Minor Astorga, Research AssistantNel Beaumont, Research Assistant
Ian Berdie, Research AssistantGaëlle Blanvillain, Research AssistantNatalia Decastro, Research AssistantAdam Richards, Research Assistant
Steve Trott, Research AssistantEddy Rankin, Track Surveyor
CARIBBEAN CONSERVATION CORPORATIONDirección: Apartado Postal 246-2050 4424 NW 13th St. Suite A-1
San Pedro Gainesville, FL 32609COSTA RICA USA
Tel: INT+ 506 224 9215 001+ 352 373 6441Fax: INT+ 506 225 7516 001+ 352 375 2449Email: [email protected] [email protected]: http://www.cccturtle.org http://www.cccturtle.org
With Financial Support From

2
TABLE OF CONTENTS
TABLE OF CONTENTS.............................................................................................................................. 2
LIST OF FIGURES ...................................................................................................................................... 4
LIST OF TABLES ........................................................................................................................................ 4
ACKNOWLEDGEMENTS .......................................................................................................................... 5
EXECUTIVE SUMMARY ........................................................................................................................... 6
MONITORING AND RESEARCH ACTIVITIES CONDUCTED.................................................................................. 6CONCLUSIONS.............................................................................................................................................. 7RECOMMENDATIONS .................................................................................................................................... 8
1. INTRODUCTION..................................................................................................................................... 9
2. METHODS................................................................................................................................................ 9
2.1 PREPARATIONS....................................................................................................................................... 92.2 TRACK SURVEYS .................................................................................................................................... 92.3 TAGGING OF NESTING SEA TURTLES ..................................................................................................... 102.4 BIOMETRIC DATA COLLECTION............................................................................................................. 102.5 DETERMINATION OF NEST SURVIVORSHIP AND HATCHING SUCCESS........................................................ 112.6 PHYSICAL DATA COLLECTION ............................................................................................................... 112.7 COLLECTION OF HUMAN IMPACT DATA ................................................................................................. 112.8 DEAD TURTLES .................................................................................................................................... 122.9 ENVIRONMENTAL EDUCATION ACTIVITIES ............................................................................................ 12
3. RESULTS................................................................................................................................................ 12
3.1 PREPARATIONS..................................................................................................................................... 123.2 TRACK SURVEYS .................................................................................................................................. 123.3 TAGGING OF NESTING SEA TURTLES ..................................................................................................... 133.4 BIOMETRIC DATA COLLECTION............................................................................................................. 143.5 DETERMINATION OF NEST SURVIVORSHIP AND HATCHING SUCCESS........................................................ 153.6 PHYSICAL DATA COLLECTION............................................................................................................... 163.7 COLLECTION OF HUMAN IMPACT DATA ................................................................................................. 183.8 DEAD TURTLES .................................................................................................................................... 203.9 ENVIRONMENTAL EDUCATION ACTIVITIES ............................................................................................ 20
4. DISCUSSION .......................................................................................................................................... 20
4.1 PREPARATIONS..................................................................................................................................... 204.2 TRACK SURVEYS .................................................................................................................................. 214.3 TAGGING OF NESTING SEA TURTLES ..................................................................................................... 214.4 BIOMETRIC DATA COLLECTION............................................................................................................. 224.5 DETERMINATION OF NEST SURVIVORSHIP AND HATCHING SUCCESS........................................................ 224.6 PHYSICAL DATA COLLECTION............................................................................................................... 234.7 COLLECTION OF HUMAN IMPACT DATA ................................................................................................. 234.8 DEAD TURTLES .................................................................................................................................... 234.9 ENVIRONMENTAL EDUCATION ACTIVITIES ............................................................................................ 24
5. REFERENCES........................................................................................................................................ 24

3
6. RECOMMENDATIONS ........................................................................................................................ 25
6.1 PREPARATIONS..................................................................................................................................... 256.2 TRACK SURVEYS .................................................................................................................................. 256.3 TAGGING OF NESTING SEA TURTLES ..................................................................................................... 256.4 BIOMETRIC DATA COLLECTION............................................................................................................. 256.5 DETERMINATION OF NEST SURVIVORSHIP AND HATCHING SUCCESS........................................................ 256.6 PHYSICAL DATA COLLECTION............................................................................................................... 256.7 COLLECTION OF HUMAN IMPACT DATA ................................................................................................. 256.8 DEAD TURTLES .................................................................................................................................... 256.9 ENVIRONMENTAL EDUCATION ACTIVITIES ............................................................................................ 25
APPENDIX 1. SEA TURTLE ENCOUNTERS. ........................................................................................ 30
APPENDIX 2: OBSERVATIONS AND ANECDOTAL INFORMATION ON ILLEGAL HARVEST.. 32

4
LIST OF FIGURESFigure 1. Seasonal distribution of leatherback nesting activity as determined from tracksurveys, Tortuguero rivermouth (mile -3/8) - Jalova lagoon (mile 18).Figure 2a. Leatherback nesting activity from Tortuguero river mouth to the mile 5 marker.Figure 2b. Leatherback nesting activity from the mile 5 marker to Juana López path.Figure 2c. Leatherback nesting activity from Juana López path to Jalova lagoon.Figure 2d. Leatherback nesting activity from Jalova lagoon to Parismina river mouth.Figure 3. Temperature (oC) at 70 cm depth, open zone.Figure 4. Ground water level.
LIST OF TABLESTable 1. Number of nests and poached nests as determined from total counts by RAs and FC.Table 2. Mean carapace length and clutch size of leatherbacks.Table 3. Mean carapace length and clutch size of green and hawksbill turtles.Table 4a. Precision of carapace measurements.Table 4b. Precision of carapace measurements for leatherbacks encountered more than once.Table 5. Fate, hatching and emerging success of marked leatherback nests.Table 6a. Results of nest excavations.Table 6b. Incidence of deformed leatherback embryos.Table 7. Rainfall, December 2001-September 2002.Table 8. Air temperature, December 2001-September 2002.Table 9. Mean monthly sand temperatures.Table 10. Number of Paying Visitors to Tortuguero National Park, 1999-2001.Table 11. Visitors to the CCC Natural History and Visitors Center, January 2000-September2002.Table 12. Room and bed capacity of the hotels and cabinas in the Tortuguero area.Table 13. Artificial lights visible from the beach, Tortuguero river mouth to Mile 5.Table 14. Dead turtles.

5
ACKNOWLEDGEMENTS
The 2002 Leatherback Program was carried out under a research permit from the Ministry ofEnvironment and Energy of Costa Rica, outlined in resolution No 059-2002.
All data presented in this report were collected by Field Coordinator Dr. Emma Harrison andher hardworking team of research assistants: Carolina Arancibia (Canada), Minor Astorga(Costa Rica), Nel Beaumont (UK), Ian Berdie (USA), Gaëlle Blanvillain (France), NataliaDecastro (Colombia), Adam Richards (USA) and Steve Trott (UK). Several programparticipants assisted in data collection and their help and financial support is gratefullyrecognized.
The Tortuguero Conservation Area park rangers under the leadership of National ParkAdministrator Sr. Educardo Chamorro showed dedication in protecting nesting sea turtles andtheir nests and also provided hospitality for visiting research assistants at the Jalova rangerstation.
John H. Phipps Biological Field Station staff Victor Barrantes (station manager), AlexanderCastillo (visitor center administrator), Sergio Campos (maintenance), Leo Bustos (captain),Yolanda Rivas (cook) and Olga Benlys (cook) provided logistical support at all times andcontributed to the friendly atmosphere at the field station.
Tour guides and villagers of Tortuguero worked constructively with permanent and temporaryprogram staff for the duration of the 2002 Leatherback Program. Hotel managers and cabinaowners provided information of the capacity of their respective facilities on request.
Roxana Silman (national director) and Ileana Vargas (administrative assistant) at the CCC SanJosé office provided logistical support and troubleshooting throughout the 2002 LeatherbackProgram. CCC staff in Gainesville, Florida purveyed necessary equipment and providedsupport on request.
Care for the Wild International provided financial support that made possible the 2002Leatherback Program and their contribution deserves particular acknowledgement.

6
EXECUTIVE SUMMARY
Monitoring and Research Activities Conducted1. A total of 21 track surveys between the Tortuguero river mouth and Jalova lagoon were
conducted by CCC track surveyors between February and July 2002.2. Peak nesting was registered 11 June when 15 fresh leatherback nests were recorded.3. The Field Coordinator and the RAs conducted a total of 30 track surveys between the
Tortuguero and Parismina rivermouths between 18 March and 13 June 2002. Minimumpoaching levels were estimated at 13.0 % for leatherback nests and 1.6 % for green turtlenests.
4. Comparison between the leatherback nest estimate extrapolated from approximatelyweekly track surveys by the CCC track surveyor and total counts by the Field Coordinatorand RAs shows that both methodologies result in very similar estimates, 782 and 779leatherback nests respectively laid between Tortuguero rivermouth and Jalova lagoonbetween 18 March and 13 June 2002.
5. A total of 46 leatherback turtles were newly tagged, 72 leatherback turtles with tags fromprevious years and/or other nesting beaches and 54 renesting leatherback turtles wereencountered during 1,181 hours of night patrols between 6 March and 14 June 2002. Inaddition, 99 green turtles were newly tagged, 8 previously tagged green turtles, 3 greenturtle renesters and 4 hawksbill turtles were newly tagged during the night patrols.
6. A total of 61 % of female leatherback turtles were previously tagged. Previously taggedleatherbacks (n=72) were originally tagged on the beaches of Tortuguero (n=25),Parismina (n=1), Pacuare/Mondonguillo (n=35), Lagunas de Urpiano/Matina (n=3),Gandoca/Manzanillo (n=4), San San/Panama (n=1), Soroptka/Panama (n=2) and PlayaBluff/Playa Larga/Panama (n=1).
7. A total of 4 % (n=2) of newly tagged leatherback turtles (n=46) showed evidence of oldtag holes or notches when they were encountered for the first time during the program.
8. A total of 91.8 % of encountered leatherback turtles laid eggs in the open beach zone(n=157), 0.6 % nested in the border zone (n=1) and 7.6 % did not lay eggs (n=13).
9. Mean carapace length (CCLmin) for leatherback turtles (n=114) was 154.5 cm and meanclutch size was 81 normal eggs and 28 yolkless eggs.
10. Mean carapace length (CCLmin) for green turtles (n=107) was 105.5 cm and for hawksbillturtles (n=4) 87.0 cm.
11. Precision of the CCLmin measurement during the same encounter was 0.6 cm forleatherback turtles and 0.4 cm for green turtles.
12. Precision of the CCLmin measurement for leatherback turtles measured during more thanone encounter was 1.3 cm for two encounters, 2.7 cm for three encounters and 2.2 cm forfour and five encounters.
13. A total of 18 leatherback nests were marked and monitored. One nests was excluded fromanalysis as the fate of the nest could not be determined with certainty.
14. Overall hatching success for monitored leatherback nests was 24.4 % and overallemerging success was 18.0 %.
15. Mean distance between the sand surface and the top egg at the time of excavation forundisturbed leatherback nests (n=6) was 58 cm and mean distance between the sandsurface and the bottom of the eggchamber for the same nests was 80 cm.

7
16. The incubation period for monitored leatherback nests for which emerging was observed(n=3) varied between 62-65 days with a mean of 63 days.
17. Eggs containing deformed embryos accounted for 0.18 % of leatherback eggs inundisturbed and washed over nests.
18. Rainfall was heaviest in May (721.2 mm) and March was the month with least rain (225.2mm).
19. Mean minimum air temperature was lowest in January (24.2ºC) and highest in June(25.8ºC), mean maximum air temperature was lowest in August (29.8ºC) and highest inApril (33.6ºC) and September (33.7ºC).
20. Mean monthly sand temperatures were lowest in January and February and highest inApril and June.
21. A total of 45,232 visitors paid to enter Tortuguero National Park in 2001.22. Data from the CCC Natural History and Visitors Center indicate that visitation decreased
after 11 September 2001 but that by June 2002 levels had returned to normal and mayeven have increased since.
23. Hotels and cabinas in the Tortuguero area slightly increased their capacity in 2002.24. The number of artificial lights visible from the beach has increased behind the airport (mile
1 1/8-1 2/8) and in front of the village (mile 2 6/8-3 3/8).25. All dead turtles encountered during the 2002 Leatherback Program were green turtles
killed by jaguars (n=18) or taken by poachers (n=2).
Conclusions1. Protective plastic bags considerably increase the lifetime of handheld radios.2. The two methods employed to calculate the number of leatherback nests laid between the
Tortuguero rivermouth and Jalova lagoon result in very similar estimates.3. Increased park rangers patrols by ATV and boat resulted in decreased poaching.4. Poaching is higher outside than inside of Tortuguero National Park.5. The Field Coordinator’s and RAs’ dedicated efforts resulted in more leatherback and
green turtle encounters being logged during the 2002 Leatherback Program than duringany previous leatherback nesting season.
6. It appears that metal flipper tags have an acceptable retention time in Tortugueroleatherback turtles.
7. Mean carapace length appears to have increased slightly in 2002.8. High tides and rough seas washed out many leatherback nests but overall hatching success
was similar to previous years.9. The occurrence of deformed embryos is a cause for concern.10. As a result of varying sand temperatures during the leatherback nesting season it is likely
that both male and female hatchlings were produced.11. Tourism in Tortuguero appears to be increasing, bringing economic benefits to more
people.12. Jaguars prefer killing and feeding on green turtles rather than on leatherback turtles.13. A more formalized sea turtle education program aimed at the Tortuguero School and High
School would be beneficial.

8
Recommendations1. Protective plastic bags should be purchased for future programs.2. Three mile markers should be placed at each beach section. Two should be painted with
the mile number.3. Beach sections with little institutional presence need increased park ranger or coast guard
patrols during the leatherback nesting season.4. A joint database for all leatherback tagging projects along the Caribbean coast of Costa
Rica and Panama should be pursued.5. Monitoring of carapace length of female leatherback turtles should be a priority.6. Leatherback nests should not be relocated in Tortuguero.7. Research is needed to determine any correlation between deformed embryos and
agricultural chemicals in the beach.8. TidBit dataloggers with protective casings should be bought when dataloggers need
replacement.9. The Costa Rican Electricity Institute should be encouraged to continue shading street
lights in Tortuguero.10. Any datasharing that can be provided to jaguar researchers should be encouraged.11. An attempt should be made to have at least one Tortuguero youth participating as a
research assistant in each future leatherback program.

9
1. INTRODUCTIONSea turtle research and conservation was initiated in Tortuguero in 1955 (Carr et al. 1978).Caribbean Conservation Corporation (CCC) began an annual leatherback (Dermochelyscoriacea) program in Tortuguero in 1995 (Campbell et al. 1996). The leatherback program isimplemented in order to fulfill CCC’s scientific mission in Tortuguero: “CCC will provide thescientific information necessary to conserve the populations of sea turtles that nest atTortuguero, Costa Rica, so that they fulfill their ecological roles”. CCC staff and ScientificAdvisory Committee revised the monitoring protocol in preparation for the 1998 LeatherbackProgram. The 2002 Leatherback Program represents the eigth consecutive leatherbackprogram and the fifth year of implementing the new monitoring protocol.
The objectives of this report are to summarize the results of the 2002 Leatherback Programand to provide recommendations for future sea turtle programs, conservation efforts andresearch activities in Tortuguero.
2. METHODS
2.1 PreparationsThe Field Coordinator arrived in Tortuguero the first week of March to prepare for the 2002Leatherback Program. The Research Assistants (RAs) arrived in Tortuguero on 11 March2002. During the first week of the 2002 Leatherback Program, RAs received training in seaturtle biology and conservation, and the monitoring protocol was explained in detail. RAs alsoreceived practical training in sea turtle tagging, nest marking and other data collection fromthe Field Coordinator and the Scientific Director. In addition to practise night patrols alongbeach sections close to the field station, training was also conducted between Jalova lagoonand mile 14 on 15-16 March.
The positions of mile markers along the 22 miles of beach between the Tortuguero andParismina river mouths were verified using a 300 feet fiberglass measuring tape. Mile markerswere located every 1/8 of a mile between the Tortuguero river mouth (mile –3/8) and mile 5and every 4/8 mile between mile 5 and the Parismina rivermouth (mile 21 4/8). Three markerswere put up in every location and the marker closest to the vegetation was painted white withthe marker number in black.
2.2 Track SurveysTrack surveys between the Tortuguero river mouth and Jalova lagoon were conductedapproximately weekly by CCC track surveyor Eddy Rankin. However, due to the tracksurveyor experiencing knee problems, the Scientific Director had to conduct two surveys andall surveys were conducted by new CCC track surveyor Roberto Rankin from 11 Juneonwards. Track surveys started at Tortuguero village at 4:30 AM - 5:00 AM and werecompleted at Jalova lagoon at approximately 9:30 AM. The section between the Tortugueroriver mouth and village was surveyed the same afternoon (3:00 PM - 5:00 PM), by the sametrack surveyor. Surveys conducted by the Scientific Director began at the Tortuguerorivermouth at 5:00 AM and terminated at Jalova lagoon at approximately 10:30 AM. Only sea

10
turtle tracks from the previous night were counted. Notes were also kept on the number ofturtles depredated by jaguars or taken by poachers.
Track surveys were also conducted between the Tortuguero and Parismina river mouths,every 3 days from 18 March to 13 June by the FC and the RAs. The beach was divided intofour sections: Tortuguero river mouth - CCC station (mile 2 5/8), CCC station-Juana Lópezpath (close to the mile 15 marker), Juana López path-Jalova lagoon (mile 18) and Jalovalagoon-Parismina river mouth (mile 21 4/8). All tracks since the previous track survey werecounted. The tracks were marked with double lines and plastic debris in order to avoidcounting the same track at more than one survey. On request from the park rangers, markingnests with plastic debris was discontinued as it was felt it may aid poachers in spotting nestsfrom the sea. Instead nests were marked using sticks found on the beach and put in a crossformation over the nest. Notes were also kept on jaguar predation, turtles turned by poachersand the number of poached fresh nests.
2.3 Tagging of Nesting Sea TurtlesNightly tagging patrols were conducted 6 March-14 June 2002 (with the exception of 7-8, 10,13-14, 17 March and 28 April). Three beach sections were patrolled with varying frequency:Tortuguero river mouth-CCC station, CCC station-mile 7 and Jalova lagoon (mile 18)-mile14.
Turtles were tagged after finishing oviposition or when returning to the sea. Leatherbackswere tagged in the rear flippers. Green (Chelonia mydas) and hawksbill (Eretmochelysimbricata) turtles were tagged axillary, close to the first scale on the front flippers. Tagnumbers, evidence of old tag holes or notches, species, date, time and activity whenencountered were noted for each encounter. The location of the nest was defined as open(=open beach without any vegetation), border (=vines or other sparse vegetation partlyshading the nest) or vegetation (=continuous vegetation behind the beach with completeshading of the nest).
Tags used during the 2002 Leatherback Program include National Band&Tag Company(NBTC) Monel #49 tags no. 79901-11, 79913-24, 79926-34, 79951- 53, 79955-67, 79969-76, 79979, 79981-85, 79987-96, 79998-80000, VA1901-09, VA1911-25, VA1927-28,VA1937-43, VA1951, VA1953-58, and VA1976-78, and Inconel #681 tags no. 92001,92003-05, 92007-08, 92010-12, 92014-17, 92019-36, 92039-46, 92048, 92050, 92052-60,92065-72, 92074-95, 92097, 92099-100, 92102, 92104, 92106-21, 92123-40, 92143-53,92155-56, 92158-61, 92163-76, 92179-90, 92192-97, 92199-205, 92207-09, 92251-56, and92276-85.
2.4 Biometric Data CollectionIf the turtle was encountered before oviposition, the eggs were counted as they were laid intothe egg chamber. The eggs were counted by a person wearing a plastic glove to avoidcontamination of the nest. Normal sized and yolkless eggs were counted separately.
CCLmin (=from the nuchal notch to the end of the caudal projection NEXT TO the centralridge) was recorded for leatherbacks. For leatherbacks, the caudal projection was classified ascomplete if no irregularities occurred and incomplete if the caudal projection was irregular or

11
parts of it were missing. CCLmin (=from where the skin meets the carapace by the nuchalnotch to the posterior notch between the supracaudals, along the midline) was recorded forgreen, hawksbill and loggerhead turtles. Measurements were recorded to the closestmillimeter. All measurements were repeated three times in order to determine precision.Precision for one encounter is defined as the difference between the shortest and the longestof the three measurements. Precision for turtles encountered more than once is defined as thedifference between the shortest and the longest of all measurements collected from the sameindividual.
2.5 Determination of Nest Survivorship and Hatching SuccessFor leatherbacks encountered previous to covering the eggs, three pieces of flagging tapeattached to the vegetation behind the nest were used to mark the nest. The location of the nestcould therefore be determined by triangulation. The third piece of flagging tape ensured thatnests could be located through triangulation even if one piece of flagging tape went missing.Each morning the marked nests were inspected so that the fate of the nest could bedetermined. Depredation and poaching were noted and resulted in termination of monitoringthe nest. Nests were only marked along the beach section between the Tortuguero river mouthand the mile 5 marker.
Marked nests were excavated two days after hatching or 75 days after oviposition (if nohatchling tracks were observed), to determine hatching and emerging success. The number ofempty eggshells, pipped eggs, live and dead hatchlings, unhatched eggs without embryo,unhatched eggs with embryo, unhatched eggs with fully developed embryo, depredated eggs,yolkless eggs, twins, deformed and albino embryos were determined for each excavated nest.Only egg shells amounting to more than 50% of an egg were recorded as an egg. Thedistances from the sand surface to the top egg as well as to the bottom of the eggchamberwere recorded for each excavated nest.
2.6 Physical Data CollectionRainfall (to the closest 0.1 mm) and temperature (current, minimum and maximum, to theclosest 0.5ºC) were recorded daily at 9 AM.
The level of the ground water was measured daily at 9 AM. The water level was determinedto the closest millimeter from three PVC pipes (8.5 cm x 160 cm) inserted in the sand in frontof the John H. Phipps Biological Field Station, at 5, 10 and 15 m distance from the high tideline (as of 15 March 1998). The PVC pipes were almost washed out by rough seas and had tobe relocated to a wider beach section in front of the field station on 1 July 2002.
Sand temperature was measured using dataloggers located at 30, 50 and 70 cm depth in theopen, border and vegetation zones in front of the CCC station.
2.7 Collection of Human Impact DataRosi Valverde Charpentier at the ACTo office in Cuatro Esquinas, Tortuguero provided dataon the number of visitors to Tortuguero National Park 1999-2001.
Alexander Castillo recorded the number of visitors at the CCC Natural History and VisitorsCenter.

12
Victor Barrantes contacted the owners or managers of the lodges and cabinas in Tortugueroand the name of the lodge/cabinas, number of beds and number of rooms were recorded.
Light surveys were conducted on 19 March, 15 April and 15 May 2002. The beach wassurveyed from the Tortuguero river mouth to the mile 5 marker. Each artificial light visiblefrom the beach was noted and the light source was identified. The location of the light source,i.e. Tortuguero (=beach) side or mainland (=lagoon) side was also noted for each light.
2.8 Dead TurtlesDead turtles encountered during track surveys or other monitoring activities were recordedand an attempt was made to determine the cause of death.
2.9 Environmental Education ActivitiesAn effort was made to identify suitable candidates for RA positions in the Tortuguerocommunity. Students from the Tortuguero school and high school were encouraged toparticipate in nightly beach patrols. Other awareness activities were conductedopportunistically when time and special events allowed.
3. RESULTS
3.1 PreparationsHeavy rainfall in early May and late June coupled with rough seas resulted in several of themile markers being washed out to sea.
3.2 Track SurveysLeatherback nesting was observed from late February to late June (Figure 1) but is likely tohave continued at very low levels at least until early July (pers. obs.). Leatherback nesting wasmost intense during the month of May.
Poaching affected a minimum of 13.0 % of leatherback nests and 1.6 % of green turtle nests(Table 1) which is a decrease in comparison with poaching levels during previous years.Poaching levels for leatherback nests at all beach sections within Tortuguero National Parkwere kept at a minimum of 10 % or less (Figure 2a-c) but the beach section outside theNational Park, between Jalova lagoon and the Parismina river mouth was heavily affected bypoaching and a minimum of 44 % of recorded leatherback nests were poached (Figure 2d).
The total number of leatherback nests laid 18 March-13 June on each beach section (Figure2a-d) was estimated by extrapolating the results of approximately weekly surveys to recordfresh tracks from the night before, using the trapezoidal rule for approximate integration(Whittaker and Robinson 1967). A comparison of the extrapolated estimates and the resultsfrom total count surveys conducted by RAs and the FC every three days shows differences forall surveyed beach sections (Figure 2a-d). However, the total estimated number of leatherbacknests laid 18 March-13 June for the three beach sections between Tortuguero river mouth andJalova lagoon are similar for the two methods (782 nests and 779 nests respectively).

13
Observations and anecdotal information regarding illegal harvest are summarized in Appendix2.
Table 1. Number of nests and poached nests as determined from total counts by RAs and FC.Date Leatherback
NestsMinimum PoachedLeatherback Nests
Min. %Poached
GreenTurtle Nests
Minimum PoachedGreen Turtle Nests
Min. %Poached
18 March 68 17 25.0 21 2 9.521 March 11 0 0 4 0 024 March 29 4 13.8 3 0 027 March 20 0 0 6 1 16.730 March 13 1 7.7 11 0 0
2 April 37 0 0 15 0 05 April 45 4 8.9 5 1 20.08 April 19 0 0 7 0 0
11 April 28 4 14.3 15 2 13.314 April 36 6 16.7 9 0 017 April 42 7 16.7 9 0 020 April 43 3 7.0 8 0 023 April 39 20 51.3 15 2 13.326 April 26 6 23.1 8 0 029 April 55 9 16.4 7 0 02 May 34 12 35.3 13 3 23.1 5 May 29 12 41.4 3 0 0 8 May 27 2 7.4 4 0 011 May 41 3 7.3 4 0 014 May 26 8 30.8 5 1 20.017 May 40 0 0 4 0 020 May 37 5 13.5 5 1 20.023 May 26 1 3.8 11 1 9.126 May 21 0 0 8 0 029 May 28 1 3.6 33 2 6.11 June 32 0 0 49 0 04 June 40 0 0 119 1 0.87 June 30 1 3.3 135 0 010 June 26 0 0 282 0 013 June 22 0 0 319 1 0.3Total 970 126 13.0 1137 18 1.6
All nests laid and poached since previous track surveys were recorded.
3.3 Tagging of Nesting Sea TurtlesIn total, 1,181 team hours of night patrols were conducted between 6 March and 14 June2002. During these patrols a total of 172 leatherback encounters, 110 green and 4 hawksbillturtle encounters were recorded (Appendix 1). This is equal to a mean of 0.146 leatherback,0.093 green and 0.003 hawksbill turtles encountered per patrol hour.
The sea turtles encountered correspond to 118 individual female leatherback turtles, 107female green turtles and four female hawksbill turtles. A total of 61 % of female leatherbackturtles were tagged previously to being encountered for the first time during the 2002 nestingseason. Previously tagged leatherback turtles (n=72) were originally tagged on the beaches ofTortuguero (n=25), Parismina (n=1), Pacuare/Mondonguillo (n=35), Lagunas de

14
Urpiano/Matina (n=3), Gandoca/Manzanillo (n=4), San San/Panama (n=1), Soroptka/Panama(n=2) (C. Ordoñez pers. comm.) and Playa Bluff/Playa Larga/Panama (n=1).
Only 4 % (n=2) of newly tagged leatherback turtles (n=46) showed evidence of holes ornotches from lost tags when they were encountered for the first time during the 2002Leatherback Program.
A total of 91.8 % of encountered leatherback turtles nested in the open beach zone (n=157),0.6 % nested in the border zone (n=1) and 7.6 % did not lay eggs (n=13).
3.4 Biometric Data CollectionLeatherback turtles with complete and incomplete caudal projections were compared andfound not to be significantly different (two-tailed t-test p>0.05, Mann-Whitney test p>0.05).Hence, data for the two categories were pooled to yield a total sample size of 114 femaleleatherback turtles with a mean carapace length (CCLmin) of 154.5 cm (Table 2).
Leatherback nests for which the eggs were counted during laying had a mean clutch size of 81normal eggs and 28 yolkless eggs (Table 2).
Table 2. Mean carapace length and clutch size of leatherbacks.Carapace length _ Clutch size _
Caudalprojection n
_ ×× CCLmin (cm) ± S.D. n
×× eggs± S.D.
×× yolklesseggs ± S.D.
Complete 110 154.7 ± 6.5 64 81 ± 18 28 ± 14Incomplete 4 148.3 ± 5.6 3 80 ± 12 41 ± 12Total 114 154.5 ± 6.6 67 81 ± 17 28 ± 14
Leatherback turtles sighted more than once (n=40) had their caudal projection consistentlyidentified as complete (n=37) in 92.5 % of cases, and varyingly as complete and incomplete(n=3) in 7.5 % of cases.
The mean carapace length (CCLmin) for green turtles encountered during the 2002Leatherback Program was 105.1 cm and 34 clutches for which egg counts were conductedcontained a mean of 110 eggs (Table 3). The four hawksbill turtles that were measured had amean carapace length (CCLmin) of 87.0 cm and the three hawksbill clutches that werecounted had a mean of 149 eggs (Table 3).
Table 3. Mean carapace length and clutch size of green and hawksbill turtles.
Species n _ Carapace length ×× CCLmin (cm) ± S.D. n
_ Clutch size ×× eggs ± S.D.
GreenHawksbill
107 4
105.1 ± 5.1 87.0 ± 4.8
34 3
110 ± 31149 ± 16
The precision of the CCLmin measurement during the same encounter was higher for greenturtles (a mean of 0.4 cm) than for leatherback turtles (a mean of 0.6 cm) (Table 4a).

15
The precision of the CCLmin carapace measurements for leatherback turtles measured duringmore than one encounter was 1.3 cm for two encounters, 2.7 cm for three encounters and 2.2cm for four and five encounters (Table 4b).
Table 4a. Precision of carapace measurements.
Species n
_ ×× precision for
CCLmin (cm) ± S.D.Leatherback 159 0.6 ± 0.6Green 110 0.4 ± 0.6
Table 4b. Precision of carapace measurements for leatherbacks encountered more than once.
Encounters n
_ ×× precision for
CCLmin (cm) ± S.D.Range(cm)
2 31 1.3 ± 0.7 0.4 - 4.13 4 2.7 ± 2.4 0.6 - 6.14 1 2.2 ± N/A N/A5 1 2.2 ± N/A N/A
3.5 Determination of Nest Survivorship and Hatching SuccessA total of 18 leatherback nests were marked between 16 March and 25 June 2002. The fate ofone of the nests could not be determined with certainty and hence the nest was excluded fromfurther analysis. The fate, hatching and emerging success of marked and monitoredleatherback nests are summarized in Table 5.
The distance from the sand surface to the top egg at the time of excavation for undisturbednests (n=6) varied between 33-105 cm with a mean of 58 cm. The distance from the sandsurface to the bottom of the egg chamber for the same nests varied between 58-118 cm with amean of 80 cm.
The incubation period for monitored leatherback nests for which emerging was observed(n=3) varied between 62-65 days with a mean of 63 days.
Table 5. Fate, hatching and emerging success of marked leatherback nests.Fate n % of total Hatching success (%) Emerging success (%)Undisturbed1. Undisturbed 6 35.3 53.3 44.1Disturbed2. Washed over 2 11.8 48.1 23.43. Washed out 9 52.9 0 0
TOTAL 17 100 24.4 18.0
(4. Unknown 1)
If it is assumed that the mean number of eggs per excavated nest (68.3 eggs/nest) isrepresentative for all leatherback nests then the total number of eggs for all marked nestsequals 1,161 eggs (68.3 x 17). Therefore, overall hatching success was 24.4 % for monitoredleatherback nests (283 empty shells from 1,161 eggs). Using the same assumptions, emerging

16
success for monitored leatherback nests is estimated at 18.0 % (209 emerged hatchlings from1,161 eggs in 17 nests).
All monitored leatherback nests that were washed out (n=9) were located within 11.55 m ofthe high tide line at the time of oviposition. However, 4 monitored leatherback nests laidwithin 11.55 m of the high tide line hatched and emerged undisturbed, including one nests thatwas located only 2.1 m from the high tide line at the time of oviposition.
Eggs containing deformed embryos accounted for 0.18 % of eggs in leatherback nests thatwere undisturbed or washed over (Table 6b).
Table 6a. Results of nest excavations.Fate Empty Shells Pipped
eggsLive
hatchlingsDead
hatchlingsUnhatch.
No embryoUnhatch.Embryo
Unhatch.Full embryo
Depredated Total eggs _× eggs/nest
Marked nests1 209 17 1 35 70 39 54 3 392 65.32 74 0 2 36 63 8 9 0 154 77.03 0 0 0 0 0 0 0 0 ? ?
ALL 283 17 3 71 133 47 63 3 ? 68.3Fate 1=Undisturbed, 2=Washed over, 3=Washed out
Table 6b. Incidence of deformed leatherback embryos.n % of eggs
Deformed embryos 1 0.18TOTAL 1 0.18
3.6 Physical Data CollectionRainfall during the months with leatherback nesting (February-July) was heaviest in May(Table 7). March was the month with least rain (Table 7).
Table 7. Rainfall, December 2001-September 2002.
MonthTotal rainfall(mm/month)
_ ×× rainfall
(mm/24hrs)December 929.3 30.0January 848.8 27.4February 296.8 10.6March 225.2 7.3April 253.0 8.4May 721.2 23.3June 595.9 19.9July 713.4 23.0August 763.4 24.6September 181.0 6.0*Data for 48 hours for 3-4 January, 16-17, 18-19, 20-21 March, 16-17 April, 17-18 May, 29-30 June**Data for 72 hours for 25-27 June***Data for 96 hours for 23-26 February
Mean minimum air temperature was lowest in January and highest in June, mean maximum airtemperature was lowest in December and highest in April and September (Table 8).

17
Table 8. Air temperature, December 2001-September 2002.
Month
_ ×× minimumtemp. (oC) *
_ ×× maximumtemp. (oC) *
December 24.4 29.1January 24.2 30.3February 24.6 32.8March 25.4 33.2April 24.9 33.6May 25.4 31.6June 25.8 33.2July 25.0 31.4August 25.0 29.8September 25.5 33.7*No data for 21 December, 3 January, 23-25 February, 16-18, 20 March, 16-17 April, 17 May, 24-26 June, 29June
In late June, high tides and rough seas almost washed out the temperature dataloggers locatedin the open beach zone. Therefore on July 1, the open zone dataloggers were relocated to awider beach section but remained in the open zone without receiving any shading from thevegetation and at the same depth as before.
There is an inverse relationship between sand temperature and shading from vegetation. In theopen zone, the shallow datalogger at 30 cm generally record higher mean temperatures thanthe dataloggers located at 50 and 70 cm (Table 9). This is not the case in the border andvegetation zones where there is little difference in temperatures recorded by shallow (30 cm)and deep (50 and 70 cm) dataloggers (Table 9). The sand temperature at 70 cm depth in theopen beach zone where 91.8 % of leatherback nests were laid is shown in Figure 3.
Table 9. Mean monthly sand temperatures.Zone _ Open
×× temp (ºC) _ Border
×× temp (ºC) _ Vegetation×× temp (ºC)
Depth (cm) 30 a,b 50 a,c 70 a 30 50 70 30 50 70DecemberJanuary
N/AN/A
27.027.5
N/A27.2
26.226.2
26.126.1
25.926.0
24.824.5
24.924.6
24.924.6
February N/A 28.7 28.6 27.7 27.5 27.3 25.5 25.6 25.7Retrieval depth (cm) 7 March N/A 58 74 35 57 75 30 50 70Depth (cm) 7 March 30 50 70 30 50 70 30 50 70March 30.4 30.0 29.5 27.7 27.8 27.6 26.1 26.2 26.1April 31.4 31.1 30.6 27.9 28.2 28.1 26.6 26.7 26.7May 28.9 28.8 28.5 27.0 27.3 27.4 26.0 26.2 26.3June 30.9 N/A 30.2 28.5 28.6 28.5 27.0 27.1 27.1Retrieval depth (cm) 15 June 32 52 74 26 47 73 34 51 70Depth (cm) 15 June 30 50 70 30 50 70 30 50 70JulyAugust
28.427.8
N/AN/A
27.927.5
27.126.5
27.326.9
27.326.9
26.125.7
26.325.9
26.426.1
Retrieval depth (cm) 25 AugustRetrieval depth (cm) 6 Sept.
33 50 6939 60 78 28 50 62
a High tides almost washed out the dataloggers located in the open zone on 1 July so dataloggers wererelocated to the open zone on a wider beach section.b Data from 7 March onwardsc No data for 16 June-24 August

18
The PVC pipes used to measure the ground water level were almost washed out by high tidesand rough seas and were relocated on 1 July 2002 to a wider beach section close to the fieldstation. Heavy rains in early May (unusual!) and late June resulted in high ground water levelsthat could be noted in the PVC pipes (Figure 4). At these occasions, it is likely that the highground water inundated some leatherback nests. Also, the high tides and rough seas washedout a large proportion of marked and monitored leatherback nests at the same time(Table 5).
3.7 Collection of Human Impact DataThe number of paying visitors coming to Tortuguero National Park has continuouslyincreased since 1999 and totalled 45,232 paying visitors in 2001 (Table 10).
Table 10. Number of Paying Visitors to Tortuguero National Park, 1999-2001.
YearCR
VisitorsForeignVisitors Total
1999 5,767 32,863 38,6302000 5,543 36,354 41,8972001 6,175 39,057 45,232Information from ACTo.
The number of visitors to the CCC Natural History and Visitors Center declined after 11September 2001 but started to increase again in June 2002 (Table 11). August 2002 was themonth with the highest mean daily visitation on record (Table 11).
Table 11. Visitors to the CCC Natural History and Visitors Center, January 2000-September2002.
2000 _ 2001 _ 2002 _Month Total ×× Per Day Total ×× Per Day Total ×× Per DayJanuary 1681* 67 1846 60 1756 57February 2427 84 2277 81 2108 75March 2582 83 2301 74 2581 83April 1742 58 2002 67 1738 58May 1365 44 1208 39 1239 40June 1437 48 1334 44 1463 49July 2899 94 2720 88 2673 86August 2645 80 2858 92 3419 110September 1871 62 1440 48 2043 68October 1746 56 1597 52November 2215 74 1550 52December 1964 63 1472 47TOTAL 24574 68 22605 62 19020 70*Visitor Center closed 1-6 January 2000 due to illness
The capacity of both hotels and cabinas in the Tortuguero area increased slightly in 2002(Table 12). The overall room and bed capacity of the hotels is approximately three times thecapacity of the cabinas.

19
Table 12. Room and bed capacity of the hotels and cabinas in the Tortuguero area.Hotels/Lodges Rooms Beds Cabinas Rooms BedsCaribe 9 17 All Rankin Lodge 8 18Caribbean Magic 16 42 Aracari 12 23Hollywood/Ever Green 15 30 La Casona 1 2Hotel Vista del Mar** 17 34 Chanu 5 16Ilan-Ilan 24 54 Ella y Yo 3 6Jungle 43 129 Hostel Daryl/Marbella 4 10Laguna 52 154 Joruki 7 14El Manati 11 17 Maryscar 22 49Mawamba 54 135 Ms Miriam 6 12Pachira 48 100 Ms Junie 12 30Tortuga 24 55 Sabina*** 22 35Turtle Beach Lodge** 12 24 Tortuguero 7 18Total – Hotels 325 791 (CCC 7 32)Cabinas Rooms BedsPisulin/Tropical Lodge* - - Total – Cabinas 116 265Pancana* - - TOTAL 441 1056* Rooms are rented out long-term to village residents instead of tourists** Located in Caño Palma, operating since 2001***Data from 2001
The beach sections with artificial lights remain the same but the number of lights behind theairport (mile 1 1/8-1 2/8) and in front of the village (mile 2 6/8-3 3/8) has increased. TheTortuguero representatives of the Costa Rican Electricity Institute (ICE) demonstratedconsiderable initiative when in August 2002, they shaded the majority of the village streetlights located closest to the beach.
Table 13. Artificial lights visible from the beach, Tortuguero river mouth to Mile 5.Mile Light source Beach side Lagoon side March April May*
-3/8 Tortuga Lodge + Houses X X X-2/8 Tortuga Lodge + Houses X X X6/8 Tortuga Lodge X X X X
1 1/8 Ilan-Ilan Lodge X1 1/8 House X X X1 2/8 Ilan-Ilan Lodge + House X X X1 3/8 Manati + Laguna Lodge X X X1 4/8 Laguna Lodge X X1 7/8 House? X2 2/8 Mawamba Lodge X X2 3/8 Mawamba Lodge X X X X2 4/8 CCC X X2 5/8 CCC X X X X2 6/8 Houses X X X X2 7/8 Houses + Street Lights X X X X
3 Houses + Street Lights X X X X3 1/8 Houses + Street Lights X X X X3 2/8 Houses + Street Lights X X X X3 3/8 House + Street Lights X X X X
1/8-6/8, 1 1/8-4 6/8 Street lights (m2 7/8-3 2/8) X X X X*Due to high tide the beach was unpassable by mile -1/8 so survey initiated at mile 0.

20
3.8 Dead TurtlesAll dead sea turtles encountered during the 2002 Leatherback Program were female greenturtles (Table 14). The majority were nesting turtles killed by jaguars on the beach sectionbetween the mile 5 marker and the Juana López path. Also, RAs and the FC registered theremains of two green turtles that had been slaughtered by poachers (Table 14).
Table 14. Dead turtles.Date Species Sex Mile Comments
18 March Cm F 6 4/8 Jaguar kill (previous night).21 March Cm F 11 4/8 Jaguar kill (previous night).30 March Cm F 12 4/8 Jaguar kill (two nights before).5 April Cm F 14 Jaguar kill (previous night).8 April Cm F 12 4/8 Jaguar kill (previous night).
18 April Cm F 13 Jaguar kill reported by park rangers.23 April Cm F 13 Jaguar kill (previous night).26 April Cm F 7 4/8 Jaguar kill (previous night).29 April Cm F 11 Jaguar kill (previous night).2 May Cm F 10 4/8 Jaguar kill (previous night).10 May Cm F 9 Carapace from poached green turtle close to vegetation.14 May Cm F 12 4/8 Jaguar kill (one week before?).23 May Cm F 9 4/8 Jaguar kill.1 June Cm F 5 4/8 Jaguar kill (previous night).4 June Cm F 12 4/8 Jaguar kill (two nights before).7 June Cm F 13 Jaguar kill (previous night).11 June Cm F 7 4/8 Jaguar kill (previous night).11 June Cm F 13 Jaguar kill (previous night).13 June Cm F 8 4/8 Jaguar kill (two nights before).13 June Cm F 0 Poached turtle.
Cm=green turtle
3.9 Environmental Education ActivitiesOne of the RAs in the 2002 Leatherback Program was from the Tortuguero community.Students from the Tortuguero school and high school occasionally participated in taggingpatrols during the leatherback program.
4. DISCUSSION
4.1 PreparationsHigh tides and rough seas washed out many of the mile markers that were put up in March2002. For future programs, it is therefore suggested that one marker be located at thevegetation line and that the two markers closest to the vegetation are numbered with therespective mile. This arrangement would ensure that at least one marker is located far fromthe high tide line and at the same time, that there are markers located away from thevegetation line where termites may shorten the lifetime of the wooden posts.
Radio communication with the team working between Jalova lagoon and mile 14 was oftendifficult. Clear communication with the Jalova ranger station could only be undertaken veryclose to the river mouth in spite of using new walkie-talkie units. As a long-term goal, it issuggested that taller antennas be installed at the Jalova park ranger station and at the CCC

21
Field Station in Tortuguero in order to improve communication between beach teams andstation personnel. The special plastic radio bags purchased to protect the handheld walkie-talkies from corrosion wore out toward the end of the program. However, the bags served thepurpose of protecting the units and it is suggested that new bags are bought for use during the2003 programs.
4.2 Track SurveysLeatherback nesting was observed from February through July with peak nesting during theMarch-June period (Figure 1, pers. obs.). Track surveys conducted by RAs and the FCcoincide with the period of heaviest leatherback nesting (Table 1).
The two methods used for estimating the number of leatherback nests show differences forindividual beach sections (Figure 2a-c). However, it is encouraging to see that the totalestimates for the entire beach between the Tortuguero river mouth and Jalova lagoon, 782nests for surveys conducted by the track surveyor and 779 nests for surveys conducted byRAs are very similar.
Poaching of leatherback nests was lower during the 2002 Leatherback Program than duringprevious leatherback turtle nesting seasons. One of the major reasons for the decline inpoaching were the increased patrols by park rangers on ATV and boats that were madepossible by a Care for the Wild International donation of funds for purchase of additionalgasoline. As a result of the early start to the green turtle nesting season, many green turtlenests also benefitted from the increased park ranger patrols and poaching of green turtle nestswas remarkably low (Table 1). Similar park ranger patrols must be maintained during futureprograms to control poaching of leatherback and other sea turtle nests within TortugueroNational Park. Track survey results indicate that the beach section between Jalova lagoon andthe Parismina river mouth is most affected by poaching (Figure 2a-d). Although this beachsection is located outside of the National Park, it would be highly beneficial if TortugueroNational Park rangers or personnel from the Costa Rican Coast Guard based in Parisminawould increase patrols along this beach section in future leatherback nesting seasons. Thiswould not only result in a decrease in poaching along that particular stretch of beach but isalso likely to decrease poaching in adjacent beach sections, both within and outside ofTortuguero National Park.
4.3 Tagging of Nesting Sea TurtlesTagging of nesting sea turtles was carried out from mid-March to mid-June, which coincideswith the period of heaviest leatherback nesting (Figure 1). The dedicated efforts of the FC andRAs resulted in more team hours of beach patrols than during any previous leatherbackprogram. The 1,181 hours of beach patrols paid off and more leatherback encounters wereregistered during the 2002 Leatherback Program than during any previous year (Appendix 1).The record number of leatherback encounters logged during the 2002 Leatherback Programwas due to the increase in nightly tagging patrols between Jalova lagoon and mile 14 ratherthan large numbers of nesting leatherback turtles. Also, the early start to the green turtlenesting meant that more green turtle encounters were logged than during previous leatherbackprograms (Appendix 1).

22
The many encountered leatherback turtles originally tagged on other nesting beaches inCaribbean Costa Rica and Panama emphasize the high mobility of nesting leatherback turtlesin the region. It also highlights the importance of cooperation between conservation projectsand the need to expand activities to the entire coastline. Beach sections with little institutionalpresence and probably high levels of poaching include Jalova lagoon-Parismina and Lagunasde Urpiano-Moín in Costa Rica.
The low level (4 %) of newly tagged turtles that showed evidence of old tag holes or notchesis encouraging and may indicate that flipper tag loss is less of a problem for the CaribbeanCosta Rica and Panama leatherback population than for leatherback populations elsewhere(Eckert & Eckert 1989). However, the only way of testing this hypothesis is to compileinformation from all leatherback tagging projects along the coast and determine the probabilityof tag loss according to the methodology described by Wetherall (1982).
4.4 Biometric Data CollectionThe mean carapace length (CCLmin) for leatherback turtles measured during the 2002Leatherback Program is slightly larger than during previous programs (Table 2). Futuremonitoring of CCLmin should be a priority so it may be determined if the increase in meanCCLmin is a result of observer variation or if it represents a change in age or size specificsurvivorship rates (decreased recruitment of smaller females into nesting population orincreased survivorship of larger mature individuals).
4.5 Determination of Nest Survivorship and Hatching SuccessA lower number of leatherback nests than normal was marked and monitored. The reason isthat fewer nests than normal were laid in the northern 5 2/8 miles where nests are marked. Apositive sign is that no poaching of marked leatherback nests was observed (Table 5).However, it is possible that poaching did occur but that rough seas and high tides washed outthe beach section where the marked leatherback nests were located so that poaching evidencecould not be found. Overall, hatching success was similar to previous years.
It remains clear that the distance between the nest and the high tide line as well as the distancebetween the nest and the vegetation line can not be used as exact clues for the fate ofleatherback nests. The dynamic nature of the Tortuguero beach means that some leatherbacknests will be washed out as a result of rapid changes in the beach morphology and that this isnot related to nest location at the time of laying. Therefore, relocation of selected leatherbacknests does not appear to be a suitable conservation technique for leatherback nests atTortuguero.
Although only one deformed leatherback embryo was encountered during excavations (Table6b), it represents 0.18 % of all eggs in undisturbed and washed over nests. Research into thepresence of pesticides and other agricultural chemicals in the Tortuguero beach are needed todetermine if use of chemicals inland from Tortuguero National Park represents a threat to seaturtle egg and hatchling survival.

23
4.6 Physical Data CollectionUnusually heavy rains fell in early May 2002 (Table 7). This is a period that is usually amongstthe driest months of the year. The heavy rains caused extensive flooding along the Caribbeancoast of Costa Rica and Panama.
As a result of the heavy rains, sand temperatures at 70 cm depth in the open beach zonedropped as much as 4ºC between 23 April and 20 May (Figure 3). If the pivotal temperaturefor leatherback turtles nesting at Tortuguero is the same as the estimated pivotal temperaturefor leatherback turtles in French Guiana (Figure 3; Girondot 1999) then it is probable thatboth male and female hatchlings were produced during the 2002 leatherback nesting season.Due to the lower temperatures from late June to mid-September, it is likely that many of thelate leatherback nests (laid in late June-early July) resulted in predominantly male hatchlings.
The new TidBit datalogger (Onset Computer Corporation) that was placed in a protectivecasing appears to have recorded temperatures successfully. The protective casing reduces thelikelihood of dataloggers failing due to high temperature coupled with high humidity. It issuggested that when dataloggers fail, they are replaced with TidBit dataloggers.
The early May rainfall also raised ground water levels to a point where lowlaying leatherbacknests may have been inundated (Figure 4).
4.7 Collection of Human Impact DataAccording to the results of the Tortuguero Conservation Area (ACTo) monitoring of payingvisitors to Tortuguero National Park, tourism is continuing to increase (Table 10). Thecapacity of hotels and cabinas in the Tortuguero area is also increasing (Table 12) which maycontribute to more people benefitting economically from ecotourism activities in Tortuguero.
The data from the CCC Natural History and Visitors Center suggest that visitation toTortuguero declined after 11 September 2001 (Table 11). However, by June 2002 visitationwas back to pre-11 September levels and since then it appears that visitation has increasedfurther (Table 11).
The increase in infrastructure and housing in Tortuguero also increases the number of artificiallights, mainly along the beach sections that are already developed (Table 13). It is encouragingto see the efforts made by the Tortuguero workers of the Costa Rican Electricity Institute(ICE) to shade street lights in order to minimize the disorientation of hatchlings.
4.8 Dead TurtlesThe relatively low levels of poaching (Table 1) also meant that few slaughtered turtles wereencountered (Table 14). However, the jaguars kept killing and eating sea turtles during the2002 Leatherback Program. The jaguars were selectively killing green turtles even if a greaternumber of nesting leatherback turtles were present on the beach. Tortuguero ConservationArea biologist Magaly Castro began a more detailed study of jaguars and sea turtledepredation towards the end of the 2002 Leatherback Program.

24
4.9 Environmental Education ActivitiesIt is suggested that efforts be made to continue the practise of having at least one researchassistant position for each sea turtle program filled by a person from Tortuguero. Also, a moreformalized sea turtle education program for the Tortuguero School and High School would behighly beneficial and it is anticipated that such a program be implemented during the 2003Leatherback Program.
5. REFERENCESCampbell, C.L., C.J.Lagueux and J.A. Mortimer. 1996. Leatherback turtle, Dermochelys
coriacea, nesting at Tortuguero, Costa Rica, in 1995. Chel. Cons. Biol., 2(2), 169-172.
Carr, A., Carr, M.H. and A.B. Meylan. 1978. The ecology and migrations of sea turtles, 7.The west Caribbean green turtle colony. Bull. Amer. Mus. Nat. Hist. 162: 1-46.
Eckert, K.L. and S.A. Eckert. 1989. The application of plastic tags to leatherback sea turtles,Dermochelys coriacea. Herpetol. Rev. 20: 90-91.
Girondot, M. 1999. Statistical description of temperature-dependent sex determination usingmaximum likelihood. Evol. Eco. Res. 1:479-486.
Wetherall, J.A. 1982. Analysis of double-tagging experiments. Fish. Bull. 80: 687-701.
Whittaker, E. T. and G. Robinson. 1967. The Trapezoidal and Parabolic Rules. In: TheCalculus of Observations: A Treatise on Numerical Mathematics. 4th Edition. Dover,New York. p156-158.

25
6. RECOMMENDATIONS
6.1 Preparations
⇒ Three mile markers should be placed at each beach section. At least two markers shouldbe marked with the mile number, one of them should be placed by the vegetation line andthe other on the open beach.
⇒ Special rubber radio bags should be bought to protect the handheld walkie-talkies.
6.2 Track Surveys
⇒ Beach sections with little institutional presence and high levels of poaching include Jalovalagoon-Parismina and Lagunas de Urpiano-Moín. Increased park ranger or coast guardpatrols along these beach sections are desirable during the leatherback nesting season.
6.3 Tagging of Nesting Sea Turtles
⇒ A joint database for all leatherback tagging projects along the Caribbean coast of CostaRica and Panama should be pursued. For example; probability of tag loss could bedetermined for the Monel #49 tags currently used by all projects.
6.4 Biometric Data Collection
⇒ Monitoring of carapace length of female leatherback turtles should be a priority as it mayindicate changes in size or age specific survivorship rates.
6.5 Determination of Nest Survivorship and Hatching Success
⇒ Leatherback nests should not be relocated as the distance between the high tide line andthe nest at the time of laying can not be used as an exclusive cue for hatching or emergingsuccess.
⇒ Research is needed to determine if there is any correlation between deformed embryos andpresence of agricultural chemicals in the beach.
6.6 Physical Data Collection
⇒ TidBit dataloggers with protective casings should be bought when dataloggers needreplacement.
6.7 Collection of Human Impact Data
⇒ The Costa Rican Electricity Institute should be encouraged to continue shading streetlights in Tortuguero.
6.8 Dead Turtles
⇒ Any advice or datasharing that can be provided to jaguar researchers should beencouraged.
6.9 Environmental Education Activities
⇒ An attempt should be made to have at least one Tortuguero youth participating as aresearch assistant in each future leatherback program.

Figure 1. Seasonal distribution of leatherback nesting activity as determined from track surveys, Tortuguero rivermouth (mile -3/8) - Jalova lagoon (mile 18).
0
5
10
15
20
25
01-Feb-02 03-Mar-02 02-Apr-02 02-May-02 01-Jun-02 01-Jul-02 31-Jul-02
Date
Lea
ther
bac
k n
ests
26

27

28

Figure 4. Ground water level.
-140
-120
-100
-80
-60
-40
-20
0
01-Feb-02 03-Mar-02 02-Apr-02 02-May-02 01-Jun-02 01-Jul-02 31-Jul-02 30-Aug-02
Date
Gro
un
d w
ater
leve
l (cm
)
5 m from H.T.L (18 March 1998) 10 m from H.T.L (18 March 1998) 15 m from H.T.L (18 March 1998)*PVC pipes used for measuring ground water level were almost washed out due to rough seas and were moved to a wider sectionof beach on 1 July 2002.
29

APPENDIX 1. SEA TURTLE ENCOUNTERS.Date Leatherbacks Greens Hawksbills
Newlytaggedturtles
Previouslytaggedturtles
Renesters Total Newlytaggedturtles
Previouslytaggedturtles
Renesters Total Newlytaggedturtles
Total
11-Mar-02 0 0 012-Mar-02 0 0 013-Mar-02 0 0 014-Mar-02 0 0 015-Mar-02 2 1 3 0 016-Mar-02 2 5 0 017-Mar-02 5 0 018-Mar-02 5 1 1 019-Mar-02 1 6 1 2 020-Mar-02 6 2 021-Mar-02 2 8 2 022-Mar-02 1 3 12 2 023-Mar-02 12 2 024-Mar-02 1 2 15 2 025-Mar-02 2 1 18 1 3 026-Mar-02 18 3 027-Mar-02 1 19 2 5 028-Mar-02 19 1 6 029-Mar-02 1 20 6 030-Mar-02 1 2 23 1 7 031-Mar-02 1 1 3 28 1 8 001-Apr-02 28 8 002-Apr-02 1 1 2 32 8 003-Apr-02 2 1 35 8 004-Apr-02 1 36 8 005-Apr-02 36 2 10 006-Apr-02 1 1 38 10 007-Apr-02 38 10 008-Apr-02 1 1 1 41 10 009-Apr-02 2 1 1 45 1 11 010-Apr-02 1 46 11 011-Apr-02 2 2 50 11 012-Apr-02 1 51 1 12 013-Apr-02 51 12 014-Apr-02 1 1 53 12 015-Apr-02 3 4 60 12 016-Apr-02 60 12 017-Apr-02 2 2 1 65 12 018-Apr-02 3 1 1 70 3 15 019-Apr-02 70 15 020-Apr-02 1 71 1 16 021-Apr-02 1 2 74 16 022-Apr-02 1 75 16 023-Apr-02 1 76 1 17 024-Apr-02 1 1 78 17 025-Apr-02 78 17 026-Apr-02 2 5 85 17 0
30
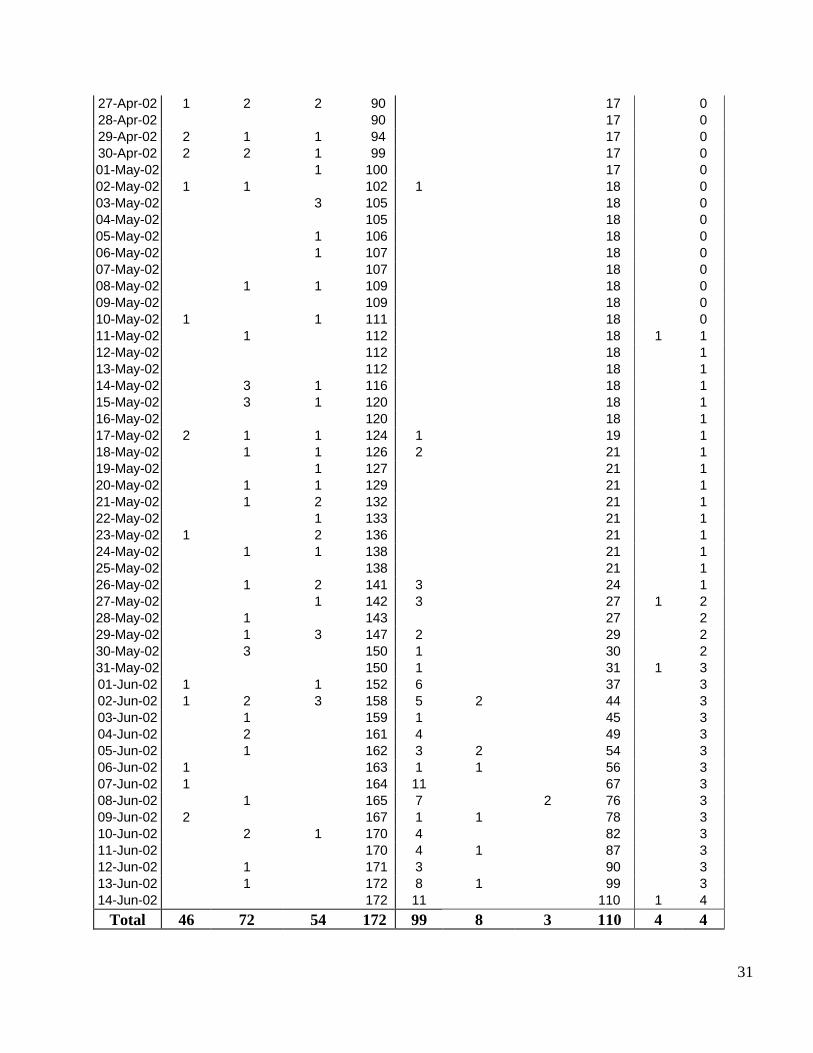
27-Apr-02 1 2 2 90 17 028-Apr-02 90 17 029-Apr-02 2 1 1 94 17 030-Apr-02 2 2 1 99 17 001-May-02 1 100 17 002-May-02 1 1 102 1 18 003-May-02 3 105 18 004-May-02 105 18 005-May-02 1 106 18 006-May-02 1 107 18 007-May-02 107 18 008-May-02 1 1 109 18 009-May-02 109 18 010-May-02 1 1 111 18 011-May-02 1 112 18 1 112-May-02 112 18 113-May-02 112 18 114-May-02 3 1 116 18 115-May-02 3 1 120 18 116-May-02 120 18 117-May-02 2 1 1 124 1 19 118-May-02 1 1 126 2 21 119-May-02 1 127 21 120-May-02 1 1 129 21 121-May-02 1 2 132 21 122-May-02 1 133 21 123-May-02 1 2 136 21 124-May-02 1 1 138 21 125-May-02 138 21 126-May-02 1 2 141 3 24 127-May-02 1 142 3 27 1 228-May-02 1 143 27 229-May-02 1 3 147 2 29 230-May-02 3 150 1 30 231-May-02 150 1 31 1 301-Jun-02 1 1 152 6 37 302-Jun-02 1 2 3 158 5 2 44 303-Jun-02 1 159 1 45 304-Jun-02 2 161 4 49 305-Jun-02 1 162 3 2 54 306-Jun-02 1 163 1 1 56 307-Jun-02 1 164 11 67 308-Jun-02 1 165 7 2 76 309-Jun-02 2 167 1 1 78 310-Jun-02 2 1 170 4 82 311-Jun-02 170 4 1 87 312-Jun-02 1 171 3 90 313-Jun-02 1 172 8 1 99 314-Jun-02 172 11 110 1 4
Total 46 72 54 172 99 8 3 110 4 4
31

APPENDIX 2: Observations and Anecdotal Information on Illegal HarvestPoaching levels were lower during the 2002 Leatherback Program than during previousleatherback nesting seasons at Tortuguero. However, there still appears to remain an activegroup outside Tortuguero whose members are dedicated to poaching of sea turtles and theireggs. Since the Costa Rican Coast Guard initiated conservation activities and beach patrolsalong the beach section south of the Parismina river mouth, it seems like the major focus forpoachers is the beach section between Jalova lagoon and the Parismina river mouth. Thisstretch is outside of Tortuguero National Park and track surveys indicate that poaching ishigher along this beach section than elsewhere (Figure 2a-d).
According to local sources, the organized group involved in turtle and egg poaching hasaccess to fast boats and attempt to visit the beach within Tortuguero National Park everycouple of days during the leatherback nesting season. The eggs and green turtles that arepoached are then transported out of the area, mainly to the city of Limón. Eggs are sold forapproximately ¢150/egg (~US$0.40) by persons that walk from bar to bar in Limón offeringeggs for sale to customers frequenting the bars. Green turtle meat is sold by persons that walkaround residential neighbourhoods in Limón offering meat for sale or through personalcontacts.
32