2002 annual report consolidated en
TRANSCRIPT

8/2/2019 2002 Annual Report Consolidated En
http://slidepdf.com/reader/full/2002-annual-report-consolidated-en 1/44

8/2/2019 2002 Annual Report Consolidated En
http://slidepdf.com/reader/full/2002-annual-report-consolidated-en 2/44
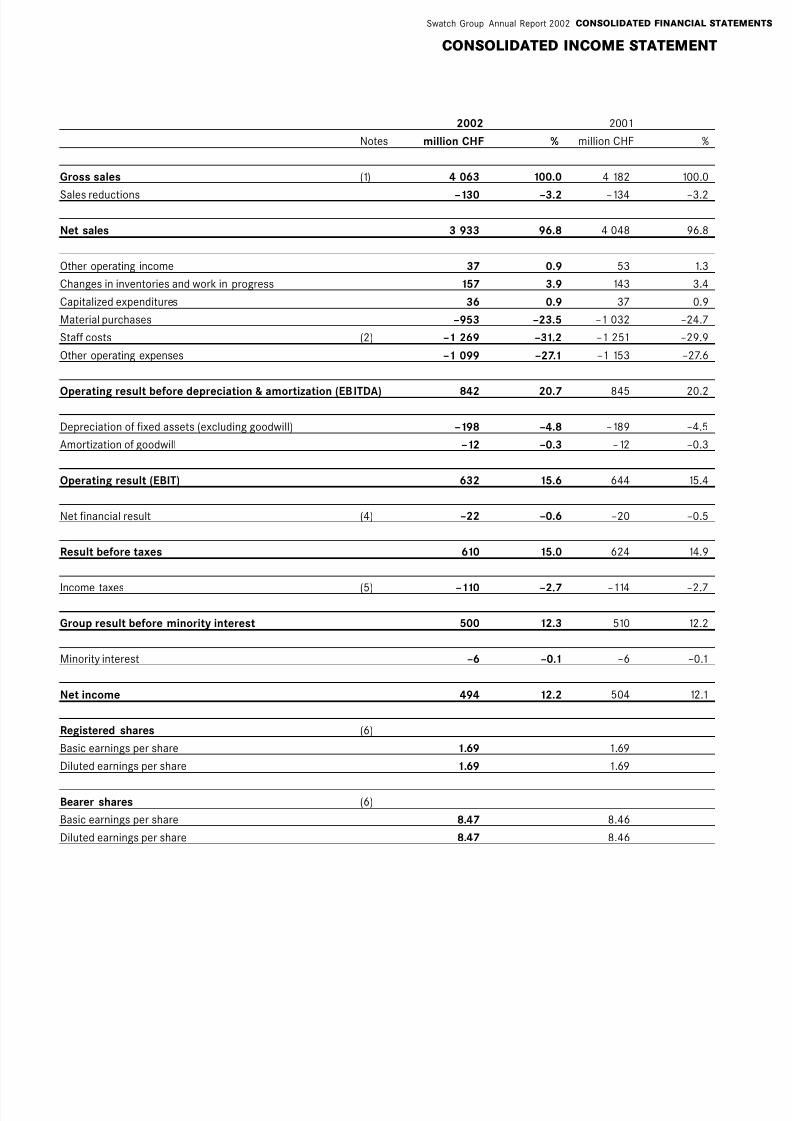
(1) 4 063 100.0 4 182 100.0
–130 –3.2 –134 –3.2
3 933 96.8 4 048 96.8
37 0.9 53 1.3
157 3.9 143 3.4
36 0.9 37 0.9
–953 –23.5 –1 032 –24.7
(2) –1 269 –31.2 –1 251 –29.9
–1 099 –27.1 –1 153 –27.6
842 20.7 845 20.2
–198 –4.8 –189 –4.5
–12 –0.3 –12 –0.3
632 15.6 644 15.4
(4) –22 –0.6 –20 –0.5
610 15.0 624 14.9
(5) –110 –2.7 –114 –2.7
500 12.3 510 12.2
–6 –0.1 –6 –0.1
494 12.2 504 12.1
(6)
1.69 1.69
1.69 1.69
(6)
8.47 8.46
8.47 8.46
2002 2001
Notes million CHF % million CHF %
Gross sales
Sales reductions
Net sales
Other operating income
Changes in inventories and work in progress
Capitalized expenditures
Material purchases
Staff costs
Other operating expenses
Operating result before depreciation & amortization (EBITDA)
Depreciation of fixed assets (excluding goodwill)
Amortization of goodwill
Operating result (EBIT)
Net financial result
Result before taxes
Income taxes
Group result before minority interest
Minority interest
Net income
Registered shares
Basic earnings per share
Diluted earnings per share
Bearer shares
Basic earnings per share
Diluted earnings per share
CONSOLIDATED INCOME STATEMENT
Swatch Group Annual Report 2002 CONSOLIDATED FINANCIAL STATEMENTS

8/2/2019 2002 Annual Report Consolidated En
http://slidepdf.com/reader/full/2002-annual-report-consolidated-en 3/44
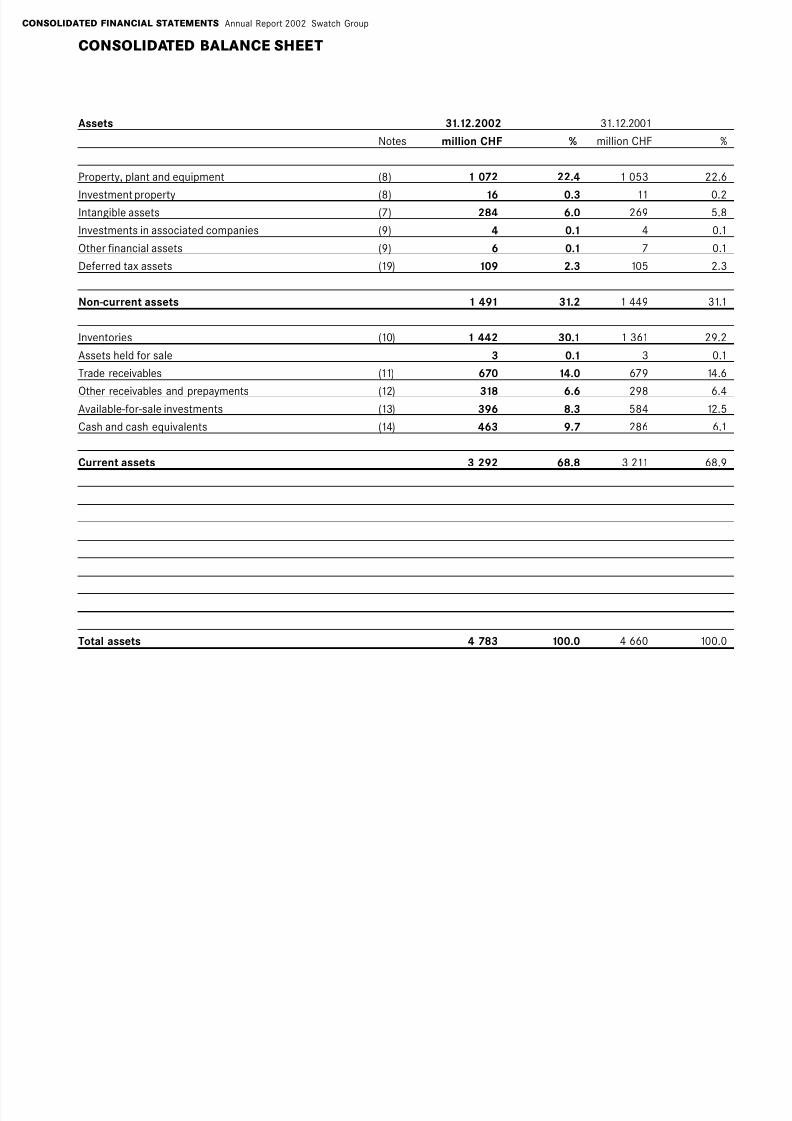
(8) 1 072 22.4 1 053 22.6
(8) 16 0.3 11 0.2(7) 284 6.0 269 5.8
(9) 4 0.1 4 0.1
(9) 6 0.1 7 0.1
(19) 109 2.3 105 2.3
1 491 31.2 1 449 31.1
(10) 1 442 30.1 1 361 29.2
3 0.1 3 0.1
(11) 670 14.0 679 14.6
(12) 318 6.6 298 6.4(13) 396 8.3 584 12.5
(14) 463 9.7 286 6.1
3 292 68.8 3 211 68.9
4 783 100.0 4 660 100.0
CONSOLIDATED FINANCIAL STATEMENTS Annual Report 2002 Swatch Group
CONSOLIDATED BALANCE SHEET
Assets 31.12.2002 31.12.2001
Notes million CHF % million CHF %
Property, plant and equipment
Investment propertyIntangible assets
Investments in associated companies
Other financial assets
Deferred tax assets
Non-current assets
Inventories
Assets held for sale
Trade receivables
Other receivables and prepaymentsAvailable-for-sale investments
Cash and cash equivalents
Current assets
Total assets
8/2/2019 2002 Annual Report Consolidated En
http://slidepdf.com/reader/full/2002-annual-report-consolidated-en 4/44
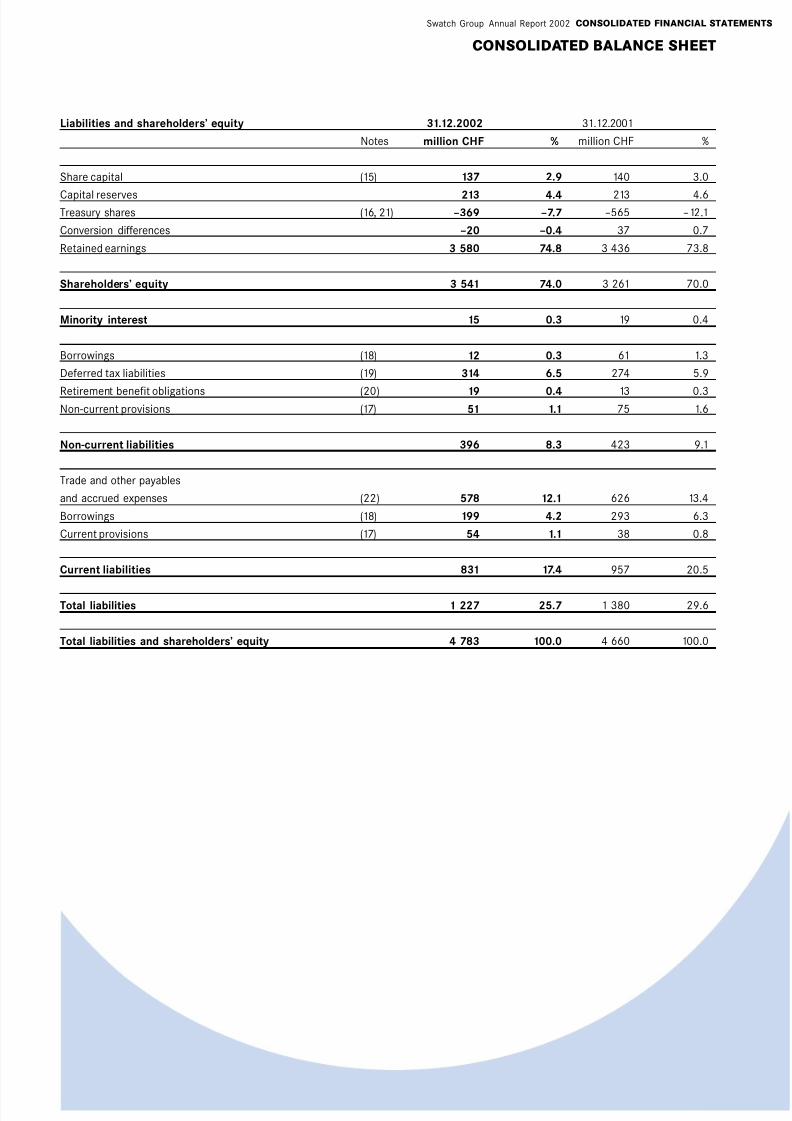
(15) 137 2.9 140 3.0
213 4.4 213 4.6(16, 21) –369 –7.7 –565 –12.1
–20 –0.4 37 0.7
3 580 74.8 3 436 73.8
3 541 74.0 3 261 70.0
15 0.3 19 0.4
(18) 12 0.3 61 1.3
(19) 314 6.5 274 5.9
(20) 19 0.4 13 0.3(17) 51 1.1 75 1.6
396 8.3 423 9.1
(22) 578 12.1 626 13.4
(18) 199 4.2 293 6.3
(17) 54 1.1 38 0.8
831 17.4 957 20.5
1 227 25.7 1 380 29.6
4 783 100.0 4 660 100.0
Swatch Group Annual Report 2002 CONSOLIDATED FINANCIAL STATEMENTS
CONSOLIDATED BALANCE SHEET
Liabilities and shareholders’ equity 31.12.2002 31.12.2001
Notes million CHF % million CHF %
Share capital
Capital reservesTreasury shares
Conversion differences
Retained earnings
Shareholders’ equity
Minority interest
Borrowings
Deferred tax liabilities
Retirement benefit obligationsNon-current provisions
Non-current liabilities
Trade and other payables
and accrued expenses
Borrowings
Current provisions
Current liabilities
Total liabilities
Total liabilities and shareholders’ equity
8/2/2019 2002 Annual Report Consolidated En
http://slidepdf.com/reader/full/2002-annual-report-consolidated-en 5/44
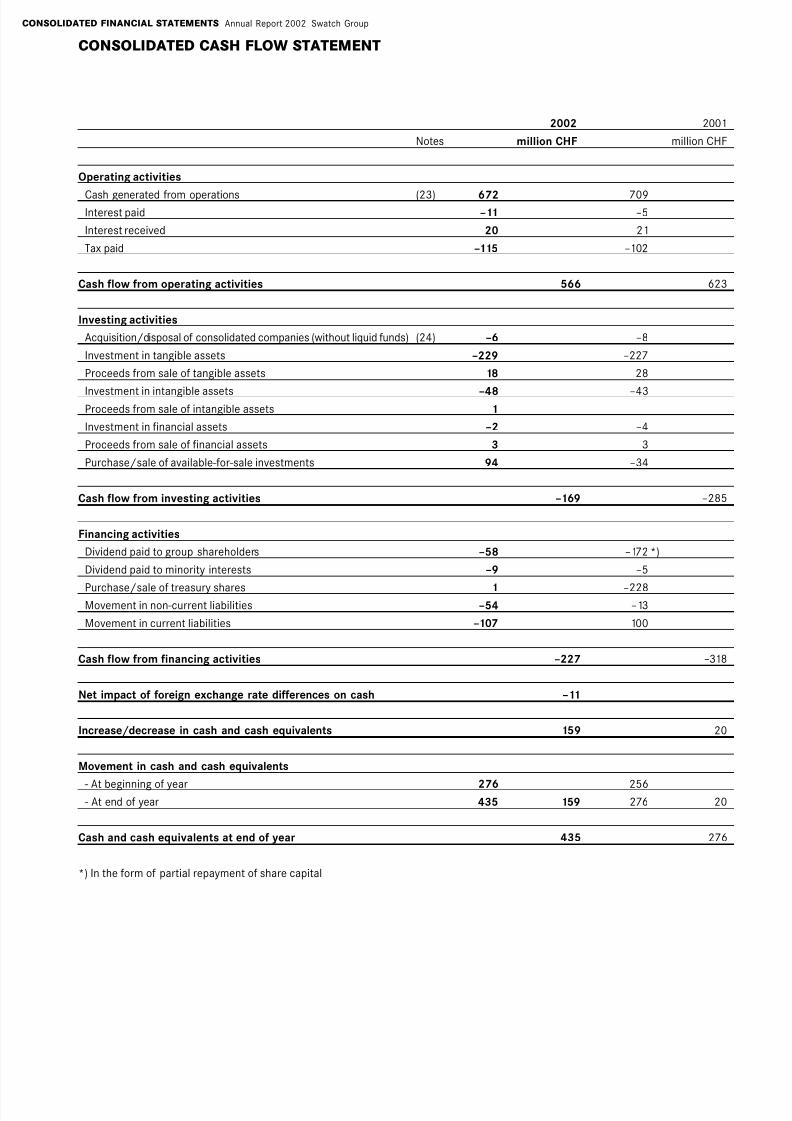
(23) 672 709–11 –5
20 21
–115 –102
566 623
(24) –6 –8
–229 –227
18 28
–48 –431
–2 –4
3 3
94 –34
–169 –285
–58 –172 *)
–9 –5
1 –228–54 –13
–107 100
–227 –318
–11
159 20
276 256435 159 276 20
435 276
CONSOLIDATED FINANCIAL STATEMENTS Annual Report 2002 Swatch Group
CONSOLIDATED CASH FLOW STATEMENT
2002 2001
Notes million CHF million CHF
Operating activities
Cash generated from operationsInterest paid
Interest received
Tax paid
Cash flow from operating activities
Investing activities
Acquisition/disposal of consolidated companies (without liquid funds)
Investment in tangible assets
Proceeds from sale of tangible assets
Investment in intangible assetsProceeds from sale of intangible assets
Investment in financial assets
Proceeds from sale of financial assets
Purchase/sale of available-for-sale investments
Cash flow from investing activities
Financing activities
Dividend paid to group shareholders
Dividend paid to minority interests
Purchase/sale of treasury sharesMovement in non-current liabilities
Movement in current liabilities
Cash flow from financing activities
Net impact of foreign exchange rate differences on cash
Increase/decrease in cash and cash equivalents
Movement in cash and cash equivalents
- At beginning of year- At end of year
Cash and cash equivalents at end of year
*) In the form of partial repayment of share capital

8/2/2019 2002 Annual Report Consolidated En
http://slidepdf.com/reader/full/2002-annual-report-consolidated-en 6/44
Swatch Group Annual Report 2002 CONSOLIDATED FINANCIAL STATEMENTS
GENERAL COMMENTS
Distribution of
gross sales by
product category
MANAGEMENT OF THE BUSINESS AND KEY FINANCIAL FIGURES
THE GROUP AS A WHOLE
Despite worldwide political unrest, uncertain future prospects, consumer reluctance, and the continuing rise
of the Swiss franc – which led to exchange losses of CHF 166 million – the Swatch Group nonetheless realized
an overall growth of +1.1% expressed in local currency in 2002, even though sales expressed in CHF dropped
slightly by –2.8%. This result clearly demonstrates that the Group succeeded in adapting both quickly and very
flexibly to external constraints.
In 2002, the launching of new products and technical innovations were the essential elements contributing to
the year’s positive results. Increase in market share in all segments, as well as effective cost control
significantly contributed to this very promising business development.
As a result of the swift streamlining of costs, the operating result after depreciation and amortization (EBIT)
experienced only a slight decline of –1.9%. Net income, which reached CHF 494 million, fell by only –2.0% with
respect to the prior year. The same figures expressed in dollars show an increase of +6.1% in gross sales, +7.2%in operating results and +7.0% in net income!
The Group’s extremely solid balance sheet and substantial liquidity will provide the freedom of movement
necessary for the Group to concentrate wholeheartedly on its operating business and current development
strategy over the coming years.
All internal Group statistics refer to gross sales. Gross sales to third parties are divided into two main
categories, of which the following table shows the main items:
2002 2001 Variance %
Total unit sales of watches, movements and
stepping motors (1000 units) 119 585 113 438 +5.4Sales of watches, movements and
stepping motors (million CHF) 3 256 3 315 –1.8
Other sales (million CHF) 807 867 –6.9
Total sales (million CHF) 4 063 4 182 –2.8
Average price of watches, movements and
stepping motors (CHF) 27.23 29.22 –6.8
Total unit sales include the sale of stepping motors, corresponding to 19.9 million units in 2002 and
12.9 million in 2001.

8/2/2019 2002 Annual Report Consolidated En
http://slidepdf.com/reader/full/2002-annual-report-consolidated-en 7/44
CONSOLIDATED FINANCIAL STATEMENTS Annual Report 2002 Swatch Group
Cash flow
from operating
activities
Operating result
Net income
GENERAL COMMENTS
Performance trend
WATCHES
(million CHF) 2002 2001 Variance %In local Exchange Total
currency differences
Sales 2 980 3 034 +3.2 –5.0 –1.8
Operating result before depreciation and
amortization (EBITDA) 558 565 –1.2
- As % of sales 18.7 18.6
Operating result (EBIT) 515 523 –1.5
- As % of sales 17.3 17.2
In 2002, the Swatch Group’s portfolio of watch brands realized positive and well-balanced growth. All the
important brands registered growth in local currency and were able to win market share, while the high-endbrands in particular enjoyed above-average growth.
The increase in operating margin from 2001 to 2002 shows that the Group is also capable of adapting rapidly
to a difficult economic environment.
The increase in operating profitability during the second half of the year was due principally to the product mix,
as well as to the doubled efforts made in reducing costs. By incorporating the investments made in
implementing various retail sales activities, marketing costs remained at the same high level as the prior year.
The opening of new shops also had a positive effect on margin.
PRODUCTION OF WATCHES, MOVEMENTS AND COMPONENTS
(million CHF) 2002 2001 Variance %
In local Exchange Total
currency differences
Sales
– Third parties 741 767
– Group 667 625
– Total 1 408 1 392 +1.9 % –0.8 +1.1
Operating result before depreciation and
amortization (EBITDA) 209 187 +11.8
– As % of sales 14.8 13.4
Operating result (EBIT) 83 65 +27.7– As % of sales 5.9 4.7
0 100 200 300 400 500 600 700
2002
2001
2000
8/2/2019 2002 Annual Report Consolidated En
http://slidepdf.com/reader/full/2002-annual-report-consolidated-en 8/44
Swatch Group Annual Report 2002 CONSOLIDATED FINANCIAL STATEMENTS
GENERAL COMMENTS
The operating margin in the watch, watch movement and component production segment rose considerably
with respect to the prior year. This increase in sales and profit is essentially due to product innovations and to
an increase in the proportion of mechanical movements. The moderate negative influence of exchange rates
in this segment was particularly felt in the sale of low-price movements in Hong Kong. Due to the constant
pressure on prices experienced in particular during the second half of the year, as well as to the increasinglyunfavorable exchange rates, operating margin during the second half of the year was slightly less than during
the first six months. Restructuring undertaken in this segment resulted in a non-recurring cost effect, also
largely concentrated in the second half of the year.
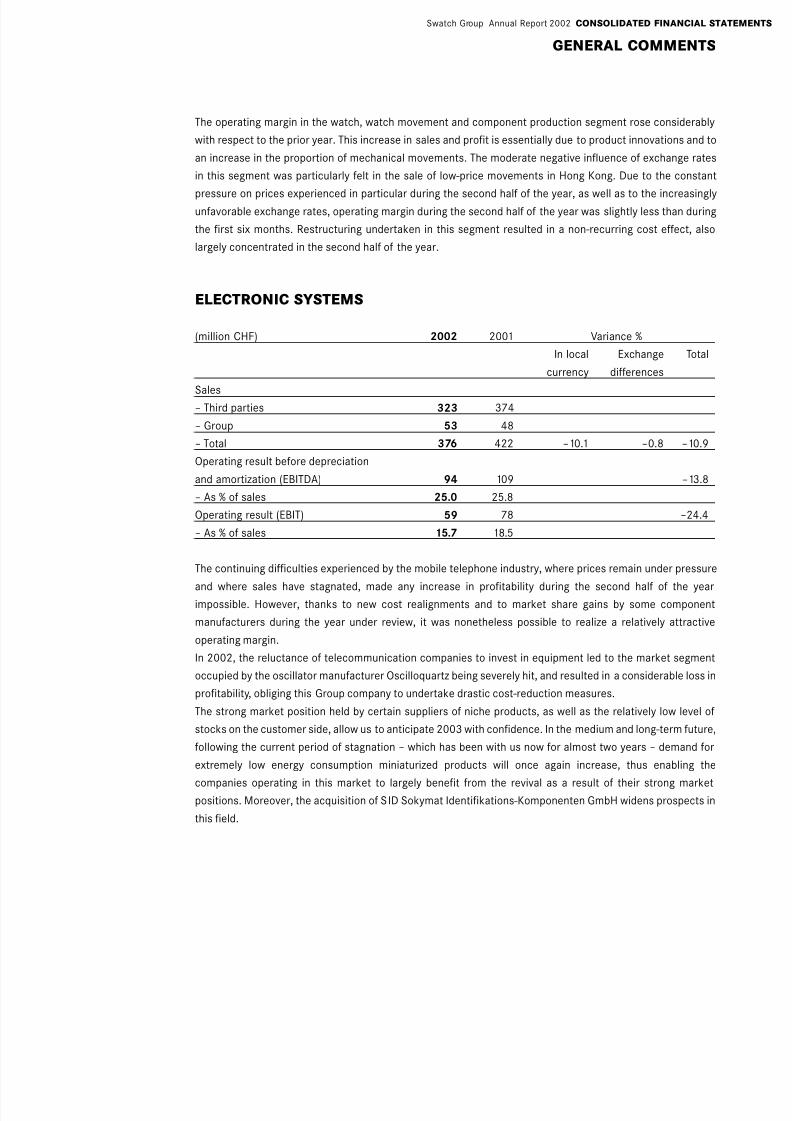
ELECTRONIC SYSTEMS
(million CHF) 2002 2001 Variance %
In local Exchange Total
currency differences
Sales– Third parties 323 374
– Group 53 48
– Total 376 422 –10.1 –0.8 –10.9
Operating result before depreciation
and amortization (EBITDA) 94 109 –13.8
– As % of sales 25.0 25.8
Operating result (EBIT) 59 78 –24.4
– As % of sales 15.7 18.5
The continuing difficulties experienced by the mobile telephone industry, where prices remain under pressure
and where sales have stagnated, made any increase in profitability during the second half of the yearimpossible. However, thanks to new cost realignments and to market share gains by some component
manufacturers during the year under review, it was nonetheless possible to realize a relatively attractive
operating margin.
In 2002, the reluctance of telecommunication companies to invest in equipment led to the market segment
occupied by the oscillator manufacturer Oscilloquartz being severely hit, and resulted in a considerable loss in
profitability, obliging this Group company to undertake drastic cost-reduction measures.
The strong market position held by certain suppliers of niche products, as well as the relatively low level of
stocks on the customer side, allow us to anticipate 2003 with confidence. In the medium and long-term future,
following the current period of stagnation – which has been with us now for almost two years – demand for
extremely low energy consumption miniaturized products will once again increase, thus enabling the
companies operating in this market to largely benefit from the revival as a result of their strong marketpositions. Moreover, the acquisition of SID Sokymat Identifikations-Komponenten GmbH widens prospects in
this field.
8/2/2019 2002 Annual Report Consolidated En
http://slidepdf.com/reader/full/2002-annual-report-consolidated-en 9/44
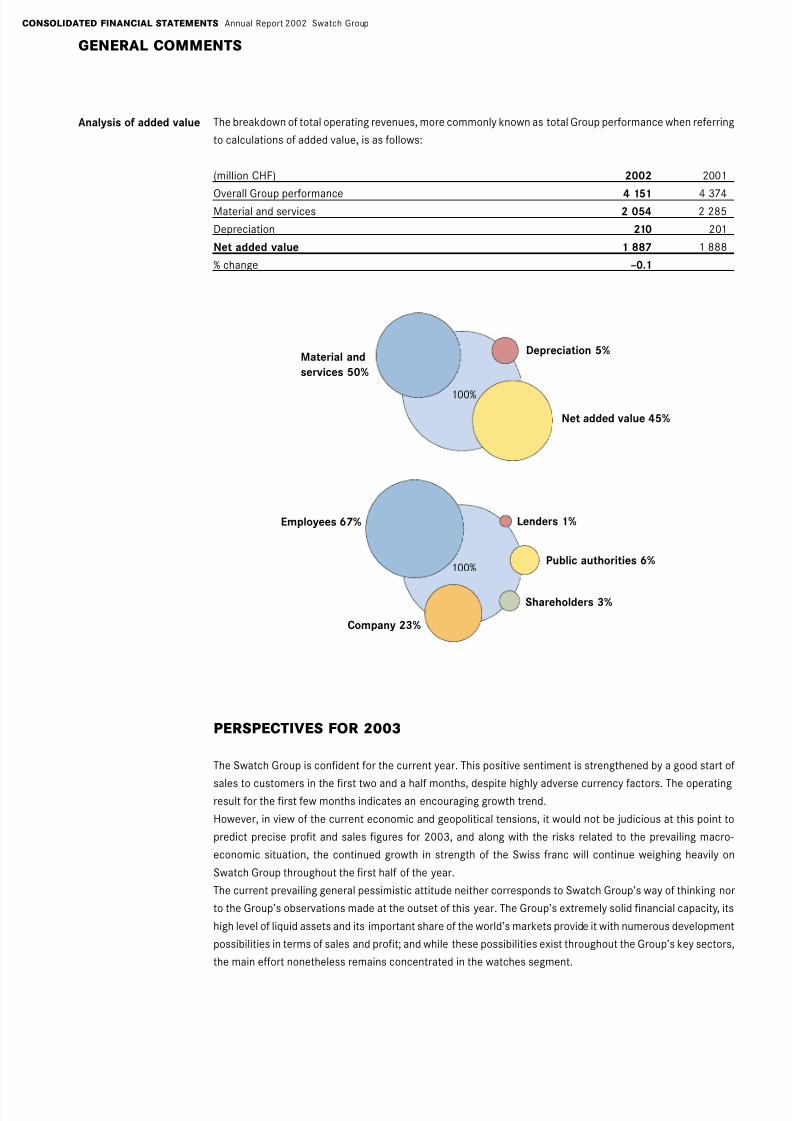
Company 23%
Material and
services 50%
Net added value 45%
Depreciation 5%
Employees 67%
Public authorities 6%
Lenders 1%
Shareholders 3%
CONSOLIDATED FINANCIAL STATEMENTS Annual Report 2002 Swatch Group
GENERAL COMMENTS
Analysis of added value The breakdown of total operating revenues, more commonly known as total Group performance when referring
to calculations of added value, is as follows:
(million CHF) 2002 2001
Overall Group performance 4 151 4 374Material and services 2 054 2 285
Depreciation 210 201
Net added value 1 887 1 888
% change –0.1
PERSPECTIVES FOR 2003
The Swatch Group is confident for the current year. This positive sentiment is strengthened by a good start of
sales to customers in the first two and a half months, despite highly adverse currency factors. The operatingresult for the first few months indicates an encouraging growth trend.
However, in view of the current economic and geopolitical tensions, it would not be judicious at this point to
predict precise profit and sales figures for 2003, and along with the risks related to the prevailing macro-
economic situation, the continued growth in strength of the Swiss franc will continue weighing heavily on
Swatch Group throughout the first half of the year.
The current prevailing general pessimistic attitude neither corresponds to Swatch Group’s way of thinking nor
to the Group’s observations made at the outset of this year. The Group’s extremely solid financial capacity, its
high level of liquid assets and its important share of the world’s markets provide it with numerous development
possibilities in terms of sales and profit; and while these possibilities exist throughout the Group’s key sectors,
the main effort nonetheless remains concentrated in the watches segment.
100%
100%
8/2/2019 2002 Annual Report Consolidated En
http://slidepdf.com/reader/full/2002-annual-report-consolidated-en 10/44
(1) 4 063 100.0 4 182 100.0
–130 –3.2 –134 –3.2
3 933 96.8 4 048 96.8
37 0.9 53 1.3
157 3.9 143 3.4
36 0.9 37 0.9
–953 –23.5 –1 032 –24.7
(2) –1 269 –31.2 –1 251 –29.9
–1 099 –27.1 –1 153 –27.6
842 20.7 845 20.2
–198 –4.8 –189 –4.5
–12 –0.3 –12 –0.3
632 15.6 644 15.4
(4) –22 –0.6 –20 –0.5
610 15.0 624 14.9
(5) –110 –2.7 –114 –2.7
500 12.3 510 12.2
–6 –0.1 –6 –0.1
494 12.2 504 12.1
(6)
1.69 1.69
1.69 1.69
(6)
8.47 8.46
8.47 8.46
2002 2001
Notes million CHF % million CHF %
Gross sales
Sales reductions
Net sales
Other operating income
Changes in inventories and work in progress
Capitalized expenditures
Material purchases
Staff costs
Other operating expenses
Operating result before depreciation & amortization (EBITDA)
Depreciation of fixed assets (excluding goodwill)
Amortization of goodwill
Operating result (EBIT)
Net financial result
Result before taxes
Income taxes
Group result before minority interest
Minority interest
Net income
Registered shares
Basic earnings per share
Diluted earnings per share
Bearer shares
Basic earnings per share
Diluted earnings per share
CONSOLIDATED INCOME STATEMENT
Swatch Group Annual Report 2002 CONSOLIDATED FINANCIAL STATEMENTS
8/2/2019 2002 Annual Report Consolidated En
http://slidepdf.com/reader/full/2002-annual-report-consolidated-en 11/44
(8) 1 072 22.4 1 053 22.6
(8) 16 0.3 11 0.2(7) 284 6.0 269 5.8
(9) 4 0.1 4 0.1
(9) 6 0.1 7 0.1
(19) 109 2.3 105 2.3
1 491 31.2 1 449 31.1
(10) 1 442 30.1 1 361 29.2
3 0.1 3 0.1
(11) 670 14.0 679 14.6
(12) 318 6.6 298 6.4(13) 396 8.3 584 12.5
(14) 463 9.7 286 6.1
3 292 68.8 3 211 68.9
4 783 100.0 4 660 100.0
CONSOLIDATED FINANCIAL STATEMENTS Annual Report 2002 Swatch Group
CONSOLIDATED BALANCE SHEET
Assets 31.12.2002 31.12.2001
Notes million CHF % million CHF %
Property, plant and equipment
Investment propertyIntangible assets
Investments in associated companies
Other financial assets
Deferred tax assets
Non-current assets
Inventories
Assets held for sale
Trade receivables
Other receivables and prepaymentsAvailable-for-sale investments
Cash and cash equivalents
Current assets
Total assets

8/2/2019 2002 Annual Report Consolidated En
http://slidepdf.com/reader/full/2002-annual-report-consolidated-en 12/44
(15) 137 2.9 140 3.0
213 4.4 213 4.6(16, 21) –369 –7.7 –565 –12.1
–20 –0.4 37 0.7
3 580 74.8 3 436 73.8
3 541 74.0 3 261 70.0
15 0.3 19 0.4
(18) 12 0.3 61 1.3
(19) 314 6.5 274 5.9
(20) 19 0.4 13 0.3(17) 51 1.1 75 1.6
396 8.3 423 9.1
(22) 578 12.1 626 13.4
(18) 199 4.2 293 6.3
(17) 54 1.1 38 0.8
831 17.4 957 20.5
1 227 25.7 1 380 29.6
4 783 100.0 4 660 100.0
Swatch Group Annual Report 2002 CONSOLIDATED FINANCIAL STATEMENTS
CONSOLIDATED BALANCE SHEET
Liabilities and shareholders’ equity 31.12.2002 31.12.2001
Notes million CHF % million CHF %
Share capital
Capital reservesTreasury shares
Conversion differences
Retained earnings
Shareholders’ equity
Minority interest
Borrowings
Deferred tax liabilities
Retirement benefit obligationsNon-current provisions
Non-current liabilities
Trade and other payables
and accrued expenses
Borrowings
Current provisions
Current liabilities
Total liabilities
Total liabilities and shareholders’ equity

8/2/2019 2002 Annual Report Consolidated En
http://slidepdf.com/reader/full/2002-annual-report-consolidated-en 13/44
(23) 672 709–11 –5
20 21
–115 –102
566 623
(24) –6 –8
–229 –227
18 28
–48 –431
–2 –4
3 3
94 –34
–169 –285
–58 –172 *)
–9 –5
1 –228–54 –13
–107 100
–227 –318
–11
159 20
276 256435 159 276 20
435 276
CONSOLIDATED FINANCIAL STATEMENTS Annual Report 2002 Swatch Group
CONSOLIDATED CASH FLOW STATEMENT
2002 2001
Notes million CHF million CHF
Operating activities
Cash generated from operationsInterest paid
Interest received
Tax paid
Cash flow from operating activities
Investing activities
Acquisition/disposal of consolidated companies (without liquid funds)
Investment in tangible assets
Proceeds from sale of tangible assets
Investment in intangible assetsProceeds from sale of intangible assets
Investment in financial assets
Proceeds from sale of financial assets
Purchase/sale of available-for-sale investments
Cash flow from investing activities
Financing activities
Dividend paid to group shareholders
Dividend paid to minority interests
Purchase/sale of treasury sharesMovement in non-current liabilities
Movement in current liabilities
Cash flow from financing activities
Net impact of foreign exchange rate differences on cash
Increase/decrease in cash and cash equivalents
Movement in cash and cash equivalents
- At beginning of year- At end of year
Cash and cash equivalents at end of year
*) In the form of partial repayment of share capital

8/2/2019 2002 Annual Report Consolidated En
http://slidepdf.com/reader/full/2002-annual-report-consolidated-en 14/44
312 213 –337 21 2 947 3 156
39 39
–3 –3
312 213 –337 21 2 983 3 192
–6 –6
22 22
–3 –3
–51 –51
3 3
–172 –172
504 504
–228 –228
140 213 –565 37 3 436 3 261
140 213 –565 37 3 436 3 261
–65 –65
8 8
–11 –11
–88 –88
–58 –58
494 494
–3 196 –193 0
137 213 –369 –20 3 580 3 541
Swatch Group Annual Report 2002 CONSOLIDATED FINANCIAL STATEMENTS
Share Capital Treasury Conversion Retained Total
capital reserves shares differences earnings shareholders’
(million CHF) equity
Balance at 1.1.2001
– Changes in accounting principles applicable to:
– IAS 39: Financial instruments
– IAS 12: Deferred taxes re IAS 39
Balance at 1.1.2001 restated
– Conversion differences
– Exchange differences related to IAS 21§19 and sundry
– Restatement related to cash-flow hedges– Available-for-sale investments:
Revaluation at fair value
Deferred taxes on available-for-sale investments
– Partial repayment of share capital
– Net income for the year
– Acquisitions/disposals of treasury shares
Balance at 31.12.2001
Balance at 1.1.2002
– Conversion differences
– Exchange differences related to IAS 21§19 and sundry
– Restatement related to cash-flow hedges
– Available-for-sale investments:
Revaluation at fair value
– Paid-out dividends
– Net income for the year
– Capital reduction
Balance at 31.12.2002
CHANGES IN CONSOLIDATED EQUITY

8/2/2019 2002 Annual Report Consolidated En
http://slidepdf.com/reader/full/2002-annual-report-consolidated-en 15/44
CONSOLIDATED FINANCIAL STATEMENTS Annual Report 2002 Swatch Group
ANNEX TO THE CONSOLIDATED FINANCIAL STATEMENTS
General principles and
accounting standards
Consolidated
companies
Consolidation
parameters
PRINCIPLES GOVERNING THE PREPARATION OF THE CONSOLIDATED
FINANCIAL STATEMENTS
The consolidated financial statements of The Swatch Group Ltd, Neuchâtel are prepared in accordance with
International Financial Reporting Standards (IFRS), formerly International Accounting Standards (IAS),published by the International Accounting Standards Board (IASB), and its predecessor, the International
Accounting Standards Committee (IASC).
Unless otherwise indicated in the following principles, the financial statements are prepared on the basis of
historic costs. Fiscal year cutoffs are determined according to the liability method of accounting.
With regard to preparation of the financial statements, management has taken account of the estimates and
assumptions influencing the total assets and liabilities considered, as well as any contingent assets and liabil-
ities shown in the annual year-end financial statements, in the same manner as the income and expenditure
relating to the fiscal year under review. However, actual figures may differ from these estimates.
The annual closing date for the individual financial statements is 31 December. The fiscal year covers the same
period as the calendar year for all consolidated companies.
The consolidated companies are those companies which are controlled directly or indirectly by The Swatch
Group Ltd holding company, which holds more than half of their voting rights or exercises control over their
operations. The subsidiary companies of the Group are consolidated from the date the power of control is
transferred to the Group. Conversely, subsidiary companies are no longer consolidated from the time this
power of control is withdrawn. All the receipts and expenditure corresponding to internal Group transactions,
including gross profit (margins on stocks) not yet realized, as well as the debts and receivables on internal
deliveries have been taken out. Where applicable, the accounting principles of the consolidated companies
were modified so as to ensure their compliance with the principles adopted by the Group.
Newly-acquired companies are consolidated as of the actual date of purchase or taking control, in line with the
purchase method.
The Group includes 129 legal entities among its consolidated subsidiaries – in other words 10 more than at the
end of 2001.
This growth is the result of creating six companies, acquiring one other, integrating four non-consolidated
companies (of which three are minority participations taken into account using the equity method) and
disposing of one legal entity.
The newly-created companies comprise one service unit in Mexico and one distribution unit in Russia, as well
as four retail sales companies established in England, Germany, Italy and the USA.
The acquisitions concern one dial manufacturing company in Switzerland, integrated into the Group’s financial
statements as of 1 January 2002.
The integration of new companies includes two real estate companies, as well as two small manufacturing
companies in which the Group holds a minority share.The legal entity no longer included in the consolidation parameters corresponds to an older company whose
assets had been liquidated during prior fiscal years.
Bearing in mind the existence of a divisional system, making it possible to manage several activities of the
same nature within one and the same legal unit, these 129 companies correspond to 651 reporting units (562
at the end of 2001), which constitute the basis of Group consolidation. The increase in the number of homoge-
neous units is the result of ongoing research into achieving the best transparency of information, so as to refine
the performance of managers overseeing the various different activities.
The full list of consolidated companies is published on pages 144 to 146 of this report.
Ten inactive companies were deliberately not consolidated (excluded from the consolidation parameters),
since they did not generate any turnover and their accumulated equity amounted to less than CHF 1 million.
These companies did not issue any dividend during the fiscal year under review. This exclusion is of no signifi-cant consequence for the annual consolidated Group financial statements.
8/2/2019 2002 Annual Report Consolidated En
http://slidepdf.com/reader/full/2002-annual-report-consolidated-en 16/44
Swatch Group Annual Report 2002 CONSOLIDATED FINANCIAL STATEMENTS
ANNEX TO THE CONSOLIDATED FINANCIAL STATEMENTS
Joint venture
Associated companies
Conversion offoreign currency
Those entities jointly controlled by the Group with an equal holding of 50%, referred to as joint venture compa-
nies, have been included in the accounts according to the proportional integration method. By applying this
method, the Group annual consolidated financial statements include product share and expenditure, assets
and liabilities, and cash flow.
At 31 December 2002, only one company is defined as a joint venture and is consolidated as such. The Group’sshare in the assets, liabilities, expenditure, and revenue of this company is immaterial in terms of consolida-
tion.
Associated companies are considered according to the equity method. This relates to companies in which the
Group holds between 20% and 50% of voting rights or over which it has a significant influence, without actually
controlling their management. The net assets and income of these companies are recorded in the Group finan-
cial statements on the basis of the accounting principles relating to them. The Group share in associate compa-
nies includes the goodwill on acquisition (net of accumulated amortization).
As at 31 December 2002, three entities were considered as associate companies and consolidated as such.
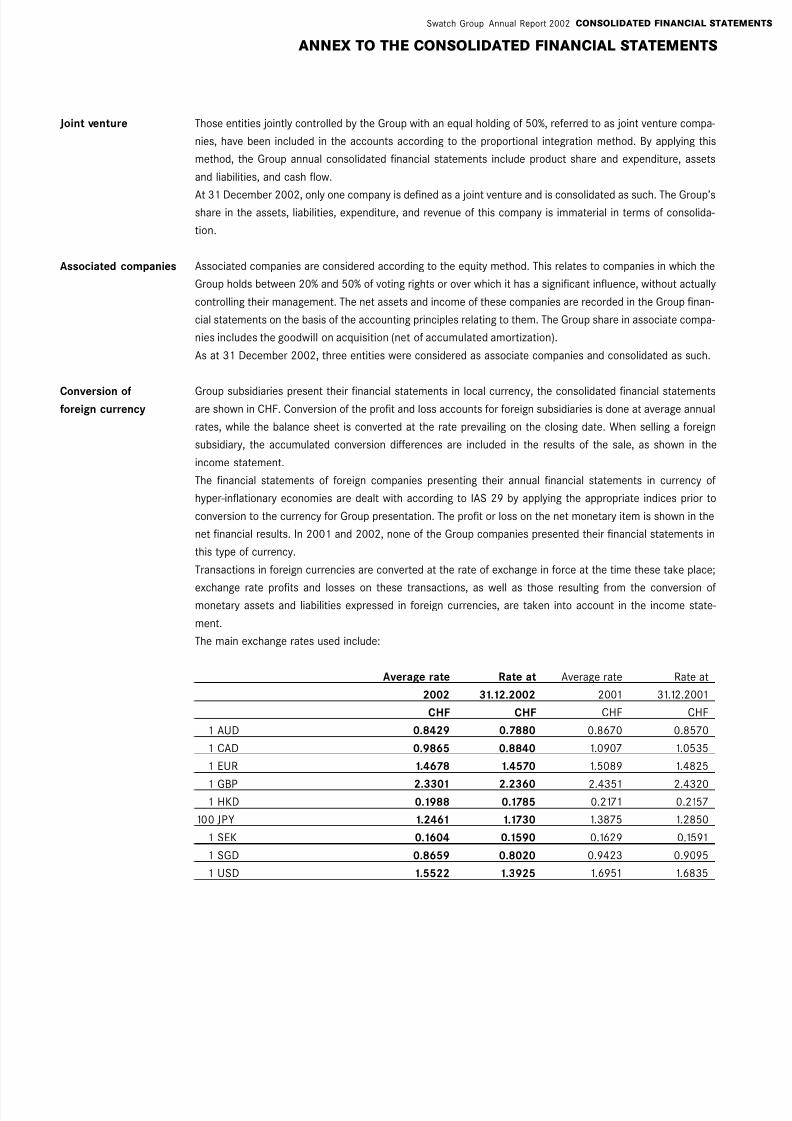
Group subsidiaries present their financial statements in local currency, the consolidated financial statementsare shown in CHF. Conversion of the profit and loss accounts for foreign subsidiaries is done at average annual
rates, while the balance sheet is converted at the rate prevailing on the closing date. When selling a foreign
subsidiary, the accumulated conversion differences are included in the results of the sale, as shown in the
income statement.
The financial statements of foreign companies presenting their annual financial statements in currency of
hyper-inflationary economies are dealt with according to IAS 29 by applying the appropriate indices prior to
conversion to the currency for Group presentation. The profit or loss on the net monetary item is shown in the
net financial results. In 2001 and 2002, none of the Group companies presented their financial statements in
this type of currency.
Transactions in foreign currencies are converted at the rate of exchange in force at the time these take place;
exchange rate profits and losses on these transactions, as well as those resulting from the conversion ofmonetary assets and liabilities expressed in foreign currencies, are taken into account in the income state-
ment.
The main exchange rates used include:
Average rate Rate at Average rate Rate at
2002 31.12.2002 2001 31.12.2001
CHF CHF CHF CHF
1 AUD 0.8429 0.7880 0.8670 0.8570
1 CAD 0.9865 0.8840 1.0907 1.0535
1 EUR 1.4678 1.4570 1.5089 1.4825
1 GBP 2.3301 2.2360 2.4351 2.43201 HKD 0.1988 0.1785 0.2171 0.2157
100 JPY 1.2461 1.1730 1.3875 1.2850
1 SEK 0.1604 0.1590 0.1629 0.1591
1 SGD 0.8659 0.8020 0.9423 0.9095
1 USD 1.5522 1.3925 1.6951 1.6835

8/2/2019 2002 Annual Report Consolidated En
http://slidepdf.com/reader/full/2002-annual-report-consolidated-en 17/44
CONSOLIDATED FINANCIAL STATEMENTS Annual Report 2002 Swatch Group
ANNEX TO THE CONSOLIDATED FINANCIAL STATEMENTS
Management of
financial risks
Financial risks
In view of the Group’s diverse worldwide activities, Group specialists are actively engaged in managing
exchange risks, changes in interest rates as well as marketable securities.
Risk management is concentrated on recognizing and analyzing exchange risks, with the aim of limiting their
effect on Group EBITDA as well as net income. In order to manage risks associated with fluctuations in foreigncurrencies, derivative financial instruments such as forward exchange contracts and hedging options are
negotiated with third parties.
Risk management is ensured by the central treasury of The Swatch Group Ltd – Group Treasury – which acts
in line with the directives issued by the Group’s management organs.
Risks are evaluated jointly with the operating units concerned and the agreed-upon coverage is then imple-
mented, under the supervision of the Finance Committee.
Exchange risks
Group financial statements are published in Swiss francs and consequently are primarily exposed to fluctua-
tions in the rate of the Euro, the US dollar, Japanese yen and other currencies of the Asiatic region. In order to
cover the discounted income in foreign currency, the Group negotiates forward exchange contracts andoptions on foreign currencies. The affiliated companies subscribe to contracts with the Group Treasury, thus
guaranteeing their margins in local currency. Group Treasury is responsible for covering the net positions in
foreign currencies with third-party counterparts. These operations can be qualified as cash-flow hedging.
Risks associated with interest rates
Interest-bearing financial assets are regulated and actively managed. In the current environment, fluctuations
in interest rates have no material influence on the Group’s financial results.
In the two years under review, the Group had no recourse to interest rate swaps recorded under liabilities in
the balance sheet, and no related position is included in the balance sheets of 2001 and 2002.
Credit risksThe Group’s policy on customer credits specifies that a periodic creditworthiness check is required. The risk of
purchasing marketable securities with inadequate solvency is minimized by the fact that only those securities
whose rating satisfies investment directives can be purchased. Management regularly monitors strict compli-
ance with these instructions.
The risk of loss on derivative financial instruments, on monetary investment contracts and on deposits in
current accounts is reduced by the fact that only those financial institutions whose solvency has undergone a
prior check by Group Treasury are used as counterparts. Exposure to these risks is closely monitored by
management and is contained within pre-defined limits.
Because of these strict requirements governing partner solvency, the risks of losses due to the non-execution
of contracts is limited.
Cash-related risks
Close supervision of cash throughout the company, as well as the judicious investment of cash reserves means
that Group Treasury has sufficient funds at all times. In order to cover exceptional requirements, Group
Treasury also has credit limits with financial institutions.
Derivative financial instruments and hedging transactions
Derivatives are valued at actual cost on signing the contract, and according to the nature of the basis trans-
action either as a cash-flow hedge or as a fair-value hedge. During subsequent re-assessments, the change in
value compared with the fair value is, depending on its nature, either recognized in the income statement (fair-
value hedge) or against equity (cash-flow hedge).

8/2/2019 2002 Annual Report Consolidated En
http://slidepdf.com/reader/full/2002-annual-report-consolidated-en 18/44
Swatch Group Annual Report 2002 CONSOLIDATED FINANCIAL STATEMENTS
ANNEX TO THE CONSOLIDATED FINANCIAL STATEMENTS
Comments relating to
income and expenses
Net financial result
Taxes
As soon as the secured base transaction becomes operative and can be considered as effective, the fair values
of both the base transaction and the hedging operation are determined, with the difference between the two
values recognized in the income statement. In the case of cash-flow hedges, the change in value recognized
in equity for the prior period is transferred to the income statement.
Details on hedging operations are explained on pages 142 and 143.
Determination of fair value
The fair values of publicly-traded available-for-sale investments correspond to their closing stock market
values at balance sheet date. Derivatives and forward contracts are valued at their market value at closing
date.
Sales are entered upon delivery of the goods or services to third parties, following deduction of sales taxes and
discounts. Provisions for customer discounts are recognized in the same period as the sales giving rise to
these discounts, and according to the terms of contract. Costs relating to contracts currently in process are
taken into consideration proportionally to work completed.
VALUATION PRINCIPLES AND DEFINITIONS
This position includes the interest expense on funds borrowed outside the Group, as well as interest income
from the investment of funds with third parties. It also includes exchange differences and the result of currency
hedges, as well as interest with respect to external loans and third-party investments in foreign currency.
This position only includes income tax. Other taxes, such as tax on capital and real estate tax, are included in
other operating expenses.
Income tax is recognized in the same period as the income and expenses to which it is related.Deferred taxes are determined according to the variable deferral method for all timing differences between
assets and liabilities for statutory reporting and their values in the financial statements. The main timing differ-
ences result from depreciation on property, machines and installations, re-assessments of some non-current
assets and derivative contracts, value adjustments on current assets, provisions of an equity nature in tax
accounts and carryforward tax losses. In relation to acquisitions, these are linked to the difference between
the fair value of net assets acquired and their tax value.
Deferred tax assets are recognized for all deductible temporary differences to the extent that these could
probably be applied against future taxable profits.
No deferred tax has been calculated on temporary differences resulting from the difference in valuation of
participations in affiliated companies.
Deferred taxes are calculated on the basis of maximum tax rates; in the case that these are not applicable,then on the basis of the tax rates in force or practically in force on the closing date. The tax rates used relate
to the companies or relevant sectors.

8/2/2019 2002 Annual Report Consolidated En
http://slidepdf.com/reader/full/2002-annual-report-consolidated-en 19/44
CONSOLIDATED FINANCIAL STATEMENTS Annual Report 2002 Swatch Group
ANNEX TO THE CONSOLIDATED FINANCIAL STATEMENTS
Intangible assets
Tangible assets
In addition to the items mentioned separately below, this heading also includes:
– License fees granting rights to new advanced technologies. Related lump-sum payments have been
capitalized and amortized over a minimum period of four years.
– Key-money paid for leasing stores in strategic locations. Where these amounts can be recovered on expiry
of the lease, they are not amortized. If, on the other hand, payment is not recoverable, key-money isamortized over a period not exceeding the term of the lease.
No brands or patents have been valued.
Goodwill
Goodwill represents the excess of the price paid for an acquisition compared with the net asset value of the
company at purchase date, retained by the Group. Goodwill is amortized by the straight-line method over a
20-year period.
Research and development costs
Research costs are recognized as ordinary expenses. The costs associated with development projects are
recognized as intangible assets, provided future financial profits are anticipated. Other development costs arerecognized as ordinary expenses. From the time of initial commercial production of the product, capitalized
development costs are subject to straight-line amortization over the period of expected profits. The period of
amortization does not exceed five years.
Software development costs
Generally, software development and maintenance costs are recognized as ordinary expenses. However, costs
directly associated with unique and identifiable software which is controlled by the Group, and whose antici-
pated economic benefit exceeds annual costs, are recognized as intangible assets. Direct costs include
expenses for the internal project development team.
Costs associated with improvement to software or extension of its performance in excess of the original speci-
fications are recognized as an asset and added to the original cost of the software. Costs associated with thedevelopment of software recognized as an asset are amortized by the straight-line method over a period not
exceeding five years.
Property, plant and equipment is valued at purchase price, less straight-line depreciation according to the
useful life of the investment.
Land is recognized on the balance sheet at its acquisition cost.
Capital expenditure has been recognized on the balance sheet at full production cost without profit margin.
Useful life considered in determining straight-line depreciation is defined according to the following categories:
– Furniture, office machinery, tooling, motor vehicles: 5 to 8 years
– IT equipment and software: 3 to 5 years– Measuring instruments, tools installations for machining by non-mechanical processes,
automation elements: 5 to 9 years
– Machines and production equipment for mechanical systems, workshop equipment: 9 to 15 years
– Factory buildings: 30 years
– Administrative buildings: 40 years
– Residential property: 50 years
8/2/2019 2002 Annual Report Consolidated En
http://slidepdf.com/reader/full/2002-annual-report-consolidated-en 20/44
Swatch Group Annual Report 2002 CONSOLIDATED FINANCIAL STATEMENTS
ANNEX TO THE CONSOLIDATED FINANCIAL STATEMENTS
Impairment of assets
Leasing agreements
Inventories
Trade receivables
Financial instruments
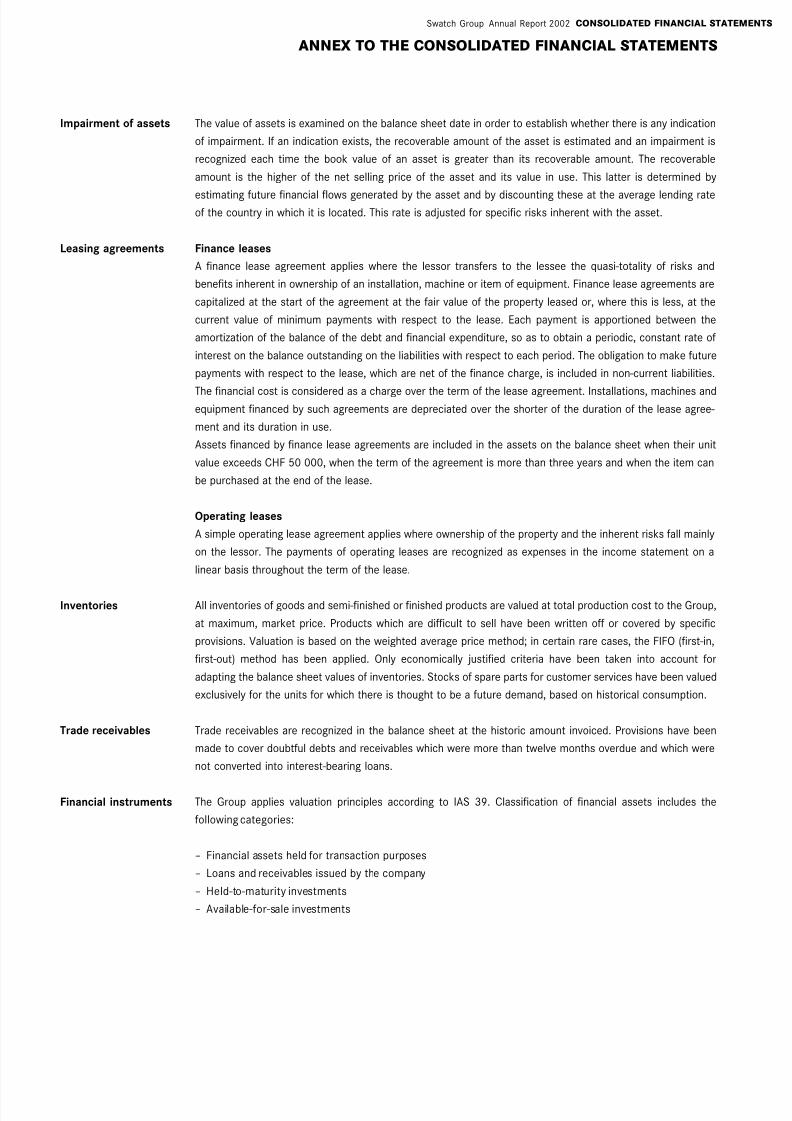
The value of assets is examined on the balance sheet date in order to establish whether there is any indication
of impairment. If an indication exists, the recoverable amount of the asset is estimated and an impairment is
recognized each time the book value of an asset is greater than its recoverable amount. The recoverable
amount is the higher of the net selling price of the asset and its value in use. This latter is determined by
estimating future financial flows generated by the asset and by discounting these at the average lending rateof the country in which it is located. This rate is adjusted for specific risks inherent with the asset.
Finance leases
A finance lease agreement applies where the lessor transfers to the lessee the quasi-totality of risks and
benefits inherent in ownership of an installation, machine or item of equipment. Finance lease agreements are
capitalized at the start of the agreement at the fair value of the property leased or, where this is less, at the
current value of minimum payments with respect to the lease. Each payment is apportioned between the
amortization of the balance of the debt and financial expenditure, so as to obtain a periodic, constant rate of
interest on the balance outstanding on the liabilities with respect to each period. The obligation to make future
payments with respect to the lease, which are net of the finance charge, is included in non-current liabilities.
The financial cost is considered as a charge over the term of the lease agreement. Installations, machines andequipment financed by such agreements are depreciated over the shorter of the duration of the lease agree-
ment and its duration in use.
Assets financed by finance lease agreements are included in the assets on the balance sheet when their unit
value exceeds CHF 50 000, when the term of the agreement is more than three years and when the item can
be purchased at the end of the lease.
Operating leases
A simple operating lease agreement applies where ownership of the property and the inherent risks fall mainly
on the lessor. The payments of operating leases are recognized as expenses in the income statement on a
linear basis throughout the term of the lease.
All inventories of goods and semi-finished or finished products are valued at total production cost to the Group,
at maximum, market price. Products which are difficult to sell have been written off or covered by specific
provisions. Valuation is based on the weighted average price method; in certain rare cases, the FIFO (first-in,
first-out) method has been applied. Only economically justified criteria have been taken into account for
adapting the balance sheet values of inventories. Stocks of spare parts for customer services have been valued
exclusively for the units for which there is thought to be a future demand, based on historical consumption.
Trade receivables are recognized in the balance sheet at the historic amount invoiced. Provisions have been
made to cover doubtful debts and receivables which were more than twelve months overdue and which were
not converted into interest-bearing loans.
The Group applies valuation principles according to IAS 39. Classification of financial assets includes the
following categories:
– Financial assets held for transaction purposes
– Loans and receivables issued by the company
– Held-to-maturity investments
– Available-for-sale investments

8/2/2019 2002 Annual Report Consolidated En
http://slidepdf.com/reader/full/2002-annual-report-consolidated-en 21/44
CONSOLIDATED FINANCIAL STATEMENTS Annual Report 2002 Swatch Group
ANNEX TO THE CONSOLIDATED FINANCIAL STATEMENTS
In view of the policy of long-term investment adopted by Management, current Group investments are
assigned to the category of available-for-sale investments.
The allocation of financial investments to the various categories takes place at the time of investment and
undergoes a regular review based on set targets.
Purchase and sale of investments is based on the settlement date principle. At the time of purchase, purchasecosts are included in the price.
Available-for-sale investments are valued at their fair value. Unrealized gains and losses in relation to the fair
value are recognized directly in equity at the time of sale or reduction in the value of the instrument (impair-
ment), and transferred to the income statement of the financial year (i.e. recycled). The Group consistently
applies this principle of recognition to the various categories as a whole.
Investment and valuation policies
In its regulations governing investments, General Management has established criteria for assessing the recov-
erability of financial investments.
The Group’s long-term investment policy, combined with its solid balance sheet reserves in terms of equity and
liquid assets, enables the Group to withstand prolonged fluctuations in capital markets without requiring thatassets be liquidated. A valuation adjustment is made at the closing dates of 30.06. and 31.12. each time objec-
tive and substantial evidence might indicate that an impairment is permanent. These regulations are applied
retroactively as of 1 January 2001, the date on which IAS 39 regulations governing financial instruments came
into force.
Assessment criteria for impairment
The assesment of the permanency of an impairment is based both on «hard» factors (changes in fair value) as
well as on «soft» factors (qualitative assessment criteria). Accordingly, an evaluation of recoverability follows
this sequence of criteria:
Hard factors (changes in fair value):To be included in the control list for impairment, financial investments under evaluation must present a perma-
nent minimum decrease in value of 50% between their purchase price and their fair value based on a period of
24 months, starting 1 January 2001 at the earliest. Investments which meet this criteria are subjected to the
following procedure:
– if the investment’s quoted price is consistently lower than the value limit for the entire 24-month observation
period, the position must be subjected to an impairment test, which must also take the «soft» factors into
consideration;
– if the investment’s quoted price exceeds the value limit during the observation period, the investment is
withdrawn from the control list for impairment.
However, an impairment test, including «soft» factors, is systematically carried out on all financial investments
whose fair value is 90% or more below their purchase price on balance sheet date, irrespective of their term.The basis for an impairment has been established when evaluation of the financial investment concerned,
including «soft» factors, does not present sufficient positive potential for development.
The following events require a valuation adjustment:
financial investments protected under Chapter 11, or involved in similar bankruptcy or legal protection proce-
dures, must be subjected to a valuation adjustment as soon as the facts pertaining to these investments are
proven.
8/2/2019 2002 Annual Report Consolidated En
http://slidepdf.com/reader/full/2002-annual-report-consolidated-en 22/44
Swatch Group Annual Report 2002 CONSOLIDATED FINANCIAL STATEMENTS
ANNEX TO THE CONSOLIDATED FINANCIAL STATEMENTS
Cash and cash
equivalents
Provisions
Employee benefit
obligations
Cash and cash equivalents are recognized in the balance sheet at their nominal value. In the cash flow state-
ment, cash and cash equivalents include petty cash, credit notes and short-term bank overdrafts. Bank loans
are included in the balance sheet under current and non-current borrowings.
Provisions are created according to homogeneous criteria, which are financially justified and are the same asthose applied during the prior financial year. Provisions for warranty and goodwill were calculated to cover the
equivalent of two years, in accordance with the European directive which came into force on 1 January 2002.
Post-employment benefits
Post-employment benefits with respect to the Group mainly relate to pensions and retirement benefits.
Pensions and retirement benefits
Group employees receive retirement benefits provided by either defined contribution or defined benefit plans.
Pension plans are either financed, in which case their assets are managed separately and independently of
those of the Group, or not financed, in which case these obligations are shown as a debt in the balance sheet.
In all major instances, the obligation relating to defined benefit plans is determined on an annual basis byindependent actuaries and based on the projected credit unit method. The actuarial hypotheses used in deter-
mining the benefits vary according to the economic conditions prevailing in the country in which the benefit
plans are located.
Group pension plans in Switzerland are defined under pension fund regulations as defined contribution plans.
This means that employer contributions are determined in advance and that companies are neither obliged by
way of statute nor by legal constraints to make extra contributions in the event that the pension fund no longer
possesses the necessary funding. These plans are independent.
In spite of this, calculations made with the projected credit unit method have also been made for Swiss pension
plans. The resulting figures are integrated into the information presented in the notes.
Actuarial differences are essentially due to modifications made to hypotheses and to the difference between
results anticipated on the basis of actuarial hypotheses and the actual results of the defined benefit plans.Differences exceeding 10% of the higher of the discounted value of the obligation or the fair value of assets at
the outset of the year under review are recognized in the income statement. Allocation in the income state-
ment is based on the average remaining working life of the personnel in the plan concerned.
Actuarial costs for plans considered as defined benefit plans and recognized in the income statement include
the current service costs, financial costs, the expected return on plan assets, past service costs and, if appli-
cable, actuarial differences.
The long-term assets of defined benefit plans are assessed at their fair value. For such plans, an asset deficit
or surplus, compared with the discounted fair value of the obligation, is recognized as a liability or asset in the
balance sheet by taking cumulated actuarial differences, as well as past service costs not yet recognized in the
income statement into consideration. However, an asset surplus is only considered to the extent that it may
provide future financial benefits which will actually be available to the Group.Contributions to defined benefit plans are recognized in the income statement in the year to which they refer.

8/2/2019 2002 Annual Report Consolidated En
http://slidepdf.com/reader/full/2002-annual-report-consolidated-en 23/44
CONSOLIDATED FINANCIAL STATEMENTS Annual Report 2002 Swatch Group
ANNEX TO THE CONSOLIDATED FINANCIAL STATEMENTS
1. Segment information
and Gross sales
NOTES
The Group manages its activities at world level according to four separate operational segments:
– Watches – marketing finished watches
– Horological production – production of watches and movements for watches or analog systems (steppingmotors)
– Electronic systems – design, production and marketing of electronic components
– General services – service and financial companies, research and development activities, real estate
companies
Gross sales are attributable to sales to third party clients while sales to other operational segments are shown
separately. Segment-based assets essentially comprise buildings and land, machines and installations, intan-
gible assets, inventories of goods, loans to third parties and cash. They do not include consolidated holdings.
Segment-based liabilities include operating commitments.
In accordance with the presentation standard applicable to the horological sector, geographical segmentation
is indicated by continent. With respect to turnover and unit sales, allocation is made according to invoice desti-nation. Total third party assets are allocated in relation to their location.

8/2/2019 2002 Annual Report Consolidated En
http://slidepdf.com/reader/full/2002-annual-report-consolidated-en 24/44
2 980 741 323 19 4 063667 53 14 –734 0
2 980 1 408 376 33 –734 4 063
558 209 94 –19 842
18.7 14.8 25.0 20.7
66.3 24.8 11.2 –2.3 100.0
515 83 59 –25 632
17.3 5.9 15.7 15.6
81.5 13.1 9.3 –3.9 100.0
–22
610–110
500
–6
494
3 034 767 374 7 4 182
625 48 7 –680 0
3 034 1 392 422 14 –680 4 182
565 187 109 –16 845
18.6 13.4 25.8 20.2
66.9 22.1 12.9 –1.9 100.0
523 65 78 –22 644
17.2 4.7 18.5 15.4
81.2 10.1 12.1 –3.4 100.0
–20
624
–114
510
–6
504
Swatch Group Annual Report 2002 CONSOLIDATED FINANCIAL STATEMENTS
2002 Watches Horological Electronic General Consolidation Total
(million CHF) production systems services adjustment
– Third– Group
Gross sales
Operating result before depreciation
and amortization (EBITDA)
– In % of sales
– In % of total
Operating result (EBIT)
– In % of sales
– In % of total
Net financial result
Result before taxesTaxes
Group results before
minority interest
Minority interest
Net income
2001 Watches Horological Electronic General Consolidation Total
(million CHF) production systems services adjustment
– Third
– Group
Gross salesOperating result before depreciation
and amortization (EBITDA)
– In % of sales
– In % of total
Operating result (EBIT)
– In % of sales
– In % of total
Net financial result
Result before taxes
Taxes
Group results beforeminority interest
Minority interest
Net income
ANNEX TO THE CONSOLIDATED FINANCIAL STATEMENTS
Income statement
Primary segment information (activity sector)

8/2/2019 2002 Annual Report Consolidated En
http://slidepdf.com/reader/full/2002-annual-report-consolidated-en 25/44
2 354 1 382 307 736 4 779
3 1 42 354 1 385 307 737 4 783
686 299 42 200 1 227
0
686 299 42 200 1 227
1 668 1 086 265 537 3 556
72 153 15 4 244
25 121 31 6 183
18 5 1 24
1 2 3
2 218 1 335 366 737 4 656
1 3 4
2 219 1 338 366 737 4 660
696 291 67 326 1 380
0
696 291 67 326 1 3801 523 1 047 299 411 3 280
61 130 47 7 245
31 114 30 3 178
11 4 1 2 18
4 1 5
CONSOLIDATED FINANCIAL STATEMENTS Annual Report 2002 Swatch Group
2002 Watches Horological Electronic General Total
(million CHF) production systems services
Balance Sheet
– Segment assets
– Equity in associated companiesTotal assets
– Segment liabilities
– Liabilities not affected
Total liabilities
Net assets
Other information
Capital expenditure
Depreciation on tangible assets
Amortization on intangible assets
Valuation differences
2001 Watches Horological Electronic General Total
(million CHF) production systems services
Balance sheet
– Segment assets
– Equity in associated companies
Total assets
– Segment liabilities
– Liabilities not affected
Total liabilitiesNet assets
Other information
Capital expenditure
Depreciation on tangible assets
Amortization on intangible assets
Valuation differences
Balance Sheet
and other information
ANNEX TO THE CONSOLIDATED FINANCIAL STATEMENTS
8/2/2019 2002 Annual Report Consolidated En
http://slidepdf.com/reader/full/2002-annual-report-consolidated-en 26/44
100% 100%
600
500
400
300
200
100
0
–100
600
500
400
300
200
100
0
–100
100% 100%
Swatch Group Annual Report 2002 CONSOLIDATED FINANCIAL STATEMENTS
2002 2001
2002 2001
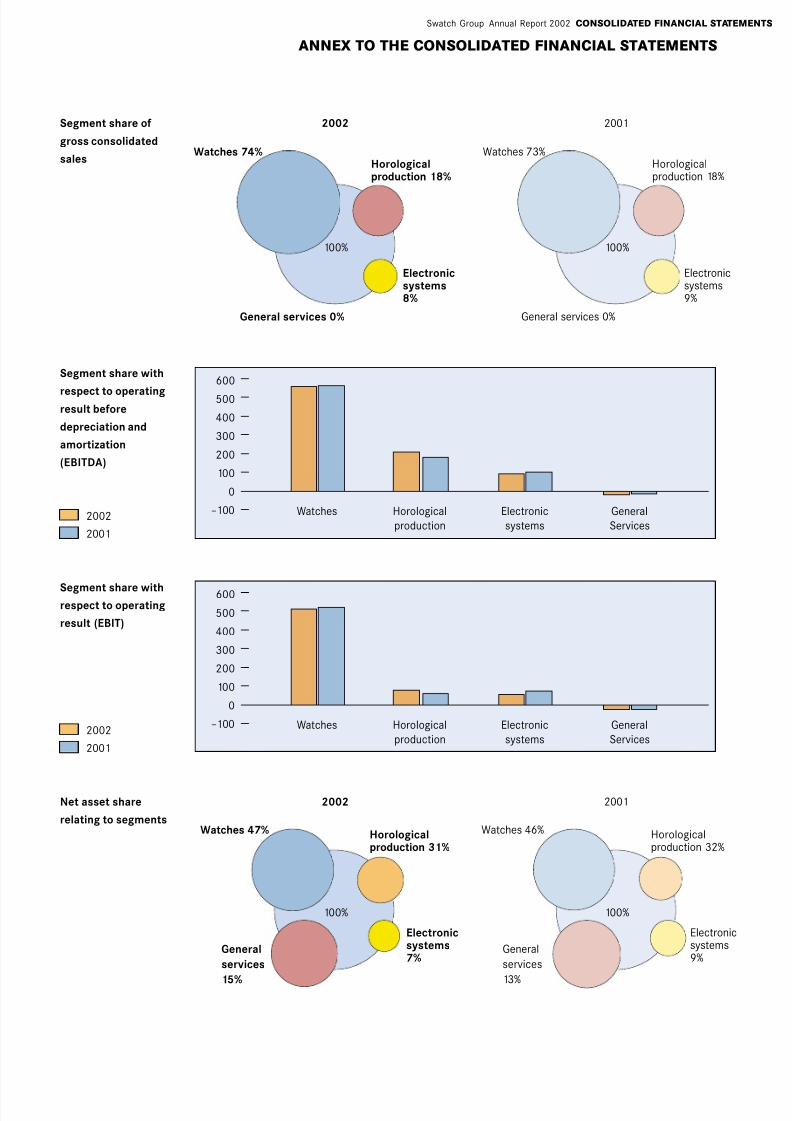
Segment share of
gross consolidated
sales
Segment share with
respect to operatingresult before
depreciation and
amortization
(EBITDA)
2002
2001
2002
2001
Net asset share
relating to segments
Segment share withrespect to operating
result (EBIT)
Electronicsystems7%
Electronicsystems8%
Horologicalproduction 18%
General services 0%
Watches 74%
Electronicsystems9%
Horologicalproduction 18%
General services 0%
Watches 73%
Watches Horological Electronic General
production systems Services
Watches Horological Electronic General
production systems Services
Horologicalproduction 31%
General
services
15%
Watches 47%
Electronicsystems9%
Horologicalproduction 32%
General
services
13%
Watches 46%
ANNEX TO THE CONSOLIDATED FINANCIAL STATEMENTS
8/2/2019 2002 Annual Report Consolidated En
http://slidepdf.com/reader/full/2002-annual-report-consolidated-en 27/44
100%
100% 100%
100% 100%
100%
2002 2001
2002 2001
2002 2001
CONSOLIDATED FINANCIAL STATEMENTS Annual Report 2002 Swatch Group
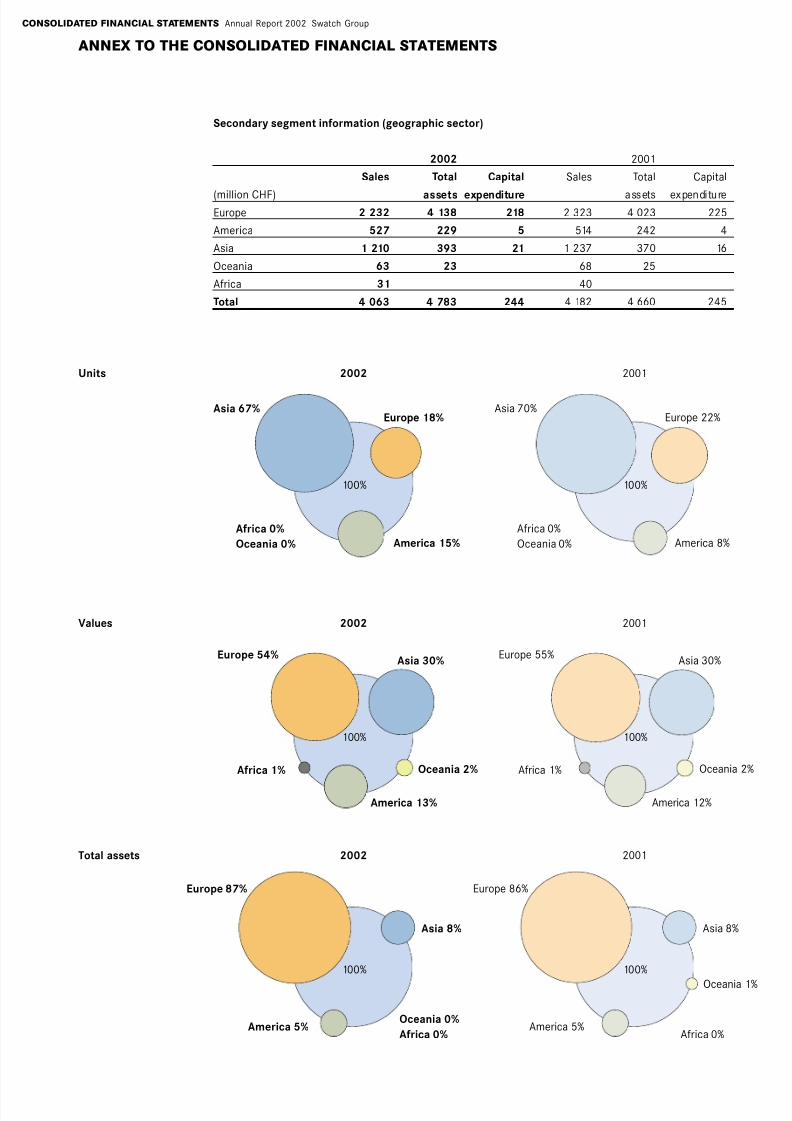
Values
America 13%
Asia 30%
Oceania 2%
Europe 54%
Africa 1%
Units
America 15%
Asia 67%
Africa 0%
Oceania 0%
Europe 18%
America 8%
Asia 70%
Africa 0%
Oceania 0%
Europe 22%
Total assets
America 5%
Asia 8%
Europe 87%
America 5%
Asia 8%
Oceania 1%
Europe 86%
Oceania 0%
Africa 0% Africa 0%
America 12%
Asia 30%
Oceania 2%
Europe 55%
Africa 1%
Secondary segment information (geographic sector)
2002 2001
Sales Total Capital Sales Total Capital
(million CHF) assets expenditure assets expenditureEurope 2 232 4 138 218 2 323 4 023 225
America 527 229 5 514 242 4
Asia 1 210 393 21 1 237 370 16
Oceania 63 23 68 25
Africa 31 40
Total 4 063 4 783 244 4 182 4 660 245
ANNEX TO THE CONSOLIDATED FINANCIAL STATEMENTS
8/2/2019 2002 Annual Report Consolidated En
http://slidepdf.com/reader/full/2002-annual-report-consolidated-en 28/44
100% 100%
2002 2001
Swatch Group Annual Report 2002 CONSOLIDATED FINANCIAL STATEMENTS
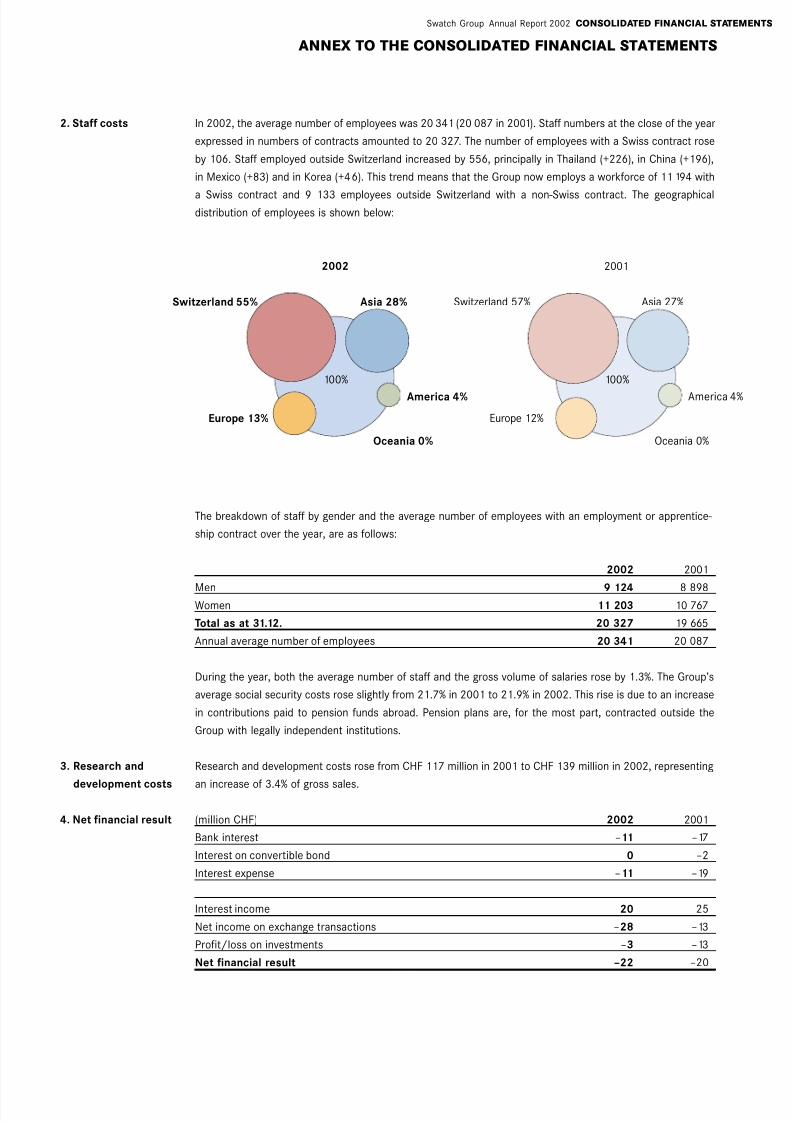
America 4%
Asia 28%
Oceania 0%
Europe 13%
America 4%
Asia 27%
Oceania 0%
Europe 12%
Switzerland 57%
In 2002, the average number of employees was 20 341 (20 087 in 2001). Staff numbers at the close of the year
expressed in numbers of contracts amounted to 20 327. The number of employees with a Swiss contract rose
by 106. Staff employed outside Switzerland increased by 556, principally in Thailand (+226), in China (+196),
in Mexico (+83) and in Korea (+46). This trend means that the Group now employs a workforce of 11 194 with
a Swiss contract and 9 133 employees outside Switzerland with a non-Swiss contract. The geographicaldistribution of employees is shown below:
2. Staff costs
3. Research and
development costs
4. Net financial result
The breakdown of staff by gender and the average number of employees with an employment or apprentice-
ship contract over the year, are as follows:
2002 2001
Men 9 124 8 898Women 11 203 10 767
Total as at 31.12. 20 327 19 665
Annual average number of employees 20 341 20 087
During the year, both the average number of staff and the gross volume of salaries rose by 1.3%. The Group’s
average social security costs rose slightly from 21.7% in 2001 to 21.9% in 2002. This rise is due to an increase
in contributions paid to pension funds abroad. Pension plans are, for the most part, contracted outside the
Group with legally independent institutions.
Research and development costs rose from CHF 117 million in 2001 to CHF 139 million in 2002, representing
an increase of 3.4% of gross sales.
(million CHF) 2002 2001
Bank interest –11 –17
Interest on convertible bond 0 –2
Interest expense –11 –19
Interest income 20 25
Net income on exchange transactions –28 –13
Profit/loss on investments –3 –13
Net financial result –22 –20
Switzerland 55%
ANNEX TO THE CONSOLIDATED FINANCIAL STATEMENTS
8/2/2019 2002 Annual Report Consolidated En
http://slidepdf.com/reader/full/2002-annual-report-consolidated-en 29/44
CONSOLIDATED FINANCIAL STATEMENTS Annual Report 2002 Swatch Group
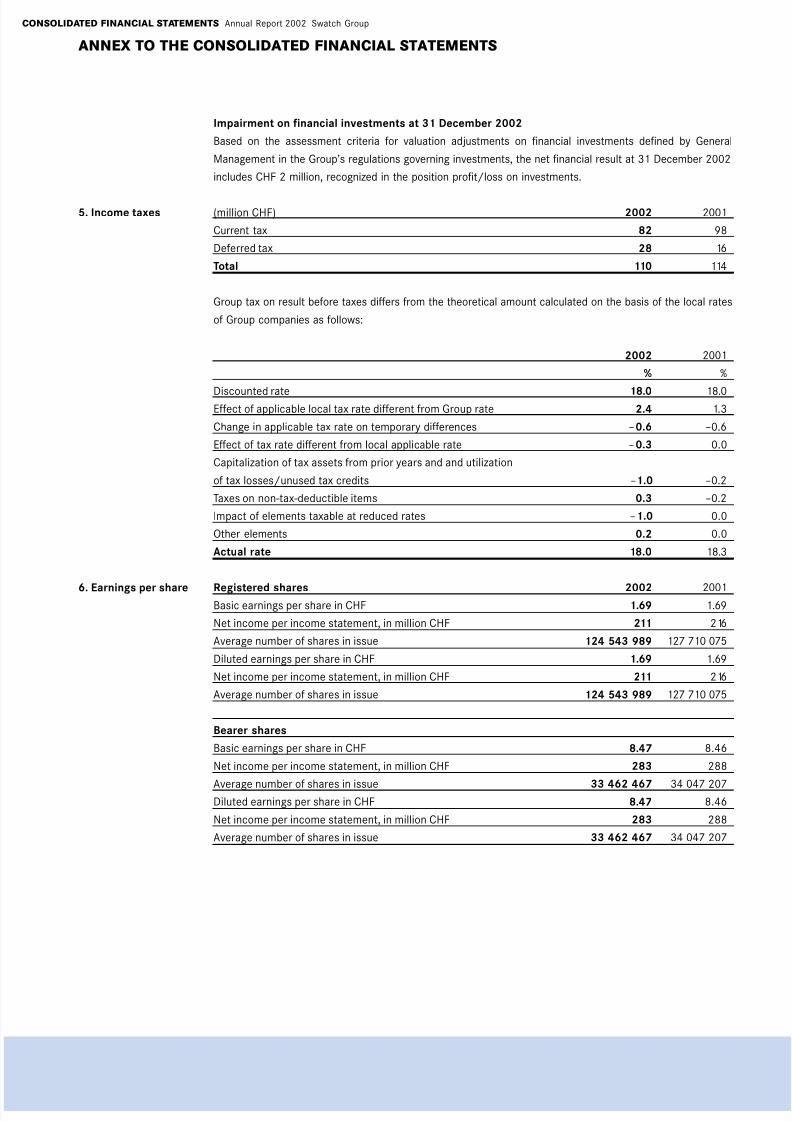
5. Income taxes
6. Earnings per share
Impairment on financial investments at 31 December 2002
Based on the assessment criteria for valuation adjustments on financial investments defined by General
Management in the Group’s regulations governing investments, the net financial result at 31 December 2002
includes CHF 2 million, recognized in the position profit/loss on investments.
(million CHF) 2002 2001
Current tax 82 98
Deferred tax 28 16
Total 110 114
Group tax on result before taxes differs from the theoretical amount calculated on the basis of the local rates
of Group companies as follows:
2002 2001
% %
Discounted rate 18.0 18.0Effect of applicable local tax rate different from Group rate 2.4 1.3
Change in applicable tax rate on temporary differences –0.6 –0.6
Effect of tax rate different from local applicable rate –0.3 0.0
Capitalization of tax assets from prior years and and utilization
of tax losses/unused tax credits –1.0 –0.2
Taxes on non-tax-deductible items 0.3 –0.2
Impact of elements taxable at reduced rates –1.0 0.0
Other elements 0.2 0.0
Actual rate 18.0 18.3
Registered shares 2002 2001Basic earnings per share in CHF 1.69 1.69
Net income per income statement, in million CHF 211 216
Average number of shares in issue 124 543 989 127 710 075
Diluted earnings per share in CHF 1.69 1.69
Net income per income statement, in million CHF 211 216
Average number of shares in issue 124 543 989 127 710 075
Bearer shares
Basic earnings per share in CHF 8.47 8.46
Net income per income statement, in million CHF 283 288
Average number of shares in issue 33 462 467 34 047 207Diluted earnings per share in CHF 8.47 8.46
Net income per income statement, in million CHF 283 288
Average number of shares in issue 33 462 467 34 047 207
ANNEX TO THE CONSOLIDATED FINANCIAL STATEMENTS

8/2/2019 2002 Annual Report Consolidated En
http://slidepdf.com/reader/full/2002-annual-report-consolidated-en 30/44
Swatch Group Annual Report 2002 CONSOLIDATED FINANCIAL STATEMENTS
7. Intangible assets
8. Tangible assets
Changes in intangible assets and the reference to acquisition values are summarized in the table on the next
page.
The table showing changes in goodwill is set out below:
(million CHF) 2002 2001Gross value
At 1 January 232 224
Goodwill from acquisitions and rounding differences 5 8
At 31 December 237 232
Accumulated amortization
At 1 January –26 –14
Annual amortization –12 –12
At 31 December –38 –26
Net at 31 December 199 206
Changes in tangible assets and the reference to acquisition values are given in the summary table on the nextpage.
At 31 December 2002, total non-current assets pledged to cover Group companies’ commitments amounted
to CHF 4 million. The comparable amount in 2001 was less than CHF 1 million.
At the end of 2002, tangible assets financed by capital lease contracts and recognized as assets in the balance
sheet represented less than CHF 2 million.
Fire insurance values
Property, plant and equipment was insured for the following amounts:
(million CHF) 2002 2001
Buildings 1 358 1 350Equipment 2 734 2 718
Total amount insured 4 092 4 068
The net value of tangible assets (including land) in the balance sheet at 31 December 2002 represented only
26.6% of the value insured.
ANNEX TO THE CONSOLIDATED FINANCIAL STATEMENTS

8/2/2019 2002 Annual Report Consolidated En
http://slidepdf.com/reader/full/2002-annual-report-consolidated-en 31/44
26 26 1 2 –1 28
93 –3 90 38 2 –1 –1 128
232 232 5 237
351 –3 348 0 44 4 –1 –2 393
699 –3 696 2 26 –7 9 726
2 064 –24 2 040 2 127 32 –64 –13 2 124
245 –6 239 25 –15 4 25327 27 19 –16 30
20 20 5 25
3 055 –33 3 022 4 197 32 –86 –11 3 158
7 –1 6 2 –2 6
4 4 1 –1 4
11 –1 10 0 3 0 –3 0 10
3 417 –37 3 380 4 244 36 –90 –13 3 561
28 –17 –3 –20 9 8
128 –39 2 –2 –12 –51 54 77
237 –26 –12 –38 206 199
393 –82 2 0 –2 –27 –109 269 284
726 –398 1 6 –2 –16 –409 301 317
2 124 –1 394 15 52 12 –145 –1 460 670 664
253 –168 4 14 2 –22 –170 77 83
30 –22 –22 5 8
25 –9 –9 11 16
3 158 –1 991 20 72 12 –183 –2 070 1 064 1 088
6 0 0 7 6
4 0 0 4 4
10 0 0 0 0 0 0 11 10
3 561 –2 073 22 72 10 –210 –2 179 1 344 1 382
CONSOLIDATED FINANCIAL STATEMENTS Annual Report 2002 Swatch Group
Movements in Fixed Assets 2002
a) Acquisition values Historical Currency Acquis.val. Acqui- Invest- Capita- Dis- *) Trans- Historical
acquisition diff. 31.12.2001 sitions ments lized posals fers acquisition
value adjust. as of (net value) expendi- (sales) valuetures
(million CHF) 31.12.01 Bil 02/01 31.12.02 2002 2002 2002 2002 2002 31.12.02
Capitalized development expenses
Other intangible assets
Goodwill
Total intangible assets
Land and buildings
Plant and machinery
Other fixtures and fittingsAdvances and construction in progress
Investment property
Total tangible assets
Other financial assets
Investment in associated companies
Total financial assets
Total non-current assets
(without deferred taxes)
b) Net balance sheet values Historical Deprec. Currency Deprec. Deprec. Depre- Deprec. Net Net
acquisition year to diff. on dis- on ciation year to balance balance
value date posals transfers date sheet value sheet value
(million CHF) 31.12.02 31.12.01 Bil 02/01 2002 2002 2002 31.12.02 31.12.01 31.12.02
Capitalized development expenses
Other intangible assets
Goodwill
Total intangible assets
Land and buildings
Plant and machinery
Other fixtures and fittings
Advances and construction in progress
Investment property
Total tangible assets
Other financial assets
Investment in associated companies
Total financial assets
Total non-current assets
(without deferred taxes)
*) The heading "Transfers" includes transfers between different categories of balance sheet positions.
ANNEX TO THE CONSOLIDATED FINANCIAL STATEMENTS
8/2/2019 2002 Annual Report Consolidated En
http://slidepdf.com/reader/full/2002-annual-report-consolidated-en 32/44
Swatch Group Annual Report 2002 CONSOLIDATED FINANCIAL STATEMENTS
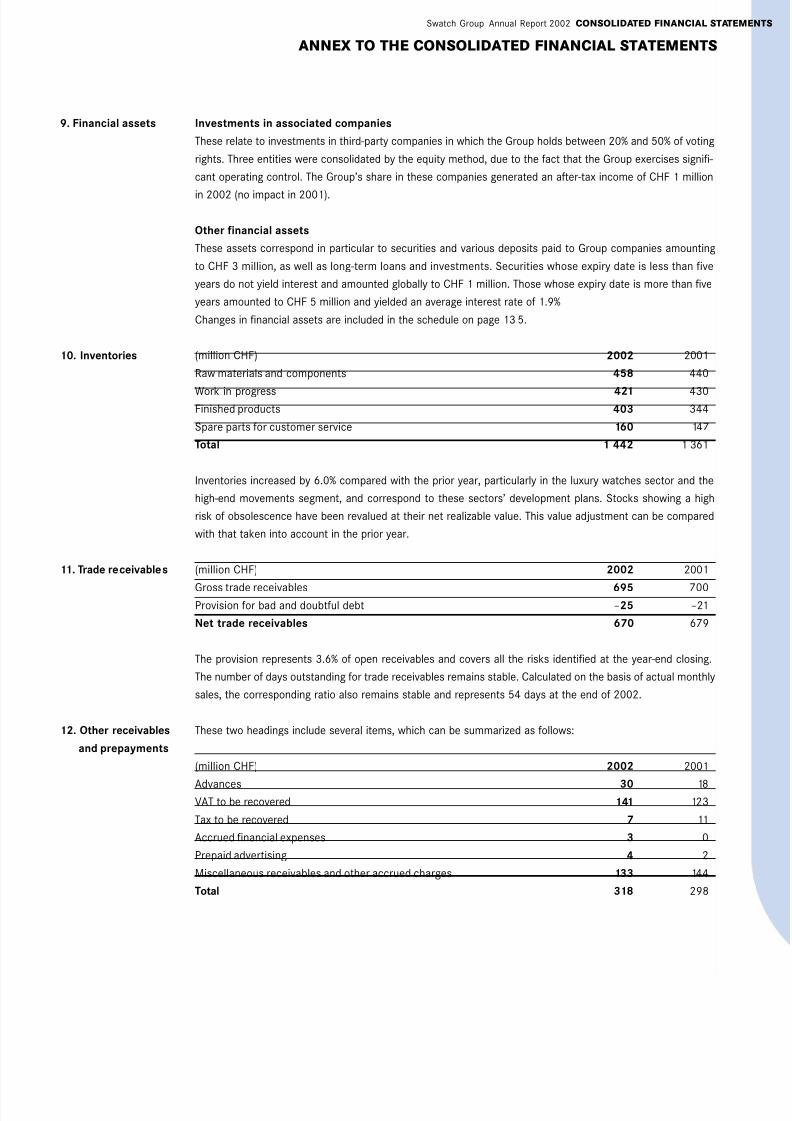
9. Financial assets
10. Inventories
11. Trade receivables
12. Other receivables
and prepayments
Investments in associated companies
These relate to investments in third-party companies in which the Group holds between 20% and 50% of voting
rights. Three entities were consolidated by the equity method, due to the fact that the Group exercises signifi-
cant operating control. The Group’s share in these companies generated an after-tax income of CHF 1 million
in 2002 (no impact in 2001).
Other financial assets
These assets correspond in particular to securities and various deposits paid to Group companies amounting
to CHF 3 million, as well as long-term loans and investments. Securities whose expiry date is less than five
years do not yield interest and amounted globally to CHF 1 million. Those whose expiry date is more than five
years amounted to CHF 5 million and yielded an average interest rate of 1.9%
Changes in financial assets are included in the schedule on page 135.
(million CHF) 2002 2001
Raw materials and components 458 440
Work in progress 421 430Finished products 403 344
Spare parts for customer service 160 147
Total 1 442 1 361
Inventories increased by 6.0% compared with the prior year, particularly in the luxury watches sector and the
high-end movements segment, and correspond to these sectors’ development plans. Stocks showing a high
risk of obsolescence have been revalued at their net realizable value. This value adjustment can be compared
with that taken into account in the prior year.
(million CHF) 2002 2001
Gross trade receivables 695 700Provision for bad and doubtful debt –25 –21
Net trade receivables 670 679
The provision represents 3.6% of open receivables and covers all the risks identified at the year-end closing.
The number of days outstanding for trade receivables remains stable. Calculated on the basis of actual monthly
sales, the corresponding ratio also remains stable and represents 54 days at the end of 2002.
These two headings include several items, which can be summarized as follows:
(million CHF) 2002 2001
Advances 30 18VAT to be recovered 141 123
Tax to be recovered 7 11
Accrued financial expenses 3 0
Prepaid advertising 4 2
Miscellaneous receivables and other accrued charges 133 144
Total 318 298
ANNEX TO THE CONSOLIDATED FINANCIAL STATEMENTS

8/2/2019 2002 Annual Report Consolidated En
http://slidepdf.com/reader/full/2002-annual-report-consolidated-en 33/44
CONSOLIDATED FINANCIAL STATEMENTS Annual Report 2002 Swatch Group
13. Available-for-sale
investments
14. Cash and cashequivalents
15. Share capital
16. Treasury shares
17. Provisions
Available-for-sale investments amount to CHF 396 million (prior year, CHF 584 million), and are valued at their
fair value on the balance sheet date.
The Swatch Group holds only current investments, which can be sold within 12 months.
(million CHF) 2002 2001Cash 1 1
Short-term bank deposits 462 285
Total 463 286
The average yield on short-term bank deposits corresponds to the average interest rates prevailing in the cap-
ital markets and for different currencies for deposits with an average maturity of 1 to 2 months.
In the consolidated cash flow statement, cash and cash equivalents comprise the following headings:
(million CHF) 2002 2001
Cash and cash equivalents 463 286
Bank overdrafts –28 –10Total 435 276
Share capital has been treated in the chapter on corporate governance, paragraphs 2.1 – 2.3, page 9 8. These
paragraphs have been audited.
The Swatch Group Ltd shares held by the Group are valuated in the consolidated financial statements at aver-
age purchase price. They are recognized as a deduction from equity. Details on changes in the number of
shares are presented in the Annex to the financial statements of the Holding, note 17.
With the exception of movements relating to the special management stock option plan and the convertible
loan issued by The Swatch Group Finance (Luxembourg) SA, which expired on 23 October 2002, all transac-
tions involving treasury shares were recorded at market value.
(million CHF) Warranty Litigation Other Total
At 31 December 2001 55 10 48 113
Conversion differences –2 –2 –4
Additional provisions 52 5 2 59
Amounts not used –8 –1 –2 –11
Used during the year –42 –4 –6 –52
At 31 December 2002 55 10 40 105
Analysis of total provisions (million CHF) 2002 2001
Non-current provisions 51 75Current provisions 54 38
Total 105 113
Warranty and goodwill
The Group offers a two-year warranty and either repairs or replaces those products which do not work to sat-
isfaction. The provision set up at the end of the year to cover future warranty costs is based on historic expe-
rience with respect to the volume of repairs and returns.
ANNEX TO THE CONSOLIDATED FINANCIAL STATEMENTS
8/2/2019 2002 Annual Report Consolidated En
http://slidepdf.com/reader/full/2002-annual-report-consolidated-en 34/44
Swatch Group Annual Report 2002 CONSOLIDATED FINANCIAL STATEMENTS
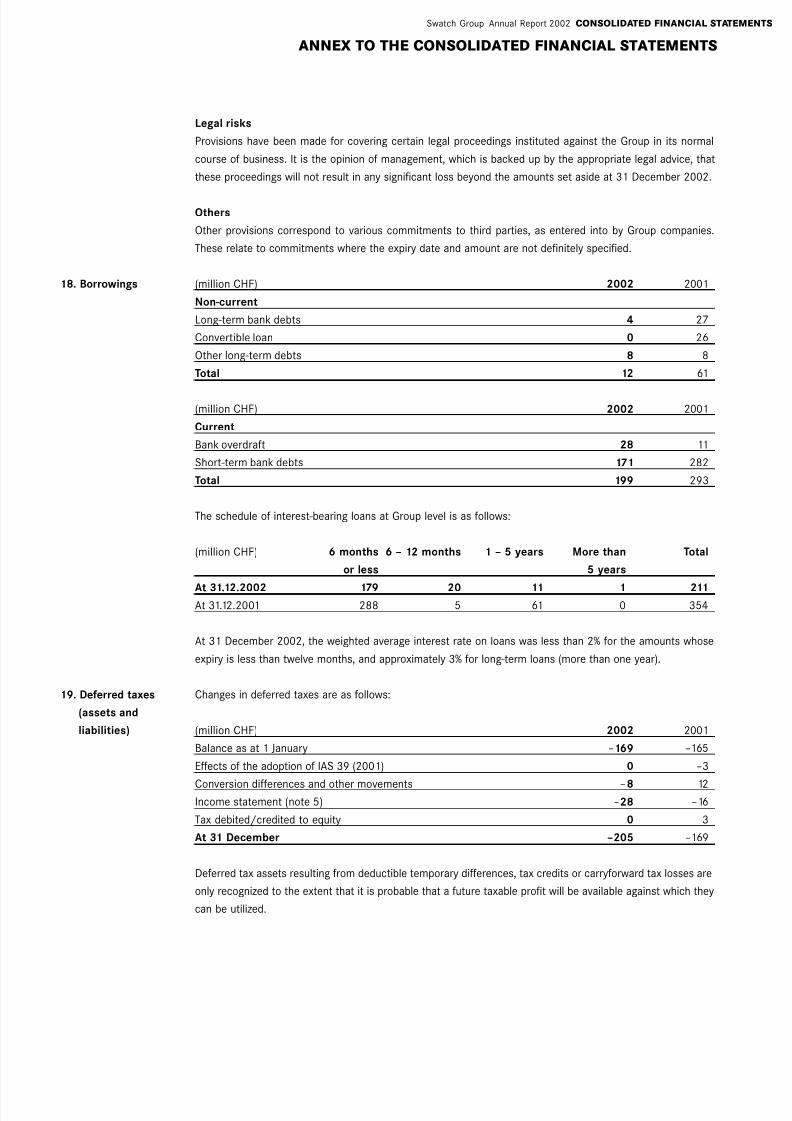
18. Borrowings
19. Deferred taxes
(assets and
liabilities)
Legal risks
Provisions have been made for covering certain legal proceedings instituted against the Group in its normal
course of business. It is the opinion of management, which is backed up by the appropriate legal advice, that
these proceedings will not result in any significant loss beyond the amounts set aside at 31 December 2002.
Others
Other provisions correspond to various commitments to third parties, as entered into by Group companies.
These relate to commitments where the expiry date and amount are not definitely specified.
(million CHF) 2002 2001
Non-current
Long-term bank debts 4 27
Convertible loan 0 26
Other long-term debts 8 8
Total 12 61
(million CHF) 2002 2001
Current
Bank overdraft 28 11
Short-term bank debts 171 282
Total 199 293
The schedule of interest-bearing loans at Group level is as follows:
(million CHF) 6 months 6 – 12 months 1 – 5 years More than Total
or less 5 years
At 31.12.2002 179 20 11 1 211At 31.12.2001 288 5 61 0 354
At 31 December 2002, the weighted average interest rate on loans was less than 2% for the amounts whose
expiry is less than twelve months, and approximately 3% for long-term loans (more than one year).
Changes in deferred taxes are as follows:
(million CHF) 2002 2001
Balance as at 1 January –169 –165
Effects of the adoption of IAS 39 (2001) 0 –3
Conversion differences and other movements –8 12Income statement (note 5) –28 –16
Tax debited/credited to equity 0 3
At 31 December –205 –169
Deferred tax assets resulting from deductible temporary differences, tax credits or carryforward tax losses are
only recognized to the extent that it is probable that a future taxable profit will be available against which they
can be utilized.
ANNEX TO THE CONSOLIDATED FINANCIAL STATEMENTS

8/2/2019 2002 Annual Report Consolidated En
http://slidepdf.com/reader/full/2002-annual-report-consolidated-en 35/44
CONSOLIDATED FINANCIAL STATEMENTS Annual Report 2002 Swatch Group
20. Retirement benefit
obligations
(post-employment
benefits)
Temporary differences for which no deferred tax has been recognized principally concern carryforward tax
losses which are not included in the consolidated financial statements. These tax losses amounted to CHF 100
million at 31 December 2002 (prior year, CHF 89 million). The deductible temporary differences and tax cred-
its not included in the calculation of deferred taxes represent an amount of CHF 20 million (CHF 15 million at
31.12.2001).Approximately 50% of carryforward tax losses expire in six years. For the remainder, the expiry is later.
Deferred tax assets and liabilities (prior to offsetting any balances submitted to the same tax authority), are
related to the following items on the consolidated balance sheet:
Deferred tax assets
Source (million CHF) 2002 2001
Reported losses/tax credits 16 10
Non-current assets 25 19
Current assets 85 82
Short-term debts 8 5Provisions 5 6
Long-term debts 3 5
Total 142 127
Deferred tax liabilities
Source (million CHF) 2002 2001
Non-current assets –104 –109
Current assets –140 –121
Short-term debts –1 0
Provisions –100 –66Long-term debts –2 0
Total –347 –296
Deferred tax assets and liabilities are offset among legal entities coming under the same tax authority.
The following deferred tax asset and liability amounts, calculated by offsetting, are presented in the consoli-
dated balance sheet:
(million CHF) 2002 2001
Deferred tax assets 109 105
Deferred tax liabilities –314 –274
Total net –205 –169
Defined benefit plans
The following table shows the financial situation of the principal pension plans under the heading of defined
benefit plans. Group pension plans in Switzerland, defined under pension fund regulations as defined contri-
bution plans, are also shown in these figures.
ANNEX TO THE CONSOLIDATED FINANCIAL STATEMENTS

8/2/2019 2002 Annual Report Consolidated En
http://slidepdf.com/reader/full/2002-annual-report-consolidated-en 36/44
2002 2001
–2 683 –2 884
2 390 2 801
–293 –83
320 124 *)
2 –3
1 0
–45 –51
–15 –13
–80 –72
–110 –108
155 169–1 –482 *)
–72 0
46 35
6 404 *)
–56 –54
–13 –2
–56 –54
54 43
–15 –13
155 169
–517 –319
–362 –150
2002 2001
% %
1.0 – 6.5 2.5 – 7.0
3.0 – 8.5 3.0 – 8.51.0 – 4.5 1.5 – 4.3
0.0 – 2.4 1.0 – 5.0
Swatch Group Annual Report 2002 CONSOLIDATED FINANCIAL STATEMENTS
Plans with liability surplus
million CHF million CHF
Present value of funded obligations
Fair value of plan assets
Liability surplus
Unrecognized actuarial difference
Present value of unfunded obligations
Unrecognized past service cost
Value adjustment
Net liability in the balance sheet
Amounts recognized in the income statement
Current service cost
Interest cost on obligations
Expected return on plan assetsNet actual losses recognized current year
Past service cost
Employee contributions
Variation of adjustment
Total reported in staff costs
Movement in the net asset/liability recognized in the balance sheet
At beginning of year
Net expense recognized in the income statement
Employer contributions paid
Net asset/liability at end of year
Actual return on plan assets
Expected return on plan assets
Actuarial difference on plan assets
Actual return on plan assets
Principal actuarial assumptions used
Discount
Expected return on plan assetsSalary increases due to inflation
Pension index
*) The recognition of the actuarial differences is related to the application of the amendment IAS 19 “Asset Ceiling”.
ANNEX TO THE CONSOLIDATED FINANCIAL STATEMENTS
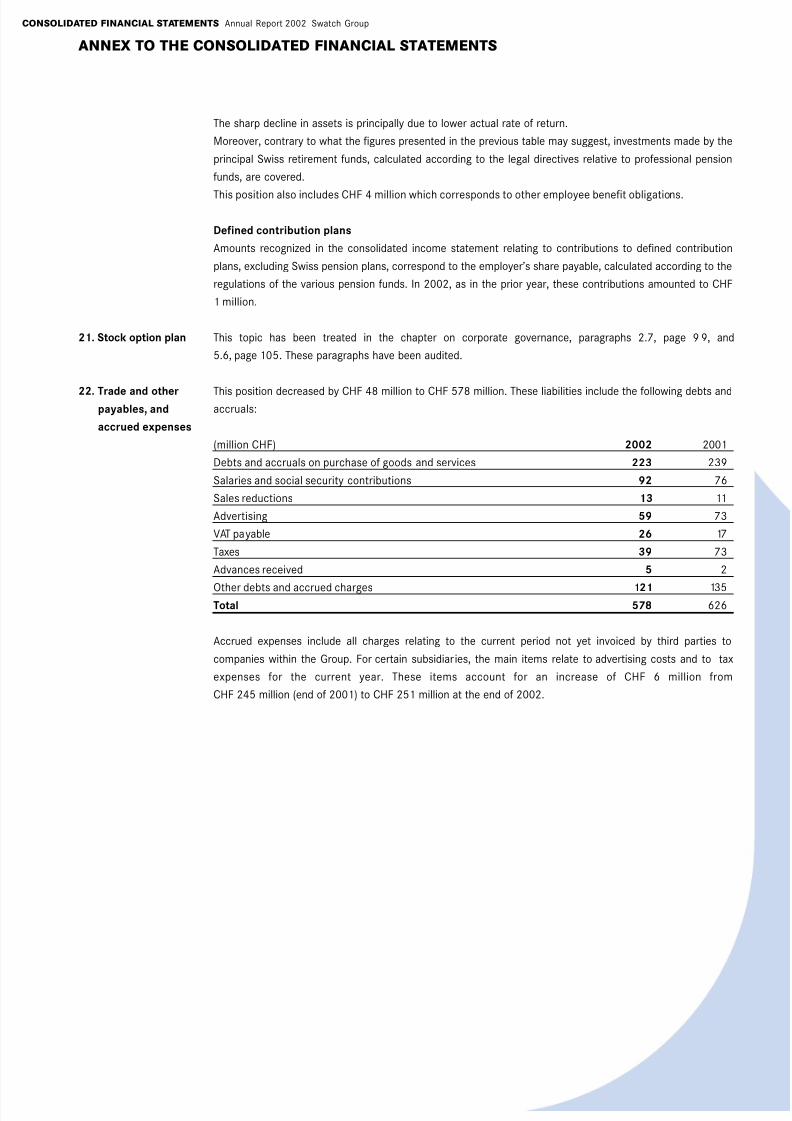
8/2/2019 2002 Annual Report Consolidated En
http://slidepdf.com/reader/full/2002-annual-report-consolidated-en 37/44
CONSOLIDATED FINANCIAL STATEMENTS Annual Report 2002 Swatch Group
21. Stock option plan
22. Trade and otherpayables, and
accrued expenses
The sharp decline in assets is principally due to lower actual rate of return.
Moreover, contrary to what the figures presented in the previous table may suggest, investments made by the
principal Swiss retirement funds, calculated according to the legal directives relative to professional pension
funds, are covered.
This position also includes CHF 4 million which corresponds to other employee benefit obligations.
Defined contribution plans
Amounts recognized in the consolidated income statement relating to contributions to defined contribution
plans, excluding Swiss pension plans, correspond to the employer’s share payable, calculated according to the
regulations of the various pension funds. In 2002, as in the prior year, these contributions amounted to CHF
1 million.
This topic has been treated in the chapter on corporate governance, paragraphs 2.7, page 99, and
5.6, page 105. These paragraphs have been audited.
This position decreased by CHF 48 million to CHF 578 million. These liabilities include the following debts andaccruals:
(million CHF) 2002 2001
Debts and accruals on purchase of goods and services 223 239
Salaries and social security contributions 92 76
Sales reductions 13 11
Advertising 59 73
VAT payable 26 17
Taxes 39 73
Advances received 5 2
Other debts and accrued charges 121 135Total 578 626
Accrued expenses include all charges relating to the current period not yet invoiced by third parties to
companies within the Group. For certain subsidiaries, the main items relate to advertising costs and to tax
expenses for the current year. These items account for an increase of CHF 6 million from
CHF 245 million (end of 2001) to CHF 251 million at the end of 2002.
ANNEX TO THE CONSOLIDATED FINANCIAL STATEMENTS

8/2/2019 2002 Annual Report Consolidated En
http://slidepdf.com/reader/full/2002-annual-report-consolidated-en 38/44
Swatch Group Annual Report 2002 CONSOLIDATED FINANCIAL STATEMENTS
2002 2001
494 504
6 6
110 114183 178
24 18
3 5
–4 –4
5 14
–20 –25
11 19
–117 –149
–51 32–1
23 –32
–4 18
10 11
672 709
23. Changes in
working capital
24. Company
acquisitions
25. Derivative
financial
instruments
million CHF million CHF
Net income
Minority interest
TaxesDepreciation of tangible assets
Amortization of intangible assets
Impairment charge
Profit/loss on sale of fixed assets
Fair value gains/ losses on
available for sale investments
Interest income
Interest expense
Changes in working capital (without liquid funds):
– Inventories
– Trade and other receivables– Assets held for sale
Changes in short-term debt:
– Trade payables and other current liabilities
Changes in provisions
Changes in pensions and other retirement benefits
Cash generated from operations
Effective 1 January 2002, the Swatch Group acquired 100% of the share capital of Rubattel & Weyermann SA,
Switzerland. In 2001, the Group acquired two retail and distribution companies in Greece as well as majority
ownership in a company located in the Czech Republic.The breakdown of net assets and goodwill is as follows:
(million CHF) 2002 2001
Cash expended 9 8
Fair value of acquired net assets –5 0
Goodwill 4 8
Cash and cash equivalents 3 0
Tangible assets 4 1
Inventories 1 1
Receivables 1 4
Debts –4 –6Net fair value of acquired assets 5 0
Total purchase value 9 8
Less: cash and cash equivalents acquired –3 0
Cash flow as a result of purchase 6 8
An overview of all the contract values, as well as those concerning the replacement of derivative financial
instruments on gold and currencies, is shown hereafter. Derivative financial instrument contract values and
replacement values pertaining to the parent company are shown in the annex to the financial statements of
the Holding on pages 153 and 154.
Type Contractual value Positive replacement Negative replacement(million CHF) value value
Forward contracts 380 5 –1
Total at 31.12.02 380 5 –1
Total at 31.12.01 471 2 –3
ANNEX TO THE CONSOLIDATED FINANCIAL STATEMENTS

8/2/2019 2002 Annual Report Consolidated En
http://slidepdf.com/reader/full/2002-annual-report-consolidated-en 39/44
CONSOLIDATED FINANCIAL STATEMENTS Annual Report 2002 Swatch Group
26. Commitments,
contingent assets
and liabilities
Fair value reserves
(million CHF) Cash-flow Derivative Paper Convertible
hedging instruments securities loan
reserves (frozen) available-
for-saleBalance at 1 January 2001 14 –1 26 4
Deferred taxes on the balance –1 –2
Recognized in the income statement –14
Deferred taxes on amounts recognized in the
income statement 1
Fair-value valuation 11 –51
Deferred taxes on fair-value valuation –1 3
Total at 31 December 2001 10 –1 –24 4
Balance at 1 January 2002 10 –1 –24 4
Recognized in the income statement –11Deferred taxes on amounts recognized in
the income statement 1
Fair-value valuation –88 –4
Deferred taxes on fair-value valuation –1
Total at 31 December 2002 0 –1 –113 0
In the course of the prior year, some derivatives were recognized as cash-flow hedges; these served to protect
operating margins.
At 31 December 2002, no cover operations designated as cash-flow hedges existed.
Other financial instrumentsIn order to ensure the permanent availability of funds required for the complete conversion of the1995–2002
convertible loan, the Group contracted over-the-counter (OTC) transactions with third parties for registered
shares of the Swatch Group Ltd. Upon expiry of the loan on 23 October 2002, 99.4% of the nominal loan
amount of CHF 100 million had been converted. At the expiry date, the remaining bondholders were reim-
bursed in the amount of CHF 595 000. At 31 December 2002, no OTC operation in relation to this transaction
remained.
Guarantees and cautions
Guarantees to third parties to secure the commitments of Group companies amounted to CHF 1 million at the
end of 2002 (CHF 1 million at the end of 2001).
The total amount of current assets pledged by Group companies to guarantee their commitments, amountedto CHF 8 million (CHF 1 million at 31.12.2001).
Leasing and other commitments
Leasing commitments for the Group as a whole not recognized on the balance sheet are as follows:
(million CHF) 2002 2001
Less than one year 6 8
From more than one year to less than five years 13 14
More than five years 13 0
Total 32 22
ANNEX TO THE CONSOLIDATED FINANCIAL STATEMENTS

8/2/2019 2002 Annual Report Consolidated En
http://slidepdf.com/reader/full/2002-annual-report-consolidated-en 40/44
Swatch Group Annual Report 2002 CONSOLIDATED FINANCIAL STATEMENTS
27. Relations with
associated thirdparty companies
28. Post-closing-date
events
Leasing contracts have been included for the first time in the totals presented above. Figures relating to 2001
have been restated. The portion of contracts which can be cancelled within a year represents CHF 2 million at
31 December 2002 (CHF 1 million in 2001).
Other commitments entered into by the Group and open at 31.12.2002 amount to CHF 8 million (prior year
CHF 10 million). They correspond to investment commitments in financial assets.
Contingent liabilities and assets
Any contingent assets and liabilities relate to past events, the outcome of which must be confirmed by future
events, which are partially beyond the Group’s control.
Some Group companies are involved in litigation arising from the normal course of their business and they may
be liable to make compensation. The costs relating to these may possibly not be covered by insurance – either
in part or in whole. However, according to Group Management, the outcome of the matters these relate to will
not significantly affect the Group’s financial situation.
In the course of the year under review, the Hayek Group invoiced Swatch Group to a total of CHF 7.8 million,
mainly in relation to assistance given to the Group’s General Management in appraising investment projects,designing and implementing specific cost-reduction programs, implementing control systems for gold and
carrying out organizational flow optimization studies. This sum also includes the remuneration for project
management, operational monitoring tasks, organizational and IT support, as well as the temporary support of
specialists for the management of various companies.
In addition, CHF 5.2 million was paid to Hayek Group companies for Group Management contracts. This sum,
which is linked to performance, was used in its greater part for bonus payments made to Hayek Engineering
specialists, as well as for other lump-sum remuneration.
One of the Group’s minority share companies based in Singapore supplied the Group with marketing and spe-
cial events services valued at CHF 3.4 million. Given that this company primarily engages external specialist
help, 92% of this sum comprises rebilling.
Procurement of goods and services from associated Group companies can be presented as follows:
(million CHF) 2002 2001
Procurement of goods and sub-contracting:
– François Golay 3 2
– Terbival 2 3
Total 5 5
Sales of goods and services to the associated companies mentioned above, as well as the positions still open
at the end of 2001 and 2002 represent less than CHF 1 million.
Directors’, executives’ and external administrators’ remuneration, participations and loansThis topic has been treated in the chapter on corporate governance, paragraphs 5.1–5.9, pages 104 to 105.
These paragraphs have been audited.
No significant new event likely to modify the valuation of the financial statements for 2002 was indicated at
the time of finalizing this report.
ANNEX TO THE CONSOLIDATED FINANCIAL STATEMENTS
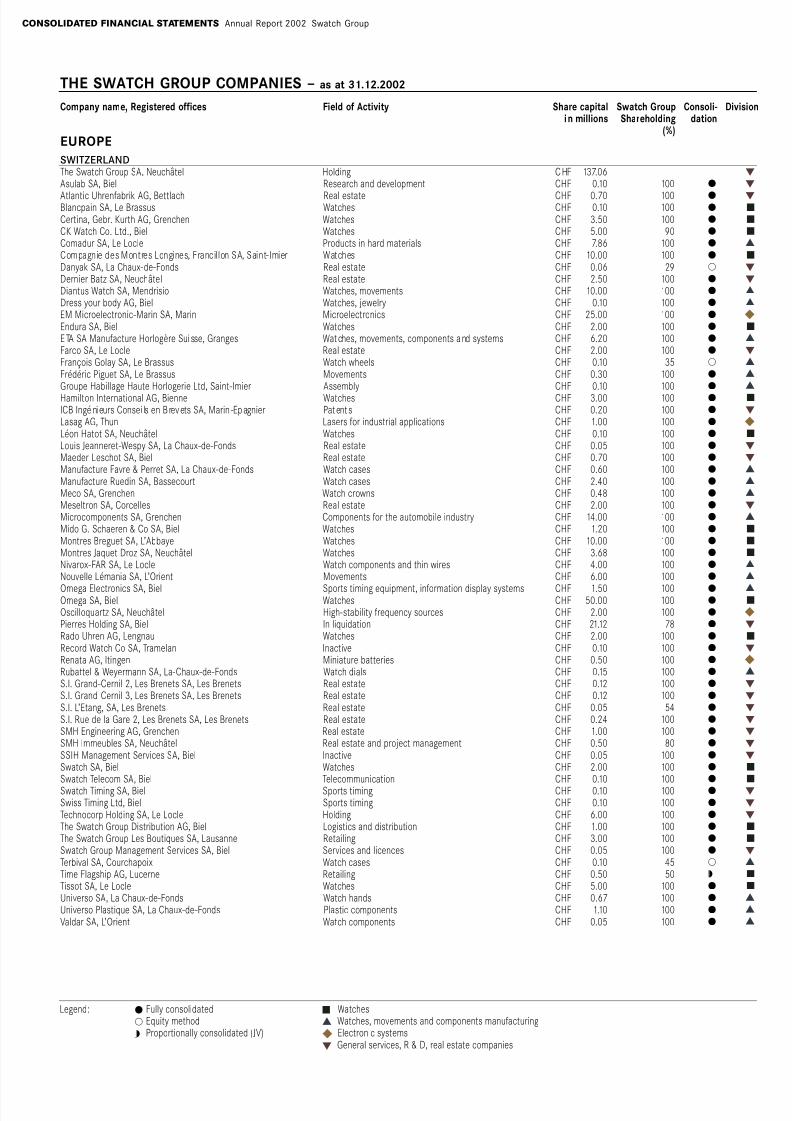
8/2/2019 2002 Annual Report Consolidated En
http://slidepdf.com/reader/full/2002-annual-report-consolidated-en 41/44
w
w
w
v
w
w
v
v
x
v
w
v
v
v
w
x
w
w
v
v
v
w
v
v
v
v
x w
w
x v
w
w
w
w
w
w
w
w
w
w
w
v
v
v
v
v
xw
CHF 137.06CHF 0.10 100
CHF 0.70 100CHF 0.10 100CHF 3.50 100CHF 5.00 90CHF 7.86 100CHF 10.00 100CHF 0.06 29CHF 2.50 100CHF 10.00 100CHF 0.10 100CHF 25.00 100CHF 2.00 100CHF 6.20 100CHF 2.00 100CHF 0.10 35CHF 0.30 100CHF 0.10 100CHF 3.00 100CHF 0.20 100CHF 1.00 100CHF 0.10 100CHF 0.05 100CHF 0.70 100CHF 0.60 100CHF 2.40 100CHF 0.48 100CHF 2.00 100CHF 14.00 100CHF 1.20 100CHF 10.00 100CHF 3.68 100CHF 4.00 100CHF 6.00 100
CHF 1.50 100CHF 50.00 100CHF 2.00 100CHF 21.12 78CHF 2.00 100CHF 0.10 100CHF 0.50 100CHF 0.15 100CHF 0.12 100CHF 0.12 100CHF 0.05 54CHF 0.24 100CHF 1.00 100CHF 0.50 80CHF 0.05 100CHF 2.00 100CHF 0.10 100CHF 0.10 100CHF 0.10 100CHF 6.00 100CHF 1.00 100CHF 3.00 100CHF 0.05 100CHF 0.10 45CHF 0.50 50CHF 5.00 100CHF 0.67 100CHF 1.10 100CHF 0.05 100
Legend: Fully consolidated WatchesEquity method Watches, movements and components manufacturingProportionally consolidated (JV) Electronic systems
General services, R & D, real estate companies
THE SWATCH GROUP COMPANIES – as at 31.12.2002
Company name, Registered offices Field of Activity Share capital Swatch Group Consoli- Divisionin millions Shareholding dation
(%)EUROPE
SWITZERLAND
The Swatch Group SA, Neuchâtel HoldingAsulab SA, Biel Research and development
Atlantic Uhrenfabrik AG, Bettlach Real estateBlancpain SA, Le Brassus WatchesCertina, Gebr. Kurth AG, Grenchen WatchesCK Watch Co. Ltd., Biel WatchesComadur SA, Le Locle Products in hard materialsCompagnie des Montres Longines, Francillon SA, Saint-Imier WatchesDanyak SA, La Chaux-de-Fonds Real estateDernier Batz SA, Neuchâtel Real estateDiantus Watch SA, Mendrisio Watches, movementsDress your body AG, Biel Watches, jewelryEM Microelectronic-Marin SA, Marin MicroelectronicsEndura SA, Biel WatchesETA SA Manufacture Horlogère Suisse, Granges Watches, movements, components and systemsFarco SA, Le Locle Real estateFrançois Golay SA, Le Brassus Watch wheelsFrédéric Piguet SA, Le Brassus MovementsGroupe Habillage Haute Horlogerie Ltd, Saint-Imier AssemblyHamilton International AG, Bienne WatchesICB Ingénieurs Consei ls en Brevets SA, Marin -Epagnier PatentsLasag AG, Thun Lasers for industrial applicationsLéon Hatot SA, Neuchâtel WatchesLouis Jeanneret-Wespy SA, La Chaux-de-Fonds Real estateMaeder-Leschot SA, Biel Real estateManufacture Favre & Perret SA, La Chaux-de-Fonds Watch casesManufacture Ruedin SA, Bassecourt Watch casesMeco SA, Grenchen Watch crownsMeseltron SA, Corcelles Real estateMicrocomponents SA, Grenchen Components for the automobile industryMido G. Schaeren & Co SA, Biel WatchesMontres Breguet SA, L’Abbaye WatchesMontres Jaquet Droz SA, Neuchâtel WatchesNivarox-FAR SA, Le Locle Watch components and thin wiresNouvelle Lémania SA, L’Orient Movements
Omega Electronics SA, Biel Sports timing equipment, information display systemsOmega SA, Biel WatchesOscilloquartz SA, Neuchâtel High-stability frequency sourcesPierres Holding SA, Biel In liquidationRado Uhren AG, Lengnau WatchesRecord Watch Co SA, Tramelan InactiveRenata AG, Itingen Miniature batteriesRubattel & Weyermann SA, La-Chaux-de-Fonds Watch dialsS.I. Grand-Cernil 2, Les Brenets SA, Les Brenets Real estateS.I. Grand-Cernil 3, Les Brenets SA, Les Brenets Real estateS.I. L’Etang, SA, Les Brenets Real estateS.I. Rue de la Gare 2, Les Brenets SA, Les Brenets Real estateSMH Engineering AG, Grenchen Real estateSMH Immeubles SA, Neuchâtel Real estate and project managementSSIH Management Services SA, Biel InactiveSwatch SA, Biel WatchesSwatch Telecom SA, Biel TelecommunicationSwatch Timing SA, Biel Sports timingSwiss Timing Ltd, Biel Sports timingTechnocorp Holding SA, Le Locle HoldingThe Swatch Group Distribution AG, Biel Logistics and distributionThe Swatch Group Les Boutiques SA, Lausanne RetailingSwatch Group Management Services SA, Biel Services and licencesTerbival SA, Courchapoix Watch casesTime Flagship AG, Lucerne RetailingTissot SA, Le Locle WatchesUniverso SA, La Chaux-de-Fonds Watch handsUniverso Plastique SA, La Chaux-de-Fonds Plastic componentsValdar SA, L’Orient Watch components
CONSOLIDATED FINANCIAL STATEMENTS Annual Report 2002 Swatch Group

8/2/2019 2002 Annual Report Consolidated En
http://slidepdf.com/reader/full/2002-annual-report-consolidated-en 42/44
w
v
w
w
w
v
v
v
v
w
v
w
w
w
w
x
EUR 0.03 95EUR 0.03 100EUR 0.51 100EUR 0.03 100
EUR 0.08 100EUR 1.28 100
EUR 0.10 100
EUR 0.05 100
EUR 0.04 100
EUR 1.75 100
EUR 2.09 100
EUR 0.45 100
EUR 6.10 1000.00 100
EUR 0.29 99EUR 0.15 100EUR 0.67 100
EUR 2.47 100
EUR 2.00 100EUR 0.28 87
GBP 2.00 100
GBP 0.08 100
EUR 0.06 100EUR 0.06 100
EUR 0.15 100
EUR 0.43 100EUR 0.01 100EUR 23.00 100
EUR 0.12 100
CHF 0.03 100
CHF 1000.00 100
EUR 0.02 100EUR 0.70 100
EUR 24.14 100
RUR 0.20 100
SEK 0.50 100
CZK 2.01 51
Swatch Group Annual Report 2002 CONSOLIDATED FINANCIAL STATEMENTS
GERMANY
Altweiler GmbH, Lörrach Real estateETA Uhrenwerke GmbH, Pforzheim ToolsGlashütter Uhrenbetrieb GmbH, Glashütte WatchesSaxonian Luxury Goods Holding GmbH, Glashütte Holding
Swiss Prestige Uhren Handel GmbH, Reutlingen InactiveThe Swatch Group (Deutschland) GmbH, Eschborn/Niederhöchstadt Distribution (Breguet, Blancpain, Léon Hatot, Omega,
Rado, Longines, Tissot, Pierre Balmain, cK Watch, Swatch,Lasag, EM Marin, Micro-Crystal)
The Swatch Group (Deutschland) Les Boutiques GmbH, RetailingEschborn/NiederhöchstadtUnion Uhrenfabrik GmbH, Glashütte Watches
AUSTRIA
The Swatch Group (Oesterreich) GmbH, Wien Distribution (Breguet, Blancpain, Glashütte, Omega, Rado,Longines, Tissot, Certina, cK Watch, Swatch)
BELGIUM
The Swatch Group (Belgium) SA, Bruxelles Distribution (Breguet, Blancpain, Glashütte, Omega, Rado,Longines, Tissot, Certina, Hamilton, Pierre Balmain,cK Watch, Swatch, Omega Electronics)
The Swatch Group Participation SA, Bruxelles Holding
SPAINThe Swatch Group (España) SA, Madrid Distribution (Breguet, Blancpain, Glashütte, Omega, Rado,
Longines, Tissot, Certina, Hamilton, Pierre Balmain,cK Watch, Swatch)
FRANCE
Breguet SAS, Paris DistributionChablais Florissant, Annemasse In liquidationFabrique de Fournitures de Bonnétage FFB SAS, Villers-le-Lac Watch components and precision partsFrésard Composants SAS, Charquemont Watch componentsSociété Européenne de Fabrication d’Ebauches d’Annemasse Watch components and electronic assembly(SEFEA) SAS, AnnemasseThe Swatch Group (France) SAS, Paris Distribution (Breguet, Blancpain, Glashütte, Jaquet Droz,
Léon Hatot, Omega, Rado, Longines, Tissot, Hamilton,Pierre Balmain, cK Watch, Swatch, Endura)
The Swatch Group (France) Les Boutiques SAS, Paris RetailingUniverso France Sàrl, Besançon Watch hands
GREAT BRITAINThe Swatch Group (UK) Ltd, Eastleigh Distribution (Breguet, Blancpain, Omega, Rado, Longines,
Tissot, Hamilton, cK Watch, Swatch, Omega Electronics)The Swatch Group (UK) Les Boutiques Ltd, Eastleigh Retailing
GREECE
Alkioni SA, Athens RetailingThe Swatch Group (Greece) SA, Athens Distribution (Breguet, cK Watch, Swatch)
IRELAND
SMH Ireland Ltd, Dublin Inactive
ITALY
Lascor S.p.A, Sesto Calende Watch cases and braceletsThe Swatch Group Europe Services S.r.l., Milano AdministrationThe Swatch Group (Italia) S.p.A., Rozzano Distribution (Breguet, Blancpain, Jaquet Droz, Glashütte,
Omega, Rado, Longines, Tissot, Hamilton, Pierre Balmain,cK Watch, Swatch)
The Swatch Group (Italia) Les Boutiques S.p.A., Rozzano Retailing
LIECHTENSTEIN
Etablissement Voltax, Vaduz Intellectual property rights
LUXEMBURG
The Swatch Group Finance (Luxembourg) SA, Finance companySociété anonyme Holding, Luxemburg
NETHERLANDS
Breguet Investments BV, Rotterdam HoldingThe Swatch Group (Nether lands) BV, Maastricht Distr ibution (Omega, Rado, Longines, Tissot , Cert ina,
Pierre Balmain, cK Watch, Swatch)
PORTUGAL
The Swatch Group (Europa) - Sociedada Unipessoal SA, Funchal Distribution
RUSSIA
Swiss Watch Le Prestige OOO Russia, Moscow Distribution
SWEDEN
The Swatch Group (Nordic) AB, Stockholm Distribution (Breguet, Omega, Rado, Longines, Tissot,Certina, cK Watch, Swatch)
CZECH REPUBLIC
ASICentrum, Prague Microelectronics
THE SWATCH GROUP COMPANIES – as at 31.12.2002
Company name, Registered offices Field of Activity Share capital Swatch Group Consoli- Divisionin mil lions Shareholding dation
(%)
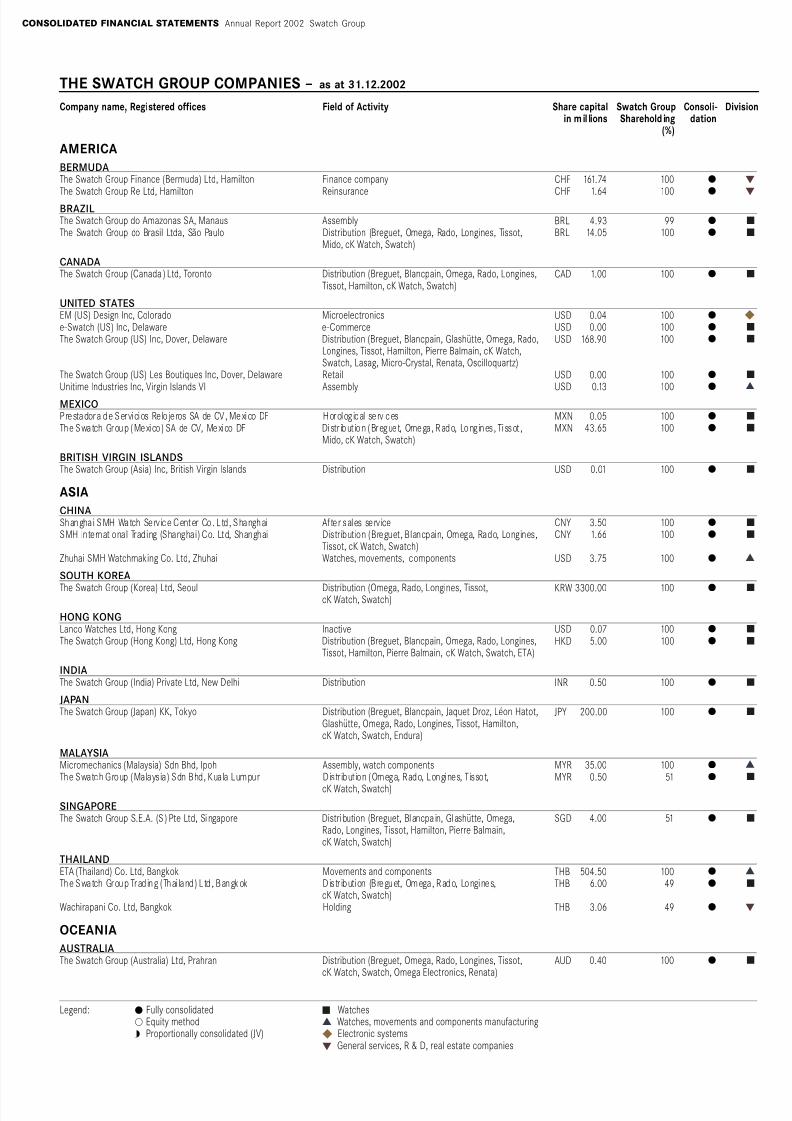
8/2/2019 2002 Annual Report Consolidated En
http://slidepdf.com/reader/full/2002-annual-report-consolidated-en 43/44
w
w
x
v
v
v
v
w
v
xw
CHF 161.74 100
CHF 1.64 100
BRL 4.93 99BRL 14.05 100
CAD 1.00 100
USD 0.04 100USD 0.00 100USD 168.90 100
USD 0.00 100USD 0.13 100
MXN 0.05 100MXN 43.65 100
USD 0.01 100
CNY 3.50 100CNY 1.66 100
USD 3.75 100
KRW 3300.00 100
USD 0.07 100HKD 5.00 100
INR 0.50 100
JPY 200.00 100
MYR 35.00 100MYR 0.50 51
SGD 4.00 51
THB 504.50 100THB 6.00 49
THB 3.06 49
AUD 0.40 100
CONSOLIDATED FINANCIAL STATEMENTS Annual Report 2002 Swatch Group
AMERICA
BERMUDA
The Swatch Group Finance (Bermuda) Ltd, Hamilton Finance company
The Swatch Group Re Ltd, Hamilton ReinsuranceBRAZIL
The Swatch Group do Amazonas SA, Manaus AssemblyThe Swatch Group do Brasil Ltda, São Paulo Distribution (Breguet, Omega, Rado, Longines, Tissot,
Mido, cK Watch, Swatch)
CANADA
The Swatch Group (Canada ) Ltd, Toronto Distribution (Breguet, Blancpain, Omega, Rado, Longines,Tissot, Hamilton, cK Watch, Swatch)
UNITED STATES
EM (US) Design Inc, Colorado Microelectronicse-Swatch (US) Inc, Delaware e-CommerceThe Swatch Group (US) Inc, Dover, Delaware Distribution (Breguet, Blancpain, Glashütte, Omega, Rado,
Longines, Tissot, Hamilton, Pierre Balmain, cK Watch,Swatch, Lasag, Micro-Crystal, Renata, Oscilloquartz)
The Swatch Group (US) Les Boutiques Inc, Dover, Delaware RetailUnitime Industries Inc, Virgin Islands VI Assembly
MEXICO
Prestadora de Servicios Relojeros SA de CV, Mexico DF Horolog ical servicesThe Swatch Group (Mexico) SA de CV, Mexico DF Distr ibut ion (Breguet, Omega, Rado, Longines, Tissot ,
Mido, cK Watch, Swatch)
BRITISH VIRGIN ISLANDS
The Swatch Group (Asia) Inc, British Virgin Islands Distribution
ASIA
CHINA
Shanghai SMH Watch Service Center Co. Ltd, Shanghai After sales serviceSMH International Trading (Shanghai) Co. Ltd, Shanghai Distribution (Breguet, Blancpain, Omega, Rado, Longines,
Tissot, cK Watch, Swatch)Zhuhai SMH Watchmaking Co. Ltd, Zhuhai Watches, movements, components
SOUTH KOREA
The Swatch Group (Korea) Ltd, Seoul Distribution (Omega, Rado, Longines, Tissot,cK Watch, Swatch)
HONG KONG
Lanco Watches Ltd, Hong Kong InactiveThe Swatch Group (Hong Kong) Ltd, Hong Kong Distribution (Breguet, Blancpain, Omega, Rado, Longines,
Tissot, Hamilton, Pierre Balmain, cK Watch, Swatch, ETA)
INDIA
The Swatch Group (India) Private Ltd, New Delhi Distribution
JAPAN
The Swatch Group (Japan) KK, Tokyo Distribution (Breguet, Blancpain, Jaquet Droz, Léon Hatot,Glashütte, Omega, Rado, Longines, Tissot, Hamilton,cK Watch, Swatch, Endura)
MALAYSIA
Micromechanics (Malaysia) Sdn Bhd, Ipoh Assembly, watch componentsThe Swatch Group (Malaysia) Sdn Bhd, Kuala Lumpur Distribution (Omega, Rado, Longines, Tissot,
cK Watch, Swatch)
SINGAPORE
The Swatch Group S.E.A. (S ) Pte Ltd, Singapore Distribution (Breguet, Blancpa in, Glashütte, Omega,Rado, Longines, Tissot, Hamilton, Pierre Balmain,cK Watch, Swatch)
THAILAND
ETA (Thailand) Co. Ltd, Bangkok Movements and componentsThe Swatch Group Trading (Thai land) Ltd, Bangkok Distr ibution (Breguet, Omega, Rado, Longines,
cK Watch, Swatch)Wachirapani Co. Ltd, Bangkok Holding
OCEANIA
AUSTRALIA
The Swatch Group (Australia) Ltd, Prahran Distribution (Breguet, Omega, Rado, Longines, Tissot,cK Watch, Swatch, Omega Electronics, Renata)
Legend: Fully consolidated WatchesEquity method Watches, movements and components manufacturingProportionally consolidated (JV) Electronic systems
General services, R & D, real estate companies
THE SWATCH GROUP COMPANIES – as at 31.12.2002
Company name, Registered offices Field of Activity Share capital Swatch Group Consoli- Divisionin mil lions Shareholding dation
(%)

8/2/2019 2002 Annual Report Consolidated En
http://slidepdf.com/reader/full/2002-annual-report-consolidated-en 44/44
Swatch Group Annual Report 2002 CONSOLIDATED FINANCIAL STATEMENTS
REPORT OF THE GROUP AUDITORS
Report of the
Group auditors
to the General Meeting of
The Swatch Group Ltd
Neuchâtel
As auditors of the Group, we have audited the consolidated financial statements (balance sheet, income state-
ment, statement of cash flows, statement of changes in equity and notes – pages 114 to 147) of The Swatch
Group Ltd for the year ended 31 December 2002.
These consolidated financial statements are the responsibility of the Board of Directors. Our responsibility isto express an opinion on these consolidated financial statements based on our audit. We confirm that we meet
the legal requirements concerning professional qualification and independence.
Our audit was conducted in accordance with auditing standards promulgated by the Swiss profession and with
the International Standards on Auditing, which require that an audit be planned and performed to obtain reaso-
nable assurance about whether the consolidated financial statements are free from material misstatement. We
have examined on a test basis evidence supporting the amounts and disclosures in the consolidated financial
statements. We have also assessed the accounting principles used, significant estimates made and the overall
consolidated financial statement presentation. We believe that our audit provides a reasonable basis for our
opinion.
In our opinion, the consolidated financial statements give a true and fair view of the financial position, the
results of operations and the cash flows in accordance with the International Financial Reporting Standards
(IFRS) and comply with Swiss law.
We recommend that the consolidated financial statements submitted to you be approved.
PricewaterhouseCoopers Ltd
P. Sütterlin A. Stotz
Basle, 26 March 2003