2000 southern east kootenay goat aeria survey...2000 southern east kootenay goat aerial survey i...
TRANSCRIPT

2000 SOUTHERN EAST KOOTENAYGOAT AERIAL SURVEY
PREPARED BYRobert Halko, P.Ag., Keith Hebert
FORColumbia Basin Fish & Wildlife Compensation Program
December 2000
COLUMBIA BASINFISH & WILDLIFECOMPENSATION
PROGRAM
www.cbfishwildlife.org
2000 Southern East Kootenay Goat Aerial Survey
i Columbia basin Fish and Wildlife Compensation Program - B.C. Environment
Executive SummaryMountain goats exist throughout the high elevation areas of the East Kootenay.Previous inventories have been conducted over most of the 2000 inventory area.These inventories were relative abundance surveys with sex and age classificationslimited to adults and juveniles. The mountain goat population is hunted in mostareas covered by this inventory during the fall hunting season, but hunts are on aLimited Entry basis. Gaining further knowledge of the current number of animals,sex and age ratios, distribution and the required habitat types to provide bettermanagement of this species is the objective of this project. Updated knowledge ofthe number of animals and the required habitat types will result in better goatmanagement in the East Kootenay.
B.C. Environment and the Columbia Basin Fish and Wildlife Compensation Programrequested a goat inventory for four Management Units in the East Kootenay –M.U.’s 4-01 (Flathead River drainage), 4-02 (Wigwam River drainage) , 4-23 (ElkRiver drainage), and 4-22 (Bull River drainage). Funding for this inventory wasprovided by the Columbia Basin Fish and Wildlife Compensation Program andC.L.I.B (Coordinated Land Inventory Base).
All census flights were done using a Bell 206 helicopter flying between 30 and 70 mabove ground level and at speeds of 60 - 100 km / hr, depending on tree cover andterrain. Animal locations were recorded using a GPS Pathfinder receiver. Locationswere recorded where the animals were first sighted.
The inventory was completed according to RIC Standards. Composition was to thelevel of adults and kids, due to the difficulty of sexing adult goats and the terraincompromising the safety of the Mt. Goats and the observers.
Tabulation of all count and classification data was done using previous sightabilitydata . Conservative management population estimates for these areas were madeusing sightability estimates made in other areas of the province.
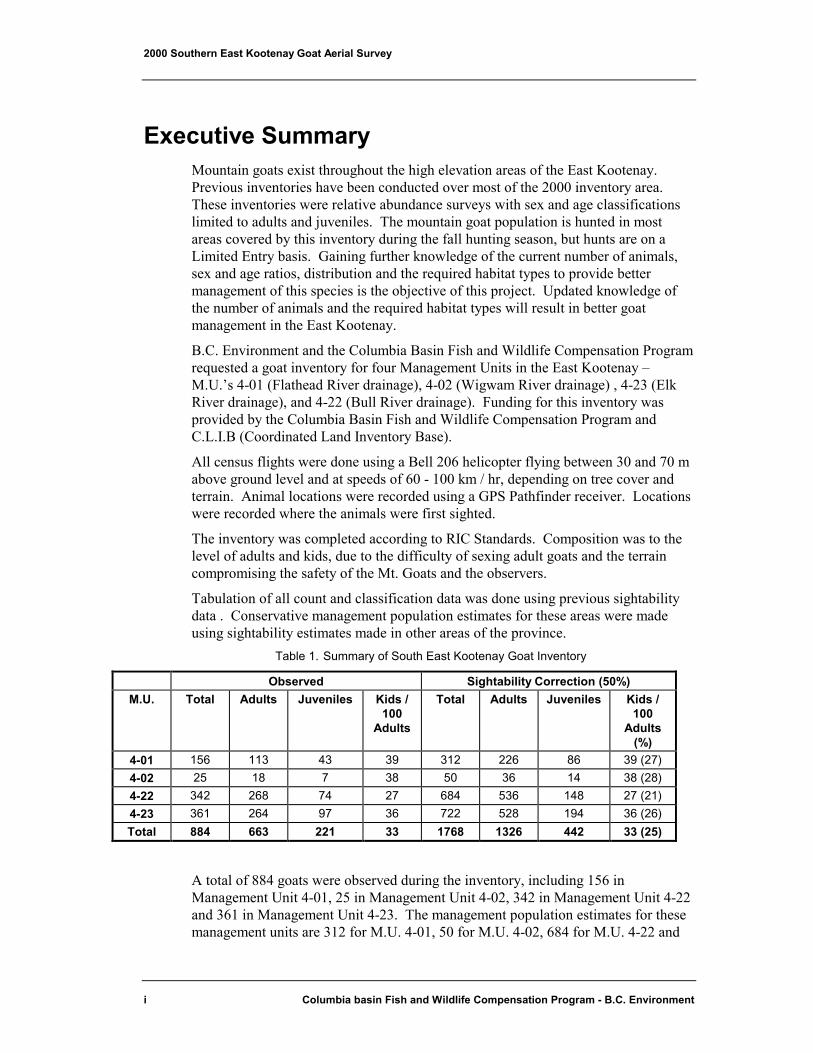
Table 1. Summary of South East Kootenay Goat Inventory
Observed Sightability Correction (50%)M.U. Total Adults Juveniles Kids /
100Adults
Total Adults Juveniles Kids /100
Adults(%)
4-01 156 113 43 39 312 226 86 39 (27)4-02 25 18 7 38 50 36 14 38 (28)4-22 342 268 74 27 684 536 148 27 (21)4-23 361 264 97 36 722 528 194 36 (26)Total 884 663 221 33 1768 1326 442 33 (25)
A total of 884 goats were observed during the inventory, including 156 inManagement Unit 4-01, 25 in Management Unit 4-02, 342 in Management Unit 4-22and 361 in Management Unit 4-23. The management population estimates for thesemanagement units are 312 for M.U. 4-01, 50 for M.U. 4-02, 684 for M.U. 4-22 and

2000 Southern East Kootenay Goat Aerial Survey
ii Columbia basin Fish and Wildlife Compensation Program - B.C. Environment
722 for the surveyed portion of M.U. 4-23. It should be noted that portions of M.U.4-23 were not surveyed due to adverse weather conditions, and this estimate is foronly the surveyed portion of the management unit.
The adult to juvenile ratio for the study area was 33 juveniles per 100 adults, orjuveniles made up 25% of the goat population. The proportion of juvenilesobserved (25%) was equal to the percent juveniles observed during summer/early fallsurveys in the Robson Valley (25%), and higher than those undertaken in the BabineMountains (17-18%);the Hazelton and Coast mountains (19%); and interior BC (15-23%). The late summer - fall recruitment rates of juvenile goats appear to besatisfactory to maintain and increase this goat herd. The highest percentage ofjuveniles was found in Management Unit 4-02 (Wigwam River) at 28%, followedclosely by Management Unit 4-23 (Elk Valley) with 26% and Management Unit 4-01(Flathead River) at 27%. The lowest percentage of juveniles was found inManagement Unit 4-22 (Bull River) at 21%. However, it should be noted that thispercentage is still higher than most other recently recorded goat inventories withinthe province of British Columbia.
Several previous goat surveys have been undertaken within the inventory areabetween 1977 and 1991 (Table 10). However, caution should be exercised incomparing these previous data with the results of the 2000 inventory. It is unknownif previous results encompassed the entire management zone, and what the surveyintensities were on these flights. Goat populations have declined in certainmanagement zones in Management Units 4-01 and 4-23. Interpreting past data fromgoat inventories in Management Unit 4-22 are difficult to interpret, as it cannot bemade certain that the entire management zones were surveyed on these previousflights.

2000 Southern East Kootenay Goat Aerial Survey
iii Columbia basin Fish and Wildlife Compensation Program - B.C. Environment
AcknowledgmentsWe would like to thank the Ktunaxa - Kinbasket Tribal Council for theirparticipation in this project, particularly Vic Clement for his participation in theinventory. We would also like to thank Bob Forbes of B.C. Environment and LarryIngham of the Columbia Basin Fish and Wildlife Compensation Program for theirguidance and assistance, as well as Clay Wilson of Bighorn Helicopter for onceagain providing quality pilots for this inventory.

2000 Southern East Kootenay Goat Aerial Survey
iv Columbia basin Fish and Wildlife Compensation Program - B.C. Environment
Table of ContentsExecutive Summary........................................................................................................i
Acknowledgments ..........................................................................................................iii
Table of Contents ...........................................................................................................iv
List of Tables..................................................................................................................iv
Introduction ....................................................................................................................1
Methods ..........................................................................................................................1
Results ...........................................................................................................................2
Discussion.......................................................................................................................8
Population Estimates................................................................................................8
Management Units and Management Zones............................................................9
Overall Populations..................................................................................................12
Adult : Juvenile Ratios.............................................................................................12
Comparison With Past Surveys................................................................................13
Conclusions ....................................................................................................................14
Literature Cited...............................................................................................................15
Appendix ........................................................................................................................16
List of TablesTable 1. Summary of South East Kootenay Goat Inventory ..........................................i
Table 2. Goat Inventory Data, M.U. 4-01 by LEH Zone................................................3
Table 3. Goat Inventory Data, M.U. 4-02 by LEH Zone................................................4
Table 4. Goat Inventory Data, M.U. 4-22 by LEH Zone................................................5
Table 5. Goat Inventory Data, M.U. 4-23 by LEH Zone................................................7
Table 6. Population estimates using three methods, Flathead M.U. 4-01. .....................10
Table 7. Population estimates using three methods, Flathead M.U. 4-01. .....................10
Table 8. Population estimates using three methods, Bull River M.U. 4-22. .................11
Table 9. Population estimates using three methods, Elk Valley M.U. 4-23(survey area only)...........................................................................................12
Table 10. Number of goats observed on previous summer inventories by zoneand year. ........................................................................................................13

2000 Southern East Kootenay Goat Aerial Survey
Page 1 Columbia basin Fish and Wildlife Compensation Program - B.C. Environment
IntroductionB.C. Environment and the Columbia Basin Fish and Wildlife CompensationProgram requested a mountain goat inventory for four Management Units in theEast Kootenay – M.U.’s 4-01 (Flathead River drainage), 4-02 (Wigwam Riverdrainage) , 4-23 (Elk River drainage), and 4-22 (Bull River drainage). Funding forthis inventory was provided by C.L.I.B. (Common Land Inventory Base) and theColumbia Basin Fish and Wildlife Compensation Program. Mountain goats existthroughout the high elevation areas of the East Kootenay. There is some concernthat goat populations in some areas within the East Kootenays have or are declining.This was indicated on preliminary goat census flights comjpleted by B.C.Environment and C.B.F.W.C.P. during the summer of 1999 in the PurcellMountains.
Previous inventories have been conducted over most of the 2000 inventory area.These inventories were relative abundance surveys with sex and age classificationslimited to adults and juveniles. The mountain goat population is hunted in mostareas covered by this inventory during the fall hunting season, but hunts are on aLimited Entry basis. Gaining further knowledge of the current number of animals,sex and age ratios, distribution and the required habitat types to provide bettermanagement of this species is the objective of this project. Updated knowledge ofthe number of animals and the required habitat types will result in better goatmanagement in the East Kootenays.
MethodsAn aerial survey was conducted between September 1 and 9, 2000 using an absolutecount. Four management units were identified for survey, including 4-01 (FlatheadRiver drainage), 4-02 (Wigwam River drainage) , 4-23 (Elk River drainage), and 4-22 (Bull River drainage). Each Management Unit was surveyed by flying all areasfrom approximately 200 m below timberline to the ridge top.
All census flights were done using a Bell 206 helicopter flying between 30 and 70 mabove ground level and at speeds of 60 - 100 km / hr, depending on tree cover andterrain. The search pattern varied from transects parallel to contours to transectsacross the contours. Transects were flown between 150 - 250 m apart, dependingon tree cover and terrain. Once animals were sighted, they were circled to obtainage and sex information. Animal locations were recorded using a GPS Pathfinderreceiver. Locations were recorded where the animals were first sighted. Flightlines were also recorded using this feature. All flight lines and goat locations weredifferentially corrected using PFINDER software.
A four-man survey team, including the pilot, was employed on the census flights.During the census flights, the primary observer sat in the front seat, next to the pilotand operated the GPS receiver. The secondary observer sat behind the pilot andrecorded all the data while the third observer sat behind the primary observer.
2000 Southern East Kootenay Goat Aerial Survey
Page 2 Columbia basin Fish and Wildlife Compensation Program - B.C. Environment
The inventory was completed according to RIC Standards. Composition was to thelevel of adults and kids, due to the difficulty of sexing adult goats and the terraincompromising the safety of the Mt. Goats and the observers. Locations ofindividuals observed were recorded on 1:50,000 topographic maps and totalnumbers, composition, vegetation type, percent cover and activity (bedded, movingor standing of first observed) at each individual location, was recorded on RIC“Animal Observation Form-Ungulate (Aerial) Sample Block “forms.Approximately 200 m below treeline was used as lower elevation boundary,however lower elevation sites dominated by escape terrain were also searched.Flight lines were identified on the maps by hand, as well as being recorded usingG.P.S. This will help in documenting the distribution of Mountain Goats as well asassist in identifying potential enhancement projects.
The total number, adults and juveniles, as well as juveniles per adult weresummarized for each management zone and management unit. CBFWCP Inventoryblock results were not analyzed due to the lack of defined blocks over most of theinventory area. Results were compared to previously completed inventories orresearch projects when possible to assist in the evaluation of the status or health ofthese goat populations.
Tabulation of all count and classification data was done using previous sightabilitydata. Poole and Heard (1999) estimated goat sightability to be approximately 67 -68% during an inventory in the Robson Valley (north of the inventory area).Chichowski et. al., (1994) also reported similar results during a mark / resurveyinventory also conducted in British Columbia. However, goat sightability has alsobeen recorded as low as 30% (Hebert and Langin, 1982; Smith, 1984; Smith andBovee, 1984). Conservative goat population estimates were made using 50%sightability, which is the mid-point between these sightability estimates. Populationestimates for Management Units and Zones were made using these numbers.
ResultsFlathead River (M.U. 4-01)
A total of 156 goats were observed during these census flights. Of this total, 113were adults and 43 were juveniles. The age class ratio was 39 juveniles : 100 adults(Table 2). Using the 68% sightability reported by Poole and Heard (1999) andChicowski et. al (1994), the estimated goat population of the Management Unit is229, comprised of 166 adults and 63 juveniles. At 50% sightability, which is beingused for management estimates, the goat population for the Management Unit is 312goats, comprised of 226 adults and 86 juveniles (Table 2). Raw data for M.U. 4-01(as well as other surveyed Management Units) appear in Appendix 1.

2000 Southern East Kootenay Goat Aerial Survey
Page 3 Columbia basin Fish and Wildlife Compensation Program - B.C. Environment
Table 2. Goat Inventory Data, M.U. 4-01 by LEH Zone.
Zone Observed 68% Sightability 50% Sightability(Management
Estimate)
30% Sightability
Adult Juvenile Total Adult Juvenile Total Adult Juvenile Total Adult Juvenile Total Juvenile: 100Auult
401A 23 10 33 34 15 49 46 20 66 77 33 110 43401B 22 6 28 32 9 41 44 12 56 73 20 93 27401C 24 9 33 35 13 48 48 18 66 80 30 110 37401E 15 6 21 22 9 31 30 12 42 50 20 70 40401X 24 11 35 35 16 51 48 22 70 80 37 117 45401Y 5 1 6 7 1 8 10 2 12 17 3 20 20
TOTAL 113 43 156 165 63 229 226 86 312 377 143 520 37
Goat management zone 4-01A consists of the drainages of Kisheneena Creek andthe south side of Sage Creek. A total of 33 goats (23 adults and 10 juveniles) wereobserved in this zone. The age class ratio was 43 juveniles : 100 adults (Table 2).Using the 50% sightability calculation, the population estimate for the managementzone is 66 goats, including 46 adults and 20 juveniles.
Goat management zone 4-01B consists of the drainage of Commerce Creek and thenorth side of the Sage Creek drainage and the south side of Middle Pass Creek.. Atotal of 28 goats (22 adults and 6 juveniles) were observed in this zone. The ageclass ratio was 27 juveniles : 100 adults (Table 2). Using the 50% sightabilitycalculation, the population estimate for the management zone is 56 goats, including44 adults and 12 juveniles.
Goat management zone 4-01C consists of the land on the east side of the FlatheadRiver from the north side of Middle Pass Creek to the south side of Pincher Creek.A total of 33 goats (24 adults and 9 juveniles) were observed in this zone. The ageclass ratio was 37 juveniles : 100 adults (Table 2). Using the 50% sightabilitycalculation, the population estimate for the management zone is 66 goats, including48 adults and 18 juveniles.
Goat management zone 4-01D consists of the land on the east side of the FlatheadRiver from the north side of Pincher Creek and the Squaw Creek drainage. As nogoats were observed within this management zone, no population estimates areavailable.
Management zone 4-01X consists of the land bordered between the west side of theFlathead River and the east side of Harvey Creek. Prominent drainages within thisunit include McLatchie and Shepp Creeks. There is currently no goat huntingwithin this unit. A total of 35 goats (24 adults and 11 juveniles) were observed inthis zone. The age class ratio was 45 juveniles : 100 adults (Table 2). Using the50% sightability calculation, the population estimate for the management zone is 70goats, including 48 adults and 22 juveniles.
Management zone 4-01E consists of the area bordered by the height of land betweenMU 4-01 and 4-02 in the west, the west side of Harvey Creek and the FlatheadRiver to the east, and the north side of Cabin Creek to the south. A total of 21 goats

2000 Southern East Kootenay Goat Aerial Survey
Page 4 Columbia basin Fish and Wildlife Compensation Program - B.C. Environment
(15 adults, 6 juveniles) were observed in this zone. The age class ratio was 40juveniles : 100 adults (Table 2). Using the 50% sightability calculation, thepopulation estimate for the management zone is 42 goats, including 30 adults and 12juveniles.
Management zone 4-01Y consists of the portion of Management Unit 4-01 west ofCabin Creek. There is currently no goat hunting within this unit. A total of 6 goats(5 adults and 1 juvenile) were observed in this zone. The age class ratio was 20juveniles : 100 adults (Table 2). Using the 50% sightability calculation, thepopulation estimate for the management zone is 12 goats, including 10 adults and 2juveniles.
Wigwam River (M.U. 4-02)
A total of 25 goats were observed during this census flight. Of this total, 18 wereadults and 7 were juveniles. The age class ratio was 38 juveniles : 100 adults.Using the 68% sightability reported by Poole and Heard (1999) and Chicowski et. al(1994), the estimated goat population of the Management Unit is 36, comprised of26 adults and 10 juveniles. At the 30% sightability reported by Hebert and Langin,(1982) and Smith and Bovee, (1984), the estimated goat population for theManagement Unit is 83 goats, comprised of 60 adults and 23 juveniles (Table 3).The only goat management zone within the Management Unit is 4-02A. Themanagement estimate for the Management Unit (using 50% sightability) is 50 goats,comprised of 36 adults and 14 juveniles.
Table 3. Goat Inventory Data, M.U. 4-02 by LEH Zone.
Zone Observed 68% Sightability 50% Sightability(Management
Estimate)
30% Sightability
Adult Juvenile Total Adult Juvenile Total Adult Juvenile Total Adult Juvenile Total Juvenile: 100Auult
4-02A 18 7 25 26 10 36 36 14 50 60 23 83 38TOTAL 18 7 25 26 10 36 36 14 50 60 23 83 38
Bull River (M.U. 4-22)
A total of 342 goats were observed during this census flight. Of this total, 268 wereadults and 74 were juveniles. The age class ratio was 27 juveniles : 100 adults. At68% sightability, this equates to a population of 503 goats, of which 394 are adultsand 109 juveniles. At 30% sightability, the total population estimate is 1140 goats,consisting of 893 adults and 247 juveniles. The largest group of goats observed inthe Management Unit was 39. A total of 89 groups of goats were classified in theBull River drainage (Table 4).

2000 Southern East Kootenay Goat Aerial Survey
Page 5 Columbia basin Fish and Wildlife Compensation Program - B.C. Environment
Table 4. Goat Inventory Data, M.U. 4-22 by LEH Zone.
Zone Observed 68% Sightability 50% Sightability(Management
Estimate)
30% Sightability
Adult Juvenile Total Adult Juvenile Total Adult Juvenile Total Adult Juvenile Total Juvenile: 100Auult
4-22A 34 9 43 50 13 63 68 18 86 113 30 143 264-22B 34 6 40 50 9 59 68 12 80 113 20 133 174-22C 11 3 14 16 4 21 22 6 28 37 10 47 274-22D 44 9 53 65 13 78 88 18 106 147 30 177 204-22E 84 27 111 124 40 163 168 54 222 280 90 370 324-22F 36 11 47 53 16 69 72 22 94 120 37 157 304-22G 25 9 34 37 13 50 50 18 68 83 30 113 36TOTAL 268 74 342 394 109 503 536 148 684 893 247 1140 27
Goat management zone 4-22A consists of the land on the east side of the Bull Riverbetween the north side of Iron Creek and the south side of Sulphur Creek. A total of43 goats (34 adults and 9 juveniles) were observed in this zone. The age class ratiowas 26 juveniles : 100 adults (Table 4). Using the 68% sightability calculation, thepopulation estimate for the management zone is 63 goats, including 50 adults and 13juveniles. Using the 30% sightability calculation, the population estimate for themanagement zone is 143 goats, including 113 adults and 30 juveniles. Themanagement estimate for this zone (50% sightability) is 86 goats, consisting of 68adults and 18 juveniles.
Goat management zone 4-22B consists of the land between the north side ofTanglefoot Creek and the south side of Galbraith Creek. A total of 40 goats (34adults and 6 juveniles) were observed in this zone. The age class ratio was 18juveniles : 100 adults (Table 4). Using the 68% sightability calculation, thepopulation estimate for the management zone is 59 goats, including 50 adults and 9juveniles. Using the 30% sightability calculation, the population estimate for themanagement zone is 133 goats, including 113 adults and 20 juveniles. Themanagement estimate for this zone (50% sightability) is 80 goats (68 adults, 12juveniles).
Goat management zone 4-22C consists of the land on the west side of the Bull Riverfrom the north side of Quinn Creek to the height of land. A total of 14 goats (11adults and 3 juveniles) were observed in this zone. The age class ratio was 27juveniles : 100 adults (Table 4). Using the 68% sightability calculation, thepopulation estimate for the management zone is 21 goats, including 16 adults and 4juveniles. Using the 30% sightability calculation, the population estimate for themanagement zone is 47 goats, including 37 adults and 10 juveniles. Themanagement estimate for zone 4-22C is 28 goats (22 adults, 6 juveniles).
Goat management zone 4-22D consists of the east side of the Bull River from thenorth side of Norboe Creek to the height of land. A total of 53 goats (44 adults and9 juveniles) were observed in this zone. The age class ratio was 20 juveniles : 100

2000 Southern East Kootenay Goat Aerial Survey
Page 6 Columbia basin Fish and Wildlife Compensation Program - B.C. Environment
adults (Table 4). Using the 68% sightability calculation, the population estimate forthe management zone is 78 goats, including 65 adults and 13 juveniles. Using the30% sightability calculation, the population estimate for the management zone is177 goats, including 147 adults and 30 juveniles. The management estimate forzone 4-22D is 106 goats, using 50% sightability. This total includes 88 adults and18 juveniles.
Management zone 4-22E consists of the land on the east side of the Bull Riverbetween the north side of Sulphur Creek and the south side of Norboe Creek. Atotal of 111 goats (84 adults and 27 juveniles) were observed in this zone. The ageclass ratio was 32 juveniles : 100 adults (Table 4). Using the 68% sightabilitycalculation, the population estimate for the management zone is 163 goats,including 124 adults and 40 juveniles. Using the 30% sightability calculation, thepopulation estimate for the management zone is 370 goats, including 280 adults and90 juveniles. The management estimate for this zone (using 50% sightability) is222 goats, including 168 adults and 54 juveniles.
Management zone 4-22F consists of the land on the west side of the Bull Riverbetween the north side of Galbraith Creek and the south side of Quinn Creek. Atotal of 47 goats (36 adults and 11 juveniles) were observed in this zone. The ageclass ratio was 31 juveniles : 100 adults (Table 4). Using the 68% sightabilitycalculation, the population estimate for the management zone is 69 goats, including53 adults and 16 juveniles. Using the 30% sightability calculation, the populationestimate for the management zone is 157 goats, including 120 adults and 37juveniles. The management estimate for zone 4-22F is 94 goats, including 72 adultsand 22 juveniles.
Management zone 4-22G consists of the land in M.U. 4-22 south of Iron Creek, andincludes both Little and Big Sand Creeks. A total of 34 goats (25 adults and 9juvenile) were observed in this zone. The age class ratio was 36 juveniles : 100adults (Table 4). Using the 68% sightability calculation, the population estimate forthe management zone is 50 goats, including 37 adults and 13 juveniles. Using the30% sightability calculation, the population estimate for the management zone is113 goats, including 83 adults and 30 juveniles. The management estimate for thiszone is 68 goats, including 50 adults and 18 juveniles.
Elk River (M.U. 4-23)
Due to inclement weather, portions of this Management Unit were not flown, orwere flown in adverse conditions. In management zone 4-23B, the portion of thezone lying north of the confluence of Cadorna Creek and Abruzzi Creek, andmanagement zone 4-23C surrounding the Elk Lakes were not censused. Althoughthis is a small portion of the management zone, it is suspected that a significantnumber of goats occupy this area.
All of management zone 4-23E and a small portion of 4-23G were flown on a dayafter a fresh snowfall. Therefore, it is suspected that several goats were missed inthese areas and accurate population estimates are not possible, especially in 4-23E.
A total of 361 goats were observed during census flights. Of this total, 264 wereadults and 97 were juveniles. The age class ratio was 37 juveniles : 100 adults.Using the 68% sightability reported by Poole and Heard (1999) and Chicowski et. al

2000 Southern East Kootenay Goat Aerial Survey
Page 7 Columbia basin Fish and Wildlife Compensation Program - B.C. Environment
(1994), the estimated goat population of the Management Unit is 476, comprised of348 adults and 128 juveniles. At the 30% sightability reported by Hebert andLangin, (1982) and Smith and Bovee, (1984), the estimated goat population for theManagement Unit is 614 goats, comprised of 449 adults and 165 juveniles (Table5).
Table 5. Goat Inventory Data, M.U. 4-23 by LEH Zone.
Zone Observed 68% Sightability 50% Sightability(Management
Estimate)
30% Sightability
Adult Juvenile Total Adult Juvenile Total Adult Juvenile Total Adult Juvenile Total Juvenile: 100Auult
423A 81 27 108 119 40 159 162 54 216 270 90 360 33423B* 112 42 154 165 62 227 224 84 308 373 140 513 37423C* 12 6 18 18 9 27 24 12 36 40 20 60 50423E** 2 1 3 - - - 4 2 6 - - - 50423G** 16 6 22 24 9 33 32 12 44 53 20 73 37423J 38 13 51 56 19 75 76 26 102 127 43 170 34
423X** 4 1 5 5 - - 8 2 10 - - - 25TOTAL 264 97 361 388 143 531 530 192 722 880 323 1203 36
*Zone only partially surveyed** Zone (or a portion thereof) flown in inclement conditions)
Goat management zone 4-23 A consists of the land on the west side of the Elk Riverbetween the north side of Brule Creek and the south side of Bingay Creek. A totalof 108 goats (81 adults and 27 juveniles) were observed in this zone. The age classratio was 33 juveniles : 100 adults (Table 5). Using the 68% sightabilitycalculation, the population estimate for the management zone is 159 goats,including 119 adults and 40 juveniles. Using the 30% sightability calculation, thepopulation estimate for the management zone is 360 goats, including 270 adults and90 juveniles. The management estimate for zone 4-23A is 216 goats, of which 162are adults and 54 are juveniles.
Goat management zone 4-23B consists of the land on the west side of the Elk Riverfrom the north side of Bingay Creek to the south side of Cadorna Creek. A total of154 goats (112 adults and 42 juveniles) were observed in the surveyed portion ofthis zone, with some goats undoubtedly being missed in the unsurveyed portion.The age class ratio was 37 juveniles : 100 adults (Table 5). Using the 68%sightability calculation, the population estimate for the management zone is 227goats, including 165 adults and 62 juveniles. Using the 30% sightabilitycalculation, the population estimate for the management zone is 513 goats,including 373 adults and 140 juveniles. The management estimate (50%sightability) for this zone is 308 goats, consisting of 224 adults and 84 juveniles.
Goat management zone 4-23C consists of the land on the west side of the Elk Riverfrom the north side of Cadorna Creek to the height of land. A total of 18 goats (12adults and 6 juveniles) were observed in this zone. The age class ratio was 50juveniles : 100 adults (Table 5). Using the 68% sightability calculation, thepopulation estimate for the management zone is 27 goats, including 18 adults and 9juveniles. Using the 30% sightability calculation, the population estimate for themanagement zone is 60 goats, including 40 adults and 20 juveniles. Themanagement estimate for the surveyed portion of this zone is 36 goats, including 24

2000 Southern East Kootenay Goat Aerial Survey
Page 8 Columbia basin Fish and Wildlife Compensation Program - B.C. Environment
adults and 12 juveniles. A significant portion of this zone was not flown due toinclement weather, and several goats were undoubtedly not observed and classified.Therefore, population estimates should be interpreted with extreme caution.
Goat management zone 4-23E consists of the Henretta Creek drainage, the AldridgeCreek drainage and the Fording River drainage above the confluence of HenrettaCreek. This zone was surveyed after a fresh snowfall and the vast majority of thegoats within the zone were not observed. Therefore, population estimates are fartoo unreliable to describe for this area.
Management zone 4-23G consists of the land bordered between the south side ofEwin Creek, the north side of Line Creek, the east side of the Fording River and theB.C. - Alberta boundary. Small portions of this zone were surveyed duringinclement conditions and some goats were undoubtedly missed during censusflights. A total of 22 goats (16 adults and 6 juveniles) were observed in this zone.The age class ratio was 37 juveniles : 100 adults (Table 5). Using the 68%sightability calculation, the population estimate for the management zone is 33goats, including 24 adults and 9 juveniles. Using the 30% sightability calculation,the population estimate for the management zone is 73 goats, including 53 adultsand 20 juveniles. The management estimate for this zone is 44 goats, of which 32are adults and 12 are juveniles.
Management zone 4-23J consists of the land bordered between the south side ofBrule Creek, the North side of Lladner Creek and the west side of the Elk River. Atotal of 51 goats (38 adults and 13 juveniles) were observed in this zone. The ageclass ratio was 34 juveniles : 100 adults (Table 5). Using the 68% sightabilitycalculation, the population estimate for the management zone is 75 goats, including56 adults and 19 juveniles. Using the 30% sightability calculation, the populationestimate for the management zone is 170 goats, including 127 adults and 43juveniles. The management estimate for zone 4-23J is 102 goats, including 76adults and 26 juveniles.
Management zone 4-23X consists of the land bordered between the east side of theFording River, the south side of Henretta Creek and the north side of Ewin Creek.Prominent drainages within this unit include Todhunter and Chauncey Creeks. Thisunit was flown shortly after a fresh snowfall, and therefore goats may have goneunobserved during the census flight. There is currently no goat hunting within thisunit. A total of 5 goats (4 adults and 1 juvenile) were observed in this zone. Theage class ratio was 25 juveniles : 100 adults (Table 5). Due to the unreliability ofthe census flight, population estimates for this zone were not made.
DiscussionPopulation Estimates
Following is a discussion on each of the survey areas. Included is an analysis of thepopulations and population demographics of each area. For each survey area, fourpopulation estimates are provided. The first estimate is based on the number ofobserved goats and assumes the “Perfect Visibility”, and assumes that no goats weremissed from the censused sampling units during the aerial survey. At best, this canbe used as a minimum population estimate. The ‘68% Efficiency’ estimate is based
2000 Southern East Kootenay Goat Aerial Survey
Page 9 Columbia basin Fish and Wildlife Compensation Program - B.C. Environment
on the 68% observer efficiency in timbered habitats reported by Poole and Heard(1999) and Chicowski et al, 1994. This estimate was calculated by dividing theperfect visibility estimates by 0.68 to account for the estimated 32% of the goatsmissed during census flights. This estimate assumes that our observer efficiencywas similar to the listed surveys. The ‘30% Efficiency’ estimate is based on the30% observer efficiency reported by Hebert and Langin and Smith and Bovee. Thisestimate was calculated by dividing the perfect visibility estimates by 0.30 toaccount for the estimated 70% of the goats missed during census flights. Thisestimate assumes that our observer efficiency was similar to the listed surveys. Thisestimate should provide an upper population estimate for the survey areas. Themanagement estimate was calculated by dividing the number of goats observed by0.5 to account for the assumed sightability of 50%.
Management Units and Management ZonesFlathead River (4-01)
We believe that the population of 156 goats using perfect visibility underestimatesthe actual goat populations in the management unit and for all management zones aswell (Table 6). This is because the weather was hot and dry during the inventory,and some goats were undoubtedly missed either in timbered habitats, rough terrainand caves. Other goats may also have been across provincial or internationalboundaries at the time of the inventory. However, the estimated 510 goats using30% efficiency is probably an overestimate. We believe that the actual goatpopulation in M.U. 4-01 is probably between these two numbers. The 50%efficiency estimate (312) would be a conservative management estimate. Table 6shows population estimates by management zone based on three differentsightability correction values.
It is interesting to note that the population estimate for management zone 4-01 D iszero. This is a definite underestimate. This is because no goats were observed inthe area during the time of the census. This is probably due to the fact that much ofthe zone straddles the Continental Divide, the goats were probably in theneighboring province of Alberta during the census flight (Alberta was not surveyedand no goats were observed across the provincial boundary).
Management estimates of goat populations ranged from a low of 0 in zone D to ahigh of 70 in zone X. It is interesting to note that no goat hunting is allowed in zoneX. Management estimates for other zones are 66, 56, 66, 42 and 12 for zones A, B,C, E and Y respectively (Table 6).

2000 Southern East Kootenay Goat Aerial Survey
Page 10 Columbia basin Fish and Wildlife Compensation Program - B.C. Environment
Table 6. Population estimates using three methods, Flathead M.U. 4-01.
Management Zone Perfect Visibility 68% Efficiency 50% Efficiency(Management
Estimate)
30% Efficiency
401 A 33 49 66 110401 B 28 41 56 93401 C 33 48 66 110401 D 0 - - -401 E 21 27 42 60401 X 35 51 70 117401 Y 6 8 12 20Total 156 224 312 510
Wigwam River (4-02)
As there is only one goat management zone within M.U. 4-02, the discussion on thetotal goat population also pertains to goat management zone 4-02A.
We believe that the actual goat population in M.U. 4-02 is probably between theperfect visibility estimate and the 30% sightability estimate (Table 7). The 50%efficiency estimate (50) would be a conservative management estimate.
Table 7. Population estimates using three methods, Wigwam M.U. 4-02.
Management Zone Perfect Visibility 68% Efficiency 50% Efficiency(Management
Estimate)
30% Efficiency
402 A 25 36 50 83Total 25 36 50 83
Bull River (M.U. 4-22)
The actual goat population of the unit is probably between the perfect visibilityestimate (342) and the 30% sightability estimate (1140). The estimate of 684 goatsusing the 50% sightability estimate is a good conservative management estimate.
Management estimates for zones ranged from a low of 28 goats in 4-22C to a highof 222 goats in 4-22E. Population estimates for Management Zones 4-22A, 4-22 Band 4-22D were 86, 80 and 106 respectively, while estimates for zones 4-22F and 4-22G were 94 and 68 goats respectively.

2000 Southern East Kootenay Goat Aerial Survey
Page 11 Columbia basin Fish and Wildlife Compensation Program - B.C. Environment
Table 8. Population estimates using three methods, Bull River M.U. 4-22.
Zone Perfect Visibility 68% Sightability 50% Sightability(Management Estimate)
30% Sightability Juvenile:100 Adult
Zone4-22A 43 63 86 143 264-22B 40 59 80 133 174-22C 14 21 28 47 274-22D 53 78 106 177 204-22E 111 163 222 370 324-22F 47 69 94 157 304-22G 34 50 68 113 36TOTAL 342 503 684 1140 27
Elk River (M.U. 4-23)
Some areas within this Management Unit were only partially surveyed, and somewere surveyed in adverse conditions, and some goats undoubtedly went unseenduring census flights as well. In addition, there are some areas where no goathunting is currently allowed that were also not surveyed. As is the case for othersurveyed Management units, we feel that the 30% efficiency population (1203)probably overestimates goat populations within the surveyed area. We believe thata good conservative management estimate of goat populations can be made usingthe 50% efficiency calculation (an estimated 722 goats). Table 9 shows populationestimates by management zone based on three different methods.
No population estimates were made for management zone 4-23 E, as the area wasflown during adverse conditions. No estimate was made for the areas with nocurrent goat hunting opportunities as well for the same reason. It should be furthernoted that the population estimate for management zones 4-23 B, 4-23 C and 4-23 Gare based on partial surveys only. Approximately 85% of zone B, 33% of zone Cand 60% of zone G was surveyed. Had the entire zones been surveyed, the resultingpopulation estimates for these zones would undoubtedly be higher.
Management estimates of goat populations ranged from a low of 36 in zone C(partial survey) to a high of 308 in zone B (partial survey). Management estimatesfor other zones are 216, 44, and 102 for A, G, and J respectively (Table 9).

2000 Southern East Kootenay Goat Aerial Survey
Page 12 Columbia basin Fish and Wildlife Compensation Program - B.C. Environment
Table 9. Population estimates using three methods, Elk Valley M.U. 4-23 (survey area only).
Management Zone Perfect Visibility 68% Efficiency 50% Efficiency(Management
Estimate)
30% Efficiency
423 A 108 159 216 360423 B* 154 227 308 513423 C* 18 27 36 60423 E** - - - -423 G** 22 33 44 73423 J 51 75 102 170
423 X** - - - -Total 361 531 722 1203
*Zone only partially surveyed** Zone (or a portion thereof) flown in adverse conditions)
Overall PopulationsThe total conservative management estimated goat population for the combinedsurvey area is 1768 goats. The highest estimated goat population is in ManagementUnit 4-23, with an estimate of 722 goats (partial survey), or approximately 40% ofthe total goat population for the survey area. Management Unit 4-22 had the secondhighest estimated goat population, with 684 goats. The lowest estimated goatpopulation was 50 in Management Unit 4-02.
Adult : Juvenile RatiosThe adult to juvenile ratio for the study area was 33 juveniles per 100 adults, orjuveniles made up 25% of the goat population. The proportion of juvenilesobserved (25%) was equivalent to the percent juveniles observed duringsummer/early fall surveys in the Robson Valley (Poole and Heard, 1999), andhigher than the 17 - 18% found during surveys in the Babine Mountains (Cichowskiet al. 1994), 19% found in the Hazelton Mountains (Demarchi et al. 1997), 15-23%in interior BC (McCrory 1979), and 21% for interior B.C. (Hebert and Woods1984). However, direct comparisons may not be valid because juvenile estimatesvary with survey techniques and time of year (Fiesta-Bianchet et al. 1994). In anyevent, it appears that late summer - fall recruitment rates of juvenile goats appearsto be satisfactory to maintain and increase this goat herd. The adult to juvenile ratiovaried between management unit. The highest percentage of juveniles was found inManagement Unit 4-02 (Wigwam River) at 28%, followed closely by ManagementUnit 4-23 (Elk Valley) with 26% and Management Unit 4-01 (Flathead River) at27%. The lowest percentage of juveniles was found in Management Unit 4-22 (BullRiver) at 21%. However, it should be noted that this percentage is still higher thanmost other recently recorded goat inventories within the province of BritishColumbia. Goat management zones 4-22B and 4-22D had a lower juvenile to adultratio in the observed population than the majority of the inventory area at 17:100and 20:100 respectively. It is unknown why these ratios are lower than the rest ofthe inventory area.

2000 Southern East Kootenay Goat Aerial Survey
Page 13 Columbia basin Fish and Wildlife Compensation Program - B.C. Environment
Comparison With Past SurveysSeveral previous goat surveys have been undertaken within the inventory areabetween 1977 and 1991 (Table 10). However, caution should be exercised incomparing these previous data with the results of the 2000 inventory. It is unknownif previous results encompassed the entire management zone, and at what intensitythe surveys were flown.
Table 10. Number of goats observed on previous summer inventories by zone and year.
Census Unit Year Adult Juveniles Total % Juvenile4-01A 1991 47 12 59 204-01A 2000 23 10 33 304-01B 1982 67 22 89 254-01B 1990 38 11 49 224-01B 2000 22 6 28 214-01C 1980 22 8 30 274-01C 1982 77 20 97 214-01C 1990 19 4 23 174-01C 2000 24 9 33 274-01D 1980 25 15 40 384-01D 1982 12 2 14 144-01D 2000 - - - -4-23B 1982 575 132 707 194-23B 1983 465 90 555 164-23B 1985 52 6 58 104-23B 1986 302 14 316 44-23B 1989 259 35 294 124-23B 2000 112 42 154 274-23C 1989 27 4 31 134-23C 2000 27 4 31 134-23J 1982 17 7 24 294-23J 2000 38 13 51 254-22B 1991 8 1 9 114-22B 2000 34 6 40 154-22C 1977 20 6 26 234-22C 2000 11 3 14 214-22E 1977 26 16 42 384-22E 1982 61 20 81 254-22E 2000 84 27 111 244-22F 1982 75 18 93 194-22F 1991 35 8 43 194-22F 2000 36 11 47 23
Goat populations in Management Unit 4-01 appear to be declining in comparisonwith past goat aerial surveys. In goat management zone 4-01A, a total of 59 goatswere observed in a 1991 survey, as compared to 33 in 2000. However, it should benoted that the percentage of juveniles in the population has increased from 20% in1991 to 30% in 2000. Goat populations in management zone 4-01B have been

2000 Southern East Kootenay Goat Aerial Survey
Page 14 Columbia basin Fish and Wildlife Compensation Program - B.C. Environment
surveyed twice in the past, with 89 goats being observed in 1982 and 49 in 1990.This number has declined to 28 in 2000. The percentage of juveniles in thepopulation for these surveys were 25%, 22% and 21% for 1982, 1990 and 2000respectively. Management zone 4-01C has been surveyed three times previous to2000. A total of 30, 97 and 23 goats were counted in 1980, 1982 and 1990respectively. In 2000, a total of 33 goats were observed, which was higher than allsurvey years except 1982. No goats were observed in management zone 4-01Dduring the 2000 survey. A total of 40 and 14 goats were counted in this zone in1980 and 1982 respectively. Data from previous surveys for this management unitshould be viewed with caution. It is possible that these previous inventories alsoincluded a portion of the province of Alberta, which would increase the count.
In most cases, goat populations appear to be declining in Management Unit 4-23 aswell. Management zone 4-23B has been one of the more intensively surveyed areasin past years, with 707, 555, 316 and 294 goats being observed in 1982, 1983, 1986and 1989 respectively. This declining trend continued to 2000, with 154 goatsbeing counted. It should be noted, however, that the 2000 survey only encompassedapproximately 85% of the management zone. It is also interesting to note that the27% juveniles in the population is significantly higher than any other recorded levelwithin this zone. One previous goat survey has been undertaken in managementzone 4-23C in 1989, with 31 goats being observed. A partial survey (approximately60% of the zone) in 2000 resulted in 18 goats being counted. Due to the small areassurveyed, a valid comparison between the two areas is not possible. A previousgoat inventory was undertaken in management zone 4-23J in 1982, with a total of 24goats being counted. In 2000, a total of 51 goats were observed. It is unknown,however, if the 1982 inventory was completed over the entire management zone.
Results from Management Unit 4-22 are difficult to interpret. The mosttroublesome fact is that it is unknown whether or not the entire management zoneswere surveyed on these previous flights. Therefore, the comparisons should bemade with caution. Management zone 4-22B was previously surveyed in 1991, witha total of 9 goats being observed. This compares to a total of 40 goats beingcounted in 2000. Management zone 4-22C was previously surveyed in 1977, with atotal of 26 goats being counted. During the 2000 survey, 14 animals wereclassified. Management zone 4-22E was previously surveyed in 1977 and 1982,with 42 and 81 goats being counted respectively. This number increased to 111during the 2000 goat survey. Management zone 4-22F was previously surveyed in1982 and 1991. A total of 93 and 43 animals were counted on these inventoriesrespectively. This compares to a total of 47 goats counted during the 2000inventory. It appears that the goat population in this zone is below 1982 levels, butcomparable to 1991 levels, assuming that the entire zones were surveyed duringprevious flights.
ConclusionsAlthough comparisons between previous surveys are difficult, it appears that goatpopulations have declined over much of the survey area. The most notablereduction appears to be in 4-23B, where 707 goats were observed in 1982, ascompared to 154 in 2000.

2000 Southern East Kootenay Goat Aerial Survey
Page 15 Columbia basin Fish and Wildlife Compensation Program - B.C. Environment
The % juveniles within the population appears to be healthy. In fact, these numbersare higher than most other recent inventories within the province. This possiblysuggests a recovery of the goat populations.
Literature CitedCHICHOWSKI, D. B., D. HAAS, AND G. SCHULTZE. 1994. A method used forestimating mountain goat numbers in the Babine Mountains Recreation Area,British Columbia. Biennial Symposium of the Northern Wild Sheep and GoatCouncil 9:56-64.
DEMARCHI, M. W., S. R. JOHNSON, AND G. F. SEARING. 1997. Mountaingoat inventory in the Nisga’a Wildlife Management Area Region A. Unpublishedreport submitted to BC Environment, Lands and Parks, Smithers.
FESTA-BIANCHET, M., M. URQUHART, AND K. G. SMITH. 1994. Mountaingoat recruitment: kid production and survival to breeding age. Canadian Journal ofZoology 72:22-27.
HEBERT, D. M., AND H. D. LANGIN. 1982. Mountain goat inventory andharvest strategies: a reevaluation. Biennial Symposium of the Northern Wild Sheepand Goat Council 3:339-350.
HEBERT, D., AND T. SMITH. 1986. Mountain goat management in BritishColumbia. Biennial Symposium of the Northern Wild Sheep and Goat Council5:48-58.
HEBERT, D., AND R. WOODS. 1984. A preliminary analysis of intensive,unreplicated survey data for mountain goat populations in British Columbia.Biennial Symposium of the Northern Wild Sheep and Goat Council 4:506-513.
McCRORY, W. P. 1979. An inventory of the mountain goats of Glacier and MountRevelstoke National Parks, British Columbia. Unpublished report. Parks Canada,Western Region, Glacier National Park, Revelstoke, B.C.
POOLE, K. G., AND D. HEARD. 1999. Mountain Goat Inventory in the RobsonValley, British Columbia (unpublished). Ministry of Environment, Lands and Parks,Prince George, B.C.
RESOURCE INVENTORY COMMITTEE. 1997. Standardized inventorymethodologies for components of British Columbia’s biodiversity: aerial-basedinventory techniques for selected ungulates, bison, mountain goat, mountain sheep,goats, elk, deer and caribou. Version 1.1. Resources Inventory Committee, BCMinistry of Environment, Lands and Parks, Victoria.
SMITH, C. A. 1984. Evaluation and management implications of long-term trendsin coastal mountain goat populations in southeastern Alaska. Biennial Symposiumof the Northern Wild Sheep and Goat Council 4:395-424.
SMITH, C. A., AND K. T. BOVEE. 1984. A mark-recapture census and densityestimate for a coastal mountain goat population. Biennial Symposium of theNorthern Wild Sheep and Goat Council 4:487-498.

2000 Southern East Kootenay Goat Aerial Survey
Page 16 Columbia basin Fish and Wildlife Compensation Program - B.C. Environment
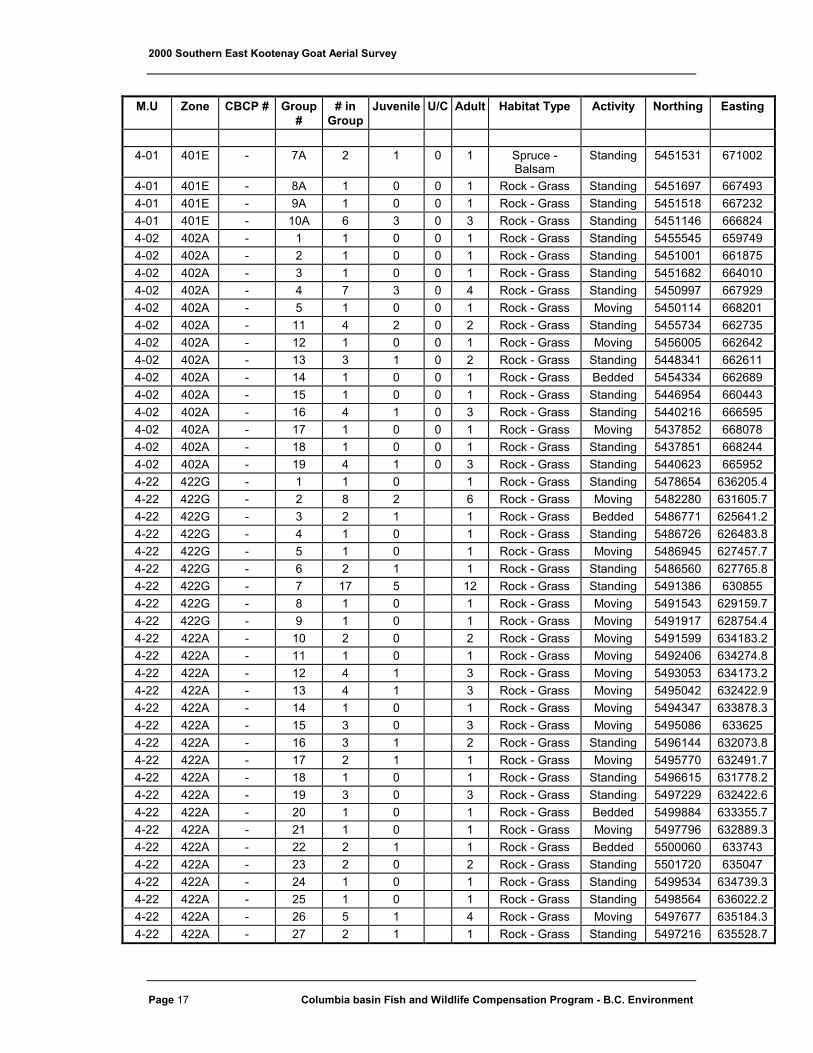
AppendixAppendix 1. Raw Data, 2000 Southern East Kootenay Goat Inventory
M.U Zone CBCP # Group#
# inGroup
Juvenile U/C Adult Habitat Type Activity Northing Easting
4-01 401A - 1 1 0 0 1 Rock - Grass Moving 5432017 702318.74-01 401A - 2 2 0 0 2 Rock - Grass Moving 5431225 702524.94-01 401A - 3 1 0 0 1 Rock - Grass Standing 5432635 702021.64-01 401A - 4 3 1 0 2 Rock - Grass Standing 5433431 701581.74-01 401A - 5 1 0 0 1 Rock - Grass Standing 5435468 698920.24-01 401A - 6 6 3 0 3 Rock - Grass Standing 5435692 703889.54-01 401A - 7 2 1 0 1 Rock - Grass Standing 5434988 704561.44-01 401A - 8 1 0 0 1 Spruce -
BalsamStanding 5436199 705989.6
4-01 401A - 9 1 0 0 1 Rock - Grass Bedded 5432825 712008.24-01 401A - 10 7 3 0 4 Rock - Grass Standing 5430553 704928.14-01 401A - 11 1 0 0 1 Rock - Grass Standing 5430451 704241.64-01 401A - 12 5 2 0 3 Rock - Grass Standing 5430802 702855.34-01 401A - 13 2 0 0 2 Rock - Grass Standing 5439247 695041.24-01 401B - 14 2 1 0 1 Rock - Grass Standing4-01 401B - 15 1 0 0 1 Rock - Grass Standing 5440258 695554.54-01 401B - 16 2 1 0 1 Rock - Grass Standing4-01 401B - 17 2 0 0 2 Rock - Grass Standing 5448056 688860.34-01 401B - 18 1 0 0 1 Rock - Grass Moving 5449537 690210.14-01 401B - 19 2 1 0 1 Rock - Grass Standing 5450925 691666.54-01 401B - 20 16 3 0 13 Rock - Grass Standing 5454793 689157.24-01 401B - 21 1 0 0 1 Rock - Grass Moving 5454303 687807.14-01 401B - 22 1 0 0 1 Rock - Grass Moving 5456053 688212.24-01 401C - 23 1 0 0 1 Rock - Grass Bedded 5457950 689786.74-01 401C - 24 1 0 0 1 Rock - Grass Standing 5460469 682727.74-01 401C - 25 3 1 0 2 Rock - Grass Standing 5461137 683726.54-01 401C - 26 1 0 0 1 Rock - Grass Standing 5463607 681676.44-01 401C - 27 2 1 0 1 Rock - Grass Standing 5463083 681522.94-01 401C - 28 1 0 0 1 Rock - Grass Standing 5463735 682272.84-01 401C - 29 4 1 0 3 Rock - Grass Moving 5463795 680941.84-01 401C - 30 16 6 0 10 Rock - Grass Standing 5467014 682101.84-01 401C - 31 4 0 0 4 Rock - Grass Moving 5466982 681317.54-01 401X - 32 11 4 0 7 Spruce -
BalsamStanding 5467170 672407.4
4-01 401X - 33 1 0 0 1 Rock - Grass Standing 5467334 672416.14-01 401X - 34 5 1 0 4 Spruce -
BalsamStanding 5464527 672887.4
4-01 401X - 35 16 5 0 11 Rock - Grass Standing 5462472 669020.64-01 401X - 36 6 2 0 4 Rock - Grass Standing 5460752 671540.94-01 401E - 37 2 0 0 2 Rock - Grass Standing 5456126 673265.34-01 401E - 38 3 0 3 0 Rock - Grass Standing 5455372 664886.14-01 401E - 16A 4 1 0 3 Rock - Grass Standing 5452081 671060.94-01 401E - 6A 2 1 0 1 Spruce -
BalsamStanding 5448822 670652
2000 Southern East Kootenay Goat Aerial Survey
Page 17 Columbia basin Fish and Wildlife Compensation Program - B.C. Environment
M.U Zone CBCP # Group#
# inGroup
Juvenile U/C Adult Habitat Type Activity Northing Easting
4-01 401E - 7A 2 1 0 1 Spruce -Balsam
Standing 5451531 671002
4-01 401E - 8A 1 0 0 1 Rock - Grass Standing 5451697 6674934-01 401E - 9A 1 0 0 1 Rock - Grass Standing 5451518 6672324-01 401E - 10A 6 3 0 3 Rock - Grass Standing 5451146 6668244-02 402A - 1 1 0 0 1 Rock - Grass Standing 5455545 6597494-02 402A - 2 1 0 0 1 Rock - Grass Standing 5451001 6618754-02 402A - 3 1 0 0 1 Rock - Grass Standing 5451682 6640104-02 402A - 4 7 3 0 4 Rock - Grass Standing 5450997 6679294-02 402A - 5 1 0 0 1 Rock - Grass Moving 5450114 6682014-02 402A - 11 4 2 0 2 Rock - Grass Standing 5455734 6627354-02 402A - 12 1 0 0 1 Rock - Grass Moving 5456005 6626424-02 402A - 13 3 1 0 2 Rock - Grass Standing 5448341 6626114-02 402A - 14 1 0 0 1 Rock - Grass Bedded 5454334 6626894-02 402A - 15 1 0 0 1 Rock - Grass Standing 5446954 6604434-02 402A - 16 4 1 0 3 Rock - Grass Standing 5440216 6665954-02 402A - 17 1 0 0 1 Rock - Grass Moving 5437852 6680784-02 402A - 18 1 0 0 1 Rock - Grass Standing 5437851 6682444-02 402A - 19 4 1 0 3 Rock - Grass Standing 5440623 6659524-22 422G - 1 1 0 1 Rock - Grass Standing 5478654 636205.44-22 422G - 2 8 2 6 Rock - Grass Moving 5482280 631605.74-22 422G - 3 2 1 1 Rock - Grass Bedded 5486771 625641.24-22 422G - 4 1 0 1 Rock - Grass Standing 5486726 626483.84-22 422G - 5 1 0 1 Rock - Grass Moving 5486945 627457.74-22 422G - 6 2 1 1 Rock - Grass Standing 5486560 627765.84-22 422G - 7 17 5 12 Rock - Grass Standing 5491386 6308554-22 422G - 8 1 0 1 Rock - Grass Moving 5491543 629159.74-22 422G - 9 1 0 1 Rock - Grass Moving 5491917 628754.44-22 422A - 10 2 0 2 Rock - Grass Moving 5491599 634183.24-22 422A - 11 1 0 1 Rock - Grass Moving 5492406 634274.84-22 422A - 12 4 1 3 Rock - Grass Moving 5493053 634173.24-22 422A - 13 4 1 3 Rock - Grass Moving 5495042 632422.94-22 422A - 14 1 0 1 Rock - Grass Moving 5494347 633878.34-22 422A - 15 3 0 3 Rock - Grass Moving 5495086 6336254-22 422A - 16 3 1 2 Rock - Grass Standing 5496144 632073.84-22 422A - 17 2 1 1 Rock - Grass Moving 5495770 632491.74-22 422A - 18 1 0 1 Rock - Grass Standing 5496615 631778.24-22 422A - 19 3 0 3 Rock - Grass Standing 5497229 632422.64-22 422A - 20 1 0 1 Rock - Grass Bedded 5499884 633355.74-22 422A - 21 1 0 1 Rock - Grass Moving 5497796 632889.34-22 422A - 22 2 1 1 Rock - Grass Bedded 5500060 6337434-22 422A - 23 2 0 2 Rock - Grass Standing 5501720 6350474-22 422A - 24 1 0 1 Rock - Grass Standing 5499534 634739.34-22 422A - 25 1 0 1 Rock - Grass Standing 5498564 636022.24-22 422A - 26 5 1 4 Rock - Grass Moving 5497677 635184.34-22 422A - 27 2 1 1 Rock - Grass Standing 5497216 635528.7

2000 Southern East Kootenay Goat Aerial Survey
Page 18 Columbia basin Fish and Wildlife Compensation Program - B.C. Environment
M.U Zone CBCP # Group#
# inGroup
Juvenile U/C Adult Habitat Type Activity Northing Easting
4-22 422A - 28 4 2 2 Rock - Grass Moving 5495085 636527.94-22 422E 4-22-54 29 1 0 1 Rock - Grass Moving 5496412 643048.44-22 422E 4-22-54 30 39 11 28 Rock - Grass Moving 5499324 643762.94-22 422E 4-22-54 31 1 0 1 Rock - Grass Standing 5500143 643570.54-22 422E 4-22-54 32 28 7 21 Rock - Grass Moving 5508727 637532.14-22 422E 4-22-54 33 2 0 2 Rock - Grass Standing 5507549 635484.64-22 422E 4-22-54 34 1 0 1 Rock - Grass Standing 5509112 636161.44-22 422E 4-22-54 35 1 0 1 Rock - Grass Bedded 5514976 635020.94-22 422E 4-22-54 36 1 0 1 Rock - Grass Standing 5517520 636770.64-22 422E 4-22-54 37 1 0 1 Rock - Grass Moving 5517744 635274.44-22 422E 4-22-54 38 7 1 6 Rock - Grass Moving 5520029 635822.94-22 422E 4-22-54 39 8 3 5 Rock - Grass Moving 5520303 635888.44-22 422E 4-22-54 40 3 1 2 Rock - Grass Moving 5522545 635824.14-22 422E 4-22-54 41 2 0 2 Rock - Grass Moving 5524030 634935.24-22 422E 4-22-54 42 3 1 2 Rock - Grass Moving 5542032 636540.44-22 422E 4-22-54 43 3 0 3 Rock - Grass Moving 5551802 640099.14-22 422D 4-22-59 44 1 0 1 Rock - Grass Moving 5552435 633141.14-22 422D 4-22-50 45 1 0 1 Rock - Grass Moving 5538848 626117.74-22 422D 4-22-50 46 25 5 20 Rock - Grass Moving 5537753 630339.64-22 422B 4-22-52 47 7 1 6 Rock - Grass Moving 5507811 616281.44-22 422B 4-22-52 48 1 0 1 Rock - Grass Moving 5506616 617986.34-22 422B 4-22-52 49 1 0 1 Rock - Grass Moving 5509591 619544.84-22 422B 4-22-52 50 3 1 2 Rock - Grass Moving 5507934 616571.74-22 422B 4-22-52 51 1 0 1 Rock - Grass Moving 5508252 610476.54-22 422B 4-22-52 52 1 0 1 Rock - Grass Standing 5514950 613660.64-22 422B 4-22-52 53 2 0 2 Rock - Grass Standing 5516673 6136404-22 422B 4-22-52 54 1 0 1 Rock - Grass Moving 5520680 613449.14-22 422B 4-22-52 55 1 0 1 Rock - Grass Standing 5516907 615368.64-22 422B 4-22-52 56 6 0 6 Rock - Grass Moving 5520389 618552.34-22 422B 4-22-52 57 5 2 3 Rock - Grass Standing 5519165 618773.94-22 422B 4-22-52 58 3 0 3 Rock - Grass Standing 5518988 619036.24-22 422B 4-22-52 59 8 2 6 Rock - Grass Moving 5518933 620034.94-22 422F 4-22-68 60 1 0 1 Rock - Grass Moving 5513602 629529.54-22 422F 4-22-68 61 1 0 1 Rock - Grass Moving 5513034 628075.14-22 422F 4-22-68 62 2 1 1 Rock - Grass Moving 5519122 625018.34-22 422F 4-22-49 63 5 1 4 Rock - Grass Moving 5527175 619978.44-22 422F 4-22-49 64 1 0 1 Rock - Grass Bedded 5523841 619894.14-22 422F 4-22-49 65 3 0 3 Rock - Grass Standing 5525412 618854.54-22 422F 4-22-49 66 2 0 2 Rock - Grass Standing 5531161 619746.74-22 422F 4-22-49 67 3 1 2 Rock - Grass Standing 5531460 619802.54-22 422F 4-22-49 68 1 0 1 Rock - Grass Bedded 5531585 619490.24-22 422F 4-22-49 69 1 0 1 Rock - Grass Standing 5532547 619030.64-22 422F 4-22-49 70 15 6 9 Rock - Grass Standing 5533413 619991.44-22 422F 4-22-49 71 1 0 1 Rock - Grass Moving 5533793 6186924-22 422F 4-22-49 72 2 0 2 Rock - Grass Standing 5534617 6190524-22 422F 4-22-49 73 4 1 3 Rock - Grass Standing 5534436 620059.74-22 422F 4-22-49 74 2 0 2 Rock - Grass Moving 5538164 618128.7

2000 Southern East Kootenay Goat Aerial Survey
Page 19 Columbia basin Fish and Wildlife Compensation Program - B.C. Environment
M.U Zone CBCP # Group#
# inGroup
Juvenile U/C Adult Habitat Type Activity Northing Easting
4-22 422F 4-22-49 75 1 0 1 Rock - Grass Moving 5538060 618516.64-22 422F 4-22-49 76 2 1 1 Rock - Grass Standing 5541174 617972.24-22 422C - 77 2 0 2 Rock - Grass Standing 5536693 623942.34-22 422C - 78 2 1 1 Rock - Grass Moving 5536950 624123.84-22 422C - 79 3 0 3 Rock - Grass Bedded 5533398 624334.94-22 422C - 80 1 0 1 Rock - Grass Bedded 5532109 625395.14-22 422C - 81 5 2 3 Rock - Grass Standing 5530462 624172.84-22 422C - 82 1 0 1 Rock - Grass Moving 5530412 625521.54-22 422D - 83 3 0 3 Rock - Grass Moving 5530422 625686.34-22 422D - 84 2 0 2 Rock - Grass Moving 5528259 627029.94-22 422D 4-22-50 85 4 0 4 Rock - Grass Standing 5530697 6298304-22 422D - 86 17 4 13 Rock - Grass Moving 5537543 629254.54-22 422E 4-22-54 87 1 0 1 Rock - Grass Bedded 5532602 636651.34-22 422E 4-22-54 88 5 2 3 Rock - Grass Moving 5533900 636435.94-22 422E 4-22-54 89 4 1 3 Rock - Grass Moving 5532130 638944.94-23 423J 4-23-53 1 1 0 1 Rock - Grass Bedded 5515627 637521.64-23 423J 4-23-53 2 3 1 2 Rock - Grass Moving 5519603 636822.24-23 423J 4-23-53 3 12 5 7 Rock - Grass Standing 5518522 643044.94-23 423J 4-23-53 4 5 1 4 Rock - Grass Moving 5518765 642310.44-23 423J 4-23-52 5 18 5 13 Rock - Grass Standing 5517924 640824.84-23 423J 4-23-52 6 1 0 1 Rock - Grass Moving 5518213 640514.84-23 423J 4-23-52 7 5 0 5 Rock - Grass Standing 5520228 640339.34-23 423J 4-23-52 8 1 0 1 Rock - Grass Standing 5518369 639874.54-23 423J 4-23-52 9 1 0 1 Rock - Grass Standing 5518225 637912.34-23 423J 4-23-52 10 3 1 2 Rock - Grass Moving 5520644 638047.64-23 423J 4-23-52 11 1 0 1 Rock - Grass Standing 5520814 638084.54-23 423A 4-23-52 12 2 0 2 Rock - Grass Standing 5523969 639471.64-23 423A 4-23-52 13 2 0 2 Rock - Grass Moving 5524787 640565.74-23 423A 4-23-50 14 2 1 1 Rock - Grass Bedded 5526659 640894.44-23 423A 4-23-50 15 3 2 1 Rock - Grass Bedded 5528478 639381.14-23 423A 4-23-50 16 2 0 2 Rock - Grass Moving 5532614 645375.14-23 423A 4-23-50 17 1 0 1 Rock - Grass Standing 5532516 6408454-23 423A 4-23-48 18 4 2 2 Rock - Grass Standing 5540187 641316.34-23 423A 4-23-48 19 1 0 1 Rock - Grass Bedded 5539691 640057.54-23 423A 4-23-48 20 9 3 6 Rock - Grass Standing 5545005 638715.14-23 423A 4-23-48 21 6 2 4 Rock - Grass Standing 5543960 640264.64-23 423A 4-23-48 22 1 0 1 Rock - Grass Standing 5546500 6429744-23 423A 4-23-48 23 1 0 1 Rock - Grass Moving 5546337 642243.14-23 423A 4-23-48 24 13 5 8 Rock - Grass Standing 5546221 639810.64-23 423A 4-23-47 25 1 0 1 Rock - Grass Standing 5550956 643548.64-23 423A 4-23-47 26 1 0 1 Rock - Grass Bedded 5551213 643353.64-23 423A 4-23-47 27 3 0 3 Rock - Grass Standing 5552765 643148.24-23 423A 4-23-47 28 30 6 24 Rock - Grass Moving 5553190 643313.14-23 423A 4-23-47 29 3 1 2 Rock - Grass Moving 5555445 642003.14-23 423A 4-23-46 30 3 0 3 Rock - Grass Standing 5557463 638344.64-23 423A 4-23-46 31 5 2 3 Rock - Grass Moving 5558390 638662.44-23 423A 4-23-46 32 2 0 2 Rock - Grass Standing 5559601 637885.9

2000 Southern East Kootenay Goat Aerial Survey
Page 20 Columbia basin Fish and Wildlife Compensation Program - B.C. Environment
M.U Zone CBCP # Group#
# inGroup
Juvenile U/C Adult Habitat Type Activity Northing Easting
4-23 423A 4-23-46 33 7 2 5 Rock - Grass Standing 5563501 636039.34-23 423A 4-23-46 34 4 1 3 Rock - Grass Standing 5564759 636122.14-23 423A 4-23-46 35 2 0 2 Rock - Grass Bedded 5564900 6355524-23 423B 4-23-46 36 3 0 3 Rock - Grass Standing 5568808 634466.34-23 423B 4-23-45 37 11 7 4 Rock - Grass Standing 5567428 638184.44-23 423B 4-23-45 38 21 4 17 Rock - Grass Standing 5568561 638170.44-23 423B 4-23-45 39 6 2 4 Rock - Grass Standing 5569687 637083.64-23 423B 4-23-45 40 1 0 1 Rock - Grass Moving 5569872 635426.44-23 423B 4-23-45 41 1 0 1 Rock - Grass Bedded 5570961 635697.74-23 423B 4-23-45 42 2 1 1 Rock - Grass Bedded 5572499 635043.54-23 423B 4-23-45 43 14 4 10 Rock - Grass Moving 5575075 637459.14-23 423B 4-23-45 44 18 6 12 Rock - Grass Standing 5573461 640683.14-23 423B 4-23-45 45 17 5 12 Rock - Grass Standing 5574259 638560.74-23 423B 4-23-45 46 6 1 5 Rock - Grass Standing 5576499 638272.34-23 423B 4-23-45 47 1 0 1 Rock - Grass Bedded 5577434 638336.14-23 423B 4-23-45 48 2 0 2 Rock - Grass Standing 5580152 637461.14-23 423B 4-23-44 49 21 6 15 Rock - Grass Standing 5577164 641857.84-23 423B 4-23-40 50 14 4 10 Rock - Grass Moving 5583232 643541.54-23 423B 4-23-40 51 1 0 1 Rock - Grass Standing 5583237 643099.54-23 423B 4-23-39 52 4 1 3 Rock - Grass Standing 5586294 6432484-23 423B 4-23-39 53 1 0 1 Rock - Grass Standing 5586628 643263.94-23 423B 4-23-39 54 1 0 1 Rock - Grass Standing 5586901 643261.44-23 423B 4-23-39 55 2 0 2 Rock - Grass Standing 5587514 643225.74-23 423B 4-23-39 56 1 0 1 Rock - Grass Bedded 5585662 639188.84-23 423B 4-23-39 57 3 1 2 Rock - Grass Moving 5585184 6385444-23 423B 4-23-39 58 1 0 1 Rock - Grass Standing 5586506 638832.44-23 423B 4-23-39 59 2 0 2 Rock - Grass Moving 5587357 640561.34-23 423C 4-23-37 60 1 0 1 Rock - Grass Standing 5592640 641894.54-23 423C 4-23-37 61 8 3 5 Rock - Grass Moving 5593870 640956.14-23 423C 4-23-37 62 9 3 6 Rock - Grass Standing 5595692 639536.94-23 423G 4-23-64 63 4 1 3 Rock - Grass Standing4-23 423G 4-23-64 64 1 0 1 Rock - Grass Standing4-23 423G 4-23-64 65 3 1 2 Rock - Grass Moving4-23 423G 4-23-64 66 1 0 1 Rock - Grass Standing4-23 423G 4-23-64 67 6 3 3 Rock - Grass Moving4-23 423G 4-23-64 68 1 0 1 Rock - Grass Moving4-23 423G 4-23-67 69 3 0 3 Rock - Grass Moving 5531210 657647.54-23 423G 4-23-67 70 1 0 1 Rock - Grass Bedded 5530541 657647.14-23 423G 4-23-64 71 2 1 1 Rock - Grass Moving 5533071 655283.44-23 423G 4-23-64 72 3 1 2 Rock - Grass Moving 5537289 654882.84-23 423X 4-23-55 73 2 0 2 Rock - Grass Moving 5548490 663936.14-23 423E 4-23-61 74 3 2 1 Rock - Grass Moving 5569092 656303.9