2000 new york state grade 8 english/language arts ... · 1 1. test design similar to the 1999 form,...
TRANSCRIPT
2000 New York State Grade 8 English/Language Arts Statewide Assessment
Technical Report

New York State Grade 8 English/Language Arts Statewide Assessment
Table of Contents
1. TEST DESIGN .......................................................................................................................... 12. A SCALING SAMPLE................................................................................................................ 2
2.1 Screening........................................................................................................................... 22.2 State data available for sampling ..................................................................................... 32.3 Selection of a scaling sample ............................................................................................ 32.4 Item analysis on the scaling sample.................................................................................. 32.5 Reliability.......................................................................................................................... 4
3. SCALING AND EQUATING........................................................................................................ 43.1 Item calibration models .................................................................................................... 43.2 Item calibration program used ........................................................................................ 63.3 Item calibration results : model-to-data fit...................................................................... 63.4 Equating method and results ............................................................................................ 73.5 Differential item functioning (DIF) .................................................................................. 7
4. IRT PATTERN-SCORING........................................................................................................... 95. G8 ELA SCALE SCORE MEANS AND STANDARD DEVIATIONS: STATE AND THE SAMPLE .... 106. SCALE-SCORE FREQUENCY DISTRIBUTIONS FOR THE STATE AND SUBGROUPS ....................... 107. CORRELATION BETWEEN G8 ELA AND G8 MATHEMATICS SCALE SCORES .......................... 11
REFERENCES......................................................................................................................... 12

1
1. Test design
Similar to the 1999 form, the grade 8 English Language Arts (G8 ELA) test has thefollowing configuration:
Session 1• 4 passages accompanied by 25 multiple-choice (MC) items:
∗ 16 MC items on Standard 1 (informational)∗ 6 MC items on Standard 2 (literary)∗ 3 MC items on Standard 3 (critical analysis)
• Two short informational passages for listening, followed by three short-response(SR) and one extended-response (ER) items. The four responses are scored as acluster (listening cluster). Standard 1.
Session 2• Linked information stimuli, accompanied by three SR and one ER items which are
scored as a cluster (reading cluster). Standard 3 : Reading and writing for criticalanalysis.
• An independent writing prompt. The response to the prompt is scored as an ERitem (independent writing). Standard 1.
Additionally, as part of the G8 ELA test, the three ER responses across sessions 1 and 2are scored as a cluster (writing mechanics). Although the writing mechanics is notlinked to any of the New York State standards, it contributes to the overall G8 ELAscore.
The table below shows the numbers of score points by the item type or cluster, and thetotal numbers of items and clusters for each grade.
Item type / cluster Grade 8 ELAMC 25 ptsListening cluster 6 ptsReading cluster 6 ptsIndependent writing 3 ptsWriting mechanics cluster 3 ptsTotal # points 43 ptsTotal # of items / clusters 29 items

2
The following condition codes were used in scoring the responses to the CR items:
Condition Code MeaningA BlankB RefusalC Insufficient to scoreD IllegibleE Other language
As with G4 ELA, each of the clusters is treated as a constructed-response (CR) item inthe scaling. Therefore, in the sections below, the clusters and the independent writingitem are also referred to as follows:
Listening cluster ≡ CR #1Reading cluster ≡ CR #2Independent writing ≡ CR #3Writing mechanics ≡ CR #4
2. A scaling sample
The process of drawing a quasi-random sample for the G8 ELA scaling began when thestate data met the following requirements pre-specified by the NYSED:• At least 85% of the estimated number of students in the state,• Includes New York City and Buffalo,• Includes at least one of Rochester, Syracuse, or Yonkers, and• Includes at least two of Mount Vernon, Albany, Binghamton, Schenectady, or New
Rochelle.
At the time of sampling, the available state data contained 217,771 students.
2.1 Screening
Prior to sampling, the following groups of students or records were eliminated, in theorder listed, from the state dataset with 217,771 students:• Students whose grades were not eight,• Duplicated records,• Students whose limited English proficiency (LEP) status was “3,” indicating that they
scored below the thirtieth percentile on a norm-referenced English reading test or thepublisher’s recommended score on an approved measure of English as a SecondLanguage in reading, and
• Students who are invalidated.
Students with the LEP status of “3” are not required to take the ELA test and wereremoved from the consideration for the sample. There were 5,864 LEP3 students.

3
Invalidated students are those who do not have a valid attempt in each test section asdefined by CTB’s Technology and Scoring Departments and who will not receive theELA score or be categorized into a performance level. There were 3,902 invalidatedstudents.
2.2 State data available for sampling
After step 2.1 above, the available state data contained 207,536 students. It was ensuredthat no out-of-range scores for either multiple-choice (MC) or constructed-response (CR)items existed in this state dataset.
Table 1 shows the frequency distribution (FD) of total G8 ELA raw score (RS). Table 2presents unadjusted p-values and item-total correlations based on the 207,536 students.As with G4 ELA, “unadjusted” p-values are computed while treating students whoomitted the item as if they got the item wrong. “P-value” for an MC item is thepercentage of students who correctly responded to the item, and the p-value for a CR itemis the mean RS divided by the maximum number of score points for the item.
2.3 Selection of a scaling sample
After a fractional random number between 0 and 1 was assigned to each of the 207,536students, the students were sorted by their random numbers. Next, a sample ofapproximately 7,000 students was selected by choosing every Xth students from the207,536 students, where X was found by dividing 207,536 by 7,000.
The sample RS means and standard deviations (SDs), presented in a table below, indicatethe close comparability of the scaling sample and the state.
N RS mean RS SDSample 6,917 30.91 (72%) 6.73State 207,536 30.95 (72%) 6.68
Table 3 presents the FDs of G8 ELA total raw-score points for the sample.
2.4 Item analysis on the scaling sample
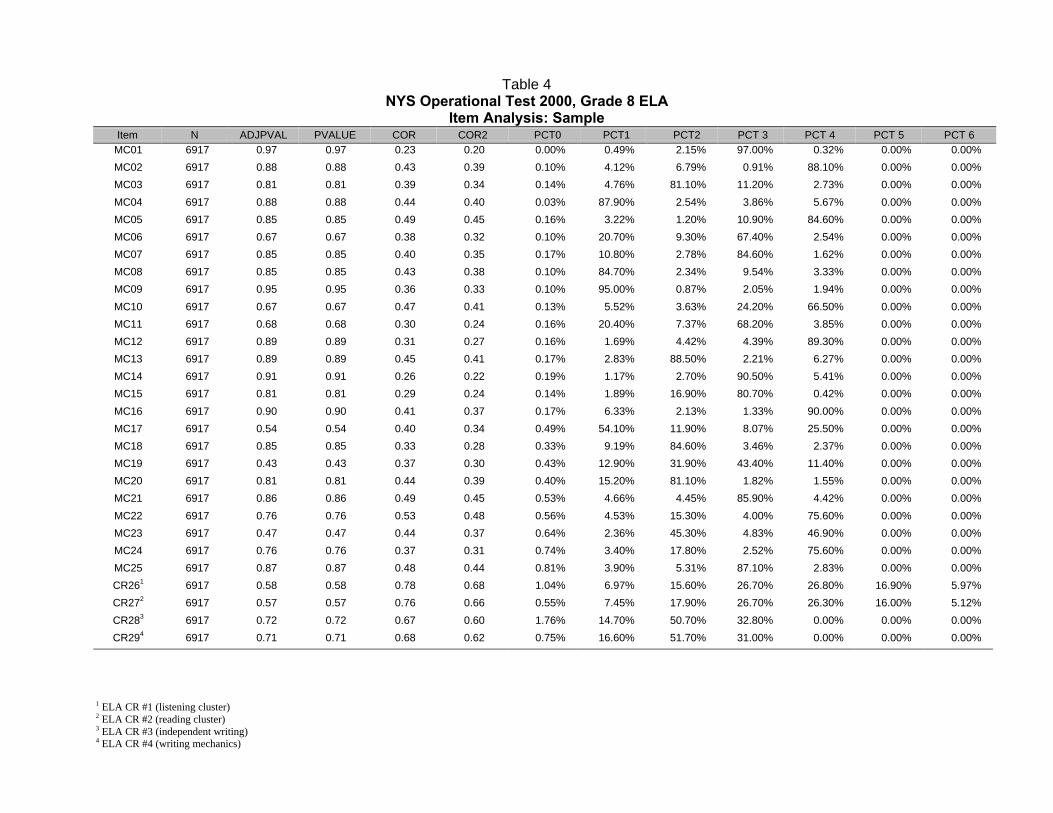
Table 4 shows the results of item analyses conducted using the scaling samples for theG8 ELA test. As with G4 ELA, the labels for the variables denote the following:
ITEM Item number.N Number of students that responded to the itemADJPVAL Item difficulty while excluding students who failed to respond to the
item. For MC items, this is the percentage of students who respondedcorrectly. For CR items, it is the mean item score divided by maximumitem score.

4
PVALUE Item difficulty after omitted responses are converted to 0s (wrong).COR Item-total correlation when the total score includes the studied item.COR2 Item-total correlation when the total score excludes the studied item.PCT0 Percentage of students who had blank responses or double marks on
MC items, or condition codes on CR items.PCT1, 2, etc. For MC items, this is the percentage of students who chose the first (or
second, etc.) answer option. For CR items, it is the percentage ofstudents who received score 1 (or 2, etc.).
The p-values indicate that some items are very easy, while others are harder. The item-total correlations without the studied item (COR2) are reasonable. The column, PCT0,does not indicate insufficient testing time for the MC section.
2.5 Reliability
The reliability of measurement refers to the “extent of variation in an individual’s scoresover a series of parallel tests” (Ghiselli et al., p.205). The two most frequently reportedindices of reliability are the standard error of measurement and the reliability coefficient.
The standard error of measurement (SEM) is a measure of the extent to which anindividual’s scores vary over numerous parallel tests. It is the standard deviation of anindividual’s scores if he or she took numerous parallel tests. The standard error ofmeasurement (SEM) is estimated using the following formula:
xxrSDSEM −= 1 ,
where SD is the standard deviation of observed scores for a single test, and rxx is thereliability coefficient for the test. The scale-score SEM for G8 ELA is reported in a latersection, section 5.
The reliability coefficient is the correlation coefficient between scores on parallel testsand is an index of how well scores on one parallel test predict scores from anotherparallel test. Among several ways to estimate the reliability of a test, Cronbach’s alphaprobably is the most frequently used. It is a measure of internal consistency (i.e., howhomogeneous test items are) appropriate for a test containing only MC items. Since theG8 ELA test contains MC and CR items, Cronbach’s alpha would underestimatereliability because of the effect of variance attributable to item types. A more appropriateindex of internal consistency, the Feldt-Raju index, was used to estimate the reliability ofthe G8 ELA test. The F-R reliability of the G8 ELA test was .88.
3. Scaling and equating
3.1 Item calibration models
The G8 ELA items were calibrated using item response theory (IRT) models. Itemresponse theory is a statistical procedure that takes into account the fact that not all testitems are alike and that all items need not be given equal weight in determining how
5
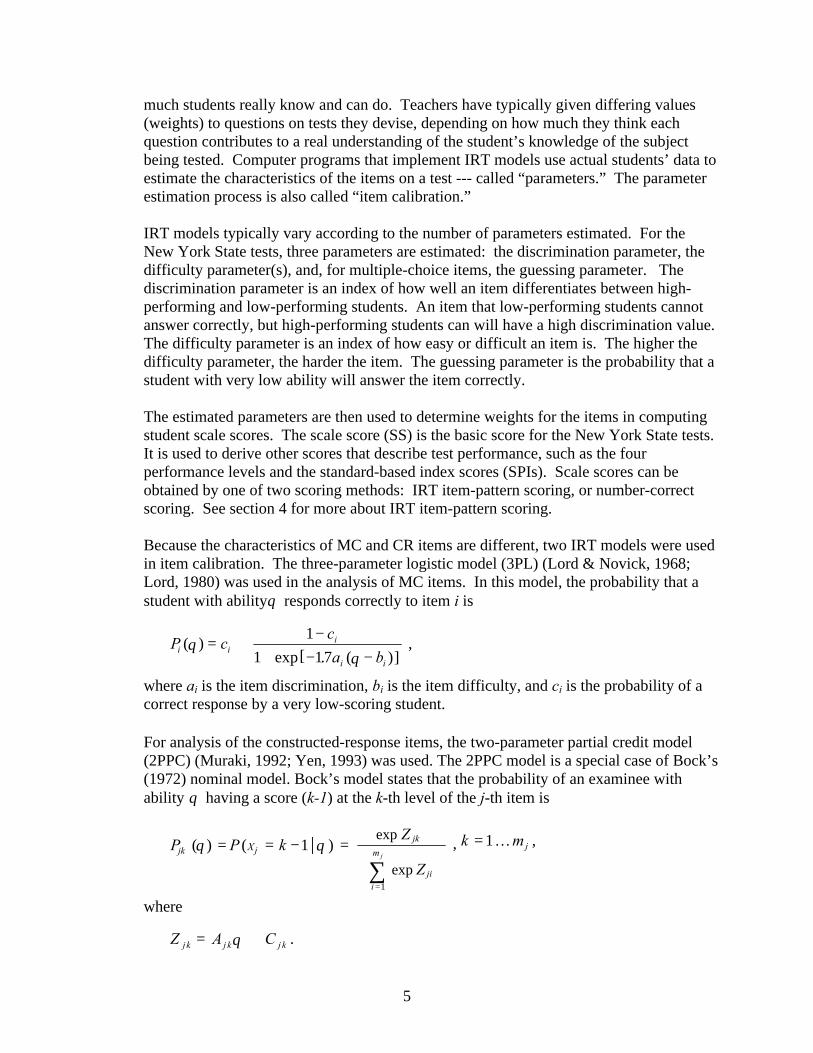
much students really know and can do. Teachers have typically given differing values(weights) to questions on tests they devise, depending on how much they think eachquestion contributes to a real understanding of the student’s knowledge of the subjectbeing tested. Computer programs that implement IRT models use actual students’ data toestimate the characteristics of the items on a test --- called “parameters.” The parameterestimation process is also called “item calibration.”
IRT models typically vary according to the number of parameters estimated. For theNew York State tests, three parameters are estimated: the discrimination parameter, thedifficulty parameter(s), and, for multiple-choice items, the guessing parameter. Thediscrimination parameter is an index of how well an item differentiates between high-performing and low-performing students. An item that low-performing students cannotanswer correctly, but high-performing students can will have a high discrimination value.The difficulty parameter is an index of how easy or difficult an item is. The higher thedifficulty parameter, the harder the item. The guessing parameter is the probability that astudent with very low ability will answer the item correctly.
The estimated parameters are then used to determine weights for the items in computingstudent scale scores. The scale score (SS) is the basic score for the New York State tests.It is used to derive other scores that describe test performance, such as the fourperformance levels and the standard-based index scores (SPIs). Scale scores can beobtained by one of two scoring methods: IRT item-pattern scoring, or number-correctscoring. See section 4 for more about IRT item-pattern scoring.
Because the characteristics of MC and CR items are different, two IRT models were usedin item calibration. The three-parameter logistic model (3PL) (Lord & Novick, 1968;Lord, 1980) was used in the analysis of MC items. In this model, the probability that astudent with abilityθ responds correctly to item i is
Pc
a bi
i
i i
( ) = ( )]
θθ
ci +−
+ − −1
1 17exp[ . ,
where ai is the item discrimination, bi is the item difficulty, and ci is the probability of acorrect response by a very low-scoring student.
For analysis of the constructed-response items, the two-parameter partial credit model(2PPC) (Muraki, 1992; Yen, 1993) was used. The 2PPC model is a special case of Bock’s(1972) nominal model. Bock’s model states that the probability of an examinee withability θ having a score (k-1) at the k-th level of the j-th item is
jm
iji
jkjjk
mk
Z
ZkPP
jX …1,
)1(=)(
1=
exp
exp| ==−=
∑θθ ,
where
kjkjkj CAZ += θ .

6
The mj denotes the number of score levels for the j-th item, and typically, the highestscore level is assigned (mj – 1) score points. For the special case of the 2PPC model usedhere, the following constraints were used:
A kjk j= −α ( )1 ,
and
,1
0∑
−
=
−=k
iijkjC γ where γ j0
0= ,
where αj and γji are the free parameters to be estimated from the data. Each item has(mj –1) independent γji parameters and one αj parameter; a total of mj parameters areestimated for each item.
3.2 Item calibration program used
The IRT model parameters were estimated using CTB’s PARDUX software (Burket,1991). PARDUX estimates parameters simultaneously for MC and CR items usingmarginal maximum likelihood procedures implemented via the EM (expectation-maximization) algorithm (Bock & Aitkin, 1981; Thissen, 1982).
Simulation studies have compared PARDUX with MULTILOG (Thissen, 1991),PARSCALE (Muraki & Bock, 1991), and BIGSTEPS (Wright & Linacre, 1992).PARSCALE, MULTILOG, and BIGSTEPS are among the most widely known and usedIRT programs. PARDUX was found to perform at least as well as these other programs.
3.3 Item calibration results : model-to-data fit
A procedure and a statistic (Q1) developed by Yen (1981) were used to measure model-to-data fit for the items. The procedure divides the sample into ten groups according totheir ability estimates. For a given item, it then compares the expected and observedproportions of the students for each of the ten ability groups and computes an index (Q1)pooled over the ability groups. The Q1 is distributed approximately as a chi-square withthe following degrees of freedom:
jj mmIdf −−= )1( ,
where I is the total number of ability groups, and mj is the possible number of score levelsfor item j.
To adjust for differences in degrees of freedom among items, Q1 is transformed to a Zusing the following formula:
df
dfQZQ
2
1
1
−= .

7
Based on our research, the Z critical value has been established as a function of samplesize (N):
15004N
Z crit = .
The lower the ZQ1, the better the item fit.
All the items in the G8 ELA test reached the convergence criterion of a maximumdifference of .001 in the difficulty parameter after 19 iterations. As shown in Table 5,one item, CR item #28 with a Z of 23.4, was flagged for poor model-to-data fit againstthe criterion value of 18.4. Figure 1 shows the plot of item characteristic curve for item#28.
3.4 Equating method and results
After the item calibration, all the G8 ELA items were placed on CTB’s TerraNova scaleusing the TerraNova MC items as anchors. The equating was performed using the testcharacteristic curve method (Stocking & Lord, 1983) implemented by PARDUX. Of 25MC items, 20 items contributed to the equating.
Figure 2 shows a plot of the test characteristic curves (TCCs) for the anchor items. Thelightest line denoted “Anch est” is the TCC based on the new G8 ELA estimates, whilethe medium-dark line denoted “Anch input” in the plot is the TCC based on theTerraNova anchor (criterion) estimates. The plot shows the quality of the equatingconducted. The closer the two TCC curves, the tighter the equating.
3.5 Differential item functioning (DIF)
As part of the testing, the students reported their gender and ethnic backgroundinformation. Using this self-reported information, a statistical differential itemfunctioning (DIF) analyses were conducted for gender groups and such ethnic groups asAfrican-American and Hispanic-American. The numbers of cases for the groups arereported in the table below.
Test Male FemaleAfrican-
AmericanHispanic-American
Asian-American
G8 ELA 3,467 3,412 1,245 914 282
An IRT-based DIF procedure (Linn & Harnisch, 1981) was used to measure DIF. Inshort, on each item on the test, the method compares the actual performance of a givengroup against their expected performance predicted from the IRT parameter estimates. Ifthe group’s actual performance is statistically and consistently better than their expectedperformance on a given item, the item will be flagged in favor of the group. If thegroup’s observed performance is statistically and consistently worse than their predictedperformance, the item will be flagged against the group.

8
To determine the expected-observed difference is “statistically and consistently” large,two DIF indices are used: a standardized difference (Z), and an overall difference (D).The difference needs to be sufficiently large by both measures for an item to be flagged.For example, even if the statistical measure (Z) indicates that an item has a significantamount of DIF, perhaps due to large sample size, the item will not be flagged unless theoverall expected-observed difference (D) indicates that the difference is more or lessconsistent throughout a range of ability.
More specifically, in the DIF procedure for MC items, students in a given gender orethnic group are divided into ten “equal”-size groups based on their ability estimates. Foreach ability group g, the difference between the expected and observed proportion correctscores is computed. The D is the mean score difference averaged over the ten abilitygroups. Consider two situations: when the differences are consistently positive for mostof the ability groups, versus when the differences are positive for about half of the abilitygroups and negative for the remaining ability groups. For the former, the averagedifference across all the ability groups would likely be positive and relatively large, whilethat would likely be relatively small for the latter. In other words, the D in absolute valueis expected to be above a criterion value when the predicted-actual performancedifferences are relatively large in the same direction (negative or positive) consistentlyacross the ability groups.
The standardized difference score for ability group g is computed as follows:
∑∈
−
−=
gj ijij
ijij
gig
PP
PU
nZ
)1(
1,
where Uij = 1 when person j answers item i correctly and Uij = 0 otherwise. Thestandardized difference over all the ability groups is:
∑
∑=
gg
gigg
in
Zn
Z2. .
A generalization of this procedure was used to measure DIF for constructed-responseitems. An item is flagged for negative DIF when D < -.10 and Z < -2.58 and for positiveDIF when D > .10 and Z > 2.58. As an aid for interpretation in the case of a CR item, aD of +.10 means that the group would have a mean score of 2.6 on the item when theirexpected mean score is 2.5.
The numbers of items flagged for DIF in the G8 ELA test are summarized on thefollowing page.

9
Focal Group Direction of DIF G8 ELAMale In favor of 0
Against 11
Female In favor of 0Against 0
African-American In favor of 0Against 0
Hispanic In favor of 0Against 12
Asian In favor of 0Against 0
1 Item #26 (CR; Listening) : Z = -6.97 and D = -.11.2 Item #11 (MC) : Z = -6.61 and D = -.11.
As indicated in the table, two items in the G8 ELA test were found to have significantDIF, one against a gender group (Male) and the other against Hispanic-Americanstudents.
4. IRT pattern-scoring
As with G4 ELA, IRT pattern scoring, as opposed to number-correct (NC) scoring, wasused in computing student scale scores (SSs) for the G8 ELA test. The former methodproduces scores for individual students that are more accurate than those produced by thelatter procedure. The increase in accuracy is approximately equivalent to a 15 to 20%increase in test length.
Number-correct scoring considers only how many questions a student answered correctlyin determining his or her score. In contrast, the IRT pattern-scoring method takes intoaccount not only his or her total raw score, but also which questions he or she got rightand the psychometric characteristics of these items. The IRT pattern scoring gainsaccuracy by considering the fact that the items are not equal in their characteristics. Forexample, low-ability students are more likely to guess correctly on some items than onothers, and some are more discriminating than others. Two students with exactly thesame raw score total will get the same SS in number-correct scoring. However, it is verypossible that even though they have the same raw score total, they answered differentitems correctly, and that the items differ considerably with regard to their characteristics.In such a case, they will likely get different SSs in item-pattern scoring even though theyhave the same raw score total.
To give a more or less concrete example, assume students A and B each got 15 itemsright on a 20-MC-item test. Their NC scores are the same, 15 points each. As notedabove, by NC scoring, they would get exactly the same SSs. By pattern scoring, their
10
scale scores could differ. For example, let's assume that the 3PL model described earlieris used and that the pattern of right and wrong responses is exactly the same for bothstudents for 18 of the 20 items (14 rights and 4 wrongs), but student A got item X rightand item Y wrong, while student B got item X wrong and item Y right. Based on the 18items on which both students got an identical pattern of right and wrong responses, their“provisional” ability estimates must be exactly the same, which may be referred to as
18θ̂ . If item X and item Y are equally difficult at 18θ̂ , but if item X is more
discriminating than item Y at 18θ̂ , student A's SS would be higher than that of student B.
In another scenario where item X is more difficult than item Y at 18θ̂ , but both items areof equal discrimination and guessing, it is difficult to predict their SSs, because student Awould get credit for getting the more difficult item X, but simultaneously get penalizedfor responding incorrectly to the easier item Y, while student B would be credited forgetting the easier item right.
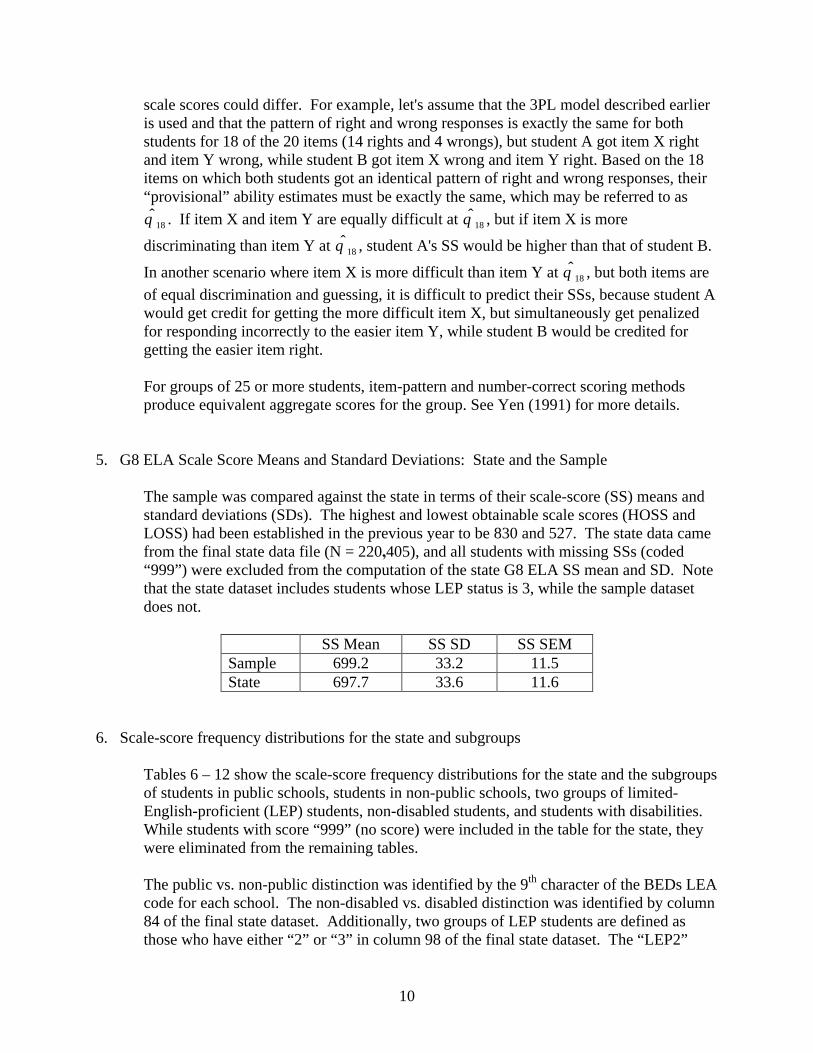
For groups of 25 or more students, item-pattern and number-correct scoring methodsproduce equivalent aggregate scores for the group. See Yen (1991) for more details.
5. G8 ELA Scale Score Means and Standard Deviations: State and the Sample
The sample was compared against the state in terms of their scale-score (SS) means andstandard deviations (SDs). The highest and lowest obtainable scale scores (HOSS andLOSS) had been established in the previous year to be 830 and 527. The state data camefrom the final state data file (N = 220,405), and all students with missing SSs (coded“999”) were excluded from the computation of the state G8 ELA SS mean and SD. Notethat the state dataset includes students whose LEP status is 3, while the sample datasetdoes not.
SS Mean SS SD SS SEMSample 699.2 33.2 11.5State 697.7 33.6 11.6
6. Scale-score frequency distributions for the state and subgroups
Tables 6 – 12 show the scale-score frequency distributions for the state and the subgroupsof students in public schools, students in non-public schools, two groups of limited-English-proficient (LEP) students, non-disabled students, and students with disabilities.While students with score “999” (no score) were included in the table for the state, theywere eliminated from the remaining tables.
The public vs. non-public distinction was identified by the 9th character of the BEDs LEAcode for each school. The non-disabled vs. disabled distinction was identified by column84 of the final state dataset. Additionally, two groups of LEP students are defined asthose who have either “2” or “3” in column 98 of the final state dataset. The “LEP2”

11
group is defined as those with “2s” in column 98, indicating that they are identified ashaving limited English proficiency and scored at or above either the 30th percentile on anorm-referenced English reading test or the publisher’s recommended score on anapproved measure of English as a Second Language (ESL) in reading. Similarly, the“LEP3” group is defined as those with “3s” in column 98, meaning that they areidentified as having limited English proficiency and scored below either the 30th
percentile on a norm-referenced English reading test or the publisher’s recommendedscore on an approved measure of English as a Second Language (ESL) in reading.
The SS frequency distributions for the groups, excluding students with score “999,” areplotted in Figure 3.
As a summary table of the SS frequency distributions, the SSs at the 10th, 25th, 50th, 75th,and 90th percentiles are listed in the following table. The SSs are the first SSs, rounded tonearest whole numbers, that have at least the cumulative percentages corresponding tothe percentile ranks. Scores “999s” were excluded from the percentile calculations.
Group 10th 25th 50th 75th 90thState 657 677 698 719 738Public 656 675 696 718 738Non-public 670 688 706 724 743LEP2 639 660 683 707 727LEP3 613 631 650 666 680S w/D* 626 647 666 685 702
* Students with disabilities
7. Correlation between G8 ELA and G8 Mathematics scale scores
The correlation between G8 ELA and Mathematics scale scores based on the state data is.75, slightly higher than that for grade 4 (.73). This correlation is very comparable tothose found in the first year of the New York State assessment programs and also in thepast with other assessment projects.

12
References
Bock, R. D. (1972). Estimating item parameters and latent ability when responses are scored intwo or more nominal categories. Psychometrika, 37, 29-51.
Bock, R. D., & Aitkin, M. (1981). Marginal maximum likelihood estimation of item parameters:An application of an EM algorithm. Psychometrika, 46, 443-459.
Burket, G. R. (1991). PARDUX [Computer program]. Unpublished.
Linn, R. L., & Harnisch, D. (1981). Interactions between item content and group membership inachievement test items. Journal of Educational Measurement, 18, 109-118.
Lord, F. M. (1980). Applications of item response theory to practical testing problems.Hillsdale, NJ: Lawrence Erlbaum.
Lord, F. M., & Novick, M. R. (1968). Statistical theories of mental test scores. Menlo Park,CA: Addison-Wesley.
Muraki, E. (1992). A generalized partial credit model: Application of an EM algorithm. AppliedPsychological Measurement, 16, 159–176.
Muraki, E., & Bock, R. D. (1991). PARSCALE: Parameter Scaling of Rating Data [Computerprogram]. Chicago, IL: Scientific Software, Inc.
Stocking, M. L., & Lord, F. M. (1983). Developing a common metric in item response theory.Applied Psychological Measurement, 7, 201-210.
Thissen, D. (1982). Marginal maximum likelihood estimation for the one-parameter logisticmodel. Psychometrika, 47, 175-186.
Thissen, D. (1991). MULTILOG [Computer program]. Chicago, IL: Scientific Software, Inc.
Wright, B. D., & Linacre, J. M. (1992). BIGSTEPS Rasch Analysis [Computer program].Chicago, IL: MESA Press.
Yen, W. M. (1981). Using simulation results to choose latent trait model. AppliedPsychological Measurement, 5, 245-262.
Yen, W. M., & Candell, G. L. (1991). Increasing score reliability with item-pattern scoring: Anempirical study in five score metrics. Applied Measurement in Education, 4, 209-228.
Yen, W. M. (1993). Scaling performance assessments: Strategies for managing local itemdependence. Journal of Educational Measurement, 30, 187-213.

Table 1NYS Operational Test 2000, Grade 8 ELARaw-Score Frequency Distribution: State
TotalRS
Frequency Count
Percent ofTotal Frequency
CumulativeFrequency
CumulativePercent
1 4 0.00 4 0.002 10 0.00 14 0.013 16 0.01 30 0.014 40 0.02 70 0.035 76 0.04 146 0.076 118 0.06 264 0.137 150 0.07 414 0.208 220 0.11 634 0.319 321 0.15 955 0.46
10 436 0.21 1391 0.6711 500 0.24 1891 0.9112 678 0.33 2569 1.2413 834 0.40 3403 1.6414 985 0.47 4388 2.1115 1175 0.57 5563 2.6816 1440 0.69 7003 3.3717 1853 0.89 8856 4.2718 2131 1.03 10987 5.2919 2545 1.23 13532 6.5220 2974 1.43 16506 7.9521 3461 1.67 19967 9.6222 3995 1.92 23962 11.5523 4593 2.21 28555 13.7624 5476 2.64 34031 16.4025 6216 3.00 40247 19.3926 7131 3.44 47378 22.8327 8115 3.91 55493 26.7428 9173 4.42 64666 31.1629 10323 4.97 74989 36.1330 10922 5.26 85911 41.4031 11995 5.78 97906 47.1832 12942 6.24 110848 53.4133 13300 6.41 124148 59.8234 13277 6.40 137425 66.2235 12999 6.26 150424 72.4836 12588 6.07 163012 78.5537 11594 5.59 174606 84.1338 10112 4.87 184718 89.0139 8534 4.11 193252 93.1240 6596 3.18 199848 96.3041 4517 2.18 204365 98.4742 2337 1.13 206702 99.6043 834 0.40 207536 100.00
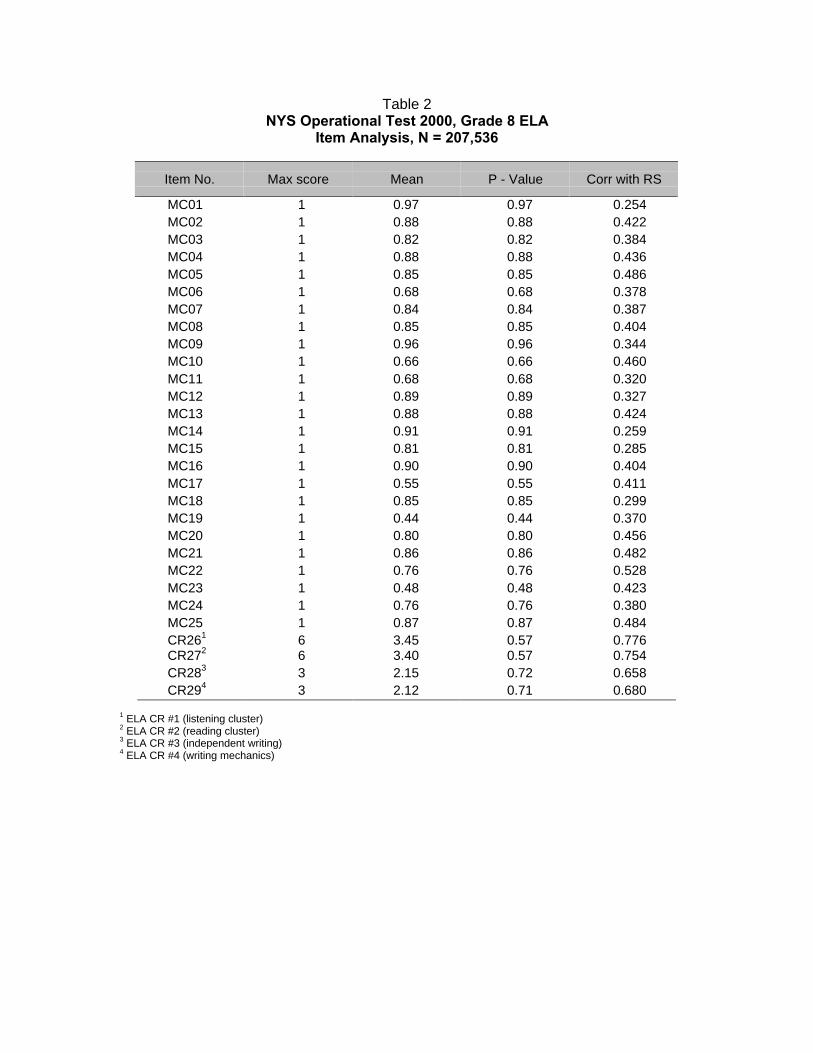
Table 2NYS Operational Test 2000, Grade 8 ELA
Item Analysis, N = 207,536
Item No. Max score Mean P - Value Corr with RS
MC01 1 0.97 0.97 0.254MC02 1 0.88 0.88 0.422MC03 1 0.82 0.82 0.384MC04 1 0.88 0.88 0.436MC05 1 0.85 0.85 0.486MC06 1 0.68 0.68 0.378MC07 1 0.84 0.84 0.387MC08 1 0.85 0.85 0.404MC09 1 0.96 0.96 0.344MC10 1 0.66 0.66 0.460MC11 1 0.68 0.68 0.320MC12 1 0.89 0.89 0.327MC13 1 0.88 0.88 0.424MC14 1 0.91 0.91 0.259MC15 1 0.81 0.81 0.285MC16 1 0.90 0.90 0.404MC17 1 0.55 0.55 0.411MC18 1 0.85 0.85 0.299MC19 1 0.44 0.44 0.370MC20 1 0.80 0.80 0.456MC21 1 0.86 0.86 0.482MC22 1 0.76 0.76 0.528MC23 1 0.48 0.48 0.423MC24 1 0.76 0.76 0.380MC25 1 0.87 0.87 0.484CR261 6 3.45 0.57 0.776CR272 6 3.40 0.57 0.754CR283 3 2.15 0.72 0.658CR294 3 2.12 0.71 0.680
1 ELA CR #1 (listening cluster)2 ELA CR #2 (reading cluster)3 ELA CR #3 (independent writing)4 ELA CR #4 (writing mechanics)

Table 3NYS Operational Test 2000, Grade 8 ELA
Raw-Score Frequency Distribution: Sample
TotalRS
FrequencyCount
Percent ofTotal Frequency
CumulativeFrequency
CumulativePercent
2 1 0.0 1 0.05 3 0.0 4 0.16 3 0.0 7 0.17 3 0.0 10 0.18 7 0.1 17 0.29 15 0.2 32 0.5
10 18 0.3 50 0.711 21 0.3 71 1.012 22 0.3 93 1.313 27 0.4 120 1.714 30 0.4 150 2.215 40 0.6 190 2.716 55 0.8 245 3.517 70 1.0 315 4.618 77 1.1 392 5.719 76 1.1 468 6.820 95 1.4 563 8.121 112 1.6 675 9.822 125 1.8 800 11.623 175 2.5 975 14.124 180 2.6 1155 16.725 209 3.0 1364 19.726 235 3.4 1599 23.127 262 3.8 1861 26.928 324 4.7 2185 31.629 328 4.7 2513 36.330 340 4.9 2853 41.231 408 5.9 3261 47.132 447 6.5 3708 53.633 435 6.3 4143 59.934 433 6.3 4576 66.235 449 6.5 5025 72.636 435 6.3 5460 78.937 369 5.3 5829 84.338 331 4.8 6160 89.139 257 3.7 6417 92.840 233 3.4 6650 96.141 145 2.1 6795 98.242 88 1.3 6883 99.543 34 0.5 6917 100.0
1 ELA CR #1 (listening cluster)2 ELA CR #2 (reading cluster)3 ELA CR #3 (independent writing)4 ELA CR #4 (writing mechanics)
Table 4NYS Operational Test 2000, Grade 8 ELA
Item Analysis: SampleItem N ADJPVAL PVALUE COR COR2 PCT0 PCT1 PCT2 PCT 3 PCT 4 PCT 5 PCT 6
MC01 6917 0.97 0.97 0.23 0.20 0.00% 0.49% 2.15% 97.00% 0.32% 0.00% 0.00%
MC02 6917 0.88 0.88 0.43 0.39 0.10% 4.12% 6.79% 0.91% 88.10% 0.00% 0.00%
MC03 6917 0.81 0.81 0.39 0.34 0.14% 4.76% 81.10% 11.20% 2.73% 0.00% 0.00%
MC04 6917 0.88 0.88 0.44 0.40 0.03% 87.90% 2.54% 3.86% 5.67% 0.00% 0.00%
MC05 6917 0.85 0.85 0.49 0.45 0.16% 3.22% 1.20% 10.90% 84.60% 0.00% 0.00%
MC06 6917 0.67 0.67 0.38 0.32 0.10% 20.70% 9.30% 67.40% 2.54% 0.00% 0.00%
MC07 6917 0.85 0.85 0.40 0.35 0.17% 10.80% 2.78% 84.60% 1.62% 0.00% 0.00%
MC08 6917 0.85 0.85 0.43 0.38 0.10% 84.70% 2.34% 9.54% 3.33% 0.00% 0.00%
MC09 6917 0.95 0.95 0.36 0.33 0.10% 95.00% 0.87% 2.05% 1.94% 0.00% 0.00%
MC10 6917 0.67 0.67 0.47 0.41 0.13% 5.52% 3.63% 24.20% 66.50% 0.00% 0.00%
MC11 6917 0.68 0.68 0.30 0.24 0.16% 20.40% 7.37% 68.20% 3.85% 0.00% 0.00%
MC12 6917 0.89 0.89 0.31 0.27 0.16% 1.69% 4.42% 4.39% 89.30% 0.00% 0.00%
MC13 6917 0.89 0.89 0.45 0.41 0.17% 2.83% 88.50% 2.21% 6.27% 0.00% 0.00%
MC14 6917 0.91 0.91 0.26 0.22 0.19% 1.17% 2.70% 90.50% 5.41% 0.00% 0.00%
MC15 6917 0.81 0.81 0.29 0.24 0.14% 1.89% 16.90% 80.70% 0.42% 0.00% 0.00%
MC16 6917 0.90 0.90 0.41 0.37 0.17% 6.33% 2.13% 1.33% 90.00% 0.00% 0.00%
MC17 6917 0.54 0.54 0.40 0.34 0.49% 54.10% 11.90% 8.07% 25.50% 0.00% 0.00%
MC18 6917 0.85 0.85 0.33 0.28 0.33% 9.19% 84.60% 3.46% 2.37% 0.00% 0.00%
MC19 6917 0.43 0.43 0.37 0.30 0.43% 12.90% 31.90% 43.40% 11.40% 0.00% 0.00%
MC20 6917 0.81 0.81 0.44 0.39 0.40% 15.20% 81.10% 1.82% 1.55% 0.00% 0.00%
MC21 6917 0.86 0.86 0.49 0.45 0.53% 4.66% 4.45% 85.90% 4.42% 0.00% 0.00%
MC22 6917 0.76 0.76 0.53 0.48 0.56% 4.53% 15.30% 4.00% 75.60% 0.00% 0.00%
MC23 6917 0.47 0.47 0.44 0.37 0.64% 2.36% 45.30% 4.83% 46.90% 0.00% 0.00%
MC24 6917 0.76 0.76 0.37 0.31 0.74% 3.40% 17.80% 2.52% 75.60% 0.00% 0.00%
MC25 6917 0.87 0.87 0.48 0.44 0.81% 3.90% 5.31% 87.10% 2.83% 0.00% 0.00%
CR261 6917 0.58 0.58 0.78 0.68 1.04% 6.97% 15.60% 26.70% 26.80% 16.90% 5.97%
CR272 6917 0.57 0.57 0.76 0.66 0.55% 7.45% 17.90% 26.70% 26.30% 16.00% 5.12%
CR283 6917 0.72 0.72 0.67 0.60 1.76% 14.70% 50.70% 32.80% 0.00% 0.00% 0.00%
CR294 6917 0.71 0.71 0.68 0.62 0.75% 16.60% 51.70% 31.00% 0.00% 0.00% 0.00%

Table 5
NYS Operational Test 2000, Grade 8 ELAModel-to-data fit results
Item FitZ1 -0.22 1.73 -0.44 2.45 0.06 0.07 0.08 0.59 0.110 -0.311 1.012 -0.813 0.014 0.715 0.416 0.117 0.918 0.819 2.320 0.621 0.222 3.323 5.724 0.325 0.226 8.927 728 23.529 6.3
Critical Z (N = 6,900) =6900
4 18.41500
× =

Table 6NYS Operational Test 2000: Grade 8 ELA
Scale Score Frequency Distributions: State
SS Freq % Cum Freq Cum % SS Freq % Cum Freq Cum %527 115 0.05 115 0.1 568 9 0.00 271 0.1528 1 0.00 116 0.1 569 10 0.00 281 0.1529 2 0.00 118 0.1 570 6 0.00 287 0.1533 1 0.00 119 0.1 571 18 0.01 305 0.1534 3 0.00 122 0.1 572 11 0.00 316 0.1535 2 0.00 124 0.1 573 23 0.01 339 0.2536 1 0.00 125 0.1 574 14 0.01 353 0.2537 2 0.00 127 0.1 575 13 0.01 366 0.2538 1 0.00 128 0.1 576 13 0.01 379 0.2539 2 0.00 130 0.1 577 19 0.01 398 0.2540 3 0.00 133 0.1 578 21 0.01 419 0.2542 1 0.00 134 0.1 579 20 0.01 439 0.2543 2 0.00 136 0.1 580 10 0.00 449 0.2544 1 0.00 137 0.1 581 21 0.01 470 0.2545 1 0.00 138 0.1 582 17 0.01 487 0.2546 2 0.00 140 0.1 583 20 0.01 507 0.2547 4 0.00 144 0.1 584 23 0.01 530 0.2548 2 0.00 146 0.1 585 18 0.01 548 0.2549 2 0.00 148 0.1 586 21 0.01 569 0.3550 1 0.00 149 0.1 587 27 0.01 596 0.3551 5 0.00 154 0.1 588 30 0.01 626 0.3552 3 0.00 157 0.1 589 23 0.01 649 0.3553 4 0.00 161 0.1 590 32 0.01 681 0.3554 6 0.00 167 0.1 591 27 0.01 708 0.3555 4 0.00 171 0.1 592 34 0.02 742 0.3556 4 0.00 175 0.1 593 33 0.01 775 0.4557 7 0.00 182 0.1 594 27 0.01 802 0.4558 10 0.00 192 0.1 595 33 0.01 835 0.4559 8 0.00 200 0.1 596 47 0.02 882 0.4560 6 0.00 206 0.1 597 39 0.02 921 0.4561 9 0.00 215 0.1 598 52 0.02 973 0.4562 6 0.00 221 0.1 599 38 0.02 1011 0.5563 4 0.00 225 0.1 600 38 0.02 1049 0.5564 13 0.01 238 0.1 601 60 0.03 1109 0.5565 7 0.00 245 0.1 602 51 0.02 1160 0.5566 9 0.00 254 0.1 603 55 0.02 1215 0.6567 8 0.00 262 0.1 604 57 0.03 1272 0.6
(table continues)

Table 6NYS Operational Test 2000: Grade 8 ELA
Scale Score Frequency Distributions: State
SS Freq % Cum Freq Cum % SS Freq % Cum Freq Cum %605 54 0.02 1326 0.6 642 561 0.25 10138 4.6606 71 0.03 1397 0.6 643 576 0.26 10714 4.9607 75 0.03 1472 0.7 644 576 0.26 11290 5.1608 81 0.04 1553 0.7 645 612 0.28 11902 5.4609 82 0.04 1635 0.7 646 689 0.31 12591 5.7610 91 0.04 1726 0.8 647 745 0.34 13336 6.1611 81 0.04 1807 0.8 648 706 0.32 14042 6.4612 110 0.05 1917 0.9 649 825 0.37 14867 6.7613 108 0.05 2025 0.9 650 826 0.37 15693 7.1614 127 0.06 2152 1.0 651 836 0.38 16529 7.5615 102 0.05 2254 1.0 652 955 0.43 17484 7.9616 129 0.06 2383 1.1 653 948 0.43 18432 8.4617 153 0.07 2536 1.2 654 970 0.44 19402 8.8618 162 0.07 2698 1.2 655 1042 0.47 20444 9.3619 156 0.07 2854 1.3 656 957 0.43 21401 9.7620 159 0.07 3013 1.4 657 1189 0.54 22590 10.2621 172 0.08 3185 1.4 658 1225 0.56 23815 10.8622 174 0.08 3359 1.5 659 1260 0.57 25075 11.4623 184 0.08 3543 1.6 660 1336 0.61 26411 12.0624 189 0.09 3732 1.7 661 1323 0.60 27734 12.6625 191 0.09 3923 1.8 662 1322 0.60 29056 13.2626 231 0.10 4154 1.9 663 1433 0.65 30489 13.8627 250 0.11 4404 2.0 664 1496 0.68 31985 14.5628 262 0.12 4666 2.1 665 1495 0.68 33480 15.2629 270 0.12 4936 2.2 666 1639 0.74 35119 15.9630 270 0.12 5206 2.4 667 1626 0.74 36745 16.7631 304 0.14 5510 2.5 668 1715 0.78 38460 17.4632 313 0.14 5823 2.6 669 1844 0.84 40304 18.3633 313 0.14 6136 2.8 670 1852 0.84 42156 19.1634 388 0.18 6524 3.0 671 1918 0.87 44074 20.0635 361 0.16 6885 3.1 672 1976 0.90 46050 20.9636 384 0.17 7269 3.3 673 1971 0.89 48021 21.8637 406 0.18 7675 3.5 674 2129 0.97 50150 22.8638 418 0.19 8093 3.7 675 2183 0.99 52333 23.7639 480 0.22 8573 3.9 676 2194 1.00 54527 24.7640 494 0.22 9067 4.1 677 2206 1.00 56733 25.7641 510 0.23 9577 4.3 678 2345 1.06 59078 26.8
(table continues)
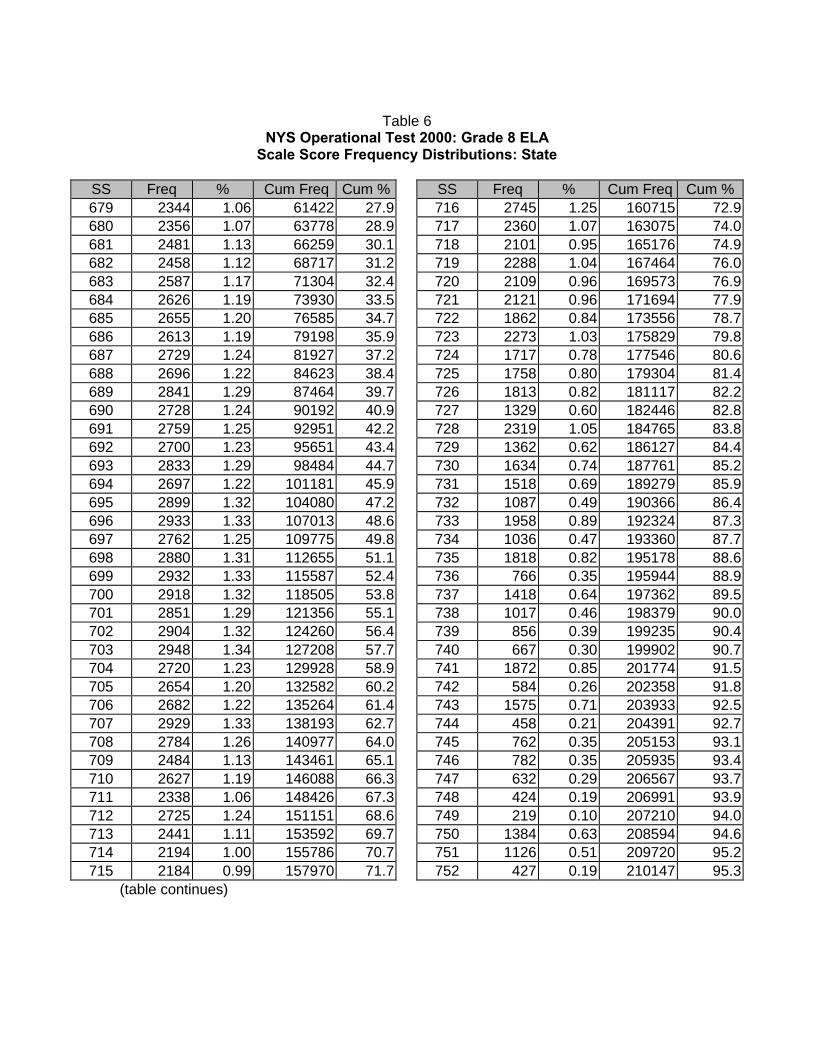
Table 6NYS Operational Test 2000: Grade 8 ELA
Scale Score Frequency Distributions: State
SS Freq % Cum Freq Cum % SS Freq % Cum Freq Cum %679 2344 1.06 61422 27.9 716 2745 1.25 160715 72.9680 2356 1.07 63778 28.9 717 2360 1.07 163075 74.0681 2481 1.13 66259 30.1 718 2101 0.95 165176 74.9682 2458 1.12 68717 31.2 719 2288 1.04 167464 76.0683 2587 1.17 71304 32.4 720 2109 0.96 169573 76.9684 2626 1.19 73930 33.5 721 2121 0.96 171694 77.9685 2655 1.20 76585 34.7 722 1862 0.84 173556 78.7686 2613 1.19 79198 35.9 723 2273 1.03 175829 79.8687 2729 1.24 81927 37.2 724 1717 0.78 177546 80.6688 2696 1.22 84623 38.4 725 1758 0.80 179304 81.4689 2841 1.29 87464 39.7 726 1813 0.82 181117 82.2690 2728 1.24 90192 40.9 727 1329 0.60 182446 82.8691 2759 1.25 92951 42.2 728 2319 1.05 184765 83.8692 2700 1.23 95651 43.4 729 1362 0.62 186127 84.4693 2833 1.29 98484 44.7 730 1634 0.74 187761 85.2694 2697 1.22 101181 45.9 731 1518 0.69 189279 85.9695 2899 1.32 104080 47.2 732 1087 0.49 190366 86.4696 2933 1.33 107013 48.6 733 1958 0.89 192324 87.3697 2762 1.25 109775 49.8 734 1036 0.47 193360 87.7698 2880 1.31 112655 51.1 735 1818 0.82 195178 88.6699 2932 1.33 115587 52.4 736 766 0.35 195944 88.9700 2918 1.32 118505 53.8 737 1418 0.64 197362 89.5701 2851 1.29 121356 55.1 738 1017 0.46 198379 90.0702 2904 1.32 124260 56.4 739 856 0.39 199235 90.4703 2948 1.34 127208 57.7 740 667 0.30 199902 90.7704 2720 1.23 129928 58.9 741 1872 0.85 201774 91.5705 2654 1.20 132582 60.2 742 584 0.26 202358 91.8706 2682 1.22 135264 61.4 743 1575 0.71 203933 92.5707 2929 1.33 138193 62.7 744 458 0.21 204391 92.7708 2784 1.26 140977 64.0 745 762 0.35 205153 93.1709 2484 1.13 143461 65.1 746 782 0.35 205935 93.4710 2627 1.19 146088 66.3 747 632 0.29 206567 93.7711 2338 1.06 148426 67.3 748 424 0.19 206991 93.9712 2725 1.24 151151 68.6 749 219 0.10 207210 94.0713 2441 1.11 153592 69.7 750 1384 0.63 208594 94.6714 2194 1.00 155786 70.7 751 1126 0.51 209720 95.2715 2184 0.99 157970 71.7 752 427 0.19 210147 95.3
(table continues)
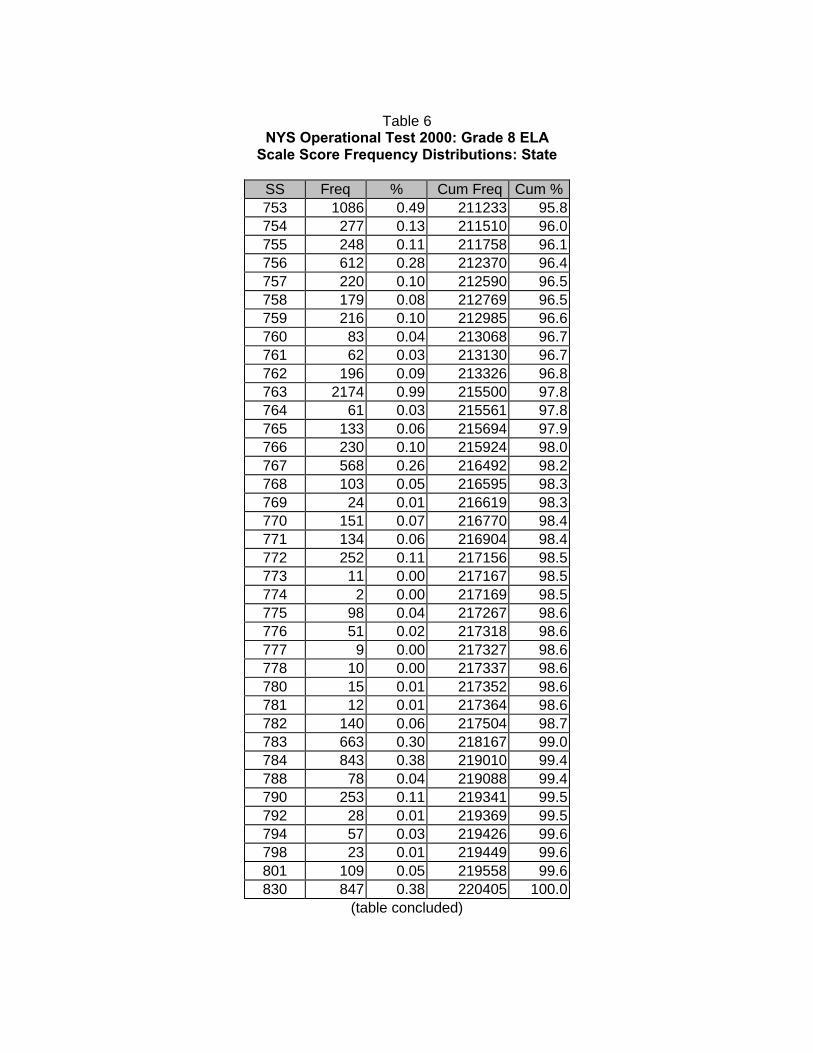
Table 6NYS Operational Test 2000: Grade 8 ELA
Scale Score Frequency Distributions: State
SS Freq % Cum Freq Cum %753 1086 0.49 211233 95.8754 277 0.13 211510 96.0755 248 0.11 211758 96.1756 612 0.28 212370 96.4757 220 0.10 212590 96.5758 179 0.08 212769 96.5759 216 0.10 212985 96.6760 83 0.04 213068 96.7761 62 0.03 213130 96.7762 196 0.09 213326 96.8763 2174 0.99 215500 97.8764 61 0.03 215561 97.8765 133 0.06 215694 97.9766 230 0.10 215924 98.0767 568 0.26 216492 98.2768 103 0.05 216595 98.3769 24 0.01 216619 98.3770 151 0.07 216770 98.4771 134 0.06 216904 98.4772 252 0.11 217156 98.5773 11 0.00 217167 98.5774 2 0.00 217169 98.5775 98 0.04 217267 98.6776 51 0.02 217318 98.6777 9 0.00 217327 98.6778 10 0.00 217337 98.6780 15 0.01 217352 98.6781 12 0.01 217364 98.6782 140 0.06 217504 98.7783 663 0.30 218167 99.0784 843 0.38 219010 99.4788 78 0.04 219088 99.4790 253 0.11 219341 99.5792 28 0.01 219369 99.5794 57 0.03 219426 99.6798 23 0.01 219449 99.6801 109 0.05 219558 99.6830 847 0.38 220405 100.0
(table concluded)

Table 7NYS Operational Test 2000: Grade 8 ELA
Scale Score Frequency Distributions: Public
SS Freq % Cum Freq Cum % SS Freq % Cum Freq Cum %527 110 0.06 110 0.1 568 8 0.00 259 0.1528 1 0.00 111 0.1 569 8 0.00 267 0.1529 2 0.00 113 0.1 570 5 0.00 272 0.1533 1 0.00 114 0.1 571 17 0.01 289 0.1534 3 0.00 117 0.1 572 10 0.01 299 0.2535 2 0.00 119 0.1 573 23 0.01 322 0.2536 1 0.00 120 0.1 574 14 0.01 336 0.2537 2 0.00 122 0.1 575 12 0.01 348 0.2538 1 0.00 123 0.1 576 12 0.01 360 0.2539 2 0.00 125 0.1 577 18 0.01 378 0.2540 3 0.00 128 0.1 578 21 0.01 399 0.2542 1 0.00 129 0.1 579 19 0.01 418 0.2543 2 0.00 131 0.1 580 10 0.01 428 0.2544 1 0.00 132 0.1 581 21 0.01 449 0.2545 1 0.00 133 0.1 582 16 0.01 465 0.2546 2 0.00 135 0.1 583 18 0.01 483 0.2547 4 0.00 139 0.1 584 23 0.01 506 0.3548 2 0.00 141 0.1 585 18 0.01 524 0.3549 2 0.00 143 0.1 586 21 0.01 545 0.3550 1 0.00 144 0.1 587 27 0.01 572 0.3551 4 0.00 148 0.1 588 29 0.01 601 0.3552 3 0.00 151 0.1 589 23 0.01 624 0.3553 4 0.00 155 0.1 590 31 0.02 655 0.3554 6 0.00 161 0.1 591 27 0.01 682 0.3555 4 0.00 165 0.1 592 31 0.02 713 0.4556 4 0.00 169 0.1 593 32 0.02 745 0.4557 6 0.00 175 0.1 594 26 0.01 771 0.4558 9 0.00 184 0.1 595 32 0.02 803 0.4559 8 0.00 192 0.1 596 45 0.02 848 0.4560 4 0.00 196 0.1 597 39 0.02 887 0.5561 9 0.00 205 0.1 598 51 0.03 938 0.5562 6 0.00 211 0.1 599 38 0.02 976 0.5563 4 0.00 215 0.1 600 34 0.02 1010 0.5564 12 0.01 227 0.1 601 56 0.03 1066 0.5565 7 0.00 234 0.1 602 48 0.02 1114 0.6566 9 0.00 243 0.1 603 53 0.03 1167 0.6567 8 0.00 251 0.1 604 55 0.03 1222 0.6
(table continues)

Table 7NYS Operational Test 2000: Grade 8 ELA
Scale Score Frequency Distributions: Public
SS Freq % Cum Freq Cum % SS Freq % Cum Freq Cum %605 50 0.03 1272 0.6 642 536 0.27 9719 4.9606 67 0.03 1339 0.7 643 547 0.28 10266 5.2607 72 0.04 1411 0.7 644 546 0.28 10812 5.5608 78 0.04 1489 0.8 645 576 0.29 11388 5.8609 78 0.04 1567 0.8 646 661 0.34 12049 6.1610 89 0.05 1656 0.8 647 704 0.36 12753 6.5611 77 0.04 1733 0.9 648 665 0.34 13418 6.8612 101 0.05 1834 0.9 649 777 0.40 14195 7.2613 100 0.05 1934 1.0 650 781 0.40 14976 7.6614 122 0.06 2056 1.0 651 791 0.40 15767 8.0615 99 0.05 2155 1.1 652 901 0.46 16668 8.5616 127 0.06 2282 1.2 653 905 0.46 17573 8.9617 143 0.07 2425 1.2 654 914 0.47 18487 9.4618 153 0.08 2578 1.3 655 980 0.50 19467 9.9619 151 0.08 2729 1.4 656 888 0.45 20355 10.4620 153 0.08 2882 1.5 657 1130 0.58 21485 10.9621 169 0.09 3051 1.6 658 1158 0.59 22643 11.5622 170 0.09 3221 1.6 659 1182 0.60 23825 12.1623 177 0.09 3398 1.7 660 1219 0.62 25044 12.8624 177 0.09 3575 1.8 661 1248 0.64 26292 13.4625 184 0.09 3759 1.9 662 1228 0.63 27520 14.0626 222 0.11 3981 2.0 663 1329 0.68 28849 14.7627 233 0.12 4214 2.1 664 1427 0.73 30276 15.4628 255 0.13 4469 2.3 665 1383 0.70 31659 16.1629 259 0.13 4728 2.4 666 1532 0.78 33191 16.9630 260 0.13 4988 2.5 667 1512 0.77 34703 17.7631 292 0.15 5280 2.7 668 1601 0.82 36304 18.5632 305 0.16 5585 2.8 669 1697 0.86 38001 19.3633 303 0.15 5888 3.0 670 1722 0.88 39723 20.2634 373 0.19 6261 3.2 671 1764 0.90 41487 21.1635 342 0.17 6603 3.4 672 1815 0.92 43302 22.0636 367 0.19 6970 3.5 673 1799 0.92 45101 23.0637 387 0.20 7357 3.7 674 1959 1.00 47060 24.0638 407 0.21 7764 4.0 675 2008 1.02 49068 25.0639 463 0.24 8227 4.2 676 2001 1.02 51069 26.0640 473 0.24 8700 4.4 677 2038 1.04 53107 27.0641 483 0.25 9183 4.7 678 2138 1.09 55245 28.1
(table continues)
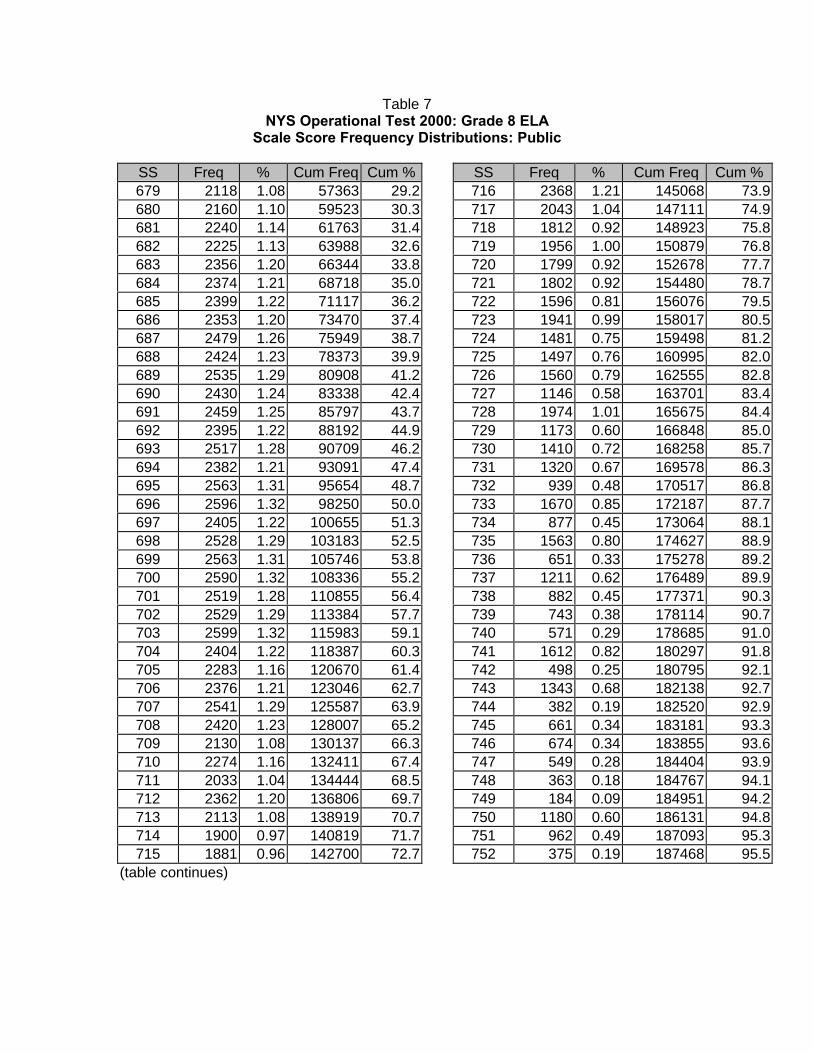
Table 7NYS Operational Test 2000: Grade 8 ELA
Scale Score Frequency Distributions: Public
SS Freq % Cum Freq Cum % SS Freq % Cum Freq Cum %679 2118 1.08 57363 29.2 716 2368 1.21 145068 73.9680 2160 1.10 59523 30.3 717 2043 1.04 147111 74.9681 2240 1.14 61763 31.4 718 1812 0.92 148923 75.8682 2225 1.13 63988 32.6 719 1956 1.00 150879 76.8683 2356 1.20 66344 33.8 720 1799 0.92 152678 77.7684 2374 1.21 68718 35.0 721 1802 0.92 154480 78.7685 2399 1.22 71117 36.2 722 1596 0.81 156076 79.5686 2353 1.20 73470 37.4 723 1941 0.99 158017 80.5687 2479 1.26 75949 38.7 724 1481 0.75 159498 81.2688 2424 1.23 78373 39.9 725 1497 0.76 160995 82.0689 2535 1.29 80908 41.2 726 1560 0.79 162555 82.8690 2430 1.24 83338 42.4 727 1146 0.58 163701 83.4691 2459 1.25 85797 43.7 728 1974 1.01 165675 84.4692 2395 1.22 88192 44.9 729 1173 0.60 166848 85.0693 2517 1.28 90709 46.2 730 1410 0.72 168258 85.7694 2382 1.21 93091 47.4 731 1320 0.67 169578 86.3695 2563 1.31 95654 48.7 732 939 0.48 170517 86.8696 2596 1.32 98250 50.0 733 1670 0.85 172187 87.7697 2405 1.22 100655 51.3 734 877 0.45 173064 88.1698 2528 1.29 103183 52.5 735 1563 0.80 174627 88.9699 2563 1.31 105746 53.8 736 651 0.33 175278 89.2700 2590 1.32 108336 55.2 737 1211 0.62 176489 89.9701 2519 1.28 110855 56.4 738 882 0.45 177371 90.3702 2529 1.29 113384 57.7 739 743 0.38 178114 90.7703 2599 1.32 115983 59.1 740 571 0.29 178685 91.0704 2404 1.22 118387 60.3 741 1612 0.82 180297 91.8705 2283 1.16 120670 61.4 742 498 0.25 180795 92.1706 2376 1.21 123046 62.7 743 1343 0.68 182138 92.7707 2541 1.29 125587 63.9 744 382 0.19 182520 92.9708 2420 1.23 128007 65.2 745 661 0.34 183181 93.3709 2130 1.08 130137 66.3 746 674 0.34 183855 93.6710 2274 1.16 132411 67.4 747 549 0.28 184404 93.9711 2033 1.04 134444 68.5 748 363 0.18 184767 94.1712 2362 1.20 136806 69.7 749 184 0.09 184951 94.2713 2113 1.08 138919 70.7 750 1180 0.60 186131 94.8714 1900 0.97 140819 71.7 751 962 0.49 187093 95.3715 1881 0.96 142700 72.7 752 375 0.19 187468 95.5
(table continues)

Table 7NYS Operational Test 2000: Grade 8 ELA
Scale Score Frequency Distributions: Public
SS Freq % Cum Freq Cum %753 947 0.48 188415 95.9754 245 0.12 188660 96.1755 212 0.11 188872 96.2756 537 0.27 189409 96.4757 190 0.10 189599 96.5758 151 0.08 189750 96.6759 182 0.09 189932 96.7760 64 0.03 189996 96.7761 49 0.02 190045 96.8762 170 0.09 190215 96.9763 1888 0.96 192103 97.8764 60 0.03 192163 97.8765 119 0.06 192282 97.9766 201 0.10 192483 98.0767 484 0.25 192967 98.3768 93 0.05 193060 98.3769 18 0.01 193078 98.3770 129 0.07 193207 98.4771 113 0.06 193320 98.4772 215 0.11 193535 98.5773 8 0.00 193543 98.5774 2 0.00 193545 98.5775 88 0.04 193633 98.6776 45 0.02 193678 98.6777 8 0.00 193686 98.6778 10 0.01 193696 98.6780 15 0.01 193711 98.6781 12 0.01 193723 98.6782 128 0.07 193851 98.7783 576 0.29 194427 99.0784 746 0.38 195173 99.4788 71 0.04 195244 99.4790 223 0.11 195467 99.5792 23 0.01 195490 99.5794 52 0.03 195542 99.6798 18 0.01 195560 99.6801 94 0.05 195654 99.6830 744 0.38 196398 100.0
(table concluded)

Table 8NYS Operational Test 2000: Grade 8 ELA
Scale Score Frequency Distributions: Non-Public
SS Freq % Cum Freq Cum % SS Freq % Cum Freq Cum %527 5 0.02 5 0.0 612 9 0.04 83 0.3551 1 0.00 6 0.0 613 8 0.03 91 0.4557 1 0.00 7 0.0 614 5 0.02 96 0.4558 1 0.00 8 0.0 615 3 0.01 99 0.4560 2 0.01 10 0.0 616 2 0.01 101 0.4564 1 0.00 11 0.0 617 10 0.04 111 0.5568 1 0.00 12 0.0 618 9 0.04 120 0.5569 2 0.01 14 0.1 619 5 0.02 125 0.5570 1 0.00 15 0.1 620 6 0.02 131 0.5571 1 0.00 16 0.1 621 3 0.01 134 0.6572 1 0.00 17 0.1 622 4 0.02 138 0.6575 1 0.00 18 0.1 623 7 0.03 145 0.6576 1 0.00 19 0.1 624 12 0.05 157 0.7577 1 0.00 20 0.1 625 7 0.03 164 0.7579 1 0.00 21 0.1 626 9 0.04 173 0.7582 1 0.00 22 0.1 627 17 0.07 190 0.8583 2 0.01 24 0.1 628 7 0.03 197 0.8588 1 0.00 25 0.1 629 11 0.05 208 0.9590 1 0.00 26 0.1 630 10 0.04 218 0.9592 3 0.01 29 0.1 631 12 0.05 230 1.0593 1 0.00 30 0.1 632 8 0.03 238 1.0594 1 0.00 31 0.1 633 10 0.04 248 1.0595 1 0.00 32 0.1 634 15 0.06 263 1.1596 2 0.01 34 0.1 635 19 0.08 282 1.2598 1 0.00 35 0.1 636 17 0.07 299 1.2600 4 0.02 39 0.2 637 19 0.08 318 1.3601 4 0.02 43 0.2 638 11 0.05 329 1.4602 3 0.01 46 0.2 639 17 0.07 346 1.4603 2 0.01 48 0.2 640 21 0.09 367 1.5604 2 0.01 50 0.2 641 27 0.11 394 1.6605 4 0.02 54 0.2 642 25 0.10 419 1.7606 4 0.02 58 0.2 643 29 0.12 448 1.9607 3 0.01 61 0.3 644 30 0.12 478 2.0608 3 0.01 64 0.3 645 36 0.15 514 2.1609 4 0.02 68 0.3 646 28 0.12 542 2.3610 2 0.01 70 0.3 647 41 0.17 583 2.4611 4 0.02 74 0.3 648 41 0.17 624 2.6
(table continues)

Table 8NYS Operational Test 2000: Grade 8 ELA
Scale Score Frequency Distributions: Non-Public
SS Freq % Cum Freq Cum % SS Freq % Cum Freq Cum %649 48 0.20 672 2.8 686 260 1.08 5728 23.9650 45 0.19 717 3.0 687 250 1.04 5978 24.9651 45 0.19 762 3.2 688 272 1.13 6250 26.0652 54 0.22 816 3.4 689 306 1.27 6556 27.3653 43 0.18 859 3.6 690 298 1.24 6854 28.6654 56 0.23 915 3.8 691 300 1.25 7154 29.8655 62 0.26 977 4.1 692 305 1.27 7459 31.1656 69 0.29 1046 4.4 693 316 1.32 7775 32.4657 59 0.25 1105 4.6 694 315 1.31 8090 33.7658 67 0.28 1172 4.9 695 336 1.40 8426 35.1659 78 0.32 1250 5.2 696 337 1.40 8763 36.5660 117 0.49 1367 5.7 697 357 1.49 9120 38.0661 75 0.31 1442 6.0 698 352 1.47 9472 39.5662 94 0.39 1536 6.4 699 369 1.54 9841 41.0663 104 0.43 1640 6.8 700 328 1.37 10169 42.4664 69 0.29 1709 7.1 701 332 1.38 10501 43.7665 112 0.47 1821 7.6 702 375 1.56 10876 45.3666 107 0.45 1928 8.0 703 349 1.45 11225 46.8667 114 0.47 2042 8.5 704 316 1.32 11541 48.1668 114 0.47 2156 9.0 705 371 1.55 11912 49.6669 147 0.61 2303 9.6 706 306 1.27 12218 50.9670 130 0.54 2433 10.1 707 388 1.62 12606 52.5671 154 0.64 2587 10.8 708 364 1.52 12970 54.0672 161 0.67 2748 11.4 709 354 1.47 13324 55.5673 172 0.72 2920 12.2 710 353 1.47 13677 57.0674 170 0.71 3090 12.9 711 305 1.27 13982 58.2675 175 0.73 3265 13.6 712 363 1.51 14345 59.8676 193 0.80 3458 14.4 713 328 1.37 14673 61.1677 168 0.70 3626 15.1 714 294 1.22 14967 62.3678 207 0.86 3833 16.0 715 303 1.26 15270 63.6679 226 0.94 4059 16.9 716 377 1.57 15647 65.2680 196 0.82 4255 17.7 717 317 1.32 15964 66.5681 241 1.00 4496 18.7 718 289 1.20 16253 67.7682 233 0.97 4729 19.7 719 332 1.38 16585 69.1683 231 0.96 4960 20.7 720 310 1.29 16895 70.4684 252 1.05 5212 21.7 721 319 1.33 17214 71.7685 256 1.07 5468 22.8 722 266 1.11 17480 72.8
(table continues)
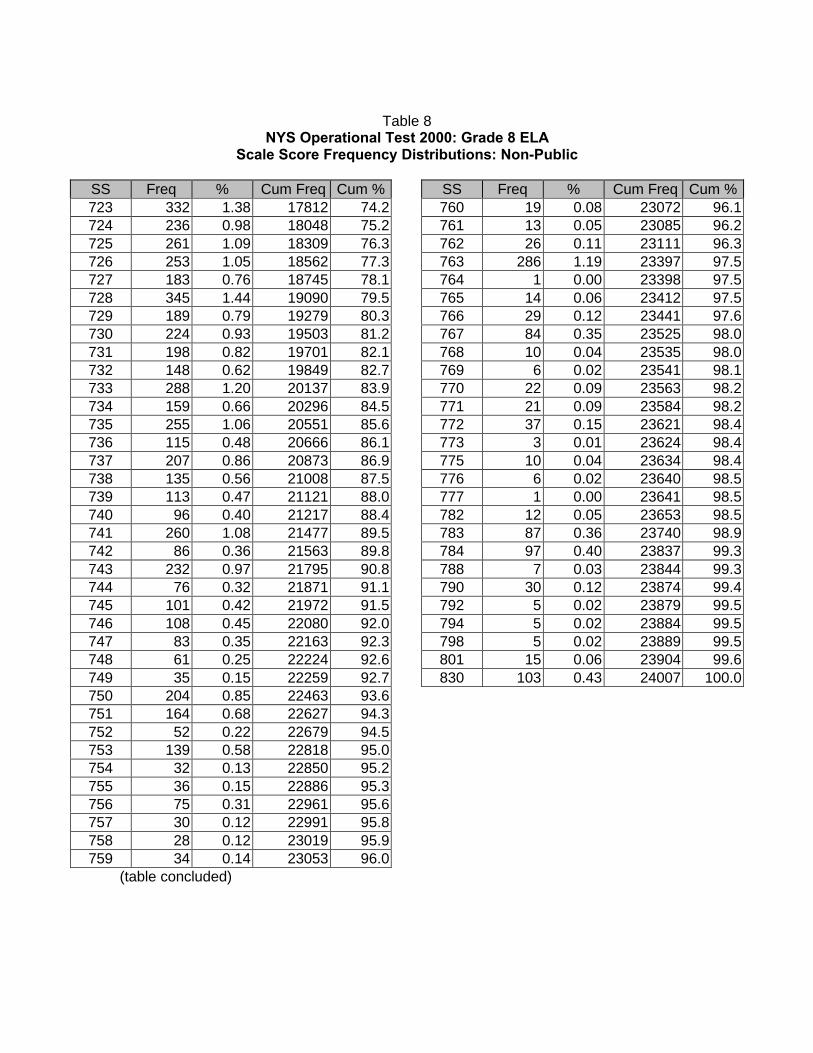
Table 8NYS Operational Test 2000: Grade 8 ELA
Scale Score Frequency Distributions: Non-Public
SS Freq % Cum Freq Cum % SS Freq % Cum Freq Cum %723 332 1.38 17812 74.2 760 19 0.08 23072 96.1724 236 0.98 18048 75.2 761 13 0.05 23085 96.2725 261 1.09 18309 76.3 762 26 0.11 23111 96.3726 253 1.05 18562 77.3 763 286 1.19 23397 97.5727 183 0.76 18745 78.1 764 1 0.00 23398 97.5728 345 1.44 19090 79.5 765 14 0.06 23412 97.5729 189 0.79 19279 80.3 766 29 0.12 23441 97.6730 224 0.93 19503 81.2 767 84 0.35 23525 98.0731 198 0.82 19701 82.1 768 10 0.04 23535 98.0732 148 0.62 19849 82.7 769 6 0.02 23541 98.1733 288 1.20 20137 83.9 770 22 0.09 23563 98.2734 159 0.66 20296 84.5 771 21 0.09 23584 98.2735 255 1.06 20551 85.6 772 37 0.15 23621 98.4736 115 0.48 20666 86.1 773 3 0.01 23624 98.4737 207 0.86 20873 86.9 775 10 0.04 23634 98.4738 135 0.56 21008 87.5 776 6 0.02 23640 98.5739 113 0.47 21121 88.0 777 1 0.00 23641 98.5740 96 0.40 21217 88.4 782 12 0.05 23653 98.5741 260 1.08 21477 89.5 783 87 0.36 23740 98.9742 86 0.36 21563 89.8 784 97 0.40 23837 99.3743 232 0.97 21795 90.8 788 7 0.03 23844 99.3744 76 0.32 21871 91.1 790 30 0.12 23874 99.4745 101 0.42 21972 91.5 792 5 0.02 23879 99.5746 108 0.45 22080 92.0 794 5 0.02 23884 99.5747 83 0.35 22163 92.3 798 5 0.02 23889 99.5748 61 0.25 22224 92.6 801 15 0.06 23904 99.6749 35 0.15 22259 92.7 830 103 0.43 24007 100.0750 204 0.85 22463 93.6751 164 0.68 22627 94.3752 52 0.22 22679 94.5753 139 0.58 22818 95.0754 32 0.13 22850 95.2755 36 0.15 22886 95.3756 75 0.31 22961 95.6757 30 0.12 22991 95.8758 28 0.12 23019 95.9759 34 0.14 23053 96.0
(table concluded)

Table 9NYS Operational Test 2000: Grade 8 ELA
Scale Score Frequency Distribution: LEP Status = 2 (Students at or above the 30th
percentile on an English reading test or a measure of English as a Second Language)
SS Freq % Cum Freq Cum % SS Freq % Cum Freq Cum %527 1 0.07 1 0.1 630 5 0.37 86 6.4571 1 0.07 2 0.1 631 5 0.37 91 6.8575 1 0.07 3 0.2 632 5 0.37 96 7.2579 1 0.07 4 0.3 633 5 0.37 101 7.6586 1 0.07 5 0.4 634 9 0.67 110 8.2587 1 0.07 6 0.4 635 11 0.82 121 9.1589 1 0.07 7 0.5 636 2 0.15 123 9.2590 1 0.07 8 0.6 637 2 0.15 125 9.4592 2 0.15 10 0.7 638 5 0.37 130 9.7597 3 0.22 13 1.0 639 5 0.37 135 10.1600 1 0.07 14 1.0 640 2 0.15 137 10.3601 2 0.15 16 1.2 641 14 1.05 151 11.3602 1 0.07 17 1.3 642 4 0.30 155 11.6603 2 0.15 19 1.4 643 12 0.90 167 12.5604 4 0.30 23 1.7 644 8 0.60 175 13.1605 1 0.07 24 1.8 645 12 0.90 187 14.0607 3 0.22 27 2.0 646 8 0.60 195 14.6608 1 0.07 28 2.1 647 8 0.60 203 15.2610 1 0.07 29 2.2 648 6 0.45 209 15.7612 2 0.15 31 2.3 649 10 0.75 219 16.4613 1 0.07 32 2.4 650 11 0.82 230 17.2614 1 0.07 33 2.5 651 6 0.45 236 17.7615 3 0.22 36 2.7 652 17 1.27 253 19.0616 1 0.07 37 2.8 653 6 0.45 259 19.4617 4 0.30 41 3.1 654 8 0.60 267 20.0618 3 0.22 44 3.3 655 10 0.75 277 20.7619 1 0.07 45 3.4 656 8 0.60 285 21.3620 6 0.45 51 3.8 657 13 0.97 298 22.3621 2 0.15 53 4.0 658 12 0.90 310 23.2622 2 0.15 55 4.1 659 12 0.90 322 24.1623 2 0.15 57 4.3 660 14 1.05 336 25.2624 3 0.22 60 4.5 661 15 1.12 351 26.3625 6 0.45 66 4.9 662 12 0.90 363 27.2626 2 0.15 68 5.1 663 21 1.57 384 28.8627 3 0.22 71 5.3 664 14 1.05 398 29.8628 3 0.22 74 5.5 665 16 1.20 414 31.0629 7 0.52 81 6.1 666 12 0.90 426 31.9(table continues)

Table 9NYS Operational Test 2000: Grade 8 ELA
Scale Score Frequency Distribution: LEP Status = 2 (Students at or above the 30th
percentile on an English reading test or a measure of English as a Second Language)
SS Freq % Cum Freq Cum % SS Freq % Cum Freq Cum %667 9 0.67 435 32.6 704 10 0.75 962 72.1668 15 1.12 450 33.7 705 16 1.20 978 73.3669 14 1.05 464 34.8 706 10 0.75 988 74.0670 11 0.82 475 35.6 707 16 1.20 1004 75.2671 16 1.20 491 36.8 708 13 0.97 1017 76.2672 15 1.12 506 37.9 709 15 1.12 1032 77.3673 19 1.42 525 39.3 710 9 0.67 1041 78.0674 15 1.12 540 40.4 711 9 0.67 1050 78.7675 17 1.27 557 41.7 712 9 0.67 1059 79.3676 18 1.35 575 43.1 713 20 1.50 1079 80.8677 10 0.75 585 43.8 714 9 0.67 1088 81.5678 13 0.97 598 44.8 715 12 0.90 1100 82.4679 20 1.50 618 46.3 716 13 0.97 1113 83.4680 15 1.12 633 47.4 717 8 0.60 1121 84.0681 17 1.27 650 48.7 718 9 0.67 1130 84.6682 15 1.12 665 49.8 719 5 0.37 1135 85.0683 12 0.90 677 50.7 720 9 0.67 1144 85.7684 23 1.72 700 52.4 721 14 1.05 1158 86.7685 15 1.12 715 53.6 722 10 0.75 1168 87.5686 20 1.50 735 55.1 723 9 0.67 1177 88.2687 9 0.67 744 55.7 724 5 0.37 1182 88.5688 11 0.82 755 56.6 725 9 0.67 1191 89.2689 12 0.90 767 57.5 726 8 0.60 1199 89.8690 13 0.97 780 58.4 727 3 0.22 1202 90.0691 17 1.27 797 59.7 728 10 0.75 1212 90.8692 18 1.35 815 61.0 729 6 0.45 1218 91.2693 17 1.27 832 62.3 730 8 0.60 1226 91.8694 11 0.82 843 63.1 731 6 0.45 1232 92.3695 8 0.60 851 63.7 732 4 0.30 1236 92.6696 17 1.27 868 65.0 733 7 0.52 1243 93.1697 9 0.67 877 65.7 734 2 0.15 1245 93.3698 13 0.97 890 66.7 735 4 0.30 1249 93.6699 8 0.60 898 67.3 736 3 0.22 1252 93.8700 17 1.27 915 68.5 737 7 0.52 1259 94.3701 13 0.97 928 69.5 738 4 0.30 1263 94.6702 12 0.90 940 70.4 739 2 0.15 1265 94.8703 12 0.90 952 71.3 740 2 0.15 1267 94.9(table continues)

Table 9NYS Operational Test 2000: Grade 8 ELA
Scale Score Frequency Distribution: LEP Status = 2 (Students at or above the 30th
percentile on an English reading test or a measure of English as a Second Language)
SS Freq % Cum Freq Cum %741 9 0.67 1276 95.6742 3 0.22 1279 95.8743 6 0.45 1285 96.3744 1 0.07 1286 96.3745 2 0.15 1288 96.5746 1 0.07 1289 96.6747 2 0.15 1291 96.7748 3 0.22 1294 96.9749 2 0.15 1296 97.1750 5 0.37 1301 97.5751 1 0.07 1302 97.5754 1 0.07 1303 97.6756 3 0.22 1306 97.8758 1 0.07 1307 97.9759 1 0.07 1308 98.0763 7 0.52 1315 98.5766 3 0.22 1318 98.7767 3 0.22 1321 99.0770 1 0.07 1322 99.0772 3 0.22 1325 99.3777 1 0.07 1326 99.3783 4 0.30 1330 99.6784 2 0.15 1332 99.8790 1 0.07 1333 99.9801 1 0.07 1334 99.9830 1 0.07 1335 100.0
(table concluded)

Table 10NYS Operational Test 2000: Grade 8 ELA
Scale Score Frequency Distributions: LEP Status = 3 (Students below the 30th percentileon an English reading test or a measure of English as a Second Language)
SS Freq % Cum Freq Cum % SS Freq % Cum Freq Cum %527 42 0.85 42 0.9 583 1 0.02 144 2.9528 1 0.02 43 0.9 584 4 0.08 148 3.0529 1 0.02 44 0.9 585 8 0.16 156 3.2533 1 0.02 45 0.9 586 6 0.12 162 3.3535 1 0.02 46 0.9 587 6 0.12 168 3.4539 1 0.02 47 1.0 588 6 0.12 174 3.5540 1 0.02 48 1.0 589 4 0.08 178 3.6543 1 0.02 49 1.0 590 11 0.22 189 3.8546 1 0.02 50 1.0 591 4 0.08 193 3.9548 1 0.02 51 1.0 592 13 0.26 206 4.2551 2 0.04 53 1.1 593 5 0.10 211 4.3554 2 0.04 55 1.1 594 8 0.16 219 4.4555 3 0.06 58 1.2 595 8 0.16 227 4.6556 1 0.02 59 1.2 596 8 0.16 235 4.8557 3 0.06 62 1.3 597 9 0.18 244 5.0558 2 0.04 64 1.3 598 19 0.39 263 5.3560 1 0.02 65 1.3 599 10 0.20 273 5.5561 4 0.08 69 1.4 600 9 0.18 282 5.7562 2 0.04 71 1.4 601 18 0.37 300 6.1564 1 0.02 72 1.5 602 11 0.22 311 6.3565 3 0.06 75 1.5 603 13 0.26 324 6.6566 3 0.06 78 1.6 604 15 0.30 339 6.9567 4 0.08 82 1.7 605 11 0.22 350 7.1568 1 0.02 83 1.7 606 12 0.24 362 7.4569 4 0.08 87 1.8 607 16 0.32 378 7.7571 7 0.14 94 1.9 608 16 0.32 394 8.0572 2 0.04 96 1.9 609 24 0.49 418 8.5573 6 0.12 102 2.1 610 17 0.35 435 8.8574 3 0.06 105 2.1 611 18 0.37 453 9.2575 3 0.06 108 2.2 612 26 0.53 479 9.7576 3 0.06 111 2.3 613 26 0.53 505 10.3577 6 0.12 117 2.4 614 27 0.55 532 10.8578 8 0.16 125 2.5 615 22 0.45 554 11.3579 7 0.14 132 2.7 616 32 0.65 586 11.9580 4 0.08 136 2.8 617 25 0.51 611 12.4581 3 0.06 139 2.8 618 48 0.97 659 13.4582 4 0.08 143 2.9 619 30 0.61 689 14.0
(table continues)

Table 10NYS Operational Test 2000: Grade 8 ELA
Scale Score Frequency Distributions: LEP Status = 3 (Students below the 30th percentileon an English reading test or a measure of English as a Second Language)
SS Freq % Cum Freq Cum % SS Freq % Cum Freq Cum %620 34 0.69 723 14.7 657 75 1.52 3030 61.5621 36 0.73 759 15.4 658 89 1.81 3119 63.3622 43 0.87 802 16.3 659 86 1.75 3205 65.1623 36 0.73 838 17.0 660 84 1.71 3289 66.8624 45 0.91 883 17.9 661 64 1.30 3353 68.1625 33 0.67 916 18.6 662 77 1.56 3430 69.7626 52 1.06 968 19.7 663 75 1.52 3505 71.2627 48 0.97 1016 20.6 664 68 1.38 3573 72.6628 60 1.22 1076 21.9 665 65 1.32 3638 73.9629 47 0.95 1123 22.8 666 69 1.40 3707 75.3630 49 1.00 1172 23.8 667 74 1.50 3781 76.8631 63 1.28 1235 25.1 668 63 1.28 3844 78.1632 57 1.16 1292 26.2 669 71 1.44 3915 79.5633 48 0.97 1340 27.2 670 64 1.30 3979 80.8634 61 1.24 1401 28.5 671 53 1.08 4032 81.9635 42 0.85 1443 29.3 672 64 1.30 4096 83.2636 70 1.42 1513 30.7 673 48 0.97 4144 84.2637 60 1.22 1573 31.9 674 55 1.12 4199 85.3638 66 1.34 1639 33.3 675 55 1.12 4254 86.4639 56 1.14 1695 34.4 676 35 0.71 4289 87.1640 65 1.32 1760 35.7 677 45 0.91 4334 88.0641 78 1.58 1838 37.3 678 43 0.87 4377 88.9642 73 1.48 1911 38.8 679 33 0.67 4410 89.6643 53 1.08 1964 39.9 680 31 0.63 4441 90.2644 82 1.67 2046 41.6 681 33 0.67 4474 90.9645 55 1.12 2101 42.7 682 33 0.67 4507 91.5646 73 1.48 2174 44.2 683 32 0.65 4539 92.2647 73 1.48 2247 45.6 684 25 0.51 4564 92.7648 83 1.69 2330 47.3 685 30 0.61 4594 93.3649 86 1.75 2416 49.1 686 21 0.43 4615 93.7650 71 1.44 2487 50.5 687 20 0.41 4635 94.1651 69 1.40 2556 51.9 688 17 0.35 4652 94.5652 72 1.46 2628 53.4 689 25 0.51 4677 95.0653 98 1.99 2726 55.4 690 19 0.39 4696 95.4654 86 1.75 2812 57.1 691 27 0.55 4723 95.9655 70 1.42 2882 58.5 692 17 0.35 4740 96.3656 73 1.48 2955 60.0 693 9 0.18 4749 96.4
(table continues)

Table 10NYS Operational Test 2000: Grade 8 ELA
Scale Score Frequency Distributions: LEP Status = 3 (Students below the 30th percentileon an English reading test or a measure of English as a Second Language)
SS Freq % Cum Freq Cum % SS Freq % Cum Freq Cum %694 16 0.32 4765 96.8 738 1 0.02 4917 99.9695 12 0.24 4777 97.0 739 1 0.02 4918 99.9696 10 0.20 4787 97.2 747 1 0.02 4919 99.9697 8 0.16 4795 97.4 756 2 0.04 4921 99.9698 10 0.20 4805 97.6 783 2 0.04 4923 100.0699 9 0.18 4814 97.8 784 1 0.02 4924 100.0700 9 0.18 4823 97.9701 5 0.10 4828 98.1702 8 0.16 4836 98.2703 9 0.18 4845 98.4704 7 0.14 4852 98.5705 4 0.08 4856 98.6706 6 0.12 4862 98.7707 4 0.08 4866 98.8708 5 0.10 4871 98.9709 3 0.06 4874 99.0710 2 0.04 4876 99.0711 4 0.08 4880 99.1712 2 0.04 4882 99.1713 4 0.08 4886 99.2714 1 0.02 4887 99.2715 1 0.02 4888 99.3716 3 0.06 4891 99.3717 2 0.04 4893 99.4718 1 0.02 4894 99.4720 4 0.08 4898 99.5721 2 0.04 4900 99.5722 2 0.04 4902 99.6723 2 0.04 4904 99.6725 2 0.04 4906 99.6726 3 0.06 4909 99.7728 1 0.02 4910 99.7729 1 0.02 4911 99.7730 2 0.04 4913 99.8732 1 0.02 4914 99.8735 1 0.02 4915 99.8737 1 0.02 4916 99.8
(table concluded)

Table 11NYS Operational Test 2000: Grade 8 ELA
Scale Score Frequency Distributions: Non-Disabled Students
SS Freq % Cum Freq Cum % SS Freq % Cum Freq Cum %527 26 0.01 26 0.0 586 4 0.00 129 0.1529 1 0.00 27 0.0 587 2 0.00 131 0.1534 1 0.00 28 0.0 588 6 0.00 137 0.1535 1 0.00 29 0.0 589 5 0.00 142 0.1537 1 0.00 30 0.0 590 6 0.00 148 0.1539 1 0.00 31 0.0 591 8 0.00 156 0.1540 1 0.00 32 0.0 592 6 0.00 162 0.1548 1 0.00 33 0.0 593 7 0.00 169 0.1555 2 0.00 35 0.0 594 9 0.00 178 0.1556 3 0.00 38 0.0 595 12 0.01 190 0.1557 2 0.00 40 0.0 596 15 0.01 205 0.1558 3 0.00 43 0.0 597 13 0.01 218 0.1559 2 0.00 45 0.0 598 14 0.01 232 0.1561 1 0.00 46 0.0 599 5 0.00 237 0.1562 3 0.00 49 0.0 600 11 0.01 248 0.1563 1 0.00 50 0.0 601 13 0.01 261 0.1564 4 0.00 54 0.0 602 12 0.01 273 0.1566 1 0.00 55 0.0 603 17 0.01 290 0.2567 1 0.00 56 0.0 604 18 0.01 308 0.2568 1 0.00 57 0.0 605 18 0.01 326 0.2569 3 0.00 60 0.0 606 16 0.01 342 0.2570 1 0.00 61 0.0 607 15 0.01 357 0.2571 4 0.00 65 0.0 608 14 0.01 371 0.2572 2 0.00 67 0.0 609 28 0.01 399 0.2573 3 0.00 70 0.0 610 25 0.01 424 0.2574 6 0.00 76 0.0 611 25 0.01 449 0.2575 4 0.00 80 0.0 612 43 0.02 492 0.3576 5 0.00 85 0.0 613 35 0.02 527 0.3577 5 0.00 90 0.0 614 43 0.02 570 0.3578 4 0.00 94 0.0 615 26 0.01 596 0.3579 11 0.01 105 0.1 616 44 0.02 640 0.3580 2 0.00 107 0.1 617 38 0.02 678 0.4581 3 0.00 110 0.1 618 54 0.03 732 0.4582 5 0.00 115 0.1 619 58 0.03 790 0.4583 1 0.00 116 0.1 620 51 0.03 841 0.4584 7 0.00 123 0.1 621 67 0.03 908 0.5585 2 0.00 125 0.1 622 67 0.03 975 0.5
(table continues)

Table 11NYS Operational Test 2000: Grade 8 ELA
Scale Score Frequency Distributions: Non-Disabled Students
SS Freq % Cum Freq Cum % SS Freq % Cum Freq Cum %623 77 0.04 1052 0.5 660 945 0.49 14727 7.7624 84 0.04 1136 0.6 661 937 0.49 15664 8.1625 92 0.05 1228 0.6 662 954 0.50 16618 8.6626 101 0.05 1329 0.7 663 1018 0.53 17636 9.2627 115 0.06 1444 0.8 664 1111 0.58 18747 9.8628 112 0.06 1556 0.8 665 1086 0.56 19833 10.3629 111 0.06 1667 0.9 666 1215 0.63 21048 10.9630 121 0.06 1788 0.9 667 1225 0.64 22273 11.6631 125 0.07 1913 1.0 668 1342 0.70 23615 12.3632 143 0.07 2056 1.1 669 1401 0.73 25016 13.0633 158 0.08 2214 1.2 670 1435 0.75 26451 13.8634 190 0.10 2404 1.3 671 1510 0.79 27961 14.5635 156 0.08 2560 1.3 672 1566 0.81 29527 15.4636 186 0.10 2746 1.4 673 1573 0.82 31100 16.2637 189 0.10 2935 1.5 674 1724 0.90 32824 17.1638 226 0.12 3161 1.6 675 1765 0.92 34589 18.0639 247 0.13 3408 1.8 676 1808 0.94 36397 18.9640 272 0.14 3680 1.9 677 1826 0.95 38223 19.9641 282 0.15 3962 2.1 678 1964 1.02 40187 20.9642 322 0.17 4284 2.2 679 1955 1.02 42142 21.9643 306 0.16 4590 2.4 680 1970 1.02 44112 22.9644 335 0.17 4925 2.6 681 2121 1.10 46233 24.0645 344 0.18 5269 2.7 682 2104 1.09 48337 25.1646 406 0.21 5675 3.0 683 2223 1.16 50560 26.3647 447 0.23 6122 3.2 684 2292 1.19 52852 27.5648 431 0.22 6553 3.4 685 2331 1.21 55183 28.7649 524 0.27 7077 3.7 686 2322 1.21 57505 29.9650 504 0.26 7581 3.9 687 2426 1.26 59931 31.2651 521 0.27 8102 4.2 688 2410 1.25 62341 32.4652 601 0.31 8703 4.5 689 2531 1.32 64872 33.7653 624 0.32 9327 4.9 690 2433 1.27 67305 35.0654 638 0.33 9965 5.2 691 2498 1.30 69803 36.3655 696 0.36 10661 5.5 692 2462 1.28 72265 37.6656 637 0.33 11298 5.9 693 2579 1.34 74844 38.9657 799 0.42 12097 6.3 694 2471 1.29 77315 40.2658 832 0.43 12929 6.7 695 2666 1.39 79981 41.6659 853 0.44 13782 7.2 696 2721 1.42 82702 43.0
(table continues)

Table 11NYS Operational Test 2000: Grade 8 ELA
Scale Score Frequency Distributions: Non-Disabled Students
SS Freq % Cum Freq Cum % SS Freq % Cum Freq Cum %697 2562 1.33 85264 44.3 734 1022 0.53 165584 86.1698 2657 1.38 87921 45.7 735 1775 0.92 167359 87.0699 2733 1.42 90654 47.2 736 757 0.39 168116 87.4700 2731 1.42 93385 48.6 737 1395 0.73 169511 88.2701 2663 1.39 96048 50.0 738 1006 0.52 170517 88.7702 2724 1.42 98772 51.4 739 847 0.44 171364 89.1703 2783 1.45 101555 52.8 740 656 0.34 172020 89.5704 2587 1.35 104142 54.2 741 1844 0.96 173864 90.4705 2512 1.31 106654 55.5 742 577 0.30 174441 90.7706 2529 1.32 109183 56.8 743 1555 0.81 175996 91.5707 2801 1.46 111984 58.2 744 449 0.23 176445 91.8708 2672 1.39 114656 59.6 745 755 0.39 177200 92.2709 2386 1.24 117042 60.9 746 774 0.40 177974 92.6710 2510 1.31 119552 62.2 747 625 0.33 178599 92.9711 2260 1.18 121812 63.4 748 418 0.22 179017 93.1712 2635 1.37 124447 64.7 749 216 0.11 179233 93.2713 2340 1.22 126787 65.9 750 1362 0.71 180595 93.9714 2127 1.11 128914 67.0 751 1115 0.58 181710 94.5715 2130 1.11 131044 68.2 752 423 0.22 182133 94.7716 2661 1.38 133705 69.5 753 1073 0.56 183206 95.3717 2297 1.19 136002 70.7 754 271 0.14 183477 95.4718 2036 1.06 138038 71.8 755 244 0.13 183721 95.6719 2212 1.15 140250 72.9 756 597 0.31 184318 95.9720 2062 1.07 142312 74.0 757 217 0.11 184535 96.0721 2068 1.08 144380 75.1 758 177 0.09 184712 96.1722 1804 0.94 146184 76.0 759 213 0.11 184925 96.2723 2225 1.16 148409 77.2 760 82 0.04 185007 96.2724 1673 0.87 150082 78.1 761 61 0.03 185068 96.3725 1723 0.90 151805 79.0 762 194 0.10 185262 96.4726 1771 0.92 153576 79.9 763 2150 1.12 187412 97.5727 1301 0.68 154877 80.6 764 60 0.03 187472 97.5728 2269 1.18 157146 81.7 765 130 0.07 187602 97.6729 1344 0.70 158490 82.4 766 227 0.12 187829 97.7730 1599 0.83 160089 83.3 767 558 0.29 188387 98.0731 1487 0.77 161576 84.0 768 102 0.05 188489 98.0732 1061 0.55 162637 84.6 769 22 0.01 188511 98.0733 1925 1.00 164562 85.6 770 150 0.08 188661 98.1
(table continues)
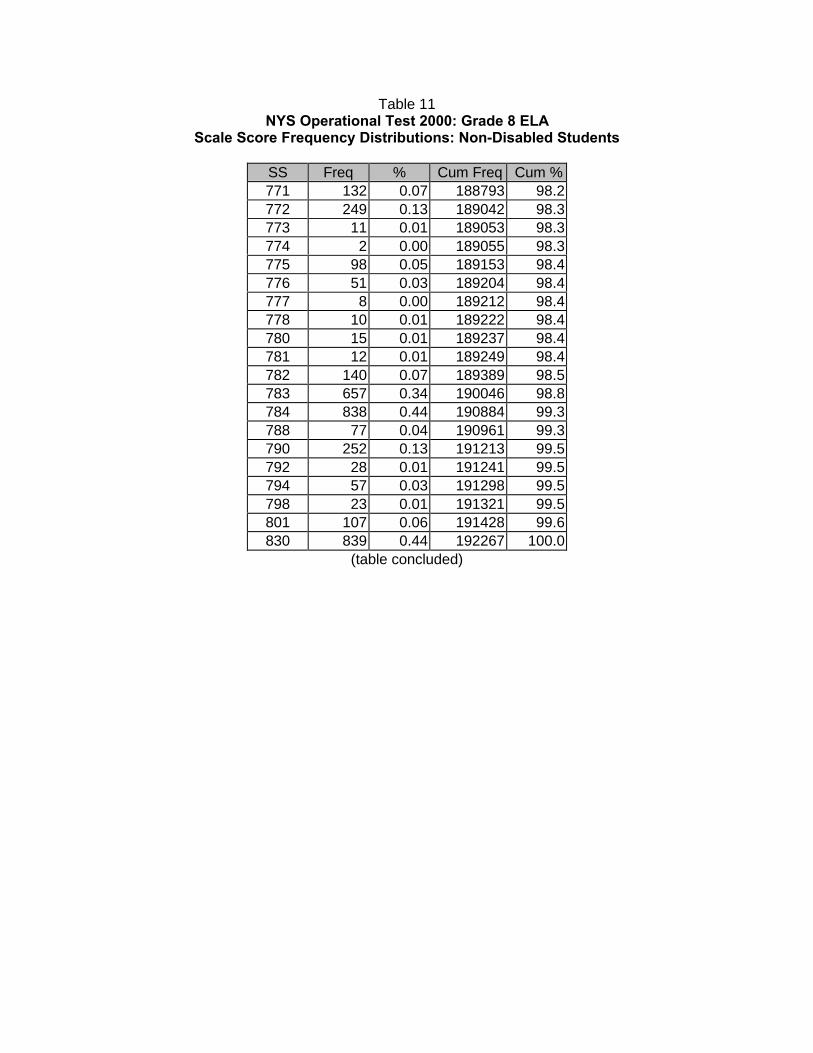
Table 11NYS Operational Test 2000: Grade 8 ELA
Scale Score Frequency Distributions: Non-Disabled Students
SS Freq % Cum Freq Cum %771 132 0.07 188793 98.2772 249 0.13 189042 98.3773 11 0.01 189053 98.3774 2 0.00 189055 98.3775 98 0.05 189153 98.4776 51 0.03 189204 98.4777 8 0.00 189212 98.4778 10 0.01 189222 98.4780 15 0.01 189237 98.4781 12 0.01 189249 98.4782 140 0.07 189389 98.5783 657 0.34 190046 98.8784 838 0.44 190884 99.3788 77 0.04 190961 99.3790 252 0.13 191213 99.5792 28 0.01 191241 99.5794 57 0.03 191298 99.5798 23 0.01 191321 99.5801 107 0.06 191428 99.6830 839 0.44 192267 100.0
(table concluded)
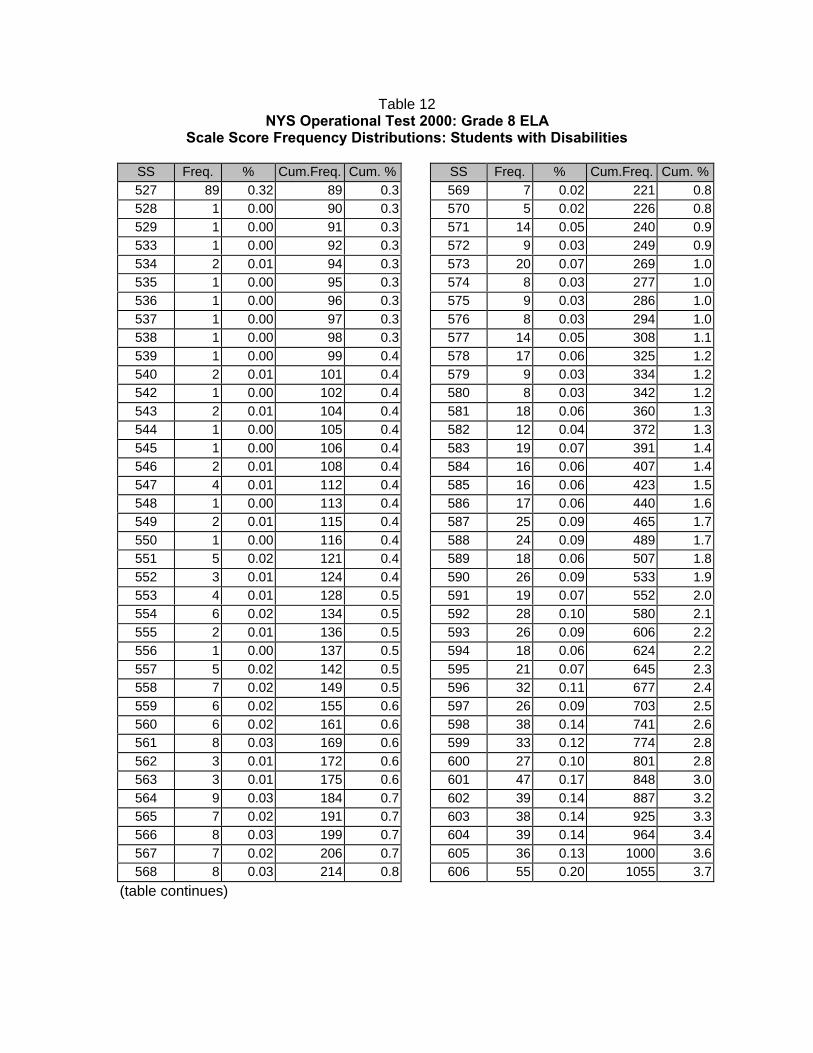
Table 12NYS Operational Test 2000: Grade 8 ELA
Scale Score Frequency Distributions: Students with Disabilities
SS Freq. % Cum.Freq. Cum. % SS Freq. % Cum.Freq. Cum. %527 89 0.32 89 0.3 569 7 0.02 221 0.8528 1 0.00 90 0.3 570 5 0.02 226 0.8529 1 0.00 91 0.3 571 14 0.05 240 0.9533 1 0.00 92 0.3 572 9 0.03 249 0.9534 2 0.01 94 0.3 573 20 0.07 269 1.0535 1 0.00 95 0.3 574 8 0.03 277 1.0536 1 0.00 96 0.3 575 9 0.03 286 1.0537 1 0.00 97 0.3 576 8 0.03 294 1.0538 1 0.00 98 0.3 577 14 0.05 308 1.1539 1 0.00 99 0.4 578 17 0.06 325 1.2540 2 0.01 101 0.4 579 9 0.03 334 1.2542 1 0.00 102 0.4 580 8 0.03 342 1.2543 2 0.01 104 0.4 581 18 0.06 360 1.3544 1 0.00 105 0.4 582 12 0.04 372 1.3545 1 0.00 106 0.4 583 19 0.07 391 1.4546 2 0.01 108 0.4 584 16 0.06 407 1.4547 4 0.01 112 0.4 585 16 0.06 423 1.5548 1 0.00 113 0.4 586 17 0.06 440 1.6549 2 0.01 115 0.4 587 25 0.09 465 1.7550 1 0.00 116 0.4 588 24 0.09 489 1.7551 5 0.02 121 0.4 589 18 0.06 507 1.8552 3 0.01 124 0.4 590 26 0.09 533 1.9553 4 0.01 128 0.5 591 19 0.07 552 2.0554 6 0.02 134 0.5 592 28 0.10 580 2.1555 2 0.01 136 0.5 593 26 0.09 606 2.2556 1 0.00 137 0.5 594 18 0.06 624 2.2557 5 0.02 142 0.5 595 21 0.07 645 2.3558 7 0.02 149 0.5 596 32 0.11 677 2.4559 6 0.02 155 0.6 597 26 0.09 703 2.5560 6 0.02 161 0.6 598 38 0.14 741 2.6561 8 0.03 169 0.6 599 33 0.12 774 2.8562 3 0.01 172 0.6 600 27 0.10 801 2.8563 3 0.01 175 0.6 601 47 0.17 848 3.0564 9 0.03 184 0.7 602 39 0.14 887 3.2565 7 0.02 191 0.7 603 38 0.14 925 3.3566 8 0.03 199 0.7 604 39 0.14 964 3.4567 7 0.02 206 0.7 605 36 0.13 1000 3.6568 8 0.03 214 0.8 606 55 0.20 1055 3.7
(table continues)
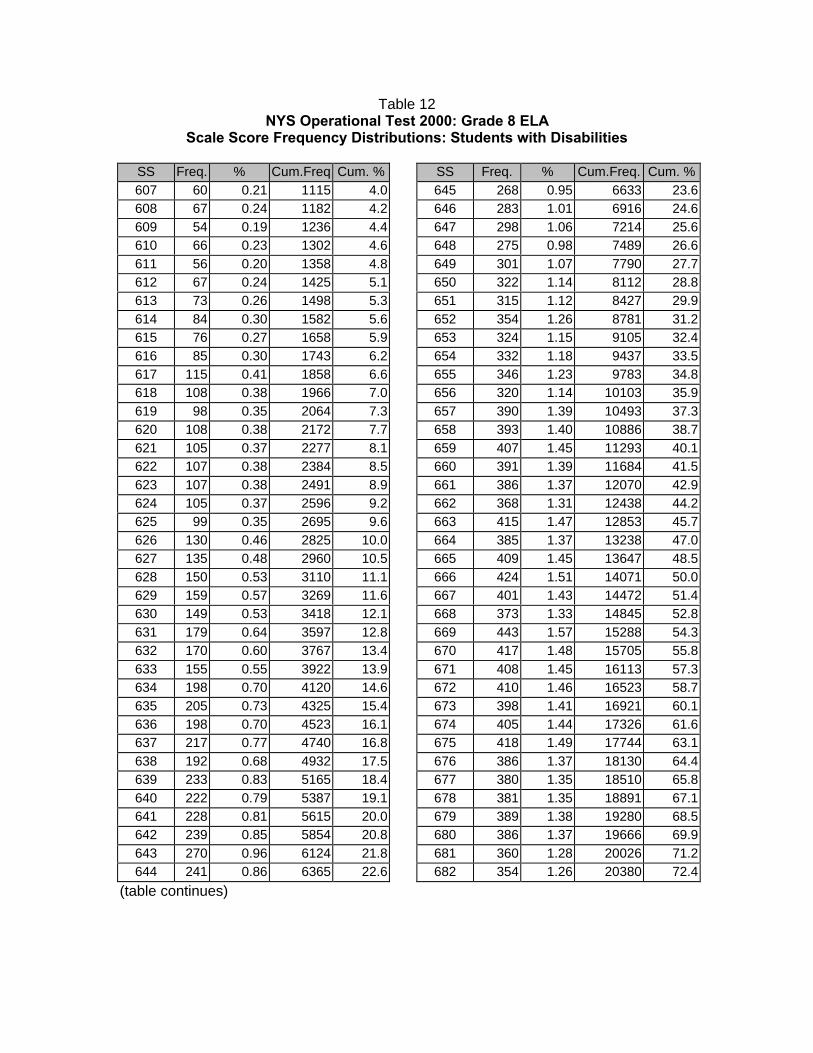
Table 12NYS Operational Test 2000: Grade 8 ELA
Scale Score Frequency Distributions: Students with Disabilities
SS Freq. % Cum.Freq Cum. % SS Freq. % Cum.Freq. Cum. %607 60 0.21 1115 4.0 645 268 0.95 6633 23.6608 67 0.24 1182 4.2 646 283 1.01 6916 24.6609 54 0.19 1236 4.4 647 298 1.06 7214 25.6610 66 0.23 1302 4.6 648 275 0.98 7489 26.6611 56 0.20 1358 4.8 649 301 1.07 7790 27.7612 67 0.24 1425 5.1 650 322 1.14 8112 28.8613 73 0.26 1498 5.3 651 315 1.12 8427 29.9614 84 0.30 1582 5.6 652 354 1.26 8781 31.2615 76 0.27 1658 5.9 653 324 1.15 9105 32.4616 85 0.30 1743 6.2 654 332 1.18 9437 33.5617 115 0.41 1858 6.6 655 346 1.23 9783 34.8618 108 0.38 1966 7.0 656 320 1.14 10103 35.9619 98 0.35 2064 7.3 657 390 1.39 10493 37.3620 108 0.38 2172 7.7 658 393 1.40 10886 38.7621 105 0.37 2277 8.1 659 407 1.45 11293 40.1622 107 0.38 2384 8.5 660 391 1.39 11684 41.5623 107 0.38 2491 8.9 661 386 1.37 12070 42.9624 105 0.37 2596 9.2 662 368 1.31 12438 44.2625 99 0.35 2695 9.6 663 415 1.47 12853 45.7626 130 0.46 2825 10.0 664 385 1.37 13238 47.0627 135 0.48 2960 10.5 665 409 1.45 13647 48.5628 150 0.53 3110 11.1 666 424 1.51 14071 50.0629 159 0.57 3269 11.6 667 401 1.43 14472 51.4630 149 0.53 3418 12.1 668 373 1.33 14845 52.8631 179 0.64 3597 12.8 669 443 1.57 15288 54.3632 170 0.60 3767 13.4 670 417 1.48 15705 55.8633 155 0.55 3922 13.9 671 408 1.45 16113 57.3634 198 0.70 4120 14.6 672 410 1.46 16523 58.7635 205 0.73 4325 15.4 673 398 1.41 16921 60.1636 198 0.70 4523 16.1 674 405 1.44 17326 61.6637 217 0.77 4740 16.8 675 418 1.49 17744 63.1638 192 0.68 4932 17.5 676 386 1.37 18130 64.4639 233 0.83 5165 18.4 677 380 1.35 18510 65.8640 222 0.79 5387 19.1 678 381 1.35 18891 67.1641 228 0.81 5615 20.0 679 389 1.38 19280 68.5642 239 0.85 5854 20.8 680 386 1.37 19666 69.9643 270 0.96 6124 21.8 681 360 1.28 20026 71.2644 241 0.86 6365 22.6 682 354 1.26 20380 72.4
(table continues)

Table 12NYS Operational Test 2000: Grade 8 ELA
Scale Score Frequency Distributions: Students with Disabilities
SS Freq. % Cum.Freq. Cum. % SS Freq. % Cum.Freq Cum. %683 364 1.29 20744 73.7 721 53 0.19 27314 97.1684 334 1.19 21078 74.9 722 58 0.21 27372 97.3685 324 1.15 21402 76.1 723 48 0.17 27420 97.4686 291 1.03 21693 77.1 724 44 0.16 27464 97.6687 303 1.08 21996 78.2 725 35 0.12 27499 97.7688 286 1.02 22282 79.2 726 42 0.15 27541 97.9689 310 1.10 22592 80.3 727 28 0.10 27569 98.0690 295 1.05 22887 81.3 728 50 0.18 27619 98.2691 261 0.93 23148 82.3 729 18 0.06 27637 98.2692 238 0.85 23386 83.1 730 35 0.12 27672 98.3693 254 0.90 23640 84.0 731 31 0.11 27703 98.5694 226 0.80 23866 84.8 732 26 0.09 27729 98.5695 233 0.83 24099 85.6 733 33 0.12 27762 98.7696 212 0.75 24311 86.4 734 14 0.05 27776 98.7697 200 0.71 24511 87.1 735 43 0.15 27819 98.9698 223 0.79 24734 87.9 736 9 0.03 27828 98.9699 199 0.71 24933 88.6 737 23 0.08 27851 99.0700 187 0.66 25120 89.3 738 11 0.04 27862 99.0701 188 0.67 25308 89.9 739 9 0.03 27871 99.1702 180 0.64 25488 90.6 740 11 0.04 27882 99.1703 165 0.59 25653 91.2 741 28 0.10 27910 99.2704 133 0.47 25786 91.6 742 7 0.02 27917 99.2705 142 0.50 25928 92.1 743 20 0.07 27937 99.3706 153 0.54 26081 92.7 744 9 0.03 27946 99.3707 128 0.45 26209 93.1 745 7 0.02 27953 99.3708 112 0.40 26321 93.5 746 8 0.03 27961 99.4709 98 0.35 26419 93.9 747 7 0.02 27968 99.4710 117 0.42 26536 94.3 748 6 0.02 27974 99.4711 78 0.28 26614 94.6 749 3 0.01 27977 99.4712 90 0.32 26704 94.9 750 22 0.08 27999 99.5713 101 0.36 26805 95.3 751 11 0.04 28010 99.5714 67 0.24 26872 95.5 752 4 0.01 28014 99.6715 54 0.19 26926 95.7 753 13 0.05 28027 99.6716 84 0.30 27010 96.0 754 6 0.02 28033 99.6717 63 0.22 27073 96.2 755 4 0.01 28037 99.6718 65 0.23 27138 96.4 756 15 0.05 28052 99.7719 76 0.27 27214 96.7 757 3 0.01 28055 99.7720 47 0.17 27261 96.9 758 2 0.01 28057 99.7
(table continues)

Table 12NYS Operational Test 2000: Grade 8 ELA
Scale Score Frequency Distributions: Students with Disabilities
SS Freq. % Cum.Freq. Cum. %759 3 0.01 28060 99.7760 1 0.00 28061 99.7761 1 0.00 28062 99.7762 2 0.01 28064 99.7763 24 0.09 28088 99.8764 1 0.00 28089 99.8765 3 0.01 28092 99.8766 3 0.01 28095 99.8767 10 0.04 28105 99.9768 1 0.00 28106 99.9769 2 0.01 28108 99.9770 1 0.00 28109 99.9771 2 0.01 28111 99.9772 3 0.01 28114 99.9777 1 0.00 28115 99.9783 6 0.02 28121 99.9784 5 0.02 28126 100.0788 1 0.00 28127 100.0790 1 0.00 28128 100.0801 2 0.01 28130 100.0830 8 0.03 28138 100.0
(table concluded)

Figure 1
NYS Operational Test 2000: Grade 8 ELAItem 28 ICC

Figure 2
NYS Operational Test 2000: Grade 8 ELAAnchor TCCs

State
Non-disabled
Public
Non-Public
Disabled
LEP 2
LEP 3
600 700 800
Scale Scores
0
500
1000
1500
2000
2500
3000
Fre
qu
ency
527 830
Figure 3
NYS Operational Test 2000: Grade 8 ELA
Frequency Distribution by Group