2000 e.on annual report - uab barcelona · klöckner & co’s extensive network of facilities...
TRANSCRIPT
2000 Annual Report
2000
An
nua
l Rep
ort
Financial Calendar
Interim Report: January–March 20012001 Annual Shareholders’ MeetingDividend PaymentInterim Report: January–June 2001Interim Report: January–September 2001Annual Press Conference, Annual Analyst ConferenceAnnual Shareholders’ Meeting
May 18, 2001May 18, 2001May 21, 2001
August 16, 2001November 15, 2001
March 21, 2002May 28, 2002
Provisional
1999
69,754
5,048
3,095
2,839
2,748
11.2
11,045
4,866
26,293
94,628
203,733
3.90
1.25
1.79
36.09
6.68
in millions (pro forma)1
Sales
Income
Pretax income
Net income
After minority interests
Internal operating profit
Return on equity after taxes2 in percent
Investments
Cash flow from operations
Stockholders’ equity
Total assets
Employees at year-end
Per share in (pro forma)
Earnings
Cash dividend
Dividend including tax credit
Stockholders’ equity4
Cash flow from operations
+/– %
+34
+35
+35
+30
+1
+2.33
+35
–20
+7
+12
–8
+30
+8
+8
+7
–20
2000
93,240
6,802
4,184
3,678
2,762
13.5
14,961
3,889
28,033
106,215
186,788
5.07
1.35
1.93
38.61
5.36
E.ON 2000
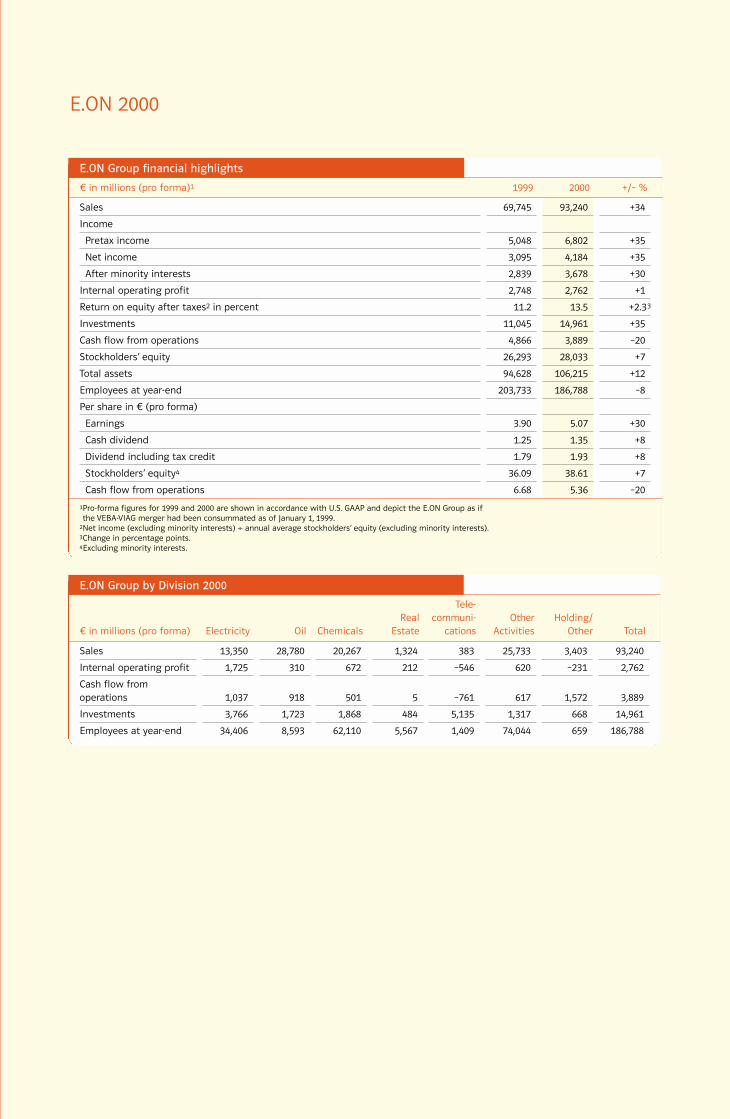
1Pro-forma figures for 1999 and 2000 are shown in accordance with U.S. GAAP and depict the E.ON Group as if the VEBA-VIAG merger had been consummated as of January 1, 1999.
2Net income (excluding minority interests) ÷ annual average stockholders’ equity (excluding minority interests).3Change in percentage points.4Excluding minority interests.
in millions (pro forma)
Sales
Internal operating profit
Cash flow from operations
Investments
Employees at year-end
Electricity
13,350
1,725
1,037
3,766
34,406
Oil
28,780
310
918
1,723
8,593
Chemicals
20,267
672
501
1,868
62,110
RealEstate
1,324
212
5
484
5,567
Tele-communi-
cations
383
–546
–761
5,135
1,409
OtherActivities
25,733
620
617
1,317
74,044
Holding/Other
3,403
–231
1,572
668
659
Total
93,240
2,762
3,889
14,961
186,788
E.ON Group by Division 2000
For more information
about E.ON, contact:
Corporate Communications
E.ON AG
Bennigsenplatz 1
40474 Düsseldorf
Germany
T +49 (211) 4579-367
F +49 (211) 4579-532
www.eon.com
Only the German version of this Annual Report is legally binding.
This Annual Report contains certain forward-looking statements that are subject to risk and uncertainties.
For information identifying economic, currency, regulatory, technological, competitive, and some other
important factors that could cause actual results to differ materially from those anticipated in the
forward-looking statements, you should refer to E.ON’s filings to the Securities and Exchange Commission
(Washington, DC), as updated from time to time, in particular to the discussion included in the section of
E.ON’s 2000 Annual Report on Form 20-F entitled ”Item 3. Key Information: Risk Factors.“
E.ON Group financial highlights

Energy. E.ON AG’s energy companies supply Germany
and Europe with electricity, district heating, natural
gas, water, and petroleum products.
E.ON Energie AG was forged by the tie-up of
PreussenElektra and Bayernwerk. Via subsidiaries and
shareholdings, E.ON Energie supplies roughly one
third of Germany’s population with power, about
10 million inhabitants with drinking water, and just
over five million customers with natural gas. It also
has stakes in major energy companies in Sweden,
Switzerland, the Netherlands, Italy, Russia, Latvia,
Hungary, and the Czech Republic.
VEBA Oel’s operations encompass global petro-
leum exploration and production, petroleum refining
and petrochemicals, and petroleum product retailing.
VEBA Oel’s Aral subsidiary is Germany’s premier service
station operator and heating oil retailer. VEBA Oel
also operates Germany’s biggest refinery system.
Chemicals. Merging Degussa-Hüls AG and SKW Trost-
berg AG created the world’s largest specialty chemi-
cals group: the new Degussa AG. Degussa is arrayed
in six market-oriented divisions: Health and Nutrition,
Construction Chemicals, Fine and Industrial Chemi-
cals, Performance Chemicals, Coatings and Advanced
Fillers, and Specialty Polymers. Degussa is the global
market leader for numerous products.
E.ON AG: an overview
VEBA Oel AGGelsenkirchenCapital: DM488 million 100%
VEBA Oil & Gas GmbHEssen Capital: 356 million 100%
VEBA Oil Refining & Petrochemicals GmbHGelsenkirchenCapital: 50 million 100%
VEBA Oil Supply and Trading GmbHHamburgCapital: 3 million 100%
Ruhr Oel GmbHDüsseldorfCapital: 223 million 50%
Aral Aktiengesellschaft & Co.BochumCapital: 172 million 100%
Aral Wärme Service GmbHGelsenkirchenCapital: 23 million 100%
Erdöl-Raffinerie-Emsland GmbH & Co. KGLingenCapital: 0.05 million 100%
VEBA Oel-Verarbeitungs GmbHGelsenkirchenCapital: 0.05 million 100%
Degussa AGDüsseldorfCapital: 206 million 64.6%
dmc2 Degussa Metals Catalysts Cerdec AG. HanauCapital: DM50 million 100%
Goldschmidt AGEssenCapital: 34 million 97.3%
Röhm GmbH & Co. KGDarmstadtCapital: DM102 million 100%
Stockhausen GmbH & Co. KGKrefeldCapital: DM84 million 99.9%
Degussa-Hüls Antwerpen N.V.Antwerp (Belgium)Capital: BEF 1,100 million 100%
SKW Biosystems SAS Boulogne Billancourt (France)Capital: FRF 978 million 100%
Degussa-Hüls CorporationRidgefield Park, NJ (USA)Capital: $6 million 100%
SKW Americas, Inc.Cleveland, OH (USA)Capital: $60 million 100%
Degussa-Hüls Ltda.Guarulhos (Brazil)Capital: BRL 53 million 100%
Degussa-Hüls Japan Co., Ltd.Tokyo (Japan)Capital: JPY 998 million 100%
NMB Co., Ltd.Tokyo (Japan)Capital: JPY 4,540 million 100%
Korea Carbon Black Co., Ltd.Inchon (South Korea)Capital: KRW 107,804 million 100%
Energy Chemicals Other Activities
Viterra AGEssenCapital: 182 million 100%
Stinnes AGMülheim an der RuhrCapital: 190 million 65.5%
Klöckner & Co AGDuisburgCapital: 100 million 100%
VIAG Telecom Beteiligungs GmbHMunichCapital: 0.3 million 100%
E.ON Telecom GmbHDüsseldorfCapital: 128 million 100%
VAW aluminium AGBonnCapital: DM227 million 100%
MEMC Electronic Materials Inc.St. Peters, MO (USA)Capital: $772 million 71.8%
With roughly 125,000 housing units of its own, another 50,000via shareholdings, and numerous commercial properties, Viterrais one of Germany’s foremost real-estate service enterprises.
Stinnes’s more than 1,500 facilities around the globe put it inthe top tier of distribution and logistics companies.
Klöckner & Co’s extensive network of facilities in Europe andNorth America makes it a leading materials distribution spe-cialist.
VIAG Telecom holds a majority interest in ONE, Austria’s third-largest cellular phone company. ONE also offers fixed-line andinternet services.
E.ON Telecom has a shareholding in France’s Bouygues Tele-com, a mobile phone operator.
VAW aluminium is one of Europe’s biggest aluminum manufac-turers and processors. VAW has customers around the world inthe packaging, automotive, construction, printing, and transpor-tation industries.
MEMC is one of the world’s premier makers of silicon wafersand owns production facilities in the U.S., Asia, and Europe.
OBAG AGRegensburgCapital: 94 million 97.6%
Pesag AktiengesellschaftPaderbornCapital: 17 million 54.7%
Schleswag AktiengesellschaftRendsburgCapital: 102 million 65.3%
TEAG Thüringer Energie AG ErfurtCapital: 92 million 74.9%
Überlandwerk Unterfranken AGWürzburgCapital: 45 million 92.4%
Contigas Deutsche Energie- AktiengesellschaftMunichCapital: 118 million 98.7%
Thüga AGMunichCapital: 164 million 57.3%
Gelsenwasser AGGelsenkirchenCapital: 88 million 80.5 %
E.ON Benelux Generation N.V.Voorburg (the Netherlands)Capital: NLG 19 million 100%
Sydkraft AGMalmö (Sweden)Capital: SEK 1,910 million 29.4%
Watt AGZurich (Switzerland)Capital: CHF 88 million 24.5%
BKW FMB Energie AGBern (Switzerland)Capital: CHF 132 million 20%
Dél-dunántúli ÁramszolgáltatóRészvénytársaságPécs (Hungary)Capital: HUF 30 billion 90.6%
Tiszántúll Áramszolgáltató RLDebrecen (Hungary)Capital: HUF 34 billion 83.1%
E.ON Energie AGMunichCapital: 639 million 100%
E.ON Kraftwerke GmbHHanoverCapital: 103 million 100%
E.ON Kernkraft GmbHHanoverCapital: 110 million 100%
E.ON Wasserkraft GmbHLandshutCapital: 173 million 100%
E.ON Netz GmbHBayreuthCapital: 110 million 100%
E.ON Trading GmbHMunichCapital: 10 million 100%
E.ON Vertrieb GmbHMunichCapital: 1.25 million 100%
E.ON Engineering GmbHGelsenkirchenCapital: 11 million 100%
Avacon AGHelmstedtCapital: 53 million 54.7%
e.dis. Energie Nord AGFürstenwalde an der SpreeCapital: 175 million 70%
Elektrizitätswerk Minden-RavensbergMindenCapital: 41 million 25.1%
Energie-AktiengesellschaftMitteldeutschland EAMKasselCapital: 61 million 46%
EVO Energieversorgung Oberfranken AGBayreuthCapital: 90 million 90.8%
EWE AktiengesellschaftOldenburgCapital: 153 million 27.4%
Isar-Amperwerke AGMunichCapital: 192 million 87.3%
As of March 1, 2001
2000 Annual Report
2000
An
nua
l Rep
ort
Financial Calendar
Interim Report: January–March 20012001 Annual Shareholders’ MeetingDividend PaymentInterim Report: January–June 2001Interim Report: January–September 2001Annual Press Conference, Annual Analyst ConferenceAnnual Shareholders’ Meeting
May 18, 2001May 18, 2001May 21, 2001
August 16, 2001November 15, 2001
March 21, 2002May 28, 2002
1999
69,745
5,048
3,095
2,839
2,748
11.2
11,045
4,866
26,293
94,628
203,733
3.90
1.25
1.79
36.09
6.68
in millions (pro forma)1
Sales
Income
Pretax income
Net income
After minority interests
Internal operating profit
Return on equity after taxes2 in percent
Investments
Cash flow from operations
Stockholders’ equity
Total assets
Employees at year-end
Per share in (pro forma)
Earnings
Cash dividend
Dividend including tax credit
Stockholders’ equity4
Cash flow from operations
+/– %
+34
+35
+35
+30
+1
+2.33
+35
–20
+7
+12
–8
+30
+8
+8
+7
–20
2000
93,240
6,802
4,184
3,678
2,762
13.5
14,961
3,889
28,033
106,215
186,788
5.07
1.35
1.93
38.61
5.36
E.ON 2000
1Pro-forma figures for 1999 and 2000 are shown in accordance with U.S. GAAP and depict the E.ON Group as if the VEBA-VIAG merger had been consummated as of January 1, 1999.
2Net income (excluding minority interests) ÷ annual average stockholders’ equity (excluding minority interests).3Change in percentage points.4Excluding minority interests.
in millions (pro forma)
Sales
Internal operating profit
Cash flow from operations
Investments
Employees at year-end
Electricity
13,350
1,725
1,037
3,766
34,406
Oil
28,780
310
918
1,723
8,593
Chemicals
20,267
672
501
1,868
62,110
RealEstate
1,324
212
5
484
5,567
Tele-communi-
cations
383
–546
–761
5,135
1,409
OtherActivities
25,733
620
617
1,317
74,044
Holding/Other
3,403
–231
1,572
668
659
Total
93,240
2,762
3,889
14,961
186,788
E.ON Group by Division 2000
For more information
about E.ON, contact:
Corporate Communications
E.ON AG
Bennigsenplatz 1
40474 Düsseldorf
Germany
T +49 (211) 4579-367
F +49 (211) 4579-532
www.eon.com
Only the German version of this Annual Report is legally binding.
This Annual Report contains certain forward-looking statements that are subject to risk and uncertainties.
For information identifying economic, currency, regulatory, technological, competitive, and some other
important factors that could cause actual results to differ materially from those anticipated in the
forward-looking statements, you should refer to E.ON’s filings to the Securities and Exchange Commission
(Washington, DC), as updated from time to time, in particular to the discussion included in the section of
E.ON’s 2000 Annual Report on Form 20-F entitled ”Item 3. Key Information: Risk Factors.“
E.ON Group financial highlights

In June 2000, VEBA and VIAG became E.ON. The merged company ranks among the world’s largest investor-owned energy service providers and is the world’s biggest specialty chemicals group. E.ON is also a new brand—a brand that’s already recognized by nine out of ten people in Germany.Each day last year, becoming E.ON was a big part of our lives. On each page of our 2000 Annual Report, you’ll find part of E.ON.

001 002 003 004 005 006 007 008 009 010 011 012
025 026 027 028 029 030 031 032 033 034 035 036
049 050 051 052 053 054 055 056 057 058 059 060
073 074 075 076 077 078 079 080 081 082 083 084
097 098 099 100 101 102 103 104 105 106 107 108
121 122 123 124 125 126 127 128 129 130 131 132
Contents
Energetic and innovative. Warm and welcoming. That’s our new logo. Its organic form along with our new corporate color—a vibrant red—define our new look.

013 014 015 016 017 018 019 020 021 022 023 024
037 038 039 040 041 042 043 044 045 046 047 048
061 062 063 064 065 066 067 068 069 070 071 072
085 086 087 088 089 090 091 092 093 094 095 096
109 110 111 112 113 114 115 116 117 118 119 120
133 134 135 136 137 138 139 140 141 142 143 144
004 Supervisory Board
005 Report of the Supervisory Board
008 Board of Management
010 Letter to our shareowners
014 The year in review
016 Images of new energy
026 Report of the Board of Management:
026 Review of Operations
038 Additional Information:
040 E.ON shares
042 ROCE
046 Strategy and investment plan
048 Employees
051 Environmental protection
052 Group Divisions:
054 Electricity
060 Oil
062 Chemicals
068 Real Estate
069 Telecommunications
070 Other Activities
072 Consolidated Financial Statements
138 Mandates of Board Members
142 Major shareholdings
144 Two-year highlights
Financial Calendar

004
Supervisory Board
Honorary Chairman
Prof. Dr. Günter Vogelsang
Düsseldorf
Supervisory Board
Hermann Josef Strenger
Chairman of the Supervisory Board,
Bayer AG, Leverkusen
Chairman
(until May 25, 2000)
Dr. Klaus Liesen
Chairman of the Supervisory Board,
Ruhrgas AG, Essen
Chairman
(since May 25, 2000)
Hubertus Schmoldt
Chairman of the Board of
Management, Industriegewerk-
schaft Bergbau, Chemie, Energie,
Hanover
Deputy Chairman
Dr. Karl-Hermann Baumann
Chairman of the Supervisory Board,
Siemens AG, Munich
(since May 25, 2000)
Ralf Blauth
Industrial Clerk (Industriekaufmann),
Marl
Dr. Rolf-E. Breuer
Spokesman of the Board of
Management, Deutsche Bank AG,
Frankfurt am Main
Dr. Gerhard Cromme
Chairman of the Board of
Management, ThyssenKrupp AG,
Düsseldorf
Rainer Dücker
Power Plant Worker, Hanover
(until December 31, 2000)
Henner Hecht-Wieber
Electrician, Bochum
(until August 31, 2000)
Wolf-Rüdiger Hinrichsen
Accounting and Administration
Manager (kfm. Angestellter),
Düsseldorf
Ulrich Hocker
General Manager, German Investor
Protection Association, Düsseldorf
Dr. Jochen Holzer
Honorary Senator, former
Chairman of the Supervisory Board,
VIAG AG, Munich
(since May 25, 2000)
Dr. h.c. André Leysen
Chairman of the Administrative
Board, GEVAERT N.V., Mortsel,
Belgium
Herbert Mai
Former Chairman, Gewerkschaft
Öffentliche Dienste, Transport und
Verkehr, Stuttgart
Dagobert Millinghaus
Accounting and Administration
Manager (kfm. Angestellter),
Mülheim an der Ruhr
Margret Mönig-Raane
Chairwoman,
Gewerkschaft Handel, Banken und
Versicherungen, Düsseldorf
Ulrich Otte
Systems Engineer (Leittechniker),
Munich
(since January 1, 2001)
Armin Schreiber
Electrical Engineer, Grafenrheinfeld
(since November 29, 2000)
Dr. Henning Schulte-Noelle
Chairman of the Board of
Management, Allianz AG, Munich
Morris Tabaksblat
Chairman of the Administrative
Board, Reed Elsevier plc.,
Amsterdam, the Netherlands
(until May 25, 2000)
Kurt F. Viermetz
Retired Vice-Chairman and Director
of the Board, J.P. Morgan & Co., Inc.,
New York, USA
Dr. Bernd W. Voss
Member of the Board of
Management, Dresdner Bank AG,
Frankfurt am Main
Dr. Peter Weber
Director of the Legal Department,
Degussa AG, Marl
Kurt Weslowski
Chemical Worker, Gelsenkirchen

005
Dr. Klaus Liesen
Chairman of the
Supervisory Board
The Supervisory Board monitored and advised man-
agement during the financial year under review.
Management regularly informed us about the pro-
gress of business and the financial status of the Com-
pany. We discussed oral and written reports submit-
ted by the Board of Management in depth at eight
meetings in 2000. We debated comprehensively all
measures subject to Supervisory Board approval. Be-
tween meetings, the Board of Management provided
Supervisory Board members with detailed informa-
tion in writing on major business transactions of key
importance for the Company’s further development.
Furthermore, the Supervisory Board’s Executive Com-
mittee received oral reports presented by the Board
of Management and discussed them in depth at six
sessions. The Chairman of the Supervisory Board was
informed on an ongoing basis about all major busi-
ness transactions as well as the development of key
financial figures.
At its meetings, the Supervisory Board dealt inten-
sively with the Group’s strategic focus on its core
energy and specialty chemicals businesses. Reporting
by the Board of Management also concentrated
on the merger of VEBA and VIAG and the progress of
post-merger integration. We were continuously
informed about the status of the Energy Division’s
divestitures and asset sales stemming from the EU
Commission’s antitrust requirements. In addition, the
Board of Management presented us detailed informa-
tion about the merger of PreussenElektra and Bayern-
werk to form E.ON Energie AG as well as that of
Degussa-Hüls and SKW Trostberg to create the new
Degussa AG. We thoroughly debated the merged
companies’ strategic orientation.
The effects of power market liberalization and
their consequences for E.ON Energie formed a key
topic of our discussions. In addition, we comprehen-
sively debated the agreement reached with the
German government on the continued use of nuclear
energy and developments in the area of energy policy.
Report of the Supervisory Board

006
Report of the Supervisory Board
We dealt in depth with the disposal of the majority
stake in Schmalbach-Lubeca, the sale of Gerresheimer
Glas and the Company’s electronics business as
well as Degussa-Hüls’s and SKW Trostberg’s takeover
of Laporte, the UK-based fine chemicals company.
We likewise discussed in detail VIAG Interkom’s partici-
pation in Germany’s UMTS auction and the option
agreement reached with British Telecom regarding
VIAG Interkom. The Board of Management also informed
us about UMTS license auctions in Switzerland and
Austria as well as the sale of the stake in Orange Com-
munications, the Swiss mobile communications com-
pany.
Other subjects of our discussions included the
financial situation and business prospects of the major
Group companies; investment, financing, and person-
nel planning for 2001 through 2003; and the Compa-
ny’s complete conversion to U.S. generally accepted
accounting principles (U.S. GAAP). During Supervisory
Board meetings, the Board of Management also regu-
larly informed us about the use and scope of deriva-
tive financial instruments. In addition, we resolved to
authorize management to repurchase E.ON AG shares.
The auditors, PwC Deutsche Revision Wirtschafts-
prüfungsgesellschaft, Düsseldorf, approved by the
Annual Shareholders’ Meeting and appointed by the
Supervisory Board, audited the Financial Statements
of E.ON AG and the Consolidated Financial Statements
as of December 31, 2000, as well as the combined
Review of Operations, and submitted an unqualified
opinion thereon. The auditors also reviewed and deliv-
ered an audit opinion on the Consolidated Financial
Statements, compiled for the first time in compliance
with U.S. GAAP. The Consolidated Financial Statements
are supplemented by the required disclosures in com-
pliance with § 292a of Germany’s Commercial Code.
The Consolidated Financial Statements compiled under
U.S. GAAP exempts the Company from the requirement
to release Consolidated Financial Statements in accor-
dance with German GAAP. Furthermore, the auditors
examined E.ON AG’s early risk detection system. This
examination revealed that the system is fulfilling its
tasks. All members of the Supervisory Board received
the Financial Statements, the Review of Operations,
and the Auditor’s Reports. The Supervisory Board’s
Executive Committee and the Supervisory Board itself
at its meeting to approve the Financial Statements
also reviewed these documents in detail with the
auditors present.
We examined the Financial Statements of E.ON AG,
the Review of Operations, and the proposal of the
Board of Management regarding the appropriation of
net income available for distribution and agreed to
these without any objections. We approved the Audi-
tor’s Report.
We approved the Financial Statements of E.ON AG
prepared by the Board of Management and also the
Consolidated Financial Statements. The Financial
Statements are thus adopted. We approved the Con-
solidated Financial Statements. We agree with the
Report of the Board of Management and, in particular,
with its statements concerning the Company’s future
development.
We agree with the Board of Management’s proposal
for appropriating net income available for distribution,
which includes a cash dividend payment of 1.35 per
share.
On September 14, 2000, Prof. Dr. Johannes Zahn
passed away at the age of 93. Prof. Zahn was a mem-
ber of VEBA AG’s Supervisory Board and its Executive
Committee from 1966 through 1983. With his interna-
tional experience and wise counsel, he made a decisive
contribution to our Group during the dynamic phase of
its development following the first partial privatization.
Prof. Zahn’s name will always remain closely associated
with E.ON’s history.

007
A court appointed Armin Schreiber to succeed
Mr. Hecht-Wieber as an employee representative mem-
ber of the Supervisory Board. Ulrich Otte joined the
Supervisory Board as a substitute member to succeed
Mr. Dücker.
The Supervisory Board thanks these gentlemen for
their fine work and their constructive approach to their
responsibilities.
The mandate of Helmut Mamsch, member of the
Board of Management since 1993, was terminated by
mutual agreement on March 31, 2000.
Following the entry of the VEBA-VIAG merger that
formed E.ON into the Commercial Register on June 16,
2000, the mandates of the following members of
the Board of Management were terminated by mutual
agreement:
• Dr. Wulf H. Bernotat, member of the Board of
Management since 1998
• Gunther Beuth, member of the Board of Manage-
ment since 1998
• Wilhelm Bonse-Geuking, member of the Board of
Management since 1995
• Dr. Hans-Dieter Harig, member of the Board of
Management since 1988
We would like to take this opportunity to again thank
these gentlemen for their superb work and their out-
standing achievements for the E.ON Group.
As of June 16, 2000, the Supervisory Board appointed
Prof. Dr. Wilhelm Simson as a member and Chairman of
the Board of Management, and Dr. Erhard Schipporeit
as a member of the Board of Management.
The Supervisory Board wishes to thank the entire
Board of Management, the Works Councils and all
the employees of E.ON AG and its affiliated companies
for their dedication and hard work.
Düsseldorf
March 26, 2001
The Supervisory Board
Dr. Klaus Liesen
Chairman
On November 25, 2000, Prof. Dr. Dr. h.c. Marcus Bierich
passed away at the age of 74. Prof. Bierich was a
member of VEBA AG’s Supervisory Board from 1983
through 1998. His balanced judgment combined with
his impressive intellect and abilities made him a
valuable and prescient adviser. Prof. Bierich rendered
exemplary service to the Group during an important
stage of its development. We will honor his memory.
Following the conclusion of VEBA AG’s Annual
Shareholders’ Meeting on May 25, 2000, Hermann J.
Strenger, member of the Supervisory Board since 1988
and Chairman of the Supervisory Board as well as
member of its Executive Committee since 1993,
resigned from the Supervisory Board. In exemplary
fashion, he used his vast experience, decisiveness, and
business acumen to guide and support the Group’s
new strategic orientation and expansion. Mr. Strenger
rendered tremendous service to the Company during
a significant phase of its history.
Morris Tabaksblat, member of the Supervisory
Board since 1998, also resigned his mandate on May 25,
2000. The Supervisory Board thanks him for his excel-
lent work.
As their successors, the shareholders elected
Dr. Karl-Hermann Baumann and Dr. Jochen Holzer to
the Supervisory Board at VEBA AG’s 2000 Annual
Shareholders’ Meeting.
At its meeting on May 25, 2000, the Supervisory
Board elected Dr. Klaus Liesen to be its Chairman until
the end of its remaining term.
Henner Hecht-Wieber and Rainer Dücker resigned
their mandates as Supervisory Board members effec-
tive August 31 and December 31, 2000, respectively.

008
Ulrich Hartmann
Born 1938 in Berlin
Member of the Board
of Management since 1989
Chairman and co-CEO
Düsseldorf
Prof. Dr. Wilhelm Simson
Born 1938 in Cologne
Member of the Board
of Management since 2000
Chairman and co-CEO
Düsseldorf
(since June 16, 2000)
Dr. Wulf H. Bernotat, born 1948 in Göttingen
Member of the Board of Management since 1998
Chairman of the Board of Management, Stinnes AG,
Mülheim an der Ruhr
(until June 16, 2000)
Gunter Beuth, born 1937 in Stolp
Member of the Board of Management since 1998
Chairman of the Board of Management, Viterrra AG,
Essen
(until June 16, 2000)
Dr. Hans Michael Gaul
Born 1942 in Düsseldorf
Member of the Board
of Management since 1990
Controlling/Corporate Planning,
M& A, Legal Affairs
Düsseldorf
Board of Management
Wilhelm Bonse-Geuking, born 1941 in Arnsberg
Member of the Board of Management since 1995
Chairman of the Board of Management, VEBA Oel AG,
Gelsenkirchen
(until June 16, 2000)
Dr. Hans-Dieter Harig, born 1938 in Alt-Jassewitz
Member of the Board of Management since 1998
Chairman of the Board of Management, E.ON Energie AG,
Munich
(until June 16, 2000)

009
Dr. Erhard Schipporeit
Born 1949 in Bitterfeld
Member of the Board
of Management since 2000
Finance, Accounting, Taxes, IT
Düsseldorf
(since June 16, 2000)
Executive Vice Presidents
Bernhard Gerstenberg, Düsseldorf
Gert von der Groeben, Düsseldorf
Ulrich Hüppe, Düsseldorf
Dr. Rolf Pohlig, Düsseldorf
Michael Söhlke, Düsseldorf
Hans Gisbert Ulmke, Düsseldorf
Dr. Manfred Krüper
Born 1941 in Gelsenkirchen
Member of the Board
of Management since 1996
Human Resources,
Infrastructure and Services,
Procurement, Organization
Düsseldorf
Helmut Mamsch, born 1944 in Bergen
Member of the Board of
Management since 1993
Group Corporate Strategy
Düsseldorf
(until March 31, 2000)

010
Dear Shareowners:
You’re holding your new company’s very first Annual
Report. At the start of the third millennium, the Group
also entered a new era. We successfully completed
Germany’s largest-ever merger. The E.ON Group has a
new, clearly defined corporate structure. And in its
first year, your company demonstrated its impressive
earnings strength.
We lifted our core energy and specialty chemicals
businesses into a new dimension. E.ON Energie has
established itself as a top-tier European utility. Degussa
is already the global leader in the attractive specialty
chemicals sector. We’re now further enlarging these
solid positions and growing internationally. At the same
time, we’re divesting our non-core activities. We’ve
already successfully sold a number of businesses. These
include E-Plus, VEBA Electronics, Gerresheimer Glas,
Orange Communications, and most recently VIAG
Interkom. Total proceeds from these divestitures amount
to about 21 billion. By selling non-core assets, we’ve
freed up substantial resources to fuel targeted growth
in our core businesses.
Even with the merger and the disposals, we never
took our eye off day-to-day operations. We successfully
met the challenges in our markets and again put in an
outstanding performance.
2000 internal operating profit up slightly from prior
year’s record. At 2.8 billion, our internal operating
profit for 2000 was slightly higher than the previous
year’s all-time high. This primarily reflects substantially
reduced losses in Telecommunications in the wake of
disposals, higher crude oil prices paired with a strong
dollar, and the cost reductions achieved in our Electric-
ity Division.
We established the new earnings record despite
Germany’s fiercely contested power market. As we
had anticipated, keen competition in the electricity
sector left its mark on E.ON Energie’s internal operat-
ing profit. Unlike in the previous financial year, in 2000
our Electricity Division felt the full brunt of market
liberalization. The Group’s other divisions all reported
higher earnings, in some cases substantially so.
Letter to our shareowners
Ulrich Hartmann and Prof. Dr. Wilhelm Simson
011
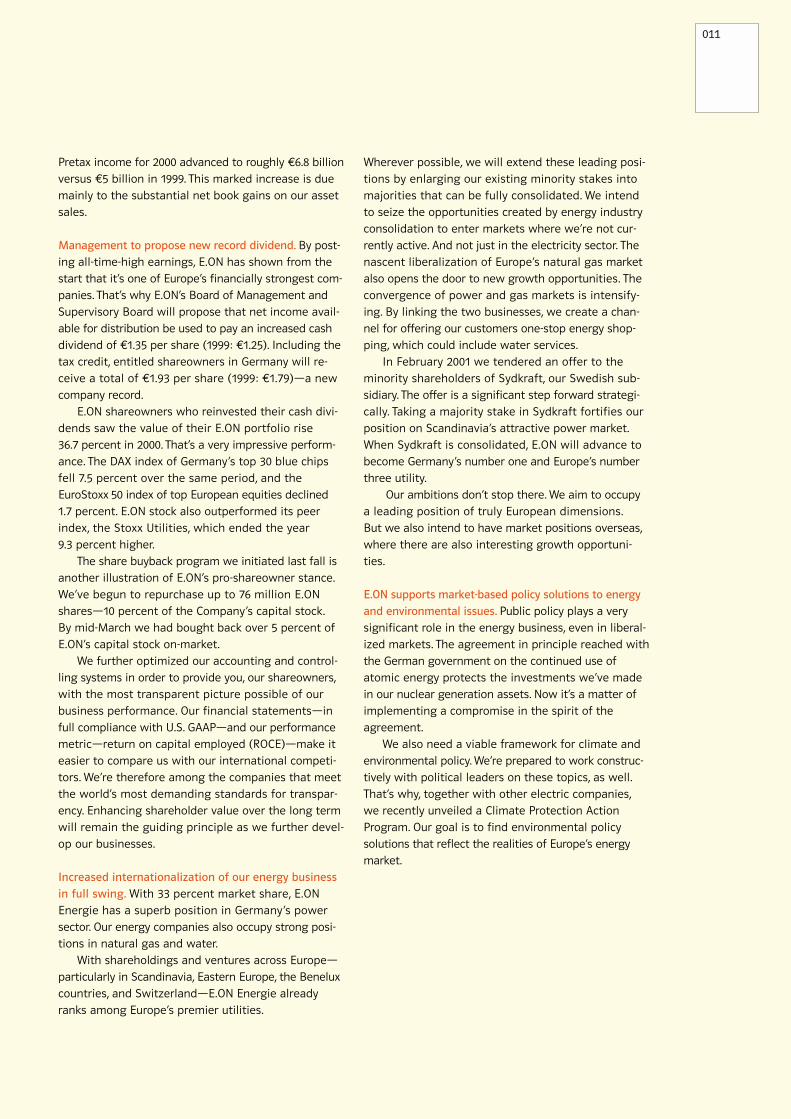
Pretax income for 2000 advanced to roughly 6.8 billion
versus 5 billion in 1999. This marked increase is due
mainly to the substantial net book gains on our asset
sales.
Management to propose new record dividend. By post-
ing all-time-high earnings, E.ON has shown from the
start that it’s one of Europe’s financially strongest com-
panies. That’s why E.ON’s Board of Management and
Supervisory Board will propose that net income avail-
able for distribution be used to pay an increased cash
dividend of 1.35 per share (1999: 1.25). Including the
tax credit, entitled shareowners in Germany will re-
ceive a total of 1.93 per share (1999: 1.79)—a new
company record.
E.ON shareowners who reinvested their cash divi-
dends saw the value of their E.ON portfolio rise
36.7 percent in 2000. That’s a very impressive perform-
ance. The DAX index of Germany’s top 30 blue chips
fell 7.5 percent over the same period, and the
EuroStoxx 50 index of top European equities declined
1.7 percent. E.ON stock also outperformed its peer
index, the Stoxx Utilities, which ended the year
9.3 percent higher.
The share buyback program we initiated last fall is
another illustration of E.ON’s pro-shareowner stance.
We’ve begun to repurchase up to 76 million E.ON
shares—10 percent of the Company’s capital stock.
By mid-March we had bought back over 5 percent of
E.ON’s capital stock on-market.
We further optimized our accounting and control-
ling systems in order to provide you, our shareowners,
with the most transparent picture possible of our
business performance. Our financial statements—in
full compliance with U.S. GAAP—and our performance
metric—return on capital employed (ROCE)—make it
easier to compare us with our international competi-
tors. We’re therefore among the companies that meet
the world’s most demanding standards for transpar-
ency. Enhancing shareholder value over the long term
will remain the guiding principle as we further devel-
op our businesses.
Increased internationalization of our energy business
in full swing. With 33 percent market share, E.ON
Energie has a superb position in Germany’s power
sector. Our energy companies also occupy strong posi-
tions in natural gas and water.
With shareholdings and ventures across Europe—
particularly in Scandinavia, Eastern Europe, the Benelux
countries, and Switzerland—E.ON Energie already
ranks among Europe’s premier utilities.
Wherever possible, we will extend these leading posi-
tions by enlarging our existing minority stakes into
majorities that can be fully consolidated. We intend
to seize the opportunities created by energy industry
consolidation to enter markets where we’re not cur-
rently active. And not just in the electricity sector. The
nascent liberalization of Europe’s natural gas market
also opens the door to new growth opportunities. The
convergence of power and gas markets is intensify-
ing. By linking the two businesses, we create a chan-
nel for offering our customers one-stop energy shop-
ping, which could include water services.
In February 2001 we tendered an offer to the
minority shareholders of Sydkraft, our Swedish sub-
sidiary. The offer is a significant step forward strategi-
cally. Taking a majority stake in Sydkraft fortifies our
position on Scandinavia’s attractive power market.
When Sydkraft is consolidated, E.ON will advance to
become Germany’s number one and Europe’s number
three utility.
Our ambitions don’t stop there. We aim to occupy
a leading position of truly European dimensions.
But we also intend to have market positions overseas,
where there are also interesting growth opportuni-
ties.
E.ON supports market-based policy solutions to energy
and environmental issues. Public policy plays a very
significant role in the energy business, even in liberal-
ized markets. The agreement in principle reached with
the German government on the continued use of
atomic energy protects the investments we’ve made
in our nuclear generation assets. Now it’s a matter of
implementing a compromise in the spirit of the
agreement.
We also need a viable framework for climate and
environmental policy. We’re prepared to work construc-
tively with political leaders on these topics, as well.
That’s why, together with other electric companies,
we recently unveiled a Climate Protection Action
Program. Our goal is to find environmental policy
solutions that reflect the realities of Europe’s energy
market.

Oil Division boosts competitiveness. VEBA Oel’s realign-
ment last year gives it a corporate structure for deal-
ing with the harsh competition of the global oil busi-
ness. The integration of Aral was completed rapidly.
The cost-cutting measures implemented in recent
years have strengthened the company substantially.
Nevertheless, in a business dominated by the inter-
national super-majors, additional efforts will be neces-
sary to ensure VEBA Oel’s sustained competitiveness.
So we’re continuing to examine a variety of scenarios
for mergers and alliances.
Chemicals: becoming the global market leader. The
merger of Degussa-Hüls and SKW Trostberg, completed
earlier this year, allows us to leverage significant
synergy and restructuring potential in our Chemicals
Division. This will enable Degussa to enhance its sus-
tained profitability.
The new Degussa has a lean, decentralized, and
powerful corporate structure. It will be able to operate
with a high degree of flexibility on global markets. A
key task this year will be to further sharpen the com-
pany’s focus on high-growth specialty chemicals
activities. Degussa has already begun its program to
divest non-core assets with roughly 6 billion in sales.
It intends to complete the majority of its disposal pro-
gram during the current year.
The takeover of Laporte, the UK-based fine chemi-
cals enterprise, was initiated during the merger
process. Laporte is a superbly positioned company
with above-average profitability. It’s an ideal match for
Degussa. Acquiring Laporte reinforces our Chemical
Division’s long-term position in attractive market seg-
ments. There are other exciting growth opportunities,
particularly in North America and Asia.
Other Activities put in strong performances. Our non-
core activities all performed well last year. Viterra fur-
ther cemented its position on Germany’s real-estate
market. The key elements of its strategy are active
portfolio management, further expansion of its real-
estate-related services, and the systematic enlarge-
ment of its commercial property portfolio.
In Telecommunications we still have interests in
Austria’s ONE and France’s Bouygues Telecom. We suc-
ceeded in creating substantial value via the disposals
of E-Plus, Cablecom, Switzerland’s Orange Communica-
tions, and VIAG Interkom—before the collapse in value
of telecoms.
Last year we also found optimal disposal solutions
for VEBA Electronics, Gerresheimer Glas, and Schmal-
bach-Lubeca.
An important factor affecting the sale of additional
Stinnes shares and of VAW aluminium is the tax relief
on capital gains that will take effect in 2002. We in-
tend to dispose of Klöckner & Co this year. Market sen-
timent regarding technology stocks will influence the
timing of the divestiture of MEMC.
New all-time highs anticipated in 2001. E.ON got off to
a strong start in its first financial year. The outlook for
this year is extremely promising.
We expect our Electricity Division to post a slightly
higher internal operating profit. One contributing factor
is the stabilization of electricity prices. We’re fostering
this trend by shutting down some of our generation
assets to reduce market overcapacity. In addition, merg-
er synergies of 700 million will be fully realized, to a
great extent by the end of this year. Moreover, we will
proceed aggressively with our ongoing cost-cutting
program.
Letter to our shareowners
012
We anticipate that our Oil Division’s internal operating
profit will be on par with last year’s solid results. Better
margins at the pump should serve to offset the ex-
pected normalization of crude oil prices and the dollar
exchange rate. In Chemicals, planned asset sales will
sharpen Degussa’s focus on its high-margin core busi-
nesses. We’re forecasting another improvement in
Chemicals’ internal operating profit. Overall, we expect
our Other Activities to post higher internal operating
profit. We anticipate that 2001 Group internal operat-
ing profit will considerably surpass last year’s figure.
We’ve set ambitious goals for this year. The mo-
mentum from the merger will not diminish. We will
leverage our enhanced strength as we compete with
our industry rivals. Above all, we will move forward
decisively with our international expansion. You can
be certain that in everything we do our highest priority
will be to create value for you, our shareowners.
013
Yours sincerely,
Ulrich Hartmann Prof. Dr. Wilhelm Simson

014
The year in review
January
• VEBA Oel acquires Mobile Oil’s interest in Aral,
giving it a total of about 99 percent of Aral’s
shares.
• PreussenElektra acquires Electriciteitsbedrijf Zuid-
Holland (EZH), a Dutch energy utility. EZH now
does business as E.ON Benelux Generation.
February
• The Company sells its interest in E-Plus (held indi-
rectly via VRT) to Bell South, an American telecom.
• At Extraordinary Shareholders’ Meetings, share-
holders vote overwhelmingly in favor of the VEBA-
VIAG merger.
March
• VEBA Telecom sells its 32 percent stake in Cable-
com Holding to US-based NTL.
June
• The VEBA-VIAG merger is entered into the Commer-
cial Register. The tie-up forges E.ON: one of the
world’s largest investor-owned energy service
providers and the world’s biggest specialty chemi-
cals group.
July
• As part of the ongoing focus on its core businesses,
E.ON sells its 73 percent stockholding in Gerres-
heimer Glas to Investcorp, a UK-based investment
group.
• The merger of Bayernwerk and PreussenElektra is
entered into the Commercial Register. The merged
entity is called E.ON Energie.
• E.ON launches a major ad campaign in Germany.
Within a month, 40 percent of Germans recognize
the E.ON brand name. This makes E.ON’s brand
recognition more than three times higher than that
of PreussenElektra or Bayernwerk.
August
• E.ON folds its Schmalbach-Lubeca stake into the
newly-formed AV Packaging. Allianz Capital Part-
ners takes a majority stake in the company.
• E.ON sells the electronic components and systems
distribution operations managed by its VEBA
Electronics subsidiary to a consortium of European
and American buyers.
• In compliance with its antitrust commitments, E.ON
Energie agrees to swap assets with Hamburgische
Electricitäts-Werke (HEW). Under the terms of the
agreement, E.ON Energie is to sell its 49 percent
stake in Bewag, the Berlin-based energy utility, to
HEW. In return, E.ON Energie is to receive HEW’s
61.9 percent shareholding in Hein Gas Hamburger
Gaswerke plus a cash payment. The deal remains in
limbo because of an arbitration procedure initiated
by Mirant (formerly Southern Energy), also a
Bewag shareholder.

015
• E.ON and British Telecom (BT) reach an agreement
under which E.ON has the option to sell its VIAG
Interkom interest to BT in January 2001. BT has the
option to acquire this interest from E.ON between
May and July 2001.
• VIAG Interkom acquires a German UMTS license for
about 8.4 billion.
October
• In response to power market liberalization and
Europe’s excess generating capacity, E.ON Energie
moves to shut down roughly 4,800 megawatts of its
installed capacity by 2003. This equals nearly a sixth
of the company’s total production capacity.
• E.ON Energie and Sydkraft, its Swedish subsidiary,
sign a letter of intent with Vattenfall, the Swedish
utility. The deal calls for E.ON Energie to transfer
its 15.4 percent stake in HEW to Vattenfall; Sydkraft
is also to transfer its 21.8 percent HEW shareholding
to Vattenfall. In return, E.ON Energie and Sydkraft
will receive shareholdings in Norway, Sweden, the
Czech Republic, and Lithuania as well as a cash
payment.
• At Degussa-Hüls’s and SKW Trostberg’s Extraordi-
nary Shareholders’ Meetings, the companies’
investors overwhelmingly approve the proposed
merger to form the new Degussa.
November
• ONE, E.ON’s Austrian telecoms shareholding,
acquires an Austrian UMTS license for around
121 million.
• E.ON sells its 42.5 percent stake in Orange Commu-
nications, the Swiss cellular phone company, to
France Télécom.
December
• Stinnes successfully completes a public offer to
purchase outstanding shares in Holland Chemical
International (HCI). HCI is listed on the Amsterdam
Stock Exchange. The acquisition makes Stinnes the
global leader in chemicals distribution.
• E.ON Energie and RWE reach an agreement with
HEW on the sale of their direct and indirect
shareholdings in Vereinigte Energiewerke Aktien-
gesellschaft (Veag) and Lausitzer Braunkohle
Aktiengesellschaft (Laubag). E.ON Energie holds a
48.75 percent stake in Veag; RWE has a 32.5 per-
cent stockholding. E.ON Energie holds a 45 percent
stake in Laubag; RWE holds 47.5 percent. Part of
the deal calls for HEW to transfer its 15.7 percent
shareholding in Sydkraft to E.ON Energie. The
agreement requires German and European anti-
trust approval as well as a go-ahead from the
German government office responsible for matters
related to the country’s reunification.

The photographs on the next ten pages stem from
E.ON’s ad campaign which ran in the second half of 2000.
The campaign was aimed at investors and opinion leaders.
Several of the images appeared in the German financial
press as well as in top international publications like the
Financial Times, Forbes, and Le Capital. The campaign’s key
message is that E.ON stands for “new energy.” Each
image symbolizes an aspect of E.ON’s brand personality:
courage, openness, inspiration, determination, and
concentration.

Courage creates new energy.

Openness creates new energy.


Inspiration creates new energy.

Determination creates new energy.


Concentration creates new energy.


Report of the Board of Management: Review of Operations
001 002 003 004 005 006 007 008 009 010 011 012
025 026 027 028 029 030 031 032 033 034 035 036
049 050 051 052 053 054 055 056 057 058 059 060
073 074 075 076 077 078 079 080 081 082 083 084
097 098 099 100 101 102 103 104 105 106 107 108
121 122 123 124 125 126 127 128 129 130 131 132

• VEBA-VIAG merger successfully completed• E.ON Group accelerates focus on core businesses• Internal operating profit for 2000 keeps pace with prior year’s
all-time high• Consolidated net income increases 30 percent year-on-year• Marked increase in Group internal operating profit anticipated
for 2001
013 014 015 016 017 018 019 020 021 022 023 024
037 038 039 040 041 042 043 044 045 046 047 048
061 062 063 064 065 066 067 068 069 070 071 072
085 086 087 088 089 090 091 092 093 094 095 096
109 110 111 112 113 114 115 116 117 118 119 120
133 134 135 136 137 138 139 140 141 142 143 144

028
Review of Operations
Highlight of 2000: VEBA-VIAG merger that forged E.ON.
The VEBA-VIAG merger that created E.ON was the
highlight of 2000. For both partners, the tie-up repre-
sented a logical continuation of their strategies. E.ON
concentrates on two core businesses: energy and
specialty chemicals. On the energy side, we success-
fully combined PreussenElektra and Bayernwerk, creat-
ing one of the world’s largest investor-owned energy
service providers. On the chemicals side, we laid the
groundwork for the tie-up of Degussa-Hüls and SKW
Trostberg. The merger of the two companies in early
2001 formed the world’s biggest specialty chemicals
group. In addition to our two core businesses, we
will continue to enhance the value of our Real Estate
Division.
These were the main merger milestones of 2000:
• An overwhelming majority of VEBA and VIAG share-
owners approved the merger at Extraordinary
Shareholders’ Meetings held in February 2000.
• The merger that formed E.ON was entered into the
Commercial Register on June 16, 2000. As of this
date, VIAG ceased to exist as an independent legal
entity, and VIAG shareholders became E.ON share-
holders.
• E.ON stock was traded for the first time on June 19,
2000.
• The tie-up of PreussenElektra and Bayernwerk to
form E.ON Energie was entered into the Commer-
cial Register on July 14, 2000.
• At the October 2000 Extraordinary Shareholders’
Meetings of Degussa-Hüls and SKW Trostberg, an
overwhelming majority of shareholders approved
the merger to create the new Degussa. The merger
was entered into the Commercial Register in
February 2001.
Numerous integration project teams worked on design-
ing the new Group’s post-merger corporate structure
as well as the structure of the Energy and Chemicals
Divisions. The new corporate architectures were thus
already in place when the mergers became official,
enabling the new companies to begin work without
delay.
Portfolio management accelerates focus on core busi-
nesses. We will combine our strengths and systemati-
cally focus our financial resources in order to bolster
and extend the leading market positions we occupy in
our core businesses. The continual optimization of the
Group’s portfolio is therefore an integral aspect of our
value-oriented management approach. In 2000 our
active portfolio management already resulted in the
disposal of our shareholdings in E-Plus, Cablecom,
Gerresheimer Glas, Orange Communications, the sale
of the activities managed by VEBA Electronics, and the
divestiture of our majority stake in Schmalbach-Lubeca.
The proceeds from asset sales create a solid founda-
tion from which to accelerate growth in our core
businesses. In 2000 we implemented the following
measures to strengthen our core businesses:
• We further improved our Electricity Division’s
European market position by acquiring EZH, the
Dutch power utility (which now operates as
E.ON Benelux Generation) and by increasing our
stake in Sweden’s Sydkraft.
• After acquiring all of Aral, we executed the
planned strategic realignment of our Oil Division
and transferred complete responsibility for day-to-
day operations to three autonomous subsidiaries.
• We pressed forward with and successfully complet-
ed the merger of Degussa-Hüls and SKW Trostberg.
The tie-up, which became official in early 2001,
created the foundation for leveraging substantial
synergy and restructuring potential. Moreover, the
takeover of Laporte, the British specialty chemicals
enterprise, represents a major strategic step
toward expanding our leading global position in
the attractive fine chemicals sector.
+/– %pro forma
+34
+1
–20
+35
–8
in millions
Sales
Internal operating profit
Cash flow from operations
Investments
Employees at year-end
2000actual
82,983
2,396
3,473
13,475
186,788
1999actual
50,515
2,072
3,255
7,017
131,602
2000pro forma
93,240
2,762
3,889
14,961
186,788
1999pro forma
69,745
2,748
4,866
11,045
203,733
E.ON Group 2000

029
Group financial reporting now in full compliance with
U.S. GAAP. In a complex transition process, E.ON fully
converted the accounting and valuation policies of
the former VEBA and VIAG to U.S. GAAP. Prior to the
merger, VIAG reported its figures based on International
Accounting Standards (IAS). VEBA reported its figures
in compliance with U.S. GAAP, as far as permissible
under German GAAP.
Under U.S. GAAP, the date of the merger’s entry
into the Commercial Register determines the inclusion
of the former VIAG in E.ON’s Consolidated Financial
Statements. For this reason, the companies of the
former VEBA contribute full twelve-month figures to
the 2000 financial year. The companies of the former
VIAG contribute figures for the period July through
December only; comparative figures for 1999 only
include the companies of the former VEBA. It is not
possible to compare the Company’s financial perfor-
mance in 1999 and 2000 on the basis of these figures.
We have therefore also calculated pro-forma
figures for 1999 and 2000 in accordance with U.S. GAAP.
These pro-forma figures represent the E.ON Group as if
the VEBA-VIAG merger had been consummated on
January 1, 1999.
The following comments are based on the consoli-
dated pro-forma figures.
Group sales increase to 93 billion. Group sales for 2000
rose 34 percent year-on-year to 93 billion. The Oil
and Chemicals Divisions were the main contributors to
the increase.
Despite 15 percent higher sales volumes, Electricity’s
sales rose only 1 percent year-on-year due to significant
price cuts, particularly since the second half of 1999.
Oil’s sales surged 135 percent owing to the first-
time full consolidation of Aral, higher sales volumes,
sustained rises in crude oil and product prices world-
wide, and the strong dollar. The renewed hike in Ger-
many’s petroleum tax on January 1, 2000, also served
to increase sales revenues.
Sales were sharply higher at our Chemicals Division,
reflecting a favorable world economic climate. Higher
product prices (mainly resulting from higher raw
material costs partially being passed on to customers)
and appreciably higher sales volumes also served to
lift sales. It should be noted that under U.S. GAAP—
unlike under German GAAP—the former Degussa’s
fourth quarter 1998 sales are no longer included in the
comparison figures for 1999.
Our Real Estate Division continued on its growth
track. Sales advanced roughly 13 percent, owing princi-
pally to higher sales generated at Residential Develop-
ment and Commercial Real Estate.
Connect Austria (ONE), our Austrian telecoms
shareholding, was the sole contributor to sales in our
Telecommunications Division. Under U.S. GAAP, ONE is
fully consolidated in 2000. ONE’s sales climbed 51 per-
cent compared with the year-earlier figure. VIAG
Interkom, consolidated on a pro-rata basis in VIAG’s
Financial Statements in 1999 in accordance with IAS,
is accounted for at equity under U.S. GAAP.
Our Other Activities generated 3 percent higher
sales. At 21,308 million, Distribution/Logistics’ sales
were relatively unchanged year-on-year. The increase
at Stinnes is largely due to a positive performance
by Chemicals and by the air and sea freight activities.
We sold our electronics businesses to a consortium
of European and American buyers in the fall of 2000.
Sales at VEBA Electronics, which are reported in our
Distribution/Logistics segment, declined appreciably.
+/– %pro forma
+1
+135
+23
+13
+51
+3
+134
+34
in millions
Electricity
Oil
Chemicals
Real Estate
Telecommunications
Other Activities
E.ON AG/consolidation1
Total external sales
2000actual
11,027
28,780
18,198
1,324
229
23,606
–181
82,983
1999actual
7,768
12,229
12,320
1,167
111
17,571
–651
50,515
2000pro forma
13,350
28,780
20,267
1,324
383
25,733
3,4032
93,240
1999pro forma
13,180
12,229
16,487
1,167
253
24,974
1,455
69,745
1Includes Schmalbach-Lubeca in the actual figures for 2000 and in the pro-forma figures for 1999 and 2000.2Includes VEBA Electronics from July 1 to September 30, 2000.
Group sales

VEBA Electronics’ third-quarter sales are not included
in this segment’s full-year sales figure because the
company’s activities were transferred to the new own-
ers with economic effect as of July 1, 2000. The sales
uptick at Klöckner is mainly indicative of higher prices
and acquisitions. Improvements in all reporting seg-
ments served to boost Aluminum’s sales 19 percent to
3,480 million. Sales at our Silicon Wafers Division rose
45 percent due to increased sales volume and slightly
higher wafer prices.
The Group generated just under 50 percent of its
sales outside Germany. About 14 percent of sales were
reported in euroland countries excluding Germany.
Internal operating profit for 2000 keeps pace with
previous year’s all-time high. Group internal operating
profit for 2000 totaled 2.8 billion, a slight increase
from 1999’s all-time high. This means that Group inter-
nal operating profit performed significantly better
than had been forecast on the basis of our nine-month
figures released in December 2000.
The 2000 financial year was the first to feel the full
impact of Germany’s liberalized power market for an
entire 12 months. Despite vigorous cost management
and 15 percent higher sales volumes, Electricity’s inter-
nal operating profit declined 30 percent year-on-year
to 1,725 million due to substantial price reductions.
Internal operating profit at our Oil Division surged
812 percent to 310 million thanks to higher crude
oil prices, higher refining margins, and a strong dollar.
By contrast, the dramatic collapse of margins in the
service station business negatively impacted earnings.
Goodwill amortization and interest expenses stemming
from the acquisition of Aral shares in late 1999 and
early 2000 also impaired earnings. Moreover, hedging
transactions dampened a portion of the earnings
increase.
Chemicals’ internal operating profit rose a sharp
58 percent to 672 million on the back of strong
global demand in the chemicals industry and favorable
currency effects. Synergy effects from the Degussa-
Hüls merger also had a positive effect. The implemen-
tation of synergies is well under way. In accordance
with U.S. GAAP, the former Degussa’s internal operating
profit from fourth quarter 1998 is no longer included in
the 1999 figures.
Our Real Estate Division’s internal operating profit
advanced 12 percent to 212 million. The rise is largely
attributable to the increased number of housing units
sold and to the sale of shares in a small property com-
pany.
The improvement in Telecommunications’ internal
operating profit stems mainly from the disposal of
shareholdings—Otelo’s fixed-line business in 1999 and
E-Plus in 2000—that were characterized by heavy start-
up losses. Earnings were impaired by the substantially
higher customer acquisition costs resulting from the
burgeoning cellular phone sector.
Internal operating profit posted by our Other
Activities rose a marked 55 percent to 620 million.
At 461 million, Distribution/Logistics’ 2000 internal
operating profit was 34 percent higher year-on-year.
Stinnes’s European overland transport and its air and
sea freight units were particularly strong earnings
contributors. VEBA Electronics’ internal operating profit
rose considerably from the previous year, although this
Review of Operations
030
+/– %pro forma
–30
+812
+58
+12
+31
+55
–
+1
in millions
Electricity
Oil
Chemicals
Real Estate
Telecommunications
Other Activities
E.ON AG/consolidation1
Total
2000actual
1,099
310
576
212
– 156
412
–57
2,396
1999actual
1,370
34
275
189
– 150
57
297
2,072
2000pro forma
1,725
310
672
212
– 546
620
– 2312
2,762
1999pro forma
2,466
34
426
189
– 789
400
22
2,748
1 Includes Schmalbach-Lubeca in the actual 2000 figures and in the pro-forma figures for 1999 and 2000.2Includes VEBA Electronics’ results from July 1 to September 30, 2000.
Group internal operating profit
The main drivers behind this positive development
are reduced losses at Telecommunications following
the disposal of shareholdings, higher crude oil prices
paired with a strong dollar, and the cost reductions
we achieved at our Electricity Division.

Dividend increases to 1.35. Under German commer-
cial law, the merger of VIAG AG into VEBA AG took
economic effect as of January 1, 2000. The merger was
entered into the Düsseldorf Commercial Register
(HRB 22 315) on June 16, 2000. On the same day, VEBA AG
was renamed E.ON AG. The Company’s registered office
remains in Düsseldorf.
Employing the book-value method, E.ON AG contin-
ued to use the book values of the assets and liabilities
transferred in the merger as shown in VIAG AG’s clos-
ing balance sheet.
To facilitate comparisons, the Balance Sheet and
the Income Statement on the next page have a column
headed “Previous financial year” next to the column
headed “Previous legal year” (VEBA AG). The column
headed “Previous financial year” shows the figures
that would have resulted if E.ON AG had already exist-
ed in its current form as of January 1, 1999.
E.ON AG’s 2000 net income amounts to 1,794 mil-
lion. After transferring 822 million to other retained
earnings, net income available for distribution totals
972 million.
At the Annual Shareholders’ Meeting on May 18,
2001, management will propose that net income avail-
able for distribution be used to pay an increased cash
dividend of 1.35 per share compared with 1.25 last
year. Together with the tax credit of 0.58 (0.54),
entitled domestic shareowners will receive a total of
1.93 per share versus 1.79 the year before.
figure does not include the company’s third-quarter
results, since its operations were transferred to the
new owners with economic effect as of July 1, 2000.
Klöckner delivered a distinctly higher internal operat-
ing profit resulting mainly from higher prices and bet-
ter margins. Hefty price increases for raw materials
and production inputs caused Aluminum’s internal
operating profits to fall 18 percent to 227 million. At
68 million, Silicon Wafers curtailed its operating loss
for the second year running. The result reflects in-
creased demand from the semiconductor industry,
slightly higher wafer prices, and the Division’s improved
cost position.
Pretax income rose 35 percent to 6,802 million.
This substantial increase is primarily attributable to
the significant net book gains from the disposal of the
Company’s shareholdings in E-Plus (3,518 million) and
Cablecom, the Swiss cable-TV operator (789 million).
Restructuring and cost-management expenditures
chiefly impacted our Electricity, Chemicals, and Oil
Divisions. Other non-operating earnings mainly include
write-downs stemming from the divestment of share-
holdings in Veag and Laubag initiated to fulfill the
EU Commission’s antitrust requirements. The dissolution
of labor agreements at E.ON Energie as well as tax-
related interest expenses also had a negative effect.
Income taxes increased to 2,618 million. The tax
rate for 2000 was 38.5 percent compared with 38.7 per-
cent in 1999. Minority interests rose because after
Stinnes’s IPO its minority interests did not affect earn-
ings until second-half 2000 and because MEMC’s loss
was markedly lower in 2000.
Group net income (after taxes and minority inter-
ests) totaled 3,678 million, up 30 percent from the
previous year.
031
+/– %pro forma
+1
+96
–51
–1,048
+83
+35
–34
+35
–98
+30
in millions
Group internal operatingprofit
Net book gains
Cost-management andrestructuring expenses
Other non-operatingearnings
Foreign E&P taxes
Pretax income
Income taxes
Income after taxes
Minority interests
Group net income
2000actual
2,396
4,636
–510
–523
552
6,551
–2,512
4,039
–469
3,570
1999actual
2,072
2,337
–402
92
301
4,400
–1,277
3,123
–132
2,991
2000pro forma
2,762
4,755
–555
–712
552
6,802
–2,618
4,184
–506
3,678
1999pro forma
2,748
2,428
–367
–62
301
5,048
–1,953
3,095
–256
2,839
Group net income

We intend to adjust the dividend proposal as necessary
if the Corporation’s ongoing share buyback program
reduces the number of entitled shares by the date of
the Annual Shareholders’ Meeting. The cash dividend
of 1.35 per entitled share will remain unchanged. That
portion of the dividend payout due to shares that are
no longer entitled to dividends will be carried forward.
The income taxes arising from the lower corporate
income tax credit will be reported separately.
The complete financial statements of E.ON AG,
with the unqualified opinion issued by the auditors,
PwC Deutsche Revision Aktiengesellschaft Wirtschafts-
prüfungsgesellschaft, Düsseldorf, will be published in
the Bundesanzeiger and filed in the Commercial
Register of the Düsseldorf District Court, HRB 22 315.
Copies are available on request from E.ON AG and
at www.eon.com.
Investments increase markedly. The E.ON Group invest-
ed 4,408 million (4,089 million) in property, plant,
and equipment in 2000. The Group invested 10,553 mil-
lion (6,955 million) in financial assets; this figure
includes 1,405 million for investments in companies
accounted for at equity. At 14,961 million, total invest-
ments for 2000 exceeded prior-year capital spending
(11,045 million) by 35 percent.
Electricity’s capital expenditures rose 29 percent
year-on-year to 3,766 million (2,923 million). Invest-
ments in property, plant, and equipment including
intangible assets of 989 million mainly served to
optimize power distribution facilities. Investments in
financial assets amounted to 2,777 million. The acqui-
sition of EZH, a Dutch energy utility, was the company’s
most significant investment. EZH now operates as
E.ON Benelux Generation.
At 1,723 million (1,308 million), our Oil’s invest-
ments increased appreciably year-on-year due mainly
to the acquisition of Mobil’s Aral shares.
Our Chemicals Division invested 1,868 million
(2,154 million) in 2000. Capital expenditures focused
on strengthening and expanding our leading market
positions in Chemicals’ core businesses. Investments in
property, plant, and equipment climbed to 1,232 mil-
lion. 636 million was invested in financial assets.
Real-Estate’s 2000 investments totaled 484 mil-
lion (333 million) and were thus significantly higher
year-on-year. Capital expenditures on property, plant,
and equipment amounted to 399 million. 85 million
was invested in financial assets. Investments were
aimed primarily at the Residential Investment and
Commercial Real Estate divisions.
Review of Operations
032
Balance Sheet in millions
Property, plant, and equipment
Financial assets
Fixed assets
Receivables from affiliatedcompanies
Other receivables
Liquid funds
Current assets
Total assets
Shareholders’ equity
Reserves subject to special taxation
Provisions
Liabilities to affiliated companies
Other liabilities
Total liabilities and stockholders’equity
Dec. 31, 2000
156
15,406
15,562
8,680
1,352
242
10,275
25,836
13,333
636
2,461
6,388
3,018
25,836
FinancialDec. 31, 1999
147
15,638
15,785
3,330
468
1,120
4,918
20,703
12,215
666
2,202
5,002
618
20,703
LegalDec. 31, 1999
141
11,391
11,532
2,247
322
1,037
3,606
15,138
7,621
609
2,017
4,847
44
15,138
in millions
Income from equity interests
Interest income (net)
Other expenditures and income (net)
Pretax income
Extraordinary expenses
Taxes
Income after taxes
Net income transferred to retainedearnings
Net income available for distribution
2000
5,772
–32
–566
5,174
–1,164
–2,216
1,794
–822
972
Financial1999
2,157
–49
273
2,381
–
–1,241
1,140
-290
850
Legal1999
1,735
–60
336
2,011
–
–1,126
885
–257
628
+/– %pro forma
+29
+32
–13
+45
+327
+29
–68
+35
–8
in millions
Electricity
Oil
Chemicals
Real Estate
Telecommunications
Other Activities
E.ON/consolidation*
Total
Investments outside Germany
2000actual
3,356
1,723
1,675
484
4,591
1,161
485
13,475
2,673
1999actual
1,349
1,308
1,298
333
171
801
1,757
7,017
1,818
2000pro forma
3,766
1,723
1,868
484
5,135
1,317
668
14,961
2,979
1999pro forma
2,923
1,308
2,154
333
1,202
1,019
2,106
11,045
3,242
*Includes Schmalbach-Lubeca in actual figures for 2000 and pro-forma figures for 1999 and 2000.
E.ON Group Investments
Financial Statements of E.ON AG (summary)
Income Statement

Foreign exchange and interest rate management.
E.ON pursues systematic and Group-wide foreign
exchange and interest rate management. Its objective
is to limit the Group’s exposure to exchange, interest
rate, and commodity price fluctuations. To this end we
also use derivative financial instruments. These consist
of established and commonly used instruments. They
are transacted with financial institutions, brokers, and
metals trading companies whose credit rating is moni-
tored on an ongoing basis.
As of December 31, 2000, the face value of foreign
exchange hedging transactions was 7,175 million;
that of interest rate hedging transactions, 2,867 mil-
lion. The market values of foreign exchange hedging
transactions for which no hedge accounting was appli-
cable totaled 17.9 million. Such transactions are used
to hedge exchange rates for planned transactions. The
market values of interest rate hedging transactions for
which no hedge accounting was applicable totaled
–3.2 million.
Derivative financial instruments are used to limit
exposure to risks from changes in commodity prices,
in particular in the Oil and Aluminum Divisions as well
as the Precious Metals unit. In addition, the Electricity
Division used electricity and gas price hedging trans-
actions to a limited extent in 2000. The face value
of commodity hedging transactions amounted to
3,479 million as of December 31, 2000. The market
values of hedging transactions for which no hedge
accounting was applicable totaled –20.3 million.
Investments at Telecommunications amounted to
5,135 million in the year under review. Of this total,
376 million was invested in property, plant, and equip-
ment. Telecommunications’ investments in financial
assets totaled 4,759 million. This figure mainly reflects
shareholder loans to VIAG Interkom stemming from its
acquisition of UMTS licenses.
We invested 1,317 million (1,019 million) in our
Other Activities in 2000. Distribution/Logistics invested
736 million in 2000, 9 percent less than in the previ-
ous year. A large part of Stinnes’s spending—573 mil-
lion—went toward acquiring Holland-based HCI. VEBA
Electronics and Klöckner invested 47 million and
116 million, respectively. Aluminum invested 514 mil-
lion (153 million), of which 194 million went toward
property, plant, and equipment and 320 million
toward financial assets. The largest single investment
was the October 2000 acquisition of Kurri-Kurri, the
Australian primary aluminum company. At 67 million,
we held Silicon Wafers’ 2000 capital expenditures to
the prior year’s modest level (60 million).
The Group’s 2000 investments in Germany totaled
11,982 million (7,803 million). Capital spending out-
side Germany amounted to 2,979 million (3,242 mil-
lion).
Nearly 70 percent of investments financed by cash flow.
Group investments in 2000 resulted in cash outflows
of 14,961 million. Accounting for proceeds received
from fixed-asset disposals and changes in other cash
investments in current assets, cash used for invest-
ment activities totaled 5,687 million (1999: 4,155 mil-
lion).
This financing requirement was funded by
3,889 million in cash flow from operations as well as
by debt.
Liquid funds (cash and other current financial invest-
ments) decreased by 1,028 million to 8,501 million.
At year-end 2000, E.ON had at its disposal a total
of 2.7 billion in short-term credit lines through banks,
a 1 billion long-term syndicated loan facility, the
2 billion Commercial Paper program, and the 2 billion
Medium Term Note program. As of the balance-sheet
date, roughly 3 billion of these financing instruments
had been utilized.
033
in millions
Cash from operations
Cash used for investing activities
Cash from financing activities
Net change in liquid funds
Liquid funds as of December 31
2000actual
3,473
–4,348
+1,943
+1,068
8,501
1999actual
3,255
–1,712
–1,383
+160
1,844
2000pro forma
3,889
–5,687
+2,244
+446
8,501
1999pro forma
4,866
–4,155
–517
+194
9,529
Statement of Cash Flows (summary)

Asset and capital structure. Investment activities in
2000 led to an increase in long-term assets of 5.4 bil-
lion. With short-term assets also increasing by 6.2 bil-
lion, total assets rose by 11.6 billion to 106.2 billion.
The Corporation’s equity ratio for 2000 decreased
slightly to 26.4 percent compared with 27.8 percent in
the previous year.
Long-term liabilities declined 0.7 billion to
40.8 billion.
The following key figures underscore the E.ON
Group’s solid asset and capital structure through the
end of 2000:
• Long-term assets are covered by stockholders’
equity at 42.7 percent (43.7 percent).
• Long-term assets are covered by long-term capital
at 112.7 percent (120.8 percent).
Standard & Poor’s and Moody’s have rated E.ON since
early 1995. As of December 31, 2000, S&P and Moody’s
gave E.ON’s long-term bonds ratings of Aa2 and AA,
respectively. E.ON’s short-term bonds received ratings
of P-1 and A-1+, respectively. These very good ratings
underscore the Group’s sound financial standing.
Implementing Group strategy impacts personnel
structure. The E.ON Group employed 186,788 people
worldwide at the end of 2000—a year-on-year decline
of roughly 17,000 employees or 8 percent. A large part
of this was attributable to the disposal of non-core
assets such as VEBA Electronics (representing a reduc-
tion of 6,200 employees) and the Company’s majority
stake in Schmalbach-Lubeca (which reduced staff by
8,700).
Ongoing restructuring measures at our Electricity
Division reduced the workforce there by 1,500 employ-
ees. The sale of Raab Karcher’s building materials unit
led to staff reductions of 6,000 employees at Stinnes.
By contrast, the number of employees at VEBA Oel
increased by 2,900 due to Aral’s first-time full consoli-
dation, and the number of staff at our Electricity
Division rose by 800 in the wake of acquiring EZH, a
Dutch energy utility (EZH is now called E.ON Benelux
Generation).
The internationalization of the E.ON Group contin-
ues unabated. There were 83,338 Group employees—
44.6 percent of our total workforce—at locations out-
side Germany at year-end 2000, up from the prior year’s
37.5 percent.
Research and development: focus on chemicals. Expen-
ditures on research and development (R&D) at the
E.ON Group totaled 661 million (728 million) in 2000.
Our Chemicals Division was responsible for the majori-
ty—82 percent—of R&D spending. Silicon Wafers fol-
lowed with 12 percent.
Chemicals’ R&D expenditures amounted to 3.2 per-
cent of sales excluding precious-metals trading.
All divisions initiated numerous new R&D projects
in the year under review.
Review of Operations
034
%
63.6
36.4
100.0
27.8
5.2
43.8
23.2
100.0
bn
65.6
40.6
106.2
28.0
5.1
40.8
32.3
106.2
Long-term assets
Short-term assets
Assets
Stockholders’ equity
Minority interests
Long-term liabilities
Short-term liabilities
Liabilities and stockholders’ equity
bn
37.3
18.9
56.2
15.8
3.9
22.3
14.2
56.2
%
61.8
38.2
100.0
26.4
4.8
38.4
30.4
100.0
bn
65.6
40.6
106.2
28.0
5.1
40.8
32.3
106.2
%
66.4
33.6
100.0
28.1
6.9
39.7
25.3
100.0
%
61.8
38.2
100.0
26.4
4.8
38.4
30.4
100.0
bn
60.2
34.4
94.6
26.3
4.9
41.5
21.9
94.6
2000 actual 1999 actual2000 pro forma 1999 pro forma
Consolidated assets, liabilities, and stockholders’ equity
Process innovation at the Flavors and Fruit Systems
division enabled it to develop a new class of flavors.
Construction Chemicals markedly expanded the new
generation of concrete super-liquifiers. At the Fine
Chemicals division, new biocatalytic systems that are
both more efficient and more environmentally friendly
were developed for manufacturing pharmaceutical
amino acids. The Oligomers/Silicones unit successfully
developed quick-hardening UV silicone release coat-
ings for labels and adhesive tape. Powerful emulsifiers
developed by Degussa’s Care Specialties unit offer cus-
tomers in the cosmetic industry completely new ways
of making formulas. The Silica, Silanes, and Catalysts
unit is developing metal-oxide dispersions, especially
for chemical-mechanical polishing (CMP) for next-gen-
eration computer chips. The High Performance Poly-
mers unit developed highly diversified polyamides
that facilitate the manufacture of more powerful
adhesive agents for multi-layered fuel line systems.
At Silicon Wafers, MEMC continued to develop next-
generation 300mm wafers. MEMC’s R&D expenditures
of 78 million were about 3 percent below the prior
year’s figure.
Major events after the close of the financial year.
• On January 15, 2001, Degussa-Hüls and SKW Trostberg
tendered a cash offer of £6.97 per share to the
stockholders of Laporte, a British specialty chemi-
cals company. By early March, Degussa had already
secured 94 percent of Laporte’s capital stock.
• On January 16, 2001, E.ON exercised the put option
to sell its 45 percent interest in VIAG Interkom to
British Telecom (BT). E.ON had concluded the
option agreement with BT in August 2000. The dis-
posal generates proceeds totaling 11.4 billion. This
figure includes the exercise price of 7.25 billion as
well as shareholder loans.
• On February 1, 2001, E.ON Energie acquired addi-
tional shares in Sydkraft, the Malmö-based energy
utility, from four Swedish municipalities. The pur-
chase increases E.ON Energie’s stake to 29.4 per-
cent of Sydkraft’s capital stock and 42.8 percent of
its voting rights. On February 21, 2001, E.ON Energie
tendered an offer to Sydkraft’s minority stockhold-
ers. The offer is valued at SEK 240 for series A
Sydkraft shares and SEK 200 for series C shares.
The transaction is subject to approval by the EU
Commission.
• The merger of Degussa-Hüls and SKW Trostberg
that formed the new Degussa became official
when it was entered into the Commercial Register
on February 9, 2001.
Risk management system and existing risks. The re-
quirements of Germany’s Control and Transparency in
Business Act (KonTraG), which came into effect on
May 1, 1998, include obliging the boards of manage-
ment of publicly listed companies to establish risk
management systems.
Even before KonTraG came into effect, VEBA and
VIAG both had effective group-wide risk management
systems in place. In 1999, in accordance with KonTraG,
both companies analyzed and documented their risk
management systems and reported on identified risks
in the Review of Operations section of their 1999
Annual Reports. Both companies’ independent audi-
tors examined the early risk detection systems. This
examination revealed that the systems were fulfilling
their tasks.
Following the merger of VEBA and VIAG to form
E.ON, we combined and further developed the existing
risk management systems. We use an integrated sys-
tem embedded in our business procedures. The system
includes our controlling processes, Group-wide guide-
lines, data processing systems, and regular reports to
the Board of Management and Supervisory Board. The
efficiency and reliability of our risk management sys-
tem is checked regularly by the internal audit and con-
trolling departments of our Divisions and of E.ON AG
as well as by our independent auditors.
035

Uniform guidelines on risk reporting throughout the
Group came into effect in August 2000. The documenta-
tion and evaluation of our system is regularly updated
in the following steps:
1. Standardized identification and documentation of
risk and control systems.
2. Evaluation of risks according to the degree of
severity and the probability of occurrence, and
assessment of the effectiveness of existing control
systems.
3. Analysis of the results and structured disclosure in
a risk report.
The following important risk categories exist within the
E.ON Group, and are thus also material for E.ON AG.
• Operational risks: Our Energy and Chemicals Divi-
sions in particular operate technologically complex
production facilities. Operational failures or
extended production downtimes could negatively
impact our earnings. The following are among the
significant measures we employ to address these
risks:
• Detailed operational and procedural guidelines.
• Further refinement of our production procedures
and technologies.
• Regular facility maintenance.
• Employee training programs.
• Appropriate insurance coverage.
• Financial risks: During the normal course of busi-
ness, E.ON is exposed to interest rate, commodity
price, and currency risks. The instruments used to
hedge these risks are described in detail in the
Notes to the Consolidated Financial Statements.
Furthermore, there are potential currency fluctua-
tion risks from short-term securities, but these are
controlled and monitored by appropriate fund
management.
• External risks: During the normal course of busi-
ness, E.ON’s subsidiaries are susceptible to market
risks that are enhanced by ongoing globalization
and keener competition. The liberalization of the
European energy market exposes our Energy Divi-
sion in particular to price and sales volume risks.
The synergy effects arising from the merger of
VEBA and VIAG, together with our ongoing cost
control measures, bolster our earnings power and
solidify our competitive position. We also hedge
against market price fluctuations in power trading
by utilizing derivative financing instruments. These
instruments are subject to the stringent require-
ments of our internal trading guidelines.
The political, social, and legal environment in
which the E.ON Group does business is a source
of additional risks. For E.ON, the predominant
theme in 2000 was the talks held with the German
government on opting out of nuclear energy. The
agreement in principle reached with the German
government represents a comprise, one that pro-
vides political safeguards for us to continue oper-
ating our existing nuclear power plants. Agree-
ment has not yet been reached with the federal
government on the necessary amendments to the
German Nuclear Power Regulations Act. Until an
understanding is reached on such amendments,
E.ON cannot seek the approval of its Supervisory
Board. The approval of E.ON’s Supervisory Board is
required before the parties can sign the draft
agreement. Other key issues for E.ON are the eco-
tax reform, the Renewable Energy Act (EEG), and
the new regulations to promote combined heat
and power stations. E.ON encourages active dialog
with all groups involved in the decision-making
process. We want to use our expertise to facilitate
objective discussion of politically controversial topics
and play an active role in shaping our business
environment.
Outlook. The VEBA-VIAG tie-up that forged E.ON repre-
sents another major milestone of our Focus & Growth
strategy. By systematically focusing on our core energy
and specialty chemicals businesses, by merging
PreussenElektra and Bayernwerk to form E.ON Energie,
and by merging Degussa-Hüls and SKW Trostberg to
Review of Operations
036

create the new Degussa we have laid a superb founda-
tion for further growth. Obtaining optimal value on
the disposal of our non-core assets is one of the means
we will use to free up the funds needed for this next
stage of growth.
Two acquisitions represent the first steps in 2001
aimed at implementing our growth strategy. On the
energy side, we moved to acquire Sydkraft, Sweden’s
second largest utility. On the chemicals side, we took
over UK-based Laporte. These investments will signifi-
cantly augment our Electricity Division’s leading posi-
tion on Europe’s energy market and will make our
Chemicals Division the top global player in the highly
attractive fine chemicals sector.
E.ON’s planned investments for 2001 amount to
6.8 billion. More than 65 percent of planned invest-
ments are earmarked for our core energy and specialty
chemicals businesses. This figure does not include the
medium-sized and major acquisitions—like the Laporte
takeover—that are integral to the growth strategy of
our core businesses.
For 2001 we anticipate that the energy market will
continue to consolidate and that power prices will sta-
bilize or recover. The synergy effects generated by the
PreussenElektra-Bayernwerk merger, capacity adjust-
ments to our generation portfolio, and cost manage-
ment measures are expected to further improve our
Electricity Division’s competitiveness. Overall, we antici-
pate that Electricity’s 2001 internal operating profit
will show a slight improvement from 2000.
Our Oil Division’s new corporate structure and sharply
reduced costs put it in a good position to meet the
challenges of the coming years. We are looking for
underlying conditions to return to normal in 2001. We
anticipate that crude oil prices, the dollar exchange
rate, and petroleum and petrochemical refining mar-
gins will all be below last year’s levels. But we are also
projecting appreciably improved service station mar-
gins. Overall, we anticipate that Oil’s 2001 internal
operating profit will be on par with last year’s solid
results.
For 2001 we expect Chemicals’ strong performance
to continue. There is, however, a risk that the economic
climate will worsen. The takeover of Laporte, the UK-
based fine chemicals firm, is also expected to have a
positive impact. Because Degussa’s core businesses
are characterized by above-average earnings, in 2001
we expect the company’s current portfolio to again
post a higher internal operating profit.
We expect the positive pattern established in our
Real Estate Division to be sustained in 2001 and antici-
pate that internal operating profit for 2001 will exceed
the prior year’s figure.
At Telecommunications we again expect to report
startup losses for 2001, but these will be significantly
lower than in 2000.
For our Other Activities we anticipate further
improvements at Stinnes and a markedly higher inter-
nal operating profit at VAW aluminium. We expect
Klöckner & Co to deliver a slightly lower internal oper-
ating profit. Owing to the worsening situation on the
silicon wafer market, from today’s perspective we
anticipate that in 2001 MEMC will post a loss on the
level of the prior year.
Overall, we expect that the Group’s 2001 internal
operating profit will markedly exceed 2000’s figure.
However, we anticipate that pretax income for 2001
will be substantially below last year’s record. Due to
the tax relief on capital gains that will take effect in
Germany in 2002, we do not expect to receive signifi-
cant gains from disposals in 2001.
037

001 002 003 004 005 006 007 008 009 010 011 012
025 026 027 028 029 030 031 032 033 034 035 036
049 050 051 052 053 054 055 056 057 058 059 060
073 074 075 076 077 078 079 080 081 082 083 084
097 098 099 100 101 102 103 104 105 106 107 108
121 122 123 124 125 126 127 128 129 130 131 132
Additional information

013 014 015 016 017 018 019 020 021 022 023 024
037 038 039 040 041 042 043 044 045 046 047 048
061 062 063 064 065 066 067 068 069 070 071 072
085 086 087 088 089 090 091 092 093 094 095 096
109 110 111 112 113 114 115 116 117 118 119 120
133 134 135 136 137 138 139 140 141 142 143 144
• E.ON stock outperforms market in 2000• Dividend increases to 1.35• E.ON systematically continues value-oriented management approach• Focus on core energy and specialty chemicals businesses creates superb
platform for further growth

040
E.ON shares
E.ON shares are listed on all German stock exchanges,
the Swiss Stock Exchange, and as American Depositary
Receipts (ADRs) on the New York Stock Exchange.
VEBA and VIAG stock exchanged for E.ON shares. In
June 2000 VIAG AG was merged into VEBA AG. The
merged entity changed its name to E.ON AG. In order
to grant entitled VIAG investors shares in E.ON, E.ON
increased its capital stock by 648 million to around
1,955 million. The Merger Agreement between VEBA
and VIAG stipulated a share exchange ratio of 5:2. This
meant that entitled VIAG shareholders received two
E.ON shares for five VIAG shares. A total of roughly
249 million new E.ON shares were issued, bringing the
total number of E.ON shares to about 752 million.
Shares in the former VEBA were exchanged 1:1 for
E.ON stock when the Company adopted its new name.
E.ON stock: clear market outperformer in 2000. At
64.80, E.ON stock closed 2000 much higher than its
year-end 1999 quote of 48.45. Shareowners who rein-
vested their cash dividends saw the value of their
E.ON portfolio rise by 36.7 percent in 2000. With the
DAX index of Germany’s top 30 blue chips down
7.5 percent on the year and the Euro Stoxx 50 index of
premier European equities off 1.7 percent, E.ON stock
distinctly outperformed German and European equity
markets. E.ON’s European peer index, the Stoxx Utili-
ties, closed 9.3 percent higher on the year, but fell well
short of E.ON’s stock performance. Investors in the for-
mer VIAG achieved even better returns. The value of
their portfolio climbed 43.3 percent in 2000.
+/– %
+34
+30
+8
–20
+7
In
Year-end share price
U.S. GAAP earnings 2
Dividend
Cash flow from operations2
Book value 2, 3
2000
64.80
5.07
1.35
5.36
38.61
1999
48.451
3.90
1.251
6.68
36.091 Figure refers to the former VEBA AG.2Pro forma.3Stockholders’ equity excluding minority interests.
40
1997 19981996
62.63 50.4645.25
60
In per share*
*Numbers for 1996–1999 refer to the former VEBA AG.
1999
48.45
2000
64.80
Key figures per share
Year-end share price

041
VEBA/E.ON share portfolio sustains double-digit
growth. Investors who purchased VEBA shares for
DM10,000 at the end of 1995 and reinvested their cash
dividends saw the value of their investment rise to
roughly DM22,800 by the end of 2000. The investment
thus more than doubled over the five-year period. The
128 percent appreciation represents an annual
increase of 17.9 percent. This means that VEBA/E.ON
stock performed almost as well as Europe’s Stoxx Utili-
ties index, which rose 20.1 percent per year over the
same span. At 20.9 percent, the five-year average
annual return to shareholders of the former VIAG was
even better. Between 1995 and 2000 Germany’s DAX
index advanced 23.3 percent annually. The Euro Stoxx 50
rose 28.4 percent each year on average. Measured
against these German and European blue-chip indices,
VEBA/E.ON stock was thus a below-average performer.
The VEBA/E.ON portfolio of long-term investors
increased 4.5-fold in value in the ten years since the
end of 1990. At 18.5 percent, VEBA/E.ON stock’s aver-
age annual increase bested both German stocks—the
DAX index climbed 16.5 percent per year since 1990—
and its European peer index, the Stoxx Utilities, which
advanced 17.1 percent per year over the same period.
Shareholders in the former VIAG AG saw the value of
their portfolio grow 17.1 percent annually between
1990 and 2000.
Dividend increases to 1.35. At the 2001 Annual Share-
holders’ Meeting, E.ON’s Board of Management and
Supervisory Board will propose that the cash dividend
for the 2000 financial year be increased to 1.35. The
previous year’s dividend was 1.25. Entitled domestic
shareowners also receive a tax credit of 0.58 per
share. Including the tax credit, dividends have in-
creased 9.25 percent per year over the last five years.
Capital stock raised by about 30 million or 11 million
shares. Following the tie-up of VEBA and VIAG, the
two companies’ utilities, VIAG’s Bayernwerk AG and
VEBA’s PreussenElektra AG, were merged to form
E.ON Energie AG. Agreement was reached with E.ON
Energie’s minority shareholders—chiefly municipalities
in Bavaria—to swap their E.ON Energie shares for
E.ON stock. For this purpose, E.ON made partial use of
Authorized Capital II to raise its capital stock by about
30 million in return for payments in kind. This
increased the number of E.ON shares by about 11 mil-
lion for a total of roughly 763 million shares.
Certification of E.ON shares ended. Among the resolu-
tions passed at the former VEBA’s Extraordinary Share-
holders’ Meeting on February 10, 2000, was a resolu-
tion to end certification. Shareholders’ right to certifi-
cation of their shares and profit-sharing coupons is
thus excluded except as provided by the rules govern-
ing stock exchanges on which the shares are listed
(see Section 4, Paragraph 2, of the Articles of Incorpo-
ration of E.ON AG). E.ON therefore will not issue stock
certificates. Certification was excluded in order to
save the Company—and its shareowners—the high
costs of printing and distributing share certificates.

042
E.ON launches share buyback program. In May 2000
the former VEBA’s Annual Shareholders’ Meeting
authorized the Company to repurchase its shares until
October 2001. E.ON can buy back up to 10 percent of
its own capital stock. Fully utilizing the authorization
would result in the repurchase of about 76 million
shares. In September 2000 E.ON’s Board of Manage-
ment moved to initiate the stock buyback program.
By December 31, 2000, E.ON had repurchased slightly
more than 15 million of its own shares or exactly
2 percent of its capital stock. The Corporation has con-
tinued to repurchase shares. On February 14, 2001,
E.ON passed the 5-percent mark. Our share buyback
program is Germany’s largest ever. Plans call for can-
celing by far the majority of repurchased shares.
Capital market’s interest in E.ON grows steadily. E.ON
has a higher weighting in key global equity indices
than did VEBA and VIAG. That’s why E.ON has stepped
up its already extensive investor relations activities.
By ensuring an ongoing flow of accurate and com-
prehensive information about our companies’ current
business climate and outlook, we strive to enable the
market to arrive at a fair valuation of our stock. Our
fundamental principle is to provide all investors and
analysts with the same excellent service.
The market’s steadily growing interest in E.ON is
reflected in the greater number of roadshows, presen-
tations, and meetings we have held in and outside
Germany. It is also demonstrated by investors’ expand-
ed use of our website (www.eon.com) and increased
participation in our telephone conferences.
In order to satisfy the global capital market’s rising
demand for information, in 2001 we plan to release
even more data and to expand our use of the latest
communication technologies, including live webcasts
of our analysts conferences.
E.ON shares
1997
2.98
8.98
1.07
1.53
534
62.63
44.89
62.63
497.2
31.1
22.78
275
102.6
1,953.9
5.3
1998
2.34
6.14
1.07
1.53
540
67.08
41.36
50.46
502.8
25.4
23.40
216
22.2
667.5
3.3
1999
3.90
6.68
1.25
1.79
849
62.60
41.60
48.45
502.8
24.4
36.09
134
21.1
755.5
2.8
2000
5.07
5.36
1.35
1.93
9726
66.55
41.01
64.80
763.3
49.5
38.61
168
28.6
1,179.9
2.4
Per share
U.S. GAAP earnings2
Cash flow fromoperations2
Dividend
including tax credit
Dividend declared 2
12-month high
12-month low
Year-end
Number of shares
Market capitalization
Book value 2, 3
Market-to-book-value ratio2, 4
E.ON share trading volume5
DAX trading volume
E.ON’s share of DAX volume
m
million
bn
%
bn
bn
%
1996
2.58
9.27
0.97
1.39
480
46.20
31.44
45.25
493.8
22.3
20.18
224
52.6
961.5
5.5
1 Numbers up to 1999 refer to the former VEBA AG.2 E.ON Group figures for 1999 and 2000 are pro forma.3 Stockholders’ equity excluding minority interests.4 Year-end stock price expressed as a percentage of book value (excluding minority interests).5All German stock exchanges (including XETRA); beginning in 1998, figures are order-book statistics andare thus not comparable with prior years.
6 The figures reflect the Company’s repurchase of 5.64 percent of its capital stock.
E.ON share key figures1

043
ROCE by segment
E.ON systematically continues value-oriented manage-
ment approach. The new E.ON Group’s primary goal
remains enhancing shareholder value over the long
term. That is why we have put a unified, Group-wide
planning and controlling system into place. The system
ensures that the Company as a whole and our individ-
ual businesses are managed with an eye to increasing
value and that our financial resources are allocated
efficiently.
E.ON’s key performance metric is return on capital
employed (ROCE). To monitor the periodic performance
of our business units, we compare a unit’s ROCE with
its business-specific cost of capital. Value is only created
when ROCE exceeds this minimum return.
The cost of capital employed is determined by
calculating the weighted average cost of equity and
debt. The cost of equity is the return expected by an
investor on the stock of companies in the same risk
category. The cost of debt equals the long-term financ-
ing terms that apply in the E.ON Group. We take into
account that the interest on debt reduces the Com-
pany’s tax burden (tax shield).
The table at right illustrates the derivation of cost
of capital before and after taxes. The Group’s average
cost of capital is currently 7.3 percent after taxes and
11.2 percent before taxes. The individual segments’ pre-
tax capital costs vary between 7.6 and 14.9 percent. This
range reflects the segments’ different risk potential.
5.6 %
5.0 %
0.80
9.6%
5.9 %
–2.0%
3.9%
60 %
40 %
7.3 %
11.2 %
Risk-free interest rate
Market premium
Beta factor1
Cost of equity (after taxes)
Cost of debt (before taxes)
Tax shield (35%) 2
Cost of debt (after taxes)
Share of equity
Share of debt
Cost of capital (after taxes)
Cost of capital (before taxes)3
1 The beta factor is used as an indicator of a stock’s relative risk. A beta greater than 1 signals ahigher risk than the risk level of the overall market; a beta factor of less than 1 signals a lower risk.
2 This reduction takes into account that the interest on debt reduces the Company’s tax burden.3(Cost of capital before taxes) x (1 – tax rate) = cost of capital after taxes 11.2% x (1 – 35%) = 7.3%

044
ROCE by segment
044
ROCE. ROCE is defined as the ratio of earnings before
interest, taxes, and amortization (EBITA) to capital
employed. Capital employed is equal to operating
assets less the amount of noninterest-bearing avail-
able capital.
ROCE measures the sustainable return on invested
capital generated by operating a business. We chose
to use EBITA as our earnings measure because it is net
of the effects of taxes, financial transactions, and
acquisitions. Moreover, EBITA does not include one-off
and rare effects.
The table above shows the E.ON Group’s ROCE and
how it is derived.
ROCE in 2000. In the 2000 financial year our ROCE de-
clined by 0.9 percentage points year-on-year to 8.0 per-
cent. The primary cause was the earnings decline
at our Electricity Division. Nearly all other Divisions in-
creased their returns, in some cases markedly so.
The Group’s return of 8.0 percent is below its cost
of capital of 11.2 percent. This underperformance
results almost exclusively from Telecommunications’
negative return. In addition to startup losses, Telecom-
munications’ high level of capital employed negatively
impacts the Group’s return. Not including Telecommu-
nications, the Group’s return was 11.1 percent. The
divestiture of VIAG Interkom will result in a markedly
improved return in 2001.
Our Electricity Division’s return fell to 10.8 percent,
slightly under its cost of capital. This primarily reflects
the sharp drop in power prices in the wake of market
liberalization. We have already initiated a number
of counteractive measures to improve Electricity’s
return. We moved to shut down 4,800 megawatts of
generating capacity; adopting a results-oriented
approach, we positioned E.ON as a premium energy
brand; and we implemented far-reaching cost-cutting
measures by realizing merger synergies. These mea-
sures will show their full effects over time.
Despite the increase in capital employed following
the complete acquisition of Aral shares, our Oil Divi-
sion’s return displayed a strong recovery. High crude
oil prices, improved refinery margins, and cost cutting
all combined to boost earnings substantially, particu-
larly on the refinery side.
Our Chemicals Division also markedly increased its
return compared with the prior year. The rapid and
successful implementation of the Degussa-Hüls and
SKW-Goldschmidt mergers along with the healthy
overall economy helped to improve earnings. We
1999
2,748
974
3,722
924
4,646
36,815
18,240
1,707
7,184
9,191
7,067
–15,932
–12,326
51,946
51,946
8.9%
in millions (pro forma)
Internal operating profit
+ Interest income (net) charged against internaloperating profit1
= EBIT
+ Goodwill amortization
= EBITA
Intangible assets and property, plant,and equipment
+ Shares in affiliated and associated companiesand other share investments
+ Cumulative goodwill amortization
+ Inventories
+ Accounts receivable
+ Other noninterest-bearing current assets (including prepaid expenses)
– Noninterest-bearing provisions2
– Noninterest-bearing liabilities (including deferred income)
= Capital employed
Average annual capital employed3
ROCE
2000
2,762
747
3,509
877
4,380
38,558
20,002
1,574
7,166
11,297
9,036
–15,080
–15,195
57,358
54,652
8.0 %
1This figure is calculated by adding in interest expenses and subtracting interest income. The pro-formacommentary on page 076 explains the derivation of interest income (net) charged against internaloperating profit.
2Noninterest-bearning provisions mainly include short-term provisions. They do not include provisions for pensions, nuclear-waste management, or other interest-bearing long-term provisions.
3For 1999, capital employed is calculated as of the balance-sheet date because no pro-forma figuresexist for 1998.
E.ON Group ROCE
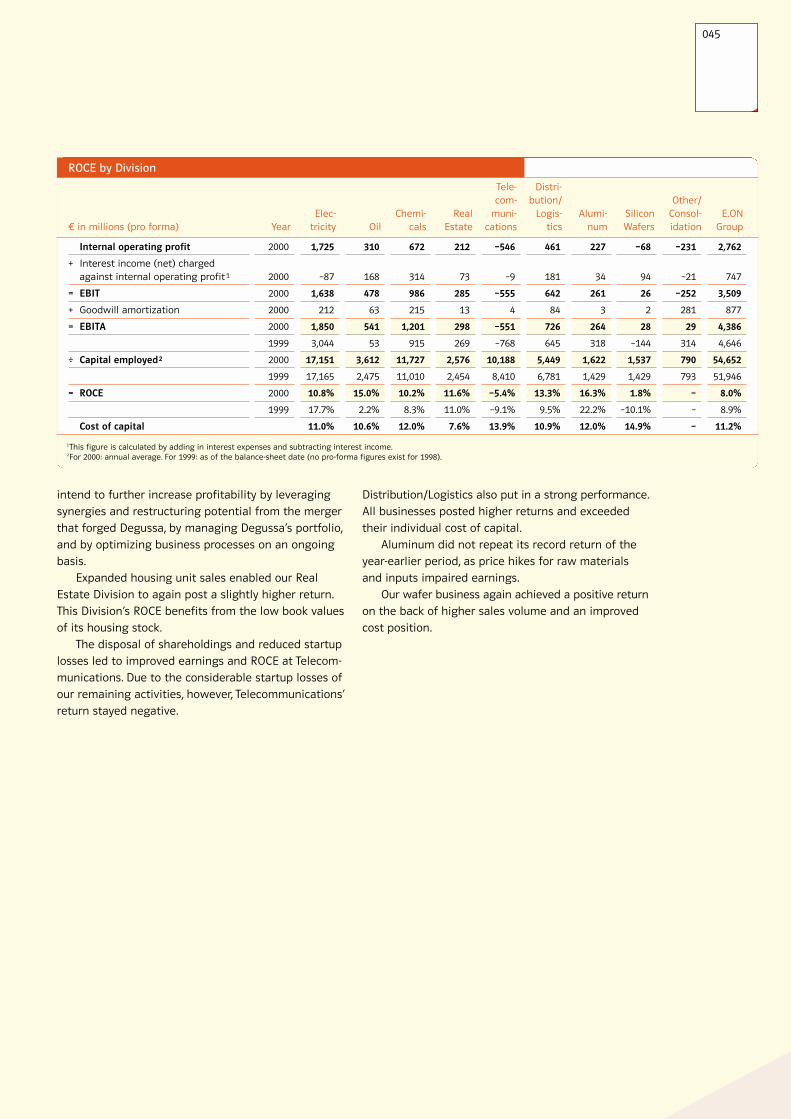
045
intend to further increase profitability by leveraging
synergies and restructuring potential from the merger
that forged Degussa, by managing Degussa’s portfolio,
and by optimizing business processes on an ongoing
basis.
Expanded housing unit sales enabled our Real
Estate Division to again post a slightly higher return.
This Division’s ROCE benefits from the low book values
of its housing stock.
The disposal of shareholdings and reduced startup
losses led to improved earnings and ROCE at Telecom-
munications. Due to the considerable startup losses of
our remaining activities, however, Telecommunications’
return stayed negative.
Distribution/Logistics also put in a strong performance.
All businesses posted higher returns and exceeded
their individual cost of capital.
Aluminum did not repeat its record return of the
year-earlier period, as price hikes for raw materials
and inputs impaired earnings.
Our wafer business again achieved a positive return
on the back of higher sales volume and an improved
cost position.
045
()
in millions (pro forma)
Internal operating profit
+ Interest income (net) chargedagainst internal operating profit 1
= EBIT
+ Goodwill amortization
= EBITA
÷ Capital employed2
= ROCE
Cost of capital
Year
2000
2000
2000
2000
2000
1999
2000
1999
2000
1999
1This figure is calculated by adding in interest expenses and subtracting interest income.2For 2000: annual average. For 1999: as of the balance-sheet date (no pro-forma figures exist for 1998).
Elec-tricity
1,725
–87
1,638
212
1,850
3,044
17,151
17,165
10.8%
17.7%
11.0%
Oil
310
168
478
63
541
53
3,612
2,475
15.0%
2.2%
10.6%
Chemi-cals
672
314
986
215
1,201
915
11,727
11,010
10.2%
8.3%
12.0%
RealEstate
212
73
285
13
298
269
2,576
2,454
11.6%
11.0%
7.6%
Tele-com-
muni-cations
–546
–9
–555
4
–551
–768
10,188
8,410
–5.4%
–9.1%
13.9%
Distri-bution/
Logis-tics
461
181
642
84
726
645
5,449
6,781
13.3%
9.5%
10.9%
Alumi-num
227
34
261
3
264
318
1,622
1,429
16.3%
22.2%
12.0%
SiliconWafers
–68
94
26
2
28
–144
1,537
1,429
1.8%
–10.1%
14.9%
Other/Consol-idation
–231
–21
–252
281
29
314
790
793
–
–
–
E.ONGroup
2,762
747
3,509
877
4,386
4,646
54,652
51,946
8.0%
8.9%
11.2%
ROCE by Division

046
Strategy and investment plan
Successful merger to form E.ON: key strategic milestone.
The VEBA-VIAG tie-up that forged E.ON represents
another major milestone of our Focus & Growth strate-
gy. By systematically focusing on our core energy and
specialty chemicals businesses—and by merging our
core subsidiaries—we have laid a superb foundation
for further growth. To generate the funds necessary to
enlarge our core businesses we intend to obtain optimal
value on the disposal of our non-core assets. In early
2001 we were already able to achieve the first successes
of our growth strategy. On the energy side, the move
in February to acquire a majority stake in Sydkraft,
Sweden’s second largest utility, will significantly aug-
ment our leading position on Europe’s energy market.
On the specialty chemicals side, the takeover of UK-
based Laporte will make us a top global player in the
highly attractive fine chemicals sector.
E.ON’s investment plan reflects its strategic focus
on energy and specialty chemicals. In the next three
years, more than three fourths of planned capital
spending will be channeled into the Company’s two
core businesses. An additional 8 percent is earmarked
for Real Estate. Just under half of our investments will
go toward enlarging established market positions and
developing new markets and products. These capital
expenditures will help cement and further expand our
market positions in our core businesses. More than
60 percent of planned investments are targeted at
Germany. The remaining funds are aimed primarily at
the rest of Europe (25 percent) and America (8 per-
cent). It should be noted that our additional strategic
investments will significantly increase the share of the
Group’s capital spending devoted to new markets and
products as well as the share of expenditures outside
Germany.
Energy: top European utility with global market
positions.
Electricity, natural gas, and water. In the wake of liber-
alization, Europe’s power and gas sectors have begun
to consolidate. Market consolidation in Germany and
Europe will continue to provide E.ON with growth
opportunities. The tie-up of PreussenElektra and Bay-
ernwerk that formed E.ON Energie has already given
us a top-notch position on Europe’s electricity market.
Building on our established strengths in Scandinavia,
Eastern Europe, Switzerland, and the Netherlands, we
plan to markedly enlarge our market position in
Europe. We intend to grow internally by expanding our
supply activities. And we intend to acquire integrated
companies that own direct customer relationships in
attractive markets. We also plan to pursue growth
opportunities overseas. Here, too, we will take an inte-
grated approach by creating value in generation, dis-
tribution, and supply, keeping our focus on direct cus-
tomer access. Moreover, we will be stepping up the
expansion of our natural gas and water activities in
order to exploit internal growth prospects and take
advantage of cross-selling opportunities. But we will
not pursue growth at any price, but rather always to
enhance shareholder value.
Achieving value-oriented growth is critical for our
energy activities. E.ON Energie’s other business driver
remains cost leadership along the entire value chain:
generation, transmission, distribution, and supply.
Preemptive cost-cutting programs and merger syner-
gies in excess of 700 million—which will be fully real-
ized by 2002—will ensure that we remain the cost
leader in Germany, Europe’s most fiercely contested
power market.
Energy 52%
Investments by Division
%
47
5
26
8
14
100
Electricity
Oil
Chemicals
Real Estate
Other Activities
Total
bn
7.3
0.7
4.1
1.2
2.2
15.5
26% Chemicals
8% Real Estate
14% Other Activities
The current investment plan represents the Group’s
first post-merger budget. E.ON plans to invest 15.5 bil-
lion over the next three years. This figure does not
include the medium-sized and major acquisitions that
are integral to the growth strategy of our Energy and
Chemicals Divisions. These strategic investments will
be funded by the sale of non-core assets, which we
expect to generate proceeds in the double-digit billion
range.
Investment plan 2001–2003
047
Overall, we plan to invest about 7.3 billion over the
next three years. The focus will be on Germany, mainly
to enlarge existing market positions and develop new
markets and products. The above-mentioned medium-
sized and major international acquisitions are not
included in this figure.
Oil. We realigned the Oil Division in fall 2000. The hold-
ing company, VEBA Oel AG, provides financial and
strategic management for our oil activities. Being
autonomous entities enables VEBA Oel’s three sub-
sidiaries to operate successfully in their specific mar-
kets. In exploration and production, VEBA Oil & Gas
has successfully completed its portfolio streamlining
program. Its planned capital expenditures will go
toward increasing production in its core fields. At
VEBA Oil Refining & Petrochemicals (VORP), the focus
is on improving the company’s cost structure and val-
ue-added component. VORP will also evaluate selected
growth opportunities. As a retailer, Aral’s strategy cen-
ters around extending its cost leadership and expand-
ing its successful convenience store business as well
as further improving its market position in Eastern
Europe.
In line with these strategic goals, E.ON plans to
invest 0.7 billion in VEBA Oel during the planning
period.
Chemicals: the world’s premier specialty chemicals
company. Combining Degussa-Hüls and SKW Trostberg
created the new Degussa: the global market leader in
specialty chemicals. Degussa already occupies numer-
ous leading positions in attractive specialty segments.
It intends to solidify and enlarge these positions via
targeted internal and external growth and by boosting
profitability. Resources will be targeted at businesses
that market highly differentiated products featuring
substantial customer benefits. Assets that do not meet
these criteria will be divested at optimal value. These
mainly include ASTA Medica, Degussa Bank, Degussa
Dental, dmc2, Phenolchemie, and SKW Piesteritz, as
well as the Gelatins, Metallurgical Chemicals, and Salt
Products business units.
The tie-up that forged the new Degussa substan-
tially enlarged our technology and R&D platforms. We
intend to systematically seize the opportunities
offered by our enhanced R&D capability. Active port-
folio management, cost cutting, and stepped up inte-
gration will all help to markedly improve Degussa’s
profitability. The new group intends to pursue growth
opportunities, particularly in America and Asia.
Chemicals will attract 4.1 billion in investments
over the next three years. This number does not in-
clude major acquisitions like the purchase of Laporte.
Almost half of all planned capital spending is aimed
at extending established market positions as well as
at tapping new markets and developing new products.
The lion’s share will go to Degussa’s core businesses.
Investments outside Germany will be targeted primar-
ily at America, Western Europe, and Asia.
Real Estate. We intend to diligently continue Viterra’s
realignment into a growth-oriented and integrated
real-estate group. Investments will concentrate on
actively managing Viterra’s extensive housing stock,
further its developing real-estate service businesses,
and systematically expanding the company’s commer-
cial real-estate portfolio.
Real Estate’s capital expenditures total 1.2 billion
during the planning period. The focus will be on the
Residential Investment division. Viterra intends to
achieve additional growth—beyond the budget plan—
at its Commercial division.
Other Activities. E.ON is in the process of systematical-
ly divesting its non-core assets. In 2000 the Company
sold its shareholdings in E-Plus, Cablecom, VEBA Elec-
tronics, Gerresheimer Glas, and Orange Communica-
tions—quickly and on favorable terms. It also disposed
of its majority stake in Schmalbach-Lubeca. In January
2001 E.ON sold its VIAG Interkom interest for an exer-
cise price of about 7.3 billion in line with its option
deal with British Telecom. For the time being, E.ON will
work diligently to enhance the value of its remaining
telecoms activities: Austria’s ONE and France’s
Bouygues Telecom. The tax relief on capital gains that
will take effect in Germany in 2002 is an important
consideration for the sale of additional Stinnes shares
and for the divestiture of VAW aluminium. Klöckner &
Co is slated for sale in 2001. Market sentiment regard-
ing technology stocks is a key factor for timing the
divestment of MEMC.
Other Activities will attract investments totaling
2.2 billion during the planning period. The budget in-
cludes individual businesses until their planned de-
consolidation. The sale of non-core assets is expected
to generate proceeds in the double-digit billion range.

048
Employees
Post-merger integration: a key challenge for human
resource management. The VEBA-VIAG tie-up and the
subsequent integration process represented key
human resource (HR) challenges in 2000. Rapid and
transparent decisions on personnel matters—especial-
ly regarding top management positions—helped accel-
erate the merger process. Management audits ensured
that objective and fair criteria were used to fill posi-
tions. Throughout the merger process we informed all
employees quickly and comprehensively about current
projects and decisions. A series of events helped to
integrate VEBA and VIAG employees and to create an
E.ON corporate culture.
Necessary personnel adjustments—like transfer-
ring employees to new locations—were accompanied
by appropriate compensation packages or umbrella
agreements. These were negotiated quickly and fairly
with employee representatives. The strong emphasis
placed on HR issues before the merger and the
prompt attention paid to them afterward made impor-
tant contributions toward speeding the integration
of VEBA and VIAG.
HR and corporate strategy closely linked. Fundamental
changes await us in the coming years, from the
Group’s ongoing focus and increasing internationaliza-
tion to e-commerce and m-commerce. In an environ-
ment of change, it is important for HR and corporate
strategy to be closely linked. This is why we will soon
be accelerating the pace of our transition away from
work- and organization-based structures toward
dynamic, project-oriented processes and more flexible
work schedules.
+/– %
–4
+47
–1
+14
+46
–25
–17
–8
Year-end figures
Electricity
Oil
Chemicals
Real Estate
Telecommunications
Other Activities
E.ON AG/Other
Group employees
2000
34,406
8,593
62,110
5,567
1,409
74,044
659
186,788
1999
35,968
5,863
62,464
4,901
962
92,784
791
203,733
Pro forma
Employees (personnel costs)
thereof:
Wages and salaries
Social security
Insurance pensions
Creditors (interest)
Governments (dividend)
Shareholders (dividend)
Company (increase in retained earnings)
Net added value
%
57.4
(45.5)
(7.4)
(4.5)
6.7
13.8
5.1
17.0
100.0
m
10,858
(8,612)
(1,396)
(850)
1,261
2,618
972
3,213
18,922
2000 1999
%
62.5
(50.0)
(7.5)
(5.0)
7.2
11.7
5.1
13.5
100.0
m
10,393
(8,313)
(1,256)
(824)
1,202
1,953
849
2,245
16,642
Employees
Net added value
57 % Employees(personnel costs)
7 %
14 %
Application of net added value within the E.ON Group
Shareholders(dividend)
Creditors(interest)
17 %Company (increasein retained earnings)
5%Governments(taxes)

049
Performance-based pay. We have increased the vari-
able component of our top managers’ remuneration.
The variable element takes into account both personal
and corporate performance. To help measure personal
achievement, top managers and their superiors agree
on a set of targets at the beginning of each year. The
performance-based compensation scheme that cur-
rently affects top-level managers will successively be
expanded to include more management staff and
employees.
E.ON InvestmentPlan helps employees invest for the
future. We launched the E.ON InvestmentPlan last
year. The Plan is an extension of the Company’s
employee stock purchase program and provides
employees with incentives for long-term saving, par-
ticularly to supplement their retirement income. The
InvestmentPlan was introduced in the second half of
2000 at the companies of the former PreussenElektra
and Degussa-Hüls as well as at VEBA Oel, Viterra, and
E.ON headquarters. Staff at the former Bayernwerk
and SKW Trostberg companies will be brought into the
Plan in 2001.
In addition to facilitating the purchase of E.ON
shares, the InvestmentPlan enables employees to
invest in equity and bond funds. The Company rewards
long-term saving by giving employees a progressively
larger investment bonus. Six months after it was
launched, over 60 percent of eligible employees were
enrolled in the Plan.
Employee training and job initiatives. Employee train-
ing and job initiatives were again a top HR priority at
E.ON in the year under review. We not only maintained
our job training offerings at their current high level,
but also continued our Venturing into New Worlds of
Work initiative. This scheme is designed to give young
people without a high-school diploma the opportunity
to acquire crucial work experience. E.ON is also com-
mitted to providing trainee positions for individuals
who are physically challenged.
E.ON is active in Germany’s nationwide Initiative
for Employment. Since fall 2000, E.ON has headed up
four joint projects involving other members of the
Düsseldorf regional network. These include a checklist
for young people entering the labor market, an inno-
vative job creation project, and support schemes for
startups.
Ongoing employee and management development
programs. E.ON recognizes that HR marketing and
ongoing employee development are essential to
ensure that the Group continues to attract and retain
top job candidates. A major milestone in this effort
was the founding of E.ON Corporate University.
Employee and management development programs
are Group-wide in their focus. They are continually
updated to help the Company retain its high poten-
tials and systematically promote their general man-
agement skills. These programs reinforce E.ON’s policy
of attempting to fill top management positions from
within its own ranks.
• The Top Talent Program, which is aimed at top uni-
versity graduates from inside or outside the Com-
pany who already have professional experience,
lets enrollees work on a project team while
attending courses on international management.

050
Employees
• E.ON Campus gives our high potentials the oppor-
tunity to interact with top E.ON executives and
discuss current Company topics and broader busi-
ness issues. The program is designed to facilitate
Group-wide networking, knowledge transfer, and
interdisciplinary projects.
• The INSEAD Business School and the International
Institute for Management Development are two
examples of executive development programs that
are custom-tailored for E.ON. Held once a year,
these programs explore international manage-
ment topics as well as E.ON-specific issues.
• The E.ON Executive Forum serves primarily to help
assess the executive potential of the Group’s top-
level managers. Observers consist of members of
E.ON’s Board of Management and the Chairmen of
the Boards of Management of the major Group
companies.
Professional development. Ongoing professional
development and supplementary training at all levels
of the Company are crucial to sustaining our competi-
tiveness. Every year E.ON employees improve their
knowledge and skills at over 4,000 Company-spon-
sored courses—from foreign-language, computer,
commercial, and technology training programs to
advanced learning in project management and nego-
tiating. Last year more than 50,000 E.ON employees
took advantage of the Corporation’s professional
development offerings.
Workforce levels impacted by implementation of Group
strategy. The E.ON Group employed 186,788 people at
the end of 2000—a year-on-year decline of roughly
17,000 employees or 8 percent. A large part of this
was attributable to the disposal of non-core assets
like VEBA Electronics (representing a reduction of
6,200 employees) and the Company’s majority stake in
Schmalbach-Lubeca (which reduced staff by 8,700).
Ongoing restructuring measures at our Electricity
Division reduced the workforce there by 1,500 employ-
ees. The sale of Raab Karcher’s building materials unit
led to staff reductions of 6,000 employees at Stinnes.
By contrast, the number of employees at VEBA Oel
increased by 2,900 due to Aral’s first-time full consoli-
dation, and the number of staff at our Electricity
Division rose by 800 in the wake of acquiring EZH, a
Dutch energy utility (EZH is now called E.ON Benelux
Generation).
The internationalization of the E.ON Group con-
tinues unabated. There were 83,338 Group employ-
ees—44.6 percent of our total workforce—at locations
outside Germany at year-end 2000, up from 37.5 per-
cent at year-end 1999.

051
Caring for the environment is a key part of the way
E.ON and our subsidiaries do business. Our steward-
ship includes integrating conservation issues into the
planning stage of projects, monitoring the environ-
mental corporate citizenship of our suppliers, and
striving continuously to use resources even more effi-
ciently.
E.ON Energie regards renewables as a significant tool
for advancing the cause of environmental protection.
That’s why in 2000 our energy subsidiary once again
initiated in-house projects and development programs
as well as offered environmentally friendly energy
products to its customers. It also wholeheartedly sup-
ports the efficient use and conversion of energy. E.ON
Energie’s signature of the German power industry’s
climate protection declaration underscores its commit-
ment.
E.ON Energie’s stewardship of the environment
goes beyond merely complying with existing law. For
example, its power transmission division verifies the
recyclability of the materials it uses. To the extent
possible, it employs water-soluble products with a low
heavy-metal content for the anticorrosive coatings
that must be applied regularly to protect electricity
pylons and transformer substations.
Last year VEBA Oel continued to invest in new refining
facilities for enhanced fuels. Since mid-February 2001
all Aral service stations in Germany have been selling
low-sulfur SuperPlus gasoline containing only 10 parts
per million (ppm) of sulfur. The refineries of VEBA Oil
Refining & Petrochemicals are already preparing for
the second stage of the fuel directive that takes effect
in 2005. The directive calls for the phased-in reduction
of the sulfur-content of all fuels to 50 ppm and even-
tually to 10 ppm.
VEBA Oel also invests extensively in soil and water
protection. Over the next 10 years the existing tanks at
its Gelsenkirchen facility will be retrofitted with dou-
ble bottoms as well as leakage and tank shell monitor-
ing systems. Our oil subsidiary also plans to initiate
a step-by-step program to modernize its wastewater
systems.
Degussa is unequivocally committed to sustainable
development and participates actively in the global
chemical industry’s Responsible Care Initiative. At the
start of 2001 Degussa issued new internal guidelines
on environmental, safety, health, and quality issues.
The guidelines’ German acronym is USGQ. A binding
USGQ code of practice ensures that all Degussa com-
panies meet the same standards. Degussa will publish
its first post-merger responsible-care and environmen-
tal report in June 2001.
Last year Degussa invested worldwide in measures
to protect the environment. For example, the company
installed emissions and waste-treatment mechanisms
at the new acrylic acid facility in Marl; it erected a
centralized wastewater treatment facility in Trostberg;
it initiated a project to retain water in its fire-fighting
system in Essen; it used organic carbon bonding to
reduce the impact of wastewater in Thailand; and it
invested in measures to reduce dust emissions in
Chile and Singapore. Because Degussa increasingly
takes an integrated approach to environmental protec-
tion, its conservation investments in 2000 declined
slightly year-on-year. Degussa considers conservation
issues early in the product development process. This
obviates the need for additional hefty investments to
protect the environment during production.
In 2000 Degussa-Hüls impressed analysts of the
Zurich-based Sustainable Asset Management Group
with its commitment to sustainable development. The
SAM analysts responded by including Degussa-Hüls
in the Dow Jones Sustainability Share Index. Degussa
will also apply to have its stock listed in this index.
Environmental protection
+/– %
+7
–10
in millions
Investments
Operating costs (including capital service)
2000
141
1,104
1999
132
1,222
Preliminary figures
Environmental protection

001 002 003 004 005 006 007 008 009 010 011 012
025 026 027 028 029 030 031 032 033 034 035 036
049 050 051 052 053 054 055 056 057 058 059 060
073 074 075 076 077 078 079 080 081 082 083 084
097 098 099 100 101 102 103 104 105 106 107 108
121 122 123 124 125 126 127 128 129 130 131 132
Group Divisions

013 014 015 016 017 018 019 020 021 022 023 024
037 038 039 040 041 042 043 044 045 046 047 048
061 062 063 064 065 066 067 068 069 070 071 072
085 086 087 088 089 090 091 092 093 094 095 096
109 110 111 112 113 114 115 116 117 118 119 120
133 134 135 136 137 138 139 140 141 142 143 144
• Merger of PreussenElektra and Bayernwerk consummated• Oil Division’s realignment executed according to plan• Tie-up of Degussa-Hüls and SKW Trostberg successfully completed• Real Estate Division sustains growth pattern

054
Electricity
• PreussenElektra and Bayernwerk consummate merger• Sagging power prices impair earnings• Agreement reached on continued use of nuclear energy• E.ON Energie adjusts generation capacity to match demand• 2001 internal operating profit projected to be slightly
above previous year’s figure
Primary energy consumption in Germany. Preliminary
estimates for 2000 put Germany’s consumption of pri-
mary energy at about 484 million tons coal equivalent,
on par with the prior year’s figure.
The sales volume of petroleum products declined
slightly, whereas natural gas consumption fell marked-
ly owing to mild autumn temperatures across the
country. In 2000 Germany burned more hard coal and
lignite than in 1999.
Electricity consumption from Germany’s public grid
amounted to 490 billion kilowatt-hours (kWh) in 2000.
This represents about a 2 percent increase over the
1999 total. At 159.3 billion kWh, nuclear energy genera-
tion was relatively unchanged from 1999. Nuclear
energy met 34 percent of Germany’s power needs in
2000. Conventional power units covered around 59 per-
cent of German consumption, hydroelectric plants
just under 5 percent, and other types of power plants
roughly 2 percent.
PreussenElektra and Bayernwerk consummate merger.
On June 13, 2000, the EU Commission gave antitrust
approval to the merger of VEBA and VIAG. This paved
the way for the integration of the two groups’ energy
companies, PreussenElektra and Bayernwerk. The
merger of PreussenElektra and Bayernwerk was con-
summated on July 14, 2000, the date the merged
entity—E.ON Energie—was entered into the Commer-
cial Register.
Following the tie-up of PreussenElektra and
Bayernwerk, the two companies’ operating units and
business activities were combined and reorganized
into the following divisions: Conventional Power, Nuclear
Power, Transmission, Hydroelectric Power, Trading, and
Distribution & Supply. The company’s data processing
and facility management operations will be merged
in 2001.
Under the post-merger integration plan, the parent
company, E.ON Energie AG, is responsible for manag-
ing the interaction of generation, trading, transmis-
38.7% Oil186.9 MTCE
21.1% Natural gas102.1 MTCE
0.1% Net importedpower0.3 MTCE
0.8% Hydro, wind3.7 MTCE
Total: 483.6 million tons coal equivalent (MTCE)
13.0%
10.9%
1.9%Other9.4 MTCE
Lignite52.6 MTCE
13.5%Hard coal65.5 MTCE
Nuclear63.1 MTCE
Preliminary figures
34.1% Nuclear159.3 TWh
27.4% Lignite127.8 TWh
0.3% Oil1.2 TWh
2.0% Other9.5 TWh
Total: 466.8 terawatt-hours (TWh)
6.9%
4.7%Hydro22.0 TWh
24.6%Hard coal114.7 TWh
Natural gas32.3 TWh
Preliminary figures
+/– %
+1
–30
–58
+29
–4
in millions (pro forma)
Sales*
Internal operating profit
Cash flow from operations
Investments
Employees at year-end
2000
13,350
1,725
1,037
3,766
34,406
1999
13,180
2,466
2,498
2,923
35,968
E.ON Energie AG, Munich
Primary energy consumption in Germany in 2000
2000 net power generation on Germany’s public grid
*Includes electricity taxes.

055
cannot seek the approval of its Supervisory Board.
The approval of E.ON’s Supervisory Board is required
before the parties can sign the draft agreement.
On May 18, 2000, the so-called Co-Generation
Protection Act took effect in Germany. It requires local
network operators, under certain conditions, to buy
power from combined heat and power (CHP) stations.
The law combines the procurement requirement with
a country-wide burden-sharing scheme. In particular,
the law is intended to provide transitional support for
municipal CHP units. The federal government has
plans to amend the current co-generation law by 2002
or earlier. The main feature of the proposed law is the
introduction of a CHP quota system. Under the legisla-
tion, electric suppliers would be required to procure an
increasing share of their power needs from CHP plants.
The law aims to reduce CO2 emissions at Germany’s
power stations by 23 million tons phased in by 2010.
E.ON Energie has made it clear to Germany’s politi-
cal leaders that legislative tampering with the coun-
try’s recently liberalized power market would be eco-
nomically harmful. It would both destroy capital and
eliminate jobs at existing power stations.
In response, E.ON Energie, along with other Ger-
man electric companies, proposed an Action Program
for Climate Protection on January 26, 2001. Provided
that the government renounces its proposed quota
system, the energy companies agreed to implement
measures to cut CO2 emissions by a total of 45 million
tons by 2010. Germany’s Economics Minister accepted
the Action Program as a viable alternative to the gov-
ernment’s quota scheme. He has announced his desire
to transform the Action Program into a binding climate-
control agreement between Germany’s government
and its energy industry by April 1, 2001.
sion, and supply. It sets operational targets and man-
ages control functions. The operating companies are
legally and organizationally autonomous. They act as
profit centers in line with the Group’s overall strategy.
Internal operating profit lags behind previous year’s
figure. The liberalization of Germany’s power market
began in April 1998. But it was not until 2000 that an
entire financial year bore the full impact of deregula-
tion. Keen price competition extended across all cus-
tomer segments and led to severe price cuts.
E.ON Energie supplied 15 percent more power in
2000 than in the prior year. Despite the gain, sales rose
just 1 percent owing to markedly lower power prices,
particularly since the second half of 1999. As expected,
E.ON Energie’s 2000 internal operating profit slid
30 percent year-on-year despite vigorous cost manage-
ment. Later in 2000, power prices began to stabilize.
By year-end 2000 E.ON Energie had already real-
ized annual cost savings totaling 200 million as part
of the anticipated synergies from the PreussenElektra-
Bayernwerk merger.
Energy utilities reach compromise with German
government on future of the country’s nuclear power
plants. On June 14, 2000, the German government and
the country’s major energy utilities reached an agree-
ment in principle on the future of Germany’s nuclear
power stations. The agreement sets the maximum
amount of electricity that Germany’s nuclear power
plants are allowed to generate between January 1,
2000, and their final decommissioning. The agreement
allows electric companies to shift power production
among their assets so that they can generate electrici-
ty at their most economically efficient units. The feder-
al government’s objective is to end nuclear power
production in Germany. In light of this, the agreement
represents an acceptable compromise, one that pro-
vides political safeguards for Germany’s energy utilities
to continue operating their existing nuclear power
plants. Agreement has not yet been reached with the
federal government on the necessary amendments to
the German Nuclear Power Regulations Act. Until an
understanding is reached on such amendments, E.ON
200
ENEL RWE Vattenfall Endesa ElectrabelEdF
225 218 92 86 79460
400
Power supplied in terawatt-hours
*Internal figures Source: Deutsche Bank estimates as of December 11, 2000
E.ON*
211
European energy utilities

Antitrust approval of VEBA-VIAG merger. As part of the
EU Commission’s merger control process, VEBA and
VIAG agreed to dispose of a number of shareholdings.
Germany’s antitrust regulators made similar require-
ments when they approved the RWE-VEW tie-up. The
elimination of cross shareholdings between RWE-VEW
and VEBA-VIAG was a key issue.
Electricity
056
+/– %
+6
+5
+18
+98
+15
In millions of kilowatt-hours
Standard-rate customers
Special-rate customers
Regional and municipal utilities
Traders
Total power supplied
2000
31,301
52,555
117,472
9,724
211,052
1999
29,485
49,988
99,254
4,902
183,629
127.2 Distributors
In terawatt-hours
8.5
52.6
31.3
Transmission losses, pumped
storage
Standard-ratecustomers
Special-ratecustomers
E.ON Energie divested its VEW stake around the end of
last year. In return, RWE transferred its shareholdings
in Gasag and Gelsenwasser to E.ON Energie.
In addition, an asset-swap agreement was reached
regarding RWE’s stakes in Bawag, Bergemann, and
Erdgas Schwaben.
Furthermore, E.ON Energie and RWE have decided
to dissolve Rhenag Energie and divide its assets be-
tween them.
E.ON Energie and RWE sold their stakes in Veag
and Laubag to HEW on December 13, 2000. As part of
the combined cash and equity deal, E.ON Energie will
receive HEW’s 15.7 percent shareholding in Sydkraft.
E.ON Energie also agreed to sell its 49 percent
interest in Bewag to HEW. In return, E.ON Energie is to
receive HEW’s 61.85 percent stake in Hein Gas Ham-
burger Gaswerke GmbH plus cash. The transaction is
still pending because another Bewag shareholder,
Mirant (formerly Southern Energy), obtained a tempo-
rary injunction against the divestiture. E.ON Energie
has filed a motion to have the injunction lifted and is
currently in out-of-court arbitration with Mirant.
E.ON Energie agreed to sell its 15.4 percent stake
in HEW to Vattenfall, a Swedish electric company. In
return, E.ON Energie will receive a 33.3 percent share-
holding in Baltic Cable, a 41.7 percent interest in VCE, a
Czech regional utility, a 10.6 percent stake in Lithua-
nia’s LPC, and a cash payment.
E.ON Energie adjusts generation capacity to match
demand. In response to the harsh competition on
Germany’s power market, E.ON Energie evaluated the
economic viability of its entire generation fleet. As a
result of the analysis, the company decided in October
2000 to shut down 4,800 megawatts (MW) of its
30,000 MW of total installed capacity. The move pri-
marily affects smaller and older power plants that are
unable to operate economically over the medium
term.
Power sales volume climbs 15 percent. In September
2000 the power supply arms of PreussenElektra and
Bayernwerk were combined to form E.ON Vertrieb.
Electricity prices for regional distribution companies,
by far the supply division’s largest customer segment,
bottomed out in the first half of 2000. Since that time,
power prices have gradually stabilized. Prices for
industrial special-rate customers also displayed initial
signs of consolidation following two years of erosion.
Electric companies continued to compete aggressively
for retail customers. Customer loyalty, however, has
meant that comparatively few residential customers
have switched suppliers.
1999
8,349
2,077
9,944
4,721
1,152
2,854
46
In megawatts at year-end
Nuclear
Lignite
Hard coal
Natural gas
Oil
Hydro
Other
2000
8,377
2,077
9,794
4,721
1,152
2,854
46
E.ON Energie power supplied
Power supplied by E.ON Energie
E.ON Energie generation capacity

057
In October 2000 E.ON Energie and six of its German
regional subsidiaries acquired a majority interest in
mercateo.com, an internet marketplace. E-commerce
provides E.ON Energie with an important new distribu-
tion channel for its power products.
Power supplied rose 15 percent year-on-year to
211,052 million kilowatt-hours (kWh). The increase
results primarily from distinctly greater commodity
trading volumes, the integration of the Dutch electric
company E.ON Benelux Generation, and the acquisi-
tion of new customers in Germany and Europe. Power
supplied to regional and municipal electric companies
in and outside Germany climbed 18 percent to
117,472 million kWh. Electricity supplied to special-rate
customers advanced 5 percent, while power supplied
to standard-rate customers rose 6 percent. Transmis-
sion losses and pumped storage together consumed
8,488 million kWh. Total power supplied increased
16 percent to 219,540 million kWh.
E.ON Energie procures majority of power from its own
generation assets. Electricity procurement in 2000
totaled 219.6 billion kWh. Of this total, 57 percent or
124.5 billion kWh came from E.ON Energie’s own gen-
eration assets; 43 percent or 95 billion kWh was pro-
cured from outside sources.
E.ON Energie’s conventional thermal power stations
produced 59.8 billion kWh in 2000. Hard-coal-fired power
units contributed 43 billion kWh to this figure, lignite-
fired power stations 12.1 billion kWh. The company’s
oil- and gas-fired power plants and CHP stations gen-
erated 4.7 billion kWh. Output at its nuclear assets
totaled 55.4 billion kWh. E.ON Energie’s hydroelectric
stations produced 8.8 billion kWh of electricity.
E.ON Energie purchased a total of 95 billion kWh of
power, 16.9 billion kWh of which was from jointly oper-
ated units. The significant share of purchased power
partially reflects procurement commitments in Hungary
and eastern Germany.
European power trading expanded. In early October
2000 E.ON Energie’s commodity trading activities were
combined into E.ON Trading. E.ON Trading has built
on the success of VEBA’s and VIAG’s trading arms and
has continually expanded its European power trading
As percentages
27.7%
15.4%
56.9%Other suppliers
Jointly operatedpower stations
Own generation
operations. Trading volume in 2000 rose 73 percent to
46.1 billion kWh compared with 26.7 billion kWh in
1999, making E.ON Trading one of Europe’s premier
power trading companies.
E.ON Trading’s core markets are Germany, Switzer-
land, the Netherlands, Austria, and Scandinavia. It also
trades power in Italy, Belgium, and the Czech Republic.
E.ON Trading is active on Europe’s leading power
exchanges in Oslo (NordPool), Amsterdam (APX), Leip-
zig (LPX), and Frankfurt (EEX). As the rest of Europe
transitions to liberalization, E.ON Trading is gradually
expanding its commodity trading operations into new
marketplaces.
1999
46.7
34.2
8.6
2.3
8.2
As percentages
Nuclear
Hard coal
Lignite
Natural gas & oil
Hydro & other
2000
44.5
34.5
9.8
3.8
7.4
In terawatt-hours
Sale
Purchase
2000
23.4
22.7
*Includes spot market.
E.ON Energie power procurement in 2000
Sources of proprietary generation
Electricity trading volume*

Natural gas distribution bests prior year’s total. E.ON
Energie sold a total of 72.5 billion kWh of natural gas,
an annual gain of 14 percent. Reported sales volume
was higher primarily because in 2000 Ferngas Salzgit-
ter was included in Avacon’s 12-month figures for the
first time. Natural gas sales rose 36 percent to 1.6 bil-
lion. Wholesale gas prices advanced markedly during
2000 on the back of sharply higher petroleum prices.
E.ON Energie’s stakes in regional and municipal
operators make it a major player on Germany’s natural
gas market. The company also has shareholdings in
Italy, Austria, the Czech Republic, Hungary, Poland,
Latvia, Sweden, and the Netherlands. These companies
are active along the entire value chain, from explora-
tion and production to ultimate-customer distribution.
In the Czech Republic E.ON Energie has a considerable
share of the retail gas distribution market. In Latvia
E.ON Energie and Ruhrgas together own nearly 43 per-
cent of Latvijas Gaze, a nationwide operator.
Water sales volume declines from previous year. At
259 million cubic meters, E.ON Energie supplied 3 per-
cent less water in 2000 than in the previous year.
Its 2000 sales totaled 217 million compared with
220 million in 1999.
E.ON Aqua was formed in 2000 with the aim of
further expanding the group’s water business. E.ON
Aqua’s key shareholding is Gelsenwasser, Germany’s
largest private water utility. After acquiring RWE’s
Gelsenwasser stake in early 2001, E.ON Aqua now
owns more than 80 percent of the company.
In 2000 Gelsenwasser and its shareholdings sup-
plied water to 2.7 million inhabitants and treated the
wastewater of 1.2 million inhabitants. It also provided
these services to numerous industrial enterprises.
Investments increase. At 3,766 million, investments in
2000 were 29 percent higher than in the prior year.
Expenditures on property, plant, and equipment
including intangible assets totaled 989 million for
2000 compared with 1,103 million in the previous
year. 773 million of this went to power plants and
district heating facilities, 212 million to electricity,
gas, and district heating distribution, and 4 million to
power trading.
E.ON Energie invested 2,777 million in financial
assets in 2000 versus 1,820 million in 1999. The acqui-
sition of EZH, a Dutch energy utility, was the com-
pany’s most significant investment. EZH now operates
as E.ON Benelux Generation.
Developing innovative technologies is top priority. One
of E.ON Energie’s top priorities is to play an active role
in developing innovative technologies. The company
continues to update its power station technology. This
includes improving materials, optimizing operations,
and developing new methods and processes for coal-
based electric generation such as circulating pressur-
ized fluidized bed technology. E.ON Energie is active in
applying the latest advances in power storage and dis-
tribution technology. These include high temperature
superconductors, new switching components, and
improved batteries. The company is also developing
renewables such as wind, biomass, and solar energy.
Moreover, E.ON Energie continually develops innova-
tive IT applications and new technologies for generat-
ing power and heat, particularly micro-energy technol-
ogy like fuel cells.
E.ON Energie’s 55 percent stake in ONELINE gives
it a presence in the development of information tech-
nologies. ONELINE is carrying out a large-scale field
trial to test Powerline communications technology in
customers’ homes. This technology provides a platform
for offering additional services like energy manage-
ment, information products, and IT services.
Over the next few years, new and increasingly
cheaper technologies will make distributed power and
heat generation increasingly relevant. In addition to
the regenerative technologies required by Germany’s
Renewable Energy Act (EEG), E.ON Energie is initiating
a series of pilot projects to test and further develop
such technologies, particularly fuel cells, micro-gas tur-
bines, and small-scale CHP stations. In the future E.ON
Energie intends to expand its use of these technologies
and employ them in ways that make business sense.
Electricity
058
+/– %
–9
+36
–1
+25
+96
+1
in millions (pro forma)
Electricity
Natural gas
Water
District heating
Other
Total
2000
9,828
1,594
217
150
1,213
13,002
1999
10,781
1,176
220
120
619
12,916
*Excludes electricity tax.
E.ON Energie sales by division*

059
Outlook. The synergy effects created by the
PreussenElektra-Bayernwerk merger, capacity adjust-
ments to our generation portfolio, and aggressive cost
management will further improve our competitive-
ness. In addition, we intend to significantly strengthen
our international position—especially in Europe’s
liberalized energy market—by making acquisitions in
our core energy businesses of electricity, natural gas,
and water.
In early February E.ON Energie acquired an addi-
tional 5.3 percent of the capital stock and 8.5 percent
of the voting rights in Sydkraft, the Swedish utility. In
keeping with Swedish practice, E.ON Energie submit-
ted a public tender offer to the remaining shareholders.
Acquiring a majority stake in Sydkraft cements our
position in Sweden’s substantial energy market and
builds a solid foundation for additional growth and
further expansion in Europe.
For 2001 we expect that the energy market will
continue to consolidate and that power prices will
stabilize or recover. Overall, we anticipate that our
Electricity Division’s 2001 internal operating profit will
show a slight improvement from 2000.
Denmark Sweden
Norway
Viking Cable
Baltic Cable
Netherlands
RWERWE
RWE
VEAG
VEAG
VEAG
RWE
RWE
RWE
EnBW
Czech Republic
Austria
E.ON Energie high-voltage grid

060
Oil
• Internal operating profit up sharply despite price wars at the pump
• Additional cost-cutting measures initiated• Realignment completed according to plan• 2001 internal operating profit expected to repeat
prior year’s strong performance
Sales volumes and sales revenue distinctly higher.
Petroleum and petrochemical sales volumes were up
distinctly year-on-year—from 31.8 million tons to
39.5 million tons. The increase reflects the first-time full
consolidation of Aral and the inclusion of the aromat-
ics business of the Emsland refinery (ERE) acquired in
late 1999. Sales revenues also rose on the back of higher
sales volumes, a sustained increase in international
crude-oil and product prices, and a strong dollar. Sales
reached 28.8 billion in 2000, representing a 135 per-
cent rise over the year-earlier total. Sales figures were
partially inflated by an eco-tax increase instituted on
January 1, 2000. Including German sales tax, this raised
the price of a liter of fuel an additional 7 pfennigs
(0.036). At 8.6 billion, petroleum and eco-taxes
together comprised around 30 percent of sales. Exclud-
ing petroleum taxes, 2000 sales climbed just under
140 percent, reaching 20.2 billion compared with
8.4 billion in 1999.
Enhanced cost-cutting measures. Our Oil Division’s
“VEBA Oel 2000” cost-cutting program, launched in
1995, generated savings of over 400 million by 2000.
In response to improved cost structures among its
competitors following a spate of industry mergers, last
year VEBA Oel initiated further cost-cutting measures,
particularly in its refinery operations.
Restructuring of operations completed on schedule. In
2000 VEBA Oel completed the realignment envisioned
in its 1999 plan. Exploration and production operations
were combined into VEBA Oil & Gas (VOG) in the wake
of Deminex’s reorganization in 1998. The entire petro-
leum retail business—including heating-oil delivery—
was folded into Aral. Responsibility for the production
of petroleum and petrochemical products was
assigned to the newly formed VEBA Oil Refining
& Petrochemicals (VORP). All three of VEBA Oel’s sub-
sidiaries bear full responsibility for managing their
operations. They have strong competitive positions
and the flexibility and independence to react swiftly
and purposefully to seize growth opportunities in their
German petroleum industry profits from positive
underlying conditions. Germany’s petroleum industry
benefited from unusually high crude oil prices, sub-
stantially higher refining and petrochemical margins,
and a strong dollar. A sharp decline in service station
margins, however, negatively impacted earnings.
Reduced OPEC oil production quotas along with
brisk demand and low inventories lifted the annual
average price for a barrel of crude oil from $10.5 to
$28.4. Buoyant demand also drove up refining margins
from $10.4 to $27 per ton. By contrast, Germany’s serv-
ice station sector posted considerable losses resulting
mainly from keener competition and heightened price
consciousness among consumers. Higher prices and
comparatively mild weather prevented the anticipated
increase in heating oil demand from materializing.
Internal operating profit up sharply despite price wars
at the pump. VEBA Oel’s internal operating profit
surged from 34 million in 1999 to 310 million in the
year under review. Higher crude oil prices and refining
margins benefited the company’s upstream, refining,
and petrochemicals units. By contrast, extremely
unsatisfactory margins severely burdened Aral’s inter-
nal operating profit. VEBA Oel augmented its Aral
shareholding in late 1999 and early 2000. Goodwill
amortization and interest expenses stemming from
the acquisition as well as hedging transactions also
offset a portion of earnings gains.
+/– %
+135
+812
+53
+32
+47
in millions
Sales*
Internal operating profit
Cash flow from operations
Investments
Employees at year-end
2000
28,780
310
918
1,723
8,593
1999
12,229
34
601
1,308
5,863
*Includes petroleum taxes.
VEBA Oel AG, Gelsenkirchen

061
markets. As a leanly staffed holding company, VEBA
Oel AG will focus on the financial and strategic man-
agement of its three subsidiaries.
VOG posts distinctly higher earnings in upstream
business. VOG is responsible for the international
exploration, development, and production of oil and
natural gas. VOG concentrates on four main regions:
Northwestern Europe, North Africa/Near East, Caspian
region/Middle East, and Northern Latin America.
In 2000 VOG produced a total of about 58.3 million
barrels of oil equivalent (boe). Proven crude oil and
natural gas reserves at year-end came to 604 million boe.
VOG has consistently optimized its portfolio and
now focuses on high-yield projects, further bolstering
its competitive position.
VOG’s upstream business profited from high crude
oil prices and the strong dollar. Additional positive
factors included the lack of any sizable non-recurring
charges as well as a one-off gains from the sale of
fields. VOG’s earnings were markedly higher in 2000
than in the prior year.
Lower margins at the pump impair Aral earnings.
With over 2,500 service stations, Aral is Germany’s pre-
eminent service station operator. Since taking over
VEBA Oel’s liquid petroleum products business, Aral is
also Germany’s leading supplier of heating oil. In 2000
Aral reported negative operating earnings for the first
time since the early 1980s. Price hikes on international
petroleum markets, the stronger dollar, and a renewed
increase in Germany’s eco-tax sent gasoline prices to
over DM2 per liter—more than $3.50 a gallon. In addi-
tion, a competitor introduced a discount-based cus-
tomer card. This unleashed a price war on the German
market, which at times resulted in dramatically dimin-
ished margins for all service station operators. Al-
though margins have stabilized again since October
2000, the improvement came too late to fully com-
pensate for our petroleum retailer’s losses earlier in
the year.
By contrast, the convenience store business per-
formed extremely well, once again achieving large
gains in sales, market share, and earnings. Aral’s new
business activities—e-commerce, for example—also
had promising launches.
VEBA Wärmeservice became an Aral business unit in
November 2000 and now operates as Aral Wärme
Service. A sustained drop in demand in the heating oil
sector as well as insufficient capacity utilization again
resulted in unsatisfactory earnings. The heating oil
business has therefore been targeted for immediate
and far-reaching restructuring measures.
VORP reports very solid first-year earnings. VORP com-
menced operations in October 2000. Its activities con-
sist of supplying crude oil and additional materials to
refineries as well as refining and selling petrochemical
products. Its petroleum products are marketed by Aral.
In contrast to the previous year, 2000 was charac-
terized by extremely high margins. Earnings in petro-
leum refining markedly exceeded our expectations. All
refineries were earnings contributors. Positive factors
included successful cost-cutting measures and a high
rate of plant availability. VORP refined a total of
14.8 million tons of crude oil. Due to ERE’s first-time
inclusion, this represents an annual increase of 4 mil-
lion tons or 34 percent.
Petrochemical demand and margins also surged
ahead compared with the previous year. The integration
of ERE as well as high availability at all petrochemical
facilities contributed to a year-on-year increase in
total sales volume of 6 percent for a record 5.1 million
tons. This figure topped an already excellent result in
1999.
Investments distinctly higher. Investments in the
2000 financial year increased by 32 percent to around
1.7 billion (1999: 1.3 billion). This mainly reflected
the acquisition of Mobil’s Aral stake and the first-time
full consolidation of Aral.
Outlook. We expect market conditions to return to
normal in 2001. We anticipate that crude oil prices, the
dollar exchange rate, and petroleum and petrochemi-
cal refining margins will all be below last year’s levels.
But we are also projecting appreciably improved
service station margins.
Internal operating profit at VOG and VORP will in
part be markedly lower than last year’s figures. We
expect Aral to report considerably higher earnings on
the back of improved margins.
Overall, we anticipate that Oil’s 2001 internal operat-
ing profit will be on par with 2000’s solid results. VEBA
Oel’s new corporate structure and sharply reduced
costs put it in a good position to meet the challenges
of the coming years.

062
Chemicals
• Sales and internal operating profit up year-on-year• Merger of Degussa-Hüls and SKW Trostberg successfully completed• Laporte acquisition will extend leading global position in
fine chemicals • Internal operating profit for 2001 expected to match prior year’s
high level
Chemicals industry in 2000 on growth track. Thanks to
robust business abroad and an economic upswing
at home, Germany’s chemicals industry can look back
on a largely successful 2000. Chemicals production in
Germany grew by around 3 percent from the previous
year. Sales in the country’s chemicals sector exceeded
the prior year’s level by about 12 percent and topped
100 billion for the first time. This hefty gain reflects
not only higher unit sales but also higher producer
prices, which rose by around 5 percent owing to price
hikes for crude oil. Chemicals exports were the driving
force behind the industry’s growth and advanced
13 percent year-on-year. This figure contains a signifi-
cant currency component due to the weak euro.
Earnings in the chemicals industry suffered in some
sectors owing to dramatic increases in crude oil
prices, as not all manufacturers were able to pass
along higher prices to their customers.
Sales and internal operating profit top prior year’s
levels. Our Chemicals Division had a very successful
2000. Aided by a strong global economy, we achieved
significant growth in sales and internal operating
profit in the first nine months. The pace slowed some-
what in the fourth quarter. Full-year 2000 sales advanced
23 percent year-on-year to 20.3 billion, and internal
operating profit was up 58 percent to 672 million.
Excluding precious-metals trading, sales climbed
21 percent to 16.9 billion. Adjusted for acquisitions
and disposals in the group of consolidated companies,
the increase amounted to 26 percent. Higher sales
volumes and favorable currency effects accounted for
the lion’s share of sales growth. The substantial rise
in raw materials costs was partially passed on to cus-
tomers and largely determined price levels. Actual
sales price increases were rare.
Merger of Degussa-Hüls and SKW Trostberg successfully
completed. Degussa-Hüls and SKW Trostberg were
managed as independent companies in 2000. The tie-up
of the two enterprises to form the new Degussa
became official when it was entered into the Commer-
cial Register on February 9, 2001. E.ON’s 64.55 percent
stake makes it Degussa’s majority shareholder.
Düsseldorf-based Degussa is the world’s largest
specialty chemicals group. Its core business is orga-
nized into six market-oriented divisions:
• Health and Nutrition
• Construction Chemicals
• Fine and Industrial Chemicals
• Performance Chemicals
• Coatings and Advanced Fillers
• Specialty Polymers
+/– %
+23
+58
–51
–13
–1
in millions (pro forma)
Sales
Internal operating profit
Cash flow from operations
Investments
Employees at year-end
2000
20,267
672
501
1,868
62,110
1999
16,487
426
1,013
2,154
62,464
Degussa AG, Düsseldorf

063
Focus on core businesses via active portfolio manage-
ment. The new Degussa will concentrate on the highly
profitable specialty chemicals sector and plans to
divest all non-core activities. These mainly include ASTA
Medica, Degussa Bank, Degussa Dental, dmc2, Phenol-
chemie, and SKW Piesteritz as well as the Gelatins,
Metallurgical Chemicals, and Salt Products business
units. The companies intended for disposal had 2000
sales of more than 6 billion. Divestitures are expect-
ed to take place over the next two years. There are
a number of possible disposal scenarios. These include
selling assets to companies that can better integrate
and develop them, forming joint ventures, or offering
shares in a stock flotation. Proceeds from divestitures
will be used to fuel growth in Degussa’s core specialty
chemicals business.
Degussa is rapidly implementing its divestiture
program. The disposal of dmc2 is the biggest project.
Degussa is simultaneously pursuing the possibility
of an IPO and the possibility of selling the business to
an investor. It has decided to break up ASTA Medica,
its pharmaceutical subsidiary. Degussa also plans
to sell Phenolchemie. The butylacryl unit and the
pentaerythrite business, with production facilities in
Bruchhausen, were divested in the year under review.
Degussa has begun its exit from the zeolithe business
and from production at Katalysatorenwerke Hüls.
In January 2001 Degussa-Hüls and SKW Trostberg
tendered a cash offer of £6.97 per share to the stock-
holders of Laporte, the British specialty chemicals
firm. Laporte’s management endorsed the offer. The
purchase price totals 1.8 billion after subtracting
liquid funds. The acquisition of Laporte represents an
important strategic step toward extending Degussa’s
leading global position in the attractive fine chemicals
sector. By early March Degussa had already secured
94 percent of Laporte’s capital stock.
Leveraging synergy and restructuring potential to
boost sustained profitability. Merging Degussa-Hüls
and SKW Trostberg enables our Chemicals Division
to leverage substantial synergy and restructuring
potential. This is expected to increase sustained prof-
itability. Beginning in 2003 Degussa expects annual
earnings improvements to total 300 million. Around
50 million will come from eliminating overlapping
businesses, in particular at Fine Chemicals and Care
Specialties, as well as from combining administrative
units. Degussa plans to achieve additional earnings
improvements worth about 250 million annually by
optimizing and restructuring its key business processes.
The best@chem project launched in July 2000 plays a
crucial role in process optimization.
Health and Nutrition
BioActives
Flavors andFruit Systems
TexturantSystems
Feed Additives
Construction Chemicals
Germany
Europe
The Americas
Asia/Pacific
Fine and Industrial Chemicals
Fine Chemicals
Bleaching andWater Chemicals
C4 Chemicals
PerformanceChemicals
Oligomere/Silicones
CareSpecialties
Superabsorbents
Coatings andAdvanced Fillers
Coatings andColorants
Silica, Silanes, andCatalysts
Advanced Fillersand Pigments
Specialty Polymers
High PerformancePolymers
Methacrylates
Specialty Acrylates
Plexiglas
Degussa Group

064
Core activities put in successful performance. With
sales of 1.1 billion—up 34 percent year-on-year—
Health and Nutrition lifted earnings markedly. One of
the main factors was the superb performance of Feed
Additives, which benefited from lively demand and the
strong dollar. Texturant Systems and Flavors and Fruit
Systems also significantly improved their contribution
to earnings. BioActives likewise reported higher earn-
ings due to the inclusion of a newly acquired U.S.-based
dietary supplement company.
Construction Chemicals grew sales 9 percent to
1.7 billion. Earnings were up distinctly. Businesses
based in the U.S., where the strong economy con-
tributed to the sharp increase, performed particularly
well. The Asia/Pacific and European divisions also
posted distinctly improved earnings. By contrast, earn-
ings in Germany were off compared with the prior
year owing to a stagnant construction sector.
Sales at Fine and Industrial Chemicals rose 27 per-
cent to 1.8 billion. Earnings were also higher. Bleach-
ing and Water Chemicals reported very fine results
that reflected extremely brisk demand, particularly in
North America. Fine Chemicals’ earnings contribution
came in behind the year-earlier figure due to planned
production plant shut-downs. At C4 Chemicals, the
plasticizers and plasticizer alcohols business contin-
ued to develop successfully. Earnings improved appre-
ciably.
Performance Chemicals managed a significant
increase in sales of 36 percent to 1.4 billion. Earnings
fell short of the prior year’s strong showing. The Super-
absorbents business unit was responsible for the
decline. This unit posted earnings that were consider-
ably lower than the good results recorded in the previ-
ous year due to the substantial hike in raw materials
costs and higher fixed asset charges for the expansion
of the acrylic acid production facilities in Marl. By con-
trast, heavy demand helped Care Specialties and
Oligomers/Silicones to report greatly improved earn-
ings.
The Coatings and Advanced Fillers division started
from a favorable position and again was able to signif-
icantly improve its performance. Greater demand
worldwide served to lift sales 16 percent to 2.5 bil-
lion. Earnings were considerably higher. The Coatings
and Colorants business unit was particularly success-
ful. It benefited from brisk demand and the strong
dollar. Silica, Silanes, and Catalysts also contributed
improved earnings due to strong global demand for
aerosil. By contrast, the Advanced Fillers and Pigments
business unit—where industrial carbon black in partic-
ular felt the impact of considerably higher carbon
black oil costs—was unable to match its 1999 earnings
performance.
Chemicals
+/– %
+20
+34
+9
+27
+36
+16
+10
+17
+24
+21
in millions (pro forma)
Core activities
Health and Nutrition
Construction Chemicals
Fine and Industrial Chemicals
Performance Chemicals
Coatings and Advanced Fillers
Specialty Polymers
Other
Non-core activities
Total
2000
10,442
1,078
1,680
1,767
1,362
2,516
1,297
742
6,473
16,915
1999
8,709
807
1,537
1,389
1,001
2,136
1,183
629
5,227
13,936
Sales (excluding precious-metals trading)

065
Specialty Polymers expanded sales 10 percent to
1.3 billion. Earnings rose sharply. All units experienced
brisk demand, which contributed to the division’s
strong showing. At High Performance Polymers, C12
derivatives reported a particularly strong increase in
sales volume. The Specialty Acrylates and Methacry-
lates business units also posted good unit sales and
earnings. The Plexiglas business likewise reported
improved earnings despite markedly higher raw
material costs.
Non-core activities have strong overall performance.
Non-core activities generated total sales of 6.5 bil-
lion in 2000—a 24 percent increase from the previous
year. Earnings improved sharply. The dmc2 business unit
had an especially successful year. It achieved distinctly
higher earnings on the back of greatly increased de-
mand for its products. SKW Piesteritz, Phenolchemie,
Oxxynova (the DMT business), Metallurgical Chemicals,
and Gelatins all contributed higher earnings. ASTA
Medica’s far-reaching restructuring program showed
the first signs of success.
Degussa expands sales in all regions. Degussa grew
revenues in all sales regions. The company’s sales
organization is active in over 100 countries. Degussa
operates upward of 300 production facilities in more
than 50 countries. Over 70 percent of sales (excluding
precious-metals trading) are generated outside
Germany.
Europe remains our Chemicals Division’s biggest
market. Here Degussa lifted sales 13 percent to
9.8 billion. Both in Germany and across Europe, the
operations of most divisions ran well. Sales generated
by custom-manufacturing operations at Fine Chemicals
showed solid growth. dmc2 also had a very successful
year due to lively demand, especially for catalytic
converters.
North American sales rose 25 percent to 3.9 billion.
The healthy U.S. economy along with the integration
of Harris Specialty Chemicals Group helped Construc-
tion Chemicals to grow sales distinctly. Buoyed by
brisk demand from the U.S. paper and pulp industry,
Bleaching and Water Chemicals also had an extremely
strong year.
Sales in Latin America advanced 51 percent to
0.8 billion. In November 2000 the foundation was laid
for an industrial carbon black facility in Brazil with a
capacity of 60,000 tons per year.
Degussa also generated higher sales in Asia. At
2.0 billion, sales were up 45 percent on the back
of a very solid overall performance and the first-time
inclusion of Japan’s Nippon Aerosil. In China’s fast-
growing market, Degussa and a Chinese partner
began to make water-treatment and paper-industry
products. Degussa continues to expand its footprint
in Asia via acquisitions and joint ventures.
In Africa, Australia, and Oceania, Degussa boosted
sales 64 percent year-on-year to 0.4 billion. The
marked increase reflects good development at Degussa
Catalyst (based in Port Elizabeth, South Africa) and the
first-time consolidation of Degussa Peroxide (head-
quartered in Morrinsville, New Zealand).

066
Chemicals
cent). Specialty Polymers invested 88 million (7 per-
cent). Others investments—which include capital
spending on non-core activities—came to 360 million
(29 percent); this figure includes the construction of a
phenol/acetone plant in Mobile, Alabama.
Degussa invested 636 million in financial assets.
440 million of this amount went toward the nearly
20 percent stake in Laporte that Degussa acquired on-
market in December 2000. Another 61 million was
invested to raise Degussa’s shareholding in Nippon
Aerosil, its Japan-based joint venture, from 50 percent
to 80 percent. 50 million went toward acquiring Traco
Labs, an American dietary supplement company head-
quartered in Champaign, Illinois.
Research and development designed to ensure market
and customer proximity. The goal of Degussa’s research
and development (R&D) program is to foster growth
via innovation. Innovations accelerate Chemicals’ earn-
ings growth, cement its competitive advantages, and
help focus the expansion of its market positions.
Degussa’s R&D expenditures totaled 542 million
in the year under review and amounted to 3.2 percent
of sales excluding precious-metals trading. Degussa
currently employs around 4,400 people at more than
50 R&D facilities worldwide.
In keeping with the different requirements of
Degussa’s markets and customers, R&D is organized
largely along decentralized lines. The divisions are
directly responsible for the majority of their ongoing
R&D projects. This ensures that the innovation process
is structured to meet the needs of Degussa’s markets
and customers.
19% Fine and Industrial Chemicals
13% ConstructionChemicals
13% PerformanceChemicals
Total: 953 million
13%
9%
9%
24%
Investments in fixed assets by core activity
Health and Nutrition
Coatings and Advanced Fillers
Specialty Polymers
Other
Investments strengthen core businesses. Investments
focused on strengthening and expanding our Chemicals
Division’s leading market positions.
In 2000 Degussa invested 1,232 million in property,
plant, and equipment (including intangible assets) com-
pared with 1,151 million in the previous year. Overall,
68 percent of fixed-asset investments went to production
facilities, 28 percent to general-purpose facilities, and 4 per-
cent to research and development facilities.
119 million—10 percent—of Chemicals’ capital spend-
ing went toward expanding the Health and Nutrition
division. Construction Chemicals invested 125 million
(10 percent) in its businesses worldwide. A further
15 percent or 185 million was invested in Fine and
Industrial Chemicals. Performance Chemicals com-
pleted a major investment project in acrylic acids in
Marl, Germany, lifting its investments to 128 million
(10 percent). Coatings and Colorants also completed
four larger projects, including the construction of an
aerosil facility in Rheinfelden, Germany. These increased
its capital expenditures for 2000 to 227 million (19 per-

067
The divisions are supported by Degussa’s Innovation
and Technology Management Department. This depart-
ment coordinates all R&D activities and aligns R&D
with Degussa’s strategy. The objective is to tap product
and market segments beyond Degussa’s current port-
folio, segments that have above-average growth and
earnings potential. CREAVIS, Degussa’s technology and
innovation subsidiary, supports the company’s R&D
projects.
All divisions initiated numerous new R&D projects
in the year under review.
Process innovation at the Flavors and Fruit Systems
unit enabled it to develop a new class of flavors. Food
and beverages can now be flavored with the taste of
Tequila.
Construction Chemicals markedly expanded its
new generation of concrete super-liquifiers. Compared
with traditional super-liquifiers, these products display
excellent processing qualities and a high degree of
concrete strength.
At the Fine Chemicals division, new biocatalytic
systems that are both more efficient and more environ-
mentally friendly were developed for manufacturing
pharmaceutical amino acids.
The Oligomers/Silicones unit successfully devel-
oped quick-hardening UV silicone release coatings for
labels and adhesive tape. Powerful emulsifiers devel-
oped by Degussa’s Care Specialties unit offer cus-
tomers in the cosmetic industry completely new ways
to make formulas. These include an organically
modified siloxane that produces a pleasant feeling
on the skin.
The Silica, Silanes, and Catalysts unit is developing
metal-oxide dispersions, especially for chemical-
mechanical polishing (CMP) for next-generation com-
puter chips.
The High Performance Polymers unit developed
highly diversified polyamides that facilitate the manu-
facture of more powerful adhesive agents for multi-
layered fuel line systems.
19% Fine and Industrial Chemicals
13% ConstructionChemicals
15% PerformanceChemicals
Total: 322 million
13%
4%
12%
24%
Health and Nutrition
Coatings and Advanced Fillers
Specialty Polymers
Other
Outlook. For 2001 we expect Chemicals’ strong
performance to continue. There is, however, a risk that
the economic climate will worsen, particularly in our
key North American market. Growth rates could
slacken somewhat in Europe, as well. Nevertheless,
we anticipate that Degussa’s superb market positions
in its core businesses will enable it to succeed even
in a tough business environment. The acquisition
of Laporte, the UK-based fine chemicals firm, is also
expected to have a positive impact. The acquisition
will, however, result in higher interest expenses and
goodwill amortization.
Because Degussa’s core businesses are character-
ized by above-average earnings, in 2001 we expect its
current portfolio to again report a higher internal
operating profit.
R&D expenditures by core activity

068
• Internal operating profit increases again• All divisions sustain growth pattern• Residential Investment successfully implements portfolio strategy• Internal operating profit expected to rise again in 2001
Growth pattern sustained in 2000. Viterra continued to
grow sales in 2000. All four divisions—Residential Invest-
ment, Residential Development, Residential Services,
and Commercial Real Estate—put in satisfactory per-
formances.
Viterra boosted sales 13 percent to 1,324 million.
The increase was fueled primarily by Residential
Development and Commercial Real Estate, each of
which posted double-digit growth rates. Internal oper-
ating profit climbed about 12 percent from 189 mil-
lion in 1999 to 212 million in the year under review.
Residential Investment repeated as Viterra’s top earn-
ings performer.
Generally favorable business development. Residential
Investment successfully continued its portfolio strategy.
The division sold 3,698 housing units in 2000 compared
with 2,935 units in the year before—a 26 percent
increase. It expanded sales by resolutely optimizing
and modernizing its housing stock. It substantially
improved internal operating profit by systematically
selling rental units and by divesting its shareholding
in a small residential property company.
Residential Development finished putting its Ger-
man branch structure into place. It successfully com-
pleted its first project in Poland. Despite an unfriendly
market environment, Residential Development raised
its sales appreciably. Financing effects from property
sales and weaker demand for single-family homes in
second half 2000 depressed internal operating profit.
Residential Services pursued the growth course
mapped out in 1999. The principal contributor was
Viterra Energy Services, which continued to expand its
activities internationally. Despite only moderately
higher sales, Residential Services’ internal operating
profit rose appreciably.
Commercial Real Estate has put its strategic focus
on office buildings and logistics facilities. Its sales
growth is chiefly attributable to the sale of a large
property in Berlin. Internal operating profit advanced
slightly against the year-earlier figure.
Investments up distinctly. At 484 million, Viterra’s
investments were up a marked 45 percent on the pre-
vious year. About 399 million was channeled into
property, plant, and equipment. 85 million was
invested in financial assets. Around 8 percent of capi-
tal spending was outside Germany. Expenditures
focused on Residential Investment (which attracted
112 million) and Commercial Real Estate (whose
investments totaled 292 million).
At Residential Investment, the lion’s share of capi-
tal spending in 2000 was aimed at maintaining and
improving the division’s housing stock. Expanding
Residential Services attracted 74 million, of which
about 74 percent went to Viterra Energy Services. The
Commercial Real Estate division significantly rein-
forced its position in the emerging market for logistics
facilities by acquiring eight logistics centers from
Germany’s postal service and nine other facilities
across the country. At 292 million, Commercial’s
investments for 2000 were almost nine times higher
than in 1999.
Outlook. Viterra’s strategic mission is to develop
a growth-oriented and integrated real-estate group.
Viterra actively manages its property portfolio, is
establishing and expanding its real-estate-related
services, and aims to occupy a leading position in the
development of residential and commercial real
estate.
Overall, we expect the positive pattern established
in our Real Estate Division to be sustained in 2001 and
anticipate that internal operating profit for 2001 will
exceed the prior year’s figure.
Real Estate
+/– %
+13
+12
–88
+45
+14
in millions
Sales
Internal operating profit
Cash flow from operations
Investments
Employees at year-end
2000
1,324
212
5
484
5,567
1999
1,167
189
43
333
4,901
Viterra AG, Essen

069
Telecommunications
Operating loss curtailed year-on-year. ONE, our Tele-
communications Division’s Austrian telecoms interest,
is fully consolidated under U.S. GAAP in 2000. Switzer-
land’s Orange Communications and France’s Bouygues
Telecom are accounted for at equity. VIAG Interkom,
which was consolidated on a pro-rata basis in VIAG’s
financial statements under IAS in 1999, is also ac-
counted for at equity in accordance with U.S. GAAP.
The disposal of shareholdings with high startup
losses—Otelo’s fixed-line business in 1999 and E-Plus
in 2000—is the main reason for the improvement in
Telecommunications’ internal operating profit. The
appreciably higher costs to acquire customers due to
the cellular phone sector’s lively growth had a damp-
ening effect on earnings.
ONE: a successful player on Austria’s mobile phone
market. ONE achieved a significant breakthrough in
2000. The subscriber base swelled from 500,000 at the
start of the year to more than 1.3 million at year-end.
The majority of ONE’s customers—1.15 million—are
cellular phone subscribers. A further 120,000 use the
f-ONE fixed-line network, and 70,000 customers use
i-ONE, the company’s internet portal. Just two years
after its market entry, ONE can already claim 20 per-
cent of Austria’s cellular phone market. The customer
structure is especially gratifying: more than half of
ONE’s customers are post-paid subscribers.
In Austria’s UMTS auction, ONE and five other
bidders each obtained two frequencies for a price of
about 121 million—relatively low for Europe.
ONE continued to expand its network in 2000,
achieving 97 percent population coverage.
Sale of shareholdings realizes substantial net book
gains. In February 2000 we sold our interest in E-Plus
to Bell South, the American telecoms company, for
about 3.8 billion. In November 2000 we also disposed
of our 42.5 percent stake in Orange Communications,
the Swiss mobile phone enterprise, to France Télécom
in a combined cash and equity deal. We received pro-
ceeds of more than 1.8 billion (including shareholder
loans of around 480 million) for our Orange interest.
Vigorous market growth in Germany and France.
VIAG Interkom, our German telecoms shareholding,
benefited from the sustained exuberant growth in the
mobile phone sector. In the summer of 2000 VIAG
Interkom acquired one of Germany’s six 3G licenses
for about 8.4 billion.
In August 2000 we concluded an option agreement
with British Telecom (BT). Under the terms of the
agreement, we could dispose of our 45 percent inter-
est in VIAG Interkom to BT in January 2001 for an exer-
cise price of around 7.3 billion. The agreement also
granted BT the option to acquire this shareholding
from us in the period May through July 2001. We exer-
cised the option in January 2001.
Bouygues Telecom, our French cellular phone
interest, continued to expand its share of France’s
burgeoning new customer market. Bouygues Telecom
had some 5.2 million mobile phone subscribers at
year-end.
Outlook. The key theme at ONE during 2001 will be 3G
cellular phone services. It intends to launch GPRS data
services in the first quarter. In addition, ONE is already
preparing to establish UMTS and is planning UMTS
services.
We expect Bouygues Telecom to continue profiting
from France’s vigorous market growth. Bouygues Tele-
com is not participating in France’s beauty contest for
awarding UMTS licenses owing to the contest’s un-
acceptable conditions. Only two providers are still in
the running for one of the four UMTS licenses. The
beauty contest is still in progress.
Overall, in 2001 we expect our Telecommunications
Division to report further startup losses, though sub-
tantially below the previous year’s level.
• Operating loss curtailed• ONE highly successful in Austria• Substantial net book gains realized through disposals• Sharply lower startup losses anticipated in 2001
+/- %
+51
+31
+29
+327
+46
in millions (pro forma)
Sales
Internal operating profit
Cash flow from operations
Investments
Employees at year-end
1999
253
–789
–1,078
1,202
962
2000
383
–546
–761
5,135
1,409
E.ON Telecom GmbH, DüsseldorfVIAG Telecom GmbH, Munich

070
Other Activities
Stinnes posts markedly higher internal operating
profit and bolsters chemical logistics business. Buoyed
by a favorable economy, Stinnes once again markedly
increased its earnings power in 2000. The company’s
ongoing focus on logistics activities was also a factor
in its improved performance.
At 12,026 million, Stinnes’s sales were up 2 per-
cent year-on-year. The uptick is due primarily to Chemi-
cals’ fine performance and to Transportation’s air and
sea freight operations.
The rise in internal operating profit—up 7 percent
to 203 million—distinctly outpaced sales growth. The
European overland transport and air and sea freight
units were particularly strong earnings performers.
As part of its concentration on logistics services, in
2000 Stinnes sold assets—including its Building Mate-
rials unit—with sales of 2.3 billion. Stinnes used the
proceeds mainly to fuel growth in its chemical logis-
tics operations. Selected acquisitions expanded the
company’s European footprint in chemicals distribu-
tion. Acquiring Holland Chemical International, which
operates primarily in North and South America as well
as in Scandinavia and Eastern Europe, makes Stinnes
a top global player in chemicals distribution. In
the year under review Stinnes acquired assets with
1.7 billion in sales. In the same span the company
generated just under 60 percent of its sales outside
Germany.
VEBA Electronics sold. VEBA Electronics posted sales
of 3,926 million. Internal operating profit advanced
84 percent to 158 million. These figures do not in-
clude the company’s second-half 2000 results because
we sold VEBA Electronics’ electronic components and
systems distribution businesses to a consortium of
European and American buyers. The activities were
transferred to the new owners with economic effect as
of July 1, 2000. The entire transaction was completed
on October 31, 2000.
Klöckner & Co increases sales volume, sales revenue,
and internal operating profit; continues to steadily
optimize business structure. In the last six months of
2000 Klöckner came close to repeating its dynamic
first-half performance. Sales volume climbed 4.5 per-
cent in full-year 2000 to 10 million tons. This figure for
the last time includes Klöckner’s trading business.
Materials warehousing and trading grew sales volume
9.6 percent year-on-year to 7.1 million tons.
The annual increase in sales revenue surpassed
the rise in sales volume. Sales revenue advanced
21 percent to 5,355 million mainly owing to price
increases and acquisitions. Internal operating profit
climbed from 68 million in 1999 to 100 million
in 2000.
Klöckner continued to steadily optimize its busi-
ness structure in the year under review. In December
2000 the company divested its global trading opera-
tions with sales of 815 million. The disposal of its
large-volume chain-of-delivery business, which was
capital-intensive and offered relatively low margins,
represents a further step toward Klöckner’s focus on
materials warehousing and trading, related services,
and system solutions.
Outlook. Overall, we expect to continue to expand our
established market positions in Distribution/Logistics.
We anticipate that the positive earnings trend at
Stinnes will carry over into 2001 despite the transition
to slower economic growth worldwide. Stinnes
expects particularly substantial earnings contributions
from its Transportation and Chemicals divisions.
We anticipate that in 2001 Klöckner will post lower,
but nevertheless satisfactory, earnings.
+/– %
+/–0
+34
+12
–9
–12
in millions (pro forma)
Sales
Internal operating profit
Cash flow from operations
Investments
Employees at year-end
2000
21,308
461
235
736
53,439
1999
21,397
344
209
806
60,567
Distribution/Logistics
Stinnes AG, Mülheim an der RuhrVEBA Electronics, Llc, Santa Clara, CA (USA)Klöckner & Co AG, Duisburg

071
Silicon Wafers
MEMC curtails operating loss for second year running.
MEMC Electronic Materials is one of the world’s lead-
ing manufacturers of silicon wafers for the semicon-
ductor industry. In 2000 the company reduced its oper-
ating loss by 69 percent to 68 million. The improve-
ment is attributable to increased demand in the semi-
conductor industry, slightly higher prices, and an
improved cost position reflecting MEMC’s far-reaching
restructuring program.
Demand matches supply on 200mm wafer market.
The silicon wafer market has been overbuilt in recent
years. In 2000 demand began to match supply in the
200mm wafer segment. As a result, MEMC was able to
raise its prices somewhat.
Outlook. Owing to the worsening situation on the
silicon wafers market, from today’s perspective we
anticipate that in 2001 MEMC will post a loss on the
level of the prior-year figure.
+/– %
+19
–18
–4
+109
–22
in millions (pro forma)
Sales
Internal operating profit
Cash flow from operations
Investments
Employees at year-end
2000
3,480
227
326
320
13,990
1999
2,926
275
339
153
17,971
+/– %
+45
+69
–
+12
+18
in millions
Sales
Internal operating profit
Cash flow from operations
Investments
Employees at year-end
2000
944
–68
56
67
6,615
1999
651
–219
–99
60
5,600
Aluminum
Increased procurement costs burden internal oper-
ating profit. Higher procurement costs negatively
impacted Aluminum’s internal operating profit. At
3,480 million, sales were up a total of 19 percent
owing to improvements at all segments. But hefty
price increases for raw materials and inputs along
with price guarantees for primary aluminum sales
reduced VAW’s internal operating profit 18 percent to
227 million.
Development largely satisfactory across all segments.
The Primary Materials, Rolled Products, and Flexible
Packaging segments all generated higher sales. The
principal drivers were higher aluminum prices, the
strong dollar, and, in some cases, higher sales vol-
umes. Price hikes for metals and raw materials were
largely responsible for the lower internal operating
profit at Primary Materials, Rolled Products, and Flexi-
ble Packaging. Automotive Products posted a higher
internal operating profit.
Outlook. Despite the weaker economy, we expect
Aluminum’s internal operating profit to come in
markedly higher in 2001 due to the restructuring
measures that have already been initiated at many of
VAW’s facilities.
VAW aluminium, Bonn
MEMC Electronic Materials, Inc., St. Peters, MO (USA)

Consolidated Financial Statements
001 002 003 004 005 006 007 008 009 010 011 012
025 026 027 028 029 030 031 032 033 034 035 036
049 050 051 052 053 054 055 056 057 058 059 060
073 074 075 076 077 078 079 080 081 082 083 084
097 098 099 100 101 102 103 104 105 106 107 108
121 122 123 124 125 126 127 128 129 130 131 132

013 014 015 016 017 018 019 020 021 022 023 024
037 038 039 040 041 042 043 044 045 046 047 048
061 062 063 064 065 066 067 068 069 070 071 072
085 086 087 088 089 090 091 092 093 094 095 096
109 110 111 112 113 114 115 116 117 118 119 120
133 134 135 136 137 138 139 140 141 142 143 144
• E.ON Consolidated Financial Statements in full compliance with U.S. GAAP• Group pro-forma internal operating profit up 0.5 percent• Pro-forma pretax income increases 35 percent• Pro-forma consolidated net income up 30 percent• Pro-forma earnings per share increase 30 percent to 5.07
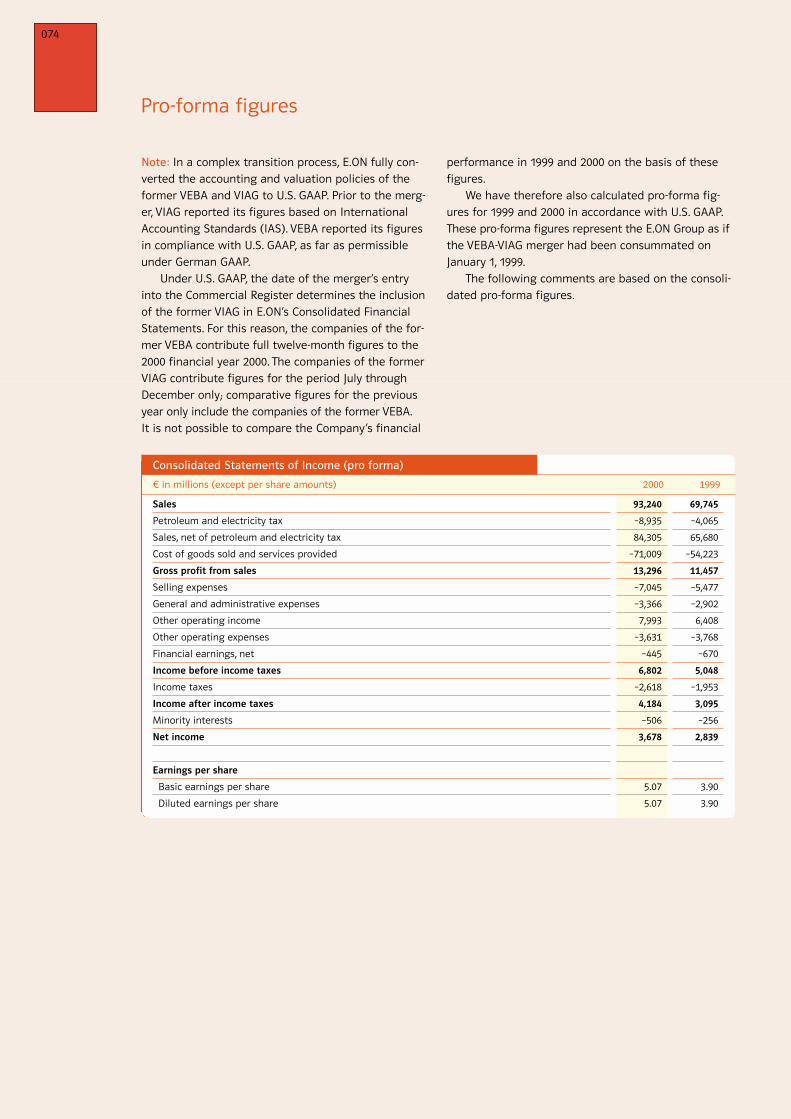
074
Pro-forma figures
Note: In a complex transition process, E.ON fully con-
verted the accounting and valuation policies of the
former VEBA and VIAG to U.S. GAAP. Prior to the merg-
er, VIAG reported its figures based on International
Accounting Standards (IAS). VEBA reported its figures
in compliance with U.S. GAAP, as far as permissible
under German GAAP.
Under U.S. GAAP, the date of the merger’s entry
into the Commercial Register determines the inclusion
of the former VIAG in E.ON’s Consolidated Financial
Statements. For this reason, the companies of the for-
mer VEBA contribute full twelve-month figures to the
2000 financial year 2000. The companies of the former
VIAG contribute figures for the period July through
December only; comparative figures for the previous
year only include the companies of the former VEBA.
It is not possible to compare the Company’s financial
performance in 1999 and 2000 on the basis of these
figures.
We have therefore also calculated pro-forma fig-
ures for 1999 and 2000 in accordance with U.S. GAAP.
These pro-forma figures represent the E.ON Group as if
the VEBA-VIAG merger had been consummated on
January 1, 1999.
The following comments are based on the consoli-
dated pro-forma figures.
2000
93,240
–8,935
84,305
–71,009
13,296
–7,045
–3,366
7,993
–3,631
–445
6,802
–2,618
4,184
–506
3,678
5.07
5.07
in millions (except per share amounts)
Sales
Petroleum and electricity tax
Sales, net of petroleum and electricity tax
Cost of goods sold and services provided
Gross profit from sales
Selling expenses
General and administrative expenses
Other operating income
Other operating expenses
Financial earnings, net
Income before income taxes
Income taxes
Income after income taxes
Minority interests
Net income
Earnings per share
Basic earnings per share
Diluted earnings per share
1999
69,745
–4,065
65,680
–54,223
11,457
–5,477
–2,902
6,408
–3,768
–670
5,048
–1,953
3,095
–256
2,839
3.90
3.90
Consolidated Statements of Income (pro forma)

075
2000
9,714
28,844
24,782
63,340
7,166
11,297
13,443
989
8,501
41,396
1,074
405
106,215
in millions
Assets
Intangible assets
Property, plant, and equipment
Financial assets
Fixed assets
Inventories
Accounts receivable
Other receivables and assets
Businesses held for sale
Liquid funds
Non-fixed assets
Deferred taxes
Prepaid expenses
Total assets (thereof short-term 2000: 40,623; 1999: 34,459)
1999
9,061
27,754
23,380
60,195
7,184
9,191
6,013
989
9,529
32,906
961
566
94,628
2000
1,985
11,402
14,705
866
–925
28,033
5,123
8,736
24,799
33,535
14,047
21,873
35,920
2,720
884
78,182
106,215
in millions
Liabilities and stockholders’ equity
Capital stock
Additional paid-in capital
Retained earnings
Accumulated other comprehensive income
Treasury stock
Stockholders’ equity
Minority interests
Provision for pensions
Other provisions
Accrued liabilities
Financial liabilities
Other liabilities
Liabilities
Deferred taxes
Deferred income
Total liabilities (thereof short-term 2000: 32,238; 1999: 21,969)
Total liabilities and stockholders’ equity
1999
1,985
11,402
12,360
546
–
26,293
4,888
8,451
25,628
34,079
11,929
13,978
25,907
2,975
486
68,335
94,628
2000
3,889
–5,687
2,244
446
8,501
in millions
Cash provided by (used for) operating activities
Cash used for investing activities
Cash used for financing activities
Net change in liquid funds
Liquid funds as of December 31
1999
4,866
–4,155
–517
194
9,529
E.ON Group Consolidated Balance Sheet (pro forma)
E.ON Group Consolidated Balance Sheet (pro forma)
Statement of Cash Flows (pro forma)

076
Pro-forma figures
in millions
External sales
Intersegment sales
Total sales
EBITDA
Depreciation/amortization and write-downs
EBIT
Interest income
Internal operating profit
thereof: earnings from companies accounted for at equity
Capital expenditures
Investments
Companies accounted for at equity
Other financial assets
Other fixed assets
Total assets
2000
13,301
49
13,350
3,597
1,959
1,638
87
1,725
121
3,766
458
2,319
989
47,647
1999
13,059
121
13,180
4,925
2,038
2,887
–420
2,466
375
2,923
553
1,267
1,103
46,021
2000
28,062
718
28,780
1,111
632
478
–168
310
38
1,723
–
1,111
612
9,178
1999
11,778
451
12,229
309
260
48
–15
34
–3
1,308
–
907
401
5,489
2000
20,139
128
20,267
2,249
1,263
986
–314
672
23
1,868
48
588
1,232
19,158
1999
16,409
78
16,487
1,730
1,062
668
–243
426
18
2,154
18
985
1,151
17,117
2000
1,300
24
1,324
419
134
285
–73
212
3
484
2
83
399
4,074
1999
1,145
22
1,167
396
134
262
–73
189
10
333
52
112
169
3,399
Electricity Oil Chemicals Real Estate
The Company’s reportable segments are presented in
line with the Company’s internal organizational and
reporting structure based on products and services.
The segments are managed separately because each
business develops, manufactures, and sells distinct
products and services. The reportable segments are
Electricity, Oil, Chemicals, Real Estate, Telecommunica-
tions, Distribution/Logistics, Aluminum, and Silicon
Wafers. The column “Other/Consolidation“ includes the
holding company, AV Packaging GmbH (Schmalbach-
Lubeca), which is accounted for under the equity
method, and effects from consolidation.
Internal operating profit is the most important
internal key figure at E.ON in terms of earnings and
serves as an indicator of a business’s long-term earn-
ings power. Internal operating profit is adjusted
income from operations (after foreign taxes related to
exploration and production). Pretax income is adjusted
primarily to exclude material non-operating income
and expenses which are unusual or infrequent. These
adjustments primarily include book gains and losses
from large divestments and restructuring expenses.
Reconciliation of internal operating profit to
income before income taxes is as follows:
Net book gains in the reporting period primarily com-
prise gains from the disposal of the shareholdings in
E-Plus (approximately 3.5 billion) and in Cablecom,
the Swiss cable-TV company (0.8 billion).
Restructuring and cost-management expenses
were incurred by the Chemicals Division in the amount
of approximately 200 million, by the Electricity Divi-
sion in the amount of approximately 160 million, and
by the Oil Division in the amount of approximately
120 million stemming from its realignment.
Other non-operating earnings in 2000 include
expenses related to the disposal of shareholdings
required by antitrust authorities (about 400 million),
the costs of the VEBA-VIAG merger and the mergers in
the Chemicals and Electricity Divisions (approximately
200 million) as well as tax-related interest expenses
(about 75 million).
Due to the high tax burden, pre-tax income in
VEBA Oel’s upstream sector is not of great signifi-
cance. Internal operating profit for the Oil Division is
therefore stated net of foreign exploration and pro-
duction income taxes; this procedure deviates from
the method applied to determine internal operating
profit in other segments. These taxes must be added
back when reconciling from internal operating profit
to pretax income.Pretax income
in millions
Group internal operating profit
Net book gains
Restructuring expenses
Other non-operating earnings
Foreign E&P taxes
Pretax income
2000
2,762
+ 4,755
– 555
– 712
+ 552
6,802
1999
2,748
+ 2,428
– 367
– 62
+ 301
5,048
Segment information by Division (pro forma)

077
2000
382
1
383
–447
108
–555
9
–546
–365
5,135
854
3,906
375
18,628
1999
250
3
253
–571
229
–800
11
–789
–603
1,202
771
101
330
9,318
2000
21,262
47
21,309
991
350
642
–181
461
9
736
7
399
330
8,727
1999
21,283
114
21,397
923
383
540
–196
343
10
806
1
455
350
10,322
2000
3,438
42
3,480
370
109
261
–34
227
19
514
1
319
194
2,915
1999
2,926
–
2,926
397
82
315
–40
275
12
153
–
3
150
2,497
2000
944
–
944
213
187
26
–94
–68
16
67
16
–12
63
2,050
1999
651
–
651
–
147
–147
–72
–219
–11
60
–
11
49
1,603
2000
4,412
–1,009
3,403
130
382
–252
22
–231
–189
668
19
435
214
–6,162
1999
2,244
–789
1,455
456
506
–50
73
23
–351
2,106
–
1,720
386
–1,138
2000
93,240
–
93,240
8,634
5,125
3,509
–747
2,762
–326
14,961
1,405
9,148
4,408
106,215
1999
69,745
–
69,745
8,564
4,842
3,722
–974
2,748
–543
11,045
1,395
5,561
4,089
94,628
Telecommunications Distribution/Logistics Aluminum Silicon Wafers Holding/Other E.ON AG total
Our 2000 Annual Report is our first to report our inter-
nal performance indicators—earnings before interest,
taxes, depreciation, and amortization (EBITDA) and
earnings before interest and taxes (EBIT)—by segment.
Placing these different earnings measures side-by-
side makes it possible to analyze the Group’s overall
business performance according to its operational,
investment, acquisition, and financial drivers.
The figures reported in our segment information
may deviate from those shown in the Company’s Con-
solidated Statement of Income because they are
adjusted for one-off and rare effects.
To serve internal management and control purpos-
es, interest income is adjusted using economic criteria.
In particular, the interest portion of additions to provi-
sions for pensions resulting from personnel expenses
is allocated to interest income. The interest portions of
the allocations of other long-term provisions are treat-
ed analogously to the degree that they are reported
on different lines of the Consolidated Income State-
ment.
Interest income (net) for 1999 consisted almost
exclusively of tax-related interest expenses stemming
from the German tax authority’s more stringent inter-
pretation regarding the tax treatment of nuclear
waste disposal.
In 2000 tax-related interest expenses are on the
decline and were more than offset by a one-off gain
from the sale of securities at our Energy Division.
The decline in the interest portion of additions to
long-term provisions is attributable to lower waste
management requirements at our Energy Division.
1This figure is calculated by adding in interest expenses and subtracting interest income.
2000
–54
– 38
– 655
–747
1999
–244
+ 172
– 902
–974
in millions
Interest income
Interest income (net) 1
Interest portion of long-term provisions
Interest income (net) charged against internal operating profit

078
We have audited the accompanying consolidated
balance sheets of E.ON AG, Düsseldorf, and subsidiaries
as of December 31, 2000 and 1999, and the related
consolidated statements of income, statements of
changes in equity and cash flows as well as notes for
the years then ended. These consolidated financial
statements prepared in accordance with United States
Generally Accepted Accounting Principles are the
responsibility of company’s Board of Managing Direc-
tors. Our responsibility is to express an opinion on
these consolidated financial statements based on our
audit.
We conducted our audit of the consolidated finan-
cial statements in accordance with German auditing
regulations for the audit of financial statements
promulgated by the Institut der Wirtschaftsprüfer in
Deutschland (IDW) as well as in accordance with
United States Generally Accepted Auditing Standards.
Those standards require that we plan and perform the
audit to obtain reasonable assurance about whether
the consolidated financial statements are free of
material misstatement. The audit includes examining,
on a test basis, evidence supporting the amounts
and disclosures in the financial statements. The audit
also includes assessing the accounting principles used
and significant estimates made by the Board of Man-
aging Directors, as well as evaluating the overall
presentation of the consolidated financial statements.
We believe that our audit provides a reasonable basis
for our opinion.
In our opinion, based on our audit the consolidated
financial statements referred to above present fairly,
in all material respect, the net assets and financial
position of the group as of December 31, 2000 and
1999, and of its results of operations and its cash flows
for the years then ended in conformity with United
States Generally Accepted Accounting Principles.
Our audit, which according to German auditing
regulations also extends to the group management
report prepared by the Board of Managing Directors
which has been combined with the management
report of E.ON AG as a legal entity for the business
year from January 1 to December 31, 2000, has not led
to any reservations. In our opinion, on the whole the
combined management report provides a suitable
understanding of the Group’s position and suitably
presents the risks of future development. In addition,
we confirm that the consolidated financial statements
and the combined management report for the busi-
ness year from January 1 to December 31, 2000, satisfy
the conditions required for the Company’s exemption
from its duty to prepare consolidated financial state-
ments and the group management report in accor-
dance with German accounting law.
Düsseldorf, March 13, 2001
PwC Deutsche Revision
Aktiengesellschaft
Wirtschaftsprüfungsgesellschaft
Independent Auditor’s Report
Brebeck Wiegand
Wirtschaftsprüfer Wirtschaftsprüfer
(German Public Auditor) (German Public Auditor)

079
2000
82,983
–8,935
74,048
–62,869
11,179
–6,096
–2,777
7,657
–3,353
–59
6,551
–2,512
4,039
–469
3,570
5.75
5.75
in millions, except for per share amounts
Sales
Petroleum and electricity tax
Sales, net of petroleum and electricity tax
Cost of goods sold and services provided
Gross profit from sales
Selling expenses
General and administrative expenses
Other operating income
Other operating expenses
Financial earnings, net
Income before income taxes
Income taxes
Income after income taxes
Minority interests
Net income
Earnings per share
Basic earnings per share
Diluted earnings per share
1999
50,515
–3,943
46,572
–39,231
7,341
–3,838
–1,693
5,444
–3,040
186
4,400
–1,277
3,123
–132
2,991
5.95
5.95
Note
(6)
(7)
(8)
(9)
(10)
(11)
(12)
E.ON AG and Subsidiaries Consolidated Statements of Income

080
Notes
Dec. 31,2000
9,714
28,844
24,782
63,340
7,166
11,297
13,443
989
8,501
41,396
1,074
405
106,215
in millions
Assets
Intangible assets
Property, plant and equipment
Financial assets
Fixed assets
Inventories
Receivables, trade
Other receivables and assets
Businesses held for sale
Liquid funds
Non-fixed assets
Deferred taxes
Prepaid expenses
Total assets (thereof short-term 2000: 40,623; 1999: 18,893)
Note
(14)
(15)
(16)
(17)
(18)
(18)
(4)
(19)
(11)
(20)
Dec. 31,1999
4,740
18,790
14,925
38,455
4,487
6,332
4,072
–
1,844
16,735
927
102
56,219
Dec. 31,2000
1,985
11,402
14,705
866
–925
28,033
5,123
8,736
24,799
33,535
14,047
21,873
35,920
2,720
884
78,182
106,215
in millions
Liabilities and stockholders’ equity
Capital stock
Additional paid-in capital
Retained earnings
Accumulated other comprehensive income
Treasury stock
Stockholders’ equity
Minority interests
Provisions for pensions
Other
Accrued liabilities
Financial liabilities
Other liabilities
Liabilities
Deferred taxes
Deferred income
Total liabilities (thereof short-term 2000: 32,238; 1999: 14,231)
Total liabilities and stockholders’ equity
Note
(21)
(22)
(23)
(24)
(25)
(26)
(27)
(28)
(29)
(29)
(11)
Dec. 31,1999
1,307
2,197
11,763
546
–
15,813
3,895
5,678
14,002
19,680
5,227
9,446
14,673
1,756
402
40,406
56,219
E.ON AG and Subsidiaries Consolidated Balance Sheets
E.ON AG and Subsidiaries Consolidated Balance Sheets

081
2000
3,570
469
4,905
1,438
–4,562
–64
–360
293
205
–1,207
–1,808
–723
570
747
3,473
5,883
1,707
1,129
–4,541
–5,175
–3,759
–912
1,320
–4,348
–925
–628
–74
10,261
–6,691
1,943
1,068
18
531
1,617
6,836
48
8,501
in millions
Net income
Income applicable to minority interests
Adjustments to reconcile net income to net cash provided by (used for) operating activities:
Depreciation and amortization
Other non-cash items
Gains from disposition of
Equity interests
Other financial assets
Intangible and fixed assets
Changes in deferred taxes
Changes in provisions
Changes in operating assets and liabilities:
Inventories
Trade receivables
Other assets
Accounts payable, trade
Other liabilities
Cash provided by (used for) operating activities
Proceeds from disposition of
Equity interests
Other financial assets
Intangible and fixed assets
Purchase of
Equity investments
Other financial assets
Intangible and fixed assets
Changes in securities (other than trading) (> 3 months)
Changes in other liquid funds (> 3 months)
Cash provided by (used for) investing activities
Payments for treasury stock
Payment of cash dividends to
Shareholders of E.ON AG
Minority stockholders
Proceeds from financial liabilities
Repayments of financial liabilities
Cash provided by (used for) financing activities
Net increase (decrease) in cash and cash equivalents maturing (< 3 months)
Effect of foreign exchange rates on cash and cash equivalents (< 3 months)
Cash and cash equivalents at the beginning of period (< 3 months)
Liquid funds at end of period (< 3 months)
Securities at the end of period (other than trading; > 3 months)
Other liquid funds at the end of period (> 3 months)
Liquid funds as shown on the balance sheet
1999
2,991
132
3,165
–445
–2,289
–7
–307
–1,494
1,797
–257
–1,970
886
976
77
3,255
5,142
486
679
–3,517
–976
–2,524
–250
–752
–1,712
–
–540
–106
1,141
–1,878
–1,383
160
15
356
531
265
1,048
1,844
E.ON AG and Subsidiaries Consolidated Statements of Cash Flow

082
Notes
Retainedearnings
9,143
–540
2,991
169
11,763
–628
3,570
14,705
in millions
January 1, 1999
Capital increase due to convertingcapital stock from DM to
Dividends paid
Net income
Other comprehensive income
Total comprehensive income
Other changes
December 31, 1999
Shares issued
Shares reacquired
Dividends paid
Net income
Other comprehensive income
Total comprehensive income
December 31, 2000
Capitalstock
1,285
22
1,307
678
1,985
Additionalpaid-incapital
2,219
–22
2,197
9,205
11,402
–162
358
196
255
451
Availablefor sale
securities
1,417
–1,020
397
93
490
Minimumpensionliability
–47
–47
–28
–75
Treasurystock
–
–
–925
–925
Total
13,855
–540
2,991
–662
2,329
169
15,813
9,883
–925
–628
3,570
320
3,890
28,033
Cumulativetranslationadjustment
Accumulated other comprehensiveincome
E.ON AG and Subsidiaries Consolidated Statements of Changes in Stockholders’ Equity

(1) Organization and Basis of Presentation
The Consolidated Financial Statements of E.ON AG
(”E.ON”, the ”Corporation”, or the “Company”) have
been prepared for the first time in accordance with
accounting principles generally accepted in the United
States of America (“U.S. GAAP”). E.ON, which until
June 16, 2000, reported under the name of VEBA
Aktiengesellschaft (“VEBA”), previously prepared its
Consolidated Financial Statements in accordance with
accounting principles generally accepted in Germany
(“German GAAP”) as prescribed by the German Com-
mercial Code (“Handelsgesetzbuch” or “HGB”) and the
German Stock Corporation Act (“Aktiengesetz”) and
applied U.S. GAAP as far as permissible under German
GAAP. VEBA also provided a reconciliation of differ-
ences between German GAAP and U.S. GAAP. To con-
form to the current year presentation, all amounts pre-
viously reported in accordance with German GAAP
have been restated to be in accordance with U.S.
GAAP. E.ON is using the relief outlined in § 292a of the
German Commercial Code, which exempts companies
from preparing consolidated financial statements in
accordance with German GAAP if the consolidated
financial statements are prepared in accordance with
internationally accepted accounting principles and
comply with the Fourth and Seventh Directive of the
European Community. For the interpretation of these
directives the Company relied on German Accounting
Standard No. 1 (DRS 1), “Exempting Consolidated
Financial Statements in accordance with § 292a of the
German Commercial Code.” A description of the signifi-
cant differences between U.S. GAAP and German GAAP
as well as a reconciliation from U.S. GAAP to German
GAAP of stockholders’ equity and net income for the
year ended December 31, 1999, has been provided in
Note 5.
On June 16, 2000, VEBA and VIAG Aktiengesellschaft
(“VIAG”) merged into E.ON. The merger is discussed
further in Note 4.
(2) Summary of Significant Accounting Policies
Principles of Consolidation. The Consolidated Financial
Statements include the accounts of E.ON AG and all
material majority-owned subsidiaries (affiliated com-
panies) in which E.ON AG directly or indirectly exercises
control through a majority of the stockholders’ voting
rights. Majority-owned companies in which E.ON does
not exercise control are accounted for under the equity
method. Companies are also accounted for under the
equity method if E.ON holds between 20 and 50 per-
cent of shares and the ability to exercise significant
influence in the investees’ operations and corporate
governance is granted (associated companies). Other
share investments represent those in which E.ON
holds less than 20 percent ownership, which are
accounted for at cost. A list of all E.ON stockholdings
and other interests has been filed with the Commer-
cial Register of the Düsseldorf District Court
(HRB 22 315).
Intercompany results, expenses and income as
well as receivables and liabilities between the consoli-
dated companies are eliminated.
Business Combinations. For business combinations
accounted for under the purchase method of account-
ing, all assets acquired and liabilities assumed are
recorded at fair value. Any excess of the purchase
price over the fair value of net assets acquired is capi-
talized as goodwill. Situations in which the fair value
of net assets acquired is greater than the purchase
price paid generate negative goodwill only to the
extent that it remains after being allocated to reduce
proportionately the values otherwise assigned to non-
current assets (with the exception of long-term invest-
ments in marketable securities and net deferred tax
assets) to zero. Goodwill and negative goodwill are
amortized over the expected useful life on a straight-
line basis. Goodwill and negative goodwill of different
subsidiaries are not offset against each other. Amorti-
zation of goodwill and negative goodwill is reported
as other operating expenses or income, respectively.
Goodwill and negative goodwill arising from compa-
nies for which the equity method is applied are calcu-
lated on the same principles that are applicable to
fully consolidated companies.
Businesses held for sale consist of companies
identified as held for sale in conjunction with the
merger between VEBA and VIAG based on their esti-
mated net realized value as determined by expected
future cash flows. These businesses are expected to
be divested within one year. In accordance with
U.S. GAAP, results of operations for these entities are
excluded from consolidated results of E.ON Businesses
held for sale are discussed in detail in Note 4.
083
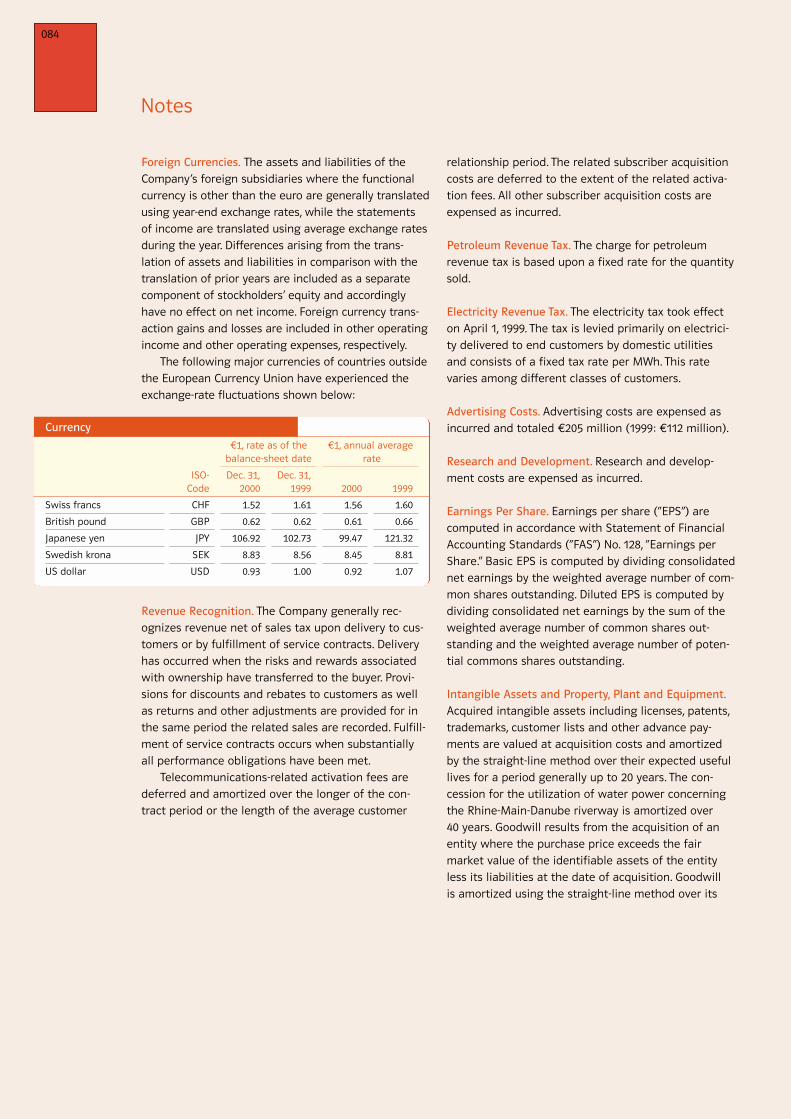
Foreign Currencies. The assets and liabilities of the
Company’s foreign subsidiaries where the functional
currency is other than the euro are generally translated
using year-end exchange rates, while the statements
of income are translated using average exchange rates
during the year. Differences arising from the trans-
lation of assets and liabilities in comparison with the
translation of prior years are included as a separate
component of stockholders’ equity and accordingly
have no effect on net income. Foreign currency trans-
action gains and losses are included in other operating
income and other operating expenses, respectively.
The following major currencies of countries outside
the European Currency Union have experienced the
exchange-rate fluctuations shown below:
Revenue Recognition. The Company generally rec-
ognizes revenue net of sales tax upon delivery to cus-
tomers or by fulfillment of service contracts. Delivery
has occurred when the risks and rewards associated
with ownership have transferred to the buyer. Provi-
sions for discounts and rebates to customers as well
as returns and other adjustments are provided for in
the same period the related sales are recorded. Fulfill-
ment of service contracts occurs when substantially
all performance obligations have been met.
Telecommunications-related activation fees are
deferred and amortized over the longer of the con-
tract period or the length of the average customer
relationship period. The related subscriber acquisition
costs are deferred to the extent of the related activa-
tion fees. All other subscriber acquisition costs are
expensed as incurred.
Petroleum Revenue Tax. The charge for petroleum
revenue tax is based upon a fixed rate for the quantity
sold.
Electricity Revenue Tax. The electricity tax took effect
on April 1, 1999. The tax is levied primarily on electrici-
ty delivered to end customers by domestic utilities
and consists of a fixed tax rate per MWh. This rate
varies among different classes of customers.
Advertising Costs. Advertising costs are expensed as
incurred and totaled 205 million (1999: 112 million).
Research and Development. Research and develop-
ment costs are expensed as incurred.
Earnings Per Share. Earnings per share (“EPS”) are
computed in accordance with Statement of Financial
Accounting Standards (“FAS”) No. 128, “Earnings per
Share.” Basic EPS is computed by dividing consolidated
net earnings by the weighted average number of com-
mon shares outstanding. Diluted EPS is computed by
dividing consolidated net earnings by the sum of the
weighted average number of common shares out-
standing and the weighted average number of poten-
tial commons shares outstanding.
Intangible Assets and Property, Plant and Equipment.
Acquired intangible assets including licenses, patents,
trademarks, customer lists and other advance pay-
ments are valued at acquisition costs and amortized
by the straight-line method over their expected useful
lives for a period generally up to 20 years. The con-
cession for the utilization of water power concerning
the Rhine-Main-Danube riverway is amortized over
40 years. Goodwill results from the acquisition of an
entity where the purchase price exceeds the fair
market value of the identifiable assets of the entity
less its liabilities at the date of acquisition. Goodwill
is amortized using the straight-line method over its
Notes
084
Swiss francs
British pound
Japanese yen
Swedish krona
US dollar
CHF
GBP
JPY
SEK
USD
1.52
0.62
106.92
8.83
0.93
1.61
0.62
102.73
8.56
1.00
1.56
0.61
99.47
8.45
0.92
1.60
0.66
121.32
8.81
1.07
ISO-Code
Dec. 31,2000
1, rate as of thebalance-sheet date
Dec. 31,1999 2000
1, annual averagerate
1999
Currency

085
Immovable assets are depreciated according to the
straight-line method, while movable assets, depending
on the use, are depreciated using either the declining-
balance method or straight-line method. When using
the declining-balance method a change from the
declining-balance method to the straight-line method
is made in the year in which the amount of straight-
line depreciation exceeds the sum determined by the
declining-balance method.
Intangible and other long-lived assets are
reviewed for impairment whenever events or changes
in circumstances indicate that the carrying amount
may not be recoverable. An impairment is recognized
when the sum of the future undiscounted cash flows
expected to be generated from the use of the asset is
insufficient to recover its related carrying value. The
carrying value of such asset is written down to fair
value, which is generally determined from estimated
discounted future net cash flows.
The Company’s oil and natural gas exploration and
production activities are accounted for under the
successful-efforts method. Under this method, costs of
expected useful life for a period generally between
8 and 20 years. Property, plant and equipment are
valued at acquisition or production costs and depre-
ciated over their expected useful lives.
productive wells and development of dry holes are ini-
tially capitalized as an intangible fixed asset. When
proved reserves of oil and natural gas are determined
and development is sanctioned, the relevant expendi-
ture is transferred to tangible production assets. Both
tangible and intangible assets as well as productive
acreage are capitalized and amortized on the unit of
production basis. All exploration expenditure deter-
mined as unsuccessful is charged against income.
Costs of that portion of undeveloped acreage likely to
be unproductive, based largely on historical experi-
ence, are amortized over the period of exploration.
Exploration license acquisition costs are amortized
over the estimated period of exploration. Other explor-
atory expenditures, including geophysical costs, other
dry hole costs and annual lease rentals, are expensed
as incurred.
Repair and maintenance costs are expensed as
incurred. Renewals and production costs that extend
the useful life of an asset are capitalized.
Interest has been capitalized on debt apportion-
able to the construction period of qualifying assets as
a part of their cost of acquisition. The additional acqui-
sition cost is depreciated over the expected useful life
of the related asset. Production costs are depreciated
over the expected useful lives of the items concerned
commencing on the completion or commissioning
date. Interest incurred during 2000 was 1,003 million
(1999: 599 million). Of this amount, interest capital-
ized was 15 million (1999: 56 million). Interest
expensed was 988 million (1999: 543 million).
Financial Assets. Shares in associated companies are
valued according to the equity method. E.ON’s
accounting policies are also generally applied to asso-
ciated companies. Other investments are accounted
for in accordance with FAS 115, “Accounting for Certain
Investments in Debt and Equity Securities.” FAS 115
requires that a security be accounted for according to
its classification as either trading, available-for-sale or
held to maturity. Debt securities for which the Compa-
ny does not have the positive intent and ability to
hold to maturity and all marketable securities are
classified as securities available-for-sale. The Company
does not hold any securities classified as trading.
Securities classified as available-for-sale are carried at
Buildings
Drillings
Chemical plants and refineries
Power plants
Conventional plants
Nuclear plants
Hydro power stations and otherfacilities used to generate renewableenergy
Equipment, fixtures, furniture and office equipment
10 to 50 years
15 years
5 to 25 years
10 to 15 years
19 years
10 to 50 years
3 to 25 years
Useful lives of Property, Plant and Equipment

086
Notes
fair value with unrealized gains and losses reported in
stockholders’ equity as a separate component until
realized. Realized gains and losses are recorded based
on the specific-identification method. Unrealized losses
on all marketable securities and investments that
are other than temporary are recognized in financial
earnings. The amortized cost of debt securities is
adjusted for amortization of premiums and accretion
of discounts to maturity. Such amortization and accre-
tion are included in interest income. Realized gains
and losses are included in other operating income and
other operating expenses.
Assets Held for Sale. If assets are identified as held for
sale, depreciation will be discontinued, and the Com-
pany determines the fair value of such assets. If the
fair value of the assets which have been identified for
sale, less selling costs, is less than the net book value
of the assets, a valuation reserve is established. Fair
value is determined based upon discounted cash flows
of the assets at rates which management deems rea-
sonable for the type of property and prevailing market
conditions, appraisals and, if appropriate, current esti-
mated net sales proceeds from pending offers.
Liquid Funds. Liquid funds include securities, checks,
cash on hand and bank balances. Depending on their
maturities, liquid funds are considered either cash and
cash equivalents or other short-term investments.
E.ON considers liquid funds with an original matu-
rity of three months or less to be cash equivalents.
Other short term investments represent liquid
funds with an original maturity of more than three
months.
Inventories. The Company values inventories at the
lower of acquisition or production costs or market val-
ues. Raw materials, products and goods purchased for
resale are valued at LIFO or average cost. In addition
to production materials and wages, production costs
include proportionate material and production over-
head based on standard capacity. The costs of general
administration, voluntary social benefits, pensions and
interest on borrowings are not capitalized. Inventory
risks resulting from excess and obsolescence are taken
into account by adequate valuation allowances.
Receivables and Other Assets. These assets are stated
at face values. Valuation allowances are provided for
identifiable individual risks for these items as well as
long-term loans. Adequate lump-sum valuation allow-
ances are provided to cover the general risk; and are
generally based on empirical values from the past.
Accrued and Other Liabilities. The valuation of provi-
sions for pension throughout the Company is based
upon actuarial computations using the projected unit
credit method in accordance with FAS 87, “Employers’
Accounting for Pensions,” and FAS 106, “Employers’
Accounting for Postretirement Benefits other than
Pensions.”
Other provisions and liabilities are recorded when
an obligation to a third party has been incurred, the
payment is probable and the amount is settled or can
be reasonably estimated.
Deferred taxes. Deferred taxes are provided for all
temporary differences between the tax and commer-
cial balance sheet. According to FAS 109, “Accounting
for Income Taxes,” deferred tax assets and liabilities
are recognized for the estimated future tax conse-
quences attributable to differences between the finan-
cial statement carrying amounts of existing assets and
liabilities and their respective tax bases. FAS 109 also

requires the recognition of future tax benefits of net
operating loss carryforwards. A valuation allowance is
provided for deferred tax assets if it is more likely
than not that the tax benefit will not be realized.
Deferred tax assets and liabilities are measured
using the enacted tax rates expected to apply to tax-
able income in the years in which those temporary dif-
ferences are expected to be recovered or settled. The
effect on deferred tax assets and liabilities of a
change in tax rates is recognized in income for the
period that includes the enactment date. In October
2000, the President of the Federal Republic of Germany
signed into law the Tax Reduction Act. As a result,
deferred taxes for domestic companies are calculated
based on a tax rate of 39 percent (1999: 52 percent) on
the basis of a federal statutory rate of 25 percent for
corporate income tax, a solidarity surcharge of 5.5 per-
cent on corporate tax, and the average trade income
tax rate applicable for E.ON. Deferred taxes related to
foreign companies are calculated at local enacted tax
rates. The major temporary differences and their net
effect are shown in Note 11.
Derivative Financial Instruments. Derivative financial
instruments are used for hedging purposes. The Com-
pany uses interest rate and cross currency swaps and
interest rate options as well as currency forwards
and options. These instruments are utilized to hedge
interest rate and foreign exchange risks. Hedging
transactions are utilized to hedge price risks resulting
from fluctuations in raw materials and commodity
prices. Crude oil swaps and options, petroleum product
and crack swaps are used to cover risks potentially
ensuing from fluctuations in crude oil and product
prices. Precious metals futures serve to hedge underly-
ing transactions in metals trading and to cover price
risks of the product and processing businesses. To
hedge price risks resulting from fluctuations in prices
and margins in the aluminum market, the Company
uses forward contracts. Gas and electricity swaps and
options are entered into in order to enable the Com-
pany to better coordinate power generating capacities
and delivery agreements. The Company uses these
derivative financial instruments to hedge recognized
transactions, firm commitments and anticipated trans-
actions.
Fair value is calculated for each derivative finan-
cial instrument. The fair value is the price at which
one party would assume the rights and/or duties of
another party. Fair values of financial derivatives have
been calculated with commonly used market valuation
methods and with reference to available market
information at the balance sheet date. Considering
the fluctuation of value-influencing market data, the
fair values shown may not be indicative of the
amounts the Company could realize under current
market conditions.
The following is a summary of the methods and
assumptions for the valuation and income effects of
utilized derivative financial instruments in the Consoli-
dated Financial Statements:
• Currency, crude oil, aluminum and precious metals
forwards, crude oil, gas, electricity as well as crack
and product swaps are valued separately at future
rates or market prices as of the balance sheet
date. The fair values of forward contracts are
based on spot prices that consider forward premi-
ums or discounts.
• Market prices for currency, crude oil, precious
metals, gas and electricity options are determined
by means of valuation methods commonly used in
the market.
• The fair values of existing instruments to hedge
interest rate risk were determined by discounting
future cash flows using market interest rates over
the remaining term of the instrument. Discounted
cash values are determined for interest rate and
cross currency swaps for each individual transac-
tion as of the balance sheet date. Interest ex-
change amounts are considered with an effect on
current results at the date of payment or accrual.
Market values for interest rate options are deter-
mined on the basis of quoted market prices or on
calculations based on option pricing models.
087

• Exchange-traded oil and metal future contracts are
valued individually at daily settlement prices deter-
mined on the futures markets that are published
by their respective clearing houses. Paid initial
margins are disclosed under other assets. Variation
margins received or paid during the term are
stated under other liabilities or other assets,
respectively. They are accounted for with an
impact on earnings at settlement or realization,
respectively.
Gains and losses on foreign exchange contracts are
recognized in other operating income, respectively
expenses. Income or expenses resulting from interest
rate contracts are reported in “Interest and similar
income or expenses.” Amounts relating to commodity
contracts are accounted for as an adjustment of sales
or costs of sales, respectively.
Derivative financial instruments utilized to hedge
the Company’s exposure to currency, interest rate or
price risks are accounted for together with the under-
lying business transactions (“hedge accounting”) if
there is a direct connection between a derivative
financial instrument and an underlying transaction.
Once allocated, gains and losses from these valuation
units, which are used to manage currency, interest
rate and commodity price risks of identifiable assets,
liabilities, or firm commitments, do not affect income
until the underlying transaction is realized.
All financial derivatives purchased to offset the
Company’s net exposure to currency, interest rate or
commodity price risks and which are not designated
as hedges of specific assets, liabilities, firm commit-
ments and anticipated transactions, are marked to
market, and any resulting unrealized gains or losses
are recognized currently in income. The carrying
amounts of derivative instruments are included under
other assets and accrued liabilities.
Generally, all financial derivatives used by the Com-
pany for hedging currency risks are marked to market,
and any resulting unrealized gains and losses are rec-
ognized currently in income. For all foreign currency
denominated balance sheet items fair values are also
calculated by using the adequate spot rate. The result-
ing unrealized gains and losses of the individually
valued foreign currency positions are recognized cur-
rently in income.
Those financial derivatives entered into by the
Company to offset its exposure to anticipated cash
flows which do not meet the requirements for apply-
ing hedge accounting are, accordingly, marked to
market at each reporting period with unrealized gains
and losses recognized in income. At such time that the
Company meets the requirements for hedge account-
ing and designates the derivative financial instrument
as a hedge of a committed transaction, subsequent
unrealized gains and losses would be deferred and
recognized along with the effects of the underlying
transaction.
If a derivative instrument ceases to meet the crite-
ria for hedge accounting, any subsequent gains and
losses are currently recognized in income. If an antici-
pated transaction does not occur or if the financial
derivative is sold or terminated prior to maturity, any
gains or losses are recognized in the above-mentioned
income sections.
Consolidated Statement of Cash Flows. The Consoli-
dated Statement of Cash Flows is classified by operat-
ing, investing and financing activities pursuant to FAS
95, “Statement of Cash Flows.” The separate line item,
other non-cash items, is mainly comprised of undis-
tributed earnings from companies valued at equity.
Effects of changes in the scope of consolidation are
shown in investing activities and have been eliminated
from the items in the three classification areas. This
also applies to valuation changes due to exchange-rate
fluctuations whose impact on cash and cash equiva-
lents is separately disclosed.
Segment Information. Segment reporting is in accor-
dance with FAS 131, “Disclosures about Segments of an
Enterprise and Related Information.” The management
approach required by FAS 131 designates the internal
reporting organization that is used by management
for making operating decisions and assessing per-
formance as the source of the Company’s reportable
Notes
088

segments. The measure of segment internal operating
profit or loss is the measure reviewed by the chief
operating decision-maker. FAS 131 also requires disclo-
sures about products and services, geographic areas
and major customers.
Use of Estimates. The preparation of financial state-
ments requires management to make estimates and
assumptions that may affect the reported amounts of
assets and liabilities and disclosure of contingent
amounts at the date of the financial statements and
reported amounts of revenues and expenses during
the reporting period. Actual results could differ from
those estimates.
New Accounting Pronouncements. In June 1998, FAS
133, “Accounting for Derivative Instruments and Hedg-
ing Activities,” was issued. FAS 133 addresses the
accounting for derivative instruments, including cer-
tain derivative instruments embedded in other con-
tracts and hedging activities. In June 1999, FAS 137 was
issued, deferring the effective date of FAS 133 to Janu-
ary 1, 2001. In June 2000, FAS 138, “Accounting for Cer-
tain Derivative Instruments and Certain Hedging Activ-
ities—an Amendment of FASB Statement No. 133,” was
issued.
The Company plans to adopt FAS 133, as amended
by FAS 138, as of January 1, 2001. Therefore the Company
analyzed the hedging strategies used and the docu-
mentation prepared. In areas where the Company will
make use of hedge accounting under the require-
ments of FAS 133, the formal documentation was ana-
lyzed and a project was established to identify deriva-
tives embedded in other contracts. The Company
expects a transition adjustment affecting the results
of operations amounting up to 60 million and no
material impact on its financial position.
In September 2000, FAS 140, “Accounting for Trans-
fers and Servicing of Financial Assets of Liabilities,”
was issued. This new standard determines accounting
principles and financial statement disclosures for
securitizations and other transfers of financial assets
and collateral. The accounting principles are effective
for transactions occurring after March 31, 2001. The
new disclosure requirements are effective for fiscal
years ending after December 15, 2000. Adoption of this
standard is not anticipated to have a material effect
on E.ON’s consolidated financial statements.
(3) Scope of Consolidation
Changes to the scope of consolidation in 2000 are
listed below:
089
See Note 4 for additional information on significant
acquisitions and disposals.
In 2000, a total of 184 domestic and 75 foreign
associated and non-consolidated companies were
valued at equity (1999: 183 and 48, respectively).
Total
836
708
202
1,342
Consolidated companies as of December 31, 1999
Acquisitions
Disposals
Consolidated companies as of December 31, 2000
Domestic
295
199
43
451
Foreign
541
509
159
891
(4) Acquisitions and Dispositions
Merger of VEBA and VIAG. On June 16, 2000, the merger
between VEBA and VIAG was completed. The merger
was entered into the Commercial Register on June 16,
2000. For convenience reasons, June 30, 2000 has been
chosen as the merger date.
Scope of Consolidation

090
VIAG was a corporate group operating in five core
businesses, classified in two main categories: energy
and telecommunications (services) as well as chemi-
cals, packaging and aluminum (innovative industries).
VIAG was one of Germany’s largest industrial groups.
VIAG’s divisions were Bayernwerk AG for the energy
business, SKW Trostberg AG for the chemicals busi-
ness, VIAG Telecom Beteiligungs-GmbH for the tele-
communications business, VAW aluminium AG for the
aluminum business and Schmalbach-Lubeca AG and
Gerresheimer Glas AG for the packaging business.
representing a purchase price of 9,271 million. The
total purchase price was 10,920 million and includes
incidental acquisition costs of 57 million.
The difference of 340 million between the pur-
chase price of the acquired identifiable net assets and
their fair values as of June 30, 2000, was capitalized
as goodwill and will be amortized over 20 years using
the straight-line method.
As a result of the transfer of the Company’s shares
in Schmalbach-Lubeca AG to AV Packaging GmbH
(AVP), which is valued at equity, goodwill attributable
to Schmalbach-Lubeca in the amount of 361 million
is included in the book value of the AVP shareholding
as of December 31, 2000.
The remaining negative goodwill of 21 million is
reported as a liability and will be amortized on a
straight-line basis over 20 years.
Operations of VIAG are included in the Consoli-
dated Statements of Income from July 1 to Decem-
ber 31, 2000.
Subsequent to the merger between VEBA and
VIAG, the electricity divisions of both companies,
PreussenElektra and Bayernwerk, were merged into
E.ON Energie AG. In September 2000 E.ON acquired the
remaining 2.46 percent of E.ON Energie AG through
the issuance of 11,387,615 E.ON AG shares resulting in
a purchase price of 686 million. This acquisition was
accounted for under the purchase method. An amount
of 566 million was recorded as goodwill, which is
being amortized over 20 years on a straight-line basis.
Of the amount allocated to the net realizable value
of VIAG’s business, 1,217 million has been identified
as pertaining to the businesses, which the Company
has identified as held for sale. The allocation of the
purchase price to the businesses held for sale was
determined based on the estimated sales prices for all
businesses held for sale less estimated cash out flows
through disposal date. The final sales price and cash
flows pertaining to these businesses may differ from
the amounts allocated.
Of the businesses held for sale, Gerresheimer Glas
was sold on July 3, 2000. The proceeds and resulting
tax benefits amounted to 228 million. Due to the
accounting treatment for businesses held for sale, no
gain or loss was recognized.
As a result of antitrust requirements, the Company
must divest the shares formerly held by VIAG in
LAUBAG Lausitzer Braunkohle AG (Laubag), VEAG Ver-
einte Energiewerke AG (Veag), and Berliner Kraft- und
Licht-AG (Bewag). The fair value was determined on
Notes
in millions
Sales
Petroleum and electricity tax
Sales, net of petroleum and electricity tax
Cost of goods sold and services provided
Gross profit from sales
Selling expenses
General and administrative expenses
Other operating income
Other operating expenses
Financial earnings, net
Income before income taxes
Income taxes
Income after income taxes
Minority interests
Net income
Earnings per share
Basic earnings per share
Diluted earnings per share
1999
69,745
–4,065
65,680
–54,223
11,457
–5,477
–2,902
6,408
–3,768
–670
5,048
–1,953
3,095
–256
2,839
3.90
3.90
2000
93,240
–8,935
84,305
–71,009
13,296
–7,045
–3,366
7,993
–3,631
–445
6,802
–2,618
4,184
–506
3,678
5.07
5.07
Pro-forma Statements of Income
The merger between VEBA and VIAG was accounted
for under the purchase method of accounting. The
merger was completed on a step-by-step basis. The
first step was the acquisition from the Free State of
Bavaria on October 7, 1999, of a total of 10 percent of
VIAG’s shares at 23.00 per share, resulting in a pur-
chase price of 1,592 million. The second step was the
acquisition of the remaining 90 percent of VIAG’s
shares exchanging 1 VEBA share for 2.5 VIAG shares,
resulting in the issuance of 249,113,480 new shares
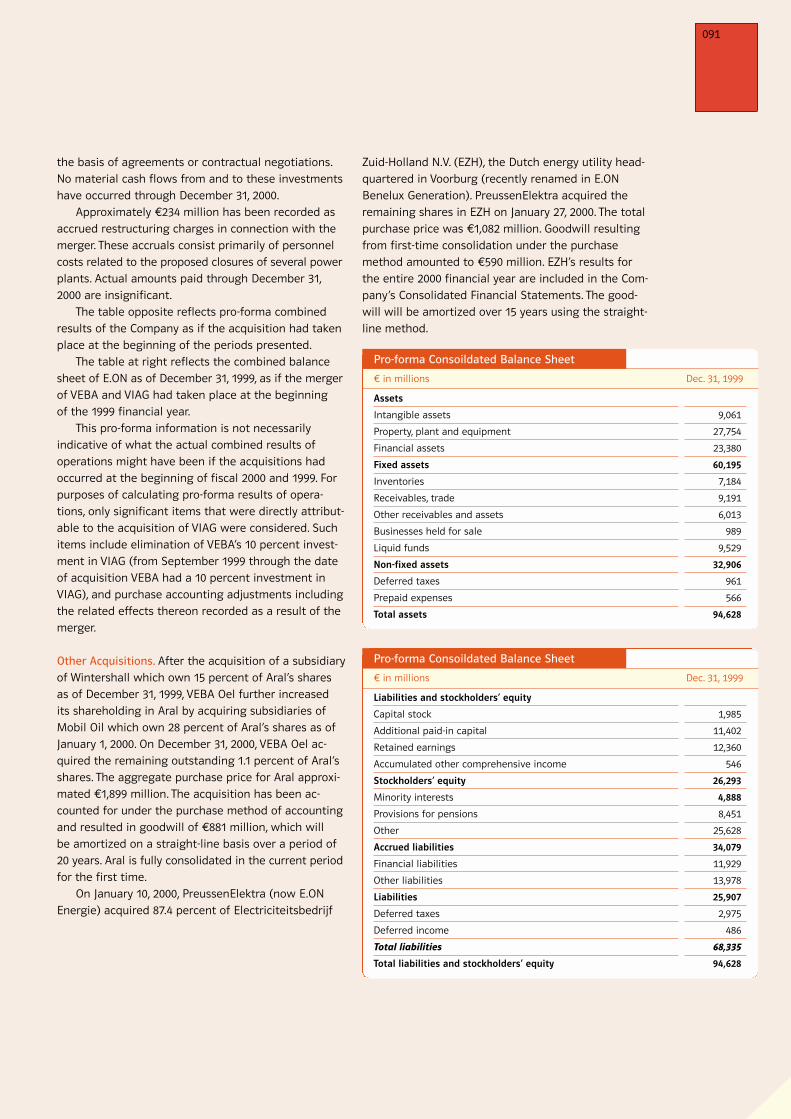
091
in millions
Assets
Intangible assets
Property, plant and equipment
Financial assets
Fixed assets
Inventories
Receivables, trade
Other receivables and assets
Businesses held for sale
Liquid funds
Non-fixed assets
Deferred taxes
Prepaid expenses
Total assets
Dec. 31, 1999
9,061
27,754
23,380
60,195
7,184
9,191
6,013
989
9,529
32,906
961
566
94,628
in millions
Liabilities and stockholders’ equity
Capital stock
Additional paid-in capital
Retained earnings
Accumulated other comprehensive income
Stockholders’ equity
Minority interests
Provisions for pensions
Other
Accrued liabilities
Financial liabilities
Other liabilities
Liabilities
Deferred taxes
Deferred income
Total liabilities
Total liabilities and stockholders’ equity
Dec. 31, 1999
1,985
11,402
12,360
546
26,293
4,888
8,451
25,628
34,079
11,929
13,978
25,907
2,975
486
68,335
94,628
the basis of agreements or contractual negotiations.
No material cash flows from and to these investments
have occurred through December 31, 2000.
Approximately 234 million has been recorded as
accrued restructuring charges in connection with the
merger. These accruals consist primarily of personnel
costs related to the proposed closures of several power
plants. Actual amounts paid through December 31,
2000 are insignificant.
The table opposite reflects pro-forma combined
results of the Company as if the acquisition had taken
place at the beginning of the periods presented.
The table at right reflects the combined balance
sheet of E.ON as of December 31, 1999, as if the merger
of VEBA and VIAG had taken place at the beginning
of the 1999 financial year.
This pro-forma information is not necessarily
indicative of what the actual combined results of
operations might have been if the acquisitions had
occurred at the beginning of fiscal 2000 and 1999. For
purposes of calculating pro-forma results of opera-
tions, only significant items that were directly attribut-
able to the acquisition of VIAG were considered. Such
items include elimination of VEBA’s 10 percent invest-
ment in VIAG (from September 1999 through the date
of acquisition VEBA had a 10 percent investment in
VIAG), and purchase accounting adjustments including
the related effects thereon recorded as a result of the
merger.
Other Acquisitions. After the acquisition of a subsidiary
of Wintershall which own 15 percent of Aral’s shares
as of December 31, 1999, VEBA Oel further increased
its shareholding in Aral by acquiring subsidiaries of
Mobil Oil which own 28 percent of Aral’s shares as of
January 1, 2000. On December 31, 2000, VEBA Oel ac-
quired the remaining outstanding 1.1 percent of Aral’s
shares. The aggregate purchase price for Aral approxi-
mated 1,899 million. The acquisition has been ac-
counted for under the purchase method of accounting
and resulted in goodwill of 881 million, which will
be amortized on a straight-line basis over a period of
20 years. Aral is fully consolidated in the current period
for the first time.
On January 10, 2000, PreussenElektra (now E.ON
Energie) acquired 87.4 percent of Electriciteitsbedrijf
Zuid-Holland N.V. (EZH), the Dutch energy utility head-
quartered in Voorburg (recently renamed in E.ON
Benelux Generation). PreussenElektra acquired the
remaining shares in EZH on January 27, 2000. The total
purchase price was 1,082 million. Goodwill resulting
from first-time consolidation under the purchase
method amounted to 590 million. EZH’s results for
the entire 2000 financial year are included in the Com-
pany’s Consolidated Financial Statements. The good-
will will be amortized over 15 years using the straight-
line method.
Pro-forma Consoildated Balance Sheet
Pro-forma Consoildated Balance Sheet

At the beginning of December 2000, Stinnes acquired
17,675,816 shares of the publicly traded chemical dis-
tributor Holland Chemical International N.V., Amster-
dam, The Netherlands (“HCI”). This equals 99.41 percent
of outstanding shares. The purchase price per share
was 16.2. The total purchase price for HCI was
293.1 million. The acquisition has been accounted for
under the purchase method and resulted in a goodwill
of 185.2 million which will be amortized on a straight-
line basis over 20 years. The consolidation took place
for the first time as of December 1, 2000.
Other Disposals. VIAG Telecom sold its 42.5 percent
interest in Orange Communications S.A., the Swiss cel-
lular phone company, to France Télécom on Novem-
ber 10, 2000. The sales price for the interest including
the transfer of shareholder loans amounted to 1.8 bil-
lion. The transfer of the shareholder loans and one
fourth of the value of the shareholding in Orange
Communications was payable in cash. The remaining
three fourths were paid for via the issuance of
102,675,638 shares in Orange S.A. The first official trad-
ing day of Orange stock was February 13, 2001. The
sale of the shareholding did not result in a significant
gain because it was accounted for at its fair value as
part of the merger.
The operating entities of the Company’s VEBA Elec-
tronics subsidiary were sold in October 2000 to a
consortium of buyers consisting of Arrow Electronics,
Melville (NY/USA), Avnet, Phoenix (AZ/USA), and
Schroder Ventures, London (UK). The purchase price
including the transfer of shareholder loans amounted
to $2.35 billion (2.6 billion). A gain of 44 million
was recorded upon sale. VEBA Electronics is included
in the Company’s Consolidated Statements of Income
until September 30, 2000.
As of March 28, 2000, Cablecom was sold. The sale
price amounted to 851 million and resulted in earn-
ings of 788 million.
VR Telecommunications GmbH & Co (VRT) and Bell-
South concluded the sale and transfer contract for
the shares in E-Plus, which was registered by a notary
public on January 26, 2000. Closing took place on Feb-
ruary 10, 2000. The sale price was 7.4 billion in addi-
tion to the extinguishment of stockholder loans in the
amount of 1.0 billion. E.ON’s share in both amounts
was 51.25 percent.
Notes
092
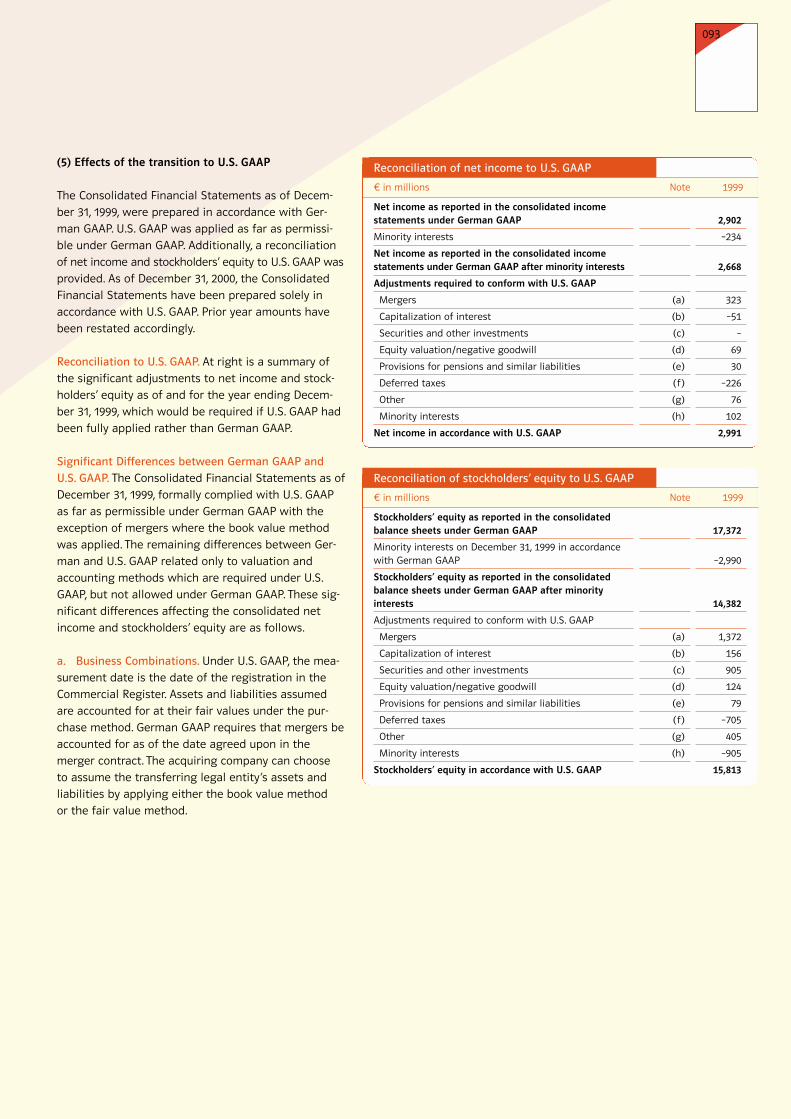
(5) Effects of the transition to U.S. GAAP
The Consolidated Financial Statements as of Decem-
ber 31, 1999, were prepared in accordance with Ger-
man GAAP. U.S. GAAP was applied as far as permissi-
ble under German GAAP. Additionally, a reconciliation
of net income and stockholders’ equity to U.S. GAAP was
provided. As of December 31, 2000, the Consolidated
Financial Statements have been prepared solely in
accordance with U.S. GAAP. Prior year amounts have
been restated accordingly.
Reconciliation to U.S. GAAP. At right is a summary of
the significant adjustments to net income and stock-
holders’ equity as of and for the year ending Decem-
ber 31, 1999, which would be required if U.S. GAAP had
been fully applied rather than German GAAP.
Significant Differences between German GAAP and
U.S. GAAP. The Consolidated Financial Statements as of
December 31, 1999, formally complied with U.S. GAAP
as far as permissible under German GAAP with the
exception of mergers where the book value method
was applied. The remaining differences between Ger-
man and U.S. GAAP related only to valuation and
accounting methods which are required under U.S.
GAAP, but not allowed under German GAAP. These sig-
nificant differences affecting the consolidated net
income and stockholders’ equity are as follows.
a. Business Combinations. Under U.S. GAAP, the mea-
surement date is the date of the registration in the
Commercial Register. Assets and liabilities assumed
are accounted for at their fair values under the pur-
chase method. German GAAP requires that mergers be
accounted for as of the date agreed upon in the
merger contract. The acquiring company can choose
to assume the transferring legal entity’s assets and
liabilities by applying either the book value method
or the fair value method.
093
in millions
Net income as reported in the consolidated incomestatements under German GAAP
Minority interests
Net income as reported in the consolidated incomestatements under German GAAP after minority interests
Adjustments required to conform with U.S. GAAP
Mergers
Capitalization of interest
Securities and other investments
Equity valuation/negative goodwill
Provisions for pensions and similar liabilities
Deferred taxes
Other
Minority interests
Net income in accordance with U.S. GAAP
1999
2,902
–234
2,668
323
–51
–
69
30
–226
76
102
2,991
Note
(a)
(b)
(c)
(d)
(e)
(f)
(g)
(h)
in millions
Stockholders’ equity as reported in the consolidatedbalance sheets under German GAAP
Minority interests on December 31, 1999 in accordancewith German GAAP
Stockholders’ equity as reported in the consolidatedbalance sheets under German GAAP after minorityinterests
Adjustments required to conform with U.S. GAAP
Mergers
Capitalization of interest
Securities and other investments
Equity valuation/negative goodwill
Provisions for pensions and similar liabilities
Deferred taxes
Other
Minority interests
Stockholders’ equity in accordance with U.S. GAAP
1999
17,372
–2,990
14,382
1,372
156
905
124
79
–705
405
–905
15,813
Note
(a)
(b)
(c)
(d)
(e)
(f)
(g)
(h)
Reconciliation of net income to U.S. GAAP
Reconciliation of stockholders’ equity to U.S. GAAP

b. Capitalization of Interest. The capitalization of
interest as a part of the historical cost of acquiring
assets that are constructed or otherwise produced for
an enterprise’s own use is required by U.S. GAAP. Ger-
man GAAP permits, but does not require, such capital-
ization. Under U.S. GAAP, interest has been capitalized
on debt apportionable to the construction period of
qualifying assets as a part of their cost of acquisition.
The additional acquisition cost is depreciated over the
expected useful life of the related asset.
c. Securities and Other Investments. Under U.S. GAAP,
securities and other share investments are classified
into one of the three categories: held-to-maturity
securities, available-for-sale securities or trading secu-
rities. The Company’s securities and other investments
are considered to be available-for-sale and thus must
be valued at market value at the balance sheet date.
Unrealized holding gains and losses are excluded from
earnings and reported as an adjustment to net equity.
Under German GAAP, securities and other investments
are valued at the lower of acquisition costs or market
value at the balance sheet date.
The available for sale treatment for the sharehold-
ing in VIAG as of December 31, 1999 had to be retro-
actively reversed in 2000 due to the acquisition of the
remaining 90 percent of VIAG shares and the full con-
solidation in 2000. Based on the at equity valuation,
the unrealized loss with an amount of 309 million is
reversed in 1999.
d. Equity Valuation/Negative Goodwill. For purposes
of the reconciliation to U.S. GAAP, the earnings of com-
panies accounted for using the equity method have
been determined using valuation principles prescribed
by U.S. GAAP. To the extent that certain equity investees
do not prepare consolidated U.S. GAAP financial
statements, an estimate is made of the reconciling
items based on information provided by the relevant
company.
In addition to the above, under U.S. GAAP, a remain-
ing negative goodwill is amortized over its expected
useful life. Negative goodwill from consolidation must
be released under German GAAP when expenses or
losses expected at the time the stockholding is
acquired are incurred, or if it becomes apparent that
the negative goodwill corresponds to a realized profit
on the balance sheet date.
e. Provisions for Pensions and Similar Liabilities. Due
to changes of the calculation bases, the unfunded
accumulated benefit obligation exceeds the accrued
pension provision in some group companies. In such
cases, under U.S. GAAP, provisions for pensions are
increased by an additional minimum liability which do
not affect income as far as not to exceed the unrecog-
nized prior service cost. Additional minimum liability
in excess of the unrecognized prior service cost is
charged directly against stockholders’ equity. Under
U.S. GAAP the additional minimum liability has no
impact on net income. Pursuant to German GAAP this
additional minimum liability is expensed to the
income statement.
Under German GAAP, accruals are established for
the estimated number of employees nearing retire-
ment who are expected to elect a government-subsi-
dized early retirement program. Under U.S. GAAP, such
accruals may be established only if the employee
consents by entering into a binding contractual agree-
ment.
f. Deferred Taxes. Under German GAAP, deferred
taxes are calculated based on the liability method for
all timing differences between valuation amounts in
the Tax and Consolidated Balance Sheet. For quasi-
permanent differences that are released over a very
long period of time or only during the course of a
company's divestment or liquidation, deferred taxes
can only be recognized if the future reversal is proba-
ble. Deferred tax assets are not recognized for tax
loss carryforwards.
Notes
094

095
Under U.S. GAAP, deferred taxes are provided for all
temporary differences between the Tax and Consoli-
dated Balance Sheet (temporary concept). The tempo-
rary concept also applies to quasi-permanent differ-
ences. Under U.S. GAAP, deferred taxes also are calcu-
lated for tax loss carryforwards and for accounting
and valuation adjustments required under U.S. GAAP.
Deferred taxes are calculated using the liability
method and are based on enacted tax rates. A valua-
tion allowance is established when it is more likely
than not that the deferred tax assets will not be
realized. The deferred tax adjustment included in the
reconciliation to U.S. GAAP also contains the income
tax effects of the other U.S. GAAP adjustments
described within this Note, were appropriate.
The deferred tax assets in the amount of 161 mil-
lion relating to the fair-value treatment of the
Company’s VIAG shares as of December 31, 1999 were
adjusted retroactively (see Note c. Securities and
other investments).
g. Other. Other differences in accounting principles
include unrealized gains from foreign currency transla-
tion, outstanding financial derivatives, the capitaliza-
tion of lease contracts, stock appreciation rights and
the accounting for costs related to initial public offer-
ings and mergers.
h. Minority Interests. Contrary to U.S. GAAP, under
German GAAP, participation of minority stockholders
in subsidiaries is shown as part of stockholders’ equity
and net income. For reconciliation purposes, minority
interests in the effects resulting from U.S. GAAP
adjustments are shown separately.
(6) Sales
A detailed analysis of sales by segment and geograph-
ical region is provided in the segment information
under Note 34.
Sales also include rental income, primarily from
the Real Estate Division, in the amount of 605 million
(1999: 605 million).
Future revenues arising from rental, tenancy and
leasing agreements for the next five years are due as
follows:
(7) Cost of Goods Sold and Services Provided
The following table provides a detailed analysis of the
cost of goods sold and services provided by segment:
in millions
2001
2002
2003
2004
2005
After 2005
681
687
697
694
701
62
3,522
in millions
Electricity
Oil
Chemicals
Real Estate
Telecommunications
Distribution/Logistics
Aluminum
Silicon Wafers
Others/Consolidation
Total
2000
9,396
18,049
14,590
859
197
17,829
1,490
804
–345
62,869
1999
6,358
7,805
9,759
691
125
14,488
–
662
–657
39,231

096
(8) Other Operating Income
At left is a detail of other operating income.
The total includes income not related to the finan-
cial year amounting to 97 million (1999: 353 million).
In 2000, gains from the disposal of fixed assets pri-
marily comprise gains resulting from the disposal of
the shareholdings in E-Plus (3,527 million) and Cable-
com (788 million). Income from the release of provi-
sions primarily relates to the release of accruals for
personnel costs. These provisions had to be released
because present circumstances indicate that they are
no longer probable.
The SAB 51 gain reported last year represents the
difference between the stockholders’ equity in
Degussa-Hüls after the merger and the proportional
stockholders’ equity in Hüls before the merger (559
million).
(9) Other Operating Expenses
At left is a detail of other operating expenses.
The total includes expenses not related to the
financial year amounting to 38 million (1999:
349 million).
Other operating expenses include costs that cannot
be allocated to production, administration or selling
costs.
In addition to the aforementioned, miscellaneous
other operating expenses relate among other items to
expenses resulting from financial instruments, expen-
ditures for crude-oil procurement by Preussag Energie
AG, expenditures from Preussag Energie’s share in
VRT's earnings, rentals, leaseholdings and ground rent.
Notes
in millions
Gains from the disposal of fixed assets
Exchange-rate differences
Release of provisions
Other trade income
Reimbursements of incurred costs
Reimbursements and grants
Recoveries
SAB 51 gain
Amortization of negative goodwill
Miscellaneous
2000
4,985
653
229
179
151
38
36
–
–
1,386
7,657
1999
2,670
357
406
124
135
55
79
559
178
881
5,444
in millions
Exchange-rate differences
Research and development costs
Amortization of goodwill
Additions to accruals
Bad debt expense
Losses from the disposal of fixed assets
Reorganization costs
Other passed-on expenses
In-process research and development to be determined by the merger
Miscellaneous
2000
588
572
502
319
219
101
78
44
–
930
3,353
1999
146
583
386
438
188
139
163
217
160
620
3,040
Other operating income
Other operating expenses
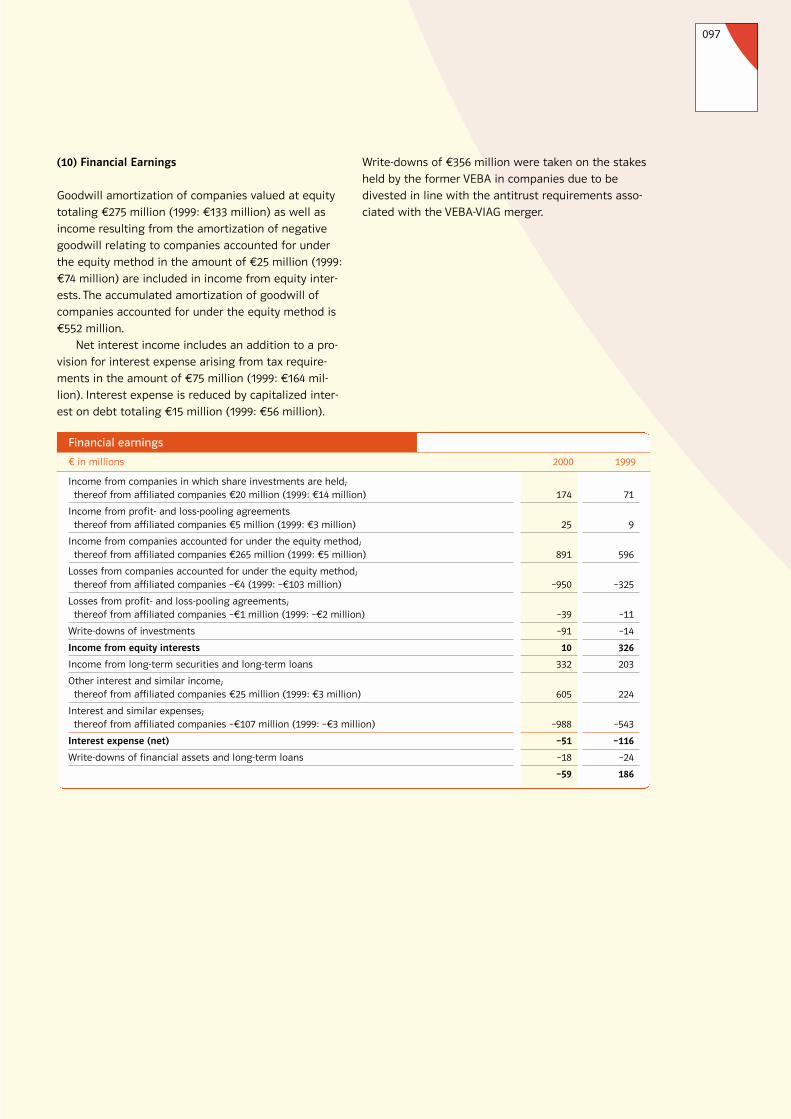
097
(10) Financial Earnings
Goodwill amortization of companies valued at equity
totaling 275 million (1999: 133 million) as well as
income resulting from the amortization of negative
goodwill relating to companies accounted for under
the equity method in the amount of 25 million (1999:
74 million) are included in income from equity inter-
ests. The accumulated amortization of goodwill of
companies accounted for under the equity method is
552 million.
Net interest income includes an addition to a pro-
vision for interest expense arising from tax require-
ments in the amount of 75 million (1999: 164 mil-
lion). Interest expense is reduced by capitalized inter-
est on debt totaling 15 million (1999: 56 million).
Write-downs of 356 million were taken on the stakes
held by the former VEBA in companies due to be
divested in line with the antitrust requirements asso-
ciated with the VEBA-VIAG merger.
in millions
Income from companies in which share investments are held;thereof from affiliated companies 20 million (1999: 14 million)
Income from profit- and loss-pooling agreements thereof from affiliated companies 5 million (1999: 3 million)
Income from companies accounted for under the equity method;thereof from affiliated companies 265 million (1999: 5 million)
Losses from companies accounted for under the equity method;thereof from affiliated companies –4 (1999: –103 million)
Losses from profit- and loss-pooling agreements; thereof from affiliated companies –1 million (1999: –2 million)
Write-downs of investments
Income from equity interests
Income from long-term securities and long-term loans
Other interest and similar income; thereof from affiliated companies 25 million (1999: 3 million)
Interest and similar expenses; thereof from affiliated companies –107 million (1999: –3 million)
Interest expense (net)
Write-downs of financial assets and long-term loans
2000
174
25
891
–950
–39
–91
10
332
605
–988
–51
–18
–59
1999
71
9
596
–325
–11
–14
326
203
224
–543
–116
–24
186
Financial earnings

(11) Income Taxes
Income taxes including deferred taxes detailed in the
table below.
Prior to the Tax Reduction Act, German corporate
tax law applied the split-rate imputation system
(“Anrechnungsverfahren”) with regard to the taxation
of a corporation and its shareholders. In general, Ger-
man corporations were subject to corporate income
tax at a rate of 40 percent on non-distributed profits
in 2000 and 1999 as well as 30 percent on distributed
profits. The corporate income tax liability is subject to
a solidarity surcharge of 5.5 percent. Taxpayers resid-
ing in Germany are entitled to a refundable tax credit
in the case of dividends distributed from fully taxed
German source. A German corporation is also subject
to trade tax.
The German Tax Reduction Act (“Steuersenkungs-
gesetz”) took effect on January 1, 2001 and replaces
the corporate imputation system with a classic corpo-
rate tax system. From 2001 the corporate income tax
rate on distributed and non-distributed profits is
reduced to 25 percent. The change in the system is
facilitated by a number of transitional provisions.
One of E.ON Energie’s subsidiaries has been grant-
ed a tax holiday for a period of 4 years (1998-2001); as
such this entity’s earnings have been tax-free. At this
time, E.ON Energie is unable to estimate the potential
tax effects to which this entity will be subjected if
this tax holiday is not extended and as a result no de-
ferred taxes have been provided.
The differences between the statutory tax rate on
non-distributed profits of 40 percent (1999: 40 percent)
in Germany and the effective tax rate of 38.3 percent
in 2000 and 29.0 percent in 1999 are summarized as
follows:
Notes
098
in millions
Current taxes
Domestic corporate income tax
Domestic trade tax on income
Foreign income tax
Other
Deferred taxes
Domestic
Foreign
2000
2,005
87
840
35
2,967
–329
–126
–455
2,512
1999
1,473
518
393
–
2,384
–949
–158
–1,107
1,277
1999Percent
40.0
–3.0
9.0
2.3
–2.8
–17.7
–
–1.5
2.9
–0.2
29.0
in millions
Corporate income tax (2000: 40%, 1999: 40%)
Credit for dividend distributions
Municipal trade taxes net of federal tax benefit
Foreign tax-rate differential
Tax rate and tax law changes
Tax-free income
Change in valuation allowances
Equity accounting
Non-deductible goodwill/badwill-amortization
Other permanent differences
Income taxes/effective tax rate
2000Percent
40.0
–2.9
1.0
3.1
–13.0
–2.5
0.2
–1.5
3.7
10.2
38.3
2000Amount
2,620
–193
66
204
–852
–163
15
–98
240
673
2,512
1999Amount
1,760
–135
394
103
–122
–777
–
–64
128
–10
1,277
Income before income taxes is attributable to the geo-
graphic locations as at left.
Deferred income taxes reflect the net tax effects
of temporary differences between the carrying
amount of assets and liabilities for financial purposes
and the amounts used for income tax purposes.
in millions
Domestic
Foreign
Total
2000
5,120
1,431
6,551
1999
3,980
420
4,400
Income taxes
Income before income taxes
Reconciliation to the effective tax rate

099
Deferred tax assets and liabilities are summarized as
follows as of December 31:
Net deferred income tax assets and liabilities in the
consolidated balance sheets are as follows:
1,209
–290
919
–1,633
–714
in millions
Deferred tax assets
Valuation allowance
Net deferred tax assets
Deferred tax liabilities
Net deferred tax assets(liabilities)
Total
1,278
–351
927
–1,756
–829
December 31, 1999
808
–207
601
–2,536
–1,935
Thereof non-current
Thereof non-currentTotal
1,345
–271
1,074
–2,720
–1,646
December 31, 2000
in millions
Deferred tax assets
Intangible assets
Fixed assets
Investments and long-term financial assets
Inventories
Receivables
Net operating loss carryforwards
Accruals
Liabilities
Other
Valuation allowance
Deferred tax liabilities
Intangible assets
Fixed assets
Investments and long-term financial assets
Inventories
Receivables
Accruals
Liabilities
Other
Net deferred tax assets/(liabilities)
2000
295
1,063
2,335
105
120
994
2,499
377
911
8,699
–271
8,428
–809
–1,957
–2,956
–110
–905
–341
–2,779
–217
–10,074
–1,646
1999
33
300
298
259
115
876
2,756
85
31
4,753
–351
4,402
–263
–1,524
–871
–99
–83
–244
–2,128
–19
–5,231
–829
Deferred tax assets and liabilities
Net deferred income tax assets and liabilities

100
ees at preferential prices between 39.26 and 50.77
(1999: between 27.02 and 50.94). The difference
between purchase price and resale price was charged
to personnel expenses.
Stock-Based Compensation. As of the balance sheet
date, the E.ON Group had various stock-based compen-
sation plans including stock appreciation rights
(“SARs”) within E.ON AG and Stinnes and a stock
option program within MEMC. All plans are accounted
for in accordance with FAS 123, “Accounting for Stock-
Based Compensation”.
Stock Appreciation Rights. The following information
applies to both stock appreciation programs within
E.ON AG and Stinnes. Differences regarding Stinnes’s
program are provided in parentheses or are otherwise
indicated.
In 2000, E.ON AG and Stinnes AG independently
decided to proceed with their SAR programs (the sec-
ond tranche) which were set up for the first time in
1999 (the first tranche).
In March 2000, E.ON AG granted approx. 1.5 million
SARs, retroactive to the beginning of 2000, to 155 exec-
utives worldwide, respectively 114 for the first tranche,
including all members of E.ON AG’s Board of Man-
agement, as part of their compensation. In the SAR
program executives of Stinnes and Degussa-Hüls as
companies with a stock exchange listing of their
shares were not included. In July 2000, Stinnes granted
approx. 1.36 million SARs to 250 executives worldwide,
respectively 260 for the first tranche, including all
members of Stinnes AG’s Board of Management, as
part of their compensation.
The SARs of the second tranche for E.ON AG are
based on the market price of E.ON shares on January 3,
2000, and on January 4, 1999, for the first tranche. The
market price of Stinnes shares on June 30, 2000, for
the second tranche and on the average market price
between June 28 and July 9, 1999, for the first tranche.
For both tranches of E.ON and Stinnes, the com-
pensation to be received from the exercise of SARs is
Notes
in millions
Wages and salaries
Social security contributions
Pension costs and other employee benefits; thereof pension costs 773 million (1999: 684 million)
2000
7,112
1,246
784
9,142
1999
5,773
1,006
694
7,473
Based on the past performance history of subsidiaries
and expectations of similar performance in the future
as well as the extended realization period for the tem-
porary differences which give rise to the deferred tax
assets, the taxable income of these subsidiaries will
more likely than not be sufficient to recognize fully
the net deferred tax asset related to these subsidiar-
ies. A valuation allowance has been provided for that
portion of the deferred tax asset where this criteria
has not been met.
The tax loss carryforwards at year-end are as
above.
For domestic tax losses there is no expiration date;
foreign loss carryforwards expire as follows: 35 mil-
lion in 2001, 345 million between 2002 and 2010, 799
million between 2010 and 2020 and 758 million do
not have an expiration date.
Undistributed earnings of foreign subsidiaries
considered to be reinvested indefinitely amounted to
1,462 million as of December 31, 2000 (1999: 315 mil-
lion). Deferred tax liabilities related to these profits
are not calculated as it was not practicable.
(12) Minority Interests in Net Income
Minority stockholders participate in the profits
of the consolidated companies in the amount of
524 million (1999: 355 million) and losses amount-
ing to 55 million (1999: 223 million).
(13) Other Information
In 2000, E.ON purchased 245,210 (1999: 360,360) of its
shares (0.03 percent (1999: 0.08) of E.ON’s outstanding
shares) on the stock market at an average price
of 58.46 [1999: 54.39] per share for employees within
the Company. These shares were sold to the employ-
in millions
Domestic loss carryforwards
Foreign loss carryforwards
2000
2,074
1,937
1999
2,153
903
Tax loss carryforwards
Personnel costs

101
months before exercise. To calculate the indexed stock
price, the stock price as of the date of grant at June 30,
2000, which amounted to 21.00, is multiplied by the
ratio of the average M-DAX performance during the
last six months prior to exercise divided by the per-
formance of this index at the date of grant, which was
4,457.92. The Stinnes SARs have a term of five years.
Qualified executives can exercise all or a portion of
the SARs granted to them on pre-determined exercise
dates within the years 2002 until 2005. SARs not exer-
cised by the final exercise date (May 2, 2005), will
automatically be considered as exercised.
The compensation for the first tranche to be
received from the exercise of SARs for E.ON and
Stinnes is calculated as the difference between the
E.ON (Stinnes) calculated stock price and the respec-
tive company’s indexed stock price multiplied by the
number of SARs to be exercised. The above-mentioned
E.ON (Stinnes) calculated stock price equals the aver-
age quotation of the last six months before exercise.
To calculate the respective company’s indexed stock
price, the respective company’s stock price at the date
of grant 54.67 (15.28) is multiplied by the ratio of
the average Euro Stoxx 50 (M-DAX) performance dur-
ing the last six months prior to exercise divided by the
performance of the applicable index at the date of
grant 4,376.82 (3,921.05). The SARs granted under the
first tranche in 1999 have a term of five years. Quali-
fied executives can exercise all or a portion of the
SARs granted to them on pre-determined exercise
dates in 2002 and 2003 (between July 2002 and July
2004). SARs not exercised by the final exercise date on
November 3, 2003 (May 3, 2004), will automatically be
considered as exercised.
paid in cash. The calculation always considers possible
dilution effects from capital changes and dividend
payments that have occurred between grant and exer-
cise. The SARs granted are non-transferable. Under cer-
tain conditions they can be exercised before the exer-
cise date or according to the conditions of the SARs in
the case of termination of employment, they are can-
celled. The table at right shows the SARs which were
cancelled in the current reporting period as a result of
termination of employment.
The second tranche for E.ON is calculated as the
difference between the E.ON share price at the day of
SAR exercise and the market price at the time of grant
which was 48.35 as of January 3, 2000, multiplied by
the number of SARs to be exercised. The SARs have a
term of seven years. Before any exercise of E.ON SARs
the following two conditions have to be met: Between
grant and exercise the E.ON share price has outper-
formed the Stoxx Utilities Price Index on at least ten
consecutive business days and the E.ON share price at
the date of exercise is at least 20 percent above the
share price at SAR grant. Qualified executives can
exercise all or a portion of the SARs granted to them
within pre-determined exercise periods in the years
2002 until 2006. SARs not exercised by the final exer-
cise date (the last business day four weeks after publi-
cation of the interim report for the third quarter 2006)
will automatically be considered as exercised. The
grant of SARs depends on the possession of a certain
number of E.ON shares which have to be held until
maturity of the SARs issued in 2000.
For the second tranche of Stinnes the compensa-
tion is calculated as the difference between the
Stinnes calculated stock price and its indexed stock
price multiplied by the number of SARs to be exer-
cised. The above mentioned Stinnes calculated stock
price equals the average quotation of the last six
Secondtranche
31,700Cancelled (termination ofemployment)
Firsttranche
200,000
Stinnes
Secondtranche
18,000
Firsttranche
77,700
E.ON

102
Concerning the second tranche there was a compen-
sation cost accrued in the amount of approximately
11.9 million regarding E.ON AG’s SAR program in 2000
as the difference between the E.ON calculated stock
price, as defined above, at December 31, 2000, and the
stock price at grant was 16.45. There was a compen-
sation cost recognized in the amount of approximately
1.4 million regarding Stinnes AG’s SAR program in
2000 as the difference in the Stinnes’ calculated stock
price, as defined above, at December 31, 2000, and the
indexed stock price was 4.36.
There was no compensation cost recognized
regarding the first tranche of E.ON AG’s SAR program
in 2000 as the difference between the E.ON calculated
stock price, as defined above, at December 31, 2000,
and the indexed stock price was –17.48. There was a
compensation cost of approximately 13.5 million rec-
ognized regarding the first tranche of Stinnes AG’s
program in 2000 as the difference in the Stinnes’ cal-
culated stock price, as defined above, at December 31,
2000 and the indexed stock price was 9.52.
Stock option plan. MEMC has an Equity Incentive Plan
(the “Plan”) that provides for the award of incentive
several kinds of stock options. Total shares authorized
for grant under the Plan are 7,197,045. Stock options to
employees are typically granted on January 1 and vest
at a rate of 25 percent annually over four years. Stock
options to non-employee directors are also typically
granted on January 1 but vest at a rate of 33 1/3 per-
cent annually over three years. The exercise price of
each option equals the market price of the MEMC’s
common stock at the date of the grant, and each
option’s maximum term is 10 years.
Total compensation cost in 2000 and 1999 recog-
nized under the Plan based on the fair value at the
grant dates consistent with the alternative method
set forth under FAS 123 was 1.6 million (1999: 1.9
million).
The fair value of options granted is estimated on
the date of grant using Black-Scholes option-pricing
model with the following weighted-average assump-
tions used for grants in 2000, 1999 respectively: risk-
free interest rate of 6.7 percent and 4.8 percent;
expected life of six years for all periods; expected
volatility of 77.1 percent and 57.6 percent; expected
dividends of zero percent for all periods.
A summary of MEMC’s Plan activity with respect to
stock options is presented opposite.
Notes
E.ON
Outstanding at beginning of year
Granted
Exercised
Cancelled
Outstanding at end of year
SARs exercisable at year-end
Stinnes
Outstanding at beginning of year
Granted
Exercised
Cancelled
Outstanding at end of year
SARs exercisable at year-end
First.tranche
–
1,037,000
–
–
1,037,000
–
–
3,447,800
–
30,000
3,417,800
–
Secondtranche
–
1,461,800
–
18,000
1,443,800
–
–
1,297,700
12,800
31,700
1,253,200
–
First tranche
1,037,000
–
–
77,700
959,300
–
3,417,800
3,400
411,100
170,000
2,840,100
–
2000 1999
Below is a summary of the quantity of SARs concern-
ing the E.ON and Stinnes stock plan activity for 2000
and 1999, respectively:
Development of SAR programs

A summary of information about stock options at
December 31, 2000 is presented below:
In January 2001, MEMC granted options to purchase
539,900 shares of common stock at 10.42 to 11.72
per share. These options will expire in January 2011.
103
Weighted-averageexercise price
(in )
26.09
35.96
24.54
16.37
9.46
13.55
16.58
Range of exercise prices (in )
26.09
35.47 – 53.80
24.46 – 31.52
3.40 – 16.58
6.52 – 20.72
8.09 – 21.87
3.40 – 53.80
Number outstanding at
December 31, 2000
342,484
115,100
151,050
797,600
637,350
654,200
2,697,784
Weighted-averageremaining
contractual life
4.5 years
5.1 years
5.9 years
7.0 years
8.0 years
9.1 years
7.3 years
Weighted-averageexercise price
(in )
26.09
35.96
24.53
16.42
9.43
13.33
19.09
Range of exercise prices (in )
26.09
35.47 – 53.80
24.46 – 31.52
3.40 – 16.58
6.52 – 20.72
8.09 – 21.87
3.40 – 53.80
Number exercisable at
December 31, 2000
342,484
115,100
141,800
601,934
317,625
77,400
1,569,343
Year ended December 31, 2000Outstanding at beginning of year
Granted
Exercised
Cancelled
Outstanding at end of year
Options exercisable at year-end
Year ended December 31, 1999Outstanding at beginning of year
Granted
Exercised
Cancelled
Outstanding at end of year
Options exercisable at year-end
Number of shares
2,325,744
668,000
–78,600
–217,360
2,697,784
1,596,343
1,773,174
687,700
–21,200
–113,930
2,325,744
1,396,428
Weighted-averageoption price
(in )
18.05
13.55
13.23
24.24
16.58
19.09
18.87
8.14
14.19
22.08
15.58
18.53
Weighted-averagefair value of options
granted (in )
9.44
4.79
Development of stock option plan MEMC
Options outstanding
Exerciseable options outstanding

104
Employees. In the current reporting period, the Com-
pany employed an average of 183,025 people, includ-
ing 5,030 trainees and interns. The breakdown by
division is at left.
Taxes Other Than Income Taxes. Taxes other than
income taxes total 168 million (1999: 59 million),
resulting principally from property tax and real estate
transfer tax in the current period.
(14) Intangible Assets
Impairment changes on intangible assets were
14 million (1999: 0 million).
Notes
Electricity
Oil
Chemicals
Real Estate
Telecommunications
Distribution/Logistics
Aluminum
Silicon Wafers
Other
Total*
2000
27,371
8,648
53,534
5,229
1,234
57,432
13,978
6,080
9,519
183,025
1999
20,888
6,042
44,853
4,683
594
49,703
–
5,704
463
132,930
Licenses
1,424
22
2,927
337
384
547
4,873
470
11
–
344
271
363
917
3,956
1,014
49
546
111
309
13
1,424
353
15
99
196
199
6
470
954
in millions
Acquisition costs balance at January 1, 2000
Exchange rate differences
Change in scope of consolidation
Additions
Disposals
Transfers
Balance at December 31, 2000
Accumulated depreciation balance at January 1, 2000
Exchange rate differences
Change in scope of consolidation
Additions
Disposals
Transfers
Balance at December 31, 2000
2000 net book value
Acquisition costs balance at January 1, 1999
Exchange rate differences
Change in scope of consolidation
Additions
Disposals
Transfers
Balance at December 31, 1999
Accumulated depreciation balance at January 1, 1999
Exchange rate differences
Change in scope of consolidation
Additions
Disposals
Transfers
Balance at December 31, 1999
1999 net book value
4,967
73
1,956
113
246
–194
6,669
1,221
13
–406
502
229
–79
1,022
5,647
2,330
96
1,210
522
90
899
4,967
818
16
–18
386
57
76
1,221
3,746
Advancepayments
68
–
74
45
10
–35
142
28
–1
11
20
–
–27
31
111
50
1
–1
33
10
–5
68
26
2
–1
3
2
–
28
40
Total
6,459
95
4,957
495
640
318
11,684
1,719
23
–395
866
500
257
1,970
9,714
3,394
146
1,755
666
409
907
6,459
1,197
33
80
585
258
82
1,719
4,740
Goodwill
*thereof trainees/interns 5,030 (1999: 5,962) thereof part-time and less than part-time employees 16,487 (1999: 10,987)
Employees
Intangible Assets

105
(15) Property, plant and equipment
Property, plant and equipment includes the capitalized
interest on debt as part of their cost of acquisition in
the amount of 15 million (1999: 56 million). Impair-
ment changes on property, plant and equipment were
257 million (1999: 156 million).
Real estate,leasehold
rights andbuildings
11,756
55
5,193
825
470
–8
17,351
4,802
13
505
562
237
27
5,672
11,679
9,876
196
1,615
299
357
127
11,756
3,983
43
623
356
142
–61
4,802
6,954
in millions
Acquisition and production costs balance at January 1, 2000
Exchange rate differences
Change in scope of consolidation
Additions
Disposals
Transfers
Balance at December 31, 2000
Accumulated depreciation balance at January 1, 2000
Exchange rate differences
Change in scope of consolidation
Additions
Disposals
Transfers
Balance at December 31, 2000
2000 net book value
Acquisition and production costs balance at January 1, 1999
Exchange rate differences
Change in scope of consolidation
Additions
Disposals
Transfers
Balance at December 31, 1999
Accumulated depreciation balance at January 1, 1999
Exchange rate differences
Change in scope of consolidation
Additions
Disposals
Transfers
Balance at December 31, 1999
1999 net book value
Mine develop-
ment costs,mines,
drillings
822
–
–3
3
–
–789
33
544
–
–
11
–
–541
14
19
829
18
–17
5
5
–8
822
518
35
–19
57
34
–13
544
278
Technicalequipment,
plant, andmachinery
34,166
207
6,137
1,204
1,182
2,072
42,604
25,102
107
1,052
2,517
1,015
223
27,986
14,618
29,774
497
3,035
798
605
667
34,166
21,525
285
2,015
1,687
455
45
25,102
9,064
3,161
9
–135
402
426
87
3,098
2,397
4
–317
367
317
12
2,146
952
2,576
48
607
366
474
38
3,161
1,925
27
466
350
394
23
2,397
764
Other equip-ment, fixtures,
furniture and office
equipment
Advancepayments
and con-struction in
progress
1,784
44
359
1,215
168
–1,645
1,589
54
–
–8
13
49
3
13
1,576
1,284
83
211
1,089
45
–838
1,784
34
2
–
21
3
–
54
1,730
Total
51,689
315
11,551
3,649
2,246
–283
64,675
32,899
124
1,232
3,470
1,618
–276
35,831
28,844
44,339
842
5,451
2,557
1,486
–14
51,689
27,985
392
3,085
2,471
1,028
–6
32,899
18,790
Property, plant and equipment
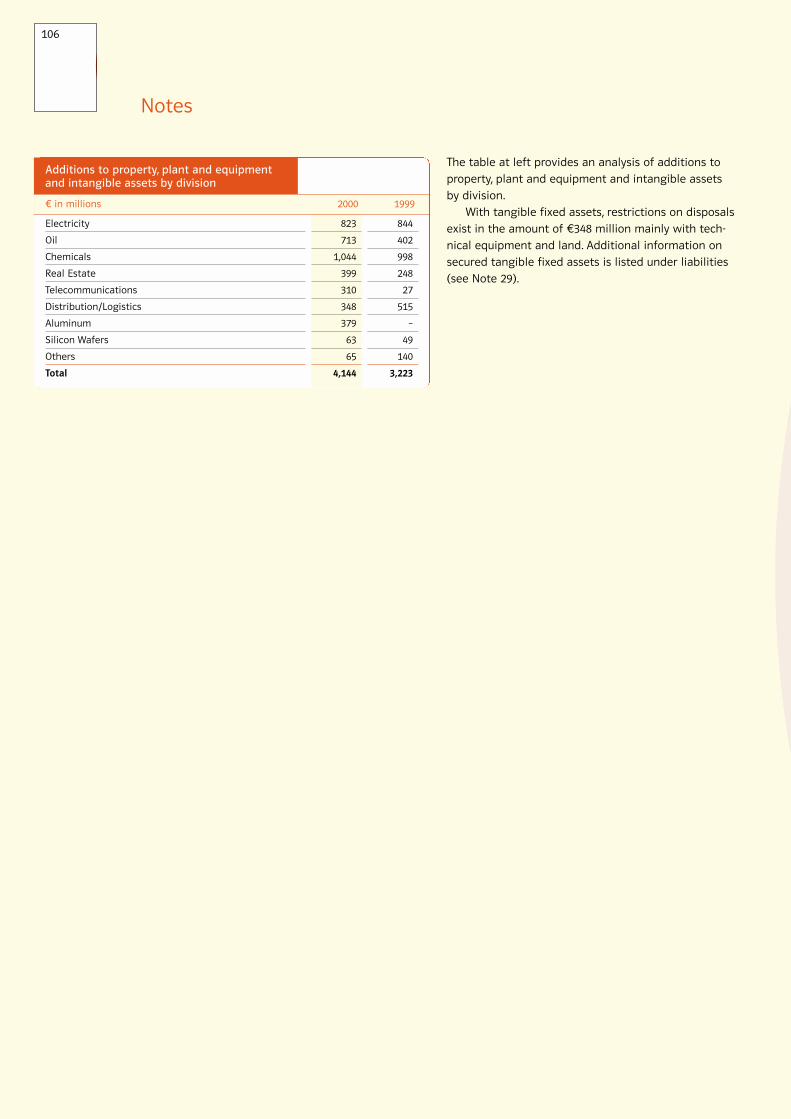
106
The table at left provides an analysis of additions to
property, plant and equipment and intangible assets
by division.
With tangible fixed assets, restrictions on disposals
exist in the amount of 348 million mainly with tech-
nical equipment and land. Additional information on
secured tangible fixed assets is listed under liabilities
(see Note 29).
Notes
in millions
Electricity
Oil
Chemicals
Real Estate
Telecommunications
Distribution/Logistics
Aluminum
Silicon Wafers
Others
Total
2000
823
713
1,044
399
310
348
379
63
65
4,144
1999
844
402
998
248
27
515
–
49
140
3,223
Additions to property, plant and equipment and intangible assets by division

107
(16) Financial Assets
The stockholdings held by the former VEBA in Bewag,
Veag, and Laubag are included in shares in associated
companies. The stockholding held by the former VEBA
in HEW is included in other share investments. These
four stockholdings are to be divested as a result of
antitrust requirements associated with the VEBA-VIAG
merger.
Shares innon-con-solidatedaffiliated
companies
609
–
4,358
355
776
38
4,584
202
1
30
19
180
–
72
4,512
543
–
78
54
69
3
609
109
1
40
62
11
1
202
407
Long-termloans to
affiliatedcompanies
548
–
50
42
533
–
107
1
–
–
1
–
–
2
105
457
1
–
92
2
–
548
1
–
–
–
–
–
1
547
Shares inassociatedcompanies
8,379
7
6,638
1,431
3,590
192
13,057
359
–
–29
468
128
–
670
12,387
6,653
104
198
2,492
370
–698
8,379
413
–
–1
84
65
–72
359
8,020
Othershare
invest-ments
1,785
–16
869
1,033
228
–228
3,215
114
–
–75
77
9
4
111
3,104
3,964
13
46
674
2,766
–146
1,785
43
–
8
70
2
–5
114
1,671
Loans toassociatedand other
companies
785
–4
316
584
260
–3
1,418
105
–
2
13
102
–3
15
1,403
835
33
3
48
78
–56
785
99
–
–
7
1
–
105
680
Long-termsecurities
2,330
2
2,073
709
1,155
–2,122
1,837
21
–
–18
2
–
–
5
1,832
2,679
–
13
363
725
–
2,330
1
–
1
19
–
–
21
2,309
Loans related to
bankingoperations
720
–
–
23
–
–
743
–
–
–
–
–
–
–
743
–
–
576
430
286
–
720
–
–
–
–
–
–
–
720
Otherlong-term
loans
604
–2
263
94
238
–4
717
33
–
1
1
14
–
21
696
596
3
6
82
87
4
604
35
–
3
13
18
–
33
571
Total
15,760
–13
14,567
4,271
6,780
–2,127
25,678
835
1
–89
581
433
1
896
24,782
15,727
154
920
4,235
4,383
–893
15,760
701
1
51
255
97
–76
835
14,925
in millions
Acquisition costs balance at January 1, 2000
Exchange rate differences
Change in scope of consolidation
Additions
Disposals
Transfers
Balance at December 31, 2000
Accumulated depreciation balance at January 1, 2000
Exchange rate differences
Change in scope of consolidation
Additions
Disposals
Transfers
Balance at December 31, 2000
2000 net book value
Acquisition costs balanceat January 1, 1999
Exchange rate differences
Change in scope of consolidation
Additions
Disposals
Transfers
Balance at December 31, 1999
Accumulated depreciation balance at January 1, 1999
Exchange rate differences
Change in scope of consolidation
Additions
Disposals
Transfers
Balance at December 31, 1999
1999 net book value
Financial Assets

108
Notes
in millions
Sales
Net income
E.ON’s portion of net income
Other2
Income from companies which are accounted for underthe equity method
11999 figures include the 10 percent stockholding in VIAG.2Other primarily includes adjustments to conform with E.ON accounting policies as well as good-will/negative goodwill (related to balance sheet data) and related amortization (related to earningsdata).
2000
38,912
–193
–30
–29
–59
1999 1
57,695
867
244
27
271
in millions
Fixed assets
Current assets and prepaid expenses
Accruals
Liabilities and deferred income
Net assets
E.ON’s equity in net assets
Other2
Investment in companies which are accounted for under the equity method
2000
60,967
33,875
23,693
42,367
28,782
11,007
5,530
16,537
19991
72,232
35,553
40,372
41,561
25,852
5,602
2,678
8,280
Fair values
620
4,316
4,936
Fair values
333
3,647
3,980
Grossunrealized
loss
–
3
3
Grossunrealized
loss
6
–
6
Grossunrealized
gain
50
700
750
Grossunrealized
gain
7
898
905
in millions
Fixed-term securities
Non-fixed-term securities
Cost
570
3,619
4,189
2000 1999
Cost
332
2,749
3,081
Shares in affiliated and associated companies accounted
for under the equity method. The summarized finan-
cial information at left represents an aggregation of
the Company’s affiliated and associated companies
which are accounted for under the equity method.
E.ON’s share of undistributed earnings of affiliated
and associated companies included in consolidated
retained earnings is 1,119 million (1999: 596 million)
as of December 31, 2000. Dividends from affiliated and
associated companies are 427 million (1999: 324
million). Application of the equity method to additions
of investments in associated and affiliated companies
resulted in goodwill of 6,458 million (1999: 47 mil-
lion), of which 4,572 million is apportionable to VIAG
Interkom and 1,621 million to Orange Communica-
tions S.A., both of which were fair valued due to the
VEBA-VIAG merger. From the first-time application of
the equity method of accounting no negative goodwill
resulted (1999: 624 million).
Other Financial Assets. As discussed in Note 4, the for-
mer VEBA acquired the remaining 90 percent of VIAG
during the period under report. The 10 percent stock-
holding in VIAG, acquired from the Free State of
Bavaria on October 7, 1999 for 1,592 million, was
included in other share investments. This investment
was previously accounted for under the cost method
of accounting and classified as available for sale
resulting in an unrealized loss of 309 million, which
includes 161 million in deferred taxes. In accordance
with ARB 51 (Accounting Research Bulletin), the Com-
pany restated the 1999 Consolidated Financial State-
ments to eliminate the effect of classifying this invest-
ment as available for sale.
The aggregate costs, fair values, and gross unreal-
ized holding gains and losses for each class of securi-
ties are summarized as follows:
11999 figures include the 10 percent stockholding in VIAG.2Other primarily includes adjustments to conform with E.ON accounting policies as well as good-will/negative goodwill (related to balance sheet data) and related amortization (related to earningsdata).
Earnings data
Balance sheet data
Securities available for sale

109
Disposal of available-for-sale securities generated pro-
ceeds in the amount of 417 million (1999: 3,024 mil-
lion) and capital gains in the amount of 28 million
(1999: 1,429 million). The Company uses the specific
identification method as a basis for determining cost
and calculating realized gains and losses.
Maturities of fixed-term securities as of December
31, 2000 are as at left.
Long-term loans are as follows:
As of December 31, 2000, 24,686 million financial
assets mature after more than one year (1999: 14,854
million).
Impairment charges on financial assets are record-
ed in the amount of 395 million (1999: 106 million).
Maturitythrough
2015
2010
2009
2010
inmillions
547
680
720
571
2,518
Interestrate up to
7.20 %
6.10 %
6.00 %
8.75 %
Maturitythrough
2035
2007
2009
2010
Loans to affiliated companies
Loans to associated companies
Loans related to banking operations
Other loans
inmillions
105
1,403
743
696
2,947
Interestrate up to
6.00 %
5.30 %
7.00 %
7.00 %
1999
Fair value
96
397
127
620
Fair value
71
223
39
333
in millions
Less than 1 year
Between 1 and 5 years
More than 5 years
Cost
96
352
122
570
2000 1999
Cost
72
222
38
332
2000
(17) Inventories
Work in progress is shown together with finished
products because they are combined for the purpose
of valuation by the LIFO method. Raw materials and
supplies contain utilities’ fuel inventories in the
amount of 183 million (1999: 96 million) and crude
oil supplies of 127 million (1999: 96 million).
Inventories in the amount of 1,660 million (1999:
875 million) are valued according to the LIFO method
and the remaining inventories are valued at average
cost or other methods. The difference between valua-
tion according to LIFO and higher replacement costs is
941 million (1999: 458 million).
in millions
Raw materials and supplies by segment
Electricity
Oil
Chemicals
Aluminum
Silicon Wafers
Others
Work in progress
Finished products by segment
Oil
Chemicals
Aluminum
Silicon Wafers
Others
Goods purchased for resale
2000
818
181
878
202
57
101
2,237
622
118
1,781
561
85
63
2,608
1,699
7,166
1999
472
162
552
–
53
39
1,278
445
147
807
–
49
29
1,032
1,732
4,487
Securities available for sale
Loans
Inventories

110
Notes
With aremainingterm up to
one year
6,329
120
1,346
25
141
1,665
9,626
With aremaining
term ofmore than
one year
3
2
9
517
61
186
778
in millions
Accounts receivable trade
Affiliated companies
Associated companies andother share investments
Reinsurance claim duefrom VersorgungskasseEnergie Mutual InsuranceFund
Receivables from bankingoperations
Other assets
With aremainingterm up to
one year
10,799
631
5,472
138
150
3,576
20,766
With aremaining
term ofmore than
one year
498
8
25
432
37
2,974
3,974
Disposalsaffecting
income
–192
–96
–15
–303
Additionsnot
affectingincome
220
108
19
347
Disposalsnot
affectingincome
–297
–2
–10
–309
At end ofyear 2000
420
43
116
579
in millions
Accounts receivable trade
Receivables from other affiliated companies
Other receivables and assets
Total 2000
At beginning
of year 2000
335
13
51
399
Additionsaffecting
income
354
20
71
445
Accounts receivable trade
Receivables from other affiliated companies
Other receivables and assets
Total 1999
Disposalsaffecting
income
–51
–1
–43
–95
Additionsnot
affectingincome
71
10
20
101
Disposalsnot
affectingincome
–98
–1
–10
–109
At end ofyear 1999
335
13
51
399
At beginning
of year 1999
266
3
65
334
Additionsaffecting
income
147
2
19
168
2000 1999
(18) Receivables and Other Assets
The amounts at left are presented net of valuation
allowances for doubtful accounts.
Accounts receivable and other assets in the
amount of 7,099 million (1999: 758 million) are inter-
est-bearing.
The reinsurance claim due from the Versorgungs-
kasse Energie Mutual Insurance Fund results from
pension obligations due to E.ON Energie employees.
The claims of these employees at the point of retire-
ment are covered to a certain extent by insurance con-
tracts made with the above mutual insurance fund.
Other assets mainly include accounts receivables
relating to E.ON Benelux’s cross-border lease transac-
tions for power stations amounting to 1,395 million;
these are carried as other liabilities in the same
amount. Other assets also consist of tax-refund claims
of 1,208 million (1999: 562 million) and short-term
loans of 443 million (1999: 409 million) as well as
other receivables of 1,240 million (1999: 290 million)
related in 2000 primarily to the sale of Orange Com-
munications S.A. In addition, other assets include
assets held for sale in the amount of 42 million
(1999: 0 million).
The additions and disposals not affecting income
relate primarily to changes in the scope of consolida-
tion.
Receivables and Other Assets
Valuation Allowances for Doubtful Accounts
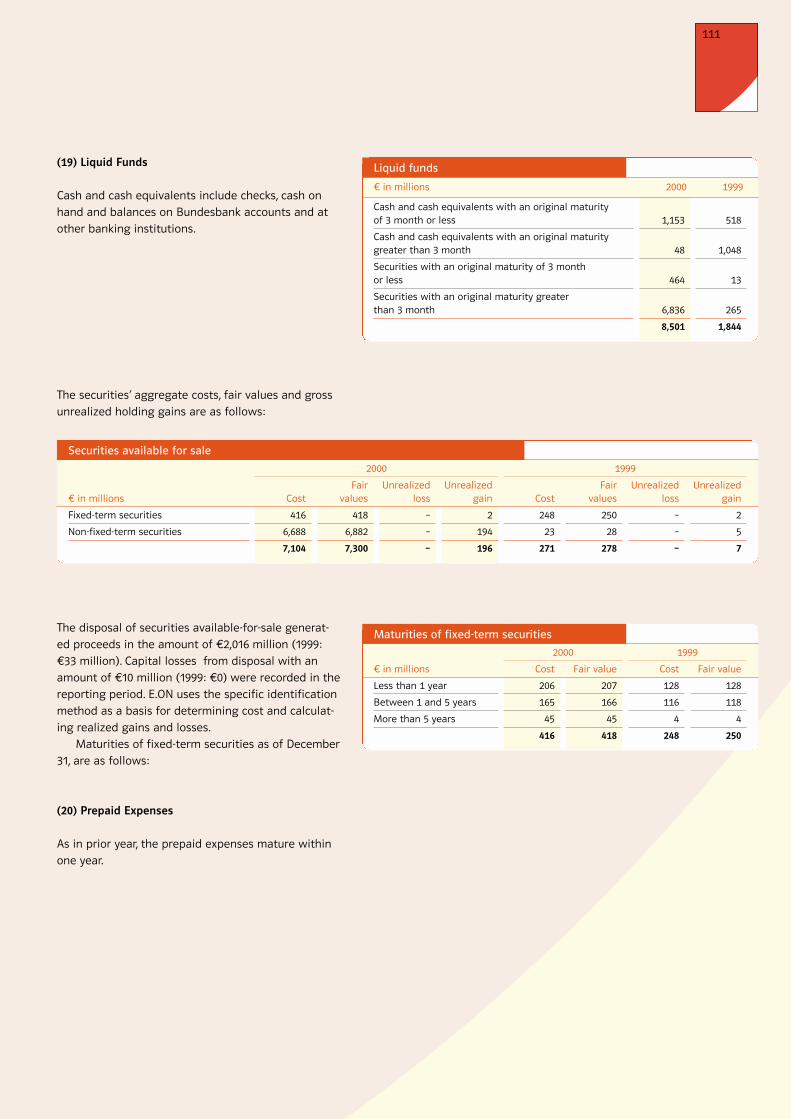
111
(19) Liquid Funds
Cash and cash equivalents include checks, cash on
hand and balances on Bundesbank accounts and at
other banking institutions.
in millions
Cash and cash equivalents with an original maturity of 3 month or less
Cash and cash equivalents with an original maturitygreater than 3 month
Securities with an original maturity of 3 month or less
Securities with an original maturity greater than 3 month
2000
1,153
48
464
6,836
8,501
1999
518
1,048
13
265
1,844
The securities’ aggregate costs, fair values and gross
unrealized holding gains are as follows:
The disposal of securities available-for-sale generat-
ed proceeds in the amount of 2,016 million (1999:
33 million). Capital losses from disposal with an
amount of 10 million (1999: 0) were recorded in the
reporting period. E.ON uses the specific identification
method as a basis for determining cost and calculat-
ing realized gains and losses.
Maturities of fixed-term securities as of December
31, are as follows:
(20) Prepaid Expenses
As in prior year, the prepaid expenses mature within
one year.
Fair value
207
166
45
418
Fair value
128
118
4
250
in millions
Less than 1 year
Between 1 and 5 years
More than 5 years
Cost
206
165
45
416
2000 1999
Cost
128
116
4
248
Fairvalues
418
6,882
7,300
Fairvalues
250
28
278
Unrealizedloss
–
–
–
Unrealizedloss
–
–
–
Unrealizedgain
2
194
196
Unrealizedgain
2
5
7
in millions
Fixed-term securities
Non-fixed-term securities
Cost
416
6,688
7,104
2000 1999
Cost
248
23
271
Liquid funds
Securities available for sale
Maturities of fixed-term securities

112
Notes
(21) Capital Stock
Development in 2000: In connection with the merger
of VEBA and VIAG the capital stock was increased
from 1,307,274,228 by 647,695,048 to 1,954,969,276
through the issuance of 249,113,480 bearer shares
without nominal value. Each share has an imputed
share amount in capital stock of 2.60. These shares
participate in the Company’s earnings beginning from
January 1, 2000. These amendments were entered
into the Commercial Register of the Düsseldorf District
Court HRB 22 315 on June 9, 2000.
Under the resolution adopted by E.ON AG’s Board
on Management on August 29, 2000, the Company
made partial use of Authorized Capital II to increase
its capital stock from 1,954,969,276 by 29,607,799 to
1,984,577,075 by issuing 11,387,615 bearer shares. Each
share has an imputed share amount in capital stock
of 2.60 and participates in the Company’s earnings
beginning from January 1, 2000. The increase in capital
stock resulted from a contribution in kind of shares
of E.ON Energie AG. These amendments were entered
into the Commercial Register of the Düsseldorf District
Court HRB 22 315 on November 3, 2000.
The Company’s capital stock now consists of
763,298,875 bearer shares issued without nominal val-
ue (1999: 502,797,780).
The total amount of outstanding shares as of
December 31, 2000 is 712,781,940 (1999: 502,797,780).
At the Annual Shareholders’ Meeting on May 25,
2000, the authorization granted at the 1998 Annual
Shareholders’ Meeting to increase the Company’s
capital stock by a maximum of 125.0 million in return
for cash contributions (with the inclusion of share-
holders’ subscriptions rights and the authorization to
increase the Company’s capital stock by a maximum
of 125.0 million in return for contributions in kind
(with the exclusion of shareholders’ subscription rights)
as well as the authorization granted at the 1996 Annual
Shareholders’ Meeting to increase the Company’s
capital stock by a maximum of 50.0 million in return
for cash contributions (with the authorization to
exclude the shareholders’ subscription rights) were
cancelled.
Instead the Board of Management was authorized to
increase the Company’s capital stock by a maximum
of 180.0 million (Authorized Capital I) through the
issuance of new shares in return for cash contributions
(with the opportunity to exclude shareholders’ sub-
scription rights) as well as to increase the Company’s
capital stock by a maximum of 180.0 million (Autho-
rized Capital II) through the issuance of new shares
in return for contributions in kind (with the exclusion
of shareholders’ subscription rights). Following the
above-mentioned capital increase, Authorized Capi-
tal II now amounts to 150.4 million.
In addition, the Board of Management was autho-
rized to increase the Company’s capital stock by a
maximum of 180.0 million (Authorized Capital III)
through the issuance of new shares in return for cash
contributions. Subject to the approval of the Super-
visory Board, the Board of Management is authorized
to exclude shareholders’ subscription rights.
All three capital increases are authorized until
May 25, 2005.
Development in 1999: The resolution adopted at the
May 1999 Annual Shareholders’ Meeting to increase
the Company’s capital stock conditionally by 50.0 mil-
lion has been cancelled. In its place, the Company’s
capital stock was conditionally increased by 75.0 mil-
lion until May 25, 2005, to issue conversion rights
or option certificates for the shares of E.ON AG or of
companies in which the Company holds a direct or
indirect majority stake. The Board of Management is
authorized to exclude shareholders’ subscription rights
in this regard.
At the Annual Shareholders’ Meeting on May 25,
2000, VEBA AG was authorized until October 31, 2001,
to repurchase its own shares up to a maximum of

113
10 percent of the Company’s capital at the time of
the repurchase. As of December 31, 2000, a total of
15,265,979 E.ON shares (2 percent of the Company’s
capital stock) had been purchased for an average
purchase price of 60.60 per share. These shares are
recognized in stockholders’ equity. See Note 25.
The resolution passed at the 1999 Annual Share-
holders’ Meeting authorizing management to pur-
chase the Company’s own shares until October 31,
2000, was cancelled.
At the 1999 Annual Stockholders’s Meeting of VEBA
AG it was resolved to convert the capital stock from
DM to . The euro-denominated capital stock was
increased by 21,892,114.01 to 1,307,274,228.00 using
corporate funds by converting a portion of additional
paid-in capital. The capital stock was reclassified such
that a DM5 nominal share was replaced by a share
without nominal value. New shares were not issued.
As a result capital stock then consisted of 502,797,780
bearer shares without nominal value. These amend-
ments were entered into the Commercial Register of
the Düsseldorf District Court HRB 22315 on August 20,
1999, and into that of the Berlin-Charlottenburg Dis-
trict Court 93 HRB 1647 on September 3, 1999.
It was also resolved to establish conditional capital
of up to 50 million to issue partial convertible bonds
or bonds with option rights on shares of E.ON AG until
May 26, 2004. This conditional capital may exclude
stockholders’ subscription rights.
The 1998 Annual Stockholders’ Meeting approved
authorized capital of DM250 million for the issuance
of new shares in exchange for cash with stock-
holders’ subscription rights and authorized capital of
DM250 million for the issuance of new shares in
exchange for capital contributions excluding stock-
holders’ subscription rights. The authorization for both
of these capital amounts expires on May 13, 2003. At
the 1999 Annual Stockholders’s Meeting it was re-
solved to convert these amounts to 125 million each.
In 1996, additional authorized capital totaling
DM100 million was approved for the issuance of new
shares in exchange for cash. This capital authorization
expires on May 22, 2001. The Board of Management
is empowered to decide on the exclusion of stock-
holders’ subscription rights. At the 1999 Annual Stock-
holders’s Meeting it was resolved to convert this
amount to 50 million.
Disclosure requirements in conjunction with Germany’s
Securities Trading Act (WpHG). In compliance with
Article 21, Paragraph 1 of Germany’s Securities
TradingAct (WpHG), Allianz of Munich informed the
Company that its direct and indirect share of E.ON
AG’s voting rights totals 10.2 percent. This figure
includes the voting rights held by Lambda-Vermögens-
verwaltungsgesellschaft mbH (Lambda). In compliance
with Article 21, Paragraph 1 of Germany’s Securities
Trading Act, Lambda informed the Company that its
share of the voting rights of E.ON AG of Düsseldorf fell
below 10 percent owing to VEBA AG’s merger with
Munich-based VIAG AG on June 16, 2000. Lambda cur-
rently holds 6.7 percent of E.ON AG’s voting rights.
Also in compliance with Article 21, Paragraph 1 of Ger-
many’s Securities Trading Act, the Free State of
Bavaria informed the Company that its share of the
voting rights of E.ON AG of Düsseldorf increased to
above the 5-percent mark owing to VEBA AG’s merger
with Munich-based VIAG AG on June 16, 2000. The
Free State of Bavaria currently holds 5.56 percent of
E.ON AG’s voting rights.

114
(24) Other Comprehensive Income
The changes in the components of other comprehen-
sive income and the related tax effects are as follows:
Notes
(25) Treasury Stock Repurchase Program
The Shareholders’ Meeting on May 25, 2000, authorized
the Board of Management to repurchase shares
through October 31, 2001. The repurchase can either be
executed as an on-market buy-back or via a Public
Tender Offer. If the authorization is fully utilized, E.ON
will buy back about 76 million of its shares. This would
amount to 4.5 billion based on an average price of
60 per share.
On September 22, 2000, E.ON´s Board of Manage-
ment decided to conduct an on-market share buy-back
of up to 10 percent of the Company’s capital stock
Net-of-taxamount
255
101
–8
–28
320
Before-taxamount
358
170
–1,429
7
–894
Tax (expense)/
benefit
–
196
43
–7
232
Net-of-taxamount
358
366
–1,386
–
–662
in millions
Foreign currency translation adjustments
Unrealized holding gains arising during period
Less: reclassification adjustment for gains included in income
Minimum pension liability adjustment
Total other comprehensive income
Before-taxamount
255
207
–18
–93
351
Tax (expense)/
benefit
–
–106
10
65
–31
2000 1999
in millions
Legal reserves
Other retained earnings
2000
45
14,660
14,705
1999
45
11,718
11,763
(22) Additional Paid-in Capital
Additional paid-in capital results exclusively from
share issuance premiums.
Additional paid-in capital rose 9,205 million to
11,402 million compared with year-end 1999. The
increase results from the share exchange that accom-
panied the VEBA-VIAG merger and from the acquisi-
tion of the remaining 2.46 percent stockholding in
E.ON Energie AG by issuing shares in E.ON AG. The
additional paid-in capital created by this transaction
corresponds to the difference between the nominal
value of the shares issued and their market value.
(23) Retained Earnings
over the next nine months. As of December 31, 2000,
E.ON had repurchased 15,265,979 of its shares at
an average price of 60.60 per share. This amounts to
2 percent of its capital stock.
Plans call for a substantial part of repurchased
shares to be cancelled. This is subject to Supervisory
Board approval.
Retained earnings
Other comprehensive income

115
(27) Provisions for Pensions
As a general rule, the Company’s pension plans are
based on pay and length of service. Employees who
entered the Company prior to 1999 participate in a
final pay arrangement where the amount of benefits
depends on final salary, averaged over the last years
of employment, and on the period of Company service.
For employees who joined the Company after the
date mentioned above, a cash balance plan applies
under which notional contributions, based on current
earnings, are actuarially converted into pension units.
In addition, the Company sponsors a performance
linked program. Under this arrangement, additional
notional contributions are set aside. As under the cash
balance plan described above these contributions are
actuarially converted into pension units.
The liabilities arising from the pension plans and
their respective costs are determined using the pro-
jected unit credit method in accordance with FAS No.
87, “Employers’ Accounting for Pensions.” The valuation
is based on current pensions and earnings and on
economic assumptions, which have been chosen in
such a way so as to reflect the realistic long-term
expectations.
The change in the projected benefit obligation is
as follows:
in millions
Electricity
Oil
Chemicals
Real Estate
Telecommunications
Distribution/Logistics
Aluminum
Silicon Wafers
Others
2000
2,145
8
2,176
11
22
540
19
197
5
5,123
1999
1,528
–
1,736
32
–5
441
–
160
3
3,895
in millions
Projected benefit obligation at January 1
Service cost
Interest cost
Business combinations
Prior service costs
Actuarial (gains)/losses
Exchange rate differences
Others
Pensions paid
Projected benefit obligation at December 31
2000
6,246
150
503
2,982
40
710
40
–60
–527
10,084
1999
5,263
121
360
784
37
–14
60
–
–365
6,246
(26) Minority Interests
Minority interests is attributable to the following
divisions:
Minority interests
Projected benefit obligation
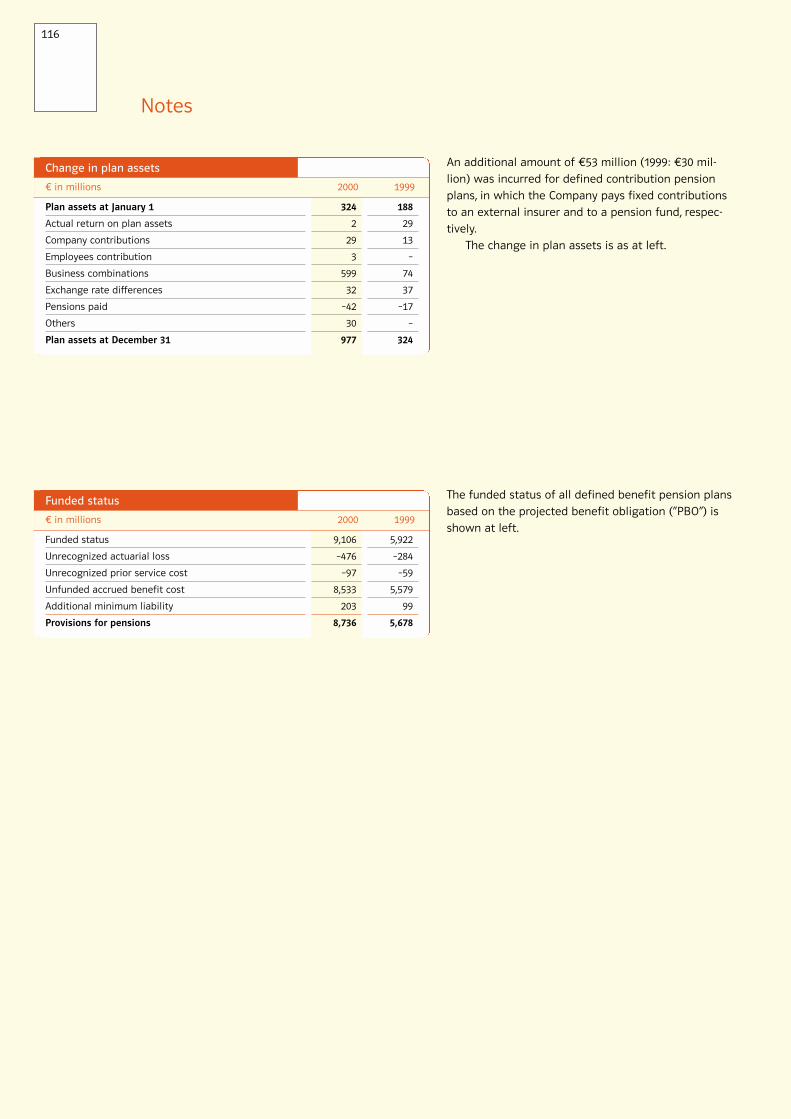
116
The funded status of all defined benefit pension plans
based on the projected benefit obligation (“PBO”) is
shown at left.
Notes
in millions
Funded status
Unrecognized actuarial loss
Unrecognized prior service cost
Unfunded accrued benefit cost
Additional minimum liability
Provisions for pensions
2000
9,106
–476
–97
8,533
203
8,736
1999
5,922
–284
–59
5,579
99
5,678
An additional amount of 53 million (1999: 30 mil-
lion) was incurred for defined contribution pension
plans, in which the Company pays fixed contributions
to an external insurer and to a pension fund, respec-
tively.
The change in plan assets is as at left.
in millions
Plan assets at January 1
Actual return on plan assets
Company contributions
Employees contribution
Business combinations
Exchange rate differences
Pensions paid
Others
Plan assets at December 31
2000
324
2
29
3
599
32
–42
30
977
1999
188
29
13
–
74
37
–17
–
324
Change in plan assets
Funded status

117
For the period between December 31, 1997 and
December 31, 1999 the valuation of pension schemes
of all local affiliates was based on the chemical indus-
try’s mortality tables (“PK-Chemie 1996 R”). These
statistics have lower death and disability incidence
rates than the previously used tables by Klaus Heubeck
from 1983. Since December 31, 2000 the Klaus Heubeck
Tables from 1998 (“Richttafeln 1998”) are being used,
which were based on disability incidence rates that
are reduced by 20 percent. Death rates are slightly
lower and disability incidence rates slightly higher
than under the previously applied “PK-Chemie 1996 R.“
The resulting actuarial loss is amortized over the
employee’s average remaining service.
In accordance with U.S. GAAP, the additional minimum
liability has no impact on net income. The additional
minimum liability is accounted for as an intangible
asset in the amount of 40 million (1999: 28 million)
not to exceed the unrecognized prior service costs. Any
remaining additional minimum liability is charged,
net of tax, directly against stockholders’ equity in the
amount of 163 million (1999: 71 million). The accumu-
lated benefit obligation and fair value of the plan
assets for pension plans under which an additional
minimum liability arises are 2,852 million (1999:
1,654 million) and 119 million (1999: 251 million),
respectively.
Provision for pensions shown on the balance sheet
also include obligations of U.S. companies arising from
post-retirement health-care benefits in the amount of
93 million (1999: 40 million).
Based upon actuarial computations, the total net
periodic pension cost is comprised of the following:
in millions
Service cost
Interest cost
Expected return on plan assets
Prior service costs
Net amortization of (gains)/losses
Net periodic pension cost
2000
150
503
–53
21
2
623
1999
121
360
–23
7
13
478
In percent
Discount rate
Projected salary increases-nonvested
Expected return on plan assets
Projected pension payment increases
2000
6.25
2.75
6.25
1.25
1999
6.25
2.75
6.25
1.25
Total net periodic pension cost
Actuarial assumptions

Notes
118
in millions
Provisions for nuclear waste management (1)
Provisions for taxes (2)
Provisions for personnel costs (3)
Provisions for outstanding trade invoices (4)
Provisions for environmental remediation (5)
Provisions for reclamation (6)
Miscellaneous (7)
2000
11,170
4,623
2,218
1,806
741
175
4,066
24,799
1999
5,889
2,572
1,656
821
494
175
2,395
14,002
(28) Other Provisions
As of December 31, 2000, 16,668 million of the above
provisions mature after more than one year (1999:
9,453 million).
(1) Provisions for nuclear waste management include
costs for nuclear fuel reprocessing, the disposal of
waste resulting from reprocessing, nuclear power
plant decommissioning, and the disposal of low-level
nuclear waste.
The provisions for nuclear waste management stated
above are net of advance payments of 1,239 million
(1999: 681 million). The advance payments are pre-
payments to nuclear fuel reprocessors, to other waste-
management companies as well as to governmental
authorities relating to reprocessing facilities for spent
fuel rods and the construction of permanent storage
facilities. The requirement for spent nuclear fuel
reprocessing and disposal/storage is based on the
German Nuclear Power Regulations Act (Atomgesetz).
Operators may either recycle or permanently dispose
of nuclear waste.
E.ON Energie has entered into contracts with two
large European fuel reprocessing firms, BNFL in the UK
and Cogema in France, for the reprocessing of all
spent nuclear fuel. The contract terms are through
2005. The radioactive waste which results from repro-
cessing will be returned to Germany to be stored in
an authorized storage facility.
The accrual for the costs of spent nuclear fuel
reprocessing includes the costs for all components of
the reprocessing requirements including the costs
of transporting spent fuel to the reprocessing firms, of
fuel reprocessing, and of outbound transportation
of nuclear waste. The stated cost estimates are based
primarily on existing contracts.
Accruals for the costs of permanent disposal of
spent fuel rods include contractual costs for procuring
intermediate containers and estimates for the costs
of intermediate on-site storage at power stations, the
costs of transporting spent fuel rods to conditioning
facilities, conditioning costs, and costs for procuring
permanent storage containers.
Cost estimates for reprocessing and for permanent
disposal are updated continually. The accrual for the
disposal of spent fuel rods is provided over the period
in which the fuel is consumed to generate electricity.
The liability for the nuclear portion of nuclear
plant decommissioning is based on the Atomgesetz,
while the liability for the non-nuclear portion depends
upon legally binding civil and public regulations as
well as voluntary agreements.
After cessation of energy production, the nuclear
inventory will be removed from the power plant. The
entire plant then will either be immediately disman-
tled and removed completely or sealed for a certain
period of time (approximately 30 years) before final
removal.
Other provisions

119
The accrual for the costs of nuclear plant decommis-
sioning includes the expected costs for run-out opera-
tion, closure and maintenance of the facility, disman-
tling and removal of both the nuclear and non-nuclear
portions of the plant, conditioning, and temporary
and final storage of contaminated waste. The expected
decommissioning and storage costs are based upon
studies performed by independent third parties and
are updated continuously. The accrual is provided over
19 years.
The accrual for the costs of the disposal of low
level nuclear waste covers all cost of conditioning and
final storage of low level waste which is generated in
the operations of the facilities.
For all facilities in Germany, accruals for the costs
of nuclear fuel reprocessing, of nuclear plant decom-
missioning, and of the disposal of low level nuclear
waste are calculated using similar methods and also
include the costs for the permanent disposal of
radioactive waste.
Permanent disposal costs include investment,
operating, and financing costs for the permanent stor-
age facilities in Gorleben and Konrad and stem from
advance payment regulations for permanent storage
facilities and are based on data from German Federal
Office for Nuclear Safety (Bundesamt für Strahlen-
schutz). Each year the Company makes advance pay-
ments to the Bundesamt für Strahlenschutz commen-
surate with its growing information base.
Furthermore, in calculating the provisions for
nuclear waste management, the Company took into
account the effects of the nuclear energy consensus
agreement reached by the German government and
the country’s major energy utilities on June 14, 2000.
(2) Provisions for taxes mainly consist of corporate
income taxes, including the solidarity surcharge, trade
tax on income and foreign income taxes.
(3) Provisions for personnel expenses primarily cover
provisions for vacation pay, early retirement benefits,
anniversary obligations and other deferred personnel
costs.
(4) Provisions for outstanding trade invoices represent
the recognition of a liability for cost of products or
services received or rendered for which a related
invoice has not been received.
(5) Provisions for environmental remediation refer
primarily to land reclamation, rehabilitating contami-
nated sites, redevelopment and water protection
measures, borehole sealing, clearing mining fields and
recultivating landfills.
(6) Of the provisions for reclamation, 90 million
(1999: 90 million) is for potential damages arising
from former hardcoal mining activities and 85 million
(1999: 85 million) from lignite mining.
(7) Miscellaneous provisions cover other risks and
include provisions for tax related interest expense,
warranty and contract costs, demolition and disman-
tling and estimated future losses on open contracts.
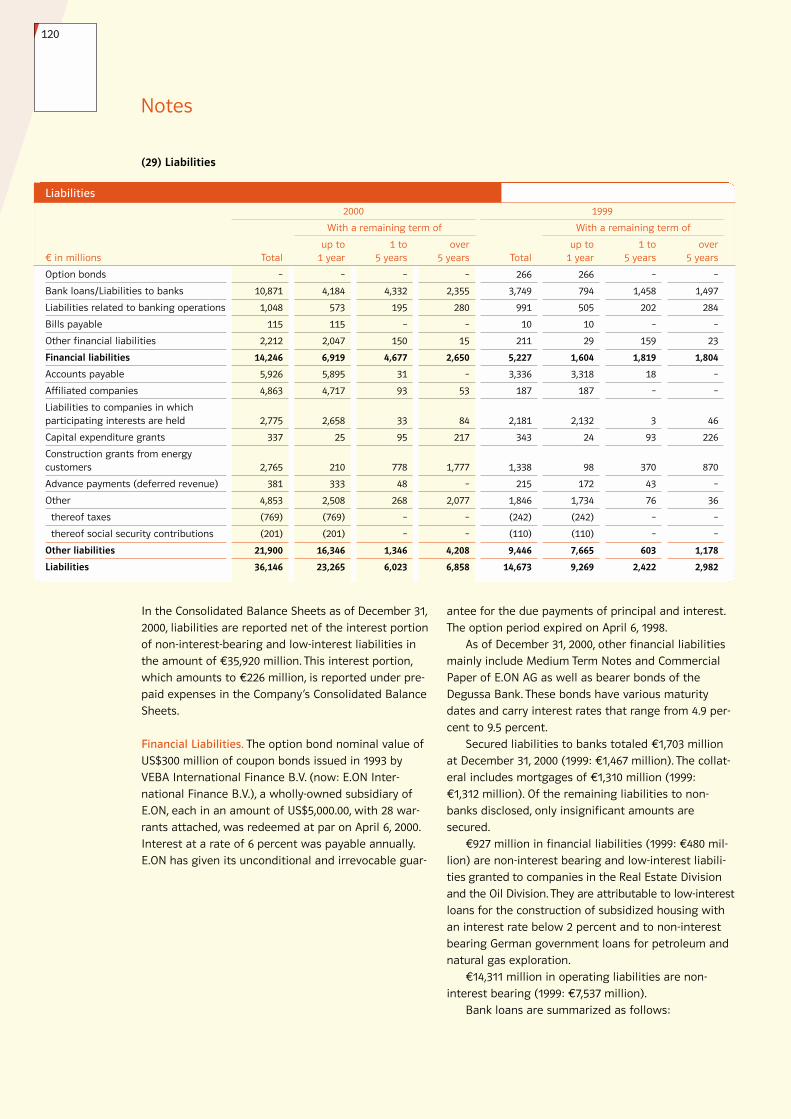
120
Notes
(29) Liabilities
In the Consolidated Balance Sheets as of December 31,
2000, liabilities are reported net of the interest portion
of non-interest-bearing and low-interest liabilities in
the amount of 35,920 million. This interest portion,
which amounts to 226 million, is reported under pre-
paid expenses in the Company’s Consolidated Balance
Sheets.
Financial Liabilities. The option bond nominal value of
US$300 million of coupon bonds issued in 1993 by
VEBA International Finance B.V. (now: E.ON Inter-
national Finance B.V.), a wholly-owned subsidiary of
E.ON, each in an amount of US$5,000.00, with 28 war-
rants attached, was redeemed at par on April 6, 2000.
Interest at a rate of 6 percent was payable annually.
E.ON has given its unconditional and irrevocable guar-
antee for the due payments of principal and interest.
The option period expired on April 6, 1998.
As of December 31, 2000, other financial liabilities
mainly include Medium Term Notes and Commercial
Paper of E.ON AG as well as bearer bonds of the
Degussa Bank. These bonds have various maturity
dates and carry interest rates that range from 4.9 per-
cent to 9.5 percent.
Secured liabilities to banks totaled 1,703 million
at December 31, 2000 (1999: 1,467 million). The collat-
eral includes mortgages of 1,310 million (1999:
1,312 million). Of the remaining liabilities to non-
banks disclosed, only insignificant amounts are
secured.
927 million in financial liabilities (1999: 480 mil-
lion) are non-interest bearing and low-interest liabili-
ties granted to companies in the Real Estate Division
and the Oil Division. They are attributable to low-interest
loans for the construction of subsidized housing with
an interest rate below 2 percent and to non-interest
bearing German government loans for petroleum and
natural gas exploration.
14,311 million in operating liabilities are non-
interest bearing (1999: 7,537 million).
Bank loans are summarized as follows:
1 to5 years
–
4,332
195
–
150
4,677
31
93
33
95
778
48
268
–
–
1,346
6,023
over5 years
–
2,355
280
–
15
2,650
–
53
84
217
1,777
–
2,077
–
–
4,208
6,858
Total
266
3,749
991
10
211
5,227
3,336
187
2,181
343
1,338
215
1,846
(242)
(110)
9,446
14,673
up to1 year
266
794
505
10
29
1,604
3,318
187
2,132
24
98
172
1,734
(242)
(110)
7,665
9,269
1 to5 years
–
1,458
202
–
159
1,819
18
–
3
93
370
43
76
–
–
603
2,422
over5 years
–
1,497
284
–
23
1,804
–
–
46
226
870
–
36
–
–
1,178
2,982
in millions
Option bonds
Bank loans/Liabilities to banks
Liabilities related to banking operations
Bills payable
Other financial liabilities
Financial liabilities
Accounts payable
Affiliated companies
Liabilities to companies in whichparticipating interests are held
Capital expenditure grants
Construction grants from energycustomers
Advance payments (deferred revenue)
Other
thereof taxes
thereof social security contributions
Other liabilities
Liabilities
Total
–
10,871
1,048
115
2,212
14,246
5,926
4,863
2,775
337
2,765
381
4,853
(769)
(201)
21,900
36,146
up to 1 year
–
4,184
573
115
2,047
6,919
5,895
4,717
2,658
25
210
333
2,508
(769)
(201)
16,346
23,265
2000
With a remaining term of
1999
With a remaining term of
Liabilities

121
Bank loans secured by mortgages on real estate
Bank loans secured by mortgages on real estate
Other secured bank loans
Unsecured bank loans, drawings on credit lines, short-term loans
339
1,032
332
9,168
10,871
inmillions Interest rate
0.5% – 7.5%
7.6% – 19.5%
0.5% – 19.5%
0.5% – 19.5%
Maturity
through 2040
through 2040
through 2040
through 2040
Interest rate
0.5% – 7.5%
7.6% – 19.5%
0.5% – 19.5%
0.5% – 19.5%
Maturity
through 2040
through 2040
through 2040
through 2040
449
825
193
2,282
3,749
2000 1999
Bank loans that bear interest below market rates have
been granted mainly to the Real Estate Division for
financing residential rental properties. Under this form
of financing, the Real Estate Division can only charge
rents that are below the prevailing market rates. Due
to these conditions, such loans appear at present value
on the balance sheet. The difference resulting from
discontinuation is reported under prepaid expenses
and released in subsequent years as rent. The interest
on the liabilities results in increased interest expenses.
Interest payments to banks amount to 293 mil-
lion (1999: 99 million).
As of December 31, 2000, bank loans have the
following maturities:
bank Offered Rate (LIBOR). In addition, a two-year,
1,022 million syndicated credit line facility with an
interest rate of up to 0.125 percentage point above
EURIBOR. The Company had utilized 400 million of
the syndicated credit line facility as of year-end 2000.
2 billion in Commercial Paper and 2 billion in
Medium Term Notes are also available to the Company
for financing purposes. As of the balance-sheet date,
1,896 million of the Commercial Paper and 106 mil-
lion of Medium Term Note programs had been utilized.
Other Liabilities. The figure shown under liabilities to
affiliated companies includes VR Telecommunications
GmbH & Co’s loans of roughly 4.5 billion, approxi-
mately 4.2 billion of which was transferred to VIAG
Telecom to finance VIAG Interkom’s acquisition of a
German UMTS license.
Capital expenditure grants of 337 million are paid
primarily by customers in the Electricity Division for
capital expenditures made on their behalf, while E.ON
retains the assets. The grants are non-refundable and
are recognized in other operating income based upon
the depreciable lives of the related asset.
Construction grants of 2,765 million are paid by
customers of the Electricity Division for costs of con-
nections according to the generally binding linkup
terms. The grants are non-refundable and are recog-
nized as sales according to the useful life.
in millions
2001
2002
2003
2004
2005
3,991
1,934
639
1,022
3,285
10,871
In addition to the drawings on credit lines shown
above, at year-end 2000 E.ON AG had committed and
available credit lines of 2,295 million at domestic and
foreign banks for financing purposes. These lines of
credit at domestic and foreign banks have maturities
of up to one year and variable interest rates up to
0.25 percent above the EURIBOR or the London Inter-
Bank loans
Bank loan maturities
inmillions

(30) Contingencies and Commitments
Contingent liabilities as listed below have not been
accrued as the risk of losses is not considered
probable.
Contingent liabilities also exist according to Sec. 24 of
the Private Limited Liability Companies Act (“GmbHG”)
for outstanding contributions of co-stockholders to the
capital of various companies. These relate to future
capital contributions required to be made by other co-
stockholders parties for which E.ON could be held
liable should the required co-stockholders fail to meet
its obligations.
Long-term Contractual Obligations. As of December 31,
2000, long-term contractual obligations related to
jointly operated power plants exist to purchase fixed
quantities of electricity from both affiliated companies
and other utilities. The purchase price of electricity
from jointly operated power plants is determined by
the supplier’s production cost plus a profit margin that
is generally calculated on the basis of an agreed
return on capital. Other utilities are primarily opera-
tors of wind-driven power plants to whom a regulated
remuneration at fixed minimum prices must be paid in
accordance with the Electricity Feed-In Law.
Long-term contractual obligations have also been
entered into by the Electricity Division in connection
with the reprocessing and storage of spent fuel ele-
ments. Respective prices are based on prevailing mar-
ket conditions.
Purchase commitments for the remaining term of
the aforementioned long-term contractual obligations
total 5,219 million and are as follows:
Notes
122
in millions
Contingent liabilities on bills of exchange
Contingent liabilities from guarantees
Contingent liabilities from warranties
Contingent liabilities from granting collateral on behalf of third parties
Other contingent liabilities
1999
6
389
99
129
22
645
2000
41
619
770
710
150
2,290
in millions
2001
2002
2003
2004
2005
Thereafter
571
504
460
443
426
2,815
5,219
There also exist additional customary long-term fuel
procurement contracts.
Contingencies
Purchase commitments
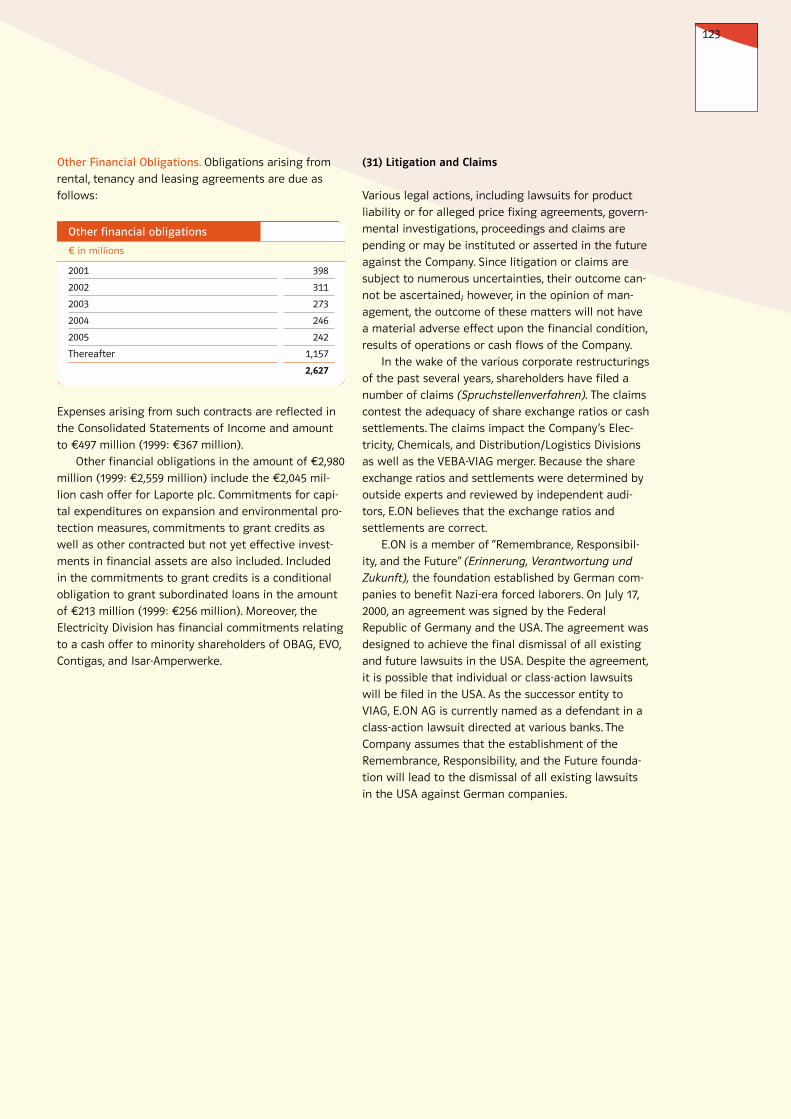
123
(31) Litigation and Claims
Various legal actions, including lawsuits for product
liability or for alleged price fixing agreements, govern-
mental investigations, proceedings and claims are
pending or may be instituted or asserted in the future
against the Company. Since litigation or claims are
subject to numerous uncertainties, their outcome can-
not be ascertained; however, in the opinion of man-
agement, the outcome of these matters will not have
a material adverse effect upon the financial condition,
results of operations or cash flows of the Company.
In the wake of the various corporate restructurings
of the past several years, shareholders have filed a
number of claims (Spruchstellenverfahren). The claims
contest the adequacy of share exchange ratios or cash
settlements. The claims impact the Company’s Elec-
tricity, Chemicals, and Distribution/Logistics Divisions
as well as the VEBA-VIAG merger. Because the share
exchange ratios and settlements were determined by
outside experts and reviewed by independent audi-
tors, E.ON believes that the exchange ratios and
settlements are correct.
E.ON is a member of “Remembrance, Responsibil-
ity, and the Future” (Erinnerung, Verantwortung und
Zukunft), the foundation established by German com-
panies to benefit Nazi-era forced laborers. On July 17,
2000, an agreement was signed by the Federal
Republic of Germany and the USA. The agreement was
designed to achieve the final dismissal of all existing
and future lawsuits in the USA. Despite the agreement,
it is possible that individual or class-action lawsuits
will be filed in the USA. As the successor entity to
VIAG, E.ON AG is currently named as a defendant in a
class-action lawsuit directed at various banks. The
Company assumes that the establishment of the
Remembrance, Responsibility, and the Future founda-
tion will lead to the dismissal of all existing lawsuits
in the USA against German companies.
in millions
2001
2002
2003
2004
2005
Thereafter
398
311
273
246
242
1,157
2,627
Expenses arising from such contracts are reflected in
the Consolidated Statements of Income and amount
to 497 million (1999: 367 million).
Other financial obligations in the amount of 2,980
million (1999: 2,559 million) include the 2,045 mil-
lion cash offer for Laporte plc. Commitments for capi-
tal expenditures on expansion and environmental pro-
tection measures, commitments to grant credits as
well as other contracted but not yet effective invest-
ments in financial assets are also included. Included
in the commitments to grant credits is a conditional
obligation to grant subordinated loans in the amount
of 213 million (1999: 256 million). Moreover, the
Electricity Division has financial commitments relating
to a cash offer to minority shareholders of OBAG, EVO,
Contigas, and Isar-Amperwerke.
Other Financial Obligations. Obligations arising from
rental, tenancy and leasing agreements are due as
follows:
Other financial obligations

124
Notes
(32) Supplemental Disclosure of Cash FlowInformation
The financing requirements for investments net of
disposals of 4,348 million (1999: 1,712 million) were
covered by cash from operations totaling 3,473 mil-
lion (1999: 3,255 million). The assumption of additional
debt was required to financing all activities. Cash used
for financing activities amounted to 1,943 million
(1999: 1,383 million). Liquid funds increased by 1,068
million (1999: 160 million) in the year under review.
Payments for acquisitions of subsidiaries during
the current year amount to 2,710 million (1999:
1,600 million). Liquid funds acquired herewith
amount to 238 million (1999: 3 million). These pur-
chases rendered assets amounting to 5,264 million
(1999: 1,969 million) as well as provisions and liabili-
ties totaling 2,749 million (1999: 577 million).
The deconsolidation of shareholdings and business
units resulting from divestments led to reductions of
7,239 million (1999: 972 million) related to assets
and 4,474 million (1999: 467 million) related to pro-
visions and liabilities. Liquid funds divested herewith
amounted to 212 million (1999: 8 million).
Liquid funds at MKC in the amount of 74 million
are subject to Korean government currency quotas.
in millions
Cash paid during the year for
Interest, net of amounts capitalized
Income taxes, net of refunds
Non-cash investing and financing activities
Merger of Degussa and Hüls
Merger of VEBA and VIAG
Contribution of Schmalbach-Lubeca for shares of AV Packaging
Disposal of shares of Orange Communication S.A.
Acquisition of minority interest in E.ON Energie
2000
257
2,789
–
9,271
290
1,077
612
1999
342
1,356
2,400
–
–
–
–
(33) Financial Instruments
a) Derivative Financial Instruments
During the normal course of operational business and
resulting financing activities, E.ON is exposed to
currency, interest rate, and commodity price risks. The
Company makes use of derivative financial instru-
ments to eliminate or limit these risks. Derivative
instruments held by the Company are used for hedg-
ing and not for trading purposes. For hedging pur-
poses, exclusive use is made of established and com-
monly used instruments with sufficient market
liquidity.
Currency and Interest Rate Derivatives. On the bal-
ance-sheet date, hedging transactions cover risks in
interest and exchange rates arising from transactions
that include recognized transactions, firm commit-
ments and anticipated deliveries, services, and other
business transactions (underlying transactions).
In line with E.ON’s hedging policy, in general macro-
hedging transactions can be completed for periods of
up to twelve months at a time to cover currency risks.
Macro-hedging transactions represent a number of
individual underlying transactions that have been
grouped together and hedged as an individual unit. As
of December 31, 2000, currency hedges were con-
ducted especially for the U.S. dollar, British pound, and
Japanese Yen.
Financial derivatives are also concluded in order to
realize time congruent hedging of interest rate risks.
Macro-hedging transactions can be concluded for
periods of up to five years to cover interest rate risks.
For micro-hedging purposes, any adequate term is
allowed for individual hedges of foreign exchange and
interest rates. However, these transactions must per-
fectly match the amounts and terms of the respective
Supplemental disclosure of cash flow information

underlying transactions in order to form hedge account-
ing. Once allocated, gains and losses from these valua-
tion units do not effect income until the underlying
transaction is realized.
The Company’s Corporate Treasury, which is
responsible for entering into derivative foreign ex-
change and interest rate contracts, acts as a service
center for the Company and not as a profit center.
With E.ON AG’s approval, the currency and interest
rate risks of Group companies are also hedged with
external parties. The Company is informed at regular
intervals about the scope of underlying and hedging
transactions via the EDP-based reporting and control-
ling system implemented throughout the Group.
The range of action, responsibilities, and financial
reporting procedures are outlined in detail in the
Company’s internal guidelines. The individual subgroup
headquarters have enacted for their responsible finan-
cial risk management own guidelines. To ensure effi-
cient risk management at E.ON AG, the Treasury, Back
Office, and Finance Controlling Departments are
organized as strictly separate units. Standard software
is employed in processing business transactions. The
Finance Controlling Department ensures continuous
and independent risk management. It prepares opera-
tional financial plans, calculates market-price and
counterparty risks, and evaluates financial transac-
tions. The Finance Controlling Department reports at
regular intervals on the Group’s market-price and
counterparty risks. Those Group’s subsidiaries which
make use of external hedging transactions have
similar organizational arrangements.
A computerized reporting and controlling system
for treasury activities has been developed and imple-
mented throughout the Company. This allows for the
systematic and consistent detection and analysis of
all the Company’s overall financial and market risks in
the area of currencies and interest rates. The system
is also used to determine, analyze, and monitor the
Company’s short- and long-term financing and invest-
ment requirements. In addition, the deployed systems
guarantee continuous and up-to-date analysis of
market and counterparty risks ensuing from concluded
short- and long-term deposits and hedging trans-
actions.
Currency and Interest Rate Market Risks. With respect
to derivatives, market risks contain the positive and
negative changes in net asset value that result from
price fluctuations on various financial markets. The
market values of derivative financial instruments are
calculated by comparing all relevant price components
of a transaction at the time of the deal with those
prevailing on the valuation date. In line with interna-
tional banking standards, market risk has been calcu-
lated with the value-at-risk method on the basis of the
RiskMetrics data and risk management software of
RiskMetrics Group. The maximum potential loss within
the following business day from derivative positions
that are not covered by booked and pending transac-
tions is calculated based on empirical standard devia-
tions and using a confidence interval of 99 percent.
Correlations between individual instruments within
a single currency are accounted for; the risk of a port-
folio is generally lower than the sum of its individual
risks. For the foreign exchange and interest rate deriva-
tives correlations between instruments and currencies
are recognized.
As a means of monitoring market risks, including
those cases with extreme market price fluctuations,
a stress test is performed on derivative positions at
regular intervals and in line with the recommendations
issued by the Bank for International Settlements (BIS).
Financial derivatives by transaction and maturity as
of December 31, 2000, are listed in the table on the
next page.
125
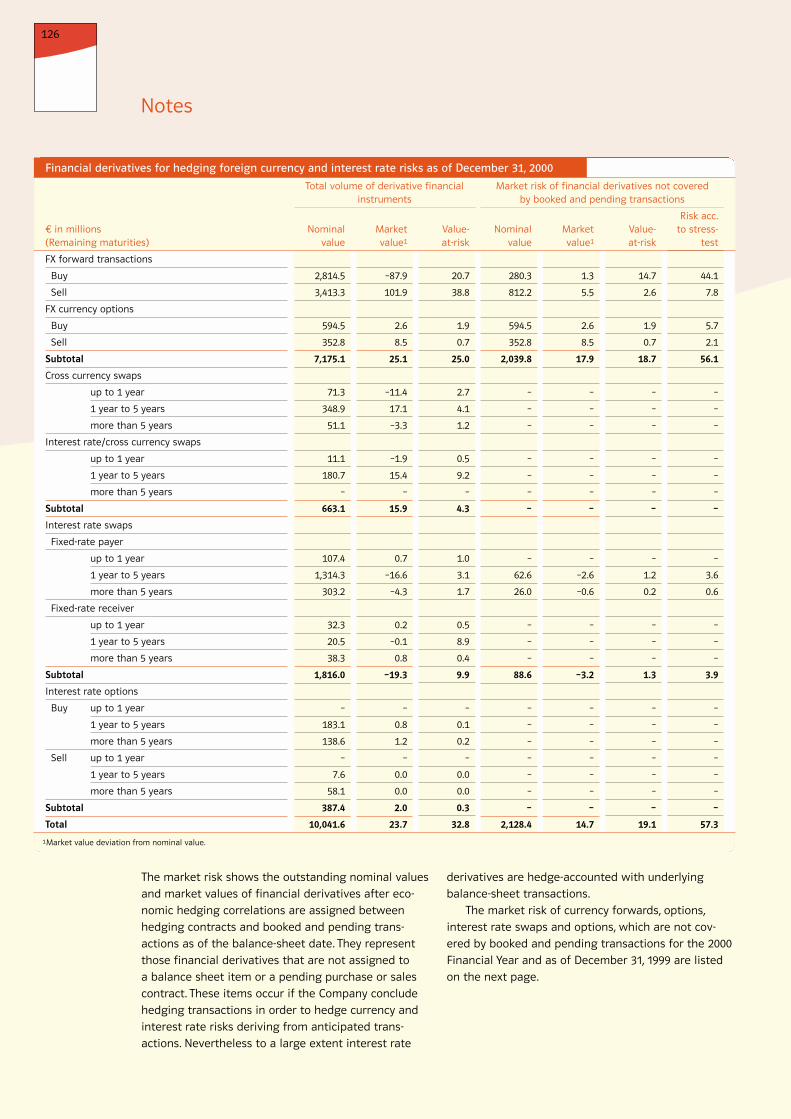
126
Notes
Value-at-risk
20.7
38.8
1.9
0.7
25.0
2.7
4.1
1.2
0.5
9.2
–
4.3
1.0
3.1
1.7
0.5
8.9
0.4
9.9
–
0.1
0.2
–
0.0
0.0
0.3
32.8
Nominalvalue
280.3
812.2
594.5
352.8
2,039.8
–
–
–
–
–
–
–
–
62.6
26.0
–
–
–
88.6
–
–
–
–
–
–
–
2,128.4
Marketvalue1
1.3
5.5
2.6
8.5
17.9
–
–
–
–
–
–
–
–
–2.6
–0.6
–
–
–
–3.2
–
–
–
–
–
–
–
14.7
Value-at-risk
14.7
2.6
1.9
0.7
18.7
–
–
–
–
–
–
–
–
1.2
0.2
–
–
–
1.3
–
–
–
–
–
–
–
19.1
Risk acc.to stress-
test
44.1
7.8
5.7
2.1
56.1
–
–
–
–
–
–
–
–
3.6
0.6
–
–
–
3.9
–
–
–
–
–
–
–
57.3
in millions(Remaining maturities)
FX forward transactions
Buy
Sell
FX currency options
Buy
Sell
Subtotal
Cross currency swaps
up to 1 year
1 year to 5 years
more than 5 years
Interest rate/cross currency swaps
up to 1 year
1 year to 5 years
more than 5 years
Subtotal
Interest rate swaps
Fixed-rate payer
up to 1 year
1 year to 5 years
more than 5 years
Fixed-rate receiver
up to 1 year
1 year to 5 years
more than 5 years
Subtotal
Interest rate options
Buy up to 1 year
1 year to 5 years
more than 5 years
Sell up to 1 year
1 year to 5 years
more than 5 years
Subtotal
Total
Nominalvalue
2,814.5
3,413.3
594.5
352.8
7,175.1
71.3
348.9
51.1
11.1
180.7
–
663.1
107.4
1,314.3
303.2
32.3
20.5
38.3
1,816.0
–
183.1
138.6
–
7.6
58.1
387.4
10,041.6
Marketvalue1
–87.9
101.9
2.6
8.5
25.1
–11.4
17.1
–3.3
–1.9
15.4
–
15.9
0.7
–16.6
–4.3
0.2
–0.1
0.8
–19.3
–
0.8
1.2
–
0.0
0.0
2.0
23.7
Total volume of derivative financialinstruments
Market risk of financial derivatives not covered by booked and pending transactions
1Market value deviation from nominal value.
The market risk shows the outstanding nominal values
and market values of financial derivatives after eco-
nomic hedging correlations are assigned between
hedging contracts and booked and pending trans-
actions as of the balance-sheet date. They represent
those financial derivatives that are not assigned to
a balance sheet item or a pending purchase or sales
contract. These items occur if the Company conclude
hedging transactions in order to hedge currency and
interest rate risks deriving from anticipated trans-
actions. Nevertheless to a large extent interest rate
derivatives are hedge-accounted with underlying
balance-sheet transactions.
The market risk of currency forwards, options,
interest rate swaps and options, which are not cov-
ered by booked and pending transactions for the 2000
Financial Year and as of December 31, 1999 are listed
on the next page.
Financial derivatives for hedging foreign currency and interest rate risks as of December 31, 2000

127
The increase of the nominal value in financial deriva-
tives essentially arises from the merger between VEBA
and VIAG as per July 1, 2000.
A sensitivity analysis was performed on the Group’s
short- and long-term capital investments and borrow-
ings including interest rate derivatives. For instance,
a 100 basis-point shift in the interest rate structure
curve would change the interest rate portfolio’s market
value by 126 million (1999: 76 million) on the balance
sheet date. The market risk according to the value-at-
risk model amounts to 97 million (1999: 44 million).
Other equity interests and securities are also based
on market prices. A 10 percent potential change in
the market value of these assets would amount to
563 million (1999: 325 million).
Value-at-risk
21.2
3.9
0.7
0.6
25.0
–
1.7
0.5
2.1
27.1
Nominalvalue
533.6
563.7
9.4
300.0
1,406.7
–
5.1
36.2
41.3
1,448.0
Marketvalue1
9.8
4.9
0.0
–4.1
10.6
–
–0.2
1.0
0.8
11.4
Value-at-risk
5.7
4.7
0.7
–
10.8
–
–
0.4
0.4
10.9
in millions(Remaining maturities)
FX forward transactions
Buy
Sell
FY currency options
Buy
Sell
Subtotal
Interest rate swaps
Fixed-rate payer
up to 1 year
1 year to 5 years
more than 5 years
Subtotal
Total
Nominalvalue
1,007.8
774.8
325.1
214.9
2,322.6
–
57.8
26.7
84.5
2,407.1
Marketvalue1
57.8
–46.8
2.2
2.6
15.8
–
–2.6
0.2
–2.4
13.4
September 30, 2000 June 30, 2000
Value-at-risk
2.9
6.8
0.1
1.0
8.9
0.0
0.4
0.0
0.4
9.0
Nominalvalue
185.2
327.2
23.1
48.7
584.2
35.7
72.9
19.9
128.5
712.7
Marketvalue1
8.3
–0.1
–0.4
–0.9
6.9
0.0
1.1
1.1
2.2
9.1
Value-at-risk
1.9
4.6
0.0
0.1
6.2
0.0
0.3
0.1
0.4
6.6
Nominalvalue
765.8
582.2
14.5
327.7
1,690.2
2.5
5.1
36.2
43.8
1,734.0
Marketvalue1
35.8
–16.9
0.0
0.2
19.1
0.0
–0.3
0.9
0.6
19.7
March 31, 2000 December 31, 1999
Market risk of financial derivatives not covered by booked and pendingtransactions during financial year 2000 and as of Dec. 31, 1999
1Market value deviation from nominal value.
Market risk of financial derivatives not covered by booked and pending transactions during
Financial Year 2000 and as of December 31, 1999
in millions(Remaining maturities)
FX forward transactions
Buy
Sell
FY currency options
Buy
Sell
Subtotal
Interest rate swaps
Fixed-rate payer
up to 1 year
1 year to 5 years
more than 5 years
Subtotal
Total

128
Commodity Derivatives. Furthermore, the businesses
of certain subsidiaries are exposed to risks resulting
from fluctuations in the prices of raw materials and
commodities. Hedging transactions of notable scope
are only concluded in the Oil and Aluminum Division
as well as precious metals trading. Electricity and
gas price hedges were also used to a limited extent in
2000. The counterparties to these transactions are
financial institutions, broker and trading companies
that satisfy E.ON’s credit rating criteria.
Hedging transactions involving oil-related deriva-
tives cover the risk of fluctuating prices for crude oil
and petroleum products arising from production, re-
fining, and distribution. Pursuant to the guidelines of
the divisions affected, macro-hedging transactions can
be concluded to cover volumes representing an equiv-
alent of up to a full year of production. In certain cases,
it is permissible to conclude appropriate forward
transactions to hedge longer-term underlying trans-
actions. Congruent derivatives can be used to hedge
open positions in oil or oil-product trading on a case
by case basis. These items have individual volumes
with short terms and are directly related to the under-
lying transaction. In order to meet the criteria for
hedge accounting under SFAS 133 in the future crack
swaps were split into crude oil and product swaps.
These transactions lead to a considerable increase in
nominal value, without changing the net position.
In order to hedge fluctuating prices and margins in
the aluminum market arising from production and
marketing, the Aluminum Division concluded hedging
transactions.
For gold, silver, and other precious metals, derivatives
are used to hedge price risks resulting from the prod-
uct and processing businesses. Over-the-counter hedg-
ing transactions are utilized in addition to metals
transactions at commodity exchanges. An insignificant
volume of the hedge instruments in metals is con-
tracted, in order to use expected price fluctuations.
The hedging transactions in the Electricity Division
are used to hedge electricity and gas price fluctua-
tions and enable the Company to better coordinate
power generating capacities and delivery agreements.
Notes

129
Nominalvalue
90.2
–
176.4
40.0
306.6
161.6
9.4
171.0
37.1
–
141.8
172.8
351.7
43.9
–
18.7
–
62.6
891.9
265.5
–
183.6
5.1
454.2
382.6
66.8
542.3
329.7
1,321.4
–
–
–
–
–
1,775.6
Marketvalue1
–4.6
–
–40.6
–9.9
–55.1
–30.9
–2.2
–33.1
4.5
–
–3.5
–5.7
–4.7
0.8
–
–0.5
–
0.3
–92.6
–0.2
–
–8.4
0.3
–8.3
26.5
1.3
77.3
39.3
144.4
–
–
–
–
–
136.1
Nominalvalue
55.4
–
193.9
36.7
286.0
129.3
0.7
130.0
56.6
–
96.7
171.3
324.6
37.2
–
29.7
–
66.9
807.5
207.7
–
153.9
5.3
366.9
–
–
–
–
–
–
–
–
–
–
366.9
Marketvalue1
7.5
–
–63.4
–4.2
–60.1
–24.1
0.6
–23.5
6.8
–
–5.0
–6.7
–4.9
6.8
–
–2.3
–
4.5
–84.0
8.5
–
–17.5
–0.4
–9.4
–
–
–
–
–
–
–
–
–
–
–9.4
Nominalvalue
76.2
–
234.0
–
310.2
154.3
–
154.3
–
–
–
–
–
87.7
–
103.5
–
191.2
655.7
146.4
–
159.2
–
305.6
–
–
–
–
–
–
–
–
–
–
305.6
Marketvalue1
–1.0
–
–43.9
–
–44.9
–12.9
–
–12.9
–
–
–
–
–
–1.5
–
–0.9
–
–2.4
–60.2
3.0
–
–18.1
–
–15.1
–
–
–
–
–
–
–
–
–
–
–15.1
Nominalvalue
33.2
–
188.2
–
221.4
220.3
11.0
231.3
–
–
–
–
–
15.2
–
52.9
–
68.1
520.8
128.0
–
56.7
2.5
187.2
–
–
–
–
–
0.5
–
3.0
–
3.5
190.7
Marketvalue1
3.4
–
–20.8
–
–17.4
–5.2
1.5
–3.7
–
–
–
–
–
0.1
–
–0.5
–
–0.4
–21.5
5.2
–
–10.3
0.2
–4.9
–
–
–
–
–
–
–
–
–
–
–4.9
in millions(Remaining maturities)
Crude oil swaps
Buy up to 1 year
more than 1 year
Sell up to 1 year
more than 1 year
Subtotal
Refinery margin and petroleumproduct swaps
up to 1 year
more than 1 year
Subtotal
Crude oil options
Buy up to 1 year
more than 1 year
Sell up to 1 year
more than 1 year
Subtotal
Exchange traded oil future contracts
Buy up to 1 year
more than 1 year
Sell up to 1 year
more than 1 year
Subtotal
Total oil-related financial derivatives
OTC precious metal future contracts
Buy up to 1 year
more than 1 year
Sell up to 1 year
more than 1 year
Subtotal
Aluminum future contracts
Buy up to 1 year
more than 1 year
Sell up to 1 year
more than 1 year
Subtotal
Precious metal options
Buy up to 1 year
more than 1 year
Sell up to 1 year
more than 1 year
Subtotal
Carryover
Nominalvalue
293.5
–
159.8
25.6
478.9
424.3
151.3
575.6
41.9
–
136.9
136.7
315.5
4.3
–
20.2
5.6
30.1
1,400.1
282.7
–
213.8
5.7
502.2
524.6
59.8
589.5
274.5
1,448.4
–
–
–
–
–
1,950.6
Marketvalue1
–31.7
–
12.6
–4.7
–23.8
20.5
18.0
38.5
–0.1
–
4.3
–2.5
1.7
–0.2
–
0.6
–0.2
0.2
16.6
17.6
–
–22.0
0.4
–4.0
–13.5
–0.3
–28.4
–12.4
–54.6
–
–
–
–
–
–58.6
Dec. 31, 2000 Sep. 30, 2000 June 30, 2000 March 31, 2000 Dec. 31, 1999
1Market value deviation from nominal value.
Total volume of oil-, metal-, gas- and electricity-related financial derivatives during the
2000 Financial Year and as of December 31, 1999
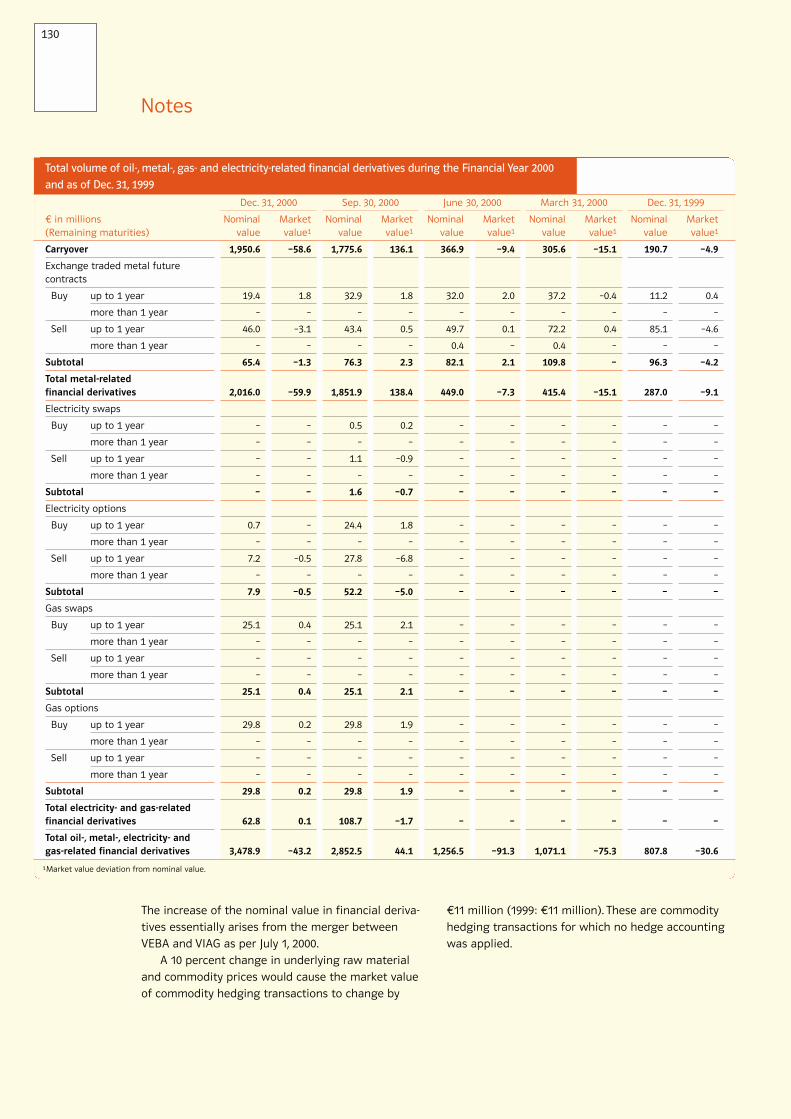
130
Notes
Nominalvalue
1,775.6
32.9
–
43.4
–
76.3
1,851.9
0.5
–
1.1
–
1.6
24.4
–
27.8
–
52.2
25.1
–
–
–
25.1
29.8
–
–
–
29.8
108.7
2,852.5
Marketvalue1
136.1
1.8
–
0.5
–
2.3
138.4
0.2
–
–0.9
–
–0.7
1.8
–
–6.8
–
–5.0
2.1
–
–
–
2.1
1.9
–
–
–
1.9
–1.7
44.1
Nominalvalue
366.9
32.0
–
49.7
0.4
82.1
449.0
–
–
–
–
–
–
–
–
–
–
–
–
–
–
–
–
–
–
–
–
–
1,256.5
Marketvalue1
–9.4
2.0
–
0.1
–
2.1
–7.3
–
–
–
–
–
–
–
–
–
–
–
–
–
–
–
–
–
–
–
–
–
–91.3
Nominalvalue
305.6
37.2
–
72.2
0.4
109.8
415.4
–
–
–
–
–
–
–
–
–
–
–
–
–
–
–
–
–
–
–
–
–
1,071.1
Marketvalue1
–15.1
–0.4
–
0.4
–
–
–15.1
–
–
–
–
–
–
–
–
–
–
–
–
–
–
–
–
–
–
–
–
–
–75.3
Nominalvalue
190.7
11.2
–
85.1
–
96.3
287.0
–
–
–
–
–
–
–
–
–
–
–
–
–
–
–
–
–
–
–
–
–
807.8
Marketvalue1
–4.9
0.4
–
–4.6
–
–4.2
–9.1
–
–
–
–
–
–
–
–
–
–
–
–
–
–
–
–
–
–
–
–
–
–30.6
in millions(Remaining maturities)
Carryover
Exchange traded metal futurecontracts
Buy up to 1 year
more than 1 year
Sell up to 1 year
more than 1 year
Subtotal
Total metal-related financial derivatives
Electricity swaps
Buy up to 1 year
more than 1 year
Sell up to 1 year
more than 1 year
Subtotal
Electricity options
Buy up to 1 year
more than 1 year
Sell up to 1 year
more than 1 year
Subtotal
Gas swaps
Buy up to 1 year
more than 1 year
Sell up to 1 year
more than 1 year
Subtotal
Gas options
Buy up to 1 year
more than 1 year
Sell up to 1 year
more than 1 year
Subtotal
Total electricity- and gas-relatedfinancial derivatives
Total oil-, metal-, electricity- and gas-related financial derivatives
Nominalvalue
1,950.6
19.4
–
46.0
–
65.4
2,016.0
–
–
–
–
–
0.7
–
7.2
–
7.9
25.1
–
–
–
25.1
29.8
–
–
–
29.8
62.8
3,478.9
Marketvalue1
–58.6
1.8
–
–3.1
–
–1.3
–59.9
–
–
–
–
–
–
–
–0.5
–
–0.5
0.4
–
–
–
0.4
0.2
–
–
–
0.2
0.1
–43.2
Dec. 31, 2000 Sep. 30, 2000 June 30, 2000 March 31, 2000 Dec. 31, 1999
1Market value deviation from nominal value.
The increase of the nominal value in financial deriva-
tives essentially arises from the merger between
VEBA and VIAG as per July 1, 2000.
A 10 percent change in underlying raw material
and commodity prices would cause the market value
of commodity hedging transactions to change by
11 million (1999: 11 million). These are commodity
hedging transactions for which no hedge accounting
was applied.
Total volume of oil-, metal-, gas- and electricity-related financial derivatives during the Financial Year 2000
and as of Dec. 31, 1999

131
Counterparty Risk from the use of Derivative Financial
Instruments. Counterparty risk addresses potential
losses that may arise from the non-fulfillment of con-
tractual obligations by individual counterparties. With
respect to derivative transactions, during lifetime
counterparty risk is restricted to the replacement cost
incurred by covering the open position should a coun-
terparty default. Only transactions with a positive mar-
ket value for E.ON are exposed to this risk. Exchange
traded oil and metal future contracts with a nominal
value of 95.5 million as of December 31, 2000 (1999:
164.4 million) bear no counterparty risk. Derivative
transactions are generally executed on the basis of
standard agreements that allow all outstanding trans-
actions with contracting partners to be offset. The
netting of transactions with positive and negative out-
standing market values is not considered in the table
below. Qualified counterparties only include financial
institutions, broker and metal trading companies that
satisfy E.ON’s credit criteria. The Divisions involved in
oil-, metal-, gas- and electricity-related derivatives also
perform thorough credit checks and monitor credit-
worthiness on an ongoing basis. In general, collateral
for derivative transactions is neither provided nor
received.
In summary, derivatives had the following lifetime
and credit structure as of December 31, 2000:
Nominalvalue
711.2
4,295.8
2,335.6
1,933.6
9,276.2
Counter-party
risk
14.3
86.4
86.9
40.7
228.3
Nominalvalue
492.8
1,356.4
996.8
713.5
3,559.5
Counter-party
risk
5.9
38.9
42.5
15.0
102.3
Nominalvalue
156.9
232.1
145.9
54.4
589.3
Counter-party
risk
1.1
2.4
0.4
0.4
4.3
Standard & Poor’s and/or Moody’s
in millions
AAA and Aaa
AA+ and Aaa or AAA and Aa1 through AA- and Aa3
AA- and A1 or A+ and Aa3 through A or A2
Other
Total
Nominalvalue
1,360.9
5,884.3
3,478.3
2,701.5
13,425.0
Counter-party
risk
21.3
127.7
129.8
56.1
334.9
Total up to 1 year 1 to 5 years more than 5 years
in millions
Financial instruments (otherthan derivative instruments)
Assets:
Loans
Securities
Cash and cash equivalents
Other
Liabilities:
Financial liablities
Carrying amount
2,518
2,222
1,566
611
5,227
Carryingamount
2,948
8,189
1,201
630
14,047
Fairvalue
2,545
2,580
1,566
611
5,119
Fairvalue
3,014
9,132
1,201
630
13,998
As of Dec. 31, 2000 As of Dec. 31, 1999
b) Non Derivative Financial Instruments
The estimated fair-value amounts have been deter-
mined using available market information and appro-
priate valuation methodologies. However, considerable
judgement is required in interpreting market data to
develop estimates of fair value. Accordingly, the esti-
mates presented herein are not necessarily indicative
of the amounts that the Company would realize under
current market conditions.
The estimated fair value of financial instruments
at December 31, 2000 and 1999, is summarized.
Market values
Rating of counterparties
The increase of the nominal value in non derivative
financial instruments essentially arises from the merg-
er between VEBA and VIAG as per July 1, 2000.
The following methods and assumptions were
used to estimate the fair value of each class of finan-
cial instruments for which it is practicable to estimate
that value:
For cash and cash equivalents the carrying value of
these amounts is a reasonable estimate of their fair
value. The fair value of loans and other financial instru-
ments is valued by discounting the future cash flows
by using the current rate for comparable instruments.
The fair value of funds and non-marketable securities
is based on quoted market prices of the investments
or other appropriate valuation techniques.
Fair values for financial liabilities were estimated
by discounting expected cash flows using market
interest rates currently available for debt of similar
terms and remaining maturities. The carrying value of
commercial paper, medium term notes and borrowings
under revolving credit facilities were assumed to
approximate fair value due to their short maturities.
The Company believes the overall credit risk re-
lated to non derivative financial instruments is insig-
nificant.
(34) Segment Information
The Company’s reportable segments are presented in
line with the Company’s internal organizational and
reporting structure based on products and services.
The segments are managed separately because each
business develops, manufactures, and sells distinct
products and services. The reportable segments are
Electricity, Oil, Chemicals, Real Estate, Telecommuni-
cations, Distribution/Logistics, Aluminum and Silicon
Wafers. The column “Other/Consolidation” includes the
holding company, AV Packaging GmbH (Schmalbach-
Lubeca), which is accounted for under the equity
method, and effects from consolidation.
Below is information on the Company’s business seg-
ments.
Electricity consists of E.ON Energie AG, which was
formed on July 13, 2000, by the PreussenElektra-
Bayernwerk merger. E.ON Energie supplies electricity,
district heating, natural gas, water, and water-related
services.
VEBA Oel manages the Company’s oil, gas, and
petrochemicals operations. VEBA Oel’s core business
consists of the exploration for and production of
hydrocarbons, refining of crude oil, production of
petrochemicals and the marketing of petroleum prod-
ucts and petrochemicals.
The Chemicals Division comprises Degussa-Hüls AG
and SKW Trostberg AG. Both are specialty chemicals
companies. On February 9, 2001 the two companies
merged to form Degussa AG.
Real Estate consists of Viterra, a real-estate services
group. Viterra has four strategic business units: Resi-
dential Investment, Residential Development, Residen-
tial Services, and Commercial.
The Company’s telecommunications activities are
overseen by two holding companies: E.ON Telecom
(formerly VEBA Telecom) and VIAG Telecom Beteili-
gungs GmbH. In August 2000, E.ON concluded an
option agreement with British Telecommunications
plc. (BT). The agreement grants VIAG Telecom Beteili-
gungs GmbH a put option, and BT a call option, on
the shareholding in VIAG Interkom in 2001.
Notes
132

The Company’s distribution and logistics operations
are organized in three holding companies: Stinnes,
Klöckner AG, and (until September 30, 2000) VEBA
Electronics. Stinnes provides logistics services in the
following areas: Transportation, Chemicals, Raw
Materials, Steel, and Full-line Wholesaling. Klöckner is
a leading multi-metal distributor. VEBA Electronics is
a distributor of electronic components.
The Company’s Aluminum Division consists of VAW
aluminium AG, a leading aluminum manufacturer and
processor for the packaging, automotive, and construc-
tion industries. VAW has four divisions: Primary
Materials, Rolled Products, Automotive Products, and
Flexible Packaging.
MEMC manages the Group’s silicon wafer opera-
tions. MEMC is one of the world’s premier manufactur-
ers of silicon wafers used in the manufacture of semi-
conductors.
Other includes E.ON AG, shareholders not assigned
to a segment, and consolidation effects.
Internal operating profit is the most important
internal key figure at E.ON in terms of earnings and
serves as an indicator of a business’s long-term earn-
ings power. Internal operating profit is adjusted
income from operations (after foreign taxes related to
exploration and production). Income from operations
for a certain reporting period corresponds to pretax
income as reported in the Consolidated Income
Statement for that period. Pretax income is adjusted
primarily to exclude material non-operating income
and expenses which are unusual (as defined by E.ON)
or infrequent. These adjustments primarily include
book gains and losses from large divestments and
restructuring expenses.
Depreciation of fixed assets, income from compa-
nies accounted for under the equity method, and
interest income have been adjusted to exclude non-
operating expenses and income and may therefore
deviate from earnings reported in the Consolidated
Statement of Income.
To serve internal management and control purposes,
interest income is adjusted using economic criteria. In
particular, the interest portion of additions to provi-
sions for pensions resulting from personnel expenses
is allocated to interest income. The interest portions
of the allocations of other long-term provisions are
treated analogously to the degree that they are
reported on different lines of the Consolidated Income
Statement.
The individual reporting segments apply the
accounting standards listed under Note (2). Internal
sales are valued at market prices.
Reconciliation of internal operating profit to
income before income taxes is as follows:
133
in millions
Internal operating profit
Net book gains (a)
Restructuring expenses/cost management programs (b)
Other non-operating earnings (c)
Foreign exploration and production income taxes (d)
Income before income taxes
2000
2,396
4,636
–510
–523
552
6,551
1999
2,072
2,337
–402
92
301
4,400
Segment information

(a) Net book gains in the reporting period primarily
comprise gains from the disposal of the shareholdings
in E-Plus (approximately 3.5 billion) and in Cablecom,
the Swiss cable-TV company (approximately 0.8 bil-
lion).
(b) Restructuring and cost-management expenses
were incurred by the Chemicals Division in the amount
of approximately 180 million, by the Electricity
Division in the amount of approximately 160 million,
and by the Oil Division in the amount of approximately
120 million stemming from its realignment.
(c) Other non-operating earnings in 2000 include ex-
penses related to the disposal of shareholdings required
by antitrust authorities (approximately 350 million)
as well as the costs of the VEBA-VIAG merger and the
mergers in the Chemicals and Electricity Divisions
(approximately 200 million).
(d) Due to the high tax burden, pre-tax income in
VEBA Oel’s upstream sector is not of great signifi-
cance. Internal operating profit for the Oil Division is
therefore stated net of foreign exploration and pro-
duction income taxes; this procedure deviates from
the method applied to determine internal operating
profit in other segments. These taxes must be added
back when reconciling from internal operating profit
to pretax income.
Notes
134
()
in millions
External sales1
Intersegment sales
Total sales
Depreciation, amortization and write-downs
Earnings from companies accounted for under the equity method
Interest income
Interest expense
Internal operating profit
Capital expenditures
Companies accounted for under theequity method
Other financial assets
Other fixed assets
Total capital expenditures
Total assets
2000
1999
2000
1999
2000
1999
2000
1999
2000
1999
2000
1999
2000
1999
2000
1999
2000
1999
2000
1999
2000
1999
2000
1999
2000
1999
Elec-tricity
10,977
7,719
50
49
11,027
7,768
1,615
1,134
109
418
497
314
460
390
1,099
1,370
458
273
2,057
483
841
593
3,356
1,349
57,244
24,834
Oil
28,062
11,778
718
451
28,780
12,229
632
260
38
–3
15
18
183
33
310
34
–
–
1,111
907
612
401
1,723
1,308
9,178
5,489
Chemi-cals
18,072
12,242
126
78
18,198
12,320
1,061
843
21
20
133
87
401
258
576
275
48
12
583
337
1,044
949
1,675
1,298
19,158
12,674
RealEstate
1,300
1,145
24
22
1,324
1,167
134
134
2
10
15
5
88
–78
212
189
2
52
83
112
399
169
484
333
4,074
3,399
Tele-com-
muni-cation
228
108
1
3
229
111
259
158
–86
–196
130
47
107
15
–156
–150
386
43
3,895
101
310
27
4,591
171
12,711
1,024
Distri-bution/
Logis-tics
20,838
16,872
47
48
20,885
16,920
316
319
9
10
34
24
213
188
384
276
8
1
356
445
298
295
662
741
8,727
8,033
Alumi-num
1,760
–
17
–
1,777
–
58
–
11
–
7
–
22
–
96
–
1
–
313
–
119
–
433
–
2,915
–
SiliconWafers
944
651
–
–
944
651
187
147
16
–11
5
2
99
74
–68
–219
16
–
–12
11
62
49
66
60
2,050
1,816
802
–
–983
–651
–181
–651
185
–
–72
63
–19
–70
40
102
–57
297
19
–
392
1,714
74
43
485
1,757
–9,842
–1,050
Holding/Others Total
82,983
50,515
–
–
82,983
50,515
4,447
2,995
48
311
817
427
1,613
982
2,396
2,072
938
381
8,778
4,110
3,759
2,526
13,475
7,017
106,215
56,219
Segment information by division
1External sales include petroleum and electricity taxes of 8,935 million (1999: 3,942 million).

135
Geographic Segmentation. The table above details
external sales (by destination and by operation) and
internal operating profit and long-lived assets infor-
mation by geographic area for the years ended
December 31.
Information on Major Customers. Excluding Germany,
E.ON’s customer structure did not result in any major
concentration in any given geographical region or
business area. Due to the high volume of customers
and the variety of business activities, there are no cus-
tomers whose business volume is material compared
to the Company’s total business volume.
in millions
External sales
By destination
By operation
Internal operating profit
Long-lived assets
2000
1999
2000
1999
2000
1999
2000
1999
Germany
42,050
25,594
48,093
30,988
1,551
1,675
19,450
13,833
Europe(eurozoneexcludingGermany)
11,458
6,253
8,958
4,819
290
49
3,383
700
Europe(other)
8,402
5,677
8,562
2,476
209
142
1,415
1,234
USA
12,544
8,296
11,132
7,755
–14
71
2,779
1,963
Others
8,529
4,695
6,238
4,477
360
135
1,817
1,060
Total
82,983
50,515
82,983
50,515
2,396
2,072
28,844
18,790
Geographic segment information

136
Notes
In million of euros or million of shares,except earnings per share
Numerator: Net income
Denominator:Weighted-average number of shares outstanding, basic
Dilutive effect of convertible bonds and notes
Shares issued on exercise of dilutive options
Shares purchased with proceeds of options
Weighted-average number of shares outstanding, diluted
Earnings per share
Basic
Diluted
1999
2,991
503
–
–
–
503
5.95
5.95
2000
3,570
621
–
–
–
621
5.75
5.75
(35) Supervisory Board and Board of Management
Provided that the Annual Stockholders’ Meeting of
E.ON on May 18, 2001 approves the proposed dividend,
total remuneration of the members of the Supervisory
Board will amount to 2.8 million (1999: 1.8 million)
and those of the members of the Board of Manage-
ment, including compensation for the performance of
duties at subsidiaries, will amount to 13.0 million
(1999: 9.6 million).
Total payments to retired members of the Board
of Management and their beneficiaries amounted to
8.1 million (1999: 7.4 million).
Provisions of 66.1 million (1999: 39.5 million) have
been provided for the pension obligations of E.ON to
retired members of the E.ON Board of Management
and their beneficiaries.
As of December 31, 2000 and 1999, no loans to
members of the Board of Management exist.
The members of the Supervisory Board and the
Board of Management are listed on pages 4, 8 and 9.
(36) Earnings per Share
The computation of basic and diluted earnings per
share for net income is as follows.
Earnings per share
137
in the amount of 4.1 billion. Since the interest in
VIAG Interkom was stated at fair value due to the
merger of VEBA and VIAG, the gain from sale in 2001
will be immaterial.
In January 2001 E.ON Energie AG raised its stake in
Malmö-based Sydkraft AG, the Swedish energy utility.
E.ON Energie increased its share of Sydkraft’s capital
stock by 5.3 percent for a total of 29.4 percent. It
increased its share of the Swedish company’s voting
rights by 8.5 percent for a total of 42.8 percent. The
purchase price was 272 million. On February 21, 2001
E.ON Energie extended a public tender offer for the
remaining Sydkraft shares.
Düsseldorf, March 12, 2001
The Board of Management
(37) Subsequent Events
The merger of Degussa-Hüls and SKW Trostberg, both
E.ON subsidiaries, was entered into the Düsseldorf
District Court’s Commercial Register (HRB 39 635) on
February 9, 2001. The merged company, called Degussa
AG, has its registered office in Düsseldorf.
On January, 12, 2001 Degussa-Hüls and SKW made
a public offer to purchase the shares of Laporte, a spe-
cialty chemical company, in the amount of £6.97 per
share. The total amount for this acquisition is about
1.76 billion.
On January 16, 2001, E.ON AG exercised the put
option to sell its 45 percent stockholding in VIAG
Interkom. E.ON had agreed on the put option with
London-based British Telecommunications in August
2000. This resulted in a cash inflow at VTB (VIAG Tele-
com Beteiligungs GmbH) in Febuary 2001 in the total
amount of 11.35 billion including shareholder loans
Hartmann Simson Gaul
Krüper Schipporeit

138
Hermann Josef Strenger
Chairman of the Supervisory Board,
Bayer AG
Chairman (until May 25, 2000)
• Bayer AG (Chairman)
• Commerzbank AG
• Degussa-Hüls AG
• Linde AG
• Agfa-Gevaert N.V.
Dr. Klaus Liesen
Chairman of the Supervisory Board,
Ruhrgas AG
Chairman (since May 25, 2000)
• Allianz AG (Chairman)
• Deutsche Bank AG
• Preussag AG
• Ruhrgas AG (Chairman)
• Volkswagen AG (Chairman)
• Beck GmbH & Co. KG
Hubertus Schmoldt
Chairman of the Board of
Management, Industriegewerk-
schaft Bergbau, Chemie, Energie
Deputy Chairman
• Bayer AG
• Buna Sow Leuna
Olefinverbund GmbH
• RAG Coal International AG
Dr. Karl-Hermann Baumann
Chairman of the Supervisory Board,
Siemens AG
(since May 25, 2000)
• Allianz AG
• Deutsche Bank AG
• Linde AG
• mg technologies AG
• Schering AG
• Siemens AG (Vorsitz)
• ThyssenKrupp AG
• Wilhelm von Finck AG
Ralf Blauth
Industrial Clerk
(Industriekaufmann)
• Degussa-Hüls AG
Dr. Rolf-E. Breuer
Spokesman of the Board of
Management, Deutsche Bank AG
• DB Industrial Holdings AG1
(Chairman)
• Bertelsmann AG
• Deutsche Börse AG (Chairman)
• Deutsche Lufthansa AG
• Münchener Rückversicherungs-
Gesellschaft AG
• Siemens AG
• Compagnie de Saint-Gobain S.A.
• Landwirtschaftliche Rentenbank
Dr. Gerhard Cromme
Chairman of the Board of
Management, ThyssenKrupp AG
• Allianz Versicherungs-AG
• Ruhrgas AG
• Volkswagen AG
• Thyssen Krupp Industries AG1
(Chairman)
• Suez Lyonnaise des Eaux S.A.
• Thales/Thomson-CSF S.A.
• The Budd Company2
Rainer Dücker
Power Plant Worker
(until December 31, 2000)
• E.ON Energie AG
• E.ON Netz GmbH
Ulrich Hocker
General Manager, German Investor
Protection Association
• Brau und Brunnen AG
• Concordia Bau und Boden AG
(Chairman)
• Gerresheimer Glas AG
• Karstadt Quelle AG
• Systracom Bank AG
• Thyssen Krupp Steel AG
• Gartmore Capital Strategy Fonds
• Phoenix Mecano AG
Dr. h.c. André Leysen
Chairman of the Administrative
Board, Gevaert N.V.
• Agfa-Gevaert AG (Chairman)
• Bayer AG
• Deutsche Telekom AG
• Schenker AG
• Agfa-Gevaert N.V. (Chairman)
• Gevaert N.V. (Chairman)
• GIB Group N.V.
• Tessenderlo Chemie N.V.
• Vlaamse Uitgeversmaatschappij
N.V.
Mandates of Board Members
Information on additional mandates carried by members of E.ON AG’s Supervisory Board
As of December 31, 2000, or the date of retirement from E.ON AG’s Supervisory Board
• Supervisory Board mandates in accordance with Sec. 100, Para. 2 of the German Stock Corporation Act (AktG)
• Membership in comparable domestic and foreign supervisory bodies of commercial enterprises
1Exempted Group mandate2Other Group mandate

139
Herbert Mai
Former Chairman, Gewerkschaft
Öffentliche Dienste, Transport und
Verkehr
• Deutsche Lufthansa AG
Dagobert Millinghaus
Accounting and Administration
Manager (kfm. Angestellter)
• Stinnes AG
Margret Mönig-Raane
Chairwoman, Gewerkschaft
Handel, Banken und
Versicherungen
• Deutsche Bank AG
Dr. Henning Schulte-Noelle
Chairman of the Board
of Management, Allianz AG
• Allianz Lebensversicherungs-AG1
(Chairman)
• Allianz Versicherungs-AG1
(Chairman)
• BASF AG
• Dresdner Bank AG
• Linde AG
• MAN AG
• Münchener Rückversicherungs-
Gesellschaft AG
• Siemens AG
• ThyssenKrupp AG
• AGF S.A.2
• Elvia Versicherungen AG2
• Fireman’s Fund Inc.2
• RAS S.p.A.2
• Vodafone Group plc
Morris Tabaksblat
Chairman of the Administrative
Board, Reed Elsevier plc.
(until May 25, 2000)
• Aegon N.V.
• Reed Elsevier plc. (Chairman)
• TNT Post Group N.V.
Kurt F. Viermetz
Retired Vice-Chairman and Director
of the Board, J.P. Morgan & Co., Inc.
• Bayerische Hypo- und Vereins-
Bank AG (Chairman)
• Grosvenor Estate Holdings
Dr. Bernd Voss
Member of the Board of
Management, Dresdner Bank AG
• Deutsche Hypothekenbank
Frankfurt-Hamburg AG1
• Dresdner Bauspar AG1
• Oldenburgische Landesbank AG1
(Chairman)
• Continental AG
• Deutsche Schiffsbank AG
(Chairman)
• Karstadt Quelle AG
• Preussag AG
• Quelle AG
• Varta AG
• Volkswagen AG
• Wacker Chemie GmbH
• Bankhaus Reuschel & Co
(Chairman)
Dr. Peter Weber
Director of the Legal Department,
Degussa-Hüls AG
• Degussa-Hüls AG
• Wohnungsgesellschaft Hüls mbH
Kurt Weslowski
Chemical Worker
• VEBA Oel AG
• VEBA Oil Refining &
Petrochemicals GmbH
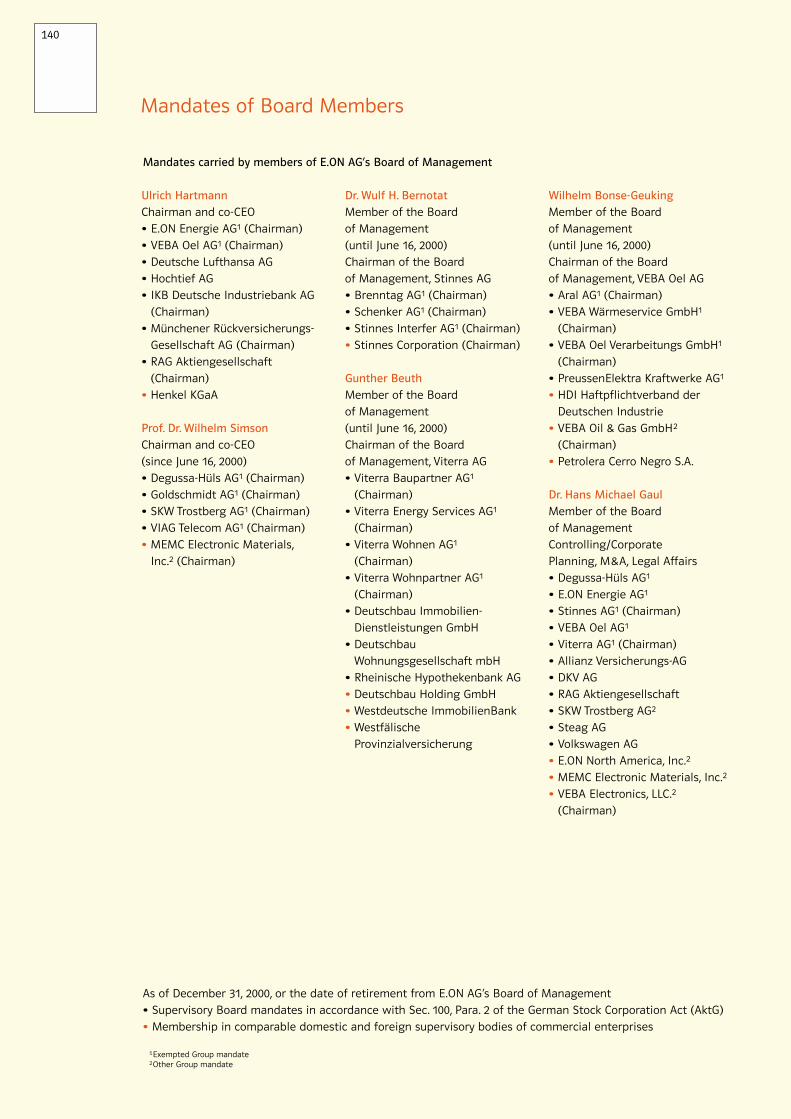
140
Ulrich Hartmann
Chairman and co-CEO
• E.ON Energie AG1 (Chairman)
• VEBA Oel AG1 (Chairman)
• Deutsche Lufthansa AG
• Hochtief AG
• IKB Deutsche Industriebank AG
(Chairman)
• Münchener Rückversicherungs-
Gesellschaft AG (Chairman)
• RAG Aktiengesellschaft
(Chairman)
• Henkel KGaA
Prof. Dr. Wilhelm Simson
Chairman and co-CEO
(since June 16, 2000)
• Degussa-Hüls AG1 (Chairman)
• Goldschmidt AG1 (Chairman)
• SKW Trostberg AG1 (Chairman)
• VIAG Telecom AG1 (Chairman)
• MEMC Electronic Materials,
Inc.2 (Chairman)
Dr. Wulf H. Bernotat
Member of the Board
of Management
(until June 16, 2000)
Chairman of the Board
of Management, Stinnes AG
• Brenntag AG1 (Chairman)
• Schenker AG1 (Chairman)
• Stinnes Interfer AG1 (Chairman)
• Stinnes Corporation (Chairman)
Gunther Beuth
Member of the Board
of Management
(until June 16, 2000)
Chairman of the Board
of Management, Viterra AG
• Viterra Baupartner AG1
(Chairman)
• Viterra Energy Services AG1
(Chairman)
• Viterra Wohnen AG1
(Chairman)
• Viterra Wohnpartner AG1
(Chairman)
• Deutschbau Immobilien-
Dienstleistungen GmbH
• Deutschbau
Wohnungsgesellschaft mbH
• Rheinische Hypothekenbank AG
• Deutschbau Holding GmbH
• Westdeutsche ImmobilienBank
• Westfälische
Provinzialversicherung
Wilhelm Bonse-Geuking
Member of the Board
of Management
(until June 16, 2000)
Chairman of the Board
of Management, VEBA Oel AG
• Aral AG1 (Chairman)
• VEBA Wärmeservice GmbH1
(Chairman)
• VEBA Oel Verarbeitungs GmbH1
(Chairman)
• PreussenElektra Kraftwerke AG1
• HDI Haftpflichtverband der
Deutschen Industrie
• VEBA Oil & Gas GmbH2
(Chairman)
• Petrolera Cerro Negro S.A.
Dr. Hans Michael Gaul
Member of the Board
of Management
Controlling/Corporate
Planning, M&A, Legal Affairs
• Degussa-Hüls AG1
• E.ON Energie AG1
• Stinnes AG1 (Chairman)
• VEBA Oel AG1
• Viterra AG1 (Chairman)
• Allianz Versicherungs-AG
• DKV AG
• RAG Aktiengesellschaft
• SKW Trostberg AG2
• Steag AG
• Volkswagen AG
• E.ON North America, Inc.2
• MEMC Electronic Materials, Inc.2
• VEBA Electronics, LLC.2
(Chairman)
Mandates of Board Members
Mandates carried by members of E.ON AG‘s Board of Management
As of December 31, 2000, or the date of retirement from E.ON AG’s Board of Management
• Supervisory Board mandates in accordance with Sec. 100, Para. 2 of the German Stock Corporation Act (AktG)
• Membership in comparable domestic and foreign supervisory bodies of commercial enterprises
1Exempted Group mandate2Other Group mandate

141
Dr. Hans-Dieter Harig
Member of the Board
of Management
(until June 16, 2000)
Chairman of the Board
of Management,
PreussenElektra AG
• Avacon AG1 (Chairman)
• Gelsenwasser AG (Chairman)
• PreussenElektra Kraftwerke AG1
(Chairman)
• Thüga AG1 (Chairman)
• Bewag Aktiengesellschaft
• Energie-Aktiengesellschaft
Mitteldeutschland
• EWE Aktiengesellschaft
• Hamburgische
Electricitäts-Werke AG
• Schleswag AG (Chairman)
• Veag Vereinigte Energiewerke AG
(Chairman)
• BKW FMB Energie AG
• Electriciteitsbedrijv Zuid-Holland
(E.Z.H.)2 (Chairman)
• PreussenElektra Kernkraft
Verwaltungs-GmbH2 (Chairman)
• PreussenElektra
Netz Verwaltungs-GmbH2
• Sydkraft AB (Chairman)
• Uranit GmbH
Dr. Manfred Krüper
Member of the Board
of Management
Human Resources,
Infrastructure and Services,
Procurement, Organization
• Klöckner & Co AG1
• Stinnes AG1
• VAW aluminium AG1
• Viterra AG1
• VEBA Oel AG1
• RAG Aktiengesellschaft
• RAG Immobilien AG
• Victoria Versicherung AG
• Victoria Lebensversicherung AG
Helmut Mamsch
Member of the Board
of Management
(until March 31, 2000)
Group Corporate Strategy
• Degussa-Hüls AG1
• Commerzbank AG
• Kali und Salz Beteiligungs AG
• Readymix AG
• SGE Deutsche Holding GmbH
• Steag AG
• Logica PLC
• MEMC Electronic Materials, Inc.2
(Chairman)
• VEBA Telecom GmbH2
Dr. Erhard Schipporeit
Member of the Board
of Management
(since June 16, 2000)
Finance, Accounting, Taxes, IT
• Degussa-Hüls AG1
• E.ON Energie AG1
• Goldschmidt AG1
• Klöckner & Co AG1 (Chairman)
• VAW aluminium AG1
(Chairman)
• AXA Colonia
Lebensversicherung AG
• Commerzbank AG
• Schmalbach-Lubeca AG
(Chairman)
• SKW Trostberg AG2
• VIAG Telecom AG2
• Connect Austria GmbH2
• E.ON Risk Consulting GmbH2
(Chairman)

142
Major shareholdings
Earnings1
m
Equity1
m
Stake
%
Location Sales1
m
I. Consolidated subsidiaries
Electricity
E.ON Energie AG Munich 100.0 4,879.2 2,135.82 835.5
Avacon AG Helmstedt 53.4 555.0 99.9 1,824.1
Braunschweigische Kohlen-Bergwerke AG Helmstedt 99.9 202.8 6.32 151.2
Contigas Deutsche Energie-Aktiengesellschaft Munich 98.7 594.1 34.62 193.6
e.dis. Energie Nord AG Fürstenwalde 70.0 724.1 31.5 1,034.3
E.ON Benelux Generation B.V. NL, Voorburg 100.0 424.9 37.1 529.1
EVO Energieversorgung Oberfranken AG Bayreuth 90.7 242.8 63.12 598.8
Gelsenwasser AG Gelsenkirchen 52.4 220.1 31.2 223.9
Isar-Amperwerke AG Munich 98.5 422.9 300.02 1,238.4
OBAG AG Regensburg 97.6 249.9 63.52 999.8
Rhein-Main-Donau AG Munich 77.5 110.2 0.0 148.6
Schleswag Aktiengesellschaft Rendsburg 65.3 367.3 63.9 1,121.0
TEAG Thüringer Energie AG Erfurt 74.9 466.6 43.2 765.4
Thüga Aktiengesellschaft Munich 57.3 819.5 80.4 186.1
Oil
VEBA Oel AG Gelsenkirchen 100.0 671.5 316.52 0.0
Aral AG & Co KG Bochum 99.0 224.3 12.02 11,937.7
VEBA Oil & Gas GmbH Essen 100.0 444.1 248.92 1.004.0
VEBA Oil Libya GmbH Gelsenkirchen 100.0 134.0 3.02 513.8
VEBA Oil Refining & Petrochemical GmbH Gelsenkirchen 100.0 159.3 105.42 8,821.6
Chemicals
Degussa AG5 Düsseldorf 64.6 3,690.0 297.8 1,887.6
ASTA Medica Aktiengesellschaft Dresden 100.0 81.0 –73.12 317.0
Degussa-Hüls Corporation USA, Ridgefield Park, NJ 100.0 936.7 23.9 4,757.4
dmc2 Degussa Metals Catalysts Cerdec AG Hanau 100.0 214.5 7.7 3,309.4
Oxeno Olefinchemie GmbH Marl 100.0 38.6 23.7 726.8
Phenolchemie GmbH & Co. KG Gladbeck 100.0 66.0 48.4 1,145.0
Röhm KG Darmstadt 100.0 145.6 28.12 805.2
Stockhausen GmbH & Co. KG Krefeld 100.0 148.3 30.6 445.6
Telecommunications
Connect Austria Gesellschaft für Telekommunikation GmbH A, Vienna 50.1 44.4 –49.3 226.9
E.ON Telecom GmbH Düsseldorf 100.0 1,248.5 601.02 0.0
VIAG Telecom Beteiligungs GmbH Munich 100.0 3,375.2 2,187.02 0.0
VR Telecommunications GmbH & Co. Norderfriedrichskoog 51.2 8,037.0 6,525.4 0.0
Real Estate
Viterra AG Essen 100.0 666.7 143.72 423.0
Viterra Baupartner AG Bochum 100.0 39.2 –4.02 207.1
Viterra Energy Services AG Essen 100.0 12.8 51.42 30.1
Distribution/Logistics
Stinnes Aktiengesellschaft Mülheim an der Ruhr 65.5 860.3 90.2 3,555.3
Brenntag S.A. F, Chassieu 100.0 63.8 11.1 362.7
BTL AB S, Göteborg 100.0 198.1 –12.9 0.0
Holland Chemical International N.V. NL, Amsterdam 100.0 160.0 21.9 1,426.0
Schenker International AB S, Göteborg 100.0 136.1 48.5 55.3
Klöckner & Co Aktiengesellschaft Duisburg 100.0 463.5 13.5 0.0
Aluminum
VAW aluminium AG Bonn 100.0 1,570.4 64.6 2,262.2
V.A.W. North American Holdings, Inc. USA, Dover, DE 100.0 114.0 26.0 298.8
NameStockholders’

143
Earnings1
m
Equity1
m
Stake
%
Location Sales1
m
1These figures comply with the financial statements prepared in accordance with the specific generally accepted accounting principles of each country and do not reflect the amountsincluded in the Consolidated Financial Statements. Stockholders' equity and earnings are translated at year-end current rates; sales are translated at annual average rates.
2Profit- and loss-pooling agreement (earnings before pooling).3Mainly previous-year figures unless profit- and loss-pooling agreement exists.4Figures derived from the Consolidated Financial Statements.5Stockholders’ equity, earnings, and sales following the consummation of the merger of Degussa-Hüls AG and SKW Trostberg AG.
Other
Aviga Aktiengesellschaft Duisburg 100.0 220.1 –33.0 0.0
CCA Holding, Inc.4 USA, Wilmington, DE 100.0 62.3 1.9 205.4
E.ON North America, Inc. USA, New York, NY 100.0 1,165.4 –326.0 0.0
MEMC Electronic Materials, Inc. USA, St. Peters, MO 71.8 830.1 –116.6 518.5
II. Other shareholdings3
Electricity
Bayerngas GmbH Munich 22.0 133.2 9.6 661.7
Bewag Aktiengesellschaft Berlin 49.0 1,942.5 128.3 1,752.1
BKW FMB Energie AG CH, Bern 20.0 420.2 54.4 1,426.9
Energie-Aktiengesellschaft Mitteldeutschland EAM Kassel 46.0 220.8 27.9 886.2
EWE Aktiengesellschaft Oldenburg 27.4 479.0 41.6 1,834.7
Fränkisches Überlandwerk AG Nuremberg 61.2 113.4 17.8 413.4
Gasag Berliner Gaswerke Aktiengesellschaft Berlin 13.0 434.5 –45.7 431.2
Gemeinschaftskernkraftwerk Grohnde GmbH Emmerthal 50.0 153.4 10.72 325.6
Graninge Aktiebolag S, Bollstabruk 13.3 311.1 36.9 240.8
Hamburgische Electricitäts-Werke AG Hamburg 15.4 631.9 83.5 1,397.0
Hein Gas Hamburger Gaswerke GmbH Hamburg 28.1 160.3 22.3 595.3
Kernkraftwerk Brunsbüttel GmbH Hamburg 33.3 32.2 3.22 121.3
Kernkraftwerk Krümmel GmbH Hamburg 50.0 102.3 10.22 188.8
Lausitzer Braunkohle Aktiengesellschaft (Laubag) Senftenberg 60.0 796.0 0.1 702.9
Lenenergo AG RUS, St. Petersburg 9.3 455.1 –16.7 716.2
Mainova Aktiengesellschaft Frankfurt am Main 24.3 389.5 43.1 950.9
rhenag Rheinische Energie Aktiengesellschaft Cologne 41.9 228.8 27.7 152.4
Stadtwerke Hannover AG Hanover 12.0 280.3 24.82 596.2
Sydkraft AB S, Malmö 20.7 2,421.5 220.1 1,678.0
VEAG Vereinigte Energiewerke AG Berlin 48.8 1,144.8 –954.4 2,248.5
Watt AG CH, Zurich 24.5 650.8 58.7 0.0
Oil
Ruhr Oel GmbH Düsseldorf 50.0 276.8 3.0 801.0
Chemicals
Cyro Industries USA, Rockaway, NJ 50.0 182.8 16.4 296.4
Polymer Latex GmbH & Co. KG Marl 50.0 102.8 –7.9 362.5
Telecommunications
Bouygues Telecom S.A. F, Velizy-Villacoublay 17.5 1,308.0 –276.9 2,037.1
VIAG Interkom GmbH & Co Munich 45.0 2,510.6 –570.4 838.4
Other
Aluminium Norf GmbH Neuss 50.0 143.5 18.52 306.3
Deutschbau-Holding GmbH Eschborn 50.0 651.7 –2.1 0.0
Hamburger Aluminium-Werk GmbH Hamburg 33.3 19.2 0.1 136.7
Norddeutsche Affinerie AG Hamburg 10.0 250.3 40.8 1,896.7
RAG Aktiengesellschaft4 Essen 39.2 2,146.2 169.0 13,650.4
WBRM-Holding GmbH Essen 50.0 59.2 –30.4 0.0
NameStockholders’

Two-year highlights (pro forma)
144
2000
93,240
6,802
4,184
3,678
2,762
5.07
1.35
65,592
40,623
8,501
106,215
28,033
1,985
5,123
40,821
27,940
7,130
5,751
32,238
8,315
6,917
17,006
106,215
3,889
14,961
186,788
26.4
112.8
13.5
–5,546
4.2
in millions
Sales
Income
Pretax income
Income after taxes
Income after minority interests
Internal operating profit
Earnings per share in
Dividend per share in
Assets
Long-term assets
Short-term assets
thereof: liquid funds
Total assets
Liabilities and stockholders’ equity
Stockholders’ equity
thereof: capital stock
Minority interests
Long-term liabilities
thereof: provisions
thereof: financial liabilities
thereof: other liabilities
Short-term liabilities
thereof: provisions
thereof: financial liabilities
thereof: other liabilities
Total liabilities and stockholders’ equity
Cash flow/investments
Cash flow from operations
Investments
Employees at year-end
Financial ratios
Equity ratio (as a percentage)
Long-term assets as a percentage of property, plant, and equipment
Return on equity after taxes (as a percentage)
Net financial position (liquid funds minus financial liabilities)
Cash flow from operations as a percentage of sales
1999
69,745
5,048
3,095
2,839
2,748
3.90
1.25
60,169
34,459
9,529
94,628
26,293
1,985
4,888
41,478
28,683
8,000
4,795
21,969
8,371
3,929
9,669
94,628
4,866
11,045
203,733
27.8
120.8
11.2
–2,400
7.0
2000 Annual Report
2000
An
nua
l Rep
ort
Financial Calendar
Interim Report: January–March 20012001 Annual Shareholders’ MeetingDividend PaymentInterim Report: January–June 2001Interim Report: January–September 2001Annual Press Conference, Annual Analyst ConferenceAnnual Shareholders’ Meeting
May 18, 2001May 18, 2001May 21, 2001
August 16, 2001November 15, 2001
March 21, 2002May 28, 2002
1999
69,745
5,048
3,095
2,839
2,748
11.2
11,045
4,866
26,293
94,628
203,733
3.90
1.25
1.79
36.09
6.68
in millions (pro forma)1
Sales
Income
Pretax income
Net income
After minority interests
Internal operating profit
Return on equity after taxes2 in percent
Investments
Cash flow from operations
Stockholders’ equity
Total assets
Employees at year-end
Per share in (pro forma)
Earnings
Cash dividend
Dividend including tax credit
Stockholders’ equity4
Cash flow from operations
+/– %
+34
+35
+35
+30
+1
+2.33
+35
–20
+7
+12
–8
+30
+8
+8
+7
–20
2000
93,240
6,802
4,184
3,678
2,762
13.5
14,961
3,889
28,033
106,215
186,788
5.07
1.35
1.93
38.61
5.36
E.ON 2000
1Pro-forma figures for 1999 and 2000 are shown in accordance with U.S. GAAP and depict the E.ON Group as if the VEBA-VIAG merger had been consummated as of January 1, 1999.
2Net income (excluding minority interests) ÷ annual average stockholders’ equity (excluding minority interests).3Change in percentage points.4Excluding minority interests.
in millions (pro forma)
Sales
Internal operating profit
Cash flow from operations
Investments
Employees at year-end
Electricity
13,350
1,725
1,037
3,766
34,406
Oil
28,780
310
918
1,723
8,593
Chemicals
20,267
672
501
1,868
62,110
RealEstate
1,324
212
5
484
5,567
Tele-communi-
cations
383
–546
–761
5,135
1,409
OtherActivities
25,733
620
617
1,317
74,044
Holding/Other
3,403
–231
1,572
668
659
Total
93,240
2,762
3,889
14,961
186,788
E.ON Group by Division 2000
For more information
about E.ON, contact:
Corporate Communications
E.ON AG
Bennigsenplatz 1
40474 Düsseldorf
Germany
T +49 (211) 4579-367
F +49 (211) 4579-532
www.eon.com
Only the German version of this Annual Report is legally binding.
This Annual Report contains certain forward-looking statements that are subject to risk and uncertainties.
For information identifying economic, currency, regulatory, technological, competitive, and some other
important factors that could cause actual results to differ materially from those anticipated in the
forward-looking statements, you should refer to E.ON’s filings to the Securities and Exchange Commission
(Washington, DC), as updated from time to time, in particular to the discussion included in the section of
E.ON’s 2000 Annual Report on Form 20-F entitled ”Item 3. Key Information: Risk Factors.“
E.ON Group financial highlights