2000 and 2001 market estimates - university of · pdf filepage vi—2000 and 2001 market...
TRANSCRIPT

Pesticides IndustrySales and Usage
2000 and 2001 Market Estimates

Pesticides Industry Sales and Usage
2000 and 2001 Market Estimates
By Timothy Kiely
David Donaldson Arthur Grube, Ph.D.
Biological and Economic Analysis Division Office of Pesticide Programs
Office of Prevention, Pesticides, and Toxic Substances U.S. Environmental Protection Agency
Washington, DC 20460
May 2004


U.S. Environmental Protection Agency Acknowledgments
Acknowledgments The authors would like to acknowledge the valuable assistance provided by the following reviewers:
• Allen Jennings, United States Department of Agriculture;
• Chuck Benbrook, Benbrook Consulting Services;
• Susan Kegley, Pesticide Action Network, North America;
• George Farnsworth and Gary Spolarich, California Department of Pesticide Regulation;
• Greg Malcolm, Doane Marketing Research, Inc.;
• Dennis Fugate, Kline & Co., Inc.;
• Leonard Gianessi, CropLife Foundation;
• Sarah Hoffman, United States Department of Agriculture; and
• U.S. Environmental Protection Agency reviewers.
Pesticides Industry Sales and Usage Report—Page i

U.S. Environmental Protection Agency Contents
Contents Sections
1. Introduction..............................................................................................................................................................Page 1
2. 2000 and 2001 Sales................................................................................................................................................. Page 4
2.1 World and U.S. Pesticide Expenditures................................................................................................................. Page 4
2.2 Value of U.S. Pesticides: Producer Level.............................................................................................................. Page 5
2.3 Pesticide Expenditures in the U.S.: Users..............................................................................................................Page 6
2.4 Pesticide and Farm Expenditures in the U.S.......................................................................................................... Page 7
3. 2000 and 2001 Usage................................................................................................................................................. Page 8
3.1 World and U.S. Pesticide Amount Used................................................................................................................ Page 8
3.2 Pesticide Supply in the U.S.: Producer Level….................................................................................................... Page 9
3.3 Pesticide Amount Used in the U.S.: Total............................................................................................................. Page 10
3.4 Amount of Pesticides Used in the U.S.: Conventional.......................................................................................... Page 12
3.5 Share of U.S. Amount of Conventional Pesticide Active Ingredient Used in the Agricultural and Non-Agricultural Market Sectors............................................................................................... Page 13
3.6 Most Commonly Used Conventional Pesticide Active Ingredients in the U.S.Agricultural Market Sector..................................................................................................................................... Page 14
3.7 Most Commonly Used Conventional Pesticide Active Ingredients in the U.S.Non-Agricultural Market Sectors……...................................................................................................................Page 15
3.8 Amount of Organophosphate Insecticides Used in the U.S...................................................................................Page 16
3.9 Pesticide Amount Used in the U.S.: Other.............................................................................................................Page 18
3.10 Pesticide Amount Used in the U.S.: Specialty Biocides and Chlorine/Hypochlorites........................................ Page 19
4. Producers and Users................................................................................................................................................. Page 20
4.1 Pesticide Producers and Users................................................................................................................................ Page 20
5. Historical Data........................................................................................................................................................... Page 21
5.1 Annual Expenditures on Pesticides in the U.S.: 1982 - 2001................................................................................ Page 21
5.2 Annual Amount of Pesticides Used in the U.S.: 1982 - 2001................................................................................Page 26
6. Glossary.................................................................................................................................................................... Page 32
Pesticides Industry Sales and Usage Report—Page iii
U.S. Environmental Protection Agency Contents
Tables
2. 2000 and 2001 Sales
Table 2.1 World and U.S. Pesticide Expenditures at User Level by Pesticide Type, 2000 and 2001 Estimates...... Page 4
Table 2.2 Value of U.S. Pesticide Production, Imports, Exports, and Supply at Producer Level.............................Page 5
Table 2.3 User Expenditures on Pesticides in the U.S. by Pesticide Type and Market Sector,2000 and 2001 Estimates...........................................................................................................................Page 6
Table 2.4 Farm Production Expenditures in the U.S................................................................................................. Page 7
3. 2000 and 2001 Usage
Table 3.1 World and U.S. Amount of Pesticide Active Ingredient at User Levelby Pesticide Type, 2000 and 2001 Estimates............................................................................................ Page 8
Table 3.2 U.S. Pesticide Production, Imports, Exports, and Supply in Amount of Active Ingredient Produced atthe Producer Level…................................................................................................................................. Page 9
Table 3.3 Amount of Pesticides Used in the U.S. by Pesticide Group, 2000 and 2001 Estimates............................Page 10
Table 3.4 Amount of Conventional Pesticide Active Ingredient Used in the U.S.by Pesticide Type and Market Sector, 2000 and 2001 Estimates.............................................................. Page 12
Table 3.5 Share of U.S. Amount of Conventional Pesticide Active Ingredient Agricultural and Non-Agricultural Market Sector Shares, 2000 and 2001 Estimates.............................. Page 13
Table 3.6 Most Commonly Used Conventional Pesticide Active Ingredients, Agricultural Market Sector, 2001, 1999, 1997, and 1987 Estimates.........................................................Page 14
Table 3.7 Most Commonly Used Conventional Pesticide Active Ingredients, Home and Garden Market Sector, 2001 and 1999 Estimates....................................................................Page 15
Table 3.8 Most Commonly Used Conventional Pesticide Active Ingredients, Industry/Commercial/Government Market Sector, 2001 and 1999 Estimates..........................................Page 15
Table 3.9 Amount of Organophosphate Insecticide Active Ingredients Used in the U.S.,All Market Sectors, 1980 – 2001 Estimates............................................................................................... Page 16
Table 3.10 Most Commonly Used Organophosphate Insecticide Active Ingredients,All Market Sectors, 2001 and 1999 Estimates...........................................................................................Page 17
Table 3.11 Other Pesticides Used in the U.S. by Pesticide Type and Market Sector, 2000 and 2001 Estimates....... Page 18
Table 3.12 Specialty Biocides Used in the U.S. by End Use Market, 2000 and 2001 Estimates................................ Page 19
Table 3.13 Chlorine/Hypochlorites Used in the U.S. by End Use Market, 2000 and 2001 Estimates........................Page 19
Page iv—2000 and 2001 Market Estimates
U.S. Environmental Protection Agency Contents
Tables (Continued)
4. Producers and Users
Table 4.1 Number of U.S. Pesticide Producers, Formulators, and Distributors........................................................Page 20
Table 4.2 Land in Farms, Land Harvested, Number of Farms, and Farms Using Pesticides....................................Page 20
Table 4.3 Number of Commercial Pest Control Firms and Number of Certified Applicators.................................. Page 20
Table 4.4 Number of U.S. Households Using Pesticides.......................................................................................... Page 20
5. Historical Data
Table 5.1 Annual User Expenditures on Pesticides in the U.S.by Pesticide Type, 1982 – 2001 Estimates, All Market Sectors................................................................ Page 22
Table 5.2 Annual User Expenditures on Pesticides in the U.S.by Pesticide Type, 1982 – 2001 Estimates, Agricultural Market Sector...................................................Page 23
Table 5.3 Annual User Expenditures on Pesticides in the U.S.by Pesticide Type, 1982 – 2001 Estimates, Industry/Commercial/Government Market Sector .............. Page 24
Table 5.4 Annual User Expenditures on Pesticides in the U.S.by Pesticide Type, 1982 – 2001 Estimates, Home and Garden Market Sector......................................... Page 25
Table 5.5 Annual Amount of Pesticide Active Ingredient Used in the U.S. by Pesticide Type, 1982 – 2001 Estimates, All Market Sectors................................................................ Page 27
Table 5.6 Annual Amount of Pesticide Active Ingredient Used in the U.S. by Pesticide Type, 1982 – 2001 Estimates, Agricultural Market Sector...................................................Page 28
Table 5.7 Annual Amount of Pesticide Active Ingredient Used in the U.S. by Pesticide Type, 1982 – 2001 Estimates, Industry/Commercial/Government Market Sector…........... Page 29
Table 5.8 Annual Amount of Pesticide Active Ingredient Used in the U.S. by Pesticide Type, 1982 – 2001 Estimates, Home and Garden Market Sector......................................... Page 30
Table 5.9 Conventional Pesticide Active Ingredient Used in the U.S.Agricultural and Non-Agricultural Market Sector Shares, 1964 – 2001…………................................... Page 31
Pesticides Industry Sales and Usage Report—Page v
U.S. Environmental Protection Agency Contents
Figures
2. 2000 and 2001 Sales
Figure 2.1 World and U.S. Pesticide Expenditures at User Level by Pesticide Type, 2001 Estimates.......................................................................................................... Page 5
Figure 2.2 User Expenditures on Pesticides in the U.S.by Pesticide Type and Market Sector, 2001 Estimates............................................................................ Page 7
3. 2000 and 2001 Usage
Figure 3.1 World and U.S. Pesticide Amounts of Active Ingredient at User Level by Pesticide Type, 2001 Estimates.......................................................................................................... Page 9
Figure 3.2 Amount of Pesticides Used in the U.S.by Pesticide Group, 2001 Estimates....................................................................................................... Page 11
Figure 3.3 Amount of Conventional Pesticide Active Ingredient Used in the U.S.by Pesticide Type and Market Sector, 2001 Estimates............................................................................ Page 13
Figure 3.4 Total Amount of Organophosphate and All Other Insecticides Active Ingredients Used in the U.S. in All Market Sectors, 1980 – 2001...........................................................................................Page 17
5. Historical Data
Figure 5.1 Annual User Expenditures on Pesticides in the U.S.by Pesticide Type, 1982 – 2001 Estimates, All Market Sectors..............................................................Page 22
Figure 5.2 Annual User Expenditures on Pesticides in the U.S.by Pesticide Type, 1982 – 2001 Estimates, Agricultural Market Sector................................................. Page 23
Figure 5.3 Annual User Expenditures on Pesticides in the U.S.by Pesticide Type, 1982 – 2001 Estimates, Industry/Commercial/Government Market Sector............. Page 24
Figure 5.4 Annual User Expenditures on Pesticides in the U.S.by Pesticide Type, 1982 – 2001 Estimates, Home and Garden Market Sector....................................... Page 25
Figure 5.5 Annual Amount of Pesticide Active Ingredient Used in the U.S. by Pesticide Type, 1982 – 2001 Estimates, All Market Sectors..............................................................Page 27
Figure 5.6 Annual Amount of Pesticide Active Ingredient Used in the U.S. by Pesticide Type, 1982 – 2001 Estimates, Agricultural Market Sector................................................. Page 28
Figure 5.7 Annual Amount of Pesticide Active Ingredient Used in the U.S. by Pesticide Type, 1982 – 2001 Estimates, Industry/Commercial/Government Market Sector............. Page 29
Figure 5.8 Annual Amount of Pesticide Active Ingredient Used in the U.S. by Pesticide Type, 1982 – 2001 Estimates, Home and Garden Market Sector....................................... Page 30
Page vi—2000 and 2001 Market Estimates


U.S. Environmental Protection Agency 1. Introduction
1. Introduction Purpose of Report
Under the Federal Insecticide, Fungicide, and Rodenticide Act (FIFRA) and the Federal Food, Drug, and Cosmetic Act (FFDCA), U.S. Environmental Protection Agency (EPA), in cooperation with the States and other agencies, such as the Food and Drug Administration (FDA) and the U.S. Department of Agriculture (USDA), is responsible for regulating the production and use of pesticides in the United States. This report provides contemporary and historical economic information on the U.S. pesticide producing and using sectors covered by these state and federal regulatory programs. Economic profile information covers a variety of topics, particularly the pesticide market with respect to dollar values and quantities of active ingredient. The EPA Pesticide Program has issued such market reports since 1979.
This report is intended only to present objective economic profile and trend information reflecting the best available information on pesticide sales and use. It does not attempt to interpret, reach conclusions about, or make inferences about the data. Detailed analysis of causal factors or implications, such as potential impacts on human health, the environment, or the economy, falls beyond the scope of this project.
We caution the reader not to infer too much from changes in the amount of pesticides used from year to year. Changes in the amount of pesticides used are not necessarily correlated to changes in the level of pest control or changes in the human health and environmental risks associated with pesticide use.
Data Sources
Neither EPA nor any other agency has a program devoted specifically to estimating the overall pesticide market in terms of dollars spent and quantity of active ingredient used on an annual basis. This report uses the best available information from the public domain and proprietary sources. The numbers in the report represent approximate values rather than precise values with known statistical properties.
The Agency has a wide variety of public and proprietary information upon which to base estimates of pesticide sales and use. The Pesticide Data Center in the Biological and Economic Analysis Division (BEAD) of EPA’s Office of Pesticide Programs (OPP) maintains extensive files and library materials. These materials cover different pesticide types and groupings in the agricultural market sector, which account for a majority of the use of conventional pesticides, and in non-agricultural market sectors. The Agency uses three national database services for the agricultural sector, including one from the USDA, and a number of more specific data sources. Similar data sources cover the non-agricultural sectors. EPA also uses proprietary data sources, with vendor permission, to estimate agricultural and non-agricultural market sectors. These proprietary data sources, produced by well-known organizations, also serve pesticide registrants and other private sector firms analyzing the U.S. pesticide market.
Overview of Contents/Scope of Report
This report profiles the U.S. pesticide industry for the years 2000 and 2001. Data, estimated using several different parameters (e.g., pesticide type, pesticide group, market sector), appear in tabular format. The scope of the report is largely inclusive of the U.S. pesticide industry and includes data on expenditures, volume, imports, exports, firms, individuals involved in production and use of pesticides, number of pesticides, and number of certified applicators, among other topics. The report includes graphical representations of the data where useful. Although most of the information covers the years 2000 and 2001, this report also includes a historical section.
Pesticides Industry Sales and Usage Report—Page 1
U.S. Environmental Protection Agency 1. Introduction
Following this Introduction (Section 1), Section 2 summarizes U.S. and world pesticide user expenditures in 2000 and 2001, and Section 3 summarizes U.S. and world pesticide amounts used in 2000 and 2001. Section 4 presents background information on pesticide market sectors. Finally, Section 5 presents historical data summarizing pesticide expenditures and estimates of amount used since 1982.
The writing of the 2002 and 2003 pesticides industry sales and usage report is scheduled to begin once all of the supporting pesticide sales and usage data for 2003 are published (Fall 2004). If you have questions regarding this report or need further information, please contact the authors at the following address:
Biological and Economic Analysis Division Office of Pesticide Programs (7503C) U.S. Environmental Protection AgencyAriel Rios Building1200 Pennsylvania Avenue, NW
Washington, DC 20460
You may also contact the authors by e-mail or (telephone): [email protected] (703-308-8112), [email protected] (703-308-9546), and [email protected] (703-308-8095).
Page 2—2000 and 2001 Market Estimates

U.S. Environmental Protection Agency
Page intentionally left blank.
Pesticides Industry Sales and Usage Report—Page 3
U.S. Environmental Protection Agency 2. 2000 and 2001 Sales
2. 2000 and 2001 Sales 2.1 World and U.S. Pesticide Expenditures
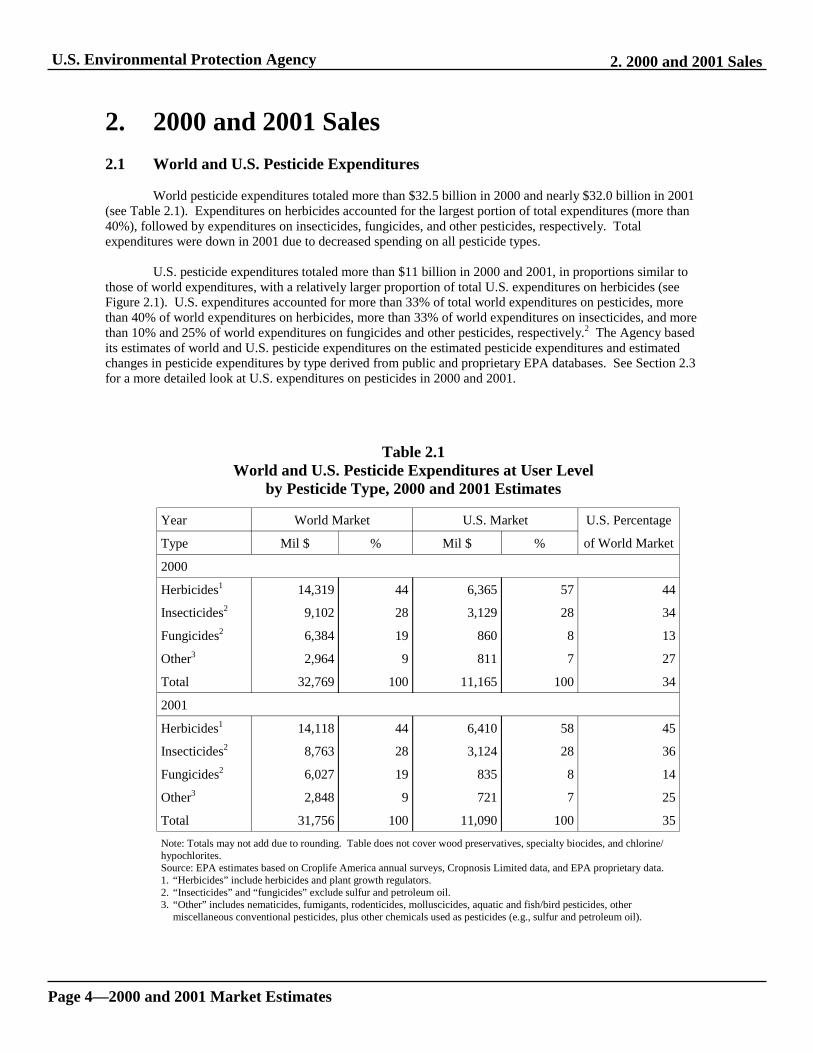
World pesticide expenditures totaled more than $32.5 billion in 2000 and nearly $32.0 billion in 2001 (see Table 2.1). Expenditures on herbicides accounted for the largest portion of total expenditures (more than 40%), followed by expenditures on insecticides, fungicides, and other pesticides, respectively. Total expenditures were down in 2001 due to decreased spending on all pesticide types.
U.S. pesticide expenditures totaled more than $11 billion in 2000 and 2001, in proportions similar to those of world expenditures, with a relatively larger proportion of total U.S. expenditures on herbicides (see Figure 2.1). U.S. expenditures accounted for more than 33% of total world expenditures on pesticides, more than 40% of world expenditures on herbicides, more than 33% of world expenditures on insecticides, and more than 10% and 25% of world expenditures on fungicides and other pesticides, respectively.2 The Agency based its estimates of world and U.S. pesticide expenditures on the estimated pesticide expenditures and estimated changes in pesticide expenditures by type derived from public and proprietary EPA databases. See Section 2.3 for a more detailed look at U.S. expenditures on pesticides in 2000 and 2001.
Table 2.1 World and U.S. Pesticide Expenditures at User Level
by Pesticide Type, 2000 and 2001 Estimates
Year World Market U.S. Market U.S. Percentage
of World Market Type Mil $ % Mil $ %
2000
Herbicides1 14,319 44 6,365 57 44
Insecticides2 9,102 28 3,129 28 34
Fungicides2 6,384 19 860 8 13
Other3 2,964 9 811 7 27
Total 32,769 100 11,165 100 34
2001
Herbicides1 14,118 44 6,410 58 45
Insecticides2 8,763 28 3,124 28 36
Fungicides2 6,027 19 835 8 14
Other3 2,848 9 721 7 25
Total 31,756 100 11,090 100 35
Note: Totals may not add due to rounding. Table does not cover wood preservatives, specialty biocides, and chlorine/hypochlorites.Source: EPA estimates based on Croplife America annual surveys, Cropnosis Limited data, and EPA proprietary data. 1. “Herbicides” include herbicides and plant growth regulators. 2. “Insecticides” and “fungicides” exclude sulfur and petroleum oil. 3. “Other” includes nematicides, fumigants, rodenticides, molluscicides, aquatic and fish/bird pesticides, other
miscellaneous conventional pesticides, plus other chemicals used as pesticides (e.g., sulfur and petroleum oil).
Page 4—2000 and 2001 Market Estimates

U.S. Environmental Protection Agency 2. 2000 and 2001 Sales
Figure 2.1 World and U.S. Pesticide Expenditures at User Level
by Pesticide Type, 2001 Estimates M
illio
ns o
f Dol
lars
40,000
32,000
24,000
16,000
8,000
0 Herbicides Insecticides Fungicides Other Total
World Market U.S. Market
Pesticide Type
2.2 Value of U.S. Pesticides: Producer Level
Table 2.2 summarizes the 2000 and 2001 average U.S. value of pesticides at the producer level, including production, import, export, and supply (total and net). Pesticide sales related to U.S. production and consumption of pesticides comprised $9.3 billion of domestic production, $1.0 billion of imports, $1.6 billion of exports, and $8.7 billion of net supply at the producer level.
Table 2.2 Value of U.S. Pesticide Production, Imports, Exports, and Supply
at Producer Level Category Annual Sales
(Billions of Dollars)
Average of 2000 and 2001
Production 9.3
Imports 1.0
Total Supply 10.3
Exports 1.6
Net Supply 8.7 Note: Excludes industrial wood preservatives, specialty biocides, and chlorine/hypochlorites. Includes conventional pesticides and other chemicals used as pesticides (e.g., sulfur and petroleum oil). Source: EPA estimates based on Croplife America annual surveys, USDA Foreign Agricultural Service’s Trade Internet System (http://www.fas.usda.gov/ustrade), and EPA proprietary data.
Pesticides Industry Sales and Usage Report—Page 5
U.S. Environmental Protection Agency 2. 2000 and 2001 Sales
2.3 Pesticide Expenditures in the U.S.: Users
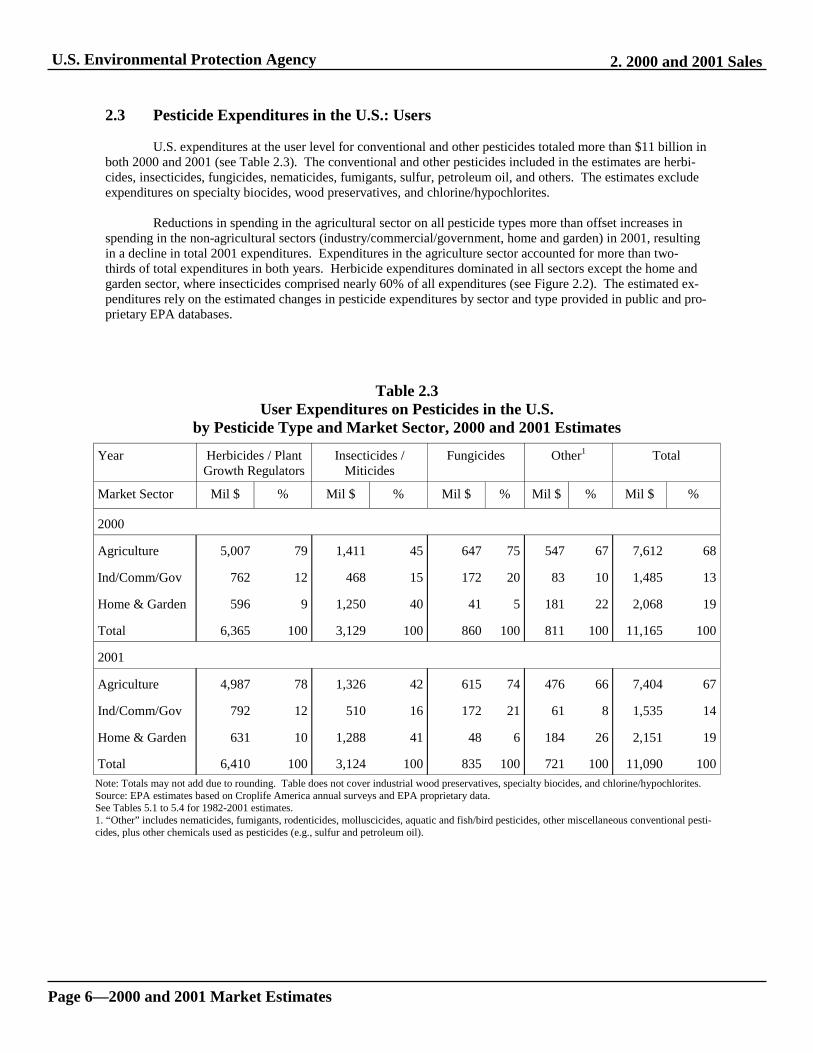
U.S. expenditures at the user level for conventional and other pesticides totaled more than $11 billion in both 2000 and 2001 (see Table 2.3). The conventional and other pesticides included in the estimates are herbicides, insecticides, fungicides, nematicides, fumigants, sulfur, petroleum oil, and others. The estimates exclude expenditures on specialty biocides, wood preservatives, and chlorine/hypochlorites.
Reductions in spending in the agricultural sector on all pesticide types more than offset increases in spending in the non-agricultural sectors (industry/commercial/government, home and garden) in 2001, resulting in a decline in total 2001 expenditures. Expenditures in the agriculture sector accounted for more than two-thirds of total expenditures in both years. Herbicide expenditures dominated in all sectors except the home and garden sector, where insecticides comprised nearly 60% of all expenditures (see Figure 2.2). The estimated expenditures rely on the estimated changes in pesticide expenditures by sector and type provided in public and proprietary EPA databases.
Table 2.3 User Expenditures on Pesticides in the U.S.
by Pesticide Type and Market Sector, 2000 and 2001 Estimates
Year Herbicides / Plant Growth Regulators
Insecticides / Miticides
Fungicides Other1 Total
Market Sector Mil $ % Mil $ % Mil $ % Mil $ % Mil $ %
2000
Agriculture 5,007 79 1,411 45 647 75 547 67 7,612 68
Ind/Comm/Gov 762 12 468 15 172 20 83 10 1,485 13
Home & Garden 596 9 1,250 40 41 5 181 22 2,068 19
Total 6,365 100 3,129 100 860 100 811 100 11,165 100
2001
Agriculture 4,987 78 1,326 42 615 74 476 66 7,404 67
Ind/Comm/Gov 792 12 510 16 172 21 61 8 1,535 14
Home & Garden 631 10 1,288 41 48 6 184 26 2,151 19
Total 6,410 100 3,124 100 835 100 721 100 11,090 100 Note: Totals may not add due to rounding. Table does not cover industrial wood preservatives, specialty biocides, and chlorine/hypochlorites.Source: EPA estimates based on Croplife America annual surveys and EPA proprietary data. See Tables 5.1 to 5.4 for 1982-2001 estimates.1. “Other” includes nematicides, fumigants, rodenticides, molluscicides, aquatic and fish/bird pesticides, other miscellaneous conventional pesticides, plus other chemicals used as pesticides (e.g., sulfur and petroleum oil).
Page 6—2000 and 2001 Market Estimates

U.S. Environmental Protection Agency 2. 2000 and 2001 Sales
Mill
ions
of D
olla
rs
Figure 2.2 User Expenditures on Pesticides in the U.S.
by Pesticide Type and Market Sector, 2001 Estimates 7,000
6,000
5,000
4,000
3,000
2,000
1,000
0
Herbicides Insecticides Fungicides Other
`
Pesticide Type
2.4 Pesticide and Farm Expenditures in the U.S.
Pesticides are an important component of total farm expenditures and are integral to farm budgeting and management. U.S. pesticide expenditures in 2000 and 2001 totaled 3.9% and 3.7% of total farm expenditures, respectively (see Table 2.4). Total farm expenditures increased slightly in 2001 while pesticide expenditures declined. Total farm expenditures are based on USDA estimates and pesticide expenditure estimates from Table 2.3.
Table 2.4 Farm Production Expenditures
in the U.S.
Expenditure (Billion $) 2000 2001
Pesticides $7.6 $7.4
Total $193.6 $200.8
Pesticides as % of Total 3.9% 3.7%
Source: EPA Estimates (Table 2.3); USDA/ National Agricultural Statistics Service (NASS) (http://www.usda.gov/nass).
Pesticides Industry Sales and Usage Report—Page 7
U.S. Environmental Protection Agency 3. 2000 and 2001 Usage
3. 2000 and 2001 Usage 3.1 World and U.S. Pesticide Amount Used
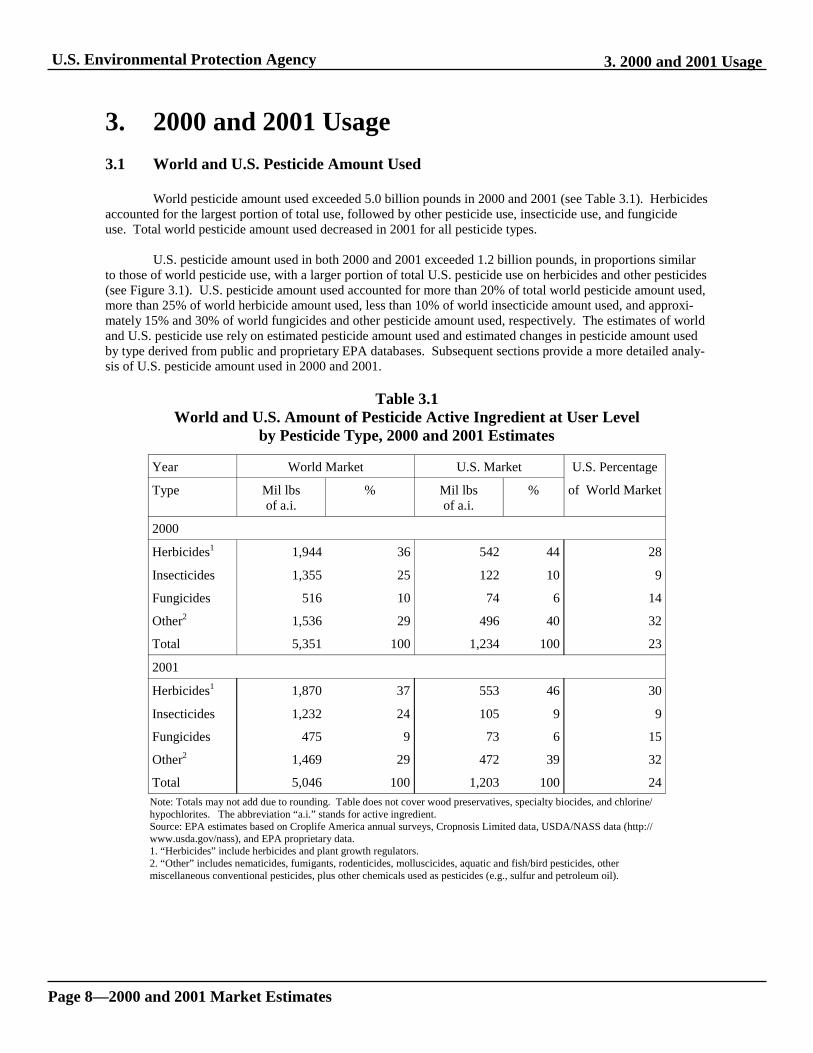
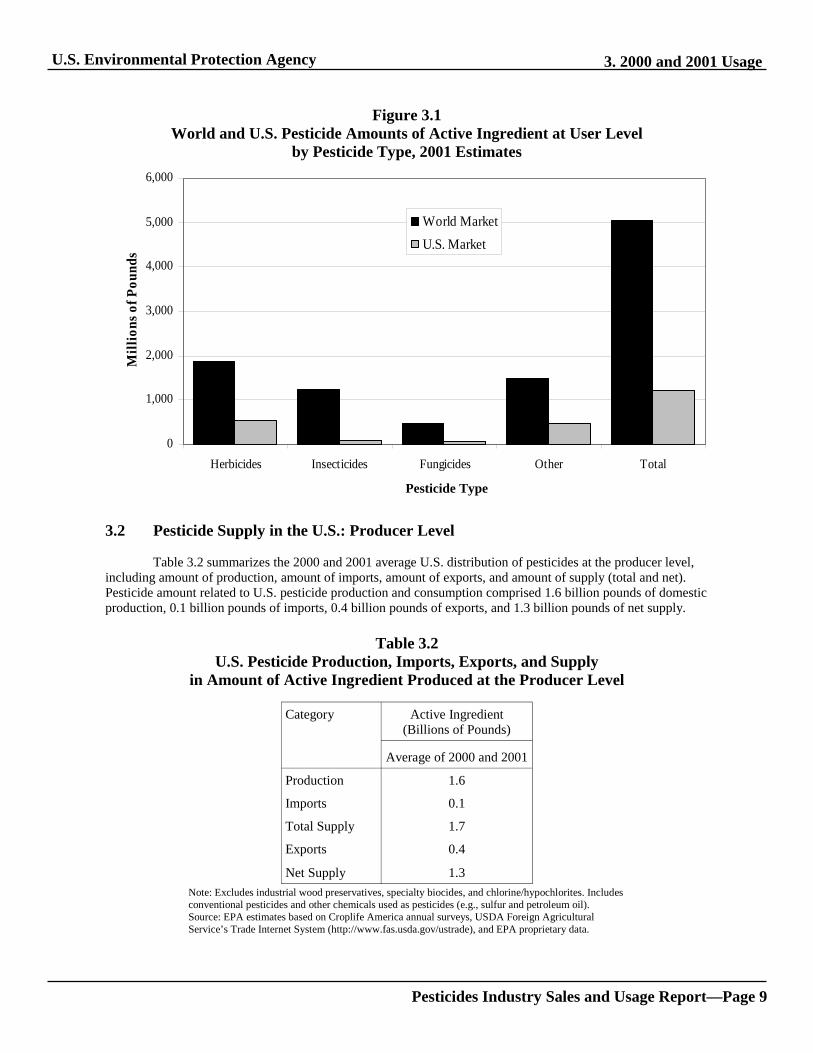
World pesticide amount used exceeded 5.0 billion pounds in 2000 and 2001 (see Table 3.1). Herbicides accounted for the largest portion of total use, followed by other pesticide use, insecticide use, and fungicide use. Total world pesticide amount used decreased in 2001 for all pesticide types.
U.S. pesticide amount used in both 2000 and 2001 exceeded 1.2 billion pounds, in proportions similar to those of world pesticide use, with a larger portion of total U.S. pesticide use on herbicides and other pesticides (see Figure 3.1). U.S. pesticide amount used accounted for more than 20% of total world pesticide amount used, more than 25% of world herbicide amount used, less than 10% of world insecticide amount used, and approximately 15% and 30% of world fungicides and other pesticide amount used, respectively. The estimates of world and U.S. pesticide use rely on estimated pesticide amount used and estimated changes in pesticide amount used by type derived from public and proprietary EPA databases. Subsequent sections provide a more detailed analysis of U.S. pesticide amount used in 2000 and 2001.
Table 3.1 World and U.S. Amount of Pesticide Active Ingredient at User Level
by Pesticide Type, 2000 and 2001 Estimates
Year World Market U.S. Market U.S. Percentage
of World Market Type Mil lbs of a.i.
% Mil lbs of a.i.
%
2000
Herbicides1 1,944 36 542 44 28
Insecticides 1,355 25 122 10 9
Fungicides 516 10 74 6 14
Other2 1,536 29 496 40 32
Total 5,351 100 1,234 100 23
2001
Herbicides1 1,870 37 553 46 30
Insecticides 1,232 24 105 9 9
Fungicides 475 9 73 6 15
Other2 1,469 29 472 39 32
Total 5,046 100 1,203 100 24 Note: Totals may not add due to rounding. Table does not cover wood preservatives, specialty biocides, and chlorine/hypochlorites. The abbreviation “a.i.” stands for active ingredient. Source: EPA estimates based on Croplife America annual surveys, Cropnosis Limited data, USDA/NASS data (http://www.usda.gov/nass), and EPA proprietary data. 1. “Herbicides” include herbicides and plant growth regulators. 2. “Other” includes nematicides, fumigants, rodenticides, molluscicides, aquatic and fish/bird pesticides, other miscellaneous conventional pesticides, plus other chemicals used as pesticides (e.g., sulfur and petroleum oil).
Page 8—2000 and 2001 Market Estimates
U.S. Environmental Protection Agency 3. 2000 and 2001 Usage
Figure 3.1 M
illio
ns o
f Pou
nds
World and U.S. Pesticide Amounts of Active Ingredient at User Level by Pesticide Type, 2001 Estimates
6,000
5,000
4,000
3,000
2,000
1,000
0
World Market U.S. Market
Herbicides Insecticides Fungicides Other Total
Pesticide Type
3.2 Pesticide Supply in the U.S.: Producer Level
Table 3.2 summarizes the 2000 and 2001 average U.S. distribution of pesticides at the producer level, including amount of production, amount of imports, amount of exports, and amount of supply (total and net). Pesticide amount related to U.S. pesticide production and consumption comprised 1.6 billion pounds of domestic production, 0.1 billion pounds of imports, 0.4 billion pounds of exports, and 1.3 billion pounds of net supply.
Table 3.2 U.S. Pesticide Production, Imports, Exports, and Supply
in Amount of Active Ingredient Produced at the Producer Level
Category Active Ingredient (Billions of Pounds)
Average of 2000 and 2001
Production 1.6
Imports 0.1
Total Supply 1.7
Exports 0.4
Net Supply 1.3 Note: Excludes industrial wood preservatives, specialty biocides, and chlorine/hypochlorites. Includes conventional pesticides and other chemicals used as pesticides (e.g., sulfur and petroleum oil). Source: EPA estimates based on Croplife America annual surveys, USDA Foreign Agricultural Service’s Trade Internet System (http://www.fas.usda.gov/ustrade), and EPA proprietary data.
Pesticides Industry Sales and Usage Report—Page 9

U.S. Environmental Protection Agency 3. 2000 and 2001 Usage
3.3 Pesticide Amount Used in the U.S.: Total
Total pesticide amount used in the United States approximated 5 billion pounds in both 2000 and 2001 (see Table 3.3). This estimate includes the conventional, other, wood preservative, specialty biocide, and chlorine/hypochlorite pesticide groups. With more than 2.5 billion pounds used, chlorine/hypochlorites exceeded all other pesticide groups combined (see Figure 3.2). The estimates of use by group rely on the estimated amount used and changes in estimated amount used by pesticide group derived from public and proprietary EPA databases. A discussion of the amount used of each pesticide group in 2000 and 2001 appears in subsequent sections (see footnotes to Table 3.3 for locations).
Table 3.3 Amount of Pesticides Used in the U.S.
by Pesticide Group, 2000 and 2001 Estimates
Pesticide Group Total (Million Pounds)
2000 2001
Conventional Pesticides1 926 888
Other Pesticides2 308 315
Specialty Biocides3 353 363
Chlorine/Hypochlorites4 2,532 2,609
Wood Preservatives5 809 797
Total 4,928 4,972 1. See Table 3.4 (conventional pesticides) for additional details and specific source information. 2. “Other pesticides” include other chemicals used as pesticides (e.g. sulfur and petroleum oil). See Table 3.11 (other pesticides) for additional details and specific source information. 3. See Table 3.12 (specialty biocides) for additional details and specific source information. 4. See Table 3.13 (chlorine/hypochlorites) for additional details and specific source information. 5. Source: American Wood Preservatives Institute (AWPI) and EPA proprietary data. “Wood Preservatives” include creosote, pentachlorophenol, and chromated copper arsenate (CCA).
Page 10—2000 and 2001 Market Estimates

U.S. Environmental Protection Agency 3. 2000 and 2001 Usage
Figure 3.2 Amount of Pesticides Used in the U.S. by Pesticide Group, 2001 Estimates
Conventional Pesticides (18%)
Other Pesticides (6%)
Chlorine/Hypochlorites (52%)
Wood Preservatives (16%)
Specialty Biocides (7%)
Pesticides Industry Sales and Usage Report—Page 11
U.S. Environmental Protection Agency 3. 2000 and 2001 Usage
3.4 Amount of Pesticides Used in the U.S.: Conventional
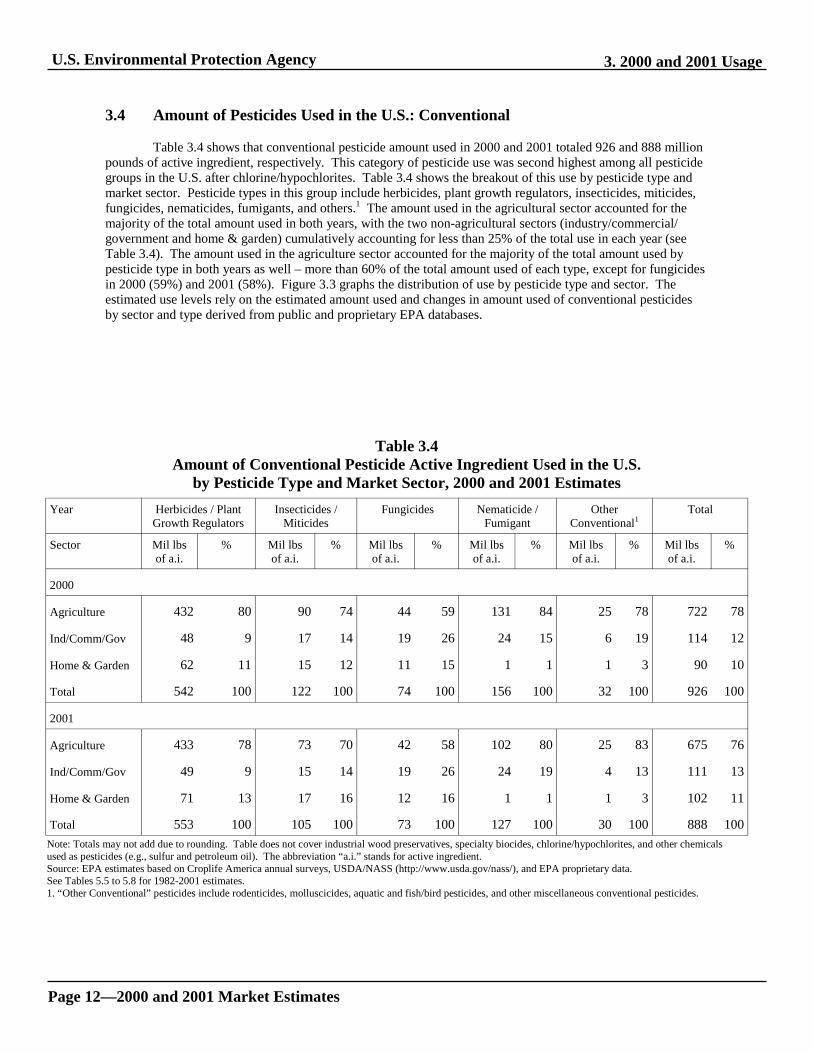
Table 3.4 shows that conventional pesticide amount used in 2000 and 2001 totaled 926 and 888 million pounds of active ingredient, respectively. This category of pesticide use was second highest among all pesticide groups in the U.S. after chlorine/hypochlorites. Table 3.4 shows the breakout of this use by pesticide type and market sector. Pesticide types in this group include herbicides, plant growth regulators, insecticides, miticides, fungicides, nematicides, fumigants, and others.1 The amount used in the agricultural sector accounted for the majority of the total amount used in both years, with the two non-agricultural sectors (industry/commercial/ government and home & garden) cumulatively accounting for less than 25% of the total use in each year (see Table 3.4). The amount used in the agriculture sector accounted for the majority of the total amount used by pesticide type in both years as well – more than 60% of the total amount used of each type, except for fungicides in 2000 (59%) and 2001 (58%). Figure 3.3 graphs the distribution of use by pesticide type and sector. The estimated use levels rely on the estimated amount used and changes in amount used of conventional pesticides by sector and type derived from public and proprietary EPA databases.
Table 3.4 Amount of Conventional Pesticide Active Ingredient Used in the U.S.
by Pesticide Type and Market Sector, 2000 and 2001 Estimates Year Herbicides / Plant
Growth Regulators Insecticides /
Miticides Fungicides Nematicide /
Fumigant Other
Conventional1 Total
Sector Mil lbs of a.i.
% Mil lbs of a.i.
% Mil lbs of a.i.
% Mil lbs of a.i.
% Mil lbs of a.i.
% Mil lbs of a.i.
%
2000
Agriculture 432 80 90 74 44 59 131 84 25 78 722 78
Ind/Comm/Gov 48 9 17 14 19 26 24 15 6 19 114 12
Home & Garden 62 11 15 12 11 15 1 1 1 3 90 10
Total 542 100 122 100 74 100 156 100 32 100 926 100
2001
Agriculture 433 78 73 70 42 58 102 80 25 83 675 76
Ind/Comm/Gov 49 9 15 14 19 26 24 19 4 13 111 13
Home & Garden 71 13 17 16 12 16 1 1 1 3 102 11
Total 553 100 105 100 73 100 127 100 30 100 888 100 Note: Totals may not add due to rounding. Table does not cover industrial wood preservatives, specialty biocides, chlorine/hypochlorites, and other chemicalsused as pesticides (e.g., sulfur and petroleum oil). The abbreviation “a.i.” stands for active ingredient.Source: EPA estimates based on Croplife America annual surveys, USDA/NASS (http://www.usda.gov/nass/), and EPA proprietary data. See Tables 5.5 to 5.8 for 1982-2001 estimates.1. “Other Conventional” pesticides include rodenticides, molluscicides, aquatic and fish/bird pesticides, and other miscellaneous conventional pesticides.
Page 12—2000 and 2001 Market Estimates

U.S. Environmental Protection Agency 3. 2000 and 2001 Usage
Mill
ions
of P
ound
s Figure 3.3
Amount of Conventional Pesticide Active Ingredient Used in the U.S. by Pesticide Type and Market Sector, 2001 Estimates
600
500
400
300
200
100
0 Herbicides/ Insecticides/ Fungicides Fumigants/ Other
Plant Growth Miticides Nematicides Regulators
Pesticide Type
3.5 Share of U.S. Amount of Conventional Pesticide Active Ingredient Used in the Agricultural and Non-Agricultural Market Sectors
Table 3.5 shows the agricultural and non-agricultural market share of total conventional pesticides consumed in 2000 and 2001. The agricultural sector accounts for more than 75% of the total amount of conventional pesticides used in both years. See Table 5.9 in the Historical Data section of this report for data covering the years 1964 through 2001.
Table 3.5 Share of U.S. Amount of Conventional Pesticide Active Ingredient
Agricultural and Non-Agricultural Market Sector Shares, 2000 and 2001 Estimates Year U.S. Agricultural Market Sector Non-Agricultural Market Sector
Mil lbs of a.i. Mil lbs of a.i. % of U.S. Mil lbs of a.i. % of U.S 2000 926 722 78 204 22 2001 888 675 76 213 24
Note: Conventional pesticides only, excluding sulfur, petroleum oil and other chemicals used as pesticides (e.g., sulfuric acid and insect repellents), wood preservatives, specialty biocides, and chlorine/hypochlorites. See Table 5.9 for 1964 - 2001. The abbreviation “a.i.” stands for active ingredient. Source: EPA estimates based on Croplife America annual surveys, USDA/NASS (http://www.usda.gov/nass), and EPAproprietary data.
Pesticides Industry Sales and Usage Report—Page 13
U.S. Environmental Protection Agency 3. 2000 and 2001 Usage
3.6 Most Commonly Used Conventional Pesticide Active Ingredients in the U.S. Agricultural Market Sector
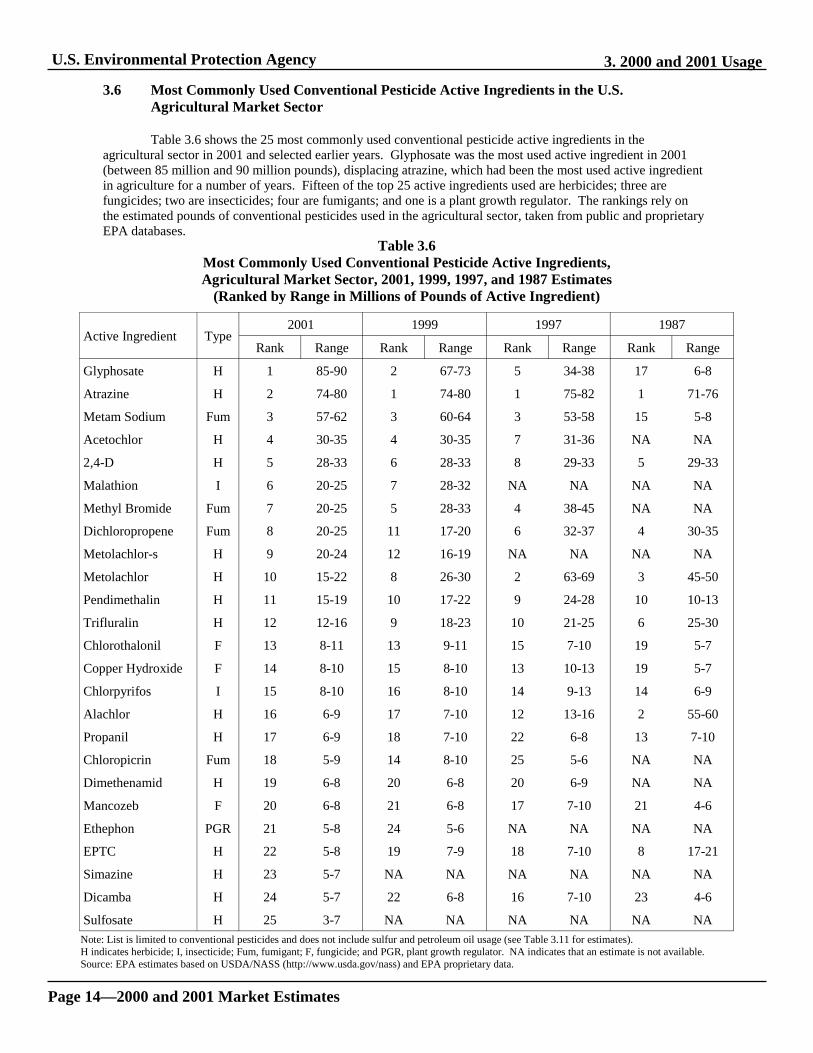
Table 3.6 shows the 25 most commonly used conventional pesticide active ingredients in the agricultural sector in 2001 and selected earlier years. Glyphosate was the most used active ingredient in 2001 (between 85 million and 90 million pounds), displacing atrazine, which had been the most used active ingredient in agriculture for a number of years. Fifteen of the top 25 active ingredients used are herbicides; three are fungicides; two are insecticides; four are fumigants; and one is a plant growth regulator. The rankings rely on the estimated pounds of conventional pesticides used in the agricultural sector, taken from public and proprietary EPA databases.
Table 3.6 Most Commonly Used Conventional Pesticide Active Ingredients, Agricultural Market Sector, 2001, 1999, 1997, and 1987 Estimates
(Ranked by Range in Millions of Pounds of Active Ingredient)
Active Ingredient Type 2001 1999 1997 1987
Rank Range Rank Range Rank Range Rank Range
Glyphosate H 1 85-90 2 67-73 5 34-38 17 6-8
Atrazine H 2 74-80 1 74-80 1 75-82 1 71-76
Metam Sodium Fum 3 57-62 3 60-64 3 53-58 15 5-8
Acetochlor H 4 30-35 4 30-35 7 31-36 NA NA
2,4-D H 5 28-33 6 28-33 8 29-33 5 29-33
Malathion I 6 20-25 7 28-32 NA NA NA NA
Methyl Bromide Fum 7 20-25 5 28-33 4 38-45 NA NA
Dichloropropene Fum 8 20-25 11 17-20 6 32-37 4 30-35
Metolachlor-s H 9 20-24 12 16-19 NA NA NA NA
Metolachlor H 10 15-22 8 26-30 2 63-69 3 45-50
Pendimethalin H 11 15-19 10 17-22 9 24-28 10 10-13
Trifluralin H 12 12-16 9 18-23 10 21-25 6 25-30
Chlorothalonil F 13 8-11 13 9-11 15 7-10 19 5-7
Copper Hydroxide F 14 8-10 15 8-10 13 10-13 19 5-7
Chlorpyrifos I 15 8-10 16 8-10 14 9-13 14 6-9
Alachlor H 16 6-9 17 7-10 12 13-16 2 55-60
Propanil H 17 6-9 18 7-10 22 6-8 13 7-10
Chloropicrin Fum 18 5-9 14 8-10 25 5-6 NA NA
Dimethenamid H 19 6-8 20 6-8 20 6-9 NA NA
Mancozeb F 20 6-8 21 6-8 17 7-10 21 4-6
Ethephon PGR 21 5-8 24 5-6 NA NA NA NA
EPTC H 22 5-8 19 7-9 18 7-10 8 17-21
Simazine H 23 5-7 NA NA NA NA NA NA
Dicamba H 24 5-7 22 6-8 16 7-10 23 4-6
Sulfosate H 25 3-7 NA NA NA NA NA NA Note: List is limited to conventional pesticides and does not include sulfur and petroleum oil usage (see Table 3.11 for estimates).H indicates herbicide; I, insecticide; Fum, fumigant; F, fungicide; and PGR, plant growth regulator. NA indicates that an estimate is not available.Source: EPA estimates based on USDA/NASS (http://www.usda.gov/nass) and EPA proprietary data.
Page 14—2000 and 2001 Market Estimates

U.S. Environmental Protection Agency 3. 2000 and 2001 Usage
3.7 Most Commonly Used Conventional Pesticide Active Ingredients in the U.S. Non-Agricultural Market Sectors
Tables 3.7 and 3.8 show the ten most commonly used conventional pesticide active ingredients in the two non-agricultural sectors (home & garden and industry/commercial/ government) in both 2001 and 1999. In both sectors, 2,4-D was the most used active ingredient, with between eight and eleven million pounds used in the home and garden sector (see Table 3.7), and between 16 and 18 million pounds used in the industry/commercial/ government sector (see Table 3.8). Seven of the top ten in the home and garden sector are herbicides and three are insecticides. Six of the top ten in the industry/commercial/government sector are herbicides, two are fungicides, and two are insecticides. As noted in Table 3.8, due to the fact that some applicators apply pesticide in both markets, there may be some usage reported in one market that may have occurred in the other. The rankings rely on the estimated amount used of conventional pesticides in the nonagricultural sector taken from EPA proprietary databases.
Table 3.7 Most Commonly Used Conventional Pesticide Active Ingredients,
Home and Garden Market Sector, 2001 and 1999 Estimates (Ranked by Range in Millions of Pounds of Active Ingredient)
Rank Rank
H 1 1
H 2 2
H 3 NA NA
Diazinon I 4 5
MCPP H 5 3
I 6 7
H 7 4
I 8 9
DCPA H 9 10
H 10 8
Type 2001 1999
Range Range
2,4-D 8-11 7-9
Glyphosate 5-8 5-8
Pendimethalin 3-6
4-6 2-4
4-6 3-5
Carbaryl 2-4 2-4
Dicamba 2-4 3-5
Malathion 2-4 1-3
1-3 1-3
Benefin 1-3 1-3
Active Ingredient
Note: Does not include moth controls: Paradiclorobenzene (30 - 35 million pounds per year) and naphthalene (2 - 4 million pounds per year). Also does not include insect repellent N,N-diethyl-meta-toluamide (5 - 7 millions pounds per year). H indicates herbicide and I, insecticide. NA indicates that an estimate is not available.Source: EPA proprietary data.
Table 3.8 Most Commonly Used Conventional Pesticide Active Ingredients,
Industry/Commercial/Government Market Sector, 2001 and 1999 Estimates (Ranked by Range in Millions of Pounds of Active Ingredient)
Active Ingredient Type 2001 1999
Rank Range Rank Range
2,4-D H 1 16-18 1 17-20
Glyphosate H 2 13-15 2 11-14
Copper Sulfate F 3 4-6 3 5-7
Pendimethalin H 4 3-5 4 3-5
Chlorothalanil F 5 2-4 7 2-4
Chlorpyrifos I 6 2-4 5 3-5
Diuron H 7 2-4 8 2-4
MSMA H 8 2-4 6 2-4
Triclopyr H 9 1-3 10 1-3
Malathion I 10 1-3 9 1-3 Note: Includes applications to homes and gardens by professional applicators. Does not include sulfur or petroleum oil. H indicates herbicide; I, insecticide; and F, fungicide. Source: EPA proprietary data.
Pesticides Industry Sales and Usage Report—Page 15

U.S. Environmental Protection Agency 3. 2000 and 2001 Usage
3.8 Amount of Organophosphate Insecticides Used in the U.S.
Table 3.9 shows the total amount of organophosphate insecticide used in 1980, 1985, and annually since 1990. The top ten active ingredients in this pesticide class include malathion, chlorpyrifos, terbufos, diazinon, methyl-parathion, phorate, acephate, phosmet, azinphos-methyl, and dimethoate (see Table 3.10). Since the passage of the Food Quality Protection Act (FQPA) in 1996, this class of conventional pesticides has been a primary focus of EPA reregistration activities. For more information on the active ingredients included in this pesticide class and their reregistration and registration status, go to U.S. EPA’s Office of Pesticide Programs Web site at http://www.epa.gov/pesticides/op/.
The amount of organophosphate insecticides used has declined nearly 45% since 1980, from an estimated 131 million pounds in 1980 to 73 million pounds in 2001 (see Figure 3.4). Since 1980, however, organophosphate use as a percent of total insecticide use has increased, from 58% in 1980 to 70% in 2001. The increase in use in 1999 was due mainly to the increased amount of malathion used as part of the USDA-sponsored Boll Weevil Eradication Program (http://www.aphis.usda.gov/ppq/weevil/). Malathion use in this program decreased over the last two years, resulting in a decline in total organophosphate use. The estimates of organophosphate insecticide use rely on the estimated amount used and changes in the amount used of organophosphates from public and proprietary EPA databases.
Table 3.9 Amount of Organophosphate Insecticide Active Ingredients Used in the U.S.,
All Market Sectors, 1980 - 2001 Estimates Year All Insecticides Organophosphates
Mil lbs of a.i. Mil lbs of a.i. % of All Insecticides
1980 228 131 58
1985 161 114 71
1990 121 85 70
1991 114 82 72
1992 116 84 72
1993 115 79 69
1994 124 83 67
1995 125 80 64
1996 116 75 65
1997 112 73 65
1998 103 66 64
1999 126 91 72
2000 122 88 72
2001 105 73 70 Note: The abbreviation “a.i.” stands for active ingredient. Source: EPA estimates based on Croplife America annual surveys, USDA/NASS (http://www.usda.gov/nass/), and EPA proprietary data.
Page 16—2000 and 2001 Market Estimates

U.S. Environmental Protection Agency 3. 2000 and 2001 Usage
Figure 3.4 Total Amount of Organophosphate and All Other Insecticides Active Ingredients
Used in the U.S. in All Market Sectors, 1980 - 2001
0
50
100
150
200
250
Organophosphate Insecticide
All Other Insecticides
Mill
ions
of P
ound
s
1980 1985 1990 1991 1992 1993 1994 1995 1996 1997 1998 1999 2000 2001
Year
Table 3.10 Most Commonly Used Organophosphate Insecticide Active Ingredients,
All Market Sectors, 2001 and 1999 Estimates (Ranked by Range in Millions of Pounds of Active Ingredient)
Active Ingredient 2001 1999
Rank Range Rank Range
Malathion 1 23-32 1 30-38
Chlorpyrifos 2 11-16 2 13-19
Diazinon 3 4-7 4 4-7
Terbufos 4 3-5 3 5-7
Acephate 5 2-3 7 2-3
Phorate 6 2-3 6 2-3
Methyl Parathion 7 1-3 5 2-4
Phosmet 8 1-2 9 1-2
Azinphos-Methyl 9 1-2 8 1-2
Dimethoate 10 1-2 10 1-2 Source: EPA estimates based on Croplife America annual surveys, USDA/ NASS (http://www.usda.gov/nass/), and EPA proprietary data.
Pesticides Industry Sales and Usage Report—Page 17

U.S. Environmental Protection Agency 3. 2000 and 2001 Usage
3.9 Pesticide Amount Used in the U.S.: Other
The total amount of other pesticides used in the U.S. was more than 300 million pounds in 2000 and 2001 (see Table 3.11). The pesticides in this group include sulfur and petroleum oil and other chemicals used as pesticides, such as sulfuric acid, insect repellants (e.g., DEET), moth control products (e.g., paradichlorobenzene), and others.1 Nearly all of the sulfur and oil used (85%) is in the agricultural sector, while the use of the other pesticides in this group is mainly in the agricultural and home and garden sectors (93%). The increase in the amount used in 2001 resulted mainly from an increase in the use of sulfur and petroleum oil in the agricultural sector. The amount of sulfur and petroleum oil and of the other pesticides used in this group in the non-agricultural sectors did not change substantially between 2000 and 2001. Nearly three-fourths of the total amount of sulfur, oil, and other pesticides used was in the agricultural sector. The estimated use levels rely on the amount used and changes in the amount used of sulfur, oil, and other pesticides by sector and type derived from public and proprietary EPA databases.
Table 3.11 Other Pesticides Used in the U.S.
by Pesticide Type and Market Sector, 2000 and 2001 Estimates Year Sulfur & Oil Other1 Total
Sector Mil lbs of a.i.
% Mil lbs of a.i.
% Mil lbs of a.i.
%
2000
Agriculture 166 85 60 53 226 73
Ind/Comm/Gov 14 7 8 7 22 7
Home & Garden 15 8 45 40 60 19
Total 195 100 113 100 308 100
2001
Agriculture 172 86 60 53 232 74
Ind/Comm/Gov 14 7 8 7 22 7
Home & Garden 15 7 46 40 61 19
Total 201 100 114 100 315 100 Note: Totals may not add due to rounding. Table estimates do not include industrial wood preservatives,specialty biocides, and chlorine/hypochlorites. The abbreviation “a.i.” stands for active ingredient.Source: EPA estimates based on Croplife America annual surveys, USDA/NASS (http://www.usda.gov/nass), and EPA proprietary data. See Tables 5.5 to 5.8 for 1982-2001 estimates.1. “Other” includes sulfuric acid, insect repellents, zinc sulfate, moth control chemicals (e.g., Paradichlorobenzene and naphthalene), and other miscellaneous chemicals produced largely for non-pesticidal purposes.
Page 18—2000 and 2001 Market Estimates
U.S. Environmental Protection Agency 3. 2000 and 2001 Usage
3.10 Pesticide Amount Used in the U.S.: Specialty Biocides and Chlorine/Hypochlorites
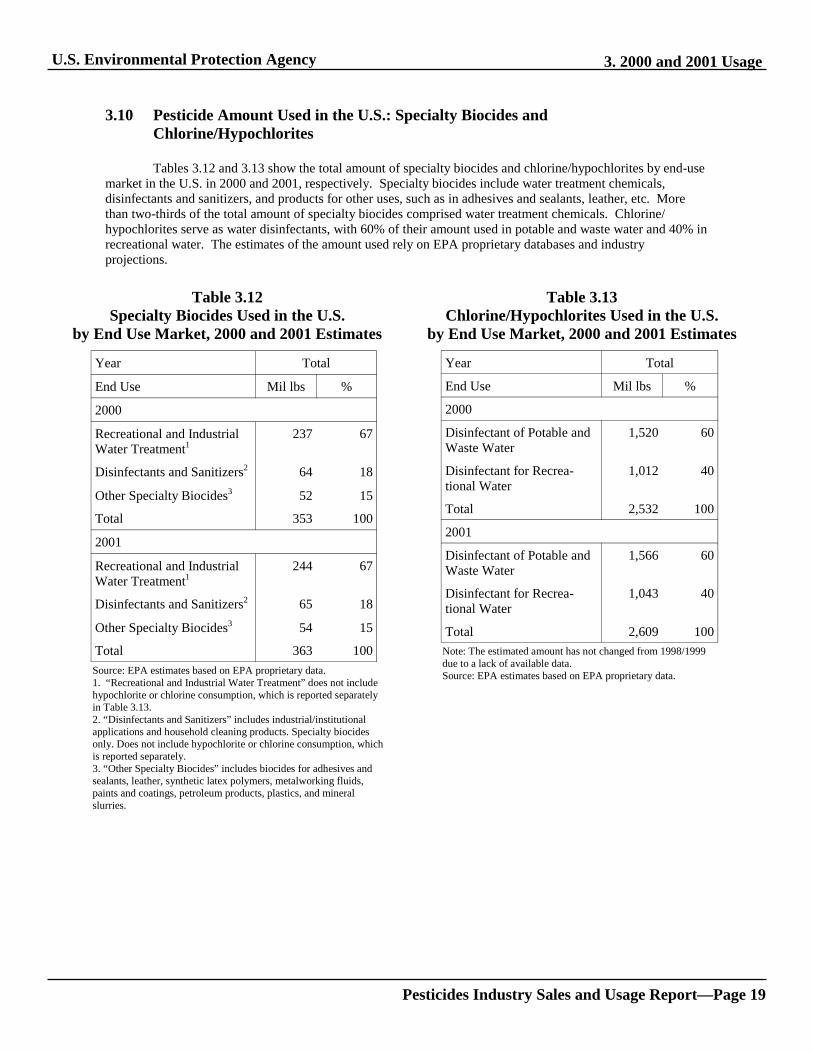
Tables 3.12 and 3.13 show the total amount of specialty biocides and chlorine/hypochlorites by end-use market in the U.S. in 2000 and 2001, respectively. Specialty biocides include water treatment chemicals, disinfectants and sanitizers, and products for other uses, such as in adhesives and sealants, leather, etc. More than two-thirds of the total amount of specialty biocides comprised water treatment chemicals. Chlorine/ hypochlorites serve as water disinfectants, with 60% of their amount used in potable and waste water and 40% in recreational water. The estimates of the amount used rely on EPA proprietary databases and industry projections.
Table 3.12 Specialty Biocides Used in the U.S.
by End Use Market, 2000 and 2001 Estimates
Table 3.13 Chlorine/Hypochlorites Used in the U.S.
by End Use Market, 2000 and 2001 Estimates
Year Total
End Use Mil lbs %
2000
Recreational and Industrial 237 67 Water Treatment1
Disinfectants and Sanitizers2 64 18
Other Specialty Biocides3 52 15
Total 353 100
2001
Recreational and Industrial 244 67 Water Treatment1
Disinfectants and Sanitizers2 65 18
Other Specialty Biocides3 54 15
Total 363 100
Year Total
End Use Mil lbs %
2000
Disinfectant of Potable and 1,520 60 Waste Water
Disinfectant for Recrea- 1,012 40 tional Water
Total 2,532 100
2001
Disinfectant of Potable and 1,566 60 Waste Water
Disinfectant for Recrea- 1,043 40 tional Water
Total 2,609 100 Note: The estimated amount has not changed from 1998/1999 due to a lack of available data. Source: EPA estimates based on EPA proprietary data. Source: EPA estimates based on EPA proprietary data. 1. “Recreational and Industrial Water Treatment” does not include
hypochlorite or chlorine consumption, which is reported separately in Table 3.13. 2. “Disinfectants and Sanitizers” includes industrial/institutional applications and household cleaning products. Specialty biocides only. Does not include hypochlorite or chlorine consumption, which is reported separately. 3. “Other Specialty Biocides” includes biocides for adhesives and sealants, leather, synthetic latex polymers, metalworking fluids, paints and coatings, petroleum products, plastics, and mineral slurries.
Pesticides Industry Sales and Usage Report—Page 19
U.S. Environmental Protection Agency 4. Producers and Users
4. Producers and Users 4.1 Pesticide Producers and Users
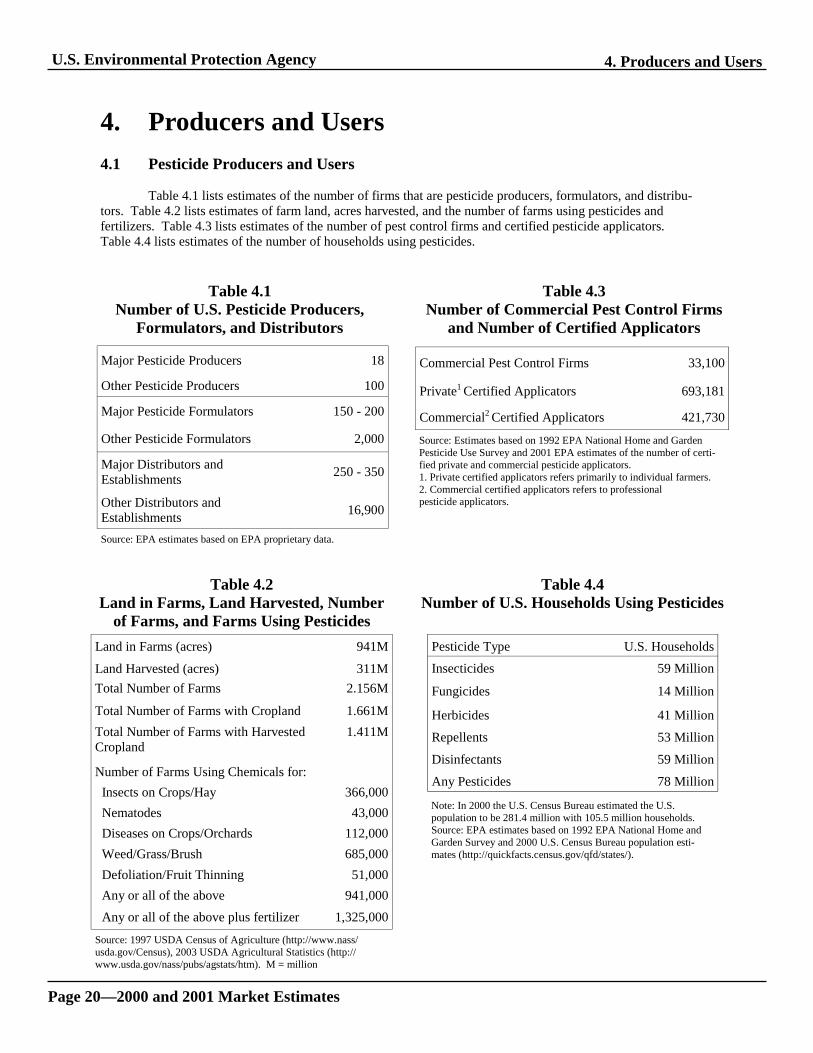
Table 4.1 lists estimates of the number of firms that are pesticide producers, formulators, and distributors. Table 4.2 lists estimates of farm land, acres harvested, and the number of farms using pesticides and fertilizers. Table 4.3 lists estimates of the number of pest control firms and certified pesticide applicators. Table 4.4 lists estimates of the number of households using pesticides.
Table 4.1 Number of U.S. Pesticide Producers,
Formulators, and Distributors
Table 4.3 Number of Commercial Pest Control Firms
and Number of Certified Applicators
18
j
Major Pesticide Producers
Other Pesticide Producers 100
Major Pesticide Formulators 150 - 200
Other Pesticide Formulators 2,000
Ma or Distributors and Establishments 250 - 350
Other Distributors and Establishments 16,900
Source: EPA estimates based on EPA proprietary data.
Table 4.2 Land in Farms, Land Harvested, Number
of Farms, and Farms Using Pesticides Land in Farms (acres) 941M
Land Harvested (acres) 311M Total Number of Farms 2.156M
Total Number of Farms with Cropland 1.661M Total Number of Farms with Harvested 1.411M Cropland
Number of Farms Using Chemicals for: Insects on Crops/Hay 366,000 Nematodes 43,000
Diseases on Crops/Orchards 112,000 Weed/Grass/Brush 685,000 Defoliation/Fruit Thinning 51,000
Any or all of the above 941,000 Any or all of the above plus fertilizer 1,325,000
Commercial Pest Control Firms 33,100
Private1 Certified Applicators 693,181
Commercial2 Certified Applicators 421,730
Source: Estimates based on 1992 EPA National Home and Garden Pesticide Use Survey and 2001 EPA estimates of the number of certified private and commercial pesticide applicators. 1. Private certified applicators refers primarily to individual farmers. 2. Commercial certified applicators refers to professional pesticide applicators.
Table 4.4 Number of U.S. Households Using Pesticides
Pesticide Type U.S. Households
Insecticides 59 Million
Fungicides 14 Million
Herbicides 41 Million
Repellents 53 Million
Disinfectants 59 Million
Any Pesticides 78 Million
Note: In 2000 the U.S. Census Bureau estimated the U.S. population to be 281.4 million with 105.5 million households. Source: EPA estimates based on 1992 EPA National Home and Garden Survey and 2000 U.S. Census Bureau population estimates (http://quickfacts.census.gov/qfd/states/).
Source: 1997 USDA Census of Agriculture (http://www.nass/ usda.gov/Census), 2003 USDA Agricultural Statistics (http:// www.usda.gov/nass/pubs/agstats/htm). M = million
Page 20—2000 and 2001 Market Estimates

U.S. Environmental Protection Agency 5. Historical Data
5. Historical Data 5.1 Annual Expenditures on Pesticides in the U.S.: 1982 - 2001
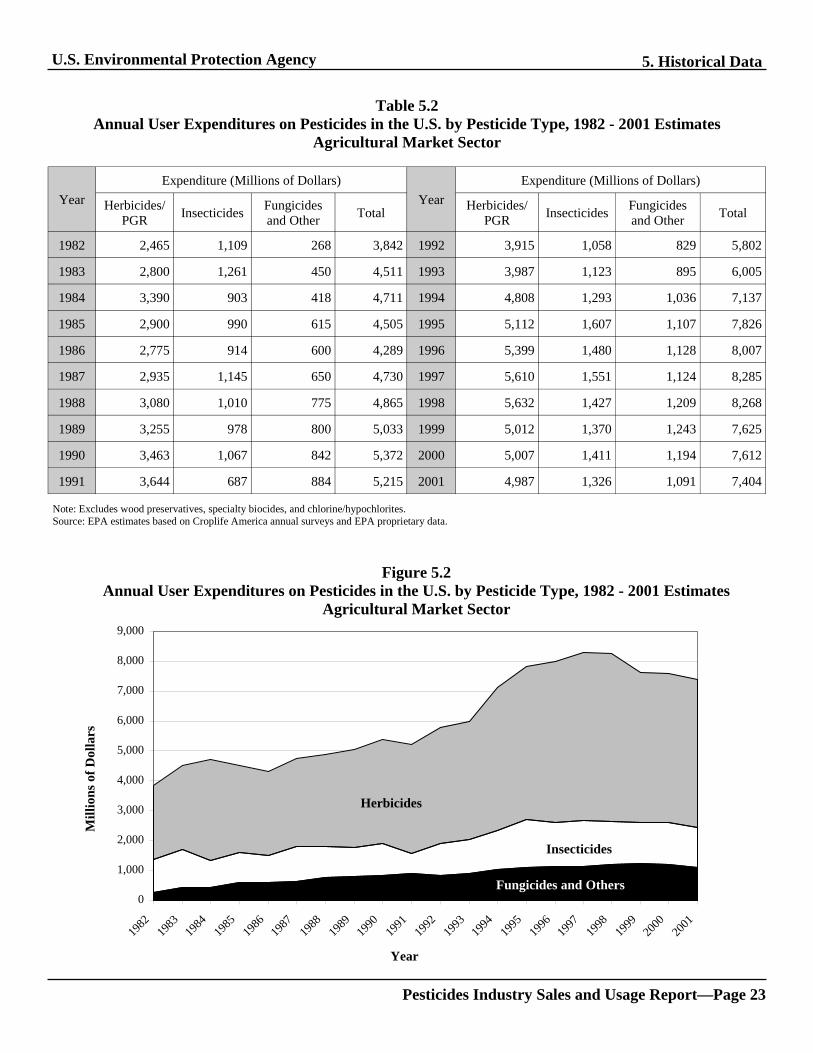
Tables 5.1 through 5.4 and corresponding figures summarize annual user expenditures on pesticides since 1982. Table 5.1 summarizes user expenditures on pesticides in all markets combined, while Tables 5.2, 5.3 and 5.4 and corresponding figures summarize user expenditures in the agricultural, industry/commercial/ government, and home and garden markets, respectively. In each market, user expenditures on pesticides have increased in total and by type since 1982, although the total amount fluctuated from year to year.
Pesticides Industry Sales and Usage Report—Page 21

U.S. Environmental Protection Agency 5. Historical Data
Table 5.1 Annual User Expenditures on Pesticides in the U.S. by Pesticide Type, 1982 - 2001 Estimates
All Market Sectors
Year Expenditure (Millions of Dollars)
Year Expenditure (Millions of Dollars)
Herbicides/ PGR Insecticides Fungicides
and Other Total Herbicides/ PGR Insecticides Fungicides
and Other Total
1982 3,772 2,014 540 6,326 1992 5,004 2,198 1,183 8,385
1983 3,870 2,074 731 6,675 1993 5,094 2,479 1,259 8,832
1984 4,488 1,809 708 7,005 1994 5,944 2,722 1,408 10,074
1985 3,920 1,823 963 6,706 1995 6,276 3,017 1,488 10,781
1986 3,858 1,759 967 6,584 1996 6,599 2,849 1,521 10,969
1987 3,973 2,008 1,049 7,030 1997 6,846 2,957 1,528 11,331
1988 4,121 1,964 1,190 7,275 1998 6,853 2,872 1,691 11,416
1989 4,305 1,978 1,141 7,424 1999 6,368 3,046 1,741 11,155
1990 4,473 2,083 1,171 7,727 2000 6,365 3,129 1,671 11,165
1991 4,682 2,139 1,223 8,044 2001 6,410 3,124 1,556 11,090
Note: Excludes wood preservatives, specialty biocides, and chlorine/hypochlorites. Source: EPA estimates based on Croplife America annual surveys and EPA proprietary data.
Figure 5.1 Annual User Expenditures on Pesticides in the U.S. by Pesticide Type, 1982 - 2001 Estimates
All Market Sectors
0
2,000
4,000
6,000
8,000
10,000
12,000
Herbicides
Fungicides and Others
Mill
ions
of D
olla
rs
and
Insecticides
1982
1983
1984
1985
1986
1987
1988
1989
1990
1991
1992
1993
1994
1995
1996
1997
1998
1999
2000
2001
Year
Page 22—2000 and 2001 Market Estimates
U.S. Environmental Protection Agency 5. Historical Data
Table 5.2 Annual User Expenditures on Pesticides in the U.S. by Pesticide Type, 1982 - 2001 Estimates
Agricultural Market Sector
Year Expenditure (Millions of Dollars)
Year Expenditure (Millions of Dollars)
Herbicides/ PGR Insecticides Fungicides
and Other Total Herbicides/ PGR Insecticides Fungicides
and Other Total
1982 2,465 1,109 268 3,842 1992 3,915 1,058 829 5,802
1983 2,800 1,261 450 4,511 1993 3,987 1,123 895 6,005
1984 3,390 903 418 4,711 1994 4,808 1,293 1,036 7,137
1985 2,900 990 615 4,505 1995 5,112 1,607 1,107 7,826
1986 2,775 914 600 4,289 1996 5,399 1,480 1,128 8,007
1987 2,935 1,145 650 4,730 1997 5,610 1,551 1,124 8,285
1988 3,080 1,010 775 4,865 1998 5,632 1,427 1,209 8,268
1989 3,255 978 800 5,033 1999 5,012 1,370 1,243 7,625
1990 3,463 1,067 842 5,372 2000 5,007 1,411 1,194 7,612
1991 3,644 687 884 5,215 2001 4,987 1,326 1,091 7,404
Note: Excludes wood preservatives, specialty biocides, and chlorine/hypochlorites. Source: EPA estimates based on Croplife America annual surveys and EPA proprietary data.
Figure 5.2 Annual User Expenditures on Pesticides in the U.S. by Pesticide Type, 1982 - 2001 Estimates
Agricultural Market Sector 9,000
8,000
7,000
6,000
5,000
4,000
3,000
2,000
1,000
0
Herbicides
Fungicides and Others
Insecticides
Mill
ions
of D
olla
rs
1982
1983
1984
1985
1986
1987
1988
1989
1990
1991
1992
1993
1994
1995
1996
1997
1998
1999
2000
2001
Year
Pesticides Industry Sales and Usage Report—Page 23

U.S. Environmental Protection Agency 5. Historical Data
Table 5.3 Annual User Expenditures on Pesticides in the U.S. by Pesticide Type, 1982 - 2001 Estimates
Industry/Commercial/Government Market Sector
Year Expenditure (Millions of Dollars)
Year Expenditure (Millions of Dollars)
Herbicides/ PGR Insecticides Fungicides
and Other Total Herbicides/ PGR Insecticides Fungicides
and Other Total
1982 852 305 142 1,299 1992 648 378 186 1,212
1983 720 288 144 1,152 1993 660 406 191 1,257
1984 720 365 150 1,235 1994 679 533 197 1,409
1985 600 315 180 1,095 1995 700 527 202 1,429
1986 642 316 192 1,150 1996 721 458 208 1,387
1987 576 330 210 1,116 1997 743 386 214 1,343
1988 600 394 240 1,234 1998 728 425 292 1,445
1989 630 317 180 1,127 1999 794 463 289 1,546
1990 593 307 169 1,069 2000 762 468 255 1,485
1991 616 328 176 1,120 2001 792 510 233 1,535
Mill
ions
of D
olla
rs
0
200
400
600
800
1,000
1,200
1,400
1,600
1,800
Herbicides
Fungicides and Others
Insecticides
Figure 5.3 Annual User Expenditures on Pesticides in the U.S. by Pesticide Type, 1982 - 2001 Estimates
Industry/Commercial/Government Market Sector
Note: Excludes wood preservatives, specialty biocides, and chlorine/hypochlorites. Source: EPA estimates based on Croplife America annual surveys and EPA proprietary data.
821
8419 86
1987
189
1990
1991
193
19 95199
61
9819 00
20013
195
198
192
194
197
198 9 992098 98 99 9919
Year
Page 24—2000 and 2001 Market Estimates

U.S. Environmental Protection Agency 5. Historical Data
Table 5.4 Annual User Expenditures on Pesticides in the U.S. by Pesticide Type, 1982 - 2001 Estimates
Home and Garden Market Sector
Year Expenditure (Millions of Dollars)
Year Expenditure (Millions of Dollars)
Herbicides/ PGR Insecticides Fungicides
and Other Total Herbicides/ PGR Insecticides Fungicides
and Other Total
1982 445 600 130 1,175 1992 441 762 168 1,371
1983 350 525 137 1,012 1993 446 870 174 1,490
1984 378 542 140 1,060 1994 456 895 175 1,526
1985 420 518 168 1,106 1995 465 883 179 1,527
1986 441 529 175 1,145 1996 479 910 185 1,574
1987 462 534 189 1,185 1997 493 1,020 190 1,703
1988 441 601 175 1,217 1998 493 1,020 190 1,703
1989 420 683 161 1,264 1999 562 1,213 209 1,984
1990 417 710 160 1,287 2000 596 1,250 222 2,068
1991 423 724 162 1,309 2001 631 1,288 232 2,151
Figure 5.4 Annual User Expenditures on Pesticides in the U.S. by Pesticide Type, 1982 - 2001 Estimates
Home and Garden Market Sector
Mill
ions
of D
olla
rs
0
500
1,000
1,500
2,000
2,500
Fungicides and Others
Insecticides
Herbicides
Note: Excludes wood preservatives, specialty biocides, and chlorine/hypochlorites. Source: EPA estimates based on Croplife America annual surveys and EPA proprietary data.
8219
319
419
519
619
719
919
019
119
219
319
94 995
996
997
998
0018 8 8 8 8 88
198 9 9 9 9
19 999
2000
21 1 1 1 1
Year
Pesticides Industry Sales and Usage Report—Page 25

U.S. Environmental Protection Agency 5. Historical Data
5.2 Annual Amount of Pesticides Used in the U.S.: 1982 - 2001
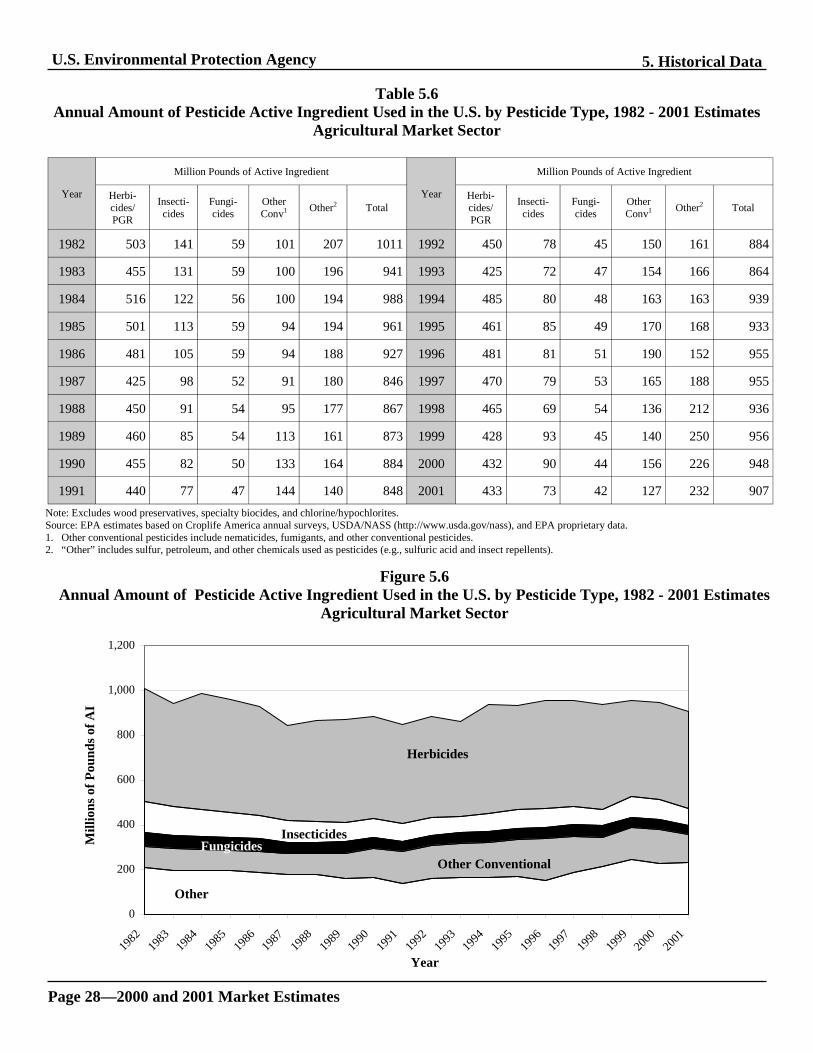
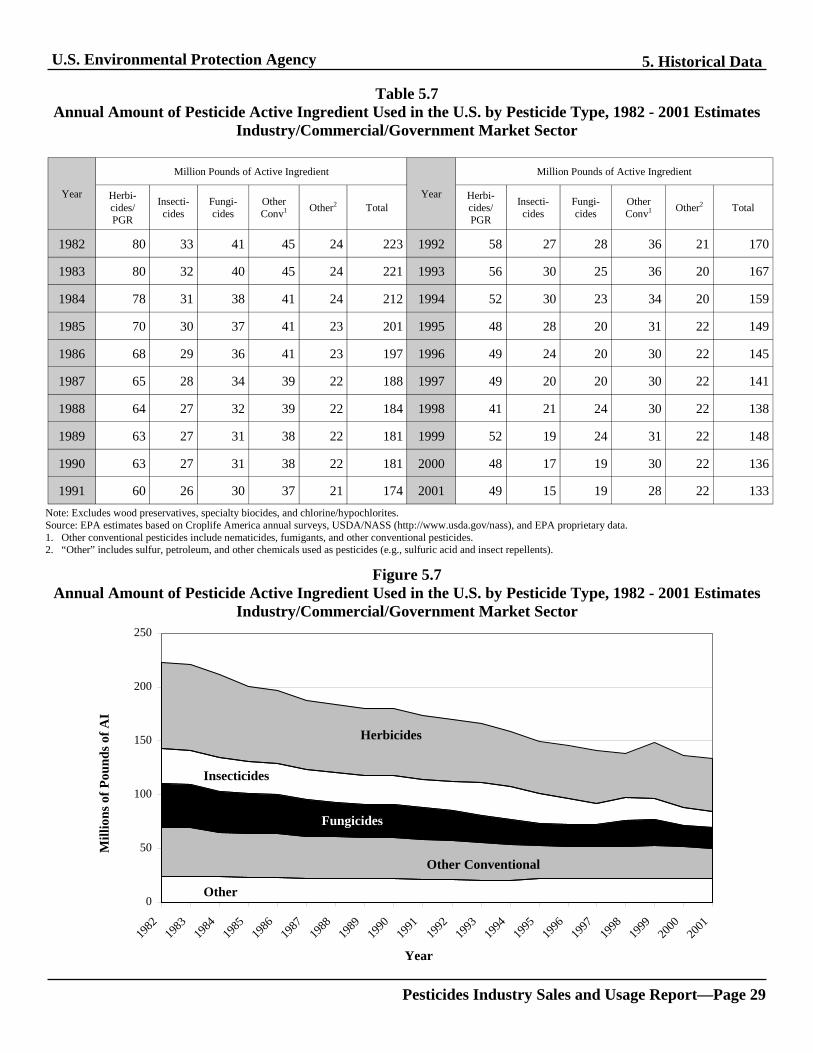
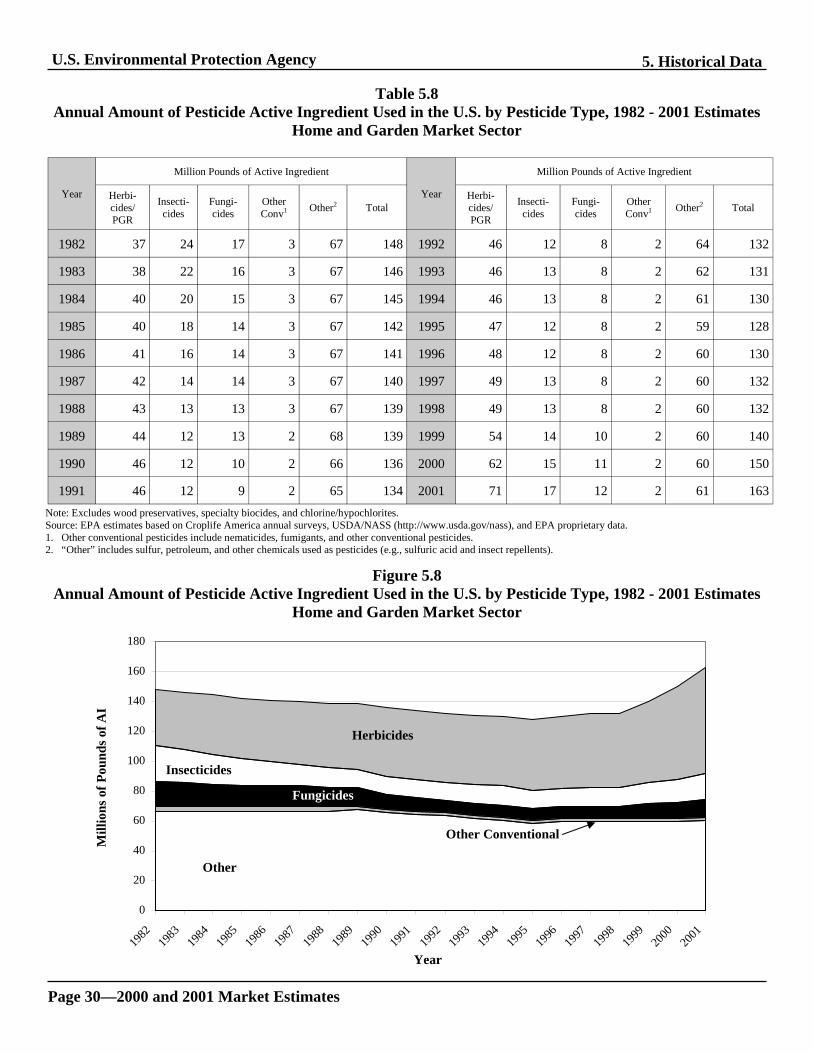
Tables 5.5 through 5.8 and corresponding figures summarize annual pounds of pesticides used since 1982. Table 5.5 summarizes the amount of pesticides used in all markets combined, while Tables 5.6, 5.7 and 5.8 and corresponding figures summarize the amount of pesticides used in the agricultural, industry/commercial/ government, and home and garden markets, respectively. In each market, except home and garden, the amount of pesticides used has decreased in total since 1982, although the total amount fluctuated from year to year.
Page 26—2000 and 2001 Market Estimates

U.S. Environmental Protection Agency 5. Historical Data
Table 5.5 Annual Amount of Pesticide Active Ingredient Used in the U.S. by Pesticide Type, 1982 - 2001 Estimates
All Market Sectors
Year
Million Pounds of Active Ingredient
Year
Million Pounds of Active Ingredient
Herbicides/ PGR
Insecticides
Fungicides
Other Conv1 Other2 Total
Herbicides/ PGR
Insecticides
Fungicides
Other Conv1 Other2 Total
1982 620 198 117 149 298 1,382 1992 554 116 81 189 246 1,186
1983 573 185 115 148 287 1,308 1993 527 115 80 192 248 1,162
1984 634 173 109 145 284 1,345 1994 583 124 79 199 244 1,229
1985 611 161 110 138 284 1,304 1995 556 125 77 203 249 1,210
1986 590 151 109 138 278 1,266 1996 578 116 79 222 234 1,229
1987 532 141 100 133 269 1,175 1997 568 112 81 197 270 1,228
1988 557 132 99 137 266 1,191 1998 555 103 86 168 294 1,206
1989 567 123 98 154 251 1,193 1999 534 126 79 173 332 1,244
1990 564 121 91 173 252 1,201 2000 542 122 74 188 308 1,234
1991 546 114 86 182 226 1,154 2001 553 105 73 157 315 1,203 Note: Excludes wood preservatives, specialty biocides, and chlorine/hypochlorites. Source: EPA estimates based on Croplife America annual surveys, USDA/NASS (http://www.usda.gov/nass), and EPA proprietary data.1. Other conventional pesticides include nematicides, fumigants, and other conventional pesticides. 2. “Other” includes sulfur, petroleum, and other chemicals used as pesticides (e.g., sulfuric acid and insect repellents).
Figure 5.5 Annual Amount of Pesticide Active Ingredient Used in the U.S. by Pesticide Type, 1982 - 2001 Estimates
All Market Sectors
0
200
400
600
800
1,000
1,200
1,400
1,600
Herbicides
Other Conventional
Insecticides
Other
Mill
ions
of P
ound
s of A
I
Fungicides
1982
1983
1984
1985
1986
1987
1988
1989
1990
1991
1992
1993
1994
1995
1996
1997
1998
1999
2000
2001
Year
Pesticides Industry Sales and Usage Report—Page 27
U.S. Environmental Protection Agency 5. Historical Data
Table 5.6 Annual Amount of Pesticide Active Ingredient Used in the U.S. by Pesticide Type, 1982 - 2001 Estimates
Agricultural Market Sector
Year
Million Pounds of Active Ingredient
Year
Million Pounds of Active Ingredient
Herbicides/ PGR
Insecticides
Fungicides
Other Conv1 Other2 Total
Herbicides/ PGR
Insecticides
Fungicides
Other Conv1 Other2 Total
1982 503 141 59 101 207 1011 1992 450 78 45 150 161 884
1983 455 131 59 100 196 941 1993 425 72 47 154 166 864
1984 516 122 56 100 194 988 1994 485 80 48 163 163 939
1985 501 113 59 94 194 961 1995 461 85 49 170 168 933
1986 481 105 59 94 188 927 1996 481 81 51 190 152 955
1987 425 98 52 91 180 846 1997 470 79 53 165 188 955
1988 450 91 54 95 177 867 1998 465 69 54 136 212 936
1989 460 85 54 113 161 873 1999 428 93 45 140 250 956
1990 455 82 50 133 164 884 2000 432 90 44 156 226 948
1991 440 77 47 144 140 848 2001 433 73 42 127 232 907 Note: Excludes wood preservatives, specialty biocides, and chlorine/hypochlorites. Source: EPA estimates based on Croplife America annual surveys, USDA/NASS (http://www.usda.gov/nass), and EPA proprietary data.1. Other conventional pesticides include nematicides, fumigants, and other conventional pesticides. 2. “Other” includes sulfur, petroleum, and other chemicals used as pesticides (e.g., sulfuric acid and insect repellents).
Figure 5.6 Annual Amount of Pesticide Active Ingredient Used in the U.S. by Pesticide Type, 1982 - 2001 Estimates
Agricultural Market Sector
0
200
400
600
800
1,000
1,200
Herbicides
Other Conventional
Other
Mill
ions
of P
ound
s of A
I
Fungicides Insecticides
1982
1983
1984
1985
1986
1987
1988
1989
1990
1991
1992
1993
1994
1995
1996
1997
1998
1999
2000
2001
Year
Page 28—2000 and 2001 Market Estimates
U.S. Environmental Protection Agency 5. Historical Data
Table 5.7 Annual Amount of Pesticide Active Ingredient Used in the U.S. by Pesticide Type, 1982 - 2001 Estimates
Industry/Commercial/Government Market Sector
Year
Million Pounds of Active Ingredient
Year
Million Pounds of Active Ingredient
Herbicides/ PGR
Insecticides
Fungicides
Other Conv1 Other2 Total
Herbicides/ PGR
Insecticides
Fungicides
Other Conv1 Other2 Total
1982 80 33 41 45 24 223 1992 58 27 28 36 21 170
1983 80 32 40 45 24 221 1993 56 30 25 36 20 167
1984 78 31 38 41 24 212 1994 52 30 23 34 20 159
1985 70 30 37 41 23 201 1995 48 28 20 31 22 149
1986 68 29 36 41 23 197 1996 49 24 20 30 22 145
1987 65 28 34 39 22 188 1997 49 20 20 30 22 141
1988 64 27 32 39 22 184 1998 41 21 24 30 22 138
1989 63 27 31 38 22 181 1999 52 19 24 31 22 148
1990 63 27 31 38 22 181 2000 48 17 19 30 22 136
1991 60 26 30 37 21 174 2001 49 15 19 28 22 133 Note: Excludes wood preservatives, specialty biocides, and chlorine/hypochlorites. Source: EPA estimates based on Croplife America annual surveys, USDA/NASS (http://www.usda.gov/nass), and EPA proprietary data.1. Other conventional pesticides include nematicides, fumigants, and other conventional pesticides. 2. “Other” includes sulfur, petroleum, and other chemicals used as pesticides (e.g., sulfuric acid and insect repellents).
Figure 5.7 Annual Amount of Pesticide Active Ingredient Used in the U.S. by Pesticide Type, 1982 - 2001 Estimates
Industry/Commercial/Government Market Sector
0
50
100
150
200
250
Herbicides
Insecticides
Other
Mill
ions
of P
ound
s of A
I
Fungicides
Other Conventional
982
1983
1984
1985
1986
1987
1988
1989
1990
1991
19
9219
9319
9419
9519
9619
9719
9819
9920
0020
01
1
Year
Pesticides Industry Sales and Usage Report—Page 29
U.S. Environmental Protection Agency 5. Historical Data
Table 5.8 Annual Amount of Pesticide Active Ingredient Used in the U.S. by Pesticide Type, 1982 - 2001 Estimates
Home and Garden Market Sector
Year
Million Pounds of Active Ingredient
Year
Million Pounds of Active Ingredient
Herbicides/ PGR
Insecticides
Fungicides
Other Conv1 Other2 Total
Herbicides/ PGR
Insecticides
Fungicides
Other Conv1 Other2 Total
1982 37 24 17 3 67 148 1992 46 12 8 2 64 132
1983 38 22 16 3 67 146 1993 46 13 8 2 62 131
1984 40 20 15 3 67 145 1994 46 13 8 2 61 130
1985 40 18 14 3 67 142 1995 47 12 8 2 59 128
1986 41 16 14 3 67 141 1996 48 12 8 2 60 130
1987 42 14 14 3 67 140 1997 49 13 8 2 60 132
1988 43 13 13 3 67 139 1998 49 13 8 2 60 132
1989 44 12 13 2 68 139 1999 54 14 10 2 60 140
1990 46 12 10 2 66 136 2000 62 15 11 2 60 150
1991 46 12 9 2 65 134 2001 71 17 12 2 61 163 Note: Excludes wood preservatives, specialty biocides, and chlorine/hypochlorites. Source: EPA estimates based on Croplife America annual surveys, USDA/NASS (http://www.usda.gov/nass), and EPA proprietary data.1. Other conventional pesticides include nematicides, fumigants, and other conventional pesticides. 2. “Other” includes sulfur, petroleum, and other chemicals used as pesticides (e.g., sulfuric acid and insect repellents).
Figure 5.8 Annual Amount of Pesticide Active Ingredient Used in the U.S. by Pesticide Type, 1982 - 2001 Estimates
Home and Garden Market Sector
0
20
40
60
80
100
120
140
160
180
Herbicides
Insecticides
Other Conventional
Other
Mill
ions
of P
ound
s of A
I
Fungicides
1982
1983
1984
1985
1986
1987
1988
1989
1990
1991
19
9219
9319
9419
9519
9619
9719
9819
9920
0020
01
Year
Page 30—2000 and 2001 Market Estimates

U.S. Environmental Protection Agency 5. Historical Data
Table 5.9 Conventional Pesticide Active Ingredient Used in the U.S.
Agricultural and Non-Agricultural Market Sector Shares, 1964 - 2001
Year Total U.S. Agricultural Sector Non- Agricultural Sector
Million Pounds of Million Pounds of % of total Million Pounds of Active Ingredient Active Ingredient U.S. Active Ingredient
1964 617 366 59 251 1965 658 396 60 262 1966 682 414 61 268 1967 712 429 60 283 1968 742 457 62 285 1969 763 491 64 272 1970 760 499 66 261 1971 793 528 67 265 1972 843 575 68 268 1973 882 607 69 275 1974 964 688 71 276 1975 1013 729 72 284 1976 1041 753 72 288 1977 1084 794 73 290 1978 1106 813 74 293 1979 1144 843 74 301 1980 1121 826 74 295 1981 1118 831 74 287 1982 1084 804 74 280 1983 1021 745 73 276 1984 1061 794 75 267 1985 1020 767 75 253 1986 988 739 75 249 1987 906 666 74 240 1988 925 690 75 235 1989 942 712 76 230 1990 949 720 76 229 1991 928 708 76 220 1992 940 723 77 217 1993 914 698 76 216 1994 984 776 79 208 1995 961 765 80 196 1996 996 803 81 193 1997 958 767 80 191 1998 912 724 79 188 1999 912 706 77 206 2000 926 722 78 204 2001 888 675 76 213
Note: Conventional pesticides only, excluding sulfur, petroleum oil and other chemicals used as pesticides (e.g., sulfuric acid and insect repellants), wood preservatives, specialty biocides, and chlorine/hypochlorites.Source: EPA estimates based on Croplife America annual surveys, USDA/NASS (http://www.usda.gov/nass), and EPA proprietary data.
Pesticides Industry Sales and Usage Report—Page 31

U.S. Environmental Protection Agency 6. Glossary
6. Glossary ACTIVE INGREDIENT (A.I.): The chemical or substance component of a pesticide product intended to kill, repel, attract, mitigate, or control a pest, or that acts as a plant growth regulator, desiccant, or nitrogen stabilizer. The remainder of a formulated pesticide product consists of one or more “inert ingredients” (e.g., water, solvents, emulsifiers, surfactants, clay, and propellants), which are there for reasons other than pesticidal activity.
AGRICULTURAL USER SECTOR (OR MARKET): Pesticides applied by owner/operators and custom/ commercial applicators to farms and facilities involved in the production of raw agricultural commodities, principally food, fiber, and tobacco; includes non-crop and post-harvest use as well as crop and field applications.
CERTIFIED APPLICATOR: A person who is authorized to apply “restricted-use” pesticides as a result of meeting requirements for certification under FIFRA-mandated programs. Applicator certification programs are conducted by states, territories, and tribes in accordance with national standards set by EPA. “Restricted-use pesticides” may be used only by or under the direct supervision of specially trained and certified applicators.
COMMERCIAL APPLICATOR: A person applying pesticides as part of a business, applying pesticides for hire, or a person applying pesticides as part of his or her job with another (not for hire) type of business, organization, or agency. Commercial applicators often are certified, but need to be so only if they use restricted-use pesticides.
CROPLIFE AMERICA: Formerly the American Crop Protection Association (ACPA), which publishes an annual pesticide industry profile (ACPA Industry Profile). The profile is a survey of pesticide sales provided by participating ACPA members.
CONVENTIONAL PESTICIDES: Pesticides that are chemicals or other substances developed and produced primarily or only for use as pesticides. An example is DDT, which was developed and used almost exclusively as a pesticide. Also includes biological and biochemical pesticides, e.g., Bacillus thuringiensis.
ECONOMIC USER SECTORS (OR MARKETS): In this report, estimates of quantities used and user expenditures for pesticides are broken out separately for the three general economic user sectors (or markets) as follows: agriculture, industrial/commercial/governmental, and home & garden. These three sectors/markets are defined elsewhere in this glossary.
FDA: The U.S. Food and Drug Administration, a branch of the U.S. Department of Health and Human Services, is involved in regulation of pesticides in the U.S., particularly enforcement of tolerances in food and feed products.
FFDCA: Federal Food, Drug, and Cosmetic Act, the law that controls pesticide residues in food and feed.
FIFRA: Federal Insecticide, Fungicide, and Rodenticide Act, the law that generally controls pesticide sale and use.
FQPA: The Food Quality Protection Act (FQPA) of 1996 amended the Federal Insecticide, Fungicide, and Rodenticide Act (FIFRA) and the Federal Food, Drug, and Cosmetic Act (FFDCA).
HOME AND GARDEN USER SECTOR (OR MARKET): Involves pesticides applied by homeowners to homes and gardens, including lawns and single- and multiple-unit housing. Does not include pesticides for home & garden applications by professional applicators.
INDUSTRIAL/COMMERCIAL/GOVERNMENTAL USER SECTOR (OR MARKET): Involves pesticides applied by professional applicators (by owner/operators/employees and custom/commercial applicators) to industrial, commercial, and governmental facilities, buildings, sites, and land; plus custom/commercial applications to homes and gardens, including lawns. May also be referred to as “professional market” for pesticides.
NON-AGRICULTURAL SECTORS: General term referring to a combination of home & garden and industrial/ commercial/governmental sectors.
Page 32—2000 and 2001 Market Estimates
U.S. Environmental Protection Agency 6. Glossary OTHER PESTICIDES: Chemicals registered as pesticides but that are produced and marketed mostly for other purposes, i.e., multi-use chemicals. Notable examples are sulfur, petroleum products (e.g., kerosene, oils, and distillates), salt, and sulfuric acid.
PESTICIDE: May be used to refer to an active ingredient (as defined above) or formulated pesticide product registered under FIFRA.
PESTICIDE USER EXPENDITURES: Dollar value of purchases by persons or businesses applying pesticides, such as farmers, commercial pesticide applicators, and homeowners. Reported numbers are nominal values for the years indicated (i.e., not adjusted or indexed for inflation).
PESTICIDE USAGE: Refers to actual applications of pesticides, generally in terms of quantity applied or units treated.
PRIVATE APPLICATOR: A category of applicator certification for farmers and/or employees, such that they can legally apply restricted-use pesticides or supervise others doing so who are not certified.
PRODUCER LEVEL: Refers to pesticide manufactures of registrants.
PROFESSIONAL MARKET: Sales of pesticides for application to industrial/commercial/governmental sector and to homes and gardens, by certified/commercial applicators.
PROPRIETARY DATA: Pesticide industry market research data that EPA purchases from private data research companies. These data are for EPA use only and cannot be divulged without vendor consent. Companies include Doane Marketing Research, Inc.; Kline and Company, Inc.; SRI, Inc.; Wood Mackenzie; and Mike Bukley, Inc.
SAFER PESTICIDES: Pesticides designated as “safer” (or “reduced risk”) by EPA exhibit favorable characteristics affecting health or environmental risks, resistance management, and integrated pest management. Reduced-risk pesticides may be conventional pesticides posing less risk, or biopesticides with unique modes of action, low use volume, lower toxicity, target species specificity, or natural occurrence.
SPECIALTY BIOCIDES: This report provides estimates for end uses as follows: swimming pools, spas, and industrial water treatment (excluding chlorine/hypochlorites, which are reported separately); disinfectants and sanitizers (including industrial/institutional applications and household cleaning products); and other specialty biocides (including biocides for adhesives and sealants, leather, synthetic latex polymers, metal-working fluids, paints and coatings, petroleum products, plastics, and textiles). These categories of end use are covered by FIFRA. Other end uses of specialty biocides (e.g., hospital/medical antiseptics, food/feed preservatives, cosmetics/toiletries) are regulated by the FDA under FFDCA and are not covered in this report.
TOLERANCE: The maximum amount of a pesticide allowable in a food or feed product before it is considered adulterated, usually specified in parts per million.
USDA/FATUS: The U.S. Department of Agriculture, Foreign Agricultural Trade of U.S. Publicly available data on U.S. agricultural imports and exports (http://www.ers.usda.gov/db/fatus).
USDA NASS: The U.S. Department of Agriculture, National Agricultural Statistics Service. Publicly available data on U.S. agricultural pesticide use (http://www.uda.gov/nass/).
USER LEVEL: Refers to pesticide users (i.e., growers, farmers, home owners, and professional pesticide Applicators).
WOOD PRESERVATIVES: Pesticide active ingredients used in treatment of wood to protect it from insects, fungi, and other pests. This report presents total use of wood preservative chemicals in industrial plants, the bulk of which is for pressure treatment. The major categories of pesticide chemicals included in this report as industrial wood preservatives are water-borne preservatives (mainly chromated copper arsenic), oil-borne preservatives (e.g., copper naphthenate and pentachlorophenol), creosote, creosote-coal tar, and creosote petroleum.
Pesticides Industry Sales and Usage Report—Page 33


United States Environmental Protection Agency Office of Prevention, Pesticides, and Toxic Substances (7503C) EPA-733-R-04-001 www.epa.gov/pesticides May 2004