20 mph zones and speed limits factsheet feb 2017€¦ · · 2018-03-0628 calthorpe road,...
TRANSCRIPT
28 Calthorpe Road, Edgbaston, Birmingham B15 1RP | Telephone 0121 248 2000 Registered Charity No: 207823 | www.rospa.com
The Royal Society for the Prevention of Accidents
Road Safety factsheet: 20mph Zones and Speed Limits
November 2017
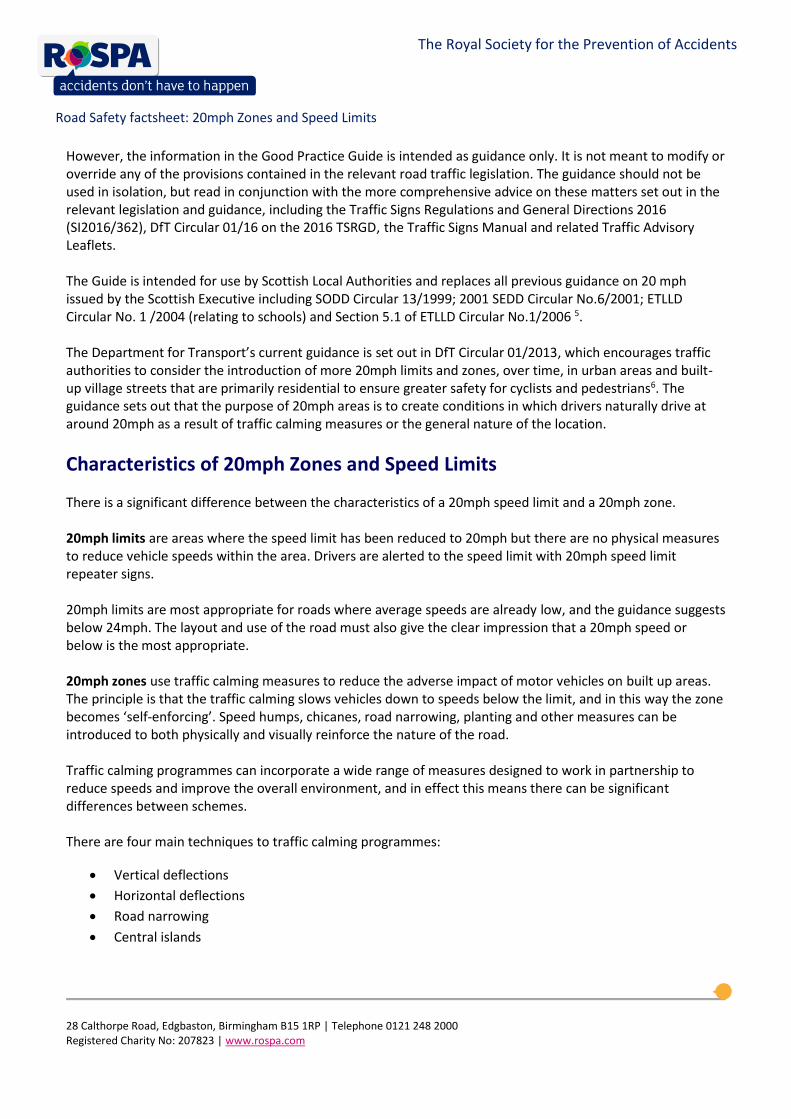
20mph Zones and Speed Limits Factsheet The majority of pedestrian casualties occur in built up areas: 29 of the 34 child pedestrians and 302 of the 413 adult pedestrians who were killed in 2016, died on built-up roads. Pedal cyclists are also vulnerable in built up areas, with over half of cyclist deaths (58 of 102) and most cyclist casualties (16,934 of 18,477) occurring on these roads.1 In 2016, 789 people were killed, 15,993 were seriously injured and 113,055 slightly injured in reported road collisions on built up* roads in Great Britain1. A large proportion of these accidents occurred on residential roads, with 90 deaths on B roads in built-up areas and 309 deaths on other minor roads in built-up areas2. Speed significantly increases the chance of being injured in a collision. Research has shown that the risk of death for pedestrians struck by cars increases at higher impact speeds, although the exact risk levels varied between the studies. One of the first studies of pedestrian injury and car impact speed3 found that at 20mph there was a 2.5% chance of being fatally injured, compared to a 20% chance at 30mph, although this study is now regarded as having overestimated the risks. A recent review identified the studies which had produced the most reliable modern estimates4. The results from one of these studies is presented in figure 1, which shows a fatality risk of 1.5% at 20 mph versus 8% at 30 mph.
Fig 1: Showing the relationship between the risk of fatal injury to adult pedestrians and vehicle impact speed † The solid line is the most likely estimate and the dotted lines show the 95% confidence limits.
Road Safety Factsheet
28 Calthorpe Road, Edgbaston, Birmingham B15 1RP | Telephone 0121 248 2000 Registered Charity No: 207823 | www.rospa.com
The Royal Society for the Prevention of Accidents
Road Safety factsheet: 20mph Zones and Speed Limits
History of 20mph Speed Limits in the UK In December 1990 the Department of Transport issued Circular Roads 4/90 which set out guidelines for the introduction of 20mph speed limits; local authorities had to apply for consent from the Secretary of State to introduce a 20mph zone. The initiative was based on experience internationally, which had demonstrated that lower speed limits could have safety benefits when combined with traffic calming measures to ensure that vehicles maintained low speeds through the zone. Road safety publicity messages at the time, such as the “Kill Your Speed, Not a Child” campaign highlighted 20mph speeds as crucial to reducing the risks of injury in an accident. The first 20mph limit was in Tinsley, Sheffield on the junction between Raby Street and Sheffield Road. Kingston upon Thames and Norwich introduced 20mph zones shortly after. There were 450 20mph speed limits introduced between 1991 and 1999. In 1999, the law was changed by the Road Traffic Regulation Act (Amendment) Order 1999, which gave Highways Authorities more flexibility so they no longer had to apply for permission to introduce a zone. The updated legislation made two distinct types of 20mph speed limit possible:
20mph limits, which consist of just a speed limit change to 20mph which is indicated by the speed limit (and repeater) signs, and
20mph zones, which were designed to be “self-enforcing” due to the traffic calming measures that were introduced along with the change in the speed limit.
It, therefore, suggests that 20mph limits are appropriate for roads where average speeds are already low (below 24mph) or along with traffic calming measures. Ultimately the Local Authority is responsible for deciding which of these was the most appropriate.
In January 2015, the Scottish Government published their Good Practice Guide in relation to the setting of 20mph speed restrictions (updated 2016). The document aims to provide greater clarity on the options available to local authorities in setting 20 mph speed restrictions throughout Scotland. Whilst encouraging consistency across the country, local authorities have options to introduce them near schools, in residential areas and in other areas of our towns and cities where there is a significant volume of pedestrian or cyclist activity. It also aims to encourage local authorities to set 20 mph speed restrictions, where appropriate.
Local authorities have a number of options when considering introducing a 20 mph speed restriction, including:-
20 mph speed limit zones
20 mph limits
Variable and part time 20 mph limits
28 Calthorpe Road, Edgbaston, Birmingham B15 1RP | Telephone 0121 248 2000 Registered Charity No: 207823 | www.rospa.com
The Royal Society for the Prevention of Accidents
Road Safety factsheet: 20mph Zones and Speed Limits
However, the information in the Good Practice Guide is intended as guidance only. It is not meant to modify or override any of the provisions contained in the relevant road traffic legislation. The guidance should not be used in isolation, but read in conjunction with the more comprehensive advice on these matters set out in the relevant legislation and guidance, including the Traffic Signs Regulations and General Directions 2016 (SI2016/362), DfT Circular 01/16 on the 2016 TSRGD, the Traffic Signs Manual and related Traffic Advisory Leaflets. The Guide is intended for use by Scottish Local Authorities and replaces all previous guidance on 20 mph issued by the Scottish Executive including SODD Circular 13/1999; 2001 SEDD Circular No.6/2001; ETLLD Circular No. 1 /2004 (relating to schools) and Section 5.1 of ETLLD Circular No.1/2006 5. The Department for Transport’s current guidance is set out in DfT Circular 01/2013, which encourages traffic authorities to consider the introduction of more 20mph limits and zones, over time, in urban areas and built-up village streets that are primarily residential to ensure greater safety for cyclists and pedestrians6. The guidance sets out that the purpose of 20mph areas is to create conditions in which drivers naturally drive at around 20mph as a result of traffic calming measures or the general nature of the location.
Characteristics of 20mph Zones and Speed Limits There is a significant difference between the characteristics of a 20mph speed limit and a 20mph zone. 20mph limits are areas where the speed limit has been reduced to 20mph but there are no physical measures to reduce vehicle speeds within the area. Drivers are alerted to the speed limit with 20mph speed limit repeater signs. 20mph limits are most appropriate for roads where average speeds are already low, and the guidance suggests below 24mph. The layout and use of the road must also give the clear impression that a 20mph speed or below is the most appropriate. 20mph zones use traffic calming measures to reduce the adverse impact of motor vehicles on built up areas. The principle is that the traffic calming slows vehicles down to speeds below the limit, and in this way the zone becomes ‘self-enforcing’. Speed humps, chicanes, road narrowing, planting and other measures can be introduced to both physically and visually reinforce the nature of the road. Traffic calming programmes can incorporate a wide range of measures designed to work in partnership to reduce speeds and improve the overall environment, and in effect this means there can be significant differences between schemes. There are four main techniques to traffic calming programmes:
Vertical deflections
Horizontal deflections
Road narrowing
Central islands
28 Calthorpe Road, Edgbaston, Birmingham B15 1RP | Telephone 0121 248 2000 Registered Charity No: 207823 | www.rospa.com
The Royal Society for the Prevention of Accidents
Road Safety factsheet: 20mph Zones and Speed Limits
Vertical deflections in the carriageway are the most effective and reliable of the speed reduction measures currently available. There are several different techniques available to achieve this:
Road hump
Plateau (speed table)
Cushion
Uneven road surface (rumble strips) Horizontal deflections in the carriageway are less effective than vertical ones in achieving reductions in speed, although their impact is significantly increased when used in combination with a vertical measure. Essentially all horizontal shifts may be classified as chicanes. The impact of chicanes is reduced if the design has to allow for the passage of HGVs as the wider carriageway increases the speed that it can be negotiated at. Chicanes can significantly reduce parking spaces. Road narrowing can also be used to support vertical deflections. It is not a speed-reducing device in itself, but it can be a reminder or encouragement to drive slowly or calmly. The effectiveness of this measure in controlling speed can be increased if the carriageway width is reduced to a single lane. However, this is largely dependent on the balance of the opposing traffic flows. The extra space created by road narrowing can be used to provide some combination of widened footways, dedicated cycle lanes and formalised parking bays, or to provide more space for public transport, for example, bus lanes. Central islands have only a limited effect on reducing speeds unless combined with another measure such as a chicane. They do, however, provide useful pedestrian refuges. Often, traffic calming involves providing more space for pedestrians and cyclists, and improving the local environment. Traffic calming schemes operate on a principle of shared space between all road users. Roads can be redesigned to give greater prominence to the residential function of the road and reduce the dominance of motor vehicles.
Locations of 20mph Zones The Department for Transport commissioned research in 2009 to estimate some of the characteristics of 20mph zones in England7. It found that zones typically covered between 1km and 25km of roads. The study found that there was a correlation between 20mph zones and schools, with over half of the zones being next to a school. There was no correlation between zones and hospitals, which the report also notes are a significant destination in urban areas. The research also looked at several Local Highway Authorities to examine the relationship between 20mph zones and the Indices of Multiple Deprivation data where they are implemented. This showed that:
33% of LHAs had implemented the majority of 20mph zones in the most deprived areas;
33% of LHAs had implemented the majority of 20mph zones in the least deprived areas; and
33% of LHAs had implemented 20mph zones in a relatively even mix between areas of least and most deprivation.
28 Calthorpe Road, Edgbaston, Birmingham B15 1RP | Telephone 0121 248 2000 Registered Charity No: 207823 | www.rospa.com
The Royal Society for the Prevention of Accidents
Road Safety factsheet: 20mph Zones and Speed Limits
Another study used high-resolution map data to study the distribution of traffic calming and to determine how the distribution of traffic calming varied by deprivation across small areas, in 5 locations nationally8. It found that traffic calming measures were most likely to be found in the most deprived areas. 20mph zones can be effective safety measures across areas of all socioeconomic groups9. This is important as there is a well established link between socio-economic status and risk of being injured in road traffic accidents. Research has found that children from the lowest socioeconomic group in England and Wales are five times more likely to be injured in accidents than those from the highest10.
Effectiveness of 20mph Zones and Speed Limits Evidence shows that 20mph zones are an effective way of preventing injuries on the road. There is less experience with 20mph limits although they have generally been positive at reducing traffic speeds. They do not reduce traffic speeds as much as zones.
20mph Zones Before 20mph zones were first introduced in the UK, it had been recognised in the Netherlands that 30km/h was a suitable speed for residential areas and that vehicle speeds could be reduced through road design. In 1984, regulations were introduced which allowed municipalities to reduce traffic speeds and volumes through this approach. An evaluation of 15 of the 30km/h zones was conducted. There were engineering measures in all of these areas, including signage, speed humps, narrower roads and chicanes. The reduction in speed was dependent on the type of engineering measure introduced into the area, but speed humps and narrowing the road almost always reduced vehicle speeds to below 30km/h. The researchers noted that there was also a reduction in traffic volume by 5% to 30%. There were reductions in the number of accidents and injury accidents compared to the rest of the municipalities with the experimental areas and also the whole of the Netherlands. Whilst both accidents and injury accidents showed between a 10% reduction to 5% increase in the 6 years following their introduction in the municipality and whole of the Netherlands; the number of accidents dropped to around 80-85% of the initial figure in the trial areas, and injury accidents dropped to between 60-80%. The first widespread evaluation of 20mph zones in the UK was carried out by TRL in 199611. It found that injury accidents were reduced by 60%, and child injury accidents were reduced by 67%. The evaluation did not find evidence that accidents increased on surrounding roads due to drivers changing their route. There was a decrease in traffic by 27% in the zones during the evaluation, but the authors attributed a large part of this to bypasses which were also built in conjunction with some of the schemes to take through traffic away from the area.
28 Calthorpe Road, Edgbaston, Birmingham B15 1RP | Telephone 0121 248 2000 Registered Charity No: 207823 | www.rospa.com
The Royal Society for the Prevention of Accidents
Road Safety factsheet: 20mph Zones and Speed Limits
From 1994, there was a widespread introduction of 20mph zones in Hull, and by 2003, there were 120 zones covering 500 streets. The casualty statistics between 1994 and 2001 showed a drop of 14% in Hull, compared to a rise of 1.5% in the rest of Yorkshire and Humberside. In the 20mph zones in Hull, there was a decrease in total accidents of 56% and in fatal and serious injuries of 90%. The biggest reductions were pedestrian casualties, which fell by 54%, child casualties, which dropped by 54% and child pedestrian casualties, which fell by 74%. These figures were reported in Local Transport Today12. A 2007 review of half of the 20mph zones which had been implemented in London (78 zones) found that they reduced injury accidents by about 42% and fatal or serious accidents by 53%13. A major review of road casualties in London between 1986 and 2006 was published in the BMJ in 200914. It demonstrated that 20mph zones reduced the number of casualties by over 40% (41.9%). The 20mph zones were slightly more effective in preventing fatal or serious injuries to children, which were reduced by half (50.2%). There was a smaller reduction in casualties among cyclists than any of the other major groups of road users studied, with a reduction of 16.9%. The analysis showed that the reduction in road injuries in 20mph zones occurred at a greater rate than the overall trend of reduction in casualties in London, that this was not attributable to any regression-to-the-means effect, and that there was no displacement in accident risk to roads close to the 20mph zones. Based on the casualty reductions seen in the 2009 BMJ paper, the North West Public Health Observatory predicted what the effect would be of introducing 20mph zones in all residential zones in the North West region15. Casualty figures collected by the police were used and the average number of casualties per year in the region was calculated using data from between 2004 and 2008. This study found that there would have been 140 fewer killed or seriously injured child casualties if there were 20mph zones in all residential areas in the region. This was an improvement of 26% on the actual figures. In addition, there would have been a 26% reduction of all pedestrian casualties and 14% reduction in all cyclist casualties.
Traffic Calming Many 20mph zones use area wide traffic calming measures to ensure lower speeds, and there have been two reviews of the literature, although the areas reviewed employed a wide range of traffic calming measures and may not necessarily have used lower speed limits as part of the measure.
A Cochrane review found that area-wide traffic calming in towns and cities may be a promising intervention for reducing the number of road traffic injuries and deaths16. A meta analysis found that traffic calming schemes reduced the number of injury accidents by about 15% on average, with schemes in residential areas showing a greater reduction17.

28 Calthorpe Road, Edgbaston, Birmingham B15 1RP | Telephone 0121 248 2000 Registered Charity No: 207823 | www.rospa.com
The Royal Society for the Prevention of Accidents
Road Safety factsheet: 20mph Zones and Speed Limits
20mph Limits The earliest examples where 20mph (30km/h) limits have been introduced without traffic calming are outside of the UK. Graz, in Austria, introduced 30km/h as the speed limit on all residential streets in September 1992. This accounts for around 800km of roads in the city, around 4/5ths of the total network18. The introduction was part of a comprehensive traffic plan in the city. The two strands were: to promote walking, cycling and public transport through improving the infrastructure and education activities; and to limit the volume and speed of traffic through introducing restrictions in the city centre and prioritising public transport. The limit itself was marked by signage and a key component was police enforcement of the limit. An education campaign about the limit also accompanied the change. There was only a small reduction in average speeds before and after the limit was introduced, however, there was a reduction in extreme speeds. The number of drivers exceeding 50 km/h (31 mph) dropped from 7.3% percent the year before the limits were introduced, to 3% afterwards. Comparing the year after the introduction of the limits, there was a 12% reduction in accidents which resulted in a minor injury and 24% fewer accidents which resulted in a serious injury. There was a reduction in all pedestrian accidents by 17% and with car drivers by 14%. There were also reductions in the number of accidents on the roads which remained at 50km/h; this was seen at both crossings and free stretches of road. The researchers argued that this was due to the comprehensive traffic plan establishing a new “traffic culture”. To control for the effects of increased enforcement of the new limit, a comparison was made by giving police in other cities the same laser enforcement equipment used in Graz. These cities showed either a smaller decrease, or an increase, in the number of accidents. There has been an expansion of 20mph limits in the UK recently. Several English authorities have implemented 20mph as the default limit for residential streets, including Oxford, Bristol, Warrington and Hackney. A number have also made political commitment in recent years to 20mph limits in principle, such as Norwich and Birmingham19. The reasons for this rapid expansion are not solely for road safety, and many are being introduced to contribute towards healthier environments. TRL carried out research on 20mph limits in 1998, which examined the effectiveness of 20mph limits without traffic calming measures20. It found that traffic calming was a more effective way of reducing vehicle speeds than signs only, which only produced a small reduction in speed. There was some evidence that public awareness campaigns and enforcement further reduced traffic speeds. In 2007, the speed limit was reduced from 30mph to 20mph on around 94% of roads in Portsmouth21. 223 sites within Portsmouth, split between six different areas of the city were monitored. A distinction was made between roads where the average speed before the 20mph zone was introduced was: 20mph or less; between 21 and 24 mph; and over 24mph. This allowed the effect of the limits to be examined in these different conditions. The before and after period, when the traffic speeds were measured, was different for each of the six areas. This was due to the staggered introduction.
28 Calthorpe Road, Edgbaston, Birmingham B15 1RP | Telephone 0121 248 2000 Registered Charity No: 207823 | www.rospa.com
The Royal Society for the Prevention of Accidents
Road Safety factsheet: 20mph Zones and Speed Limits
There was an overall average speed reduction of 1.3mph following the introduction of the limits, as the average speed dropped from 19.8mph to 18.5mph. The change across the six areas varied from a reduction of 0.6mph to 1.7mph. This was a statistically significant reduction in speeds across the city. Overall, there was a drop in the number of police reported injuries in the six areas comparing the average of 163.7 casualties per year over the 3 years before the introduction and an average of 129.4 casualties per year in the two years after. This represented a 21% reduction. The number of KSIs rose from an average of 18.3 per year to 19.9 per year in the same time period, although the relatively low numbers of recorded KSI casualties in Portsmouth mean that small fluctuations up and down by chance can have an undue influence on this. Much of this increase came from the number of pedestrians injured and it was not possible to measure whether the amount of pedestrian activity had increased following the introduction of the 20mph limits. Bristol has also piloted 20mph limits in two areas using only signage as one element of a strategy to increase physical activity in Bristol22 along with events that encourage children to play outside and increase the uptake of cycling. There was also a communications strategy, which resulted in several different education campaigns about the 20mph limits. The Inner East Bristol pilot area covered around 300 roads and the Inner South Bristol pilot area covered around 200. Vehicle Activated Signs were used on higher speed or major roads within the areas to supplement the signage at entry points, and repeater signs. Roundels with the speed limit painted onto the road were also used. Two years after the introduction of the limits, speed surveys were recorded on 10% of the roads covered by the scheme. There was a reduction in mean daytime speeds on 65% of the roads. On residential roads, there was on average a 0.4mph reduction in traffic speeds. There was a greater reduction on main roads, as 1.7mph was the average reduction in the Inner East area and 1.3mph in the Inner South area. There were reductions in speed in the 30mph roads within the areas too. In the Inner South area, there was a reduction of 1mph comparing the mean speeds before and after, and in the Inner East area, there was a 9.2mph reduction on the same roads. There was a 1.1mph reduction in average speeds on 30mph roads outside of the Inner South area. Given the relatively low numbers of casualties in each of the two areas, it was not possible to draw conclusions about the effect of 20mph limits on injuries from the data available. There has also been a recent pilot scheme in South Central Edinburgh, which has aimed to reduce vehicle speeds through signage and surface markings in residential streets with high levels of pedestrian activity. The council adopted a target to increase levels of cycling in the city and to reduce the number of road traffic incidents. For the council, it was expected that lowering speed would encourage increased levels of walking and cycling, while reducing the severity of any potential incidents19. Although the council had chosen to implement several 20mph zones in the past with physical traffic calming measures, these were very costly to implement and required additional maintenance. It is estimated that a 20mph limit can be introduced at just 1/6th of the cost of a traditional 20mph zone. For this reason, a number of 20mph limits were trialed in residential areas.
28 Calthorpe Road, Edgbaston, Birmingham B15 1RP | Telephone 0121 248 2000 Registered Charity No: 207823 | www.rospa.com
The Royal Society for the Prevention of Accidents
Road Safety factsheet: 20mph Zones and Speed Limits
To evaluate the success of the 20mph limit pilot, 48 ‘before’ speed surveys were taken across a sample of street locations in the pilot area before the implementation of a 20mph limit. Speed surveys were taken again after the 20mph limit was enforced. Of these locations, 20 locations remained at a 30mph limit for the pilot period and 28 of the locations were changed to the new 20mph limit. For the 28 locations that had their speed limit changed to 20mph, average ‘before’ speeds were 22.8mph, while ‘after’ speeds fell to 20.9mph, an average fall of 1.9mph. In the locations that remained at a 30mph limit, the average fall in speed between the ‘before’ and ‘after’ speed was 0.8mph. 12 ‘before’ locations also had an average speed that exceeded 24mph, an average of 25.8mph. The average ‘after’ speed at these locations was 22.4mph, an average fall of 3.3mph. However, there were some slight increases in the average speed in 4 of the ‘before’ locations. 4 locations also continued to have average speeds of over 24mph. To ensure that these speeds fall towards 20mph; it was proposed that permanent engineering changes were made to these streets, including physical traffic calming measures, additional signage and road narrowing, as with a traditional 20mph zone. Overall, the speed surveys have demonstrated that the 20mph speed limit has resulted in an overall positive drop in speeds in the majority of cases. Although 75% of the locations still have a speed average in excess of 20mph, in all but 4 of the locations, speeds are below 24mph, which is the DfT threshold recommended for the effective operation of 20mph limits. Benefits evidenced through this pilot scheme were lower vehicle speeds, and strong residential support for 20mph limits. Surveyed residents also mentioned benefits of 20mph limits such as safety for children walking around the area and playing in the street, and better walking and cycling conditions. In the year following the launch of the scheme, data also showed a 7% increase in journeys by foot, a 5% increase in journeys by bicycle and a 3% fall in journeys by car. It is anticipated that the scheme will lead to a reduction in road incidents due to the reduction in average vehicle speeds, which will be monitored over the next few years. Finally, a similar pilot scheme is currently taking place in Birmingham, where 20mph speed limits have been introduced on the city’s roads in the City Centre, Central East and Central South to improve safety and reduce the number of accidents. Following an audit of the signs and lines, the Traffic Regulation Order has now been sealed, meaning that these speed limits are enforceable by the police, just as other speed limits are. Under the banner of ‘slower is safer’, a city-wide publicity campaign is underway to show road users the benefits of driving at 20mph on residential roads. There are also a number of other activities to encourage drivers to stick to the 20mph limits currently taking place. These activities include ‘kid’s court’, an educational activity, which gives speeding drivers the opportunity to face a panel of school children or receive penalty points on their license and a £100 fine. A video featuring local school children has also been produced and is being used to deliver a message to speeding drivers when the police are out on location delivering roadside education and enforcement activities.
28 Calthorpe Road, Edgbaston, Birmingham B15 1RP | Telephone 0121 248 2000 Registered Charity No: 207823 | www.rospa.com
The Royal Society for the Prevention of Accidents
Road Safety factsheet: 20mph Zones and Speed Limits
Birmingham City Council hope that implementing this area-wide 20mph limit could reduce road traffic collisions by 8%. Data is currently being collected and an evaluation will take place in due course. A recent umbrella review of the effects of 20mph zones and limits on health and health inequalities indicated that 20mph zones and limits were effective in reducing accidents, injuries and traffic volumes. There was also evidence from Towner et al’s reviews that these measures are cost effective and are typically received positively by local residents23. Despite evidence that 20mph speed limits can lead to small reductions in vehicle speed, a 2017 survey by Brake and Churchill Car Insurance of 2,000 UK drivers revealed that more than half (52%) of drivers admit to driving at 25mph or faster in a 20mph speed limit, and 26% admitted to speeding in 20mph limits once a week or more. 25-34 year olds were most likely to drive at 25mph or faster in a 20mph speed limit (73%), while 55-64 year olds were least likely (45%). Men (41%) admitted driving at these speeds more than women (43%)24.
Reduction in Traffic Flow Accident risk is not usually the only intended outcome to a traffic calming scheme, as transport policy. 20mph zones and limits can also lead to a number of other benefits, such as a reduction of traffic flow in the area. Although results of studies do vary, it is generally suggested that traffic volumes reduce following the implementation of a 20mph zone or limit. Between 2007 and 2008, levels of motorised traffic in Portsmouth 20mph areas fell by 3%, which was higher than the national average reduction in traffic. However, the report concluded that data suggested that traffic had not re-routed systematically from the roads subject to 20mph limits to main roads on the cordon25. However, other studies have indicated larger reductions of traffic flow in 20mph limits and zones. A TRL review of 250 20mph zones in England, Scotland and Wales stated that traffic flow in 20mph zones reduced on average by 27%, but flows in surrounding boundary roads increased by 12%. Despite this, the review concluded that there was generally little accident migration to surrounding roads26. A more recent Steer Davies Gleave report suggested that there is a reduction in traffic volumes of 5.2% for 20mph areas without traffic calming and 13.4% for areas with traffic calming 27 In conclusion, traffic volumes generally decrease in 20mph zones, although this impact is highly variable and depends on the characteristics of a particular area. The level of motor vehicle traffic is an underpinning cause of injury on the roads, with research indicating that traffic volume is predictive of the number of cyclist and pedestrian injuries. This means that reducing traffic volume has the potential to improve cycle safety, pedestrian safety, and road safety in general.
28 Calthorpe Road, Edgbaston, Birmingham B15 1RP | Telephone 0121 248 2000 Registered Charity No: 207823 | www.rospa.com
The Royal Society for the Prevention of Accidents
Road Safety factsheet: 20mph Zones and Speed Limits
Lower Traffic Speeds and Health As well as road safety benefits, it is important to highlight the contribution that 20mph zones can have in improving air quality, reducing noise pollution and encouraging more physical activity, such as walking and cycling, by contributing towards a safer environment. The money spent on the schemes can also greatly improve the residential area. A recent study 28 calculated casualty rates and the effects of vehicles on air pollution in 30mph zones in Wales. The researchers then estimated the casualty rate and the impacts of vehicles on air pollution in 20mph speed limit areas. Evidence from the study suggested that a default speed limit of 20mph would substantially reduce road traffic casualties, and at worst would not lead to a direct change in air pollution. However, indirectly, if reduced traffic speeds encourage people to switch to active modes of travel, such as cycling and walking, there are likely to be greater reductions in air pollution. The study concluded that health and costs savings are likely to be substantial, and the costs of implementing 20mph limits are likely to be far lower than the benefits reduced speeds bring.
Assessment of any Unintended Negative Consequences
Vehicle Damage RoSPA has received enquiries from members of the public who have raised concerns that traffic calming used in 20mph zones has unintended negative consequences, such as causing vehicle damage and injuring vehicle occupants when vehicles go over the calming, slowing emergency services, or increases vehicle emissions. Research to evaluate the impact on road humps on both vehicle damage and the likelihood of occupant injury by TRL and Millbrook 29
included testing vehicles on speed cushions and road humps and creating computer models of vehicles and their occupants.
The tests did not show evidence of any vehicle damage from the humps or significant and permanent changes to the vehicle’s suspension systems. The report concluded that the levels of discomfort caused by the humps were generally acceptable if they were traversed at an appropriate speed (15-20mph) and that the forces on the spine were an order of magnitude smaller than what typically causes an injury. However, some people with conditions such as degenerative discs or weak bones are more susceptible to an injury.
Emergency Services Response Times There have been concerns raised by the London Ambulance Service about the effect on ambulance response times, and that this puts people at risk. There are two relevant studies. In 1997, a US study looked at the effect of three traffic calming measures on response times30, two different lengths of speed bumps (14 and 21 feet length), and traffic circles (similar in design to mini roundabouts, although the plan in the paper shows vegetation in the middle). The delay of different emergency vehicles travelling between 25 and 40mph was measured.
28 Calthorpe Road, Edgbaston, Birmingham B15 1RP | Telephone 0121 248 2000 Registered Charity No: 207823 | www.rospa.com
The Royal Society for the Prevention of Accidents
Road Safety factsheet: 20mph Zones and Speed Limits
It found that the traffic circles had the greatest effect on response times, adding between 1.3 to 10.7 seconds of delay to vehicles. Road humps added between 9.4 and 0 seconds to the response time, with shorter 14 feet bumps adding slightly more time.
However, the relevance of these results to the UK is not clear, as the traffic calming measures examined covered the whole width of the road, which is not typically representative of the narrow speed cushions used in the UK. TRL research looked at the average speed of a fire tender running over different types of traffic calming in an estate in Surrey31. The authors estimated that on average, traffic calming measures caused a time delay of 1.25-1.40 seconds, and that the average speeds were lowest over flat top humps, and highest over speed cushions. When implementing 20mph zones, consultation with the emergency services, as well as the local community would be beneficial to identify any issues before the traffic calming is put in. This would help to provide safer roads and meet the concerns of the emergency services, or to identify other ways to ensure rapid response times without losing the significant road safety benefits of a 20mph zone. It is important that communities, and other stakeholders, know what they are getting from a 20mph zone or limit and have a say in their development. Results from the Inner City Road Safety Demonstration Project32 highlight that residents often had concerns about the amount of available on street parking, and proposals which reduced it were opposed. There was both opposition and support for traffic calming features, with greater levels of support for it in residential areas.
One important finding from the demonstration project was that consultation must be ‘right first time’.
28 Calthorpe Road, Edgbaston, Birmingham B15 1RP | Telephone 0121 248 2000 Registered Charity No: 207823 | www.rospa.com
The Royal Society for the Prevention of Accidents
Road Safety factsheet: 20mph Zones and Speed Limits
RoSPA’s Policy Position on 20mph Zones and Speed Limits Inappropriate speed is one of the most serious road safety problems on Britain’s roads, and causes death and injury to thousands of people each year. A co-ordinated speed management strategy must include education, training and publicity, highway engineering and design, vehicle engineering and enforcement measures. Setting appropriate speed limits is an important part of this strategy. 20 mph Zones RoSPA strongly supports the use of 20mph zones as they are an effective means of reducing road crashes and casualties. They are very effective at protecting our most vulnerable road users, including children, pedestrians and cyclists, and significantly decrease the risk of being injured in a collision. RoSPA encourages their greater use, especially in residential areas. 20 mph Limits RoSPA supports and encourages the wider use of 20mph limits. They have been shown to reduce traffic speed, although not as much as 20mph zones with traffic calming. However, they are considerably less expensive to implement, which means that wider areas can be covered. They also provide additional benefits, such as encouraging more physical activity, such as walking and cycling. They can also greatly improve the character of a residential area and quality of life of the residents. 20mph limits are most appropriate for roads where average speeds are already low, below 24mph, and the layout and use of the road also gives the clear impression that a 20mph speed or below is the most appropriate. Although a high proportion of urban roads are suitable for 20mph limits, RoSPA does not believe that 20mph speed limits are suitable for every road in a local authority area. They should be targeted at roads that are primarily residential in nature and on town or city streets where pedestrian and cyclist movements are high (or potentially high), such as around schools, shops, markets, playgrounds and other areas. Roads which are not suitable for 20mph limits are major through routes. Some European experiences have shown the value of introducing lower limits as part of a more comprehensive traffic plan rather than on their own. Typically there are small reductions in speed following the introduction of 20mph limits. However there is a smaller evidence base for the introduction of signs on their own as they are a more recent intervention, and most schemes have only had a short follow up period. Local evaluations of 20mph limits, along with monitoring of traffic speeds will help to understand the effects of 20mph limits in different circumstances and whether there needs to be more work to reduce traffic speeds. In the Netherlands 30km/h speed limits are seen as the initial step to reduce speeds in residential areas, and in future more road engineering will be introduced where needed33.
28 Calthorpe Road, Edgbaston, Birmingham B15 1RP | Telephone 0121 248 2000 Registered Charity No: 207823 | www.rospa.com
The Royal Society for the Prevention of Accidents
Road Safety factsheet: 20mph Zones and Speed Limits
Stronger evidence of the road safety benefits of 20 mph will hopefully be provided by the new study of their effectiveness, commissioned by the DfT. The importance of ensuring speed compliance on roads which do not have a 20mph feel also needs to be addressed. 20mph schemes are an example of a good synergy between road safety and other public health outcomes. They are also a good example of the Safe System in action as they reduce the risk of collisions occurring and the risk of any that do occur causing death or serious injury. Local Authorities are the bodies responsible for determining where 20mph zones and limits should be introduced. Local Authorities should take advantage of opportunities to introduce them where they are needed. 20 mph areas should initially be prioritised to places where they are most needed, for example, in areas of social deprivation which have high populations, areas which consistently display accident problems or have other issues which a 20mph zone could alleviate, and in residential areas around locations which are common urban destinations. The need for 20mph zones can be examined when developing safer routes to school. Speed limits can, and should, be supported by other measures to help drivers drive at safe speeds, and to enforce the limits for drivers who choose to ignore them. Consultation and engagement with local communities and other stakeholders is of vital importance. Consultation and engagement with local communities and other stakeholders is of vital importance, to make sure that safer roads are prioritised where needed. Local communities should have input into the schemes development. Emergency services must be consulted when implementing 20mph zones to ensure that their requirement to use the roads quickly is balanced with the considerable benefit of a 20mph zone. The underpinning idea behind the 20mph schemes is that the speed limit – if adhered to – reduces the risk of crashes occurring and presents a strong chance of avoiding fatal or serious injuries if one does occur. In built up residential areas, RoSPA believes that 20mph represents the best compromise between mobility and risk. Other Benefits
20mph limits are not just a road safety measure. Therefore, when assessing their value and effectiveness, it is important to consider increases in walking and cycling and improvements in quality of life indicators, such as health improvements, community cohesion and better air quality, as well as reductions in vehicle speeds and road crashes and casualties. For more information on speed, view our ‘Inappropriate speed’, ‘Top 10 tips to stay within the limit’ and ‘Speed cameras’ factsheets.
28 Calthorpe Road, Edgbaston, Birmingham B15 1RP | Telephone 0121 248 2000 Registered Charity No: 207823 | www.rospa.com
The Royal Society for the Prevention of Accidents
Road Safety factsheet: 20mph Zones and Speed Limits
References
1 Reported Road Casualties GB (2016), ‘Table RAS30016’ URL: https://www.gov.uk/government/statistical-data-sets/ras30-reported-casualties-in-road-accidents 2 Reported Road Casualties GB (2016) ‘Table RAS 30009’ URL: https://www.gov.uk/government/statistical-data-sets/ras30-reported-casualties-in-road-accidents 3 Ashton, S. J. and Mackay, G. M. (1979) ‘Some characteristics of the population who suffer trauma as pedestrians when hit by cars and some resulting implications’ URL: http://www.ircobi.org/wordpress/downloads/irc1979/pdf_files/1979_4.pdf 4 Rosén, E. et al. (2011) ‘Literature review of pedestrian fatality risk as a function of car impact speed’, Accident Analysis and Prevention, 43: 25-33. 5 Transport Scotland (2015) ‘Good Practice Guide on 20mph Speed Restrictions’ http://www.transport.gov.scot/system/files/documents/guides/20%20mph%20Good%20Practice%20Guide%20-%2019%20December%202014%20-%20Version%20to%20be%20published.pdf 6 Department for Transport (2013), Department for Transport Circular 01/2013: Setting Local Speed Limits. URL: http://www.20splentyforus.org.uk/UsefulReports/circular-01-2013.pdf Date Accessed: 29/06/2017.
7 DfT (2009) ‘Review of 20mph Zone and Limit Implementation in England: Road Safety Research Report Findings’ http://www.dft.gov.uk/pgr/roadsafety/research/rsrr/theme4/20mphzoneresearch.pdf 8 Rodgers, S. E. et al. (2010) ‘Using geographical information systems to assess the equitable distribution of traffic-calming measures: translational research’, Injury Prevention, 16: 7-11 9 Steinbach, R. et al. (2011) ‘The impact of 20 mph traffic speed zones on inequalities in road casualties in London’, London J Epidemiol Community Health, 65(10): 921-926. 10 Roberts, I. and Power, C. (1996) ‘Does the decline in child injury mortality vary by social class? A comparison of class specific mortality in 1981 and 1991’, British Medical Journal, 313(7060): 784–786. 11 Webster, D. C. and Mackie, A. M. (1996) Review of traffic calming schemes in 20 mph zones, UK: TRL. 12 Brightwell, S. (2003) Hull Reaps Road Safety Rewards From Slowing the City's Traffic, London: Local Transport Today. 13 Webster, D. and R. Layfield (2007), Review of 20 mph zones in London Boroughs, UK: TRL. 14 Grundy, C. et al (2009) ‘Effect of 20 mph traffic speed zones on road injuries in London, 1986-2006: controlled interrupted time series analysis’, British Medical Journal, 2009; 339:b4469.
28 Calthorpe Road, Edgbaston, Birmingham B15 1RP | Telephone 0121 248 2000 Registered Charity No: 207823 | www.rospa.com
The Royal Society for the Prevention of Accidents
Road Safety factsheet: 20mph Zones and Speed Limits
15 Deacon, L. et al (2011) ‘Road Traffic Collisions and Casualties in the North West of England’ URL: http://www.nwhpaf.org.uk/downloads/811361414197200746009032012125421.pdf 16 Bunn, F. et al (2003) ‘Area-wide traffic calming for preventing traffic related injuries’, Cochrane Database of Systematic Reviews, 1: Art. No.: CD003110. 17 Elvik, R. (2001), ‘Area-wide urban traffic calming schemes: a meta-analysis of safety effects’, Accident Analysis and Prevention, 33(3):327-36 18 National Highway Traffic Safety Administration (1999) ‘Literature Review on Vehicle Travel Speeds and Pedestrian Injuries’, http://www.nhtsa.gov/people/injury/research/pub/HS809012.html 19 Turley, M. (2013) South Central Edinburgh 20mph Limit Pilot Evaluation, Transport and Environment Committee, August 2013. http://www.edinburgh.gov.uk/downloads/file/7820/south_central_edinburgh_20mph_limit_pilot_evaluation_2013 20 Mackie, A (1998) Urban speed management methods, UK: TRL. 21 (2010) ‘Interim Evaluation of the Implementation of 20mph Speed Limits in Portsmouth, Final Report – September’ http://assets.dft.gov.uk/publications/speed-limits-portsmouth/speed-limits-portsmouth.pdf 21 22 Bristol City Council (2012) ‘20mph Speed Limit Pilot Areas: Monitoring Report’ http://www.bristol20mph.co.uk/wp-content/uploads/2016/06/20mph-Monitoring-Report-pilot-areas-2012.pdf 23 Cairns et al (2014) ‘Go slow: an umbrella review of the effects of 20 mph zones and limits on health and health inequalities’, Journal of Public Health, September 2014: 1-6. 24 Brake (2017) ‘More than half of UK drivers admit to speeding in 20mph areas’ URL: http://www.brake.org.uk/media-centre/1728-more-than-half-of-uk-drivers-admit-to-speeding-in-20mph-areas
25 Atkins (2010) ‘ Interim Evaluation of the Implementation of 20 mph Speed Limits in Portsmouth’
URL: http://www.wirralpedestrians.org.uk/files/20mphzoneresearch.pdf Date Accessed: 05/04/2017. 26 DfT (1999) ‘20mph Speed Limits and Zones’ URL:http://www.ukroads.org/webfiles/TAL%209-99%2020%20mph%20speed%20limits%20and%20zones.pdf Date Accessed: 05/04/2017. 27 Steer Davies Gleave (2014) ‘Research into the Effectiveness of 20mph speed limits and zones’
28 Calthorpe Road, Edgbaston, Birmingham B15 1RP | Telephone 0121 248 2000 Registered Charity No: 207823 | www.rospa.com
The Royal Society for the Prevention of Accidents
Road Safety factsheet: 20mph Zones and Speed Limits
URL: http://www.roadsafetyknowledgecentre.org.uk/downloads/20mph-reportv1.0-FINAL.pdf Date Accessed: 05/04/2017. 28 Jones, S. J. And Brunt, H. (2017) ‘Twenty miles per hour speed limits: a sustainable solution to public health problems in Wales’, Epidimol Community Health, 0: 1-8. 29 Kennedy, J. et al (2004) Impact of road humps on vehicles and their occupants, UK: TRL. 30 Coleman, M. A. (1997) ‘The Influence of Traffic Calming Devices upon Fire Vehicle Travel Times’ http://www.ci.canby.or.us/CityGovernment/committees/TrafficSafety/docs/PDX_StudyFireResponseTime.pdf 31 Boulter, P. G. et al. (2001) The Impacts of Traffic Calming Measures on Vehicle Exhaust Emissions, UK: TRL. 32 DfT. (2009) Inner City Road Safety Demonstration Project Interim Report, DfT. URL: http://www.dft.gov.uk/pgr/roadsafety/dpp/icroadsafetyinterimreport.pdf 33 SWOV (2010) ‘SWOV Fact Sheet, Zones 30: Urban Residential Areas’ URL: http://www.swov.nl/rapport/Factsheets/UK/FS_Residential_areas.pdf