20-f 2001 ing
TRANSCRIPT

U.S. SECURITIES AND EXCHANGE COMMISSION
Washington, D.C. 20549
FORM 20-F [ ] REGISTRATION STATEMENT PURSUANT TO SECTION 12(b) OR (g) OF THE SECURITIES EXCHANGE ACT OF 1934 OR [X] ANNUAL REPORT PURSUANT TO SECTION 13 OR 15 (d) OF THE SECURITIES EXCHANGE ACT OF 1934
For the fiscal year ended December 31, 2001
Commission file number 1-14878
GERDAU S.A. (Exact Name of Registrant as Specified in its Charter)
Federative Republic of Brazil
(Jurisdiction of Incorporation or Organization)
N/A (Translation of Registrant's name into English)
Av. Farrapos 1811
Porto Alegre, Rio Grande Do Sul - Brazil CEP 90220-005 (Address of principal executive offices) (Zip code)
Securities registered pursuant to Section 12(b) of the Act:
Title of Each Class Preferred Shares, no par value per share, each represented by American Depositary Shares
Name of Each Exchange in Which Registered New York Stock Exchange
Securities registered pursuant to Section 12(g) of the Act:
None
Securities for which there is a reporting obligation
pursuant to Section 15(d) of the Act:
None
The total number of issued shares of each class of stock of GERDAU S.A. as of December 31, 2001 was: 39,382,020,386 Common Shares, no par value per share 74,109,685,986 Preferred Shares, no par value per share Indicate by check mark whether the Registrant (1) has filed all reports required to be filed by Section 13 or 15(d) of the Securities Exchange Act of 1934 during the preceding 12 months (or such shorter period that the Registrant was required to file such reports), and (2) has been subject to such filing requirements for the past 90 days. Yes X No Indicate by check mark which financial statement item the Registrant has elected to follow Item 17 Item 18 X .

i
TABLE OF CONTENTS
Page
INTRODUCTION ................................................................................................................................................................ 1
PART I.................................................................................................................................................................................. 2 ITEM 1. IDENTITY OF DIRECTORS, SENIOR MANAGEMENT AND ADVISERS................................ 2 ITEM 2. OFFER STATISTICS AND EXPECTED TIMETABLE .................................................................. 2 ITEM 3. KEY INFORMATION.......................................................................................................................... 2 ITEM 4. INFORMATION ON THE COMPANY............................................................................................. 10 ITEM 5. OPERATING AND FINANCIAL REVIEW AND PROSPECTS .................................................... 32 ITEM 6. DIRECTORS, SENIOR MANAGEMENT AND EMPLOYEES ...................................................... 40 ITEM 7. MAJOR SHAREHOLDERS AND RELATED PARTY TRANSACTIONS .................................. 46 ITEM 8. FINANCIAL INFORMATION........................................................................................................... 47 ITEM 9. THE OFFER AND LISTING................................................................................................................ 48 ITEM 10. ADDITIONAL INFORMATION..................................................................................................... 52 ITEM 11. QUANTITATIVE AND QUALITATIVE DISCLOSURES ABOUT MARKET RISK .............. 60 ITEM 12. DESCRIPTION OF SECURITIES OTHER THAN EQUITY SECURITIES.................................. 62
PART II................................................................................................................................................................................. 62 ITEM 13. DEFAULTS, DIVIDEND ARREARAGES AND DELIQUENCIES .............................................. 62 ITEM 14. MATERIAL MODIFICATIONS TO THE RIGHTS OF SECURITY HOLDERS AND
USE OF PROCEEDS...................................................................................................................................... 63 ITEM 15. .............................................................................................................................................................. 63 ITEM 16. .............................................................................................................................................................. 63
PART III................................................................................................................................................................................ 64 ITEM 17. FINANCIAL STATEMENTS........................................................................................................... 64 ITEM 18. FINANCIAL STATEMENTS........................................................................................................... 64 ITEM 19. FINANCIAL STATEMENTS AND EXHIBITS ............................................................................. 64

F-1
INTRODUCTION Unless otherwise indicated, all references herein (i) to the "Company" or to "Gerdau" are references to Gerdau S.A., a corporation organized under the laws of the Federative Republic of Brazil ("Brazil") and its consolidated subsidiaries, and (ii) to "Prefe rred Shares" and "Common Shares" refer to the Company's authorized and outstanding preferred stock and common stock, designated as ações preferenciais and ações ordinárias, respectively, each without par value. All references herein to the "real," "reais" or "R$" are to the Brazilian real, the official currency of Brazil. All references to (i) "U.S. dollars," "dollars" or "U.S.$" are to United States dollars, (ii) "billions" are to thousands of millions, (iii) "km" are to kilometers, and (iv) "tons" denote metric tons. The Company has prepared the consolidated financial statements included herein in conformity with accounting principles generally accepted in the United States ("U.S. GAAP").
CAUTIONARY STATEMENT WITH RESPECT TO FORWARD-LOOKING STATEMENTS
Statements made in this annual report with respect to the Company’s current plans, estimates, strategies and beliefs and other statements that are not historical facts are forward-looking statements about the Company’s future performance. Forward-looking statements include but are not limited to those using words such as “believe”, “expect”, “plans”, “strategy”, “prospects”, “forecast”, “estimate”, “project”, “anticipate”, “may” or “might” and words of similar meaning in connection with a discussion of future operations or financial performance. From time to time, oral or written forward -looking statements may also be included in other materials released to the public. These statements are based on management’s assumption’s and beliefs in light of the information currently available to it. The Company cautions you that a number of important risks and uncertainties could cause actual results to differ materially from those discussed in the forward-looking statements, and therefore you should not place undue reliance on them. You also should not rely on any obligation of the Company to update or revise any forward-looking statements, whether as a result of new information, future events or otherwise. The Company disclaims any such obligation. Risks and uncertainties that might affect the Company include, but are not limited to, (i) general economic conditions in the Company’s markets, particularly levels of spending; (ii) exchange rates, particularly between the real and the U.S. dollar, and other currencies in which the Company makes significant sales or in which its assets and liabilities are denominated; and (iii) the outcome of contingencies.

2 - 2 --1
PART I
ITEM 1. IDENTITY OF DIRECTORS, SENIOR MANAGEMENT AND ADVISERS
Not applicable, as the Company is filing this Form 20-F as an annual report.
ITEM 2. OFFER STATISTICS AND EXPECTED TIMETABLE
Not applicable, as the Company is filing this Form 20-F as an annual report.
ITEM 3. KEY INFORMATION
A. SELECTED FINANCIAL DATA
U.S. GAAP Presentation
The selected financial information for the Company included in the following table should be read in conjunction with, and is qualified in its entirety by, the U.S. GAAP financial statements of the Company and “Operating and Financial Review and Prospects appearing elsewhere herein. The consolidated financial data for the Company as of December 31, 2001, 2000 and 1999, are derived from the U.S. GAAP financial statements included elsewhere herein. The financial statements as of December 31, 2001, 2000 and 1999 have been audited by Arthur Andersen S/C.
For the years ended December 31, (expressed in thousands of U.S. dollars)
Statement of income data: 2001 2000 1999 1998 1997 Net sales 2,320,530 2,676,714 1,720,988 1,885,061 1,824,108 Cost of sales (1,641,620) (1,964,353) (1,101,371) (1,315,179) (1,296,453) Gross profit 678,910 712,361 619,617 569,882 527,655 Sales and marketing expenses (105,801) (112,195) (86,007) (101,386) (107,199) General and administrative expenses (181,108) (213,143) (157,755) (175,457) (198,083) Operating income 392,001 387,023 375,855 293,039 222,373 Interest expense and exchange loss (238,269) (243,477) (222,414) (151,739) (54,359) Interest income 55,002 57,324 64,166 86,897 31,626 Other non-operating income (expense) (7,853) 2,165 5,196 18,798 17,330 Equity pickup on non-consolidated company 18,324 33,962 (4,903) - - Income before income taxes and minority interest 219,205 236,997 217,900 246,995 216,970 Provision for income taxes:
Current (40,981) (36,725) (17,456) (38,460) (17,335) Deferred (13,666) (8,899) (3,080) (13,843) (21,710)
Income before minority interest 164,558 191,373 197,364 194,692 177,925 Minority interest 2,795 (2,815) 328 (844) (21,182) Net income available to common and preferred
shareholders
167,353
188,558
197,692
193,848
156,743 Basic earnings per 1,000 shares
Common 1.38 1.56 1.65 3.22 2.76 Preferred 1.52 1.72 1.79 3.54 3.10
Diluted earnings per 1,000 shares Common 1.38 1.55 1.65 3.06 2.69 Preferred 1.52 1.70 1.78 3.35 3.00
Cash dividends declared per 1,000 shares Common 0.58 0.55 1.20 0.76 0.68 Preferred 0.65 0.60 1.27 0.81 0.74
Number of common shares outstanding 39,382,020,386 33,070,107,530 19,691,010,193 19,691,010,193 19,314,516,379
3 - 3 --1
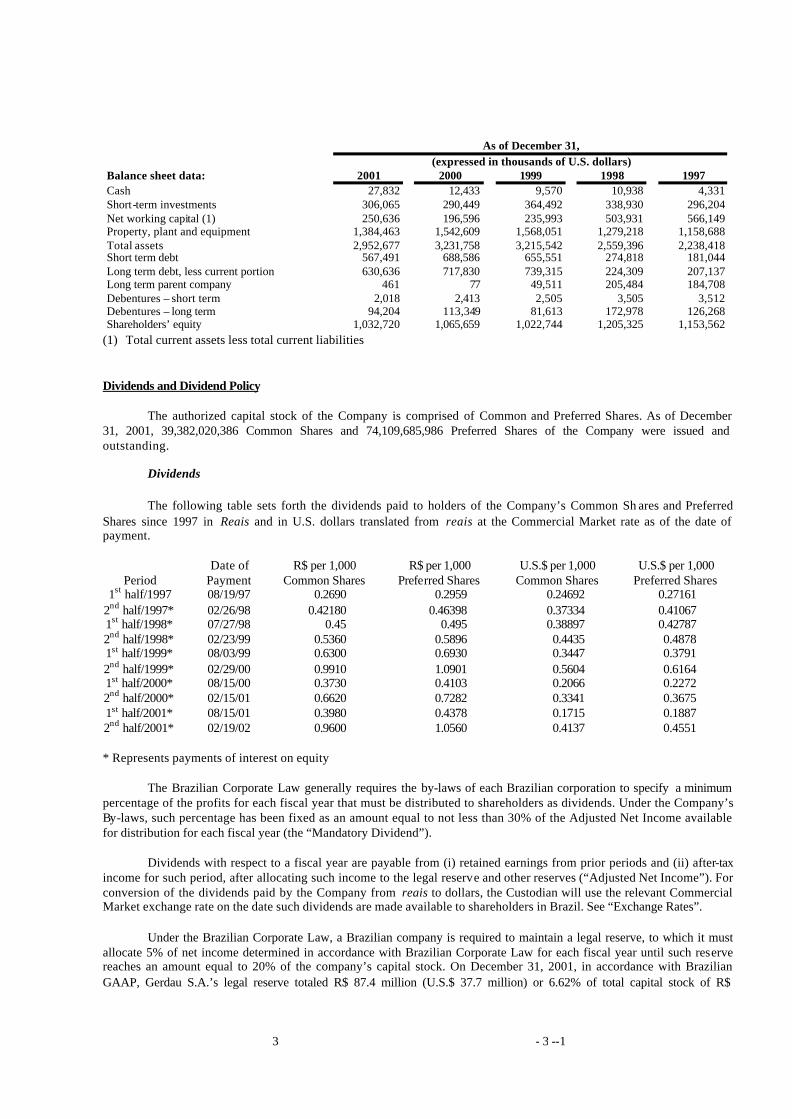
As of December 31, (expressed in thousands of U.S. dollars)
Balance sheet data: 2001 2000 1999 1998 1997 Cash 27,832 12,433 9,570 10,938 4,331 Short-term investments 306,065 290,449 364,492 338,930 296,204 Net working capital (1) 250,636 196,596 235,993 503,931 566,149 Property, plant and equipment 1,384,463 1,542,609 1,568,051 1,279,218 1,158,688 Total assets 2,952,677 3,231,758 3,215,542 2,559,396 2,238,418 Short term debt 567,491 688,586 655,551 274,818 181,044 Long term debt, less current portion 630,636 717,830 739,315 224,309 207,137 Long term parent company 461 77 49,511 205,484 184,708 Debentures – short term 2,018 2,413 2,505 3,505 3,512 Debentures – long term 94,204 113,349 81,613 172,978 126,268 Shareholders’ equity 1,032,720 1,065,659 1,022,744 1,205,325 1,153,562
(1) Total current assets less total current liabilities
Dividends and Dividend Policy
The authorized capital stock of the Company is comprised of Common and Preferred Shares. As of December 31, 2001, 39,382,020,386 Common Shares and 74,109,685,986 Preferred Shares of the Company were issued and outstanding.
Dividends
The following table sets forth the dividends paid to holders of the Company’s Common Sh ares and Preferred Shares since 1997 in Reais and in U.S. dollars translated from reais at the Commercial Market rate as of the date of payment.
Date of R$ per 1,000 R$ per 1,000 U.S.$ per 1,000 U.S.$ per 1,000 Period Payment Common Shares Preferred Shares Common Shares Preferred Shares
1st half/1997 08/19/97 0.2690 0.2959 0.24692 0.27161 2nd half/1997* 02/26/98 0.42180 0.46398 0.37334 0.41067 1st half/1998* 07/27/98 0.45 0.495 0.38897 0.42787 2nd half/1998* 02/23/99 0.5360 0.5896 0.4435 0.4878 1st half/1999* 08/03/99 0.6300 0.6930 0.3447 0.3791 2nd half/1999* 02/29/00 0.9910 1.0901 0.5604 0.6164 1st half/2000* 08/15/00 0.3730 0.4103 0.2066 0.2272 2nd half/2000* 02/15/01 0.6620 0.7282 0.3341 0.3675 1st half/2001* 08/15/01 0.3980 0.4378 0.1715 0.1887 2nd half/2001* 02/19/02 0.9600 1.0560 0.4137 0.4551 * Represents payments of interest on equity
The Brazilian Corporate Law generally requires the by-laws of each Brazilian corporation to specify a minimum percentage of the profits for each fiscal year that must be distributed to shareholders as dividends. Under the Company’s By-laws, such percentage has been fixed as an amount equal to not less than 30% of the Adjusted Net Income available for distribution for each fiscal year (the “Mandatory Dividend”).
Dividends with respect to a fiscal year are payable from (i) retained earnings from prior periods and (ii) after-tax income for such period, after allocating such income to the legal reserve and other reserves (“Adjusted Net Income”). For conversion of the dividends paid by the Company from reais to dollars, the Custodian will use the relevant Commercial Market exchange rate on the date such dividends are made available to shareholders in Brazil. See “Exchange Rates”.
Under the Brazilian Corporate Law, a Brazilian company is required to maintain a legal reserve, to which it must allocate 5% of net income determined in accordance with Brazilian Corporate Law for each fiscal year until such reserve reaches an amount equal to 20% of the company’s capital stock. On December 31, 2001, in accordance with Brazilian GAAP, Gerdau S.A.’s legal reserve totaled R$ 87.4 million (U.S.$ 37.7 million) or 6.62% of total capital stock of R$

4 - 4 --1
1,320.1 million (U.S.$ 568.9 million).
According to Law 9,457, holders of preferred shares in a Brazilian corporation (including the Preferred Shares) are entitled to receive dividends at least 10% greater than dividends paid on Common Shares unless there is a provision for a fixed minimum dividend on preferred shares based on capital. The Company has no such provision and, accordingly, pays dividends on Preferred Shares 10% higher than those paid on Common Shares. The Gerdau S.A. executive management presented a proposal at the shareholders' year-end meeting which has been approved to grant both Common Shares and Preferred Shares a 100% tag along right with the control block of Common Shares. This measure was approved by shareholders on April 30, 2002, and it will extend to all shareholders a right that the new Brazilian Corporate Law required only for minority holders of Common Shares (and at only 80% of the consideration paid to the controlling shareholders).
Under the recent amendments to the Brazilian Corporate Law, by extending the tag along right to minority shareholders, the Company will no longer need to comply with the requirement to pay an additional 10% premium on dividends paid to preferred shareholders. Upon approval and effectiveness of the amendments to the Company’s by-laws to provide for the tag-along as described above, the Company will pay the stated 30% (By -Law) of Adjusted Net Profit to all shareholders, without any premium to preferred shareholders.
As a general requirement, shareholders who are not residents of Brazil must have their investment in a Brazilian company registered with the Central Bank to have dividends, sales proceeds or other amounts related to their shares eligible for conversion into foreign currency for remittance outside Brazil. Preferred Shares underlying the ADSs will be held in Brazil by the Custodian as agent for the Depositary. The holder of Preferred Shares will be the registered owner on the records of the Depositary for the Preferred Shares.
Payments of cash dividends and distributions, if any, will be made in Brazilian currency to the Custodian, on behalf of the Depositary, which will then convert such proceeds into U.S. dollars and will cause such U.S. dollars to be delivered to the Depositary for distribution to holders of ADRs. If the Custodian is unable to immediately convert the Brazilian currency received as dividends into U.S. dollars, the amount of U.S. dollars payable to holders of ADRs may be adversely affected by any devaluation or depreciation of the Brazilian currency in relation to the U.S. dollar that occurs before such dividends are converted and remitted. Dividends in respect of the Preferred Shares paid to holders who are not Brazilian residents, including holders of ADSs, are not subject to Brazilian withholding tax.
Interest on Equity
Law 9,249 of December 1995 provides that a company, at its discretion, may pay interest on equity to shareholders as an addition or an alternative to dividends. A Brazilian corporation is entitled to pay (and set off against the Mandatory Dividend for each fiscal year) to its shareholders as interest on equity up to the limit of the TJLP (Long-Term Interest Rate). The payment of interest as described herein is subject to a 15% withholding income tax. See “Item 10 E - Taxation”.
Dividend Policy
The Company currently intends to pay dividends on its outstanding Preferred Shares in the amount of its required distributions for any particular fiscal year, subject to any determination by the Board of Directors that such distributions would be inadvisable in view of the Company’s financial condition. As a policy, although not required to do so by law, the Company pays dividends or interest on capital twice a year.
Exchange Rates
There are two legal foreign exchange markets in Brazil, the Commercial Market and the Floating Market. The Commercial Market is reserved primarily for foreign trade transactions and transactions that generally require prior approval from Brazilian monetary authorities, such as the purchase and sale of registered investments by foreign persons and related remittances of funds abroad. Purchases of foreign exchange in the Commercial Market may be carried out only through a financial institution in Brazil authorized to buy and sell currency in that market. The Commercial Market rate is the commercial selling rate for Brazilian currency into U.S. dollars, as reported by the Central Bank. The "Floating Market rate" is the prevailing selling rate for Brazilian currency into U.S. dollars which applies to transactions to which

5 - 5 --1
the Commercial Market rate does not apply, as reported by the Central Bank. Prior to the implementation of the Real Plan, the Commercial Market rate and the Floating Market rate differed significantly at times. Since the introduction of the real, the two rates have not differed significantly, although there can be no assurance that there will not be significant differences between the two rates in the future. Both the Commercial Market rate and the Floating Market rate are reported by the Central Bank on a daily basis .
Both the Commercial Market rate and the Floating Market rate are freely negotiated but have been subject to limited intervention by the Central Bank. After implementation of the Real Plan, the Central Bank initially allowed the real to float with minimal intervention.
On January 18, 1999, the Central Bank officially announced its new policy to allow the real’s value to be determined by the foreign exchange markets, intervening only to limit wide swings in the value of the currency. The pressure on the real during the beginning of March that same year caused the government to drop the managed band exchange rate system and to adopt a free floating exchange rate system. Following the adoption of this system and with the designation of a new Central Bank president, Armínio Fraga, as well as other macro-economic factors, the real strengthened so that on December 31, 1999, the exchange rate was R$ 1.79 per US$ 1.00. Since that date, however, it has declined against the Dollar. On December 31, 2000 the Commercial Market rate was R$ 1.9554 per U.S.$ 1.00 and on December 31, 2001, the exchange rate was R$ 2.32 per US$ 1.00. The year of 2001 was strongly influenced by the economic and political crises in Argentina. The real fluctuated heavily against the U.S. dollar. By the end of the year, however, the financial situation of Brazil as perceived by economic agents caused the Brazilian currency to recover and regain value. Since then it has fluctuated well within the ratios considered stable by the financial markets. The net devaluation in the period was 18.67%. On April 30, 2002 the rate was R$ 2.36 per U.S.$ 1.00.
The following table sets forth information on prevailing Commercial Market rates for the periods indicated.
Exchange Rates Reais per U.S.$ 1.00 Year Average Price 1997 Average 1.0784 1998 Average 1.1609 1999 Average 1.8133 2000 Average 1.8293 2001 Average 2.3504
Exchange Rates Exchange Rates Reais per US$ 1.00 Reais per U.S.$ 1.00 Year Month Lowest Rate Highest Rate 2001 July 2.3249 2.5979 2001 August 2.4463 2.5585 2001 September 2.5590 2.8007 2001 October 2.6866 2.7828 2001 November 2.4604 2.6820 2001 December 2.2930 2.4672
Source: Economática
The Company will make any cash distributions related to the Preferred Shares in Brazilian currency. Accordingly, exchange rate fluctuations may affect the U.S. dollar amounts received by the holders of Preferred ADSs on conversion by the Depositary of such distributions into U.S. dollars for payment to holders of Preferred ADSs. Fluctuations in the exchange rate between reais and the U.S. dollar may also affect the U.S. dollar equivalent of the reais price of the Preferred Shares on the Brazilian stock exchanges.
Brazilian law provides that, whenever there is a serious imbalance in Brazil’s balance of payments or serious factors that enable it to foresee such imbalance, temporary restrictions may be imposed on remittances of foreign capital abroad. For approximately nine months in 1989 and early 1990, for example, to maintain Brazil’s foreign currency reserves, the amounts were subsequently released in accordance with Brazilian Government directives. There can be no

6 - 6 --1
assurance that similar measures will not be taken by the Brazilian Government in the future.
B. CAPITALIZATION AND INDEBTEDNESS
Not required.
C. REASONS FOR THE OFFER AND USE OF PROCEEDS
Not required.
D. RISK FACTORS
Factors Relating to Brazil and to the Company Political and Economic Condition
The Brazilian economy has been affected by frequent and occasionally drastic intervention by the Brazilian Government, which has often changed monetary, credit, tariff and other policies to influence the course of Brazil's economy. Changes in policy involving tariffs, exchange controls, regulatory policy and taxation could adversely affect the Company’s business and financial results, as could inflation, devaluation, social instability and other political, economic or diplomatic developments and the Brazilian Government’s response to such developments.
Brazil’s latest economic stabilization plan (the “Real Plan”) which effectively reduced inflation since the introduction of the new currency, the real, in July 1994, does not contain any wage or price controls, and has been supported by the government of President Fernando Henrique Cardoso, who was Finance Minister at the time of the adoption of the Real Plan. Although President Cardoso has stated his intention to continue to support the market and privatization measures of recent years, there is no guarantee that the actions taken by the Brazilian Government will be continued or will be successful.
Brazil experienced a financial and economic crisis in the first quarter of 1999 following the financial and economic crisis in Asia. In response, the Government adopted economic measures to protect the Real Plan and the stability of the Brazilian currency. The effects of these measures are exp ected to continue in force during 2002.
The highlights of these measures include the approval of an increase in the CPMF (temporary financial transaction contribution) from 0.30% to 0.38%, (ii) a R$ 8.7 billion cut in the Federal Budget, (iii) an increase in the COFINS (contribution for the financing of Social Security) from 2% to 3%, (iv) an increase from 20% to 40% in the percentage of funds the Federal Administration transfers to the States, (v) a reduction in spending for state-run companies of R$ 2.7 billion and (vi) an increase in the FEF (fiscal stabilization fund). Furthermore, the Federal Administration is currently attempting to have Congress approve a Tax Reform bill. A Social Security reform bill proposed by the Federal Administration was voted and approved by Congress, in 1999.
These reforms have re-established the international financial community's confidence in Brazil which, combined with the decrease in tax rates, have allowed for the resumption of economic growth.
The Brazilian economy, however well it has performed, is still part of the greater world economy and is not immune to the adverse effects that may spill over from its neighbors or other related economies in the world.
Inflation; Effects of Economic Stabilization Program and Change of Currency.
Brazil experienced extremely high and generally unpredictable rates of inflation for several years. For this reason, the Federal Government developed a series of mechanisms to protect the value of assets. The main instruments have been inflation indices with particular attention to the INPC (National Index for Consumer Prices). With the end of high inflation and the newly acquired status of stable economy, Brazil changed its reference for inflation tracking by instituting the IPCA (National Extended Consumer Price Index). This index has been used for setting inflation targets with the IMF and for domestic purposes. Inflation in Brazil, as stated by the INPC, was 2,489.11% in 1993 and, 929.32% in 1994. After 1994, inflation reached lower levels. From 1999 on, the IPCA became the reference. Inflation in Brazil was 22.41% in 1995, 9.56% in 1996, 5.22% in 1997, 1.66% in 1998, 8.94% in 1999 and 5.97% in 2000. In 2001, the inflation as

7 - 7 --1
calculated by this index reached 7.67%, slightly above the upper limit margin of 7% as defined by the Brazilian monetary authorities.
Inflation, as well as governmental efforts to combat inflation, have historically had significant negative effects on the Brazilian economy generally and on the profitability and results of operations of the Company in particular. In an attempt to control inflation, the Government has at times imposed wage and price controls, and reduced Government spending among other measures. Inflation, as well as governmental measures to combat inflation, combined with public speculation about possible future actions, has also contributed to economic uncertainty in Brazil and to heightened volatility in the Brazilian securities markets. Furthermore, the Government’s desire to control inflation and to reduce budget deficits may cause it to make actions that may slow or halt Brazilian economic growth. A significant increase in inflation in Brazil could have serious adverse consequences on the Company.
Effects of Currency Devaluations and Exchange Rate Fluctuations.
The value of various South American currencies, including currencies in the countries in which the Company operates, when compared to each other and to the United States and the Canadian dollar, has fluctuated significantly and can be expected to continue to do so. In Brazil, the recent successive crises in the international financial markets have created a significant threat to the stability of the Brazilian currency and, on January 18, 1999 led to the Central Bank’s announcement that the real would trade freely on foreign-exchange markets, with the Central Bank intervening only to limit wide swings in the real’s value. See “Risk Factors – Factors Relating to Brazil and to the Company – Political and Economic Condition.” These fluctuations may have significant effects on the Company’s results of operations and financial condition and on its consolidated financial statements, which are denominated in U.S. dollars.
The Company maintains assets denominated in reais and, to a lesser extent, in U.S. and Canadian dollars, Chilean, Uruguayan and Argentinean pesos, and it regularly experiences gains and losses due to exchange movements between such currencies and the U.S. dollar. At the same time, the Company has loans contracted in Brazil and indexed to the U.S. dollar and to other currencies, which also suffer the impact of the exchange rates between these currencies and the real. As a result, the Company may be exposed to significant exchange losses from further devaluation of the Brazilian real and/or other currencies against the U.S. dollar. The Company’s net sales, gross profit and operating margins may also be influenced by changes in exchange rates. The Company’s sales denominated in the currencies of Brazil, Canada, Uruguay, Chile, Argentina and the United States represented 63.6%, 8.9%, 0.7%, 2.7%, 0.6% and 23.5%, respectively, of the Company’s consolidated gross sales for the year ended December 31, 2001. Because the Company’s U.S. GAAP financial statements are denominated in U.S. dollars, net sales and other financial statement accounts (including net income) could be adversely affected by a devaluation of a local currency relative to the U.S. dollar.
Controls and Restrictions on U.S. Dollar Remittances.
Brazilian law provides that, whenever there exists, or is a serious risk of a material imbalance in Brazil balance of payments, the Government may, for a limited period of time, impose restrictions on the remittance to foreign investors of the proceeds of their investments in Brazil. This situation did occur for approximately six months in 1989 and early 1990, as did the imposition of a restriction on the conversion of the Brazilian currency into foreign currencies. Such restrictions could hinder or prevent the Custodian or holders who have surrendered ADSs for the underlying Preferred Shares from converting dividends, distributions or the proceeds from the sale of such Preferred Shares into U.S. dollars and remitting such U.S. dollars abroad. Holders of ADSs could be adversely affected by delays in, or refusals to grant, any required governmental approvals for conversion of Brazilian currency payments and remittances abroad in respect of the Preferred Shares underlying the ADSs.
Developments in Other Emerging Market Countries
The Brazilian securities markets are, to varying degrees, influenced by economic and market conditions in other emerging market countries. Although economic conditions are different in each country, investors' reaction to developments in one country can have effects on the securities of issuers in other countries. For example, in December 1994, the government of Mexico sharply devalued the peso and allowed its value to float, triggering an economic crisis in Mexico which negatively affected the securities markets in many Latin American countries, including Brazil. Last year, the worsening of the economic crisis in Argentina had a materially adverse effect on the Brazilian economy and on its securities markets and led to the adoption of Government policies that may have further adverse effects on both economic growth and on the Brazilian securities markets. There can be no assurance that the Brazilian securities markets or
8 - 8 --1
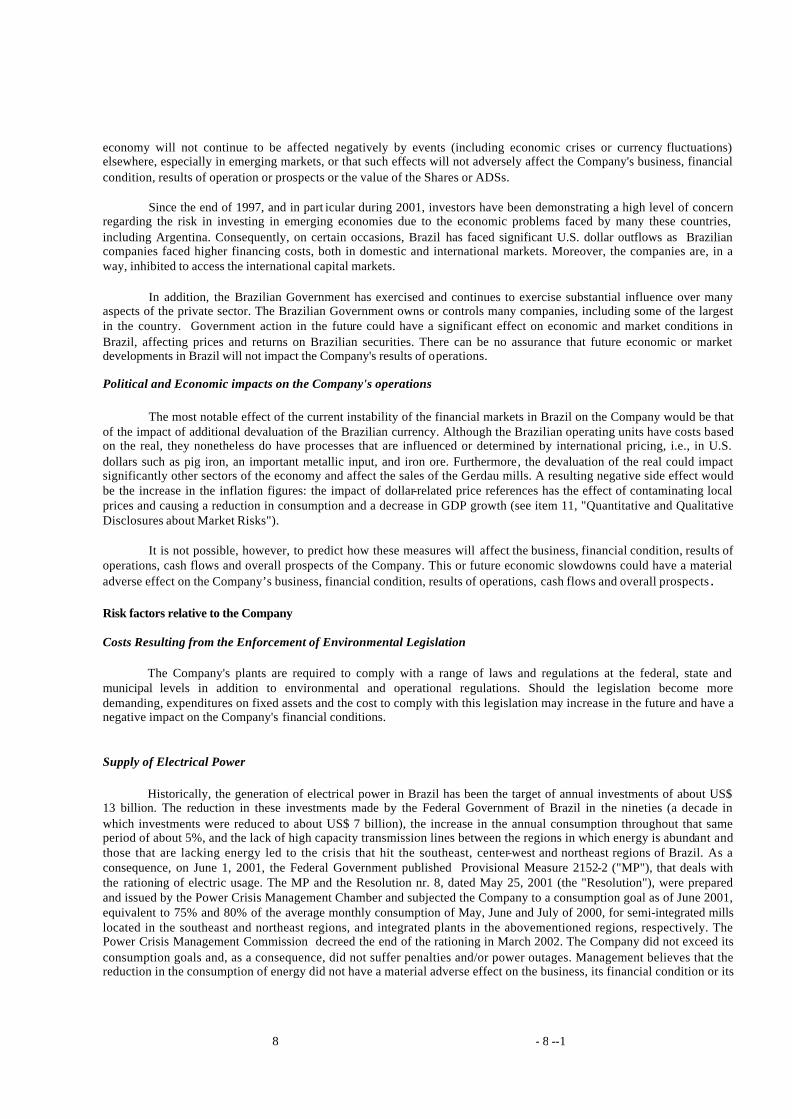
economy will not continue to be affected negatively by events (including economic crises or currency fluctuations) elsewhere, especially in emerging markets, or that such effects will not adversely affect the Company's business, financial condition, results of operation or prospects or the value of the Shares or ADSs.
Since the end of 1997, and in part icular during 2001, investors have been demonstrating a high level of concern regarding the risk in investing in emerging economies due to the economic problems faced by many these countries, including Argentina. Consequently, on certain occasions, Brazil has faced significant U.S. dollar outflows as Brazilian companies faced higher financing costs, both in domestic and international markets. Moreover, the companies are, in a way, inhibited to access the international capital markets.
In addition, the Brazilian Government has exercised and continues to exercise substantial influence over many aspects of the private sector. The Brazilian Government owns or controls many companies, including some of the largest in the country. Government action in the future could have a significant effect on economic and market conditions in Brazil, affecting prices and returns on Brazilian securities. There can be no assurance that future economic or market developments in Brazil will not impact the Company's results of operations.
Political and Economic impacts on the Company's operations
The most notable effect of the current instability of the financial markets in Brazil on the Company would be that of the impact of additional devaluation of the Brazilian currency. Although the Brazilian operating units have costs based on the real, they nonetheless do have processes that are influenced or determined by international pricing, i.e., in U.S. dollars such as pig iron, an important metallic input, and iron ore. Furthermore, the devaluation of the real could impact significantly other sectors of the economy and affect the sales of the Gerdau mills. A resulting negative side effect would be the increase in the inflation figures: the impact of dollar-related price references has the effect of contaminating local prices and causing a reduction in consumption and a decrease in GDP growth (see item 11, "Quantitative and Qualitative Disclosures about Market Risks").
It is not possible, however, to predict how these measures will affect the business, financial condition, results of operations, cash flows and overall prospects of the Company. This or future economic slowdowns could have a material adverse effect on the Company’s business, financial condition, results of operations, cash flows and overall prospects .
Risk factors relative to the Company
Costs Resulting from the Enforcement of Environmental Legislation
The Company's plants are required to comply with a range of laws and regulations at the federal, state and municipal levels in addition to environmental and operational regulations. Should the legislation become more demanding, expenditures on fixed assets and the cost to comply with this legislation may increase in the future and have a negative impact on the Company's financial conditions.
Supply of Electrical Power
Historically, the generation of electrical power in Brazil has been the target of annual investments of about US$ 13 billion. The reduction in these investments made by the Federal Government of Brazil in the nineties (a decade in which investments were reduced to about US$ 7 billion), the increase in the annual consumption throughout that same period of about 5%, and the lack of high capacity transmission lines between the regions in which energy is abundant and those that are lacking energy led to the crisis that hit the southeast, center-west and northeast regions of Brazil. As a consequence, on June 1, 2001, the Federal Government published Provisional Measure 2152-2 ("MP"), that deals with the rationing of electric usage. The MP and the Resolution nr. 8, dated May 25, 2001 (the "Resolution"), were prepared and issued by the Power Crisis Management Chamber and subjected the Company to a consumption goal as of June 2001, equivalent to 75% and 80% of the average monthly consumption of May, June and July of 2000, for semi-integrated mills located in the southeast and northeast regions, and integrated plants in the abovementioned regions, respectively. The Power Crisis Management Commission decreed the end of the rationing in March 2002. The Company did not exceed its consumption goals and, as a consequence, did not suffer penalties and/or power outages. Management believes that the reduction in the consumption of energy did not have a material adverse effect on the business, its financial condition or its

9 - 9 --1
results of operations. In addition, the threat of an increase in electricity tariffs did not materialize although this could happen in the medium term. Power and electricity represents approximately 9% of the Company’s total production cost. Currently, the Company believes that a significant concern is Brazil’s ability to invest in power generation capacity in order to avoid future risks including a new period of rationing, power outages and tariff increments, among others.
Market Concentration
Under Brazilian law, all activities that lead to market concentration involving at least one company with annual gross revenues of at least R$ 400 million or in control of at least a 20% market share must be reported to the authorities responsible for economic protection which, regardless of the approval of the transaction, may impose fines as a result of not presenting the appropriate documents on a timely basis. Any company that has more than 20% in the several different markets in which it operates may have its acquisitions questioned by the CADE - – Conselho Administrativo de Defesa Econômica, (Economic Defense Administrative Council) responsible for the analysis and decision on acts that indicate anticompetitive practices in any market.
Level of Indebtedness and Restrictive clauses to Funding
On December 31st, 2001, the level of indebtedness of the Group including contracts for funding in local and foreign currencies and debentures less cash and cash equivalents was less than its net worth (net debt to equity ratio of 91%).
The Company has entered into several loan contracts in addition to other forms of funding, such as the issuance of debentures, in an approximate total amount of US$ 1.3 billion (as of December 2001). Some of these contracts have restrictive clauses such as (i) issuance of debentures and golden shares and adding debt without the prior consent of the National Bank for Social and Economic Development - (exception made for loans for the regula r operation of the borrower with the sole purpose of replacing of material); (ii) constitution of guarantees as collateral of any kind of operation with other creditors without providing to the BNDES the same guarantees; (iii) the creation of liens on assets with exception made for those already pledged at the date of the signing of the respective contract unless the same conditions are extended to the holders of debentures , exception made for (a) any lien on capital goods placed at the time of their purchase as collateral, (b) liens on commercial goods to guarantee short term debt to be paid through the revenues generated by the sale of these goods, (c) liens on promissory notes and (d) liens given as legal guarantees; (iv) the payment of dividends in cash in excess of 30% of the Net Profit of each period adjusted in accordance with art. 202 of law 6.404/76 if after the payment of such excess: (a) the long term liability exceeds more than 1.5 times the net worth; or (b) current assets are less than current liabilities; (v) payment of dividends or any other form of statutory participation in the profits of the corporation if it is delinquent in the payment of the interest and the principal of the debentures; (vi) voluntary pre -payment of long-term debt without making the proportional buyout of debentures still outstanding in the market, except if these payments are for the replacement of long term debt with long term debt at a lower cost (lower interest rates, same interest rates or better conditions for the Company); (vii) encumbrance, transference, assignment or any form of disposal of quotas and/or the subscription owned or to be owned that may jeopardize directly or indirectly the controlling shareholders' ownership position; (viii) maintain INDAC – Indústria, Comércio e Administração S/A as the direct or indirect controlling entity of voting shares of the Company . Furthermore, many debt contracts require that the Company have, throughout the validity of these contracts, levels of capitalization and of current liquidity as determined by the parties.
Should any events of default as defined by these contracts occur, the Company could face the acceleration of the maturity of this debt as well as other contracts. The acceleration of the maturity of debt and other contracts might result in the Company’s inability to honor its commitments
Consolidation of the Steel market abroad
Market Consolidation
The Group has a substantial part of its business abroad. It is therefore subject to competition in these markets. In recent times, the steel sector has been undergoing a process of consolidation with the resulting creation of companies with greater production capacity. This can represent an important increase in competition. The Group may be forced to decide to acquire other companies or their assets, which may represent the outlay of substantial financial resources. There are no

10 - 10 --1
guarantees that the Group will have the financial resources to make these acquisitions should they become necessary or desirable.
Protectionist Measures
The measures imposed by the U.S. Administration and by the European Union to protect their domestic markets against the import of certain cheap steel products, do not impact directly the operations of Gerdau in Brazil due to the fact that exports to these countries are negligible. The Gerdau units in the U.S. operate independently and do not require any type of steel inputs from Brazil.
Argentine Crisis
Due to the economic crisis in Argentina, long steel demand in that country was reduced by roughly 50% as of the second half of 2001. The impact of this crisis on the Group’s activity level is limited because the Argentine operations represent less than 2% of Gerdau’s total sales. In order to adapt to the new economic reality, Gerdau has: i) adjusted its production to the local demand, ii) restricted credit, and iii) promoted a financial and corporate restructuring of its Argentine business.
The restructuring occurred in March 2002, as follows: Gerdau transferred its 71.77% stake in Sociedad Industrial Puntana S.A. – SIPSA to its partner Sipar Aceros S.A.. Gerdau maintains its stake of 38.18% in Sipar, whereas Sipsa becomes an integral subsidiary of Sipar. This new structure further reduced Gerdau’s exposure to the eventual impact o f any additional currency devaluation in Argentina and allows for better synergies between the two companies.
The significant devaluation of the Argentine peso vis -à-vis the US dollar generated a loss of US$ 21.4 million in Gerdau's business in the last quarter of 2001; in the first quarter of 2002, there was an additional loss of US$ 7.0 million. Moreover, the restructuring promoted in March generated a US$ 1.8 million loss.
ITEM 4. INFORMATION ON THE COMPANY
A. HISTORY AND DEVELOPMENT OF THE COMPANY
Gerdau is part of an industrial conglomerate, which began in 1901 with the acquisition by the Gerdau family of a nail factory located in Porto Alegre, in the Southern region of Brazil. In 1969, the business changed its name to Metalúrgica Gerdau S.A., which today controls Gerdau S.A.
With the objective of assuring the supply of raw material, immediately after the end of World War II, Siderúrgica Riograndense S.A., a steel producer also located in Porto Alegre, was acquired. The Company's output was increased through, among other things, the construction of a new mill. In the second half of the 1960s, the Company began to expand and diversify its activities.
The expansion involved the acquisition of existing companies (which increased the Company's market share) and the construction of new plants, in Brazil and abroad. The first company acquired was Indústria de Arames São Judas Tadeu S.A., in São Paulo, which is today known as "Comercial Gerdau". Comercial Gerdau, through a network of 70 branches, covers all of Brazil for retail sales of product. Subsequently, the Group expanded with various steel mills, drawing mills and factories for the production of strands, steel cables, soldered wire mesh and similar products located in principal Brazilian and foreign markets.
In order to assure competitive advantages in each region in which the Company operates, the Company adopted a principal strategy of acting through medium-sized companies situated in the heart of the economic regions capable of supplying raw materials originating in the same areas in which the final products were sold. See "Business Strategy".
In the beginning of 1995, a corporate restructuring program was initiated to simplify the structure resulting from the process of expansion and development through acquisition and establishment of companies, with the purpose of

11 - 11 --1
improving the transparency of operations, achieving greater acceptance in the modern Brazilian capital markets and enhancing the conditions for access to international capital markets.
The restructuring began with a public exchange offer of preferred shares of the former Companhia Siderúrgica da Guanabara-Cosigua (today Gerdau S.A.) held by the controlling shareholders in exchange for shares held by minority shareholders in the following affiliated companies: Siderúrgica Guaira S.A.(“Guaira”), Siderúrgica Açonorte S.A. (“Açonorte”) and Cia. Siderúrgica Pains (“Pains”). This transaction was conducted through the São Paulo Stock Exchange in February 1995 and the widespread acceptance of this process by the shareholders of these companies permitted the continuation of the restructuring process by merger, during the period of February 1995 through June 1997, of 28 companies then comprising the Gerdau group. In January 1999 Comercial Gerdau was also merged into Gerdau S.A. All of the steel mill operations of Gerdau, installed in Brazil and abroad, are concentrated in Gerdau S.A.
B. BUSINESS OVERVIEW
Gerdau S.A. is a producer of long ordinary and specialty steel through its industrial units located in Brazil and its subsidiaries in Uruguay, Chile, Canada, Argentina and the United States, with installed production capacity of 7.3 million tons of crude steel (not including Açominas and Cartersville), 7.0 million tons of rolled product (not including Açominas, Cartersville and Sipar) and 0.9 million tons of drawn products. The Company produces steel based on the mini-mill concept, whereby steel is produced in electric arc furnaces, starting with scrap and pig iron acquired mainly in the region where each mill operates (the so-called mini-mill concept). Gerdau also operates plants capable of producing steel starting with iron ore in blast furnaces and through the direct reduction process. Gerdau's products are manufactured with a wide range of specifications, intended to satisfy a large spectrum of consuming groups.
The three principal markets in which the Company operates are the civil construction, manufacturing and agricultural and breeding sectors. Last year, the first two represented approximately 98% of the total sales volume of the Company measured in tons. In 2001, Gerdau produced 6.1 million tons of crude steel, of which 3.5 million (not including Açominas’ production) were produced in Brazil (13.0% of national production) and 2.6 million tons through its subsidiaries abroad. In the segment of long rolled steel, Gerdau is the largest Brazilian producer, with approximately 44.5% of total production.
For the fiscal year ended December 31, 2001, the Company achieved consolidated net sales in the amount of U.S.$ 2.3 billion, generating consolidated net income of U.S.$ 167.3 million.
Business Strategy
Gerdau's principal business focus is the decentralized production of long steel products using electric arc furnaces ("EAF") mini-mills employing continuous casting technology. Plants are sized and located in order to fit in the local economy and access markets efficiently. This strategy was a response to the geographical dimensions of Brazil, its limited infrastructure and high freight costs, which motivated growth of a business focused on selling products where raw materials were readily accessible. From the mid 1970s through the early 1990s, Gerdau concentrated on improving its market share in Brazil through a combination of increasing the production capacity of its existing facilities and through strategic acquisitions, typically of distressed mini-mills where the Company's principal contribution would be management skills rather than capital. Gerdau has increased its share of Brazilian long steel production from 14.1% of total tonnage produced in 1975 to 44.5% in 2001. The Company's share of Brazilian crude steel production grew from 6.3% to 13.0% during the same period. See, "Production Process - Domestic Steel Production." Gerdau's strategy has been implemented through the following acquisitions:
• Domestic acquisitions: In the 1960s the Company acquired a mill in Pernambuco in Northeast Brazil. In the 1970s it acquired two mills (Alagoas and Paraná) and constructed its largest mill in Rio de Janeiro. Gerdau's structure further developed as a result of its participation in Brazil's privatization auctions in the late 1980s and early 1990s. In the first phase of privatizations, it acquired Barão de Cocais mill in 1988 and Usina Siderúrgica da Bahia S.A.-Usiba (“Usiba”) in 1989. In the second, broader phase of privatizations, Gerdau acquired Companhia Siderúrgica do Nordeste ("Cosinor") in 1991 and Aços Finos Piratini S.A. (“Piratini”), a specialty steel maker, in part in order to enter the market for high-value-added products. Gerdau has increased productivity of these privatized mills significantly since the acquisition (as measured in metric tons of crude steel per man-year) by reducing the number of employees and investing in technological upgrades of processes and equipment. Through these investments and
12 - 12 --1
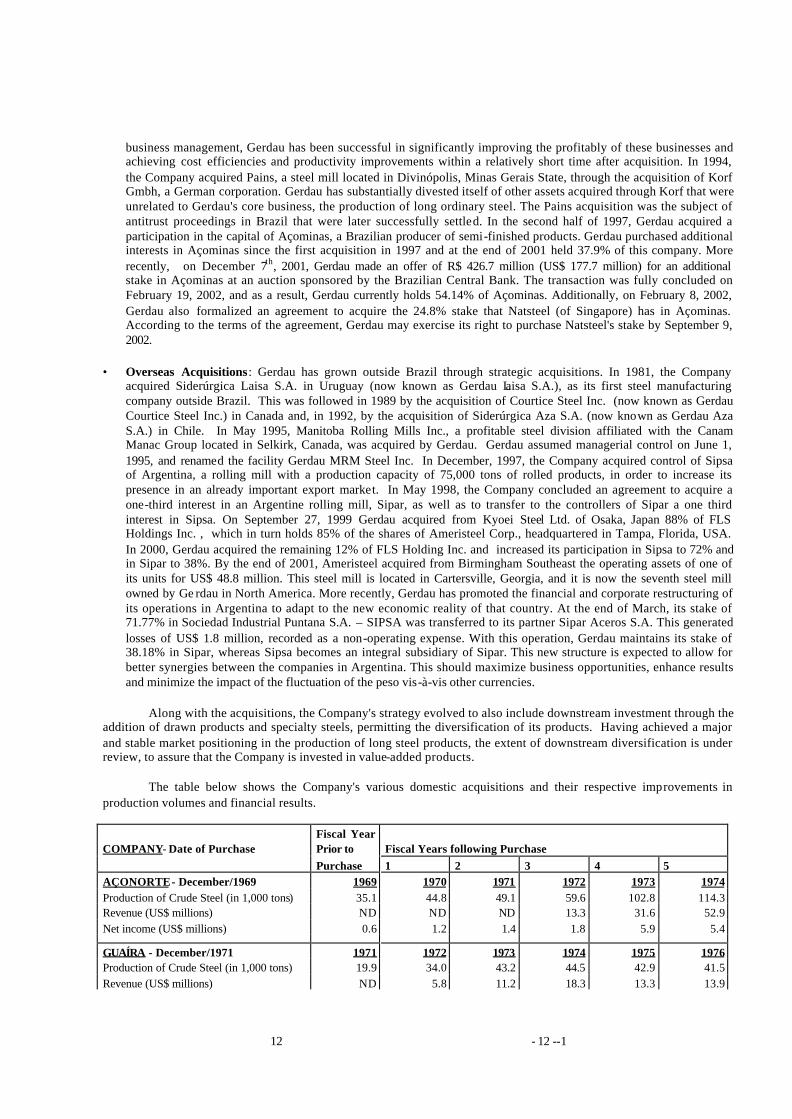
business management, Gerdau has been successful in significantly improving the profitably of these businesses and achieving cost efficiencies and productivity improvements within a relatively short time after acquisition. In 1994, the Company acquired Pains, a steel mill located in Divinópolis, Minas Gerais State, through the acquisition of Korf Gmbh, a German corporation. Gerdau has substantially divested itself of other assets acquired through Korf that were unrelated to Gerdau's core business, the production of long ordinary steel. The Pains acquisition was the subject of antitrust proceedings in Brazil that were later successfully settled. In the second half of 1997, Gerdau acquired a participation in the capital of Açominas, a Brazilian producer of semi-finished products. Gerdau purchased additional interests in Açominas since the first acquisition in 1997 and at the end of 2001 held 37.9% of this company. More recently, on December 7th, 2001, Gerdau made an offer of R$ 426.7 million (US$ 177.7 million) for an additional stake in Açominas at an auction sponsored by the Brazilian Central Bank. The transaction was fully concluded on February 19, 2002, and as a result, Gerdau currently holds 54.14% of Açominas. Additionally, on February 8, 2002, Gerdau also formalized an agreement to acquire the 24.8% stake that Natsteel (of Singapore) has in Açominas. According to the terms of the agreement, Gerdau may exercise its right to purchase Natsteel's stake by September 9, 2002.
• Overseas Acquisitions: Gerdau has grown outside Brazil through strategic acquisitions. In 1981, the Company acquired Siderúrgica Laisa S.A. in Uruguay (now known as Gerdau Laisa S.A.), as its first steel manufacturing company outside Brazil. This was followed in 1989 by the acquisition of Courtice Steel Inc. (now known as Gerdau Courtice Steel Inc.) in Canada and, in 1992, by the acquisition of Siderúrgica Aza S.A. (now known as Gerdau Aza S.A.) in Chile. In May 1995, Manitoba Rolling Mills Inc., a profitable steel division affiliated with the Canam Manac Group located in Selkirk, Canada, was acquired by Gerdau. Gerdau assumed managerial control on June 1, 1995, and renamed the facility Gerdau MRM Steel Inc. In December, 1997, the Company acquired control of Sipsa of Argentina, a rolling mill with a production capacity of 75,000 tons of rolled products, in order to increase its presence in an already important export market. In May 1998, the Company concluded an agreement to acquire a one-third interest in an Argentine rolling mill, Sipar, as well as to transfer to the controllers of Sipar a one third interest in Sipsa. On September 27, 1999 Gerdau acquired from Kyoei Steel Ltd. of Osaka, Japan 88% of FLS Holdings Inc. , which in turn holds 85% of the shares of Ameristeel Corp., headquartered in Tampa, Florida, USA. In 2000, Gerdau acquired the remaining 12% of FLS Holding Inc. and increased its participation in Sipsa to 72% and in Sipar to 38%. By the end of 2001, Ameristeel acquired from Birmingham Southeast the operating assets of one of its units for US$ 48.8 million. This steel mill is located in Cartersville, Georgia, and it is now the seventh steel mill owned by Ge rdau in North America. More recently, Gerdau has promoted the financial and corporate restructuring of its operations in Argentina to adapt to the new economic reality of that country. At the end of March, its stake of 71.77% in Sociedad Industrial Puntana S.A. – SIPSA was transferred to its partner Sipar Aceros S.A. This generated losses of US$ 1.8 million, recorded as a non-operating expense. With this operation, Gerdau maintains its stake of 38.18% in Sipar, whereas Sipsa becomes an integral subsidiary of Sipar. This new structure is expected to allow for better synergies between the companies in Argentina. This should maximize business opportunities, enhance results and minimize the impact of the fluctuation of the peso vis-à-vis other currencies.
Along with the acquisitions, the Company's strategy evolved to also include downstream investment through the addition of drawn products and specialty steels, permitting the diversification of its products. Having achieved a major and stable market positioning in the production of long steel products, the extent of downstream diversification is under review, to assure that the Company is invested in value-added products.
The table below shows the Company's various domestic acquisitions and their respective improvements in production volumes and financial results.
COMPANY- Date of Purchase
Fiscal Year Prior to
Fiscal Years following Purchase
Purchase 1 2 3 4 5 AÇONORTE - December/1969 1969 1970 1971 1972 1973 1974 Production of Crude Steel (in 1,000 tons) 35.1 44.8 49.1 59.6 102.8 114.3 Revenue (US$ millions) ND ND ND 13.3 31.6 52.9 Net income (US$ millions) 0.6 1.2 1.4 1.8 5.9 5.4 GUAÍRA - December/1971 1971 1972 1973 1974 1975 1976 Production of Crude Steel (in 1,000 tons) 19.9 34.0 43.2 44.5 42.9 41.5 Revenue (US$ millions) ND 5.8 11.2 18.3 13.3 13.9

13 - 13 --1
Net income (US$ millions) 0.02 0.4 1.4 2.0 1.1 1.0 COMESA - January/1974 1973 1974 1975 1976 1977 1978 Production of Crude Steel (in 1,000 tons) 4.7 11.9 7.0 14.3 16.1 16.8 Revenue (US$ millions) 0.9 4.5 4.6 6.2 6.8 8.3 Net income (US$ millions) (1.7) 0.4 0.1 0.4 0.7 0.7 HIME - February/1985 1984 1985 1986 1987 Production of Crude Steel (in 1,000 tons) 200.2 192.1 188.3 Merged into Cosigua Revenue (US$ millions) 47.7 ND 68.9 (presently Gerdau S.A.) Net income (US$ millions) (5.0) ND (0.4) USIBA - October/1989 1989 1990 1991 1992 1993 1994 Production of Crude Steel (in 1,000 tons) 336.4 315.9 310.0 330.2 377.9 401.4 Revenue (US$ millions) 101.8 78.8 72.9 91.6 96.6 167.4 Net income (US$ millions) (19.2) (12.6) 1.7 (3.1) 2.3 1.2 PIRATINI February/1992 1991 1992 1993 1994 1995 Production of Crude Steel (in 1,000 tons) 171.9 141.4 178.2 192.4 Merged into Riograndense Revenue (US$ millions) 66.8 61.3 94.1 164.6 (presently Gerdau S.A.) Net income (US$ millions) (21.0) (5.1) 1.4 2.3 PAINS - February/1994 10/92 to
09/93 10/93 to
12/94 1995 1996 1997
Production of Crude Steel (in 1,000 tons) 438.2 502.7 343.5 385.5 Merged into Gerdau S.A. Revenue (US$ millions) 138.8 253.0 219.1 193.6 Net income (US$ millions) 2.6 2.6 4.5 6.0
Future
The Company will continue to implement its strategy over the near and medium-term, by undertaking the following steps:
• Financial Management: Given the high cost of financing in Brazil and the current trend toward consolidation in the steel industry worldwide, the Company's medium-term strategy is to consolidate its existing acquisitions and reduce financial expenses. This will be achieved through a financial strategy to extend the tenor of its existing debt in order to increase cash flow available for reinvestment without substantially increasing overall leverage of the Company. The intention is to fund capital expenditures increasingly out of cash flow, with the exception of strategic expansions required to maintain or establish market share in a profitable market segment. The focus is first on increasing the efficiency and profitability of existing operations and limiting allocation of capital for acquisitions to only the most important opportunities.
• Cost Management : The Company will continue to concentrate on securing adequate and reliable steel scrap supplies and adjusting its production levels to minimize variable costs of production. While the Company has the flexibility to switch production from the domestic market to exports, depending on market demand, domestic sales generally have been more profitable than export sales and it is likely in the future to focus heavily on regional sales for each of its companies. Nonetheless, the historical volatility of the Brazilian economy has made it a management priority that Gerdau maintain a high degree of production and market flexibility in order to quickly adapt to changing market conditions.
The acquisition of Cartersville (installed capacity of 726 thousand tons of crude steel per year in the USA) and the increase of the investment in Açominas also constitute important steps for the future development of the Company's business.

14 - 14 --1
Industry Overview - Worldwide and Brazil
Since the 1940s, steel has been of vital importance to the Brazilian economy. As a result of an interruption of steel supplies during World War II, the Brazilian government began developing the domestic steel industry by forming Companhia Siderúrgica Nacional ("CSN"), a flat steel producer, and Companhia Vale do Rio Doce, an iron ore producer. During almost 50 years of state control, the Brazilian flat steel sector was coordinated on a national basis under a steel monopoly, Siderbrá s. The state had far less involvement in the non-flat sector, which has traditionally been made up of smaller private sector companies such as Gerdau. As a result of the debt crisis of the 1980s, the Brazilian government's access to foreign capital became severely restricted and further investment in the state steel sector was reduced. For a general discussion as the Brazilian economic environment, see "Item 3.D - Risk Factors."
In 1990, the Brazilian government selected the steel industry as the first industry to become privatized. Starting in 1991, the larger integrated flat steel producers, which had operated as semi-autonomous companies under the control of Siderbrás, were individually privatized. Today, the Brazilian steel industry is composed of 12 companies, with an installed annual capacity of approximately 33 million tons, producing a full range of flat, non-flat, carbon, stainless and specialty steel. The flat steel industry is currently dominated by the producers that before privatization used to belong to Siderbrás, such as CSN, while Gerdau has become the leading producer of long steel products.
Brazil exports a great part of its steel production. In 2001, the Brazilian steel industry exported 9.3 million tons, while it imported only 1.1 million tons. Steel imports in 2001 represented 6.1% of domestic apparent steel consumption (defined as domestic sales plus imports).
Brazil's production of crude steel rose from 20.6 million tons in 1990 to 26.7 million tons in 2001. In 2001, Brazil accounted for over 51.6% of total steel production in Latin America, with production over two times that of Mexico, the second largest producer in Latin America, and approximately 29.7% of U.S. production.
Crude steel products comprise non-finished ingots, billets, blooms and slabs produced at the melting and casting stage of the production process. Rolled products are higher value-added products manufactured from crude steel at the intermediate stage of production in rolling mills. Long rolled products include wire rod, rebars, profiles, and round, square and flat bars.
All information concerning the steel industry contained herein was obtained from either IBS (the Brazilian Steel Institute) reports or IISI (International Institute for the Steel Industry) and was not prepared specifically for Gerdau. This information is publicly available and is presented in a standardized format. IBS is comprised of Brazilian steel companies, and Gerdau is included among them as an associated member.
The following table shows historical crude steel production (in millions of tons) and related data for the periods indicated: World U.S. South
America Mexico Brazil Brazil - % of
World Production (millions of tons) 1990 770.5 89.7 29.3 8.7 20.6 2.7 1991 733.6 79.7 30.9 8.0 22.6 3.1 1992 719.7 84.3 32.3 8.5 23.9 3.3 1993 727.5 88.8 33.8 9.2 25.2 3.5 1994 725.2 91.2 35.0 10.3 25.7 3.5 1995 752.3 95.2 34.6 12.1 25.1 3.3 1996 750.0 95.5 35.9 13.2 25.2 3.4 1997 798.9 98.5 37.0 14.2 26.2 3.3 1998 777.2 98.7 36.1 14.2 25.8 3.4 1999 788.3 97.4 34.6 15.3 25.0 3.2 2000 829.6 100.7 39.1 15.7 27.9 3.4 2001 831.8 89.7 37.6 13.5 26.7 3.2 Source: IBS / IISI

15 - 15 --1
The following table shows historical rolled steel production (in millions of tons) in Brazil for the periods indicated. Rolled Products - Brazil Flat Long Total (millions of tons) 1990 8.8 6.0 14.8 1991 9.4 5.5 14.9 1992 10.1 5.8 15.9 1993 10.0 6.5 16.5 1994 10.7 6.7 17.4 1995 10.6 5.5 16.1 1996 11.0 5.7 16.7 1997 11.3 6.1 17.4 1998 10.4 6.0 16.4 1999 10.1 6.7 16.8 2000 11.2 7.0 18.2 2001 10.7 7.4 18.1 Source: IBS
Consumption
Real GDP in Brazil grew at a rate of 1.5% in 2001 (based on preliminary data) and 4.5% and 0.8% in 2000 and 1999, respectively. Total domestic steel sales increased by over 33.9% from 11,725 million tons in 1995 to 15,696 million tons in 2001. Brazilian industrial production grew in all of the steel intensive sectors of the economy, especially capital goods and consumer durables.
Historically, the Brazilian steel industry has been affected by substantial fluctuations in domestic demand for steel. Although national per capita demand varies with GDP, fluctuations in steel demand tend to be more pronounced than changes in economic activity. For purposes of comparison, the following table sets forth global steel apparent consumption from 1993 through 2000, the most recent year for which statistics are available. Apparent Steel Consumption of Finished Steel World US
South America Mexico Brazil
(millions tons of finished steel products) 1993 614.1 90.8 18.9 7.5 10.6 1994 619.8 103.1 20.9 8.8 12.1 1995 656.0 100.0 22.1 5.9 12.0 1996 651.8 107.0 23.1 8.1 13.0 1997 701.7 113.4 26.6 9.7 15.3 1998 691.6 119.8 25.7 10.6 14.5 1999 700.3 116.4 22.6 10.9 14.1 2000 761.6 120.0 24.7 11.3 15.8 2001 * * * * 16.7 * 2001 data are not available Source: IISI
Production Costs
Brazil is one of the world's lowest cost producers of steel. Brazil's advantages include a relatively inexpensive and abundant supply of raw ma terials, as well as low labor costs. Brazil also has the benefit of a relatively large internal market. These advantages are offset to some extent by such factors as dependence on imported coal, high internal costs of financing and restricted availability of electric energy.

16 - 16 --1
Production Process
In 2001, the Company was the largest manufacturer of long-rolled steel products and the fourth largest crude steel producer in Brazil. The Company offers over 34,000 products in the commodity steel, rolled steel, dra wn steel and specialty steel segments of the steel market. In 2001, the Company produced 3,470 thousand metric tons of crude steel in Brazil (not including Açominas’ production) and 2,580 thousand metric tons of crude steel abroad.
Domestic Steel Production
The Company's production of steel has increased steadily since 1991 mainly due to the acquisition of several steel companies and increases in the installed capacity of the Company's steel mills. Comparing the production capacities in 1992 and 2001, on the table below, the increase is notable:
Production Capacity
(million of tons) Crude Steel Long rolled products Drawn products 2001 7.3 7.0 0.9 1992 3.9 3.3 0.8
In 2001, 57.4%, or 3.5 million tons of the Company's crude steel was produced in Brazil (excluding Açominas) and 42.6%, or 2.6 million tons, was produced by the Company's subsidiaries located in Canada, Chile, Uruguay and the United States; while 57.1%, or 3.3 million tons, of the Company's long rolled products was produced in Brazil (excluding Açominas), 42.9%, or 2.5 million tons, was produced outside Brazil (excluding Sipar). All of the Company's drawn products are produced in Brazil.
According to IBS data, in 1975 Brazilian steel production equaled 8.3 million tons of crude steel and 3.6 million tons of long rolled products. In the same year Gerdau companies produced 525 thousand tons of crude steel and 506 thousand tons of long rolled products, 6.3% and 14.1%, respectively.
The table below sets forth, for the periods indicated, a comparison of the annual production of crude and long rolled steel for Brazil and for Gerdau S.A. and the percentage of crude and long rolled steel production attributable to the Company:
Output - Gerdau S.A. non-consolidated and Brazil (in millions of tons) Crude Steel Long Rolled Products* Brazil Gerdau S.A.
non-consolidated Gerdau S.A.
(%) Brazil Gerdau S.A.
non-consolidated Gerdau S.A.
(%)
1990 20,567 2,374.0 11.5 5,921 1,900.8 31.1 1991 22,617 2,090.3 9.2 5,533 1,804.7 32.6 1992 23,934 2,427.5 10.1 5,741 2,084.9 36.3 1993 25,207 2,588.2 10.3 6,477 2,268.0 35.0 1994 25,747 3,039.4 11.8 6,618 2,673.8 40.4 1995 25,076 2,752.7 11.0 5,434 2,455.6 45.1 1996 25,237 2,877.9 11.4 5,661 2,528.6 44.7 1997 26,153 3,051.4 11.7 6,158 2,781.4 45.2 1998 25,760 2,974.2 11.6 6,047 2,753.1 46.0 1999 24,996 3,270.5 13.1 6,672 3,054.9 45.8 2000 27,865 3,495.9 12.5 7,000 3,250.3 46.4 2001 26,718 3,470.1 13.0 7.425 3,301.4 44.5
Source: IBS/Gerdau * See also, - “Competition.”

17 - 17 --1
Gerdau S.A.'s production process is based mostly on the mini-mill concept. It has six electric arc furnace ("EAF") mills, two small integrated units and one direct reduction iron ("DRI") plant.
Mini-mills are smaller mills which offer several advantages over the larger integrated steel producers, including: (i) lower capital costs; (ii) lower operational risks due to the avoidance of a concentration of capital and production capacity in a single production unit; (iii) the proximity of production units to raw material sources; (iv) the proximity to the local markets and the ease of adjustments in production levels; (v) less expensive raw material costs, principally due to the use of steel scrap instead of iron ore and coke, which are employed by the larger integrated mills; and (vi) more efficient management structure due to the relative simplicity of the production process and lower manning levels required.
The Company's production process consists of (i) sourcing, (ii) melting, (iii) casting, (iv) rolling and (v) drawing.
Sourcing
The Company's mini-mills (which have annual crude steel production capacities ranging from 70,000 tons to 1.4 million tons) use steel scrap and pig iron produced from within a radius of 120 to 300 miles and manufacture primarily products for consumption within the region in wh ich the mill is located. This production strategy has the advantage of minimizing transportation costs of raw materials and final products and allows capacity adjustments to be made in relatively small increments. The Company acquires its main raw materia l, steel scrap for use in its electric arc furnaces, from an extensive network of more than 4,500 suppliers. The Company believes it is the largest purchaser of steel scrap in Brazil. Iron ore for use in its blast furnaces and DRI plant is bought from several Brazilian mining companies. Pig iron, for use in its electric arc furnaces, is produced by the Company or bought from third parties. In 2001, the Company produced approximately 70% of its pig iron consumption needs.
Liquid Steel Production
Liquid steel is produced in electric arc furnaces, energy optimizer furnaces or in a blast furnace/converter combination. After charging the electric arc furnace with the predetermined mixture of raw materials (i.e., scrap, pig iron or DRI), electric power is applied following a computer-controlled melting profile. The Company's mixture of raw material varies from 60% steel scrap and 40% pig iron to 90% steel scrap and 10% pig iron, depending upon prices and local availability. The Company believes that these ratios optimize the use of available steel scrap without causing demand pressure in the relevant steel scrap markets. In the blast furnace/converter combination, liquid steel is produced by reducing iron ore by burning charcoal, coke or a combination of both with oxygen. DRI is a process that replaces the blast furnace and reduces the amount of iron ore used by injecting hot natural gas, producing what is commonly known as sponge iron, which will then be placed into an electric arc furnace or a converter.
The molten steel is then tapped into the ladle furnace where it is refined according to customer specification. Ferro-alloys are added in the ladle furnace according to the chemical specifications of the grade of steel being produced. In the case of high-alloy steel, or specialty steel, the ladle is taken to a vacuum degasification unit to remove carbon, oxygen and gases.
Continuous Casting
The liquid steel is transferred from the ladle furnace into a continuous casting machine from which it emerges as a continuous square strand of steel that is cut into pre-determined lengths, called billets. In the continuous casting machine, the liquid steel is poured into a mold and cooled from the outside in, so that a solidified shell is formed around the molten metal as it emerges from the mold, allowing it to hold its shape.
Downstream Processing
The billets are transferred to a rolling mill to produce finished, rolled or drawn products. The billets are reheated, reduced in diameter and then rolled into finished reinforcing concrete bars ("rebars"), bars, shapes, and wire rod. These products then are allowed to cool uniformly. Drawn products are created by drawing wire rod, without reheating, producing wires of various shapes and thickness, such as welding wires, barbed and barbless fencing wires, galvanized wires, concrete reinforcing wire, and other wires. Wire is also the input for other products such as wire meshes, chains, nails and clamps.

18 - 18 --1
Set forth below is a brief description of the Company's main product lines and the markets they serve:
Crude Steel - Crude steel has a relatively low value-added process. The Company's main crude steel product is continuously cast billets, most of which is consumed by the Company in the manufacture of finished products and specialty steels. During 2001, billets accounted for 1.6% of the Company's domestic sales and 28.2% of export sales, as measured by weight.
Rolled Steel - Billets are used to manufacture rolled products such as wire rod, rebars, profiles and round, square and flat bars. In 2001, common steel rolled products accounted for 56.4% of the Company's domestic sales, 68.1% of export sales and 100% of the sales of the subsidiaries abroad, as measured by weight. The main market for the Company's domestic sales of rebars is Brazil's civil construction market, which uses finished steel products for a variety of purposes including water dams, port docks and facilities, bridges, highways, tunnels and commercial and residential building construction.
Drawn Steel -These are high value added products and include wires of various shapes and thicknesses, welding wires, barbed and barbless fencing wires, galvanized wires, concrete reinforcing wire mesh, nails and clamps. These products are sold to the manufacturing, the civil construction and the agriculture sector. In 2001, drawn products accounted for 21.0% of the Company's domestic sales and 2.6% of exports, as measured by weight.
Specialty Steel - Specialty or high-alloy steel requires advanced manufacturing processes and normally includes some degree of customization. The Company produces specialty steel, which includes stainless steel, used for the manufacturing of tools and machinery (e.g. cold, hot and high-speed steels), chains, fasteners, railroad spikes and special spring steel, at the Piratini plant. Specialty steel products are mainly consumed by Brazil's manufacturing sector, including the automotive and mechanical industries. In 2001, production at the Piratini plant represented approximately 31.7% of the Brazilian long specialty steel production. Each level of processing adds value to the simple crude steel product and as the product goes through incremental refining processes, it commands a significantly higher price in the market. Specialty steel accounted for 7.6% of domes tic sales and 1.1% of exports in the same year, as measured by weight.
The following is a description of several of the products produced by the Company:
CIVIL CONSTRUCTION PRODUCTS
GG-50, CA-60 and CA-25 concrete reinforcing bars (rebars) Annealed wire
Ribbed welded wire mesh for reinforced concrete
Transfer bars POP columns and meshes Stirrups and supports
Structural profiles Fabricated rebar
Casa Fácil Gerdau (rolled steel structure for low-income housing) INDUSTRIAL PRODUCTS
Hot rolled flat, round and square bars
Cold drawn round, square and hexagonal bars Blooms Angles
Channel, I-beam, T-Shapes and W-beams Ribbed T profile Elevator guide rails
Star profile Slabs

19 - 19 --1
Tribar Wire rod
Rolled and continuous cast billets
Steel railroad ties Special section profiles (manufactured in Canada)
Grader blades
Smelter bars Light rails
Superlight I-beams Elevator guide rails
Metallurgy
Complete line of wires for industrial applications, welding and wire ropes AGRICULTURAL PRODUCTS
Oval-shaped wire and barbed wire
High-Strength steel fence posts Staples for fences
Cercafix post-spacing wire
Wire and posts for electric fences Wire rope for corrals
Wire and wire rope for agricultural products Galvanized wire
Plastic-coated galvanized wire
Chain link fences NAILS
Bulk nails - construction
Bulk nails - carpentry Bulk nails - packaging
SPECIALTY STEELS Engineering steels (carbon and alloyed)
Round and square rolled bars
Wire rod Forged bars
Cold-finished products
Heat treatment Tool steels
Forged bars and blooms
Round, square and flat rolled bars Stainless steels
Round and square rolled bars Wire rod
Forged bars
Cold-finished

20 - 20 --1
Foreign Subsidiaries' Steel Production
The Company's production of steel abroad has grown steadily between 1981 and 1999, through acquisitions and increases in the production capacity of its foreign facilities. In acquiring foreign businesses, the Company has maintained its focus on the mini-mill-based production of long common steel products, but also seeks undervalued or under-performing steel mills. The Company believes that due to the large capital investment required to build a steel mill and the existing global oversupply of steel, acquisitions are the preferred means of expansion outside Brazil.
The following table sets forth, for the periods indicated, the production of crude steel and rolled products of the Company's production facilities abroad (in thousands of tons): LAISA
(Uruguay)
AZA (Chile)
COURTICE (Canada)
MRM (Canada)
SIPSA (Argentina)
AMERISTEEL (USA)
Year Crude Steel
Long Rolled Products
Crude Steel
Long Rolled Products
Crude Steel
Long Rolled Products
Crude Steel
Long Rolled Products
Crude Steel
Long Rolled Products
Crude Steel
Long Rolled Products
1993 29.0 29.0 34.0 25.0 227.0 190.0 - - - - - - 1994 28.9 28.3 41.8 27.9 234.0 199.2 - - - - - - 1995 33.7 29.2 62.7 54.3 245.0 182.2 156.4 142.4 - - - - 1996 43.5 36.1 72.8 68.1 244.5 206.2 273.8 258.0 - - - - 1997 45.9 39.3 79.5 75.9 201.1 176.3 310.3 277.9 - - - - 1998 51.4 45.2 80.4 75.7 259.8 220.5 294.9 265.0 - 39.0 - - 1999 45.4 41.6 140.9 122.2 260.4 250.6 290.6 261.3 - 38.5 453.9* 405.9* 2000 43.7 40.1 216.5 200.6 281.8 269.1 304.8 270.2 - 37.9 1,761.2 1,655.7 2001 41.2 37.3 244.2 225.7 294.4 274.6 321.4 277.8 - 29.4 1,678.8 1,640.3 * October through December
Laisa. In 1981, the Company acquired the Laisa mini-mill, located in Uruguay. Laisa has been profitable for the last 12 years and is the largest producer of long steel products in Uruguay. Laisa has a production capacity of 70,000 tons of crude steel and 72,000 tons of rolled steel per annum. Laisa is the only domestic steel producer in Uruguay. Production statistics are based on Laisa's production and sales added to Uruguayan imports. Import data are provided by the Customs of Uruguay and the Bank of the Republic, its financial agent. These two institutions report to the Ministry of Economy.
Aza. In 1992, the Company acquired the Aza mini-mill, located in Chile. In January 1999, a second steel plant began operations in Chile. The new mill, in conjunction with the continuing upgrading of existing facility, increased total annual capacity to 360 thousand tons of crude steel and 440 thousand tons of rolled steel per year. The discrepancy between figures related to crude steel and long rolled products is due to the fact that the Company dedicates an old long rolled products unit to the production of shapes and profiles. Based on official import statistics furnished by the Chilean Government (part of the market is supplied by imports) and information obtained from other producers (there are no official statistics about each company's production), the Company believes that it controls approximately 35% of the market.
Courtice. The Company acquired the Courtice mini-mill, located in Canada, in 1989. At that time Courtice had incurred losses for the previous three years and offered the Company an opportunity to gain valuable managerial and technical experience competing within the highly competitive North American market. Courtice is now a profitable unit with a production capacity of 305,000 tons of crude steel and 280,000 tons of rolled steel per annum.
MRM. MRM was acquired in June 1995. In 1995, as a result of its presence in the Canadian market, Gerdau became aware of an opportunity to acquire MRM, historically a profitable production facility and a quality producer of special shapes and other rolled products complementary to Courtice's product line. In 2001, MRM had a production capacity of 355,000 tons of crude steel and 300,000 tons of rolled steel per annum.
Sipsa. At the end of 1997 Gerdau acquired Sociedad Industrial Puntana S.A., a rolling mill installed in Argentina, with a production capacity of 75,000 tons of rolled products, with a view to increasing its presence in an important market to which it already exported steel products. In 1998, Gerdau transferred one third of its shares to Sipar reducing its stake to 67%. In 2000 Gerdau increased its participation to 72%. More recently the Argentine operation was restructured. See “Business Strategy”.

21 - 21 --1
Ameristeel. On September 27, 1999 Gerdau acquired from Kyoei Steel Ltd. of Osaka, Japan, 88% of FLS Holdings Inc. which in turn holds 85% of the shares of Ameristeel Corp., headquartered in Tampa, Florida, USA. In 2000, Gerdau acquired the remaining 12% of FLS Holding Inc.. Ameristeel is engaged in the manufacture and sale of long steel products from recycled scrap raw material and has an installed capacity of nearly 2,040,000 tons of crude steel per annum and 1,841,000 tons of rolled steel. Steel operations are conducted in four non union manufacturing facilities located respectively in the states of Florida, Tennessee (two) and North Carolina, eighteen “rebar fabrication shops”, two operations for manufacturing rail spikes and one for producing nails and welded wire mesh. More recently, by the end of 2001, Ameristeel acquired from Birmingham Southeast the operating assets of a unit located in Cartersville, Georgia. This new unit is now the fifth plant of Ameristeel, and added 726 thousands tons of crude steel capacity and 544 thousands tons of rolling capacity.
Other Businesses
The Company owns pine forests and eucalyptus forests. The Company has planted these forests since 1971. The forests allow the Company to obtain certain tax advantages.
Eucalyptus is used as a raw material for the production of charcoal. Charcoal is used in the blast furnaces for pig iron production.
Availability of Raw Materials
Due to the nature of its business operations, Gerdau S.A. does not usually enter into long-term supply contracts with its suppliers and is therefore subject to fluctuations in the prices and availability of these items. In 2001, the five largest suppliers accounted for approximately 15% of Gerdau S.A.’s total purchases, and the ten largest suppliers (including energy) accounted for approximately 20% of purchases. In that period, the largest supplier of steel scrap to Gerdau S.A. accounted for approximately 2.0% of Gerdau S.A.’s steel scrap purchases.
Metallic Inputs
The principal raw metallic input materials used in the Company's steel making activities are steel scrap, pig iron, iron ore (used in the blast furnaces at the Divinópolis and Barão de Cocais facilities and at Usiba's - Simões Filho - DRI plant), and ferro-alloys.
The Company uses a mixture of steel scrap and pig iron or DRI for the production of steel. Pig iron is used because of the relative scarcity of good quality steel scrap in the Brazilian market (in the United States, by contrast, mini-mill steel makers usually use 100% steel scrap input).
As a mini-mill operator using electric arc furnace technology, Gerdau's principal input is steel scrap, which accounted for approximately 19% of cost of goods sold of Gerdau S.A. during 2001. Although international steel scrap prices are determined in the U.S. domestic market (as the United States is the principal exporter of scrap), the price of steel scrap in Brazil varies region by region, depending upon regional supply, demand and transportation costs. Gerdau is the largest consumer of steel scrap in Brazil, and in some markets, Gerdau consumes the vast majority of steel scrap supply. However, with over 4,500 scrap suppliers in Brazil, no single steel scrap supplier has provided more than 2.0% of total requirements of Gerdau S.A.
Scrap
There are two broad classifications of steel scrap: obsolescence scrap (ranging from tin drinking cans to car bodies to white goods) and industrial scrap (factory stampings, steel turnings, etc.). Obsolescence scrap, on average, accounts for approximately 65% of Gerdau S.A.'s steel scrap purchases, and is acquired through steel scrap dealers. Industrial scrap, which on average accounts for approximately 35% of Gerdau S.A.'s steel scrap purchases, is purchased directly from the industrial centers generating the scrap. Industrial steel scrap is also generated by the Company's own production processes. Steel scrap remains readily available in the Brazilian market, both from obsolescence scrap and industrial scrap.
The largest portion of the steel scrap consumed by the Company is bought in the State of São Paulo, the balance being evenly distributed among the other areas in which the Company's mills are located. Obsolescence scrap is usually

22 - 22 --1
delivered to the steel mill by a scrap dealer. In regions where it does not have a steel mill, the Company has scrap collection centers, where scrap is collected and compacted for transport by third parties (by rail or road) to the nearest mill.
The price of scrap in Brazil varies by region, depending upon regional supply and demand and transportation costs. Each month, based on market conditions, the Company's purchasing Director sets the maximum price for scrap (by category of scrap and region) to be paid by Company representatives. Due to a greater level of competition among scrap purchasers and despite a greater supply of scrap in the heavily industrialized Southeast region of Brazil (including the States of São Paulo and Rio de Janeiro), prices there tend to be higher than in other regions. However, because the Company's facilities are evenly distributed throughout Brazil, the Company is able to take advantage of lower prices in the other regions without incurring high transportation costs.
Pig Iron and Sponge Iron
Brazil is a net exporter of pig iron. The majority of Brazilian pig iron is produced in the State of Minas Gerais by a relatively large number of small producers. Pig iron is a substitute for scrap. In Brazil, the price of pig iron is related to the cost of charcoal, an important and the most volatile cost in the production of pig iron. When the price of charcoal is seasonally high, coke can be used as a substitute which, although more expensive, provides a higher yield in pig iron production. Iron ore, the main component of pig iron, is widely available in Brazil. Brazil is among the world's leading producers and exporters of iron ore. The Company purchases its iron ore from several different regional suppliers.
The Company's sponge iron production unit is its USIBA (Simões Filho) DRI plant. The Company consumes all of its pig iron and sponge iron production in its own meltshops. Approximately 30% of Gerdau S.A.'s pig iron requirements are bought from third parties. In purchasing, the Company seeks to preserve the flexibility resulting from a large number of suppliers in order to avoid becoming overly dependent upon a small number of large suppliers.
Other Inputs
Brazil is an exporter of the alloys used in the Company's steel mills and all such materials are purchased in Brazil. Other significant inputs (electrodes, furnace refracting materials, oxygen, nitrogen and other industrial gases and limestone) are readily available in Brazil. Additional inputs associated with the production of pig iron and DRI at the Company's steel mills are charcoal (at Barão de Cocais, Divinópolis and Contagem) and natural gas at USIBA (Simões Filho).
The cost of the basket of additional materials used in the steel refining process accounts for approximately 10% of the total production cost of a metric ton of crude steel. Therefore, the final prices of the Company's products are relatively insensitive to changes in the price of these materials. Furthermore, these materials are widely available in the Brazilian market.
Energy
The production of steel is an energy intensive process and electric energy costs constitute a significant portion of the steel production costs per metric ton, accounting for approximately 9% of the total cost of goods sold in 2001.
Gerdau produces crude steel through three different process: (i) based on scrap and electric furnaces (70% of the Brazilian process); (ii) based on iron ore and blast furnaces (20% of the Brazilian production); and (iii) based on the DRI process, which uses natural gas to reduce iron ore and an electric arc furnace to produce crude steel.
The purchase of electrical energy and natural gas is made through long term supply agreements between each producing unit and the authorized public utility company of its region. Demand and consumption are agreed upon by the parties annually. The Brazilian Federal Government, through ANEEL (National Electric Power Agency), establishes the prices which each public utility company may charge its customers, and varies according to each consumer class. The consumers are classified according to their use (commercial, industrial, residential) and level of demand (tension and volume). After the enactment of Law 9,074 of July 7, 1995, consumers with demands higher than 3,000 KW (kilowatts) and tensions higher than 69 KV (kilovolt) may buy electrical energy from concessionaires of other regions.
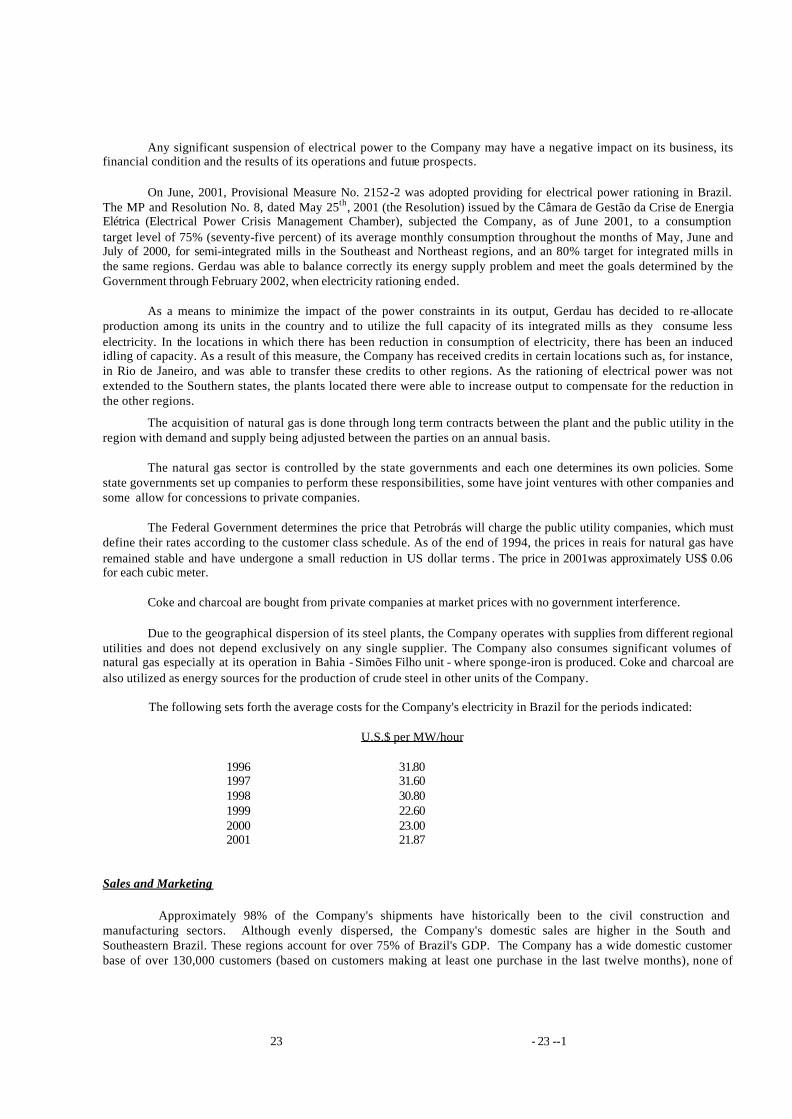
23 - 23 --1
Any significant suspension of electrical power to the Company may have a negative impact on its business, its financial condition and the results of its operations and future prospects.
On June, 2001, Provisional Measure No. 2152-2 was adopted providing for electrical power rationing in Brazil. The MP and Resolution No. 8, dated May 25th, 2001 (the Resolution) issued by the Câmara de Gestão da Crise de Energia Elétrica (Electrical Power Crisis Management Chamber), subjected the Company, as of June 2001, to a consumption target level of 75% (seventy-five percent) of its average monthly consumption throughout the months of May, June and July of 2000, for semi-integrated mills in the Southeast and Northeast regions, and an 80% target for integrated mills in the same regions. Gerdau was able to balance correctly its energy supply problem and meet the goals determined by the Government through February 2002, when electricity rationing ended.
As a means to minimize the impact of the power constraints in its output, Gerdau has decided to re-allocate production among its units in the country and to utilize the full capacity of its integrated mills as they consume less electricity. In the locations in which there has been reduction in consumption of electricity, there has been an induced idling of capacity. As a result of this measure, the Company has received credits in certain locations such as, for instance, in Rio de Janeiro, and was able to transfer these credits to other regions. As the rationing of electrical power was not extended to the Southern states, the plants located there were able to increase output to compensate for the reduction in the other regions.
The acquisition of natural gas is done through long term contracts between the plant and the public utility in the region with demand and supply being adjusted between the parties on an annual basis.
The natural gas sector is controlled by the state governments and each one determines its own policies. Some state governments set up companies to perform these responsibilities, some have joint ventures with other companies and some allow for concessions to private companies.
The Federal Government determines the price that Petrobrás will charge the public utility companies, which must define their rates according to the customer class schedule. As of the end of 1994, the prices in reais for natural gas have remained stable and have undergone a small reduction in US dollar terms . The price in 2001was approximately US$ 0.06 for each cubic meter.
Coke and charcoal are bought from private companies at market prices with no government interference.
Due to the geographical dispersion of its steel plants, the Company operates with supplies from different regional utilities and does not depend exclusively on any single supplier. The Company also consumes significant volumes of natural gas especially at its operation in Bahia - Simões Filho unit - where sponge-iron is produced. Coke and charcoal are also utilized as energy sources for the production of crude steel in other units of the Company. The following sets forth the average costs for the Company's electricity in Brazil for the periods indicated:
U.S.$ per MW/hour
1996 31.80 1997 31.60 1998 30.80 1999 22.60 2000 23.00 2001 21.87
Sales and Marketing
Approximately 98% of the Company's shipments have historically been to the civil construction and manufacturing sectors. Although evenly dispersed, the Company's domestic sales are higher in the South and Southeastern Brazil. These regions account for over 75% of Brazil's GDP. The Company has a wide domestic customer base of over 130,000 customers (based on customers making at least one purchase in the last twelve months), none of

24 - 24 --1
which account for more than 2% of the Company's total sales in Brazil and the top ten domestic customers represented less than 10% of Gerdau's domestic steel sales.
The geographic distribution of the Company's sales has remained relatively constant. Generally, the geographic diversity of the Company's production facilities has supported the diversification of its sales distribution. Consistent with the Company's strategy of increasing profitability within Brazil through increased profit margins, the Company has been shifting its sales focus to higher value-added products, such as drawn products and specialty long steel products.
The following table, sets forth, for the periods indicated, the Company's annual sales of crude steel, long rolled, drawn steel products and specialty steel products as measured by weight :
Sales Distribution by Product Line (in tons):
1997 1998 1999 2000 2001 TOTAL 3,657,941 3,810,808 4,566,418 6,487,784 6,427,755 SEMI FINISHED 117,075 119,764 109,694 246,575 180,625
Domestic market 37,299 41,579 29,093 53,503 54,393Exports 79,776 78,185 80,601 193,072 126,232
COMMON LONG PRODUCTS 2,488,512 2,594,771 3,211 ,347 4,781,327 4,824,743
Domestic market 1,662,931 1,727,384 1,740,771 1,884,212 1,887,877Exports 86,745 102,212 294,097 321,859 304,142Abroad 738,836 765,175 1,176,479 2,575,256 2,632,724
SPECIALTY STEEL PRODUCTS 172,272 168,280 212,845 263,845 259,927
Domestic market 150,889 157,531 208,843 250,498 254,918Exports 21,383 10,749 4,002 13,347 5,009
DRAWN PRODUCTS 651,907 648,515 660,953 706,356 713,324
Domestic market 631,987 631,378 651,540 693,939 701,789Exports 19,920 17,137 9,413 12,416 11,535
FLAT PRODUCTS (RESALE) 228,175 279,478 371,579 489,681 449,136
Domestic market 228,175 279,478 371,579 489,681 449,136 Domestic.
The Company's sales and marketing efforts in Brazil are organized into the following Business Units: (1) Civil construction, (2) Manufacturing, (3) Agricultural products, (4) Nails, (5) Metallurgical products (chains, wires, staples and others), (6) Specialty steels, (7) Exports, (8) Retail and (9) Forestry. The "Business Units" are responsible for the sales and marketing of the Company's products. The Business Units are organized along product lines rather than regional or geographic divisions in order to provide a specialized and knowledgeable sales and marketing effort for each market segment and to enhance the responsibilities of the Company to each such market segment.
Each Business Unit has national coverage with a centralized sales policy and localized execution. Business Units with the most sales to a particular customer are allocated responsibility for Company relations with that customer. On average, approximately 65% of sales in Brazil are made through Company employees (including Comercial Gerdau employees) and the balance through authorized representatives selling on a commission basis. The Company provides these representatives with product catalogs and other sales material, computer terminals linked to Gerdau's information system and fax and telephone equipment. Representatives cover the Brazilian countryside where customer orders are, on average, smaller. Including Comercial Gerdau's 70 sales outlets, the Company has approximately 200 points of sale in Brazil.
The Company's sales approach is to develop a close partnership with the client. As a result of its strong customer orientation, Gerdau has proactively developed products to suit client needs, established a brand image, and achieved very high standards for its products.

25 - 25 --1
The Company's wide base of customers provides the Company with an extensive database as to trends in the market and the ability to support price levels in the market, which provides it with a competitive advantage relative to its domestic competitors and imports.
Domestic sales have an average order period of eight days, and Gerdau arranges the delivery of goods directly to its customers in order to minimize delays. Sales trends in both the domestic and export markets are forecast monthly based on the past three months' historical data. Gerdau employs its own extensive data systems to remain informed of market developments so that it can respond swiftly to fluctuations. Gerdau considers its flexibility to shift between markets and the ability to monitor and adapt to changes in market demand, thereby keeping inventory levels at a minimum, as the keys to success.
Export and Foreign Operations Marketing
Export marketing activities are coordinated by the Business Unit responsible for selling the Company's exportable products and are conducted (i) primarily on FOB (Free on Board) basis, (ii) at sight against letters of credit opened by customers in more than 30 countries throughout the world and (iii) directly to clients in neighboring countries and otherwise indirectly through trading companies.
Despite of dealing primarily in commodity products such as rebars, Gerdau is very conscious of the importance of quality control. In order to ensure the satisfaction of end-users around the world with products purchased indirectly from Gerdau, the Company from time to time sends technicians to check directly the quality of products shipped to clients.
Foreign operations are primarily devoted to supplying the respective domestic markets of the countries in which they are located, with the exception of the Canadian operations, which sell almost 50% of their production in the United States. The Canadian operations market their products in the United States through direct sales to customers which are invoiced on the same terms as Canadian customers but in U.S. dollars.
Retail
Comercial Gerdau is the Company's retail arm in Brazil. It sells a full range of steel products, not only those made by the Company. The Company is able to use the sales information generated by Comercial Gerdau as a market barometer by which to formulate production and marketing strategies. Sales of products of producers unaffiliated with the Company accounted for approximately half of Comercial Gerdau's 2001 physical sales and 7.4% of the Company's total sales. Gerdau believes the extensive information available to its sales force concerning its customers along with its strategy of forming strong customer relationships to be its main competitive advantage in the sale and marketing of its products.
Terms of Sale
The Company's usual terms of sale are 21 days for domestic sales, which are made CIF (Cost Insurance and Freight). Domestic customers making purchases of more than the equivalent of U.S.$ 10,774 per month are subject to a centralized credit approval process. As a consequence of these policies, the Company's bad debt write-offs (which are made after 12 months) are an insignificant percentage of Gerdau's consolidated accounts receivable.
All Gerdau companies (Brazil and abroad) accept both immediate and deferred payment for purchase of their products, the latter in accordance with ordinary commercial terms used in each region, determined seasonally. Presently, the majority of the sales are made with a maximum sales term of 30 days.
Facilities
Gerdau S.A. (the parent company) operates nine steel mills and four other industrial plants (two drawing mills, one welded wire mesh factory and a pig iron plant) installed in Brazil and on a scale established as a result of the regional markets in which they operate.

26 - 26 --1
In the Southeast region of Brazil, the largest market in the country, the Company operates Gerdau Cosigua (melt shop, rolling mills, drawing mills and nail factory) in the State of Rio de Janeiro; Gerdau Barão de Cocais, Gerdau Divinópolis, with melt shops and rolling mills, and Gerdau Contagem (production of pig iron) in the State of Minas Gerais; and two drawing mills and a factory for welded wire meshes and strands in the State of São Paulo.
In the South region, the second largest market in Brazil, the Company has three mills: Gerdau Riograndense (melt shop, rolling mills, drawing mills and nail factory) and Gerdau Aços Finos Piratini (melt shop and rolling mills for manufacture of specialty steels) in the State of Rio Grande do Sul, and Gerdau Guaíra (melt shop and rolling mill) in the State of Paraná.
The Northeast region is supplied by three other units, Gerdau Açonorte (melt shop, rolling mills, drawing mills and nail factory) in the State of Pernambuco; Gerdau Usiba (melt shop, rolling mill and drawing mill) in the State of Bahia; and Gerdau Cearense (melt shop and rolling mill) in the State of Ceará.
The largest of the Company's operating units is Gerdau Cosigua, located in the Southeast State of Rio de Janeiro. It has an installed production capacity of 1,404,000 tons of crude steel per annum (see Item 4.D for location, installed capacity and type of facility of each Company unit).
In addition, as of December 2001, Gerdau had a participation of 37.90% in the capital of Açominas, a Brazilian producer of semi-finished products located in the Southeast state of Minas Gerais. Açominas has an installed production capacity of 3.0 million tons of crude steel per annum.
Competition
Shipping, freight and port loading costs are a major barrier to imports and, since the Company operates primarily in the ordinary long rolled product business where the profit margins are relatively small, the incentive for foreign competitors to enter the Brazilian market is low. In the domestic market, no single company competes against the Company across all its product range. The Company's diversification and decentralization of its business gives it, Gerdau believes, a competitive edge over its major competitors, who have more centralized operations.
In the domestic market, the largest producers of long rolled steel (the sector in which Gerdau competes) are as follows:
Company Production (1,000 metric tons) % of total Gerdau S.A. 3,301.4 44.5 Belgo Mineira 2,632.1 35.4 V&M do Brasil 445.0 6.0 Villares 397.1 5.4 Barra Mansa 351.5 4.7 Other 297.9 4.0 Total 7,425.0 100.0
Source: IBS/Gerdau
Gerdau S.A. (the parent company) has its industrial units located in the main consuming regions of the country, while its competitors have their mills concentrated mainly in the Southeast region. As the following table shows, Gerdau has more than 80% of its sales in the most developed regions as indicated below:
Gerdau S.A. - Regional Sales Distribution (% of sales in the domestic market)
1996 1997 1998 1999 2000 2001 South 22.3 26.2 25.5 20.9 25.3 26.4 Southeast 53.1 51.9 49.7 52.2 51.2 49.3 Northeast 13.8 13.2 15.6 15.7 14.1 14.9 Midwest 7.7 5.5 6,0 7.9 4.9 5.3 North 3.1 3.2 3.2 3.3 4.5 4.1

27 - 27 --1
Belgo Mineira Group is the second largest producer in the Brazilian market and has its production facilities concentrated in the Southeast region. Belgo Mineira was originally an integrated steel company but today it also has mini-mills plants. Gerdau is essentially a mini-mill-based company, with plants located near steel scrap supply, port facilities, and the markets they serve, thereby incurring low freight costs.
The Mercosul tariff and non-tariff protection for the countries that have subscribed to the Treaty of Asunción (signed on March 26, 1991 by Argentina, Brazil, Uruguay and Paraguay) is in place. Import duties have therefore been phased out in the steel segment. Gerdau does not expect the elimination of trade tariffs to adversely affect its operations or financial results. The competitive advantages of Brazilian steel producers are based primarily upon costs and abundant supply of labor, energy and raw materials. Gerdau believes that its average production cost at its facilities in Brazil is competitive with costs of other producers in Brazil and worldwide.
In 2001, Gerdau was the 4th largest Brazilian crude steel producer (operations in the country). The ten largest Brazilian crude steel producers were:
Company Tonnage (1,000 tons)
% of total
CST 4,784 17.9 Usiminas 4,620 17.3 CSN 4,048 15,2 GERDAU 3,470 13.0 Belgo Mineira 2,668 10.0 Cosipa 2,460 9.2 Açominas 2,355 8.8 Acesita 786 2.9 Villares 601 2.3 V&M do Brasil 500 1.9 Other 426 1.5 Total 26,718 100.0 Source: IBS
In 2001, the largest Brazilian producers of rolled steel were: Flat Products Long Products 1,000 tons % of total 1,000 tons % of total Usiminas 3,901 36.6 - - CSN 3,754 35.3 - - GERDAU - - 3,318 44.7 Belgo Mineira - - 2,632 35.4 Cosipa 2,436 22.9 - - Acesita 556 5.2 - - V&M do Brasil 445 6.0 Villares - - 397 5.4 Barra Mansa - - 352 4.7 Other - - 281 3.8 Total 10.647 100.0 7,425 100.0 Source: IBS
Environmental Standards
The Gerdau Group produces steel with the strong commitment to protect the atmosphere, the waters, the la nd and the green areas in which it has a presence. It invests in acoustic protection and in the development of an environmental awareness in the community. Its eco-efficiency practices are comparable to the best in the world and utilize the shared management method with its employees involved in environmental education programs.

28 - 28 --1
The performance of the units is tracked and evaluated by an Environmental Management System. This allows for the management of outcomes and to reach new levels of sustainability.
In the last five years Gerdau has invested US$ 100 million in updating its environmental preservation technologies. In 2001, investments totaled US$ 15 million.
Gerdau's mills are equipped with high efficiency solid particle and gas air filtering systems.
Industrial waters are treated and re-circulated within closed circuit systems all inside the perimeter of the plants. At present, the re-circulation rate efficiency reaches the mark of 95%. This level of efficiency meets stringent water protection standards. Part of the 5% remaining water evaporates during the manufacturing process whereas the volume that is returned to the rivers meets all quality requirements as determined by specific regulations. In many cases, the quality surpasses that of the water collected.
Largest steel scrap recycler in Latin America and one of the largest in the world, Gerdau companies re-utilize 5.3 million metric tons of scrap per year. They transform this input into new steel products to be used by the civil construction, industrial, autoparts and agricultural sectors.
The Company has rigorous management and control systems for steel scrap. This reduces the amount of residues in the electric furnaces and improves thermal efficiency. It also has radioactivity detectors to avoid contamination of the productive process by radioactive scrap.
All the industrial residues are controlled and managed at the source such as reduction, recycling, reutilization and storage. Historically, the Gerdau Group conducts scientific research in partnerships with universities in order to better develop uses for scrap, slag and meltshop dust for other productive processes. These by-products replace with great advantage other natural raw materials and reduce the environmental impact resulting from the extraction of these inputs from nature.
Slag from the melt shop is being widely utilized in the pavement of highways as a substitute for soil and lintstone. Scale, for instance, is an important element in the production of cement. This year new research has been started to find ways to mix dust with clay for the ceramic industry.
Environmental Improvements:
1. The main investments in environment were made at mills in Brazil, Chile, Canada and the United States.
2. Three new dust collecting systems increased the level of environmental protection at the mills located in Charlotte, Barão de Cocais and Divinópolis. At Gerdau MRM Steel, improvements were made in the dust collecting system. In Uruguay, at Gerdau Laisa, new equipment will begin operating in 2003.
3. For the protection of water supplies, the Company has installed water collection and treatment units at Riograndense, enhanced the existing unit at Cosigua and upgraded the re-circulation system at Gerdau Aza, in Chile.
4. New landfill areas with control of soil conditions have enhanced the care at Cosigua and Guaíra. Guaíra has concluded a noise reduction program at its rolling mill. At Charlotte, new lower levels of noise have been attained at the scrap yard.
Green Areas
This fiscal year, Gerdau inaugurated a 3,800 seedling native species forest at Cosigua, located in Rio de Janeiro, as homage to Curt Johannpeter, who commanded a decisive phase of the expansion of the Gerdau Group business. In Canada, Gerdau MRM Steel planted 1.8 thousand seedlings of local species such as Colorado Blue Spruces and Willows.
Gerdau Laisa plant has enlarged its green belt, adding five hectares.
29 - 29 --1
Environmental control
Environmental control in Brazil is a regional rather than national matter, and different environmental standards are imposed by the different state authorities. Gerdau seeks to work with the relevant environmental authorities to achieve compliance with all applicable standards at a reasonable cost and in a reasonable timeframe. The Company's overseas subsidiaries were in substantial compliance with applicable environmental regulations upon their acquisition and continue to operate in accordance with applicable standards.
Gerdau believes that each of its facilities is in substantial compliance with the environmental regulations applicable to it.
Maintenance and Technology
Due to the severe operating conditions in steel mills, regular maintenance of equipment is a significant ongoing expense comprising approximately 8% of the Company's cost of goods sold for the year ended December 31, 2001. The Company employs specialized maintenance teams, each with responsibility for a particular area of production.
As is usual for mini-mill steel makers, the Company does not have any formal research and development program, since steel-making technology is readily available for purchase. However, the Company is continuously implementing improvements and technological developments. Over the past years, the Company has introduced modern technologies in its mini-mills, such as high power transformers, water-cooled side-walls and roofs, oxygen lance manipulators, slag foaming and ladle furnaces. In its rolling mills, the Company has introduced automatic furnace control continuous rolling mills, high speed finishing blocks, tempcore and thermex heat treatment, stelmor wire rod processing, automatic typing machines and slit rolling. Most sophisticated production equipment used by the Company is supplied by international machinery builders and steel technology companies. Such suppliers generally enter into technology transfer agreements with the purchaser and provide extensive technical support and staff training in connection with the installation and commissioning of the equipment. Gerdau has entered into technology transfer agreements with Nippon Steel, Sumitomo Steel, Thyssen, Daido Steel and BSW.
Employees
The Company's labor costs vary in accordance with each region within Brazil. The Company believes its wages are competitive within the regional markets in which each facility is located. Personnel wage expenses (direct labor cost) accounted for approximately 14% of the total cost of goods sold.
As of December 31, 2001, the Company had 12,405 employees (this number does not include Açominas and Sipar), comprising 8,631 engaged in Brazil, and 3,774 abroad.
As unions in Brazil are organized on a regional rather than a national basis, the Company has no nationally applicable agreements with its workers. Gerdau believes that its employee pay and benefit structure is comparable to general market rates. Gerdau also provides its employees with fringe benefits such as health and childcare.
Gerdau seeks to maintain good working conditions in Company plants and as a consequence has what it believes is a comparatively low employee turnover rate. Due to the high value it places on employee training, the Company attempts to manage any necessary production curtailments through the timing of vacations, rather than workforce reductions.
The Company has not in the past experienced strikes and believes that it generally has good relations with its employees. The Company has not lost a day's production due to labor disputes in the last 40 years. The Company is, however, a party to litigation initiated by current or former employees involving dis putes over employee benefits. See "Item 8 – Financial Information - Legal Proceedings".
C. ORGANIZATIONAL STRUCTURE

30 - 30 --1
Gerdau S.A. is a producer of long common and specialty steel products through its industrial units located in Brazil and its subsidiaries in Uruguay, Chile, Canada, Argentina and in the United States, with installed production capacity of 7.3 million tons of crude steel (not including Açominas or Cartersville), 7.0 million tons of rolled product (not including Açominas, Cartersville and Sipar) and 0.9 million tons of drawn products. The Company produces steel based on the mini-mill concept, whereby steel is produced in electric arc furnaces, starting with scrap and pig iron acquired mainly in the region where each mill operates (the so-called mini-mill concept). Gerdau also operates plants capable of producing steel starting with iron ore in blast furnaces and through the direct reduction process. Gerdau's products are manufactured with a wide range of specifications, intended to satisfy a la rge spectrum of consuming groups.
The three principal markets in which the Company operates are the civil construction, manufacturing and agricultural and breeding sectors. Last year, the first two represented approximately 98% of the total sales volume of the Company measured in tons. In 2001, Gerdau produced 6.1 million tons of crude steel, of which 3.5 million (not including Açominas’ production) were produced in Brazil (13.0% of national production) and 2.6 million tons through its subsidiaries abroad. In the segment of long rolled steel, Gerdau is the largest Brazilian producer, with approximately 44.5% of total production.
The following chart shows the corporate structure of the principal companies of Gerdau as of December 31, 2001: Shareholding Structure – Main Companies (Direct and indirect % of participation) The following table shows the main companies and investments held directly or indirectly by Gerdau S.A. as of December 31, 2001: Company Country Participation (%) Gerdau Laisa S.A. ("Laisa") Uruguay 99 Gerdau Aza S.A. ("Aza") Chile 99 Gerdau Courtice Steel Inc. ("Courtice") Canada 100 Gerdau MRM Steel Inc. ("MRM") Canada 100 Seiva S.A. Florestas e Indústrias ("Seiva") Brazil 96 Armafer Serviços de Construção Ltda. ("Armafer") Brazil 100
MET. GERDAU S.A.
51
GERDAU S.A.
Gerdau Internacional
Armafer
Seiva
96100
Açominas
38 100
Laisa Courtice 100
100
38
72
100
100
85
Aza
Sipsa
Sipar
MRM
AmeriSteel
GTL
100

31 - 31 --1
Aços Minas Gerais S.A. - Açominas ("Açominas") Brazil 38 Sociedad Industrial Puntana S.A. - Sipsa ("Sipsa") Argentina 72 Sipar Laminacion de Aceros ("Sipar") Argentina 38 Ameristeel Corp (“Ameristeel”) USA 85 Gerdau GTL Spain S.L. (“GTL”) Spain 100 D. PROPERTY, PLANTS AND EQUIPMENT
The principal properties of Gerdau consist of installations for the production of steel, rolled products and drawn products. The following is a list identifying the location, capacity and type of installation, as well as the types of products manufactured:
Notes: (1) An "EAF" or electric arc furnace mini-mill produces crude steel using scrap steel and pig iron as its principal raw materials; (2) A "blast furnace" or "DRI" mill is, in addition, able to produce pig iron or sponge iron to be used in its crude steel production using iron ore and charcoal or natural gas as its main raw materials
Capacity (Thousands of tonnes per annum)
Pig Iron Sponge Iron
Crude Steel
Rolled Steel
Drawn Steel
Type of Facility
TOTAL GERDAU 1.356 7.304 6.979 897
BRAZIL 1.356 4.174 3.971 897 GERDAU S.A. 1.356 4.174 3.971 897
Barão de Cocais - MG 330 330 198 - Blast furnace / LD converter / Rolling mill Charqueadas - RS - 310 380 - EAF minimill / Rolling mill Curitiba - PR - 390 167 - EAF minimill/Rolling mill Divinopolis - MG 336 500 456 - Blast furnace / EOF converter / Rolling mill Maracanaú - CE - 120 120 - EAF minimill / Rolling mill Recife - PE - 230 270 91 EAF minimill / Rolling mil / Drawing mill / Nails clamps factory Rio de Janeiro - RJ - 1.404 1.510 284 EAF minimill / Rolling mill / Drawing mill / Nails clamps factory Sapucaia do Sul - RS - 390 470 172 EAF minimill / Rolling mill / Drawing mill / Nails clamps factory Simões Filho - BA 450 500 400 25 DRI plant / EAF minimill / Rolling mill / Drawing mill Contagem 240 - - - Blast furnace Cotia - SP - - - 72 Drawing mill Cumbica -SP - - - 130 Wire meshes factory São J. dos Campos -SP - - - 123 Drawing mill
ABROAD - 3.130 3.008 - AZA - 360 440 -
Santiago – Renca/Colina (Chile) - 360 440 - EAF minimill / Rolling mill LAISA - 70 72 -
Montevideo (Uruguay) - 70 72 - EAF minimill / Rolling mill COURTICE - 305 280 -
Cambridge (Canada) - 305 280 - EAF minimill / Rolling mill MRM - 355 300 -
Selkirk (Canada) - 355 300 - EAF minimill / Rolling mill SIPSA - - 75 -
Villa Mercedez (Argentina) - - 75 - Rolling mill AMERISTEEL - 2.040 1.841 -
Charlotte-NC (USA) - 435 363 - EAF minimill / Rolling mill Jackson-TN (USA) - 635 499 - EAF minimill / Rolling mill Jacksonville-FL (USA) - 562 544 - EAF minimill / Rolling mill Knoxville-TN (USA) - 408 435 - EAF minimill / Rolling mill

32 - 32 --1
ITEM 5. OPERATING AND FINANCIAL REVIEW AND PROSPECTS
A. OPERATING RESULTS
Brazilian Economic Environment .
Gerdau’s results and its financial condition are dependent on Brazil’s general economic condition and particularly on (i) economic growth and its impact on steel demand, (ii) financing costs and the availability of financing, and (iii) exchange rates between Brazilian and foreign currencies.
For many years, Brazil experienced high rates of inflation the effect of which was a progressive decline in purchasing power for the vast majority of the Brazilian population. During periods of high inflation, effective salaries and wages tend to fall because the frequency and size of salary and wage adjustments for inflation usually do not offset the actual rate of inflation. Since the introduction of the real in July 1994, the rate of inflation in Brazil has decreased dramatically (see table below). In addition, there has been economic growth after the implementation of the Real Plan, with GDP in Brazil increasing by 2.9% in 1996, 3.9% in 1997, 0.2% in 1998, 0.8% in 1999, 4.5% in 2000 and 1.5% in 2001 (based on preliminary data).
Under Brazilian GAAP and corporate law, the UFIR (Fiscal Reference Unit) was used as the index in high inflation times for inflation adjustment in the preparation of financial statements for periods through December 31, 1995. However, Federal Law 9,249, enacted on December 26, 1995, abolished the prior Brazilian price-level restatement system effective January 1, 1996 for corporate law purposes and for reporting public companies, although the CVM allows companies to prepare financial statements in accordance with the constant currency method and any general price index may be used for such restatement.
The following table sets forth Brazilian inflation and the devaluation of Brazilian currency against the U.S. dollar for the periods shown. For a discussion on the decision of the Central Bank, in January, 1999, to allow the real to float freely in the foreign exchange markets and its subsequent devaluation, see “Item 10.D. Exchange Controls – Exchange Rates.”
January to April Year ended December 31, 2002 2001 2000 1999 Inflation (INPC base) 2.71% 9.44% 5.27% 8.43% Inflation (IGP-M) 1.07% 10.37% 9.96% 20.10% Devaluation (R$ vs. U.S.$) 1.81% 18.67% 9.30% 48.36%
The devaluation of the Brazilian currency in 2001 was a consequence of the interaction of a few key variables. Noteworthy are the impact of the imbalances of the economy of Brazil's largest trading partner Argentina along with incidents such as the terroris t attack in September in the United States which made some international investors look for more secure markets.
The impact of devaluation on Gerdau's business is essentially the possibility of further reducing revenues due to a slowdown of the Brazilian economy as a result of an increase in domestic interest rates. However, it is important to note that Gerdau S.A. has almost 40% of its operations abroad, which provides it with a natural protection. This ensures some counter balancing effect that minimizes the impact of any devaluation of the real on the operational side and that of the U.S. dollar-based portion of the Gerdau S.A.'s indebtedness.
Effects on Demand.
During the high inflation period there was a gap in frequency as well as in readjustment indices between price increases and corresponding salary raises, which eroded purchasing power. This gap was significantly reduced by the recent low inflation indices and increased consumer demand.

33 - 33 --1
The recent devaluation of the Brazilian currency has had a significant impact on the economy. Nonetheless, the expected negative impact – i.e., higher inflation, negative GDP – was not as severe as anticipated. In fact, the recovery process was significantly faster than it was thought possible. This, however, is no guarantee of future performance of the country’s economy.
Seasonal Variation
The Company’s sales are not subject to meaningful seasonal variation. Its performance is more dependent on the development in the segments that compose the Brazilian Gross Domestic Product (“PIB”). The table below shows the quarterly sales volumes for the principal consuming segments of the Company’s products in the last three years:
Sales Volume per Market Segment – Gerdau S.A. non-consolidated (1,000 tons):
2001 2000 1999 Civil Civil Civil
Quarter Construction Manufacturing Other Construction Manufacturing Other Construction Manufacturing Other First 451.9 509.2 28.0 429.3 450.4 28.8 442.8 351.1 24.1 Second 464.5 492.9 28.7 436.3 461.8 27.1 436.0 370.8 21.8 Third 459.4 457.2 22.3 470.3 552.7 28.6 482.7 403.0 25.9 Fourth 396.0 471.5 24.2 463.4 553.1 26.7 428.6 389.5 27.6 Total 1,771.8 1,930.8 103.3 1,799.4 2,018.0 111.1 1,790.0 1,514.4 99.4 Results of Operations
The table below contains information expressed in percentage of different lines per net sales revenue, under U.S. .GAAP, for the following years:
Fiscal year ending December 31, 2001 2000 1999
Net Sales Revenue 100.0% 100.0% 100.0% Cost of Goods Sold (70.7%) (73.4%) (64.0%) Gross Profit 29.3% 26.6% 36.0% Sales Expenses (4.6%) (4.2%) (5.0%) General and Administrative Expenses (7.8%) (7.9%) (9.2%) Operating Profit 16.9% 14.4% 21.8% Net Income 7.2% 7.0% 11.5%
The table below contains information about revenues and expenses, under U.S. GAAP, per market segment for the following years:
Fiscal Year Ended on December 31, Percentage Variation 2001 2000 1999 2001-2000 2000-1999
Net Sales Revenue Civil Construction 1,098,908 1,270,101 839,326 (13.5%) 51.3% Manufacturing 1,029,975 1,163,835 663,613 (11.5%) 75.4% Other 191,646 242,778 218,049 (21.1%) 11.3%
Total 2,320,530 2,676,714 1,720,988 (13.3%) 55.5% Cost of Goods Sold
Civil Construction (793,832) (932,085) (521,940) (14.8%) 78.6% Manufacturing (730,039) (854,101) (487,467) (14.5%) 75.2% Other (117,749) (178,167) (91,964) (33.9%) 93.7%
Total (1,641,620) (1,964,353) (1,101,371) 16.4% 78.4% Gross Profit
Civil Construction 305,077 338,015 317,386 (9.7%) 6.5% Manufacturing 299,936 309,735 176,146 (3.2%) 75.8% Other 73,897 64,611 126,085 14.4% (48.8%)
Total 678,910 712,361 619,617 (4.7%) 15.0% Operating Profit

34 - 34 --1
Civil Construction 160,380 183,642 183,304 (12.7%) 0.2% Manufacturing 179,920 168,278 144,930 6.9% 16.1% Other 51,701 35,103 47,621 47,3% (26.3%)
Total 392,001 387,023 375,855 1.3% 3.0% Financial Income 55,002 57,324 64,166 (4.0%) (10.7%) Financial Expense (238,269) (243,477) (222,414) (2.1%) 9.5% Total 167,353 188,558 197,692 (11.2%) (4.6%)
The following table shows cost accounting for goods sold during 2001, 2000 and 1999 expressed in percentage
of net sales revenue (all under US GAAP):
Breakdown of Costs of Goods Sold 2001 2000 1999
Raw materials 51% 53% 53% Direct labor costs 14% 13% 14%
Total direct costs 65% 66% 67% Indirect labor costs 5% 5% 3% Third party services 7% 7% 11% Depreciation 9% 9% 6% Power and electricity 9% 8% 8% Other 5% 4% 5%
Total indirect costs 35% 33% 33% Total costs 100% 100% 100%
Fiscal year ended December 31, 2001 compared to fiscal year ended December 31, 2000
Net Sales Revenue
The consolidated net revenue of US$ 2.3 billion decreased 13.3 % mainly due to the devaluation of the real and to lower prices in the United States. Roughly 60% of net revenue comes from Brazilian operations, and the real devalued 18.7% during the year. The average net price in the United States was U.S.$ 375/ton down from U.S.$ 388/ton. Physical sales reached 6.4 million tons in line with the previous year.
Cost of Sales and Gross Profits
Cost of sales decreased 16.4% reaching US$ 1.6 billion. This reduction is explained by the devaluation of the Brazilian currency and by gains in productivity that were achieved due to technological updating and the reallocation of production among the several plants in Brazil. Especially due to these gains, gross margin went up to 29.3% from 26.6%. Gross profit totaled U.S.$ 678.9 million, a 4.7% decrease when compared to 2000.
Operating Income
Operating income of U.S.$ 392.0 million was slightly lower than last year. The reduction in operating expenses was enough to compensate the reduction in gross profit. Moreover, operating margin went to 16.9%, up from 14.5%.
Financial Expenses and Financial Revenue
Net financial expenses decreased 1.6% reaching U.S.$ 183.3 million. This decrease can be explained by the higher amount of exchange losses accounted for in the period (U.S.$ 50.3 million in 2000 versus U.S.$ 71.8 million in 2001). The stronger devaluation of the real was the main reason for the increase in exchange losses. The exchange losses would have been higher if the Company had not taken protection through use of swap contracts in the amount of U.S.$ 325 million of its debt exposure during 2001.

35 - 35 --1
Equity Pickup
Equity pickup reached U.S.$ 18.3 million in 2001, down from U.S.$ 34.0 million in 2000. The reduction occurred due to the lower results obtained by Açominas as a consequence of the 40-day shut-down of the blast furnace for refurbishment and technological updating.
Provision for Income Tax
In 2001, the provision for income tax of U.S.$ 54.6 million exceeded by U.S.$ 9 million the provision in the previous year due to better results of the Brazilian operations.
Net Income
Net income of U.S.$ 167.3 million decreased 11.2% in 2001 compared to 2000. Results were adversely affected by: i) the devaluation of the Brazilian currency, ii) lower results in North America and iii) lower results from the subsidiary Açominas.
Fiscal year ended December 31, 2000 compared to fiscal year ended December 31, 1999
Net Sales Revenue
The consolidated net revenue of US$ 3.2 billion increased 55.5% due to the growth of shipments and in prices. Shipments were especially affected by an increase in the Brazilian industrial activity and the consolidation of Ameristeel throughout the whole year. Quantitatively, physical sales went up 41.4% reaching 6.5 million tons. As for prices, an increase of 10.0% brought the average prices up to US$ 415 from US$ 377.
Cost of Sales and Gross Profits
Gross profits went up 15.0% reaching US$ 712.4 million, on the other hand gross margin went down to 26.6% from 36.0%. This reduction is explained by an increase in prices of some raw materials in Brazil, such as scrap, which had hit the bottom in 1999. Another factor that contributed for the narrowing in margins was the consolidation in full of AmeriSteel, a company with higher production costs than those in Brazil.
Operating Income
If on the one hand margins were tight in 2000, on the other, general and administrative expenses, as a percentage of sales, went down almost 120 basis points to 8.0%. Sales and marketing expenses also decreased from 5.0% of net sales to 4.2%. As a result, operating income of US$ 387.0 million was 3.0% greater than the US$ 375.9 million registered in 1999.
Financial Expenses and Financial Revenue
Although cost of funding and exchange losses were lower in 2000, net financial expenses increased by 17.6%. This happened because the average indebtedness level in 1999 was lower than in 2000. In fact, during the second half of 1999, the indebtedness grew substantially due to the acquisition of Ameristeel and a capital injection in Açominas. Both investments were partially financed with third-party capital. It is important to mention that the Company’s debt increased not only as a consequence of these new loans but also due to the consolidation of the already existing debt of Ameristeel.
Equity Pickup
Due to the substantial recovery obtained by Açominas, equity pickup reached U.S.$. 34.0 million up from a negative equity pickup of U.S.$. 4.9 million in 1999.

36 - 36 --1
Non Operational Revenue.
The non-operating income of U.S.$ 2.2 million in 2000 is mainly due to gains resulting from the disposal of fixed assets.
Provision for Income Tax
In 2000, the provision for income tax of U.S.$ 45.6 million exceeded, by more than U.S.$ 25 million, the amount provided in the previous year. In 1999 income taxes were positively affected by the devaluation of Real.
Net Income
Net income of U.S.$ 188.6 million decreased 4.6% in 2000 compared to 1999. The result was negatively affected by increases in provision for income taxes and by changes in the cost structure, due to the consolidation of Ameristeel, and increases of raw material prices in Brazil.
B. LIQUIDITY AND CAPITAL RESOURCES
The net cash generated by operating activities totaled U.S.$ 300.4 million, U.S.$ 225.5 million and U.S.$ 297.5 million for the years ended December 31, 1999, 2000 and 2001, respectively, totaling U.S.$ 823.4 million. Net cash generated by operating activities was one of the main sources of liquidity utilized by the Company. Short and long-term financing agreements aggregated U.S.$ 1,586.1 million in the period, contributing U.S.$ 811.2 million in 1999, U.S.$ 421.8 million in 2000 and U.S.$ 353.1 in 2001, toward the Company’s liquidity needs. Sales of disposed fixed assets generated total proceeds of U.S.$ 34.8 million for the years of 1999, 2000 and 2001.
In 2001, the main uses of capital resources were: U.S.$ 244.0 million in fixed assets, U.S.$ 436.6 million in short and long term debt payments and U.S.$ 70.9 million in payment of dividends. In 2000, the main uses of capital resources were: U.S.$ 264.8 million in fixed assets, U.S.$ 348.4 million in short and long-term debt payments and U.S.$ 66.0 million in payment of dividends. In 1999, the main uses of capital resources were: U.S.$ 433.4 million in fixed assets, U.S.$ 235.3 million in short and long-term debt payments and U.S.$ 37.4 million in payment of dividends.
The amount of resources invested in fixed assets from 1999 to 2001 (U.S.$ 942.2 million) was used for modernization and technological update of the Company’s industrial plants and subsidiaries.
From December 31, 2000 to December 31, 2001 net working capital increased by U.S.$ 54.0 million, from U.S.$ 196.6 million in 2000 to U.S.$ 250.6 million in 2001. This increase was primarily due to a decrease in current liabilities.
Indebtedness and Financial Strategy
The loans taken by the Company are basically intended to finance investments in fixed assets, both for the modernization and technological update of the plants and for the expansion of installed capacity, for the financing of working capital, and, depending on market conditions, for short-term financial investments.
The balance of loans totaled U.S.$ 1,198.1 million and U.S.$ 1,406.5 million at December 31, 2001 and 2000, respectively. On the same dates, the balance of short-term financial investments and cash totaled U.S.$ 333.9 million and U.S.$ 302.9 million, respectively.
Total debt reached U.S.$ 1,294.3 million in 2001, down from U.S.$ 1,522.3 million in 2000. Net debt decreased from U.S.$ 1,219.4 million in 2000, to U.S.$ 960.4 million in 2001 due to the devaluation of the Brazilian currency, debt payments and gains from swap operations. Net financial expenses were, respectively, U.S.$ 186.2 million and U.S.$ 183.3 million in 2000 and 2001, respectively.
The following table lists the indebtedness profile of the Company as of December 31, 2001 and 2000 (in thousands of U.S. dollars): 2001 2000

37 - 37 --1
Short Term: Short-term debt: Debt denominated in reais 372 515 Debt denominated in foreign currency 370,967 371,535 Total short term debt 371,339 372,050 Current portion of long-term debt: Debt denominated in reais 45,342 49,276 Debt denominated in foreign currency 150,810 267,260 Total current portion of long-term debt 196,152 316,536 Debentures 2,018 2,413 Short-term debt plus current portion of long-term debt
and debentures
569,509
690,999
Long Term: Long-term debt, less current portion: Debt denominated in reais 141,833 198,733 Debt denominated in foreign currency 488,803 519,097 Total long term debt 630,636 717,830 Debentures 94,204 113,349 Subtotal 724,840 831,179 Long-term debt, parent company 461 77 Long-term debt, plus debentures and parent company 725,301 831,256 Total debt 1,294,810 1,522,255 Short-term investments and cash 333,897 302,882 Net debt: 960,913 1,219,373 On December 31, 2001 the Company’s indebtedness was subject to the following terms and conditions:
Short term:
In 2001, the Company’s short-term debt remained stable at US$ 371.3 million. This short-term debt is subject to interest rates ranging from 2.0% to 11.02% per year, plus monetary restatement or variation of exchange rates.
Additionally, the Company will have to pay the current portion of long-term debt and debentures in the amount of U.S.$ 196.1 million, of which U.S.$ 45.3 million relates to financing in reais and U.S.$ 150.8 million relates to financing in foreign currencies.
Long term:
Long-term debt totaled U.S.$ 725.3 million on December 31, 2001. U.S.$ 630.6 million of this debt is comprised of loans from financial institutions of which U.S.$ 141.8 million of which is denominated in reais, with a cost ranging from 9.25% to 11.86% plus monetary restatement (TJLP) per year and U.S.$ 488.8 million is denominated in foreign currency, with a cost of monetary restatement plus interest which varies from 3.0% to 11.02% per year. Of the total long term debt, U.S.$ 94.2 million refers to debentures denominated in reais, with an interest cost which varies from TR+ 8% to 19.0% per year as of December 31, 2001 (see Note 10 to the financial statements) and US$ 461 thousand refers to debt with Gerdau S.A..
Of the loans denominated in foreign currency, U.S.$ 488.8 million, or approximately 27.0% of the principal, were contracted by the Company in Brazil and 73.0% of the principal amount by the Company’s foreign subsidiaries.
In January 1999, the Company assumed the debt related to the Eurobonds issued by Metalúrgica Gerdau, for U.S.$ 130.0 million, maturing on May 26, 2004, which were partially redeemed on May 26, 1999.
The Company is subject to limitations on the incurrence of indebtedness, the granting of encumbrances on its properties and on the payment of dividends under certain circumstances, under the instruments defining creditors rights for its debentures, its Banco Nacional de Desenvolvimento Econômico e Social - BNDES (“BNDES”) financing,

38 - 38 --1
Eurobonds issued by Metalúrgica Gerdau S.A. in 1996 and assumed by the Company and scheduled to mature in 2004, and due to the acquisition of Ameristeel.
The Company’s public debentures prohibit the payment of dividends in excess of 30% of distributable net profits, if after giving effect to such distributions the Company’s long-term liabilities exceed more than 1.5 times its net worth and its current assets are less than its current liabilities.
The 1996 Eurobonds limit consolidated financial indebtedness to no greater than four times Earnings Before Interest, Taxes, Depreciation and Amortization (EBITDA).
The Company’s indebtedness to the BNDES requires that the current liquidity ratio (consisting of current assets divided by current liabilities) be at least 1.3 and that financial debt divided by Earnings Before Interest, Taxes, Depreciation and Amortization (EBITDA) be less than five. These agreements also contain negative covenants, subject to customary exceptions.
Gerdau Steel, Inc., the Canadian subsidiary of Gerdau S.A. responsible for the financing of the acquisition of Ameristeel, is required to fulfill the following covenants:
1. Current liquidity ratio of 1.0 or greater; 2. Debt service coverage ratio greater than 1.0; 3. Interest coverage greater than 2.0, 4. Total debt over EBITDA less than 2.75 until September 2002 and 2.0 after September 2002. 5. Term debt over capitalization not greater than 0.55 through December 31, 2001 and not greater than 0.4
after this date. 6. Tangible net worth of Canadian companies in the Group greater than $110 million plus 50% of
cumulative consolidated net income.
The Company agrees to furnish a copy of the the debt instruments described herein to the Securities and Exchange Commission upon request.
All covenants described above are based on financial statements prepared in accordance with Brazilian Corporate Law and at December 31, 2001, management believes that the Company was in full compliance regarding such debt covenants and other conditions of the debt described above.
On December 31, 2001, the Company’s long-term debt and debentures (including current portion) totaled U.S. $ 921.4 million. Of this balance, U.S. $ 283.9 million (30.8%) was denominated in Brazilian reais and U.S. $ 637.5 million (69.2%).was denominated in U.S. dollars.
The Company has entered into arrangements to swap its foreign currency exchange rate exposure inherent to this debt. As of December 2001, the total amount swapped was U.S.$ 225.6 million. Part of the Company’s cash flow from operations is denominated in Brazilian reais and U.S. dollars. See “Currency Remeasurement – Revenue Denomination and Exchange Rate Devaluations.” Such cash flows from operations may be utilized to service this debt. There can, however, be no assurance that cash flows from operations will be sufficient to service the foreign currency denominated debt obligations, which are denominated principally in U.S. dollars. Consequently, there can be no assurance that exchange rate fluctuations will not have a material adverse effect on the Company’s business, financial condition and results of operations. See Item 3 D.
The Company’s long-term indebtedness to financial institutions will be amortized as follows: U.S.$ million
2003 172.1 2004 238.7 2005 139.3 2006 49.1 2007 and t hereafter 31.4 Total 630.6

39 - 39 --1
Reserve for Contingencies.
On December 31, 2001, the reserve for probable and reasonably estimable contingencies totaled U.S.$ 55.2 million. This is partially backed by legal escrow accounts controlled by the corresponding courts totaling U.S.$ 26.7 million as of that same date.
Investments
In order to face the increasing demand for steel products in the markets in which the Company is directly or indirectly conducts business, Gerdau invested during 2001 to increase output capacity, to make improvements in existing plants and to update them technologically as well as to create new products. These investments totaled US$ 119.8 million, of which US$ 80.1 million was spent in plants located in Brazil and US$ 39.7 million in plants abroad.
In addition to the investments above, Ameristeel spent US$ 48.8 million to acquire the operating assets of Carterville, one of Birmingham Southeast’s plant.
Gerdau also made an offer of R$ 426.6 million reais for an additional stake in Açominas at an auction sponsored by the Brazilian Central Bank. The transaction was fully concluded on February 19, 2002, and as a result Gerdau currently holds 54.14% of Açominas. Additionally, on February 8, 2002 Gerdau also formalized an agreement to acquire the 24.8% stake that Natsteel (of Singapore) has in Açominas. According to the terms of the agreement, Gerdau may exercise its right to purchase Natsteel's stake by September 9, 2002.
Basis of Presentation
The following analysis is based on and should be read in conjunction with the Company’s U.S. GAAP financial statements, including the notes thereto, included elsewhere in this Registration Statement. For certain purposes, such as filing financial statements with the Brazilian Securities Commission, and determining dividend payments and tax liabilities in Brazil, the Company has been and will continue to be subject to the requirements of Brazilian GAAP, and the Company will continue to prepare financial statements in Brazil in accordance with Brazilian GAAP. The information included in this section (revenues and expenditures) will be presented in dollars according to U.S. GAAP (Notes 2.1 and 2.2 to the financial statements) and should be analyzed in conjunction with the financial statements, where the criteria for translation into dollars of revenues and expenditures as well as the effects of the translation are presented.
Currency Translation
Foreign Currency Translation
The Company, which carries out the majority of its business in Brazilian reais, and, to a lesser extent, in U.S. and Canadian dollars and Chilean, Uruguayan and Argentine pesos, has selected the United States dollar as its reporting currency. The U.S. dollar amounts presented have been remeasured/translated following the guidelines established in Statement of Financial Accounting Standards (“SFAS”) No.52, “Foreign Currency Translation” on the basis of audited financial statements expressed in the local currency of each of the countries. Under SFAS No.52, there are two methods of translation: the current rate method and the monetary/non-monetary method.
In the case of the Company and subsidiaries whose local currency is the functional currency (Chile, Canada, United States and Argentina), the current rate method of translation has been used. This method involves the translation of assets and liabilities at the exchange rate in effect at the end of each period. Average exchange rates have been applied for the translation of the accounts that make up the results of periods. In this case, translation adjustments are recorded as a separate component of shareholders’ equity.
Revenue Denominations and Exchange Rate Devaluations
The table below lists the amount of gross revenue from sales denominated in Brazilian reais , Canadian dollars, Uruguayan, Chilean and Argentinean pesos and U.S. dollars in the years indicated.
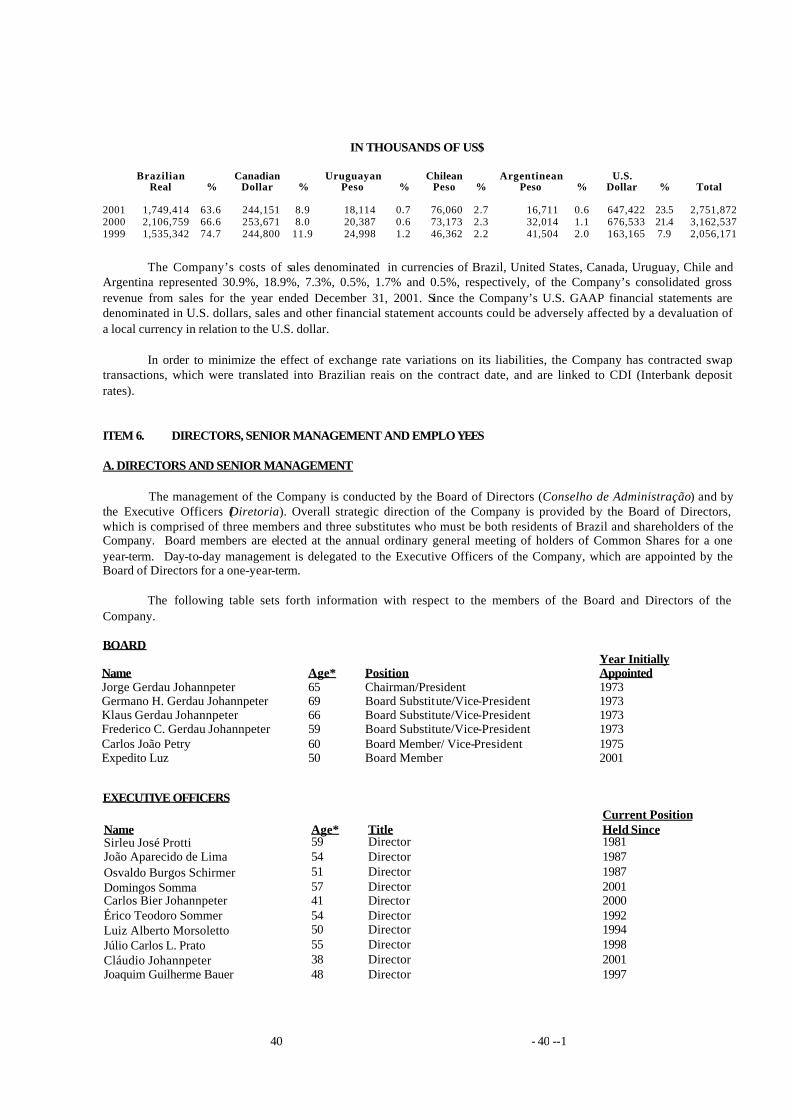
40 - 40 --1
IN THOUSANDS OF US$
Brazilian Canadian Uruguayan Chilean Argentinean U.S. Real % Dollar % Peso % Peso % Peso % Dollar % Total
2001 1,749,414 63.6 244,151 8.9 18,114 0.7 76,060 2.7 16,711 0.6 647,422 23.5 2,751,872 2000 2,106,759 66.6 253,671 8.0 20,387 0.6 73,173 2.3 32,014 1.1 676,533 21.4 3,162,537 1999 1,535,342 74.7 244,800 11.9 24,998 1.2 46,362 2.2 41,504 2.0 163,165 7.9 2,056,171
The Company’s costs of sales denominated in currencies of Brazil, United States, Canada, Uruguay, Chile and Argentina represented 30.9%, 18.9%, 7.3%, 0.5%, 1.7% and 0.5%, respectively, of the Company’s consolidated gross revenue from sales for the year ended December 31, 2001. Since the Company’s U.S. GAAP financial statements are denominated in U.S. dollars, sales and other financial statement accounts could be adversely affected by a devaluation of a local currency in relation to the U.S. dollar.
In order to minimize the effect of exchange rate variations on its liabilities, the Company has contracted swap transactions, which were translated into Brazilian reais on the contract date, and are linked to CDI (Interbank deposit rates).
ITEM 6. DIRECTORS, SENIOR MANAGEMENT AND EMPLOYEES
A. DIRECTORS AND SENIOR MANAGEMENT
The management of the Company is conducted by the Board of Directors (Conselho de Administração) and by the Executive Officers (Diretoria). Overall strategic direction of the Company is provided by the Board of Directors, which is comprised of three members and three substitutes who must be both residents of Brazil and shareholders of the Company. Board members are elected at the annual ordinary general meeting of holders of Common Shares for a one year-term. Day-to-day management is delegated to the Executive Officers of the Company, which are appointed by the Board of Directors for a one-year-term.
The following table sets forth information with respect to the members of the Board and Directors of the Company.
BOARD Name
Age*
Position
Year Initially Appointed
Jorge Gerdau Johannpeter 65 Chairman/President 1973 Germano H. Gerdau Johannpeter 69 Board Substitute/Vice-President 1973 Klaus Gerdau Johannpeter 66 Board Substitute/Vice-President 1973 Frederico C. Gerdau Johannpeter 59 Board Substitute/Vice-President 1973 Carlos João Petry 60 Board Member/ Vice-President 1975 Expedito Luz 50 Board Member 2001
EXECUTIVE OFFICERS Name
Age*
Title
Current Position Held Since
Sirleu José Protti 59 Director 1981 João Aparecido de Lima 54 Director 1987 Osvaldo Burgos Schirmer 51 Director 1987 Domingos Somma 57 Director 2001 Carlos Bier Johannpeter 41 Director 2000 Érico Teodoro Sommer 54 Director 1992 Luiz Alberto Morsoletto 50 Director 1994 Júlio Carlos L. Prato 55 Director 1998 Cláudio Johannpeter 38 Director 2001 Joaquim Guilherme Bauer 48 Director 1997

41 - 41 --1
Francesco Saverio Merlini 59 Director 1998 João Carlos Salin Gonçalves 55 Director 1999 Heitor Luis Beninca Bergamini 44 Director 1999 Cláudio Mattos Zambrano 54 Director 2000 Elias Pedro Vieira Manna 46 Director 2000 Gerson Marcos Venzon 46 Director 2000 Paulo Roberto Perlotti Ramos 49 Director 1996 Manoel Vitor de Mendonça Filho 44 Director 2001 Nestor Mundstock 50 Director 2001 * As of December 31,2001.
The following is a brief biography of each of the Company's Directors and Executive Officers:
JORGE GERDAU JOHANNPETER. Mr. Jorge Johannpeter, has been working for the Gerdau Companies since 1954. Mr. Jorge Johannpeter and his brothers, Germano, Klaus and Frederico, started as apprentices. Mr. Jorge Johannpeter became an Executive Officer in 1973 and was appointed President in 1983. He received a degree in Law from the Federal University of Rio Grande do Sul.
GERMANO H. GERDAU JOHANNPETER. Mr. Germano Johannpeter has been working with his brothers since 1951. Mr. Germano Johannpeter became an Executive Officer in 1973 and was appointed Vice-President of the Gerdau Companies in 1983. He received a degree in Business Administration from the Getúlio Vargas Foundation
KLAUS GERDAU JOHANNPETER. Mr. Klaus Johannpeter has worked for the Gerdau Companies with his brothers since 1954. Mr. Klaus Johannpeter became an Executive Officer in 1973 and was appointed Vice-President of the Gerdau Companies in 1983. He received a degree in Civil, Electrical and Mechanical Engineering from the Federal University of Rio Grande do Sul.
FREDERICO C. GERDAU JOHANNPETER. Mr. Frederico Johannpeter has worked for the Gerdau Companies with his brothers since 1961. Mr. Frederico Johannpeter became an Executive Officer in 1973 and was appointed Vice-President of the Gerdau Companies in 1983. He received a degree in Business Administration from the Federal University of Rio Grande do Sul.
CARLOS JOÃO PETRY. Mr. Petry has worked for the Gerdau Companies since 1965. In 1975, he was appointed to the Board of Directors and in 2000 he was named Vice-President of Brazilian Operations. Mr. Petry received a degree in Philosophy from the Federal University of Rio Grande do Sul.
EXPEDITO LUZ. Mr. Luz has worked for Gerdau since 1976. He was appointed to the Board of Directors in 2001. Mr. Expedito Luz received a degree in Law from the Federal University of Rio Grande do Sul 1975 and a Master in Law from the Columbia Law School in 1981.
SIRLEU JOSÉ PROTTI. Mr. Protti joined the Company in 1967 and became Executive Officer in 1981. He is currently the Managing Director of the Brazilian Long Steel Operations. Mr. Protti received a degree in Economics from the Catholic Pontiff University of Rio Grande do Sul, in 1966.
JOÃO APARECIDO DE LIMA. Mr. Lima joined the Company in 1974 and became an Executive Officer in 1987. He is currently the Human Resource Director. Mr. Lima received a degree in Brazilian Literature from the University of São Paulo, in 1971, and in Psychology from IMS, in 1974.
OSVALDO BURGOS SCHIRMER. Mr. Schirmer joined the Company in 1986 and became Financial Director in 1987. Mr. Schirmer received a degree in Business Administration from the Federal University of Rio Grande do Sul, in 1973, and in Industrial Agronomy Administration from the Illinois University, in 1975 and an M.B.A. in Finance and International Business from the Southern Illinois University, in 1977.
DOMINGOS SOMMA. Mr. Somma joined the Company in 1980 and became an Executive Officer in 1988. He is currently the Executive Director of the Brazilian Long Steel Operations. Mr. Somma received a degree in Economics from the Mackenzie University, in 1968.

42 - 42 --1
CARLOS BIER JOHANNPETER. Mr. Carlos Johannpeter joined the Company in 1976. In 1991, Mr. Carlos Johannpeter became Executive Officer of the Gerdau Steel for Industry. Mr. Carlos Johannpeter currently is the Managing Director of Business Departments. He received a degree in Law from the Federal University of Rio Grande do Sul.
LUIZ ALBERTO MORSOLETTO. Mr. Morsoletto joined the Company in 1983 and has been an Executive Officer of the Gerdau Divinópolis Industrial Unit. Mr. Morsoletto received a degree in Metallurgical Engineering from the Mauá Engineering School -SP, in 1975.
JÚLIO CARLOS L. PRATO. Mr. Prato joined the Company in 1969 and became an Executive Officer in 1992 and is currently the Executive Director of the Industrial Units located in the Northeast region of Brazil. Mr. Prato received a degree in Metallurgical Engineering from the Federal University of Rio Grande do Sul, in 1969.
CLÁUDIO JOHANNPETER. Mr. Cláudio Johannpeter joined the Company in 1982. In 1997, Mr. Cláudio Johannpeter became Executive Officer and is currently the Executive Director of the Industrial Units. Mr. Cláudio Johannpeter received a degree in Metallurgical Engineering from the Federal University of Rio Grande do Sul in 1990.
ÉRICO TEODORO SOMMER. Mr. Sommer joined the Company in 1975 and became an Executive Officer in 1992. He is currently the Engineering Director. Mr. Sommer received a degree in Electrical Engineering from the Federal University of Rio Grande do Sul in 1970.
JOAQUIM GUILHERME BAUER. Mr. Bauer has worked for the Company since 1982. In 1997, Mr. Bauer became Director of the Gerdau Steel for Industry Business Unit. Mr. Bauer received a degree in Metallurgical Engineering from the Federal University of Rio Grande do Sul, in 1977.
FRANCESCO SAVÉRIO MERLINI. Mr. Merlini joined the Company in 1977 and became an Executive Officer in 1998. He is currently the Director of the Gerdau Rio de Janeiro Industrial Unit. Mr. Merlini received a degree in welding techniques from the Cuyo National University of Argentina in 1970.
JOÃO CARLOS SALIN GONÇALVES . Mr. Gonçalves joined the Company in 1969 and became an Executive Officer in 1999. He is currently the Metal Supplies Director. Mr. Gonçalves received a degree in Metallurgical Engineering from the Federal University of Rio Grande do Sul in 1969.
HEITOR LUIS BENINCA BERGAMINI. Mr. Bergamini joined the Company in 1985 and became an Executive Officer in 1999. He is currently the Director of the Comercial Gerdau (Retail Unit). Mr. Bergamini received a degree in Economics from the Catholic Pontiff University of Rio Grande do Sul in 1982.
CLÁUDIO MATTOS ZAMBRANO. Mr. Zambrano joined the Company in 1970 and became an Executive Officer in 2000. He is currently the Director of the Gerdau Aços Finos Piratini Industrial Unit. Mr. Zambrano received a degree in Mechanical Engineering from the Catholic Pontiff University of Rio Grande do Sul, in 1970, and in Business Administration from the same university, in 1975.
ELIAS PEDRO VIEIRA MANNA. Mr. Manna joined the Company in 1988 and became an Executive Officer in 2000. He is currently the Commercial Director for Specialty Steel Products. Mr. Manna received degrees in Operational Mechanical Engineering, Mechanical Engineering and Civil Engineering, from the Catholic Pontiff University of Rio Grande do Sul in 1977, 1981 and 1982 respectively. He also received a Masters degree in Materials Engineering from the Federal University of Santa Catarina in 1982.
GERSON MARCOS VENZON. Mr. Venzon joined the Company in 1982 and became an Executive Officer in 2000. He is currently the Director of Gerdau’s Civil Construction Business Division. Mr. Venzon received a degree in Economics from the Federal University of Rio Grande do Sul in 1977 and a Masters degree in Engineering Economics from the Federal University of Santa Catarina in 1980.
PAULO ROBERTO PERLOTT RAMOS. Mr. Paulo Ramos joined the Company in 1976 and became an Executive Officer in 1995. He is currently the Director of Gerdau’s Exports Business Division. Mr. Paulo Ramos received a degree in Mechanical Engineering and Business from the Federal University of Rio Grande do Sul.

43 - 43 --1
MANOEL VITOR DE MENDONÇA FILHO. Mr. Vitor joined the Company in 1983 and became an Executive Officer in 2001 and is currently the Executive Director of the Industrial Units located in the South region of Brazil. Mr. Vitor received a degree in Metallurgical Engineering from the Federal University of Minas Gerais in 1982.
NESTOR MUNDSTOCK. Mr. Mundstock joined the Company in 1975 and became an Executive Officer in 2001 and is currently the Executive Director of the Industrial Units located in the Central region of Brazil. Mr. Mundstock received a degree in Metallurgical Engineering from Fluminense Federal University, in 1975.
There are no pending legal proceedings to which any Board member or Executive Officer of the Company is a party adverse to the Company.
All of the Executive Officers of the Company are appointed in such capacities by the Board of Directors to serve for one-year terms, which are renewable at the pleasure of the Board of Directors.
Family relationship
Jorge Gerdau Johannpeter, Germano H. Gerdau Johannpeter, Klaus Gerdau Johannpeter and Frederico C. Gerdau Johannpeter are brothers. Carlos Bier Johannpeter is Jorge Gerdau Johannpeter’s son and Cláudio Johannpeter is Klaus Gerdau Johannpeter’s son.
B. COMPENSATION Gerdau has been gradually introducing a variable portion of employee compensation. In 2001, variable compensation for all employees totaled U.S.$ 16.6 million. For managers and directors the company has the “RAC” (Additional Contracted Remuneration). For other employees the Company has the “Programa Metas” (Goals Program) and Participation Programs. All employees receive additional compensation, according to the score obtained in PGQ (Gerdau’s Quality Program). Total compensation for managers and directors in 2001 totaled US$ 7.2 million.
Employee Pension Plan
The Company and affiliates co-sponsor a contributory pension plan covering substantially all Brazilian-based employees (the “Domestic Plan”). The Domestic Plan is principally a defined benefit plan with certain limited defined contributions. Additionally, the Company's Canadian and American subsidiaries sponsor defined benefit plans (the “Canadian Plans” and the “American Plans”) covering substantially all of their employees. Contributions to the Domestic Plan for defined contribution participants are based on a specified percentage of employees’ compensation and totalled US$ 955.4 thousand in 2001, US$ 1,626.8 thousand in 2000 and US$ 1,560 thousand in 1999. Contributions to the Domestic Plan for defined benefit participants and contributions to the Canadian Plan are based on actuarially determined amounts.
The Domestic Plan is administered by Gerdau - Sociedade de Previdência Privada, which was established by the Group for this purpose. Plan assets of the Domestic Plan consist of investments in bank certificates of deposit, equity and debt securities and investment funds. In ten years of existence, Gerdau Previdência Privada’s net worth has reached U.S.$ 62.2 million, with 100% of its capital being contributed by affiliated Brazil-based Companies. Gerdau's Domestic Plan provides its employees with an opportunity to increase their future income by means of basic no-contribution and supplementary plans, an optional contribution plan, retirement, pension and savings plans.
Total pension expense for 2001, 2000 and 1999 was US$ 7,659 thousand, US$ 5,354 thousand and US$ 8,058 thousand, respectively.
C. BOARD PRACTICES Name Jorge Gerdau Johannpeter Chairman and President since 1973. Germano H. Gerdau Johannpeter Vice-President and a Board Substitute since 1973. Klaus Gerdau Johannpeter Vice-President and a Board Substitute since 1973. Frederico C. Gerdau Johannpeter Vice-President and a Board Substitute since 1973.

44 - 44 --1
Carlos João Petry Board Member since 1975 and a Vice-President since 2000. Expedito Luz Board Member since 2001. Alberto Monteiro de Queiroz Audit Committee Member since April 2001. José A. Cruz Módena Audit Committee Member since April 2001. Peter Wilm Rosenfeld Audit Committee Member since April 2001. Sirleu José Protti Managing Director of the Brazilian Long Steel Operations since 2001. João Aparecido de Lima Human Resource Director since 1987. Osvaldo Burgos Schirmer Financial Director since 1987. Domingos Somma Executive Director of the Brazilian Long Steel Operations since 2001. Carlos Bier Johannpeter Managing Director of Business Departments since 2000. Érico Teodoro Sommer Engineering Director since 1992. Luiz Alberto Morsoletto Director of Divinopolis’ plant since 1994. Júlio Carlos L. Prato Executive Director of Northeast units since 1998. Cláudio Johannpeter Executive Director of Industrial Units since 2001 Joaquim Guilherme Bauer Director of Gerdau Steel for Industry since 1997. Francesco Saverio Merlini Director of Cosigua’s plant since 1998. João Carlos Salin Gonçalves Metal Supplies Director since 1999. Heitor Luis Beninca Bergamini Director of Comercial Gerdau since 1999. Cláudio Mattos Zambrano Director of Aços Finos Piratini since 2000. Elias Pedro Vieira Manna Commercial Director for specialty steel products since 2000. Gerson Marcos Venzon Director of Gerdau’s Civil Construction since 2000. Paulo Roberto Perlott Ramos Director of Gerdau’s Exports Division since 1996. Manoel Vitor de Mendonça Filho Executive Director of the Industrial Units located in the south region since 2001. Nestor Mundstock Executive Director of the Industrial Units located in the central region since 2001. * All people listed above are elected at the annual ordinary general meeting of holders of Common Shares for a one-year term, and in the event of termination of their mandate, they are entitled only to statutory employment benefits under applicable law, without any special severance.
D. EMPLOYEES
As of December 31, 2001, the Company had 12,405 employees, in line with the total of employees in the previous year. The following table sets forth information with respect to geographic distribution of Gerdau’s employees:
Brazil Abroad Total 1998 8,639 1,335 9,974 1999 8,495 3,526 12,021 2000 8,436 3,904 12,340 2001 8,631 3,774 12,405
The number of employees engaged abroad sharply increased, from 1998 to 1999, due to the acquisition of Ameristeel. E. SHARE OWNERSHIP
The following chart indicates the individual holdings of Gerdau S.A. Preferred and Common Shares by each director. The list of directors that hold shares of the Company indicated below do not own 1% or more of the Company's capital in each stock class. The Company does not provide employees any additional rights in any form, i.e., stock options or securities of the Company.

45 - 45 --1
Name Common Shares % Preferred Shares %
Jorge Gerdau Johannpeter 44,574 - 1.690.478 - Germano H. Gerdau Johannpeter 73,106 - 34,338,652 0.05% Klaus Gerdau Johannpeter 85,688 - 2,009,374 - Frederico C. Gerdau Johannpeter 44,774 - 5,366.478 0.01% Carlos João Petry 314,968 - 1,629,124 - Expedito Luz 32 1,560,000 Sirleu José Protti - - 1,560,000 - João Aparecido de Lima - - 1,560,000 - Osvaldo Burgos Schirmer - - 1,560,000 - Domingos Somma 24,274 - 1,870,350 - Carlos Bier Johannpeter 2,786,164 - 5,576,380 0.01% Érico Teodoro Sommer - - 1,560,000 - Luiz Alberto Morsoletto - - 1,505,956 - Júlio Carlos L. Prato 154,956 - 1,992,436 - Cláudio Johannpeter 2,700,000 - 17,811,464 0.02% Joaquim Guilherme Bauer - - 1,689,014 - Francesco Saverio Merlini - - 959,820 - João Carlos Salin Gonçalves - - 1,759,480 - Heitor Luis Beninca Bergamini - - 1,560,000 - Cláudio Mattos Zambrano 28,314 - 2,340,580 - Elias Pedro Vieira Manna - - 1,560,000 - Gerson Marcos Venzon - - 1,560,000 - Paulo Roberto Perlotti Ramos - - 1,732,566 - Manoel Vitor de Mendonça Filho - - 1,560,000 - Nestor Mundstock 50,310 - 2,003,768 -
ITEM 7. MAJOR SHAREHOLDERS AND RELATED-PARTY TRANSACTIONS
A. MAJOR SHAREHOLDERS
The following table sets forth certain information as of December 31, 2001 with respect to (i) any person known to the Company to be the owner of more than 5% of the Company's outstanding shares of voting Common Shares, (ii) any person known to the Company to be the owner of more than 5% of the Company's outstanding shares of Preferred Shares and (iii) the total amount of the Company's voting Common Shares and Preferred Shares owned by the executive officers and directors of the Company as a group.
As of December 31, 2001, 39,382,020,386 Common Shares and 74,109,685,986 Preferred Shares were issued and outstanding. Of the two kinds of shares traded in the market, only the Common Shares have voting rights. Under the terms of the Company's By -laws, however, specific rights are assured to the non-voting Preferred Shares.
The Gerdau family, through its holdings in Indac - Indústria, Administração e Comércio S.A., Grupo Gerdau Empreendimentos Ltda. and Gersul Empreendimentos Imobiliários Ltda., controls Metalúrgica Gerdau S.A. holding, collectively, 71.8% of the voting capital and 23.9% of the total capital. Individually, Indac - Indústria, Administração e Comércio S.A. holds 32.3% of the voting capital and 10.8% of the total capital of Metalurgica Gerdau S.A., Grupo Gerdau Empreendimentos Ltda. holds 25.6% of the voting capital and 8.5% of the total capital of Metalurgica Gerdau S.A., and Gersul Empreendimentos Imobiliários Ltda. holds 13.9% of the voting capital and 4.6% of the total capital of Metalurgica Gerdau S.A..

46 - 46 --1
Shareholder Common Shares % Preferred Shares % Metalúrgica Gerdau S.A. 32,677,464,100 83.0 21,043,082718 28.4 BNDES Participações S.A. – BNDESPAR 2,714,970,110 6.9 - - Clube de Investimentos HRP 915,084 - 4.244,518,064 5.7 Santa Felicidade Com. Imp. Exp. Prods. Sid. Ltda.* 936,949,502 2.4 2,999,759,664 4.0 Gersul Empreendimentos Imobiliários S.A.* 747,214,768 1.9 - - Grupo Gerdau Empreendimentos Ltda.* 547,570,932 1.4 6,270,673 - Indac 236,648,440 0.6 - - Members of the Board of Directors and Executive Board as a group (17 persons)
6,307,160 - 91,264,330 0.1
* Controlled by or affiliated with Metalúrgica Gerdau S.A.
Metalúrgica Gerdau S.A. and its controlled companies hold 85% of the voting capital of Gerdau S.A. and, consequently, have the ability to control the Company's Board of Directors and the direction and other operations of the Company.
B. RELATED-PARTY TRANSACTIONS
The most significant transactions of the Company with its related parties are with Banco Gerdau, Fundação Gerdau, Haras Joter Ltda. and , Metalúrgica Gerdau.
Banco Gerdau, a wholly owned subsidiary of Metalúrgica Gerdau, has established an investment fund for the exclusive use of the Company. The fund’s investments consist of fixed-income security. There are borrowings of the Company from its parent company, Metalúrgica Gerdau, and borrowings of Fundação Gerdau and Haras Joter Ltda. from Gerdau S.A.. These borrowings are denominated in Brazilian Reais and bear interest at the average in terest rate defined by the Company for its inter-company loans and other financial transactions. Usually the Company’s inter-company rate is established according to the market average rate. For further information about transactions with related parties, see Note 6 of the financial statements.
C. INTERESTS OF EXPERTS AND COUNSEL
Not applicable.
ITEM 8. FINANCIAL INFORMATION
A. CONSOLIDATED STATEMENTS AND OTHER FINANCIAL INFORMATION
The Company’s financial statements are included in Item 18.
Legal proceedings
As is the case with many other industrial companies in Brazil, the Company is engaged in several disputes with Brazilian taxation authorities. The principal disputes involve the Federal taxes Contribuição Provisória sobre Movimentação Financeira (“CPMF”), Fundo de Participação e Integração Social ("PIS"), Contribuição Social para o Financiamento da Seguridade Social ("COFINS"), Contribuições Previdenciárias (“INSS”), Fundo de Investimento Social ("FINSOCIAL"), Contribuição ao Fundo de Assistência ao Trabalhador Rural (“FUNRURAL”), Contribuição Social Sobre o Lucro , and the Income Tax, Imposto de Renda Pessoa Jurídica (“IRPJ”), as well as the state value added tax, Imposto Sobre Circulação de Mercadorias e Serviços ("ICMS"). The questions raised in all of these matters but for the INSS have already been ruled on by the Brazilian Supreme Court, establishing precedents for the lower courts.
Therefore, although in some cases the outcome is highly predictable, because the relevant disputes have not been concluded, the contingent liability in respect of these taxes remains on the books of the Company in the aggregate amount of U.S.$ 27.1 as of December 31, 2001 (CPMF – US$ 5.8 million, PIS/COFINS – U.S.$ 3.9 million, INSS – U.S.$ 7.7 million, FINSOCIAL – U.S.$ 3.1 million, FUNRURAL – U.S.$ 0.049 million, Contribuição Social Sobre o Lucro – U.S.$ 1.1 million, IRPJ – U.S.$ 4.4 million, ICMS – U.S.$ 0.4 million and others U.S.$ 0.7 million).

47 - 47 --1
The aggregate amount equivalent to U.S.$ 12.4 million has been paid to the courts to be held in judicial escrow pending the outcome of the above disputes; therefore, the actual amount to be paid in the event that the Company is completely unsuccessful in such tax disputes would not be greater than U.S.$ 9.8 million.
Along with other electricity consumers, the Company has challenged the constitutionality of "compulsory loans" required to be made to the state-owned utility holding company Eletrobrás (Empréstimo Compulsório Eletrobras sobre Energia Elétrica) by its customers. The current amount in dispute by the Company is the equivalent of U.S.$ 21.7 million, including an aggregate amount of the equivalent of U.S.$ 11.2 million that has been paid into court (where it is held in judicial escrow pending the outcome of the relevant disputes). In 2001, the amounts under dispute and in judicial escrow were reduced to U.S.$ 21.5 million and U.S.$ 3.0 million, respectively, due the termination of three major law suits. The Company has established a reserve relating to "compulsory loans" since: (i) in March 1995 the Brazilian Supreme Court decided against the interests of the Company as it relates to this matter; (ii) even though the payment to Eletrobras was in the form of a loan, the repayment to the Company will be made in the form of Eletrobras shares; and (iii) based on currently available information, the Eletrobras shares will most likely be worth less than 5% of the amount payable if the repayment were to be made in cash. Although the constitutionality of the charge has been sustained by the Brazilian Supreme Court, several issues are still pending, including the amounts to be paid by the Company.
During the last year, the Company received several tax assessments concerning INSS (social security contributions levied on employees payroll). Among other subjects, the Fiscal Authorities are questioning irregularities in payments concerning vacation premium established by collective agreement, labor accident insurance, profit sharing programs, directors fees, additional indemnity on dismissals, as well as regarding employees of outsourced services´ companies, due to the Company’s alleged legal joint and several liability.
The Company is also party to a number of lawsuits by ex-employees, including personal injury claims. As to the claims directly referring to compliance with labor laws, it is very difficult to estimate the value of such employees' lawsuits because plaintiffs in Brazil generally make several alternative or complementary claims in a single lawsuit only a few of which ever result in an award. Additionally, in the Company's experience the plaintiffs in these suits tend to exaggerate the amounts of their claims. Nevertheless, the Company has estimated the probable loss amount for each lawsuit. The Company estimates that the total probable loss involved in these ex-employees lawsuits as of December 31, 2001 should not exceed U.S.$ 6.3 million.
Most of these labor lawsuits are characterized by multiple ex-employee demands arising from Brazilian legislation providing for additional payments over and above the employee's former base salary. These suits include, among other things, demands for (i) overtime, (ii) night work, (iii) the correction of dangerous working conditions, (iv) the reduction of fines levied due to termination and (v) requests to fine the Company for late payment of termination payments. Also, some ex-employees sue the Company in torts because of personal injury resulting from labor accidents. The accounting treatment adopted by the Company for the above amounts in dispute is to accrue for each contingency when the amounts are probable and reasonably estimable.
The Company believes, based in part on advice from legal counsel, that the reserve for contingencies of U.S.$ 55.2 million as of December 31, 2001, is sufficient to meet probable and reasonably estimable losses in the event of unfavorable rulings in the aforementioned matters. As such, the Company believes that the ultimate resolution of such matters will not have a material effect on the consolidated financial position as of December 31, 2001 or the results of future operations or cash flows.
B. SIGNIFICANT CHANGES
There were no significant changes nor have any relevant facts occurred after the date of the financial statements included in this annual report.

48 - 48 --1
ITEM 9. THE OFFER AND LISTING
A. OFFER AND LISTING DETAILS
Price Information
The table below presents, for the indicated periods, the minimum and maximum closing prices for Preferred Shares on the São Paulo Stock Exchange. The prices are expressed in nominal reais as of the period end date. The sales prices included on the two following tables were also translated into U.S. dollars, but please note that the “high” and “low” quote in U.S. dollars in a given period may not be in the same month of the “high” and “low” prices expressed in reais due to the influence of the foreign exchange rate. Closing Sale Prices Nominal Reais per 1,000 Preferred
Shares U.S. Dollars per 1,000 Preferred Shares
High Low High Low 1997 27.50 8.55 25.05 8.22 1998 24.90 7.30 19.39 5.53 1999 50.30 7.30 27.51 5.54 2000 58.00 14.99 32.36 7.65 2001 23.80 13.06 11.84 4.81 Closing Sale Prices Nominal Reais per 1,000 Preferred
Shares U.S. Dollars per1,000 Preferred Shares
High Low High Low 1999 First Quarter 18.00 7.30 9.94 5.54 Second Quarter 29.50 18.45 16.67 10.70 Third Quarter 34.00 24.80 17.98 13.24 Fourth Quarter 50.30 31.30 27.51 16.00 2000 First Quarter 58.00 45.00 32.36 25.89 Second Quarter* 45.00 16.99 25.80 9.17 Third Quarter 26.90 21.98 14.90 12.16 Fourth Quarter 22.40 14.99 12.12 7.65 2001 First Quarter 23.38 16.81 11.84 8.24 Second Qu arter 20.19 15.37 9.24 6.57 Third Quarter 17.49 13.06 7.05 4.81 Fourth Quarter 23.80 13.30 9.66 4.92 2002 First Quarter 29.01 22.02 12.41 9.55 The sales prices included on the following table were translated into U.S. dollars in accordance with the Commercial Market rate of exchange for each corresponding date quoted. Closing Sale Prices Nominal Reais per 1,000 Preferred
Shares U.S. Dollars per1,000 Preferred Shares
High Low High Low 2001 January 23.38 16.81 11.84 8.67 February 20.90 17.95 10.54 8.67 March 19.91 17.65 9.37 8.24 April 20.19 17.75 9.24 8.16

49 - 49 --1
May 20.05 15.37 9.02 6.57 June 18.01 15.95 7.73 6.69 July 17.49 14.65 7.02 5.91 August 17.40 16.15 7.05 6.39 September 16.31 13.06 6.36 4.81 October 19.00 13.30 6.96 4.92 November 23.80 18.11 9.56 6.75 December 23.47 21.40 9.66 9.22 2002 January 26.75 22.02 11.07 9.55 February 27.90 23.32 11.60 9.63 March 29.01 26.50 12.41 11.23 April 32.60 27.00 14.19 11.75 * The Board of Directors of the Company authorized a 2-for-1 stock split of its Common and Preferred stock, which was approved in the General and Extraordinary Shareholders’ Meeting held on April 28, 2000. The additional shares resulting from the split were distributed by Banco Itaú S.A., the transfer agent, two days after approval, for shares traded in Brazil, and seven days after the approval for ADSs, to shareholders of record on April 28, 2000, at which time the shares were traded on a split-adjusted basis.
The following table presents, for the months indicated, the high and low prices for the ADRs as indicated in the Over-the-Counter Market until March 10, 1999, when the Company upgraded its ADSs to level II. For periods subsequent to this date, the table presents the negotiated prices on the New York Stock Exchange.
US$ Price Low High 1998 6.81 21.81 1999 6.75 27.00 2000 7.56 31.25 2001 4.70 11.90
US$ Price Low High 1999 First Quarter 6.75 10.25 Second Quarter 10.25 18.50 Third Quarter 13.13 18.50 Fourth Quarter 17.75 27.00 2000 First Quarter 25.88 31.25 Second Quarter* 9.13 26.25 Third Quarter 12.13 15.00 Fourth Quarter 7.56 13.00 2001 First Quarter 8.09 11.75 Second Quarter 6.50 11.90 Third Quarter 4.68 7.60 Fourth Quarter 4.70 10.00 2002 First Quarter 9.50 12.43
* 2-for-1 stock split of common and preferred stock on April 28,2000.
US$ Price Low High 2000 July 12.13 13.94 August 12.75 15.00 September 12.31 14.38 October 9.88 13.00 November 8.38 10.31 December 7.56 9.63

50 - 50 --1
2001 January 8.50 11.75 February 8.70 10.85 March 8.09 9.85 April 7.81 11.90 May 6.50 9.16 Jun 6.55 8.04 July 5.77 7.60 August 6.26 7.21 September 4.68 6.60 October 4.70 7.10 November 6.60 9.75 December 8.75 10.0
2002 January 9.50 11.35 February 9.53 11.90 March 11.10 12.43 April 11.70 14.05
B. PLAN OF DISTRIBUTION
Not required.
C. MARKETS
Trading on the Brazilian Stock Exchanges
Of Brazil's stock exchanges, the São Paulo Stock Exchange has been the most significant in recent years. During 2001, the São Paulo Stock Exchange accounted for almost the totality of the trading value negotiated in Brazil.
The São Paulo Stock Exchange is a non-profit entity owned by its member brokerage firms. Trading on the São Paulo Stock Exchange is limited to member brokerage firms and a limited number of authorized non-members. The São Paulo Stock Exchange currently has two open outcry trading sessions each business day, from 11:00 a.m. to 1:30 p.m and from 2:30 p.m. to 5:45 p.m. Trading is also conducted between 11:00 a.m. and 6:00 p.m. on the automated system of the São Paulo Stock Exchange. There is also trading in the so-called After-Market, only through the automated system of the São Paulo Stock Exchange, from 6:45 p.m. to 19:30 p.m. Only shares that were traded during the regular trading session of the day may be traded in the After-Market of the same day.
There are no specialists or market makers for the Company's shares on the São Paulo Stock Exchange. The Comissão de Valores Mobilários (the "CVM" or the "Brazilian Securities Commission") and the São Paulo Stock Exchange have discretionary authority to suspend trading in shares of a particular issuer under certain circumstances. Trading in securities listed on the São Paulo Stock Exchange may be effected off the exchange under certain circumstances, although such trading is very limited.
On December, 2001, the aggregate market capitalization of the companies listed on the São Paulo Stock Exchange was approximately US$ 185.4 billion. Although any of the outstanding shares of a listed company may trade on the São Paulo Stock Exchange, in most cases less than half of the listed shares are actually available for trading by the public, the remainder being held by small groups of controlling persons that rarely trade their shares. For this reason, data showing the total market capitalization of the São Paulo Stock Exchange tend to overstate the liquidity of the Brazilian equity securities market. The Brazilian equity securities market is relatively small and illiquid compared to major world markets.
Settlement of transactions is effected three business days after the trade date without adjustment of the purchase price for inflation. Payment for shares is made through the facilities of a separate clearinghouse, named Companhia Brasileira de Liquidação e Custódia – CBLC, which maintains accounts for member brokerage firms. The seller is ordinarily required to deliver the shares to the exchange on the second business day following the trade date. The CBLC is controlled by clearing agents, such as member brokerage firms and banks, and the São Paulo Stock Exchange.

51 - 51 --1
Trading on the São Paulo Stock Exchange by non-residents of Brazil is subject to certain limitations under Brazilian foreign investment legislation.
Regulation of Brazilian Securities Markets
The Brazilian securities markets are regulated by the Brazilian Securities Commission (“CVM”), which has authority over stock exchanges and the securities markets generally, and by Banco Central do Brasil (the "Central Bank"), which has, among other powers, licensing authority over brokerage firms and regulates foreign investment and foreign exchange transactions. The Brazilian securities market is governed by Law no. 6,385 dated December 7, 1976, as amended (the "Brazilian Securities Law") and the Brazilian Corporate Law (Law no. 6,404 dated December 15, 1976, as amended) (the "Brazilian Corporate Law").
Law 10,303 of October 31, 2001, amended Law nº 6,385/76 and Law nº 6,404/76. The most important changes were (i) the conversion of CVM into an autonomous governmental agency linked to the Ministry of Finance, with legal independence and separate assets and liabilities; (ii) the requirement of greater disclosure by listed companies; (iii) the tag-along right to minority common shareholders in the event of change in control of a listed company; (iv) the right of preferred shareholders with non-voting rights or restricted voting rights representing at least 10% of the total stock of a listed company to elect one board member and his alternate (considering that until April 2005, the representative of such shareholders will be chosen out of a three-name list prepared by controlling shareholders); (v) the right of the minority common shareholders to also elect one board member; and (vi) the preferred shares will only be traded in the stock market if they have at least one of the rights mentioned below: (a) priority in the receipt of dividends corresponding to at least 3% of the shares’ net worth based on the last approved balance sheet of the company; (b) the right to receive dividends at least 10% higher than the dividend assigned to each common share; or (c) the tag-along right in the event of change in the control of the company. The By-Laws of existing listed companies shall be modified to conform to the new provisions mentioned above, by March 1, 2003.
Under the Brazilian Corporate Law, a comp any is either listed, a "companhia aberta", such as the Company, or private, a "companhia fechada". All listed companies are registered with the CVM and are subject to reporting requirements. A company registered with the CVM may have its securities traded either on the São Paulo Stock Exchange or in the Brazilian over-the-counter markets ("Brazilian OTC"). The shares of a listed company, including the Company, may also be traded privately subject to certain limitations.
There are certain cases in which the disclosure of information to the CVM, the São Paulo Stock Exchange, or even to the public is required. These include (i) the direct or indirect acquisition by an investor of at least 5% (five percent) of any class or type of shares representing the capital stock of a listed company, (ii) the sale of shares which represents the transfer of control of a listed company and (iii) the occurrence of a material event to the corporation.
Recently CVM issued Instruction Nº 361, of March 5, 2002, which regulates the tender offers mainly when the following events occur: (i) delisting of public companies; (ii) increase in the equity interest by the controlling shareholder; and (iii) transfer of control of a public company.
To be listed on the São Paulo Stock Exchange, a company must apply for registration with the CVM and the São Paulo Stock Exchange. Once this exchange has admitted a company to listing and the CVM has accepted its registration as a listed company, its securities may be traded in the São Paulo Stock Exchange, as long as the company complies with the minimum requirements of this exchange.
The Brazilian OTC consists of direct trades between individuals in which a financial institution registered with the CVM serves as intermediary. No special application, other than registration with the CVM, is necessary for securities of a listed company to be traded in the Brazilian OTC. The CVM requires that it be given notice of all trades carried out in the Brazilian OTC by the respective intermediaries.
Trading in securities on the São Paulo Stock Exchange may be suspended at the request of a company in anticipation of the announcement of a material event. Trading may also be suspended on the initiative of the exchange or the CVM, among other reasons, based on or due to a belief that a company has provided inadequate information regarding a material event or has provided inadequate responses to the inquiries by the CVM or the exchange.
52 - 52 --1
The Brazilian securities markets are governed principally by Brazilian Securities Law, by Brazilian Corporate Law and by regulations issued by the CVM and the Conselho Monetário Nacional (the "National Monetary Council"). These laws and regulations, among others, provide for disclosure requirements, restrictions on insider trading and price manipulation, and protection of minority shareholders. Although many changes and improvements have been introduced, the Brazilian securities markets are not as highly regulated and supervised as the U.S. securities markets or markets in certain other jurisdictions.
ITEM 10. ADDITIONAL INFORMATION
A. SHARE CAPITAL
Not applicable.
B. MEMORANDUM AND ARTICLES OF ASSOCIATION
The information required for this item was included in the Registration Statement on Form 20-F dated February 3, 1999 (Commission file number 0-29956) and in the subsequent annual reports on Form 20-F dated July 14, 1999 and dated June 29, 2000 (Commission file number 1-14878) for the years ended December 31, 1998 and 1999, respectively.
C. MATERIAL CONTRACTS
Not applicable.
D. EXCHANGE CONTROLS
There are no restrictions on ownership or voting of the Company's capital stock by individuals or legal entities domiciled outside Brazil.
The right to convert dividend payments and proceeds from the sale of the Company's capital stock into foreign currency and to remit such amounts outside Brazil is subject to restrictions under foreign investment legislation which generally requires, among other things, that the relevant investment has been registered with the Central Bank.
In Brazil, there is a mechanism available to foreign investors interested in trading directly on the São Paulo Stock Exchange. Until March 2000, this mechanism was known as Annex IV Regulations, in a reference to the Annex IV of Resolution No. 1,289 of the National Monetary Council (the "Annex IV Regulations"). Currently, this mechanism is regulated by Resolution No. 2,689, of January 26, 2000, of the National Monetary Council and by Instruction No. 325, of January 27, 2000, of the CVM, as amended (the "2,689 Regulation").
The 2,689 Regulation, which became effective on March 31, 2000, sets forth new rules about foreign portfolio investments in Brazil. Foreign investments registered under Annex IV Regulations had to be conformed to the 2,689 Regulation by September 30, 2000. Such new rules allow foreign investors to invest in almost all of the financial assets and to engage in almost all transactions available in the Brazilian financial and capital markets, provided that some requirements are fulfilled. In accordance with the 2,689 Regulation, foreign investors are individuals, legal entities, mutual funds and other collective investments resident, domiciled or headquartered abroad. The 2,689 Regulation prohibits the offshore transfer or assignment of the title of the securities, except in the cases of (i) corporate reorganization effected abroad by a foreign investor or (ii) inheritance.
Pursuant to the 2,689 Regulation, foreign investors must: (i) appoint at least one representative in Brazil with powers to perform actions relating to the foreign investment; (ii) fill in the appropriate foreign investor registration form; (iii) obtain registration as a foreign investor with CVM; and (iv) register the foreign investment with the Central Bank.
The securities and other financial assets held by the foreign investor pursuant to the 2,689 Regulation must be registered or maintained in deposit accounts or under the custody of an entity duly licensed by the Central Bank or by the CVM or be registered in register, clearing and custody systems authorized by the Central Bank or by the CVM. In

53 - 53 --1
addition, securities trading is restricted to transactions carried out in exchanges or organized over-the-counter markets licensed by the CVM.
All investments made by a foreign investor under the 2,689 Regulation will be subject to an electronic registration with the Central Bank. Foreign investments registered under Annex IV Regulations had to be conformed to the new rules of capital registration by September 30, 2000.
Resolution No. 1,927 of the National Monetary Council, which is the Amended and Restated Annex V to Resolution No. 1,289 (the "Annex V Regulations"), provides for the issuance of depositary receipts in foreign markets in respect of shares of Brazilian issuers. The ADSs have been approved under the Annex V Regulations by the Central Bank and the CVM. Accordingly, the proceeds from the sale of the ADSs by ADR holders outside Brazil are free of Brazilian foreign investment controls and holders of the ADSs will be entitled to favorable tax treatment. According to the 2,689 Regulation, foreign investments registered under Annex V Regulations may be transferred to the new investment system created by Resolution No. 2,689 and vice-versa, with due regard to the conditions set forth by the Central Bank and by the CVM.
A foreign investment registration has been made in the name of The Bank of New York, as Depositary for the Preferred ADSs (the "Depositary"), and is maintained by Banco Itaú S.A. (the "Custodian") on behalf of the Depositary. Pursuant to the registration, the Custodian and the Depositary are able to convert dividends and other distributions with respect to the Preferred Shares represented by Preferred ADSs into foreign currency and remit the proceeds abroad. In the event that a holder of Preferred ADSs exchanges Preferred ADSs for Preferred Shares, such holder will be entitled to continue to rely on the Depositary's registration of foreign investment for only five business days after such exchange, following which such holder must seek to obtain its own registration with the Central Bank. Thereafter, unless the Preferred Shares are held pursuant to the 2,689 Regulation by a foreign investor, such holder may not be able to convert into foreign currency and remit outside Brazil the proceeds from the disposition of, or distributions with respect to, such Preferred Shares, and such holder generally will be subject to less favorable Brazilian tax treatment than a holder of Preferred ADSs.
Restrictions on the remittance of foreign capital abroad could hinder or prevent the Custodian, as custodian for the Preferred Shares represented by Preferred ADSs or holders who have exchanged Preferred ADSs for Preferred Shares from converting dividends, distributions or the proceeds from any sale of Preferred Shares into U.S. dollars and remitting such U.S. dollars abroad. Holders of Preferred ADSs could be adversely affected by delays in, or refusal to grant any required government approval for conversions of Brazilian currency payments and remittances abroad of the Preferred Shares underlying the Preferred ADSs.
Exchange Rates
There are two legal foreign exchange markets in Brazil, the Commercial Market and the Floating Market. The Commercial Market is reserved primarily for foreign trade transactions and transactions that generally require prior approval from Brazilian monetary authorities, such as the purchase and sale of registered investments by foreign persons and related remittances of funds abroad. Purchases of foreign exchange in the Commercial Market may be carried out only through a financial institution in Brazil authorized to buy and sell currency in that market. The Commercial Market rate is the commercial selling rate for Brazilian currency into U.S. dollars, as reported by the Central Bank. The "Floating Market rate" is the prevailing selling rate for Brazilian currency into U.S. dollars which applies to transactions to which the Commercial Market rate does not apply, as reported by the Central Bank. Prior to the implementation of the Real Plan, the Commercial Market rate and the Floating Market rate differed significantly at times. Since the introduction of the real, the two rates have not differed significantly, although there can be no assurance that there will not be significant differences between the two rates in the future. Both the Commercial Market rate and the Floating Market rate are reported by the Central Bank on a daily basis.
Both the Commercial Market rate and the Floating Market rate are freely negotiated but have suffered minor intervention by the Central Bank. After implementation of the Real Plan, the Central Bank initially allowed the real to float with minimal intervention.
On January 18, 1999, the Central Bank officially announced its new policy to allow the real’s value to be determined by the foreign exchange markets, intervening only to limit wide swings in the value of the currency. The pressure on the real during the beginning of March that same year caused the government to drop the managed band

54 - 54 --1
exchange rate system and to adopt a free floating exchange rate system. Following the adoption of this system and with the designation of a new Central Bank president, Armínio Fraga, as well as other macro-economic factors, the real has strengthened so that on December 31, 1999, the exchange rate was R$ 1.79 per US$ 1.00. Since that date it has declined against the Dollar. On December 31, 2000 the Commercial Market rate was R$ 1.9554 per U.S.$ 1.00 and on December 31, 2001, the exchange rate was R$ 2.32 per US$ 1.00. The year of 2001 was strongly influenced by the economic and political crises in Argentina. The real fluctuated heavily against the U.S. dollar. By the end of the year, however, the financial situation of Brazil as perceived by economic agents caused the Brazilian currency to recover and regain value. Since then it has fluctuated well within the ratios considered stable by the financial markets. The net devaluation in the period was of 18.67%. On April 30, 2002 the rate was R$ 2.36 per U.S.$ 1.00.
The following table sets forth information on prevailing Commercial Market rates for the periods indicated.
Exchange Rates reais per U.S.$ 1.00(1)
Year Average Price 1997 Average 1.0784 1998 Average 1.1609 1999 Average 1.8133 2000 Average 1.8293 2001 Average 2.3504
Exchange Rates Exchange Rates Reais per US$ 1.00 reais per U.S.$ 1.00(1)
Year Month Lowest Rate Highest Rate 2001 July 2.3249 2.5979 2001 August 2.4463 2.5585 2001 September 2.5590 2.8007 2001 October 2.6866 2.7828 2001 November 2.4604 2.6820 2001 December 2.2930 2.4672
Source: Economática
The Company will make any cash distributions related to the Preferred Shares in Brazilian currency. Accordingly, exchange rate fluctuations may affect the U.S. dollar amounts received by the holders of Preferred ADSs on conversion by the Depositary of such distributions into U.S. dollars for payment to holders of Preferred ADSs. Fluctuations in the exchange rate between reais and the U.S. dollar may also affect the U.S. dollar equivalent of the reais price of the Preferred Shares on the Brazilian stock exchanges.
Brazilian law provides that, whenever there is a serious imbalance in Brazil’s balance of payments or serious factors that enable it to foresee such imbalance, temporary restrictions may be imposed on remittances of foreign capital abroad. For approximately nine months in 1989 and early 1990, for example, to maintain Brazil’s foreign currency reserves, the amounts were subsequently released in accordance with Brazilian Government directives. There can be no assurance that similar measures will not be taken by the Brazilian Government in the future.
E. TAXATION
The following summary contains a description of the principal Brazilian and U.S. federal income tax consequences of the purchase, ownership and disposition of a Preferred Share and Preferred ADS, but it does not purport to be a comprehensive description of all the tax considerations that may be relevant to a decision to purchase any of such securities. In particular, this summary deals only with holders that will hold Preferred Shares or Preferred ADSs as "capital assets" within the meaning of Section 1221 of the Internal Revenue Code of 1986, as amended (the "Code"), and does not address the tax treatment of a holder that may be subject to special tax rules, such as banks, insurance companies, dealers in securities, persons that will hold Preferred Shares or Preferred ADSs in a hedging transaction or as a position in a "straddle" or "conversion transaction" for tax purposes, persons that have a "functional currency" other than the U.S. dollar, persons liable for alternative minimum tax or persons that own or are treated as owning 10% or

55 - 55 --1
more of the voting shares of the Company. Prospective purchasers of any of such securities should consult their own tax advisors as to the personal tax consequences of their investment, which may vary for investors in different tax situations.
The summary is based upon tax laws of Brazil and the United States and regulations thereunder as in effect on the date hereof, which are subject to change (possibly with retroactive effect). Although there is at present no income tax treaty between Brazil and the United States, the tax authorities of the two countries have had discussions that may culminate in such a treaty; no assurance can be given, however, as to whether or when a treaty will enter into force or how it will affect the U.S. holders or Preferred Shares of Preferred ADSs. This summary is also based upon the representations of the Depositary and on the assumption that each obligation in the Deposit Agreement relating to the Preferred ADSs and any related documents will be performed in accordance with its terms.
Brazilian Tax Considerations
The following discussion summarizes the material Brazilian tax consequences of the acquisition, ownership and disposition of Preferred Shares or Preferred ADSs by a holder that is not domiciled in Brazil for purposes of Brazilian taxation and, in the case of a holder of Preferred Shares which has registered its investment in such securities with the Central Bank as a U.S. dollar investment (in each case, a "non-Brazilian holder"). The following discussion does not specifically address all of the Brazilian tax considerations applicable to any particular non-Brazilian holder, and each non-Brazilian holder should consult his or her own tax advisor concerning the Brazilian tax consequences of an investment in any of such securities.
Taxation of Dividends.
Dividends paid with respect to income earned since January 1, 1996, including dividends paid in kind (i) to the Depositary in respect of the Preferred Shares underlying the Preferred ADSs or (ii) to a non-Brazilian holder in respect of Preferred Shares, are not subject to any withholding tax in Brazil. The current tax legislation eliminated the then existing 15% withholding tax on dividends paid to companies, resident individuals or non-residents in Brazil. Accordingly, dividends with respect to profits generated on or after January 1, 1996 are not subject to withholding tax in Brazil. Dividends related to profits generated prior to December 31, 1993 will be subject to Brazilian withholding tax of 25%. Dividends related to profits generated between January 1, 1994 and December 31, 1995 will be subject to Brazilian withholding tax of 15%.
Taxation of Gains.
Gains realized outside Brazil by a non-Brazilian holder on the disposition of Preferred ADSs to another non-Brazilian holder are not subject to Brazilian tax.
The withdrawal of Preferred Shares in exchange for Preferred ADSs is not subject to Brazilian tax. The deposit of Preferred Shares in exchange for Preferred ADSs is not subject to Brazilian tax provided that the Preferred Shares are registered by the investor or its agent under the 2,689 Regulation. In the event the Preferred Shares are not so registered, the deposit of Preferred Shares in exchange for Preferred ADSs may be subject to Brazilian tax at the rate of 15%. On receipt of the underlying Preferred Shares, a non-Brazilian holder who qualifies under the 2,689 Regulation will be entitled to register the U.S. dollar value of such shares with the Central Bank as described below.
Non-Brazilian holders are not subject to tax in Brazil on gains realized on sales of Preferred Shares that occur abroad or on the proceeds of a redemption of, or a liquidating distribution with respect to, Preferred Shares. When the Preferred Shares are registered under the 2,689 Regulation, the non-Brazilian holder cannot transfer or assign them abroad. As a general rule, non-Brazilian holders are subject to a withholding tax imposed at a rate of 15% on gains realized on sales or exchanges of Preferred Shares that occur in Brazil to or with a resident of Brazil, outside of the São Paulo Stock Exchange. Non-Brazilian holders are subject to withholding tax at the rate of 10% on gains realized on sales or exchanges in Brazil of Preferred Shares that occur on the São Paulo Stock Exchange unless such sale is made under the 2,689 Regulation. Gains realized arising from transactions on the São Paulo Stock Exchange by an investor under the 2,689 Regulation are not subject to tax (except as described below). The "gain realized" as a result of a transaction on the São Paulo Stock Exchange is the difference between the amount in Brazilian currency realized on the sale or exchange and the acquisition cost measured in Brazilian currency, without any correction for inflation, of the shares sold. The "gain realized" as a result of a transaction that occurs other than on the São Paulo Stock Exchange will be the positive difference between the amount realized on the sale or exchange and the acquisition cost of the Preferred Shares, both such

56 - 56 --1
values to be taken into account in reais. There are grounds, however, to hold that the "gain realized" should be calculated based on the foreign currency amount registered with the Central Bank. There can be no assurance that the current preferential treatment for holders of Preferred ADSs and for certain non-Brazilian holders of Preferred Shares under the 2,689 Regulation will continue in the future or that such treatment will not be changed in the future.
As of January 1, 2000, the preferential treatment under the 2,689 Regulation is no longer applicable if the non-Brazilian holder of the Preferred ADSs or Preferred shares is resident of a tax haven – i.e., countries which do not impose income tax or where such tax is imposed at a rate lower than 20% - in accordance with Law No. 9,959, of January 27, 2000. In other words, gains realized by such holder on the sale or exchange in Brazil that occur in the spot market of shares traded on a Brazilian stock exchange will be taxed at a rate of 10% (to be increased to 20% as of January 1, 2002, in accordance with the same Law). Law 9,959 also provides that such rate of 10% on gains realized on the sale or exchange in Brazil of Preferred Shares, that occur on the São Paulo Stock Exchange, will be increased to 20% for transactions carried out on or after January 1, 2002.
Any exercise of preemptive rights relating to the Preferred Shares will not be subject to Brazilian taxation. Any gain on the sale or assignment of preemptive rights relating to the Preferred Shares by the Depositary on behalf of holders of Preferred ADSs will be subject to Brazilian income taxation at the rate of 15%, unless such sale or assignment is performed within the São Paulo Stock Exchange, in which the gains are exempt from withholding income tax .
Any gain on the sale or assignment of preemptive rights relating to Preferred Shares, will be subject to Brazilian income tax at the same rate applicable to the sale or disposition of Preferred Shares. The maximum rate of such tax is currently 15%.
Interest on Net Worth.
Distributions of interest on net worth in respect of the Preferred Shares as an alternative form of payment to shareholders who are either Brazilian residents or non-Brazilian residents, including holders of ADSs, are subject to Brazilian withholding tax at the rate of 15%. In the case of non-Brazilian residents that are residents of a tax haven , the income tax rate is 25%. Since 1996, such payments have been tax deductible by the Company. Since 1997, the payments have also been deductible in determining social welfare contributions and income tax by the Company as long as the payment of a distribution of interest is approved at the Company's General Meeting. The distribution of interest on shareholders' equity may be determined by the Board of Directors of the Company alone. No assurance can be given that the Board of Directors of the Company will not determine that future distributions of profits be made by means of interest on shareholders' equity instead of by means of dividends.
Other Brazilian Taxes.
There are no Brazilian inheritance, gift or succession taxes applicable to the ownership, transfer or disposition of Preferred Shares or Preferred ADSs by a non-Brazilian holder except for gift and inheritance taxes which are levied by some states of Brazil on gifts made or inheritances bestowed by individuals or entities not resident or domiciled in Brazil or domiciled within the state to individuals or entities resident or domiciled within such state in Brazil. There are no Brazilian stamp, issue, registration or similar taxes or duties payable by holders of Preferred Shares or Preferred ADSs.
Pursuant to Decree 2,219 of May 2, 1997, and Ordinance no. 5 of January 21, 1999, issued by Ministry of Finance, the amount in reais resulting from the conversion of the proceeds received by a Brazilian entity from a foreign investme nt in the Brazilian securities market (including those in connection with the investment in the Preferred Shares or Preferred ADSs and those made under the 2,689 Regulation) is subject to a transaction tax ("IOF"), although at present the rate of such tax is 0%. The Minister of Finance is empowered to establish the applicable IOF tax rate. Under Law 8,894 of June 21, 1994, such IOF tax rate may be increased at any time to a maximum of 25%, but any such increase will only be applicable to transactions occurring after such increase becomes effective.
Pursuant to Law 9,311 of October 24, 1996, the Contribuição Provisória sobre Movimentação Financeira (the "CPMF tax") was levied at a rate of 0.2% on all fund transfers in connection with financial transactions in Brazil. Pursuant to Law 9,539, the CPMF tax is payable until February 1999. Pursuant to Constitutional Amendment 21, of March 18, 1999, the collection of the CPMF was extended for an additional period of 36 months. This payment of the CPMF tax was required as of June 17, 1999. The CPMF tax rate was 0.38% during the first 12 months, and would be 0.30% for the remaining period. But in December 2000, Constitutional Amendment 31 increased the rate to 0.38% as of

57 - 57 --1
March 2001. Although the CPMF tax is set to expire on June 16, 2002, the Brazilian Congress is discussing the possibility of converting this tax into a permanent tax. The responsibility for the collection of the CPMF tax is borne by the financial institution that carries out the relevant financial transaction. Additionally, when the non-Brazilian holder remits the proceeds from the sale or assignment of Preferred Shares by means of a foreign exchange transaction, the CPMF tax will be levied on the amount to be remitted abroad in Brazilian reais. If it is necessary to perform any exchange transaction in connection with Preferred ADSs or Preferred Shares, it will bear the CPMF tax.
Registered Capital .
The amount of an investment in Preferred Shares held by a non-Brazilian holder registered with the CVM under the 2,689 Regulation, or in ADSs held by the Depositary representing such holder, as the case may be, is eligible for registration with the Central Bank; such registration (the amount so registered is referred to as "Registered Capital") allows the remittance abroad of foreign currency, converted at the Commercial Market rate, acquired with the proceeds of distributions on, and amounts realized with respect to disposition of, such Preferred Shares. The Registered Capital for Preferred Shares purchased in the form of a Preferred ADS, or purchased in Brazil and deposited with the Depositary in exchange for a Preferred ADS, will be equal to their purchase price (in U.S. dollars) paid by the purchaser. The Registered Capital for Preferred Shares that are withdrawn upon surrender of Preferred ADSs, will be the U.S. dollar equivalent of (i) the average price of the Preferred Shares on the São Paulo Stock Exchange on the day of withdrawal, or (ii) if no Preferred Shares were sold on such day, the average price of Preferred Shares that were sold in the fifteen trading sessions immediately preceding such withdrawal. The U.S. dollar value of the Preferred Shares is determined on the basis of the average Commercial Market rates quoted by the Central Bank on such date (or, if the average price of Preferred Shares is determined under clause (ii) of the preceding sentence, the average of such average quoted rates on the same fifteen dates used to determine the average price of the Preferred Shares).
A non-Brazilian holder of Preferred Shares may experience delays in effecting the registration of Registered Capital, which may delay remittances abroad. Such a delay may adversely affect the amount, in U.S. dollars, received by the non-Brazilian holder.
U.S. Federal Income Tax Considerations
As used below, a "U.S. holder" is a holder of a Preferred Share or Preferred ADS that is, for U.S. federal income tax purposes, (i) an individual citizen or resident of the United States, (ii) a corporation organized under the laws of the United States, any State thereof or the District of Columbia, or (iii) any other person or entity that is subject to U.S. federal income tax on a net income basis in respect of the Preferred Shares or Preferred ADSs (including a nonresident alien individual or foreign corporation whose income with respect to a Preferred Share or Preferred ADS is effectively connected with the conduct of a U.S. trade or business). The following discussion assumes that the Preferred Shares and Preferred ADSs are held as capital assets.
In general, for U.S. federal income tax purposes, a holder of an American Depository Receipt ("ADR") evidencing an ADS will be treated as the beneficial owner of the Preferred Share(s) represented by the applicable ADS.
Taxation of Dividends.
In general, a distribution made with respect to a Preferred Share or Preferred ADS (which for this purpose will include distributions of interest on equity) will, to the extent made from the current or accumulated earnings and profits of the Company, as determined under U.S. federal income tax principles, constitute a dividend for U.S. federal income tax purposes. If a distribution exceeds the amount of the Company's current and accumulated earnings and profits, it will be treated as a non-taxable return of capital to the extent of the U.S. holder's tax basis in the Preferred Share or Preferred ADS on which it is paid and thereafter as capital gain. As discussed below, the term "dividend" means a distribution that constitutes a dividend for U.S. federal income tax purposes.
The gross amount of any dividend paid (which will include any amounts withheld in respect of Brazilian taxes) with respect to a Preferred Share or Preferred ADS will be subject to U.S. federal income taxation as foreign source dividend income and will not be eligible for the dividends received deduction generally allowed to U.S. corporations. A dividend paid in Brazilian currency will be includible in the income of a U.S. holder at its value in U.S. dollars calculated by reference to the prevailing spot market exchange rate in effect on the day it is received by the U.S. holder or, in the case of a dividend received in respect of Preferred ADSs, on the date the dividend is received by the Depositary, whether

58 - 58 --1
or not the dividend is converted into U.S. dollars. Any gain or loss realized on a subsequent conversion or other disposition of the Brazilian currency will be treated as U.S. source ordinary income or loss. In the case of a U.S. holder that is not a United States person, the currency gain or loss will be U.S. source income only if the currency is held by a qualified business unit of the U.S. holder in the United States.
Subject to generally applicable limitations under U.S. federal income tax law, the Brazilian withholding tax will be treated as a foreign income tax eligible for credit against a U.S. holder's U.S. federal income tax liability. For purposes of the computation of the foreign tax credit limitation separately for specific categories of income, any dividends generally will constitute foreign source "passive income" or, in the case of certain holders, "financial services income." Alternatively, a U.S. holder may elect not to claim a credit for any of its foreign taxes and deduct all of those taxes in computing taxable income.
Taxation of Capital Gains.
A deposit or withdrawal of Preferred Shares by a holder in exchange for a Preferred ADS will not result in the realization of gain or loss for U.S. federal income tax purposes.
A U.S. holder generally will recognize capital gain or loss upon a sale or other disposition of a Preferred Share or Preferred ADS held by the U.S. holder or the Depositary in an amount equal to the difference between the U.S. holder's adjusted basis in the Preferred Share or Preferred ADS (determined in U.S. dollars) and the U.S. dollar amount realized on the sale or other disposition. If a Brazilian tax is withheld on the sale or disposition of a share, the amount realized by a U.S. holder will include the gross amount of the proceeds of that sale or disposition before deduction of the Brazilian tax. Capital gain recognized by certain non-corporate U.S. holders is taxed at a maximum tax rate of 20% in respect of property held more than one year. Capital gain, if any, realized by a U.S. holder on the sale or other disposition of a Preferred Share or Preferred ADS generally will be treated as U.S. source income for U.S. foreign tax credit purposes. Consequently, in the case of a disposition of a Preferred Share that is subject to Brazilian tax imposed on the gain (or, in the case of a deposit, in exchange for a Preferred ADS or a Preferred Share that is not registered under the 2,689 Regulation, on which a Brazilian capital gains tax is imposed) (see "-Brazilian Tax Considerations-Taxation of Gains"), the U.S. holder may not be able to use the foreign tax credit for that Brazilian tax unless it can apply the credit against U.S. tax payable on other income from foreign sources in the appropriate income category, or, alternatively, it may take a deduction for the Brazilian tax if it elects to deduct all of its foreign income taxes. In general, any loss will be sourced to the taxpayer's residence (as specially defined in Section 865(g) of the Code), subject to certain exceptions that can treat a loss recognized by a U.S. resident in whole or in part as a foreign source loss.
Passive Foreign Investment Company Rules.
Based upon the nature of its current and projected income, assets and activities, the Company does not expect the Preferred Shares or Preferred ADSs to be considered shares of a passive foreign investment company ("PFIC") for U.S. federal income tax purposes. In general, a foreign corporation is a PFIC if at least 75% of its gross income for the taxable year (or, in general, a preceding taxable year in which the taxpayer owned stock in the corporation) is passive income or if at least 50% of its assets for the current year (or, in general, a preceding year in which the taxpayer owned stock in the corporation) produce passive income or are held for the production of passive income. In general, passive income for this purpose means, with certain designated exceptions, dividends, interest, rents, royalties, annuities, get gains from dispositions of certain assets, net foreign currency gains, income equivalent to interest, income from notional principal contracts and payments in lieu of dividends. The determination of whether the Preferred Shares or Preferred ADSs constitute shares of a PFIC is a factual determination made annually, and therefore the Company's failure to constitute a PFIC at one time is subject to change. Subject to certain exceptions, once a U.S. holder's Preferred Shares or Preferred ADSs are treated as shares of a PFIC, they remain shares in a PFIC.
If the Company is treated as a PFIC, contrary to the discussion in "U.S. Federal Income Tax Considerations-Taxation of Dividends" and "-U.S. Federal Income Tax Considerations-Taxation of Capital Gains" above, a U.S. holder would be subject to special rules with respect to (i) any gain realized on the sale or other disposition of Preferred Shares or Preferred ADSs and (ii) any "excess distribution" by the Company to the U.S. holder (generally, any distribution during a taxable year in which distributions to the U.S. holder on the Preferred Shares or Preferred ADSs exceed 125% of the average annual taxable distributions the U.S. holder received on the Preferred Shares or Preferred ADSs during the proceeding three taxable years or, if shorter, the U.S. holder's holding period for the Preferred Shares or Preferred ADSs). Under those rules, (i) the gain or excess distribution would be allocated ratably over the U.S. holder's holding period for

59 - 59 --1
the Preferred Shares or Preferred ADSs, (ii) the amount allocated to the taxable year in which the gain or excess distribution is realized would be taxable as ordinary income, (iii) the amount allocated to each prior year, with certain exceptions, would be subject to tax at the highest tax rate in effect for that year and (iv) the interest charge generally applicable to underpayments of tax would be imposed in respect of the tax attributable to each prior year. A U.S. holder who owns Preferred Shares or Preferred ADSs during any year the Company is a PFIC must file Internal Revenue Service Form 8621. In general, if the Company is treated as a PFIC, the rules described in the second sentence of this paragraph can be avoided by a U.S. holder making, in the first year the U.S. holder owns Preferred Shares or Preferred ADSs while the Comp any is treated as a PFIC, an election to treat the Preferred Shares or Preferred ADSs as shares in a qualified electing fund ("QEF"). In that event, the U.S. holder must include in income each year his pro rata share of the Company's ordinary earnings and net capital gains, whether or not distributed. In general, distributions of such previously taxed income are not taxable. A U.S. holder's basis in the Preferred Shares or Preferred ADSs increases by amounts included in income pursuant to a QEF election and decreases by any nontaxable distributions. A QEF election is available only if the Company provides certain information to its shareholders, including the amount of its ordinary earnings and net capital gains computed generally in accordance with U.S. federal income tax rules, and the Company presently does not intend to make those computations or to provide that information. Alternatively, a U.S. holder may elect to be subject to a mark-to-market regime for stock in a PFIC. The mark-to-market rules, effective for taxable years of U.S. holders beginning after December 31, 1997, also would apply to the exclusion of the rules described in the second sentence of this paragraph, except generally to the extent that the Company is a PFIC at any time while a U.S. holder has owned Preferred Shares or Preferred ADSs and the U.S. holder has not made either the mark-to-market election or an election under current law to treat the Company as a QEF. Under the mark-to-market rules, a U.S. holder may elect mark-to-market treatment for its Preferred Shares or Preferred ADSs, provided the Preferred Shares or Preferred ADSs, for purposes of these rules, constitute "marketable stock" pursuant to Treasury regulations that have yet to be promulgated. A U.S. holder electing the mark-to-market regime generally would treat any gain recognized under mark-to-market treatment or on an actual sale of Preferred Shares or Preferred ADSs as ordinary income and would be allowed an ordinary deduction for any decrease in the value of Preferred Shares or Preferred ADSs in any taxable year and for any loss recognized on an actual sale, but only to the extent, in each case, of previously included mark-to-market income not offset by previously deducted decreases in value. A U.S. holder's basis in Preferred Shares or Preferred ADSs would increase or decrease by gain or loss taken into account under the mark-to-market regime. A mark-to-market election is generally irrevocable.
Information Reporting and Backup Withholding .
A U.S. holder of a Preferred Share or Preferred ADS will generally be subject to information reporting to the U.S. Internal Revenue Service ("IRS") and to "backup withholding" at the rate of 31% with respect to dividends paid on or the proceeds of a sale or other disposit ion of a Preferred Share or Preferred ADS paid within the United States, or through certain U.S. related financial intermediaries unless such holder (i) is a corporation or comes within certain other exempt categories, and demonstrates this fact when so required, or (ii) provides a correct taxpayer identification number, certifies that it is not subject to backup withholding, and otherwise complies with applicable requirements of the backup withholding rules. Any amount withheld under these rules will be creditable against the holder's U.S. federal income tax liability, and a U.S. holder may obtain a refund of any excess amounts withheld by filing the appropriate claim for refund with the IRS. While holders that are not U.S. holders generally are exempt from backup withholding and information reporting on payments made within the United States, a holder that is not a U.S. holder may be required to comply with applicable certification procedures to establish that it is not a U.S. person in order to avoid the application of U.S. information reporting requirements and backup withholding.
F. DIVIDENDS AND PAYING AGENTS
Not applicable.
G. STATEMENT BY EXPERTS
Not applicable
H. DOCUMENTS ON DISPLAY
All the documentation concerning the Company may be found and inspected at the Company’s headquarters, at 1811 Farrapos Av., Porto Alegre, Rio Grande do Sul, Brazil.

60 - 60 --1
I. SUBSIDIARY INFORMATION
Not applicable.
ITEM 11. QUANTITATIVE AND QUALITATIVE DISCLOSURES ABOUT MARKET RISKS
The Company does have some exposure to market risks related but not limited to exchange rate (Brazilian reais, Canadian dollars vis -à-vis the U.S. dollar) indexed assets, and interest rate-based financial instruments. During the year of 2001, the fluctuation in the exchange rate of the real versus the U.S. dollar devalued 18.67% (the U.S. dollar rate for reais on December 31, 2000 was R$ 1.9554 per US$ 1.00 and on December 31, 2001 the rate was R$ 2.3204 per US$ 1.00). The Company’s market risk exposure comes mainly from its financing contracts. Furthermore, currency devaluation (exchange rate risk), increases in inflation and interest rates can impact on the Company’s financing capabilities and its cash flow.
The Company has a Eurobond, issued on May 24, 1996 for a total of US$ 130 million and it will mature in May 24, 2004. This bond is fully protected against any currency variations of the US$ against the real. Besides the Eurobond operation, other derivatives hedges were entered into during 2001 and at December 31, 2001 the total amount outstanding was US$ 225.6 million (See Item 5, Indebtedness and Financial Strategy). Gerdau S.A. does not rely on imported raw materials and for this reason does not need to protect itself against international prices for its inputs. The company’s raw material are mostly produced locally (steel scrap and pig iron) and these items do not fluctuate in line with international prices.
The Company maintains assets denominated in reais and, to a lesser extent, in U.S. and Canadian dollars, Chilean, Uruguayan and Argentine pesos, and it regularly experiences gains and losses due to exchange movements between such currencies and the U.S. dollar. At the same time, the Company has loans contracted in Brazil and indexed to the U.S. dollar and to other currencies, which also suffer the impact of the exchange rates between these currencies and the real. As a result, the Company may be exposed to significant exchange losses from further devaluation of the Brazilian real and/or other currencies against the U.S. dollar. The Company’s net sales, gross profit and operating margins may also be influenced by changes in exchange rates. The Company’s sales denominated in the currencies of Brazil, Canada, Uruguay, Chile, Argentina and the United States represented 63.6%, 8.9%, 0.7%, 2.7%, 0.6% and 23.5%, respectively, of the Company’s consolidated gross sales for the year ended December 31, 2001. Because the Company’s U.S. GAAP financial statements are denominated in U.S. dollars, net sales and other financial statement accounts (including net income) could be adversely affected by a devaluation of a local currency relative to the U.S. dollar.
Intending to minimize the effect of exchange rate variations on its liabilities, the Company has entered into swap transactions, which were translated into Brazilian reais on the contract date, and are linked to CDI (Interbank deposit rates). Swap contracts are as follows:
Company and consolidated
Contract date Description Amount (US$000)
In proportion to CDI - % Maturity
02.12.2001 Eurobonds 50,000 84.5 05.20.2004 02.12.2001 Eurobonds 50,000 87.0 05.20.2004 07.18.2001 Eurobonds 30,000 103.7 05.20.2004 03.30.2001 Imports 9,515 100.0 10.04.2004 10.04.2001 Imports 32,556 100.0 06.25.2002 12.05.2001 Imports 12,559 100.0 12.23.2002 07.16.2001 Prepayment 30,710 80.3 03.01.2006 07.18.2001 Prepayment 10,236 92.8 03.01.2006
On December 31, 2001, the level of indebtedness of the Company including contracts for funding in local and foreign currencies and debentures less cash and cash equivalents was less than its net worth (net debt to equity ratio of 91%). Debt maturities are as follows:

61 - 61 --1
2002 2003 2004 2005 2006 2007 thereafter TOTALLIABILITIES
Denominated in Brazilian currency (reais)
BNDES 45,714 36,907 28,640 24,073 21,288 6,751 24,649 187,549 Average interest rate TJLP + TJLP + TJLP + TJLP + TJLP + TJLP + T JLP + 3.00% 3.00% 3.00% 3.00% 3.00% 3.00% 3.00% Debentures 2,018 13,156 81,047 96,222 Average interest rate CDI CDI CDI Parent company 461 461Average interest rate 22.87%
Denominated in U.S. dollars Eurobonds 1,848 92,303 94,151 Average interest rate 11.125% 11.125% Import financing 68,346 38,726 15,087 237 122,395 Average interest rate LIBOR + LIBOR + LIBOR + LIBOR + 2.36% 2.36% 2.36% 2.36% Export financing 25,224 17,985 18,108 8,051 1,087 70,456 Average interest rate LIBOR + LIBOR + 6.821% 6.821% 6.821% 6.821% 6.821% Pre-export financing 5,493 5,493 Average interest rate LIBOR + 3.72% Companies abroad 404,057 78,438 84,599 106,979 26,729 701,275 Average interest rate LIBOR + LIBOR + LIBOR + LIBOR + LIBOR + 2.50% 2.50% 2.50% 2.50% 2.50%
Denominated in Cdn$ dollars Machinery and other financing 16,809 16,809 Average interest rate LIBOR + 2.50% TOTAL 569,509 172,056 238,737 152,496 49,104 6,751 106,157 1,294,810 ASSETS Denominated in Brazilian currency (reais) Cash 340 340 Investments 76,378 76,378 Average interest rate CDI Denominated in U.S. dollars Cash 27,492 27,492 Investments 229,687 229,687 Average interest rate 3.50%
Protectionist Measures
The measures imposed by the U.S. Administration and by the European Union to protect their domestic markets against the import of certain cheap steel products, do not directly impact the operations of Gerdau in Brazil due to the fact that exports to these countries are negligible Gerdau units in the U.S. operate independently and do not require any type of steel inputs out of Brazil.
Argentine Crisis

62 - 62 --1
Due to the economic crisis in Argentina, long steel demand in that country was reduced by roughly 50% as of the second half of 2001. The impact of this crisis on the Company’s activity level is limited because the Argentine operations represent less than 2% of Gerdau’s total sales. With a view to adapting to the new economic reality, Gerdau has: i) adjusted its production to the local demand, ii) restricted credit, and iii) promoted a financial and corporate restructuring.
The restructuring occurred in March 2002, as follows: Gerdau transferred its 71.77% stake in Sociedad Industrial Puntana S.A. – SIPSA to its partner Sipar Aceros S.A.. Gerdau maintains its stake of 38.18% in Sipar, and Sipsa becomes an integral subsidiary of Sipar. This new structure further reduced Gerdau’s exposure to the eventual impact of any additional currency devaluation in Argentina and is expected to allow for better synergies between the two companies.
The significant devaluation of the Argentine peso vis -à-vis the US dollar generated a loss of US$ 21.4 million in Gerdau's business in the last quarter of 2001; in the first quarter of 2002, there was an additional loss of US$ 7.0 million. Moreover, the restructuring promoted in March generated a US$ 1.8 million loss.
ITEM 12. DESCRIPTION OF SECURITIES OTHER THAN EQUITY SECURITIES
Not applicable.
ITEM 13. DEFAULTS, DIVIDEND ARREARAGES AND DELIQUENCIES
Not applicable.

63 - 63 --1
PART II
ITEM 14. MATERIAL MODIFICATIONS TO THE RIGHTS OF SECURITY HOLDERS AND USE OF
PROCEEDS Not applicable.
ITEM 15. Not applicable. ITEM 16. Not applicable.

64 - 64 --1
PART III ITEM 17. FINANCIAL STATEMENTS The Company has responded to Item 18 in lieu of responding to this item. ITEM 18. FINANCIAL STATEMENTS Reference is made to Item 19 for a list of all financial statements filed as part of this Annual Report. ITEM 19. FINANCIAL STATEMENTS AND EXHIBITS (a) Financial Statements for the years ended December 31, 2001, 2000 and 1999 Page
Report of Independent Public Accountants F-1
Consolidated Balance Sheets as of December 31, 2001 and 2000 F-2
Consolidated Statements of Income for the years ended December 31, 2001, 2000 and 1999
F-4 Consolidated Statement of Changes in Shareholders’ Equity for the years ended December 31, 2001, 2000 and 1999
F-5
Consolidated Statement of Cash Flows for the years ended December 31, 2001, 2000 and 1999
F-6 Notes to Consolidated and Combined Financial Statements F-8
(b) List of Exhibits None.

65 - 65 --1
SIGNATURES
The registrant hereby certifies that it meets all of the requirements for filing on Form 20-F and that it has duly caused and authorized the undersigned to sign this annual report on its behalf. GERDAU S.A. By: /s/ Frederico C. Gerdau Johannpeter Name: Frederico C. Gerdau Johannpeter Title : Vice President By: /s/ Osvaldo Burgos Schirmer Name: Osvaldo Burgos Schirmer Dated: April 30th , 2002 Title: Chief Financial Officer

F – 1
REPORT OF INDEPENDENT PUBLIC ACCOUNTANTS
To the Board of Directors and Shareholders of Gerdau S.A.:
We have audited the accompanying consolidated balance sheets of Gerdau S.A. and its subsidiaries, translated into U.S.
dollars, as of December 31, 2001 and 2000, and the related translated consolidated statements of income, changes in
shareholders’ equity and cash flows for each of the three years in the period ended December 31, 2001. These
consolidated financial statements are the responsibility of the Company’s management. Our responsibility is to express an
opinion on these financial statements based on our audits.
We conducted our audits in accordance with auditing standards generally accepted in the United States of America. Those
standards require that we plan and perform the audits to obtain reasonable assurance about whether the financial
statements are free of material misstatement. An audit includes examining, on a test basis, evidence supporting the
amounts and disclosures in the financial statements. An audit also includes assessing the accounting principles used and
significant estimates made by management, as well as evaluating the overall financial statements presentation. We believe
that our audits provide a reasonable basis for our opinion.
In our opinion, the translated financial statements referred to above present fairly, in all material respects, the financial
position of Gerdau S.A. and subsidiaries as of December 31, 2001 and 2000, and the results of their operations and their
cash flows for each of the three years in the period ended December 31, 2001, in conformity with accounting principles
generally accepted in the United States of America.
Arthur Andersen S/C
Porto Alegre, Brazil
January 28, 2002 except with respect to the matters discussed in Note 24, as to which the date is March 28, 2002
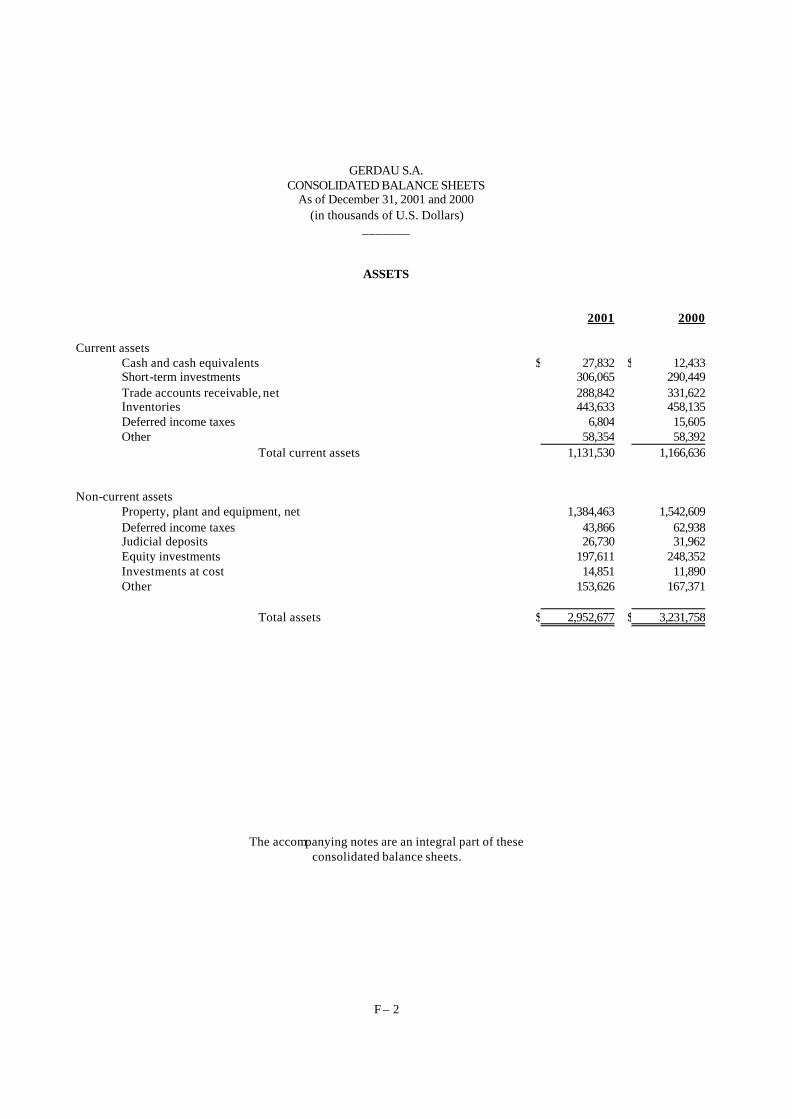
F – 2
GERDAU S.A. CONSOLIDATED BALANCE SHEETS
As of December 31, 2001 and 2000 (in thousands of U.S. Dollars)
_______
ASSETS
2001 2000 Current assets
Cash and cash equivalents $ 27,832 $ 12,433Short-term investments 306,065 290,449Trade accounts receivable, net 288,842 331,622Inventories 443,633 458,135Deferred income taxes 6,804 15,605Other 58,354 58,392
Total current assets 1,131,530 1,166,636 Non-current assets
Property, plant and equipment, net 1,384,463 1,542,609Deferred income taxes 43,866 62,938Judicial deposits 26,730 31,962Equity investments 197,611 248,352Investments at cost 14,851 11,890Other 153,626 167,371
Total assets $ 2,952,677 $ 3,231,758
The accompanying notes are an integral part of these consolidated balance sheets.

F – 3
GERDAU S.A. CONSOLIDATED BALANCE SHEETS
As of December 31, 2001 and 2000 (in thousands of U.S. Dollars)
_______
LIABILITIES
2001 2000 Current liabilities
Short-term debt $ 371,339 $ 372,050Current portion of long-term debt 196,152 316,536Debentures 2,018 2,413Trade accounts payable 137,397 139,945Income taxes payable 12,787 608Deferred income taxes 2,872 6,651Payroll and related liabilities 32,504 40,201Dividends (interest on equity) payable 44,957 38,546Taxes payable, other than income taxes 24,413 29,047Other 56,455 24,043
Total current liabilities 880,894 970,040 Non-current liabilities
Long-term debt, less current portion 630,636 717,830Debentures 94,204 113,349Long-term debt, parent company 461 77Deferred income taxes 151,257 144,495Accrued pension liability 47,158 40,806Reserve for contingencies 55,170 70,395Other 27,780 66,824
Total non-current liabilities 1,006,666 1,153,776 Total liabilities 1,887,560 2,123,816 Minority interest 32,397 42,283 SHAREHOLDERS' EQUITY (Note 13) Preferred shares - no par value
74,109,685,986 shares issued and outstanding 558,971 558,971Common shares - no par value
39,382,020,386 shares issued and outstanding 279,243 279,243Legal reserve 56,074 46,075Retained earnings 762,494 676,037Cumulative other comprehensive loss (624,062) (494,667) Total shareholders' equity 1,032,720 1,065,659 Total liabilities and shareholders' equity $ 2,952,677 $ 3,231,758
The accompanying notes are an integral part of these consolidated balance sheets.

F – 4
GERDAU S.A. CONSOLIDATED STATEMENTS OF INCOME
for the years ended December 31, 2001, 2000 and 1999 (in thousands of U.S. Dollars, except per share amounts)
_______ 2001 2000 1999 Sales $ 2,751,872 $ 3,162,537 $ 2,056,171
Less: federal and state excise taxes (311,223) (349,949) (282,308)Less: freight and discounts (120,119) (135,874) (52,875)
Net sales 2,320,530 2,676,714 1,720,988
Cost of sales (1,641,620) (1,964,353) (1,101,371) Gross profit 678,910 712,361 619,617
Sales and marketing expenses (105,801) (112,195) (86,007)General and administrative expenses (181,108) (213,143) (157,755)
Operating income 392,001 387,023 375,855
Interest expense (166,496) (193,172) (80,478)Exchange loss (71,773) (50,305) (141,936)Interest income 55,002 57,324 64,166Equity pickup on non-consolidated companies 18,324 33,962 (4,903)Other non-operating income (expense) (7,853) 2,165 5,196
Income before income taxes and minority interest 219,205 236,997 217,900 Provision for income taxes (Note 14):
Current (40,981) (36,725) (17,456)Deferred (13,666) (8,899) (3,080)
(54,647) (45,624) (20,536) Income before minority interest 164,558 191,373 197,364 Minority interest 2,795 (2,815) 328 Net income 167,353 188,558 197,692 Net income available to Common and Preferred shareholders
$ 167,353 $ 188,558 $ 197,692 Per share data Basic earnings per 1,000 shares
Common $ 1.38 $ 1.56 $ 1.65Preferred $ 1.52 $ 1.72 $ 1.79
Diluted earnings per 1,000 shares
Common $ 1.38 $ 1.55 $ 1.65Preferred $ 1.52 $ 1.70 $ 1.78
Number of Common shares outstanding 39,382,020,386 39,382,020,386 39,382,020,386 Number of Preferred shares outstanding 74,109,685,986 74,109,685,986 74,109,685,986
The accompanying notes are an integral part of these consolidated financial statements.

F – 5
GERDAU S.A. CONSOLIDATED STATEMENTS OF CHANGES IN SHAREHOLDERS’ EQUITY
for the years ended December 31, 2001, 2000 and 1999 (in thousands of U.S. Dollars, except share data)
Common
Stock
Preferred
Stock
Legal
Reserve
Retained Earnings
Cumulative Other
comprehensive loss
Treasury
Stock
Total
Balances as of January 1, 1999 $ 277,580 $ 558,971 $ 27,831 $ 444,873 $ (101,072) $ (2,858) $ 1,205,325Net income available to Common and Preferred shareholders - - - 197,692 - - 197,692Translation adjustments - - - - (313,938) - (313,938)Treasury stock sold - - - - - 2,858 2,858Gain on treasury stock sold - - - 1,680 - - 1,680Dividends (interest on equity) - $1.20 per 1,000 Common shares and $1.27 per 1,000 Preferred shares
- - - (70,873) - - (70,873)
Transfer to legal reserve - - 9,859 (9,859) - - - Balances as of December 31, 1999 $ 277,580 $ 558,971 $ 37,690 $ 563,513 $ (415,010) $ - $ 1,022,744Capital increase with use of reserves 1,663 - (1,663) - - - - Net income available to Common and Preferred shareholders - - - 188,558 - - 188,558Translation adjustments - - - - (79,657) - (79,657)Dividends (interest on equity) - $0.55 per 1,000 Common shares and $0.60 per 1,000 Preferred shares
- - - (65,986) - - (65,986)
Transfer to legal reserve - - 10,048 (10,048) - - -
Balances as of December 31, 2000 $ 279,243 $ 558,971 $ 46,075 $ 676,037 $ (494,667) $ - $ 1,065,659Net income available to Common and Preferred shareholders - - - 167,353 - - 167,353Translation adjustments - - - - (191,243) - (191,243)
Exchange effects on equity - - - - 61,848 - 61,848Dividends (interest on equity) - $0.58 per 1,000 Common shares and $0.65 per 1,000 Preferred shares
-
-
-
(70,897)
-
- (70,897)
Transfer to legal reserve - - 9,999 (9,999) - - - Balances as of December 31, 2001 $ 279,243 $ 558,971 $ 56,074 $ 762,494 $ (624,062) $ - $ 1,032,720
The accompanying notes are an integral part of these consolidated financial statements.

F – 6
GERDAU S.A. CONSOLIDATED STATEMENTS OF CASH FLOWS for the years ended December 31, 2001, 2000 and 1999
(in thousands of U.S. Dollars) ____
2001 2000 1999
Cash flows from operating activities
Net income $ 167,353 $ 188,558 $ 197,692Adjustments to reconcile net income to cash flows from operating activities:
Depreciation and amortization 135,878 140,912 82,863Equity pickup (18,324) (33,962) 4,903Exchange loss on long-term debt 71,773 50,305 141,936Minority interest (2,795) 2,815 (328)Deferred income taxes 28,434 15,206 28,278Loss on dispositions of property, plant and equipment 10,395 2,165 6,285Provision for doubtful accounts 6,743 10,820 2,775Reserve for contingencies (22,859) (9,595) 9,100Non cash financial revenue (10,107) - -Gain on sale of short-term investments (2,210) (26,602) (22,908)
Changes in assets and liabilities:
Increase in accounts receivable (16,948) (62,738) (58,852)Increase in inventories (57,563) (41,668) (104,612)(Increase) decrease in judicial deposits 204 (6,340) (3,802)Increase in accounts payable and accrued liabilities 66,496 826 77,838(Increase) decrease in other current assets (12,521) (6,295) 7,503Increase in other non-current assets (12,583) (15,736) (124,201)Increase in other current and non-current liabilities (18,997) 16,820 55,946
Net cash provided by operating activities 312,369 225,491 300,416 Cash flows from investing activities
Additions to property, plant and equipment (244,021) (264,799) (433,431)Proceeds from dispositions of property, plant and equipment 11,482 13,625 9,700Acquisition of investments at cost, net of cash acquired of $ 6,960 15,385 (32,259) (344,534)Purchases of short-term investments (282,967) (335,787) (366,170)Proceeds from maturities and sales of short-term investments 223,874 405,414 253,577Translation 136,134 (16,838) 40,462
Net cash used in investing activities (140,113) (230,644) (840,396)

F – 7
GERDAU S.A. CONSOLIDATED STATEMENTS OF CASH FLOWS
for years ended December 31, 2001, 2000 and 1999 (in thousands of U.S. Dollars)
____
2001 2000 1999 Cash flows from financing activities
Cash dividends (interest on equity) paid $ (70,897) $ (65,986) $ (37,386)Sale (purchase) of treasury stock - - 4,538Receipts of short-term debt 110,508 163,777 516,864Payments of short-term debt (121,270) (74,957) (56,821)Proceeds from long-term debt 242,599 257,992 294,295Repayment of long-term debt (315,352) (273,407) (178,516)
Net cash provided by (used in) financing activities (154,412) 7,419 542,974 Increase (decrease) in cash 17,844 2,266 2,994Effect of exchange rate changes on cash (2,445) 597 (4,362)Cash at beginning of year 12,433 9,570 10,938Cash at end of year $ 27,832 $ 12,433 $ 9,570 Supplemental cash flow data Cash paid during the year for:
Interest (net of amounts capitalized) $ 83,258 $ 137,592 $ 267,445Income taxes 11,890 25,916 15,599
The accompanying notes are an integral part of these
consolidated financial statements.

F – 1
1 Nature of operations
Gerdau S.A. is a sociedade anônima incorporated as a limited liability company under the laws of the
Federative Republic of Brazil. The principal business of Gerdau S.A. (“Gerdau”) and its subsidiaries in
Uruguay, Chile, Canada, Argentina and the United States (collectively the “Company”) comprise the
production of crude steel and related long rolled products, drawn products and long specialty products. The
Company produces steel based on the mini-mill concept, whereby steel is produced in electric arc furnaces,
starting with scrap and pig iron acquired mainly in the region where each mill operates. Gerdau also operates
plants capable of producing steel starting with iron ore in blast furnaces and through the direct reduction
process.
The main markets in which the Company operates are the civil construction, manufacturing, agriculture and
cattle raising sectors, the first two of which represented approximately 94% of the total sales volume of the
Company measured in tons in 2001 (unaudited). These markets are located in Brazil, United States, Canada
and Chile and, to a lesser extent, Uruguay and Argentina.
2 Basis of presentation
The principal accounting policies followed by the Company in the preparation of these financial statements
are summarized below:
2.1 Statutory records
The accompanying consolidated financial statements have been prepared in accordance with generally
accepted accounting principles in the United States (“U.S. GAAP”), which differ in certain aspects from
generally accepted accounting principles in Brazil (“Brazilian GAAP”) and applied by the Company in the
preparation of its statutory financial statements and for other purposes.
Shareholders' equity and results of operations included in these financial statements differ from those
included in the statutory accounting records as a result of (i) the effects of differences between the rate of
devaluation of the Brazilian real against the United States Dollar (“U.S. dollar” or “U.S. $”) and the indices
F – 2
mandated for indexation of statutory financial statements through December 1995, and (ii) differences in the
methods of measuring amounts under U.S. GAAP and Brazilian GAAP.
2.2 Currency remeasurement
The Company, which transacts the majority of its business in Brazilian reais, and, to a lesser extent, in U.S.
dollars, Canadian dollars and Chilean pesos, has selected the United States dollar as its reporting currency.
The U.S. dollar amounts for all periods presented have been remeasured/translated following the guidelines
established in Statement of Financial Accounting Standards (“SFAS”) No. 52, “Foreign Currency
Translation” on the basis of audited financial statements expressed in the local currency of each of the
countries.
The Company’s main operations are located in Brazil, where, as well as for the subsidiaries in Chile, Canada
and Argentina, the local currency is the functional currency. In these cases, the current rate method of
translation has been used. This method involves the translation of assets and liabilities at the exchange rate in
effect at the end of each period. Average exchange rates have been applied for the translation of the accounts
that make up the results of the periods. Translation adjustments are recorded directly in shareholders’ equity.
Gains and losses on foreign currency denominated transactions are included in the consolidated statements of
income.
Due to the economic crisis in Argentina, the long steel demand in that country was reduced by roughly 50%
during the second half of 2001. The impact of this crisis on the Group’s activity level is limited because the
Argentine operations represent less than 2% of the Gerdau’s total sales. For translation purposes Argentine
financial statements were converted using the exchange rate of $1.70 Argentine Peso to US$ 1.00.
2.3 Interest of Parent Company
As of December 31, 2001, the Company’s parent, Metalúrgica Gerdau S.A. (“MG”, collectively with its
subsidiaries and affiliates, the “Conglomerate”) owned 47.33% of the total capital of the Company. MG’s
share ownership consisted of 82.98% of the Company’s common shares and 28.39% of its non-voting
preferred shares.
3 Significant accounting policies

F – 3
The following is a summary of the significant accounting policies followed by the Company in the
preparation of the consolidated financial statements.
3.1 Consolidation
The accompanying consolidated financial statements include the accounts of the Company and its majority-
owned subsidiaries, as follows (ownership percentages as of December 31, 2001):
Percentage ownership Seiva S.A. – Florestas e Indústrias 96 Gerdau GTL Spain S. L. 100 Armafer Serviços de Construção Ltda. 100 Gerdau Laisa S.A. 99 Gerdau Aza S.A. 99 Gerdau MRM Steel Inc. 100 Gerdau Courtice Steel Inc. 100 Ameristeel Corporation 85
All significant intercompany balances and transactions have been eliminated in consolidation.
3.2 Use of estimates
The preparation of financial statements in accordance with generally accepted accounting principles requires
management to make estimates and assumptions that affect the reported amounts of assets and liabilities and
disclosures of contingent assets and liabilities as of the dates of the financial statements and the reported
amounts of revenues and expenses during the reporting periods. Estimates are used when accounting for the
allowance for doubtful accounts, depreciation, long-lived assets, income taxes and contingencies. Actual
results could differ from those estimates.
3.3 Cash equivalents
Cash equivalents are considered to be all highly liquid temporary cash investments with original maturity
dates of three months or less.
3.4 Short-term investments
Short-term investments consist of bank certificates of deposit and investments held in a related-party fund for

F – 4
the exclusive use of the Company (see Note 7). These certificates of deposit and investments have maturities
ranging from four months to one year at the time of purchase and are stated at cost plus accrued interest.
Except for the investments mentioned above, the Company considers as cash equivalents all investments with
original maturities of 90 days or less.
3.5 Inventories
Inventories are valued at the lower of cost or market. Cost is determined using the average cost method.
Inventories of packaging and maintenance supplies are valued at cost.
3.6 Property, plant and equipment
Property, plant and equipment are recorded at cost, including capitalized interest and other costs incurred
during the construction phase of major new facilities. Interest on loans denominated in reais includes the
effect of indexation of principal required by some of the loan agreements . Interest on foreign currency
borrowings excludes the effects of foreign exchange gains and losses.
Depreciation is computed under the straight-line method at rates which take into consideration the useful
lives of the related assets: 25 years for buildings and improvements, 10 years for machinery and equipment,
10 years for furniture and fixtures, and five years for vehicles and computer equipment. Assets under
construction are not depreciated until they are placed into service. Expenditures for maintenance and repairs
are charged to expense as incurred. Any gain or loss on the disposal of property and equipment is recognized
in the year of disposal.
The Company periodically evaluates the carrying value of its long-lived assets for impairment. The carrying
value of a long-lived asset is considered impaired by the Company when the anticipated undiscounted cash
flow from such asset is separately identifiable and less than its carrying value. In that event, a loss would be
recognized based on the amount by which the carrying value exceeds the fair market value of the long-lived
asset. Fair market value is determined primarily using discounted anticipated cash flows. No impairment
losses have been recorded for any of the periods presented.

F – 5
3.7 Non-current investments
Investments in 20 percent to 50 percent-owned affiliates where the Company does not have effective control
are accounted for under the equity method. Investments in less than 20 percent-owned affiliates are
accounted for under the cost method. As of December 31, 2001, the Company’s equity investment is
comprised of a 37.90% equity interest in the capital of Aço Minas Gerais S.A. – Açominas and a 38.18%
interest in the capital of Sipar Aceros S.A. – Sipar.
3.8 Revenues
Revenues from sales of products and services are recognized when products are shipped or services are
performed. The Company's usual terms of sale are 21 days for domestic sales, which are made CIF (Cost
Insurance and Freight). Domestic customers making purchases of more than the equivalent of U.S.$ 10,774
per month are subject to a centralized credit approval process. As a consequence of these policies, the
Company's bad debt write-offs (which are made after 12 months) are an insignificant percentage of Gerdau's
consolidated accounts receivable.
All Gerdau companies (Brazil and abroad) accept both immediate and deferred payment for purchase of their
products, the latter in accordance with ordinary commercial terms used in each region, determined seasonally.
Presently, the majority of the sales are made with a maximum sales term of 30 days.
3.9 Accounts receivable
Accounts receivable are stated at estimated realizable values. Allowances are provided, when necessary, in an
amount considered by management to be sufficient to meet probable future losses related to uncollectible
accounts.
3.10 Income taxes
The Company accounts for income taxes under the provisions of SFAS No. 109, “Accounting for Income
Taxes”, which requires the application of the comprehensive liability method of accounting for income taxes.
Under this method, a company is required to recognize a deferred tax asset or liability for all temporary
differences. Deferred tax assets and liabilities are measured using enacted tax rates in effect for the year in
which those temporary differences are expected to be recovered or settled. Under SFAS No. 109, the effect

F – 6
on deferred tax assets and liabilities of changes in tax rates is recognized in income for the period that
includes the enactment date.
Deferred tax assets are reduced through the establishment of a valuation allowance, as appropriate, if, based
on the weight of available evidence, it is more likely than not that the deferred tax asset will not be realized.
3.11 Earnings per share
Each share of Common and Preferred stock entitles the shareholder to participate in earnings; however, in
accordance with Brazilian law, Preferred shareholders are entitled to receive per-share dividends of at least
10% greater than the per-share dividends paid to Common shareholders (hereinafter referred to as the
Mandatory Dividend). In calculating earnings per share (“EPS”), preferred stock has been treated as a
participating s ecurity.
In calculating EPS, the Company has adopted the two-class method. This method is an earnings allocation
formula that determines earnings per share for each class of common stock and participating security
according to dividends declared and participation rights to undistributed earnings. Under this method, net
income is first reduced by the amount of dividends declared in the current period for each class of stock; the
remaining earnings are then allocated to common stock and participating securities to the extent that each
security may share in earnings. The total earnings allocated to each security (i.e. actual dividends declared
and the amount allocated for the participation feature) is then divided by the number of shares outstanding at
the end of the period.
Basic EPS excludes dilution, while diluted EPS reflects the potential dilution that could occur if the
convertible debentures were converted into shares. In calculating diluted EPS, interest expense net of tax on
the convertible securities is added back to “Allocated net income available to Common and Preferred
shareholders”, with the resulting amount divided by the number of dilutive shares outstanding. Convertible
securities are considered in the number of dilutive Commo n and Preferred shares outstanding. See Note 15.
All EPS data is calculated giving retroactive consideration to stock dividends (Note 13.1) and shares issued
in connection with the transfer of entities and operations to the Company by the controlling shareholder, MG
(Note 2.3).
EPS is disclosed in amounts per 1,000 shares, which corresponds to the minimum number of shares that can
be traded on the Brazilian stock exchanges.

F – 7
3.12 Dividends and interest on share capital
The Company's Articles of Incorporation require it to pay its Common and Preferred shareholders annual
dividends in the amount of 30% of net income calculated in accordance with the provisions of the Brazilian
Corporate Law. Approval of the payment of such dividends is received during the Company's Annual
General Meeting, which must be held on or before April 30 of each year. Dividends are payable in Brazilian
reais and reflected in these financial statements upon approval (declaration).
Effective January 1, 1996, companies are allowed to declare and distribute tax deductible interest on equity,
determined utilizing the Taxa de Juros Longo Prazo (“TJLP”) (long-term interest rate), up to a maximum of
50% of net income, as calculated in accordance with the Brazilian Corporate Law, or 50% of retained
earnings. Such interest payments are reflected in these financial statements as dividends and are charged to
retained earnings upon payment.
The benefit to the Company, as opposed to making a dividend payment, is a reduction in its income tax
charge equivalent to 33% of such amount. Income tax is withheld from the stockholders relative to interest at
the rate of 15%, except for interest due to the Brazilian government, which is exempt from tax withholdings.
3.13 Pension plans
SFAS No. 87, “Employers’ Accounting for Pensions”, has been applied as of the beginning of the earliest
year presented in these financial statements. The majority of the Company’s employees are covered by
pension plans to which the Company makes contributions based on either a percentage of employees
compensation for defined contribution plans or actuarially determined amounts for participants of the defined
benefit plans. These plans were evaluated by independent actuaries.
3.14 Compensated absences
Vacation expense is fully accrued in the period the employee renders services to earn such vacation.
3.15 Environmental and remediation costs

F – 8
Expenditures relating to ongoing compliance with environmental regulations, designed to minimize the
environmental impact of the Company’s operations, are capitalized or charged against earnings, as
appropriate. Capitalization is considered appropriate when the expenditures will continue to provide benefits
to the Company; such expenditures are recorded on the date expended. Provisions for non-capital
expenditures are charged against earnings at the time they are considered to be probable and reasonably
estimable. Management believes that, at present, each of its facilities is in substantial compliance with the
applicable environmental regulations.
Future information and developments will require the Company to continually reassess the expected impact
of environmental matters. However, the Company has evaluated its total environmental exposure based on
current available data and believes that compliance with all applicable laws and regulations will not have a
material impact on the Company’s liquidity, consolidated financial position or results of operations.
3.16 Advertising costs
Advertising costs are expensed when incurred. Advertising costs included in selling and marketing expenses
were approximately $9,144, $8,966 and $6,000 for the years ended December 31, 2001, 2000 and 1999
respectively. No advertising costs have been deferred at the balance sheet dates herein.
3.17 Accounting for sales of shares by subsidiaries
Gains or losses arising from the sale of shares by subsidiaries are recognized in the Statement of Changes in
Shareholders’ Equity, to the extent that the net book value of the shares owned by the Company after the sale
exceeds or is lower than the net book value per share immediately prior to the sale of the shares.
4 Short-term investments
Short-term investments consisted of the following as of December 31:
2001 2000 Investment funds $ 50,976 $ 37,892Investment funds – Banco Gerdau S/A 76,125 84,761Fixed revenue securities 113,640 129,565Variable revenue securities 65,324 38,231
$ 306,065 $ 290,449

F – 9
5 Trade accounts receivable, net
Trade accounts receivable consis ted of the following as of December 31:
2001 2000 Trade accounts receivable $ 311,887 $ 350,967Less: allowance for doubtful accounts (23,045) (19,345)
$ 288,842 $ 331,622
6 Inventories
Inventories consisted of the following as of December 31:
2001 2000 Finished products $ 215,045 $ 224,839Work in process 62,149 68,568Raw materials 95,904 64,255Packaging and maintenance supplies 62,140 90,995Advances to suppliers of materials 8,395 9,477 $ 443,633 $ 458,135
7 Balances and transactions with related parties
Balances with related parties at December 31 were as follows:
2001 2000 Short-term investments - Banco Gerdau S.A. (i) $ 76,125 $ 84,761Long-term debt – MG (ii) $ 461 $ 77
(i) Banco Gerdau, a wholly owned subsidiary of MG, established an investment fund for the exclusive
use of the Company. The fund’s investments consist of time deposits in major Brazilian banks and
treasury bills of the Brazilian government. Income earned on the Company’s investment in the fund
aggregated $14,440 in 2001 and $8,338 in 2000, representing average yields of 17.0 % and 16,9 %,
respectively.
(ii) Borrowings of the Company with MG as of December 31, 2001 and 2000 are denominated in
Brazilian reais, bear interest at the average composite borrowing rate of the Conglomerate (22.8% as
of December 31, 2001), mature in May 2002, and can be renewed at every six months. Interest

F – 10
expense related to such loans aggregated $20 in 2001, $3,081 in 2000 and $4,326 in 1999,
representing average effective rates of 22.8 %, 19.6% and 25.4%, respectively.
8 Property, plant and equipment, net
Property, plant and equipment consisted of the following as of December 31:
2001 2000 Buildings and improvements $ 352,653 $ 347,286Machinery and equipment 1,495,911 1,542,887Vehicles 13,096 14,971Furniture and fixtures 33,170 38,559Other 118,370 138,845 2,013,200 2,082,548
Less: accumulated depreciation (833,261) (859,640) 1,179,939 1,222,908Land 96,276 154,541Construction in progress 108,248 165,160
Total $ 1,384,463 $ 1,542,609
Construction in progress as of December 31, 2001 represents principally renewals and improvements in the
manufacturing facilities of the Company located in Brazil. The Company capitalized interest on construction
in progress in the amount of $14,228 in 2001, $20,735 in 2000 and $11,934 in 1999.
As of December 31, 2001, machinery and equipment with a net book value of approximately $33,546 was
pledged as collateral for certain long-term debt.
9 Accrued pension liability
The Company and other related companies in the Conglomerate co-sponsor a contributory pension plan
covering substantially all Brazilian-based employees (the “Domestic Plan”). The Domestic Plan is
principally a defined benefit plan with certain limited defined contributions. Additionally, the Company's
Canadian and American subsidiaries sponsor defined benefit plans (the “Canadian Plans” and the “American
Plans”) covering substantially all of their employees. Contributions to the Domestic Plan for defined

F – 11
contribution participants are based on a specified percentage of employees’ compensation and totalled $ 955
in 2001, $1,596 in 2000 and $1,560 in 1999. Contributions to the Domestic Plan for defined benefit
participants and contributions to the Canadian Plans and American Plans are based on actuarially determined
amounts.
The Domestic Plan is administered by Gerdau - Sociedade de Previdência Privada, which was established by
the Conglomerate for this purpose. Plan assets of the Domestic Plan consist of investments in bank
certificates of deposit, equity and debt securities and investment funds.
Total pension contributions for 2001, 2000, and 1999 were $ 7,659, $5,354 and $8,058, respectively.
Net periodic pension cost relating to the defined benefit component of the Domestic Plan was as follows:
2001 2000 1999
Service costs of benefits earned during the period $ 1,989 $ 2,180 $ 2,073 Interest cost on the projected benefit obligation 5,037 5,110 4,182 Actual return on plan assets (15,111) (8,940) (16,505) Deferred gain on plan assets 10,538 3,970 13,108 Amortization of gain (475) (970) (597) Amortization of unrecognized transition obligation 865 1,114 1,123
Net pension expense $ 2,843 $ 2,464 $ 3,384 The funded status of the defined benefit components of the Domestic Plan as of December 31 was at follows:
2001 2000 1999 Actuarial present value of accumulated benefit obligation:
Vested benefits $ 21,510 $ 21,023 $ 11,188 Non vested benefits 4,609 5,263 11,352
Accumulated benefit obligation 26,119 26,286 22,540 Future projected salary increase 29,478 34,043 29,277 Projected benefit obligation 55,597 60,329 51,817 Plan assets at fair value 62,222 55,370 52,214 Projected benefit obligation in excess of plan assets (6,625) 4,959 (397) Unrecognized net transition obligation (1,757) (3,127) (4,557) Unrecognized net gain 25,761 16,498 23,281 Accrued pension liability recognized in the balance sheet $ 17,379 $ 18,330 $ 18,327
Additional information required by SFAS nº 132 for the Domestic Plan is as follows:
2001 2000 Change in benefit obligation
Benefit obligation at the beginning of the year $ 60,329 $ 51,817 Service cost 1,989 2,180 Interest cost 5,037 5,110 Actuarial loss (1,642) 7,608 Benefit payments (721) (1,613)

F – 12
Translation adjustment (9,395) (4,773) Benefit obligation at the end of the year $ 55,597 $ 60,329
2001 2000
Change in plan assets Fair value of plan assets at the beginning of the year $ 55,370 $ 52,214 Actual return on plan assets 15,111 8,940 Employer contributions 941 793 Benefit payments (721) (1,613) Translation adjustments (8,479) (4,964) Fair value of plan assets at the end of the year $ 62,222 $ 55,370
Funded status: Funded status at the end of the year 6,625 (4,959) Unrecognized prior service cost - - Unrecognized gains (25,761) (16,498) Unrecognized transition obligation 1,757 3,127 Accrued cost (17,379) (18,330)
The unrecognized net transition obligation and net gains or losses are being amortized on a straight-line basis
over 15 years, the average remaining working life of the employees. The amortization of the net transition
obligation from January 1, 1989 (the effective date of SFAS No 87 for non-U.S. plans) through December
31, 1994 was recorded directly to equity in the opening balance sheet under U.S. GAAP and amounted to
approximately $10,956.
Following is a summary of assumptions used in the accounting for the defined benefit component of the
Domestic Plan:
2001 2000 1999
Weighted-average discount rate 9.7% 9.7% 9.7% Rate of increase in compensation 8.7% 8.7% 8.7% Long-term rate of return on plan assets 9.7% 9.7% 9.7%
The components of net periodic pension cost for the Canadian Plans are as follows:
2001 2000 1999
Service costs of benefits earned during the period $ 1,064 $ 865 $ 936 Interest cost on projected benefit obligation 2,097 2,090 1,955 Expected return on plan assets, net (2,278) (2,153) (1,691) Amortization of unrecognized transition obligation 9 105 811
Net pension expense $ 892 $ 907 $ 2,011
Assumptions used in the accounting for the Canadian Plans were:
2001 2000 1999
Weighted-average discount rate 7.0% 7.0% 7.5% Rate of increase in compensation 2.5% 2.5% 8.0% Long-term rate of return on plan assets 7.0-7.5% 7.0-7.5% 8.0%

F – 13
The following sets forth the funded status of the Canadian Plans as of December 31: 2001 2000 1999 Plan assets at fair value $ 31,207 $ 33,245 $ 32,093 Actuarial present value of benefits 32,186 31,281 33,332 Unfunded pension liability 979 (1,964) 1,239 Unrecognized net losses (3,019) (33) (3,129) Additional minimum liability 1,483 1,377 - Prepaid pension costs $ (557) $ (620) $ (1,890)
Additional information required by SFAS nº 132 for the Canadian Plans is as follows:
2001 2000 Change in plan assets Plan assets at the beginning of the year 33,245 32,093 Exchange impact on opening balance (1,932) (1,745) Benefits paid and net exchange impact (468) (358) Return on assets 362 3,255 Plan assets at the end of the year 31,207 33,245 Change in the actuarial present value of benefits Actuarial present value of benefits at the beginning of the year 31,281 30,836 Service cost 1,064 865 Estimated benefits paid (1,562) (1,644) Interest accrued 2,097 2,090 Net exchange impact (1,277) (18) Other 583 (848) Actuarial present value of benefits at the end of the year 32,186 31,281
The subsidiaries in the United States currently provide specified health care benefits to retired employees.
Employees who retire after a certain age with specified years of service become eligible for benefits under
this unfunded plan. The American subsidiary has the right to modify or terminate these benefits. The
components of net periodic pension cost for the American Plans are as follows:
Pension Benefits Postretirement Medical
2001 2000 2001 2000 Service costs of benefits earned during the period 4,039 3,302 247 210 Interest cost on projected benefit obligation 8,822 8,008 586 564 Expected return on plan assets, net (9,983) (9,341) - - Amortization of unrecognized transition obligation (35) (35) - (11) Recognized actuarial gain - - - (18)
Net pension expense 2,843 1,934 833 745
Assumptions used in the accounting for the American Plans were:

F – 14
2001 2000 Weighted-average discount rate 7.25% 7.5% Rate of increase in compensation 4.5% 4.5% Long-term rate of return on plan assets 9.25% 9.5%
The following sets forth the funded status of the American Plans as of December 31:
Pension Benefits Postretirement Medical 2001 2000 2001 2000
Plan assets at fair value 101,716 108,188 - - Actuarial present value of benefits 131,886 116,940 9,068 7,858 Plan assets in excess of liability (30,170) (8,752) (9,068) (7,858) Unrecognized prior service cost (221) (257) - (135) Unrecognized net losses 16,149 (3,164) 246 (933) Prepaid pension costs (14,242) (12,173) (8,822) (8,926)
Additional information required by SFAS nº 132 for the American Plans is as follows:
Pension Benefits Postretirement Medical 2001 2000 2001 2000
Change in plan assets Plan assets at beginning of the year 108,188 105,304 - - Employer contribution 774 - 937 800 Plan participants’ contributions - - 466 429 Benefits paid and net exchange impact (5,755) (5,493) (1,403) (1,229) Return on assets (1,491) 8,377 - - Plan assets at the end of the year 101,716 108,188 - -
Change in the actuarial present value of benefits
Actuarial present value of benefits at beginning of the year 116,940 102,345 7,858 7,834 Service cost 4,039 3,302 247 210 Estimated benefits paid (5,755) (5,493) (1,403) (1,229) Interest accrued 8,822 8,008 586 564 Plan participants’ contributions - - 466 429 Plan amendments - - 135 - Actuarial loss 7,840 8,778 1,179 50 Actuarial present value of benefits at the end of the year 131,886 116,940 9,068 7,858
The Company estimated an obligation of US$ 5,745, related to a retirement benefit to be paid to its executives. This amount was included in the pension plan liability in the financial statements, with a counterpart in the statements of income of the period.

F – 15
10 Short-term debt Short-term debt consists of working capital lines of credit and export advances with interest rates ranging from LIBOR + 1.3% per annum to 13.4% per annum, plus monetary correction and exchange variation as of December 31, 2001. All short-term debt mature in less than one year, and is payable in a single amount upon maturity. Generally, interest is being paid in a monthly basis. This debt is guaranteed by the parent company. 11 Long-term debt and debentures
Long-term debt and debentures consisted of the following as of December 31:
Annual Interest Rate %
2001
2000
Long-term debt, excluding debentures, denominated in Brazilian reais (i) Financing for machinery 9.25 to 10.0 $ 187,175 $ 248,009Long-term debt, excluding debentures, denominated in foreign currencies Financing for machinery and others (Cdn$) 9.09 - 19,658Working capital (US$) 3.0 to 8.36 333,033 479,847Financing for machinery (US$) (ii) LIBOR+11.02 220,686 194,336
Financing for investments (US$) 5.53 85,894 91,716Financing for machinery (DM$) 10.4 - 800 826,788 1,034,366Less: current portion (196,152) (316,536)Long-term debt, excluding debentures, less current portion $ 630,636 $ 717,830
Debentures (iii) $ 96,222 $ 115,762Less: current portion (2,018) (2,413)Debentures, less current portion $ 94,204 $ 113,349
(i) The long-term debt denominated in Brazilian reais is indexed for inflation using the TJLP –fixed by
the Government on a quarterly basis or the TR – Taxa Referencial (nominal interest reference rate) published by the Government on a daily basis.
(ii) Interest is based on the six month London Inter-Bank Offered Rate (“LIBOR”), which as of December 31, 2001 was 2.44%.
(iii) Debentures are represented by six outstanding issues as follows: Issue Issuance Maturity 2001 2000 Third 1982 2011 $ 20,240 $ 21,665 Fifth 1989 2005 8,116 11,764 Seventh 1982 2012 6,331 6,971 Eighth 1982 2013 17,503 20,385 Ninth 1983 2014 37,796 45,475 Eleventh 1990 2020 6,236 9,502 Total $ 96,222 $ 115,762
Debentures are denominated in Brazilian reais and bear variable interest (CDI – Certificado de Depósito Interbancário). The annual average nominal interest rates were 16.95 % as of December 31, 2001 and 16.95% as of December 31, 2000. The Company’s public debentures prohibit the payment of dividends in

F – 16
excess of 30% of distributable net profits, if after giving effect to such distributions the Company’s long-term liabilities exceed more than 1.5 times its net worth and its current assets are less than its current liabilities. The Company has $8,073 of convertible debentures due at various dates through 2005, which are convertible at the option of the holders into 263,901,675 shares of Common stock and 527,803,350 shares of Preferred stock, computed by dividing the face value of the debt by the book value, in corporate law, of the shares at December 31, 2001.
The Company’s debt agreements contain covenants, which require the maintenance of certain ratios, as calculated in accordance with Brazilian GAAP. The most restrictive of these covenants are as follows: § A ratio of current liquidity, which consists of current assets divided by current liabilities, of 1.0 or greater. § A ratio of less than 2.5 through September 30th, 2002 and 2.0 thereafter, of the total of long and short-term indebtedness divided by operating profit plus financial expenses plus depreciation and amortization (EBITDA). § A ratio of debt service coverage, consisting of total operating EBITDA less capital expenditures and cash taxes, divided by principal plus cash interest, greater than 1.1. § A ratio of interest coverage, consisting of the operating EBITDA less capital expenditures, divided by cash interest, greater than 2.0. § A ratio of the term debt divided by the capital of the Canadian companies not greater than 0.55 through December 31st, 2001 and not greater than 0.4 thereafter. § A ratio of tangible net worth of the Canadian companies greater than US$ 117 million plus 50% of the cumulative consolidated net income. On January 4, 1999, the Company assumed the debt related to the Eurobonds of $130,000, issued by the Company’s parent, Metalúrgica Gerdau, maturing in May 2004, in exchange for the existing debt with the parent. Consequently, the Company is subject to certain financial covenants related to the issuance of these Eurobonds. Under the most restrictive of these covenants, the Company must maintain consolidated indebtedness at a level that is less than four times consolidated EBITDA. As of December 31, 2001, the Company was in compliance with all restrictive covenants related to the Eurobonds. Of the total amount issued, the subsidiary GTL Equity Investments Corp. bought $ 42,038 when some of the bondholders had the opportunity to exercise the put option. For purposes of presentation in the accompanying financial statements, the balance of the Eurobond debt is shown at its net amount. Other covenants in the debt agreements restrict the payment of dividends and limit the incurrence of additional debt. As of December 31, 2001, the Company was in compliance with these covenants. Long-term debt matures in the following years:
2003 $ 172,0562004 238,7372005 139,3402006 49,1042007 and thereafter 31,399 $ 630,636
12 Commitments and contingencies

F – 17
The Company is party to claims with respect to certain taxes, contributions and labor. Management believes,
based in part on advice from legal counsel, that the reserve for contingencies is sufficient to meet probable
and reasonably estimable losses in the event of unfavorable rulings, and that the ultimate resolution will not
have a significant effect on the consolidated financial position as of December 31, 2001 or the results of
future operations or cash flows. However, it is possible that contingencies could have a material effect on
quarterly or annual operating results, when resolved in future periods.
Included in the reserve for contingencies as of December 31, 2001 is $21,744 relating to “compulsory loans”
required to be made to ELETROBRÁS (“Empréstimo Compulsório Eletrobrás sobre Energia Elétrica”), the
government-owned energy company, by its customers. The Company has, along with other electricity
customers, challenged the constitutionality of these loans. In March 1995, the Supreme Court decided against
the interests of the Company. Even though the constitutionality of the “compulsory loans” has been sustained
by the Supreme Court, several issues remain pending, including the amounts to be paid by the Company. The
claims are expected to be outstanding for at least two or three more years.
The Company has established an allowance relating to the “compulsory loans” as: (i) the Supreme Court has
initially decided against the interests of the Company as it relates to this matter, (ii) even though the payment
to Eletrobras was in the form of a loan, the re-payment to the Company will be made in the form of
Eletrobras shares, and (iii) based on currently available information, the Eletrobras shares will most likely be
worth less than 5% of the amount that would be paid if the re-payment was to be made in cash.
Also included in the reserve for contingencies are $3,063 relating to contested federal social contribution
taxes, “Fundo de Investimento Social” (“FINSOCIAL”), $398 relating to state value added tax, “Imposto
Sobre Circulação de Mercadorias e Serviços” (“ICMS”), $1,071 relating to “Contribuição Social Sobre o
Lucro”, $5,788 relating to “Contribuição Provis ória sobre Movimentação Financeira” (“CPMF”), $4,402
relating to income tax (“Imposto de Renda”), $7,684 relating to social security contribution (“INSS”) and
$3,936 relating to contested federal social contribution taxes, “Programa de Integração Social”, (“PIS”) and
“Contribuição para o Financiamento da Seguridade Social” (“COFINS”). The Company believes that, under
the Supreme Court ruling on PIS, it is entitled to a tax refund which it has offset against monthly payments of
PIS and COFINS. The amounts offset have been accounted for as a contingent liability. The Company
believes that it will not have judgement on the merits for at least two years.
The Company is also a party to a number of lawsuits by employees. As of December 31, 2001, the Company
has accrued $6,121 relating to such lawsuits. Additionally, the Company is involved in a number of lawsuits

F – 18
arising from the ordinary course of business and has accrued $163 for these claims.
Judicial deposits, which represent restricted assets of the Comp any, relate to amounts paid to the court and
held in Judicial escrow pending resolution of related legal matters. The balance as of December 31, 2001 is
comprised principally of $11,183 relating to the ELETROBRÁS dispute (December 31, 2000: $14,244) and
$5,788 related to disputed federal contribution over financial operations, “Contribuição Provisória sobre
Movimentação Financeira” (“CPMF”) (December 31, 2000: $6,869, related to “Contribuição Provisória sobre
Movimentação Financeira”).
In addition to the matters described above, the Company is involved as plaintiff and defendant in a variety of
routine litigation incidental to the normal course of business. Management believes, based on the opinion of
legal counsel, that it has defense or insurance protection with respect of such litigation and that any losses
therefrom, whether or not insured, would not have a material adverse effect on the consolidated results of
operations or consolidated financial position of the Company. The legal advisors of the Company assessed the
amount of possible losses on contingencies as US$ 48 million, in December 31, 2001.
13 Shareholders' equity
13.1 Share capital
As of December 31, 2001, 39,382,020,386 shares of Common stock and 74,109,685,986 shares of Preferred
stock were issued and outstanding. The share capital of the Company is comprised of Common shares and
Preferred shares, all without par value. The authorized capital of the Company is comprised of
240,000,000,000 Common shares and 480,000,000,000 Preferred shares. Only the Common shares are
entitled to vote. Under the Company’s By-laws, specific rights are assured to the non-voting Preferred shares.
There are no redemption provisions associated with the Preferred shares. The Preferred shares have
preferences in respect of the proceeds on liquidation of the Company and additional 10% on dividend
payments. In the event that the Mandatory Dividend is omitted for three consecutive years, the Preferred
shares acquire voting rights until payment of such dividend is resumed.

F – 19
The following sets forth the changes in the Company’s shares from January 1, 1999 through December 31,
2001:
Common Preferred Treasury Shares Issued Shares Issued Stock Balances as of January 1, 1999 19,691,010,193 37,054,813,723 (233,100,000) Shares issued in the merger of Comercial Gerdau - 29,270 - Sale of Preferred shares - - 233,100,000 ------------------- ------------------- ------------------ Balances as of December 31, 1999 19,691,010,193 37,054,842,993 - Shares issued in the split of shares 19,691,010,193 37,054,842,993 - ------------------- ------------------- ------------------ Balances as of December 31, 2000 39,382,020,386 74,109,685,986 - - ------------------ ------------------ ---------------- Balances as of December 31, 2001 39,382,020,386 74,109,685,986 - =========== =========== ==========
Under Brazilian GAAP, for periods prior to December 31, 1995, statutory reserves were subject to monetary
correction with a capital reserve established to accumulate the amount of the monetary correction. During
1996 and 1995, the Company issued Common and Preferred shares to its shareholders thereby capitalizing all
remaining amounts included in the capital reserve. For U.S. GAAP purposes, this transaction has been treated
as a stock dividend; historical per share amounts have therefore been restated for all periods.
13.2 Legal reserve
Under Brazilian law, the Company is required to transfer up to 5% of annual net income, determined in
accordance with the Brazilian Corporate Law, to a legal reserve until such reserve equals 20% of paid-in
capital. The legal reserve may be utilized to increase paid-in capital or to absorb losses, but cannot be used
for dividend purposes.
13.3 Dividend payments
Brazilian law permits the payment of cash dividends from retained earnings calculated in accordance with the
provisions of the Brazilian Corporate Law and as stated in the statutory accounting records. As of December
31, 2001, the Company's retained earnings available for dividend distributions to Preferred and Common
shareholders approximated $ 440,874.

F – 20
Aggregate dividends declared by the Company for the years ended December 31 were as follows:
2001 2000 1999 Common shares $ 23,046 $ 21,491 $ 23,741
Preferred shares 47,851 44,495 47,132
Total $ 70,897 $ 65,986 $ 70,873
14 Accounting for income taxes
Income tax payable is calculated separately for Gerdau and each of its subsidiaries as required by the tax laws
of the countries in which Gerdau and its subsidiaries operate. Income tax expense for the fiscal year ended
December 31 consists of the following:
2001 2000 1999 Current tax expense (benefit): Brazil $ 34,883 $ 37,058 $ 4,855 United States (2,236) (3,611) 3,501 Canada 5,414 3,357 8,824 Other countries 2,920 (79) 276 40,981 36,725 17,456 Deferred tax expense (benefit): Brazil 12,699 2,522 527 United States - 5,321 (1,488) Canada 1,168 (1,955) 4,387 Other Countries (201) 3,011 (346) 13,666 8,899 3,080 Income tax expense $ 54,647 $ 45,624 $ 20,536
A reconciliation of the provisions for income taxes to the income taxes calculated at the Brazilian statutory rates
follows:
2001 2000 1999
Net income before taxes and minority interest $ 219,205 $ 236,997 $ 217,900 Statutory Brazilian income tax rate 34.00% 34.00% 35.67% Income tax at statutory rate 74,530 80,579 77,725 Permanent differences: - International rate differences (1,655) (1,085) (2,201) - Non-deductible expenses/non taxable revenue 4,953 303 (535) - Effect of changes in tax rates - 620 (17,514) - Differences related to assets and liabilities remeasured at historical
rates, resulting from (i) indexing used for Brazilian tax purposes; and (ii) changes in exchange rates
11,057
(5,060)
(16,135)
- Equity pickup on non-consolidated companies (6,230) (11,547) 1,749 - Interest on equity (24,105) (22,435) (23,388) - Other, net (3,903) 4,249 835

F – 21
Income tax expense $ 54,647 $ 45,624 $ 20,536
Tax rates in the principal geographical areas in which the Company operates, for the years ended December
31, were as follows:
2001 2000 1999 Brazil Federal income tax 25.00% 25.00% 25.00% Social contribution 9.00% 9.00% * 12.00% Composite federal income tax rate 34.00% 34.00% 37.00% United States Federal income tax (approximately) 40.00% 40.00% 43.00% Canada Federal income tax 21.84% 21.84% 21.84% Provincial rate (approximately) 15.16% 15.16% 15.16% Composite income tax rate 37.00% 37.00% 37.00% Chile Federal income tax 15.00% 15.00% 15.00% Uruguay Federal income tax 30.00% 30.00% 30.00%
* 8% from January to April, 1999.
Deferred income tax
The more significant temporary differences that give rise to the deferred tax assets and deferred tax liabilities
as of December 31 are presented below:
2001 2000 1999 Deferred tax assets
Property, plant and equipment $ 27,403 $ 33,936 $ 41,294 Net operating loss carryforwards 1,177 7,239 634 Accrued liability for legal proceedings 8,195 23,934 18,054 Accrued pension costs 13,340 6,232 13,536 Other 555 7,202 6,968 Gross deferred income tax assets 50,670 78,543 80,486
Deferred tax liabilities Capitalized interest on property, plant and equipment 3,291 7,227 3,194 Accelerated depreciation 142,232 142,646 139,508 Other 8,606 1,273 520
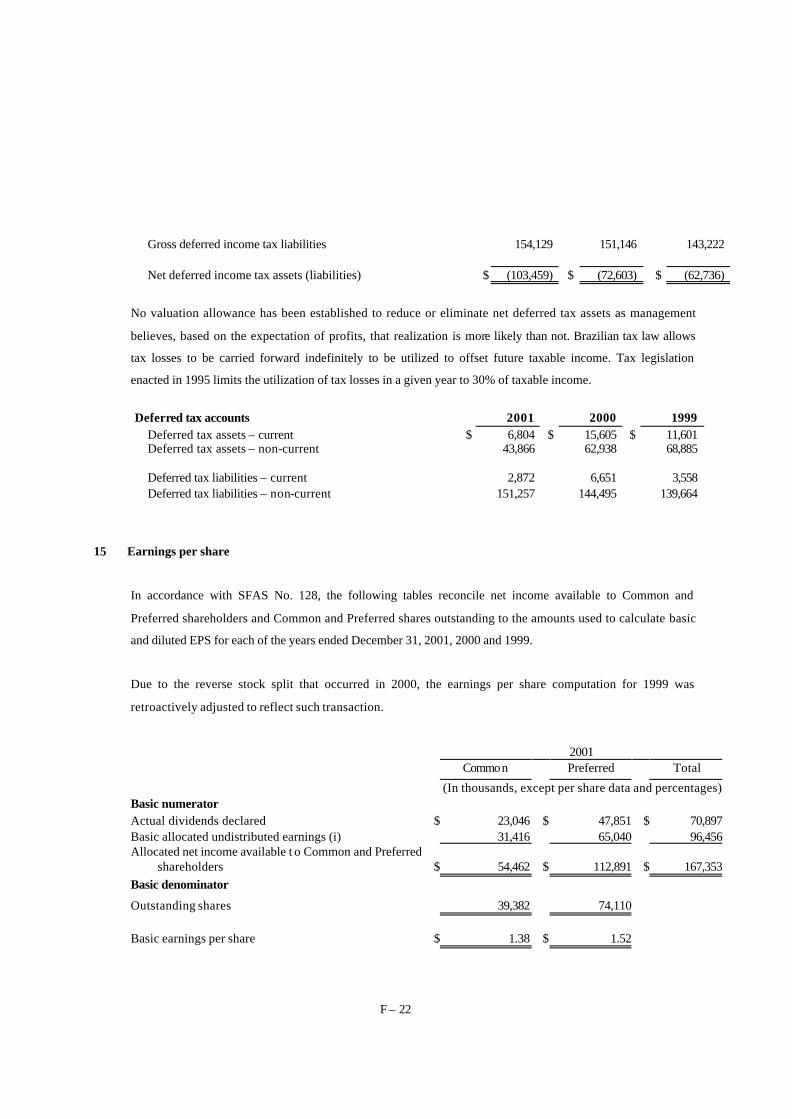
F – 22
Gross deferred income tax liabilities 154,129 151,146 143,222 Net deferred income tax assets (liabilities) $ (103,459) $ (72,603) $ (62,736)
No valuation allowance has been established to reduce or eliminate net deferred tax assets as management
believes, based on the expectation of profits, that realization is more likely than not. Brazilian tax law allows
tax losses to be carried forward indefinitely to be utilized to offset future taxable income. Tax legislation
enacted in 1995 limits the utilization of tax losses in a given year to 30% of taxable income.
Deferred tax accounts 2001 2000 1999
Deferred tax assets – current $ 6,804 $ 15,605 $ 11,601 Deferred tax assets – non-current 43,866 62,938 68,885 Deferred tax liabilities – current 2,872 6,651 3,558 Deferred tax liabilities – non-current 151,257 144,495 139,664
15 Earnings per share
In accordance with SFAS No. 128, the following tables reconcile net income available to Common and
Preferred shareholders and Common and Preferred shares outstanding to the amounts used to calculate basic
and diluted EPS for each of the years ended December 31, 2001, 2000 and 1999.
Due to the reverse stock split that occurred in 2000, the earnings per share computation for 1999 was
retroactively adjusted to reflect such transaction.
2001 Common Preferred Total
(In thousands, except per share data and percentages) Basic numerator Actual dividends declared $ 23,046 $ 47,851 $ 70,897 Basic allocated undistributed earnings (i) 31,416 65,040 96,456 Allocated net income available t o Common and Preferred
shareholders $
54,462
$
112,891 $
167,353
Basic denominator
Outstanding shares 39,382 74,110
Basic earnings per share $ 1.38 $ 1.52

F – 23
2001 Common Preferred Total
(In thousands, except per share data and percentages) Diluted numerator Actual dividends declared $ 23,046 $ 47,851 $ 70,897 Basic allocated undistributed earnings (i) 31,416 65,040 96,456 Diluted allocated undistributed earnings 54,462 112,891 167,353 Convertible securities: Interest expense on convertible debt, net of tax (ii) 160 300 460
Allocated diluted net income available to Common and Preferred shareholders
$
54,622
$
113,191 $
167,813
Diluted denominator Basic outstanding shares 39,382 74,110 Convertible securities: Convertible debentures (ii) 264 528 Diluted outstanding shares 39,646 74,638 Diluted earnings per share $ 1.38 $ 1.52
2000 Common Preferred Total
(In thousands, except per share data and percentages) Basic numerator Actual dividends declared $ 21,491 $ 44,495 $ 65,986 Basic allocated undistributed earnings (i) 39,922 82,650 122,572 Allocated net income available to Common and
Preferred shareholders
$ 61,413
$ 127,145
$ 188,558
Basic denominator
Outstanding shares 39,382 74,110
Basic earnings per share $ 1.56 $ 1.72

F – 24
2000 Common Preferred Total
(In thousands, except per share data and percentages) Diluted numerator Actual dividends declared $ 21,491 $ 44,495 $ 65,986 Basic allocated undistributed earnings (i) 39,922 82,650 122,572 Diluted allocated undistributed earnings 61,413 127,145 188,558 Convertible securities:
Interest expense on convertible debt, net of tax (ii) 227 427 654
Allocated diluted net income available to Common and Preferred shareholders
$ 61,640
$ 127,572
$ 189,212
Diluted denominator Basic outstanding shares 39,382 74,110 Convertible securities: Convertible debentures (ii) 366 732 Diluted outstanding shares 39,748 74,842
Diluted earnings per share $ 1.55 $ 1.70
1999 Common Preferred Total
(In thousands, except per share data and percentages) Basic numerator Actual dividends declared $ 23,741 $ 47,132 $ 70,873 Basic allocated undistributed earnings (i) 41,287 85,532 126,819 Allocated net income available for Common and Preferred shareholders
$ 65,028
$ 132,664
$ 197,692
Basic denominator Outstanding shares 39,382 74,110 Basic earnings per share $ 1.65 $ $ 1.79
Diluted numerator
Actual dividends declared $ 23,741 $ 47,132 $ 70,873 Basic allocated undistributed earnings (i) 41,287 85,532 126,819 Diluted allocated undistributed earnings 65,028 132,664 197,692 Convertible securities:
Interest expense on convertible debt, net of tax (ii) 196 407 603 Allocated diluted net income available to Common and Preferred shareholders
$ 65,224
$ 133,071
$ 198,295
Diluted denominator Basic outstanding shares 39,382 74,110 Convertible securities:
Convertible debentures (ii) 246 493

F – 25
Diluted outstanding shares 39,628 74,603
Diluted earnings per share $ 1.65 $ 1.78
(i) The Company calculates earnings per share on Common and Preferred shares under the "two
class method". See Note 3.11. Effective January 1, 1997 Preferred shareholders are entitled to
receive per-share dividends of at least 10% greater than the per-share dividends paid to Common
shareholders. Undistributed earnings, therefore, from January 1, 1997 forward have been
allocated to Common and Preferred shareholders on a 100 to 110 basis respectively, based upon
the number of shares outstanding at the end of the period and considering items assumed to be
common stock equivalents for purposes of EPS computation, as discussed below (ii).
(ii) For purposes of computing diluted EPS, convertible securities are assumed to be converted
into Common and Preferred shares at the beginning of the period or from the point at which such
securities were outstanding. In accordance with Brazilian Corporate Law, on conversion of
convertible debt, a maximum of 66.67% of the debt can be applied towards the acquisition of
Preferred stock. In calculating diluted EPS, therefore, the Company has assumed a conversion
ratio for convertible securities of 66.67: 33.33 Preferred to Common stock.
16 Fair value of financial instruments
In accordance with SFAS No. 107, “Disclosures About Fair Value of Financial Instruments”, the Company is
required to disclose the fair value of financial instruments, including off-balance sheet financial instruments,
when fair values can be reasonably estimated. The values provided are representative of the fair values as of
December 31, 2001 and 2000 and do not reflect subsequent changes in the economy, interest and tax rates,
and other variables that may impact determination of fair value. The following method and assumptions were
used in estimating fair values for financial instruments:
- Cash and short term investments: The carrying amounts approximate fair value because of the short maturity
of these instruments.
- Judicial deposits: The carrying amount of judicial deposits approximates fair value, as interest is receivable
on such deposits at a variable market rate.

F – 26
- Trade accounts receivable, accounts payable trade and payroll and related liabilities: The carrying amount of
these accounts approximates fair value.
- Short-term debt, long-term debt (except Eurobonds) and debentures: The fair value of short-term debt, long-
term debt and debentures is based on current rates offered for similar debt.
- Long-term debt, Eurobonds: The fair value of the Eurobonds presents a discount over the debt value, which
makes its balance, in fair value, different from the balance in the books.
The carrying amounts and fair values of the Company’s significant financial instruments as of December 31
are as follows:
2001 2000 Carrying
Amount Fair
Value Carrying
Amount Fair
Value
Cash and short -term investments $ 333,897 $ 333,897 $ 302,882 $ 302,882 Trade accounts receivable, net 288,842 288,842 331,622 331,622 Judicial deposits 26,730 26,730 31,962 31,962 Accounts payable trade 137,397 137,397 139,945 139,945 Payroll and related liabilities 32,504 32,504 40,201 40,201 Short-term debt 371,339 371,339 372,050 372,050 Long-term debt, including current portion 826,788 830,402 1,034,366 1,034,054 Debentures, including current portion 96,222 96,222 115,762 115,762 Long - term debt, Eurobonds 28,031 31,645 94,282 93,970
17 Derivative instruments
As of December 31, 2001, US$ 1,010,579 of the total debt of the Company was denominated in foreign
currencies and is exposed to market risk from changes in foreign-exchange rates. The Company manages risk
from fluctuations in foreign currencies exchange rates, which affect the amount of Brazilian reais necessary to
pay obligations denominated in foreign currencies, by using derivative instruments, primarily swap contracts.
The main objective in holding these instruments is to match the gains from investing the proceeds of
borrowings and loans with exchange losses generated by the devaluation of the Brazilian real against foreign
currencies. Although such instruments reduce the foreign-exchange related risk, they do not eliminate them.

F – 27
The credit risk exposure is addressed in Note 18. The Company does not hold financial instruments for
trading purposes.
Effective January 1, 2001, the Company adopted SFAS No. 133, “Accounting for Derivative Instruments and
Hedging Activities”, as amended. Under SFAS No. 133, the contracts of the Company do not meet the
criteria to qualify as the hedge of an exposure to foreign currency or interest rate risk. Therefore, the
Company has accounted for the derivative transactions by calculating the unrealized gain or loss at each
balance sheet date and changes in the fair value of all derivatives are now being recorded in current
operations. As of December 31, 2000, the Company did not have any derivative instruments.
The effect of applying the procedures of SFAS No. 133, as of December 31, 2001, was a gain of US$ 6,074
(net of income tax effects of US$ 3,129), and is presented as a reduction of the interest expenses in the
statement of income for the year then ended. The method to calculate this effect consisted of two steps, where
the first was to find the future value of each contract, through the application of the projected contractual rate,
and the second was to bring the future value of the contracts to present value, through the application of the
market rate and terms available at the balance sheet date. During the year of 2001, the gross gain realized on
derivative instruments amounted to US$ 16,661, which were recognized in the income statement. There were
no losses on derivatives contracts during the year 2001. In addition, there were no gains or losses on
derivatives contracts for the years 2000 and 1999.
The swap contracts outstanding at December 31, 2001, are listed below:
Contract date
Object Amount (US$ thousand)
Proportion CDI rate
Maturity
02/12/2001 Eurobonds 50,000 84.5% 05/20/2004 02/12/2001 Eurobonds 50,000 87.0% 05/20/2004 07/18/2001 Eurobonds 30,000 103.7% 05/20/2004 03/30/2001 Import 9,515 100.0% 10/04/2004 10/04/2001 Import 32,556 100.0% 06/25/2002 12/05/2001 Import 12,559 100.0% 12/23/2002 07/16/2001 Pre-payment 30,710 80,3% 03/01/2006 07/18/2001 Pre-payment 10,236 92.8% 03/01/2006
18 Concentration of credit risks
The Company's principal business is the production and sale of long ordinary steel products, including: crude
steel; long rolled products, such as merchant bars and concrete reinforcing bars used in the construction
industry; drawn products, such as wires and meshes; and long specialty steel products, such as tool steel and

F – 28
stainless steel. Approximately 46% of the Company's sales during 2001 were to civil construction customers,
with the remaining sales primarily to manufacturing customers. Approximately 64% of the Company's sales
are to domestic Brazilian companies, with the remainder equally split between export sales from Brazil and
sales of its foreign subsidiaries located in Canada, Chile, Argentina and Uruguay.
No single customer of the Company accounted for more than 10% of net sales and no single supplier
accounted for more than 10% of purchases. Historically, the Company has not experienced significant losses
on trade receivables.
19 Segment information
The Company’s operations are classified into three business segments: civil construction, manufacturing and
other. The civil construction segment principally involves the production and sale of concrete reinforcing
bars, wire for reinforced concrete, annealed tying wire, welded meshes and nails. The manufacturing segment
primarily consists of the production and sale of bars, wire rods, specialty steel products and billets. The other
businesses segment consists of the agriculture and breeding sectors.
Information about the Company’s segments is as follows:
(i) There are no significant inter-segment sales transactions.
(ii) Operating income consists of net sales less applicable operating costs and expenses related to those
sales.
(iii) The identifiable assets are trade accounts receivable, inventories and property, plant and equipment.
2001 Civil
Construction
Manufacturing Other
businesses Consolidated
total
Net sales to external customers 1,098,908 1,029,975 191,646 2,320,530
Operating income 160,380 179,920 51,701 392,001
Identifiable assets 1,110,273 877,235 129,430 2,116,938
Capital expenditures 135,322 107,087 15,913 258,322
Depreciation and amortization 71,180 56,328 8,370 135,878
Interest expenses 78,846 73,900 13,750 166,496
Income tax 22,358 25,082 7,207 54,647

F – 29
2000 Civil
Construction
Manufacturing Other
businesses Consolidated
Total
Net sales to external customers 1,270,101 1,163,835 242,778 2,676,714
Operating income 183,642 168,278 35,103 387,023
Identifiable assets 1,106,707 1,014,113 211,546 2,332,366
Capital expenditures 125,647 115,135 24,017 264,799
Depreciation and amortization 66,863 61,269 12,781 140,912
Interest expenses 91,660 83,991 17,521 193,172
Income tax 21,648 19,837 4,139 45,624
1999 Civil
Construction
Manufacturing
Other
businesses
Consolidated
Total
Net sales to external customers 839,326 663,613 218,049 1,720,988
Operating income 183,304 144,930 47,621 375,855
Identifiable assets 1,245,303 903,549 180,123 2,328,975
Capital expenditures 211,384 167,131 54,916 433,431
Depreciation and amortization 40,412 31,952 10,499 82,863
Interest expenses 39,249 31,032 10,197 80,478
Income tax 10,015 7,918 2,603 20,536
Geographic information about the Company follows: 2001 Brazil United States Canada Other countries Total Net sales 1,377,759 591,353 244,151 107,267 2,320,530 Identifiable assets
930,483 768,850 235,679 181,926 2,116,938
Long lived assets 637,320 384,571 223,744 138,828 1,384,463
Operating income 371,681 (19,828) 21,734 18,414 392,001
2000 Brazil United States Canada Other countries Total Net sales 1,628,996 676,533 253,671 117,514 2,676,714

F – 30
Identifiable assets
1,280,727 582,891 256,763 211,985 2,332,366
Long lived assets 783,568 367,218 241,371 150,452 1,542,609
Operating income 316,065 22,063 29,503 19,392 387,023
1999 Brazil United States Canada Other countries Total Net sales 1,243,478 163,165 244,800 69,545 1,720,988 Identifiable assets
1,290,617 563,631 272,883 204,203 2,328,975
Long lived assets 891,906 344,811 174,154 157,180 1,568,051
Operating income 302,764 14,501 50,679 7,911 375,855
20 Valuation and qualifying accounts
Year ended December 31, 2001:
Balance as of Charges Balances beginning to cost as of end
Description of the year and expenses Deductions of the year
Provisions offset against assets Allowance for doubtful accounts $ 19,345 $ 3,700 $ $ 23,045 Reserves: Provision for contingencies 70,395 (15,225) 55,170 Total $ 89,740 $ 3,700 $ (15,225) $ 78,215
Year ended December 31, 2000:
Balance as of Charges Balances beginning to costs and as of end
Description of the year expenses Deductions of the year Provisions offset against assets Allowance for doubtful accounts $ 9,318 $ (793) $ 10,820 $ 19,345 Reserves: Provision for contingencies 87,430 (7,440) (9,595) 70,395
Total $ 96,748 $ (8,233) $ 1,225 $ 89,740
Year ended December 31, 1999:
Balance as of Charges Balances

F – 31
beginning to costs and as of end Description of the year expenses Deductions of the year
Provisions offset against assets Allowance for doubtful accounts $ 9,685 $ (3,142) $ 2,775 $ 9,318 Reserves: Provision for contingencies 115,936 (58,081) 29,575 87,430 Total $ 125,621 $ (61,223) $ 32,350 $ 96,748
21 Goodwill of Ameristeel Corporation
In September 1999, the Company acquired a 74% interest in Ameristeel Corporation. This acquisition was
accounted for under the purchase method and the results of the acquired company have been included in the
financial statements of the Company from the respective date of acquisition. In 2000, Gerdau increased its
interest in Ameristeel to 85%.
The excess purchase price over the fair value of the net assets acquired, including expenses incurred by the
Company, has been recorded as goodwill and is included in other long-term assets. The amortization of
goodwill in 2001 and 2000 was US$ 6,529 and US$ 6,268, respectively. The net balance of goodwill at
December 31, 2001, was US$ 119,003, which was being amortized over a period of 25 years, starting
September, 1999.
22 Interest in Açominas
At December 31, 2001, the Company held a 37.90% equity interest in Aço Minas Gerais S.A. – Açominas
(“Açominas”), which is accounted for under the equity method. This investment includes an excess of
carrying value over the purchase price of the net assets acquired in the amount of US$ 191,398, which is
being amortized to income over the average remaining useful life of the fixed assets of Açominas, which is
approximately 30 years. After the conclusion of the transactions mentioned below, the Company will
include Açominas in its consolidated financial statements, and the excess of carrying value over the
purchase price will be offset against the carrying value of the fixed assets of Açominas.
On December 7, 2001 the Company offered US$ 177.7 million for the 17.67% participation on the capital
of Açominas held by Agropecuária Senhor do Bonfim. If all other major shareholders of Açominas
(Natsteel Corp., Fundação Aços de Seguridade Social, Clube de Empregados da Açominas and CEA

F – 32
Participações) resign their right of preference to acquire the shares of Açominas, the Company’s equity
interest in Açominas will increase to 54.13%. The deadline for the companies to announce their decision
was February 13, 2002, and the companies decided not to exercise their preference right.
The full financial statements of Açominas are included as an attachment to this report.
23 New accounting pronouncements
In June 2001, the Financial Accounting Standards Board (FASB) issued SFAS No. 141, "Business
Combinations". SFAS No. 141 addresses financial accounting and reporting for business combinations and
supersedes APB Opinion No. 16, " Business Combinations" and SFAS No. 38, " Accounting for Pre-
acquisition Contingencies of Purchased Enterprises". SFAS No. 141 requires that intangible assets be
recognized as assets apart from goodwill if they meet two criteria: the contractual-legal criterion and the
separability criterion. To assist in identifying acquired intangible assets, SFAS No. 141 also provides a list
of intangible assets that meet either of those criteria. In addition to the disclosure requirements prescribed
in APB Opinion No. 16, SFAS No. 141 requires disclosure of the primary reasons for a business
combination and the allocation of the purchase price paid to the assets acquired and liabilities assumed by
major balance sheet caption. SFAS No. 141 also requires that when the amounts of goodwill and intangible
assets acquired are significant to the purchase price paid, disclosure of other information about those assets
is required, such as the amount of goodwill by reportable segment and the amount of the purchase price
assigned to each major intangible asset class. Based on an initial assessment of the provisions and
requirements of SFAS No. 141, management believes that the implementation of this statement will not
result in a significant impact to the Company's consolidated financial statements.
In June 2001, FASB issue SFAS No. 142, “Goodwill and Other Intangible Assets”. SFAS No. 142
addresses financial accounting and reporting for acquired goodwill and other intangible assets and
supersedes APB Opinion No. 17, “Intangible Assets”. SFAS No. 142 also amends SFAS No. 121,
“Accounting for the Impairment of Long-lived Assets and for Long-lived Assets to Be Disposed Of”, to
exclude from its scope goodwill and intangible assets that are not amortized. SFAS No. 142 addresses how
intangible assets that are acquired individually or with a group of other assets (but not those acquired in a
business combination) should be accounted for in financial statements upon their acquisition. This
statement also addresses how goodwill and other intangible assets should be accounted for after they have
been initially recognized in the financial statements. With the adoption of SFAS No. 142, goodwill is no
longer subject to amortization over its estimated useful life, but rather it will be subject to at least an annual
assessment for impairment by applying a fair-value-based test. Additionally, negative goodwill is

F – 33
recognized as an extraordinary gain at the time of the business combination. The provisions of SFAS No.
142 must be applied starting with fiscal years beginning after December 15, 2001. Early application is
permitted for entities with fiscal years beginning after March 15, 2001, provided that the first interim
financial statements have not been issued. An exception to SFAS No. 142 application date is for goodwill
and intangible assets acquired after June 30, 2001, which will be immediately subject of the non-
amortization provisions of this statement. Based on an initial assessment of the provisions and requirements
of SFAS 142, management understands that the implementation of this statement will not result in any
significant impact to the Company’s financial statements. Initially the implementation of SFAS 142
resulted in discontinuing the amortization of goodwill on January 1, 2002. For the year of 2002 the effect of
discontinuing the amo rtization of goodwill will result in an increment of income before tax of
approximately US$ 6 million.
In June 2001, the FASB issued the SFAS No. 143, “Accounting for Asset Retirement Obligations”. SFAS
No. 143 basically requires that the fair value of a liability for an asset retirement obligation be recognized in
the period in which it is incurred if a reasonable estimate of fair value can be made. The associated asset
retirement cost is capitalized as part of the carrying amount of the long-lived asset. Under SFAS No. 143,
the liability for an asset retirement obligation is discounted and accretion expense is recognized using the
credit-adjusted risk-free interest rate in effect when the liability was initially recognized. In addition,
disclosure requirements contained in SFAS No. 143 will provide more information about asset retirement
obligations. SFAS No. 143 is effective for financial statements issued for fiscal years beginning after June
15, 2002 with earlier application encouraged. Management is still evaluating whether the implementation of
SFAS No. 143 will have a significant impact on the Company’s financial position and results of operations.
In August 2001, the FASB issued SFAS No. 144, "Accounting for the Impairment or Disposal of Long-
Lived Assets". This statement supersedes SFAS No. 121, "Accounting for the Impairment of Long-Lived
Assets and for Long-Lived Assets to be Disposed Of", although it retains the fundamental provisions of
SFAS No. 121. SFAS No. 144 also supersedes the accounting and reporting provisions of APB Opinion
No. 30, "Reporting the Results of Operations", for segments of a business to be disposed of but retains APB
No. 30's requirement to report discontinued operations separately from continuing operations and extends
that reporting to a component of an entity that either has been disposed of or it is classified as held for sale.
SFAS No. 144 is effective for fiscal years beginning after December 15, 2001 and interim periods within
those years, with early application encouraged. Based on an initial assessment of the provisions and
requirements of SFAS 144, management understands that the implementation of this statement will not
result in any impact to the Company’s financial statements.

F – 34
24 Subsequent events
As a recent development in its relations with investors, the Gerdau S.A. Executive Committee presented a
proposal at the shareholders' year-end meeting to grant all Common Stock and Preferred Shares a 100%
"tag along" right. This measure wa s approved by shareholders on April 30, 2002, and it will extend to all
shareholders a right that the new Brazilian Corporate Law extended only to minority Common stockholders
and only 80% of the tag along. Tag along grants to the minority shareholders the right to receive the same
amount paid to the major shareholder in case of transfer of control.
According to this same new law, by extending the tag along right to all shareholders, the Company no
longer needs to comply with the law that requires the payment of an additional 10% premium on dividends
pay out to preferred shareholders. The Company will pay the stated 30% (per its By-Laws) of adjusted net
profit instead of the legally required minimum if 25%.
On February 7, 2002, Gerdau signed a contract with Natsteel Corp. to acquire its 24.8% equity participation
in the capital of Açominas. According to the terms of the contract, the Company may exercise its buying
right until September 9, 2002, and pay the amount of US$ 207.6 million until the 10th day after the 30 day
preference deadline given to the other major shareholders in the control group. To protect itself against
exchange rate fluctuations, the Company carried out hedge operations through swap contracts in the same
amount and on the same date.
In order to adapt to the new economic reality in Argentina, the Company has promoted a financial and
corporate restructuring, which took place in March 28, 2002 as follows: Gerdau transferred its 71.77%
stake in Sociedad Industrial Puntana S.A. – SIPSA to its partner, Sipar Aceros S.A.. Gerdau maintains its
stake of 38.18% in Sipar, whereas SIPSA becomes an integral subsidiary of Sipar. This new structure
further reduced Gerdau’s exposure to the eventual impact of any additional currency devaluation in
Argentina and allows for better synergies between the two companies.
F – 35
Aço Minas Gerais S.A. - AÇOMINAS Consolidated Financial Statements together with Report of Independent Public Accountants December 31, 2001 and 2000

F – 36
Report of Independent Public Accountants To the Board of Directors of Aço Minas Gerais S.A. - AÇOMINAS: We have audited the accompanying consolidated balance sheets of AÇO MINAS GERAIS S.A. - AÇOMINAS (a Brazilian corporation) and subsidiaries, translated into U.S. dollars, as of December 31, 2001 and 2000, and the related translated consolidated statements of operations and comprehensive loss, changes in stockholders’ equity and cash flows for each of the three years in the period ended December 31, 2001. These financial statements are the responsibility of the Company’s management. Our responsibility is to express an opinion on these financial statements based on our audits. We conducted our audits in accordance with auditing standards generally accepted in the United States of America. Those standards require that we plan and perform the audit to obtain reasonable assurance about whether the financial statements are free of material misstatement. An audit includes examining, on a test basis, evidence supporting the amounts and disclosures in the financial statements. An audit also includes assessing the accounting principles used and significant estimates made by management, as well as evaluating the overall financial statement presentation. We believe that our audits provide a reasonable basis for our opinion. In our opinion, the translated financial statements referred to above present fairly, in all material respects, the financial position of Aço Minas Gerais S.A. - AÇOMINAS and subsidiaries as of December 31, 2001 and 2000, and the results of their operations and comprehensive loss and their cash flows for each of the three years in the period ended December 31, 2001, in conformity with accounting principles generally accepted in the United States of America. Belo Horizonte, Brazil,
January 28, 2002

F – 1
AÇO MINAS GERAIS S.A. - AÇOMINAS AND SUBSIDIARIES
CONSOLIDATED BALANCE SHEETS--DECEMBER 31, 2001 AND 2000
(Stated in thousands of U.S. dollars)
A S S E T S
2001 2000 CURRENT ASSETS:
Cash and cash equivalents $ 101,033 $ 148,527 Restricted cash 15,000 11,420 Accounts receivable - domestic 20,844 21,157 Allowance for doubtful domestic accounts (287) (1,579) Accounts receivable - foreign 31,303 17,958 Advances to suppliers 2,591 7,391 Notes and other receivables 11,960 9,055 Inventories 121,094 95,608 Deferred tax asset 4,115 - Prepaid expenses 1,603 1,193
------------- ------------- Total current assets 309,256 310,730
------------- ------------- NONCURRENT ASSETS:
Notes and other receivables 5,149 8,647 Property and equipment for sale, at fair value 4,055 5,019 Prepaid expenses 1,233 1,768 Prepaid pension cost 17,729 15,761 Deferred tax asset 29,447 - Escrow deposits 1,821 4,856 Investments 29 35 Property, plant and equipment, net 1,127,928 1,229,204
------------- ------------- 1,187,391 1,265,290
------------- ------------- Total assets $ 1,496,647 $ 1,576,020 ======= =======
The accompanying notes are an integral part of these consolidated balance sheets.

F – 2
AÇO MINAS GERAIS S.A. - AÇOMINAS AND SUBSIDIARIES
CONSOLIDATED BALANCE SHEETS--DECEMBER 31, 2001 AND 2000
(Stated in thousands of U.S. dollars)
L I A B I L I T I E S A N D S T O C K H O L D E R S ' E Q U I T Y
2001 2000 CURRENT LIABILITIES:
Loans and financing $ 30,499 $ 23,899 Advances on exchange and export contracts 108,102 79,581 Financing secured by future export sales 51,951 56,618 Suppliers and contractors 114,760 93,422 Accounts payable 6,414 9,186 Salaries and payroll charges 10,768 10,920 Taxes payable 909 1,168
------------- ------------- Total current liabilities 323,403 274,794
------------- -------------
NONCURRENT LIABILITIES: Loans and financing 101,206 51,866 Financing secured by future export sales 27,703 67,486 Accounts payable 1,732 2,756 Export prepayment 35,000 - Reserve for contingencies 10,299 18,606
------------- ------------- Total noncurrent liabilities 175,940 140,714
------------- -------------
STOCKHOLDERS' EQUITY: Common shares - no par value-
59,089,531 shares authorized and outstanding 4,273,861 4,273,861 Preferred shares - no par value-
17,798 shares authorized and outstanding 6,468 6,468 Legal reserve 7,046 5,082 Cumulative comprehensive loss (906,086) (732,753) Accumulated deficit (2,383,985) (2,392,146)
-------------- -------------- 997,304 1,160,512
-------------- -------------- Total liabilities and stockholders' equity $ 1,496,647 $ 1,576,020 ======== ========
The accompanying notes are an integral part of these consolidated balance sheets.

F – 3
AÇO MINAS GERAIS S.A. - AÇOMINAS AND SUBSIDIARIES
CONSOLIDATED STATEMENTS OF OPERATIONS AND COMPREHENSIVE LOSS
FOR THE YEARS ENDED DECEMBER 31, 2001, 2000 AND 1999
(Stated in thousands of U.S. dollars)
2001 2000 1999 GROSS SALES OF PRODUCTS AND SERVICES $ 530,438 $ 652,374 $ 510,570 REVENUE DEDUCTIONS:
Taxes on sales (56,234) (61,653) (51,370) Freight, discounts and returns (36,732) (49,280) (35,469)
------------ ------------ ------------ Deductions from gross sales (92,966) (110,933) (86,839)
------------ ------------ ------------ NET SALES OF PRODUCTS AND SERVICES 437,472 541,441 423,731 COST OF PRODUCTS AND SERVICES SOLD (325,759) (386,843) (320,515)
------------ ------------ ------------ Gross profit 111,713 154,598 103,216
OPERATING EXPENSES: Selling (11,229) (15,916) (15,073) General and administrative (30,598) (31,345) (30,588) Other operating (expense) income - net (11,368) 25,443 11,546
------------ ----------- ----------- Income from operations 58,518 132,780 69,101
Financial expenses (31,376) (34,448) (63,819) Financial income 33,543 31,313 27,877 Exchange losses (47,224) (33,532) (136,037) Non-operating expenses (2,358) (10,013) (419)
----------- ----------- ------------
Income (loss) before income taxes 11,103 86,100 (103,297) DEFERRED INCOME TAX BENEFIT 32,813 - -
----------- ----------- ------------ Net income (loss) for the year 43,916 86,100 (103,297)
OTHER COMPREHENSIVE LOSS:
Translation adjustments (173,333) (106,862) (502,655) -------------- ------------ -------------
Comprehensive loss $ (129,417) $ (20,762) $ (605,952) ======= ====== =======
Per share data: Basic earnings per 1,000 shares-
Common $ 0.74 $ 1.46 $ (2.27) Preferred $ 0.72 $ 1.44 $ (2.28)
Diluted earnings per 1,000 shares- Common $ - $ - $ (2.19) Preferred $ - $ - $ (2.28)
Weighted average number of Common shares outstanding 59,090 59,090 45,404 Weighted average number of Preferred shares outstanding 18 18 18
The accompanying notes are an integral part of these consolidated statements.

F – 1
AÇO MINAS GERAIS S.A. - AÇOMINAS AND SUBSIDIARIES
CONSOLIDATED STATEMENTS OF CHANGES IN STOCKHOLDERS' EQUITY
FOR THE YEARS ENDED DECEMBER 31, 2001, 2000 AND 1999
(Stated in thousands of U.S. dollars)
Additional
paid-in capital - Common
stock
Additional paid-in capital - Preferred
stock Legal
reserve Treasury
stock
Cumulative comprehensive
loss Accumulated
deficit Total BALANCES DECEMBER 31, 1998 $ 4,055,108 $ 6,468 $ - $ - $ (123,236) $ (2,369,867) $ 1,568,473 Capital contribution 101,985 - - - - - 101,985 Conversion of debentures 27,123 - - - - - 27,123 Premium on share issuance 2,366 - - - - - 2,366 Translation adjustments - - - - (502,655) - (502,655) Net loss for the year - - - - - (103,297) (103,297) --------------- ------------- ---------- ------------- ------------- -------------- --------------- BALANCES DECEMBER 31, 1999 $ 4,186,582 $ 6,468 $ - $ - $ (625,891) $ (2,473,164) $ 1,093,995 Capital contribution 82,161 - - - - - 82,161 Premium on share issuance 5,118 - - - - - 5,118 Reverse stock split - - - (7) - - (7) Cancellation of treasury stock - - - 7 - - 7 Translation adjustments - - - - (106,862) - (106,862) Net income for the year - - - - - 86,100 86,100 Transfer to legal reserve - - 5,082 - - (5,082) - ------------- ------------- --------- ------------ ------------ -------------- ------------- BALANCES DECEMBER 31, 2000 $ 4,273,861 $ 6,468 $ 5,082 $ - $ (732,753) $ (2,392,146) $ 1,160,512 Dividends paid - - - - - (33,791) (33,791) Translation adjustments - - - - (173,333) - (173,333) Net income for the year - - - - - 43,916 43,916 Transfer to legal reserve - - 1,964 - - (1,964) - ------------- ------------- --------- ------------ ------------ -------------- ------------- BALANCES DECEMBER 31, 2001 $ 4,273,861 $ 6,468 $ 7,046 $ - $ (906,086) $ (2,383,985) $ 997,304 ======= ======= ===== ======= ======= ======== ========
The accompanying notes are an integral

F – 2
part of these consolidated statements.

F – 1
Page 1 of 2
AÇO MINAS GERAIS S.A. - AÇOMINAS AND SUBSIDIARIES
CONSOLIDATED STATEMENTS OF CASH FLOWS
FOR THE YEARS ENDED DECEMBER 31, 2001, 2000 AND 1999
(Stated in thousands of U.S. dollars)
2001 2000 1999
CASH FLOWS FROM OPERATING ACTIVITIES: Net income (loss) $ 43,916 $ 86,100 $ (103,297) Non-cash adjustments - Depreciation 45,729 57,590 53,289 Provision for contingent liabilities 2,376 6,226 304 Noncurrent accrued interest expense 4,453 1,744 3,850 Exchange losses on long-term items 38,848 21,139 149,545 Allowance for losses on realization of noncurrent assets 3,289 - - Loss on disposals of property, plant and equipment 2,921 31,553 7,203 Present value adjustment on noncurrent assets 870 - - Deferred income tax benefit (30,875) - - Other (268) (254) 898 ----------- ----------- -----------
111,259 204,098 111,792 Changes in assets and liabilities-
Increase in accounts receivable (17,649) (10,672) (11,988) Increase in inventories (37,280) (14,116) (25,379) (Increase) decrease in notes and other receivables (3,983) 7,253 9,862 Decrease (increase) in advances to suppliers 3,347 (4,299) (2,755) (Increase) decrease in prepaid expenses (550) 76 (196) (Increase) decrease in escrow deposits and other (4,539) 29,216 (2,290) Increase in suppliers and contractors 33,149 3,438 24,110 (Decrease) increase in accounts payable (3,143) (19,834) 11,991 Increase (decrease) salaries and payroll charges 1,664 815 (4,164) (Decrease) increase in other payables (7,738) 404 (3,331)
------------- ------------- ------------- (36,722) (7,719) (4,140) ------------- ------------- ------------- Net cash provided by operating activities 74,537 196,379 107,652 ------------- ------------- -------------
CASH FLOWS USED IN INVESTING ACTIVITIES: Additions to property, plant and equipment (132,814) (61,140) (94,189) Decrease (increase) in property and equipment for sale 161 (2,766) (319) ----------- ----------- -----------
Net cash used in investing activities (132,653) (63,906) (94,508) ----------- ----------- -----------

F – 2
Page 2 of 2 2001 2000 1999
CASH FLOWS FROM FINANCING ACTIVITIES: Proceeds from advances on exchange and export contracts $ 232,301 $ 473,912 $ 203,475 Repayment of advances on exchange and export contracts (180,033) (482,234) (201,322) Proceeds from loans and financing 131,773 30,767 126,939 Repayment of loans and financing (75,955) (66,867) (150,406) Proceeds from financing secured by future export sales - - 61,998 Repayment of financing secured by future export sales (39,979) (47,481) (139,875) (Increase) decrease in restricted cash (4,946) (1,962) 12,125 (Increase) decrease on leasing (1,121) (1,588) 1,455 Capital contribution - 87,279 105,582 Dividends paid (26,198) - - ----------- ----------- ----------- Net cash provided by (used in) financing activities 35,842 (8,174) 19,971 ----------- ----------- ----------- Net (decrease) increase in cash and cash equivalents (22,274) 124,299 33,115 Effects of exchange rate change on cash and cash equivalents (25,220) (10,955) (303) Cash and cash equivalents at beginning of the year 148,527 35,183 2,371 ----------- ----------- ----------- Cash and cash equivalents at end of the year $ 101,033 $ 148,527 $ 35,183 ====== ====== ====== Supplemental disclosures of cash flow information-
Cash paid during the year for: Interest $ 23,553 $ 19,941 $ 50,063 Prepayment of income taxes 430 - - Supplemental investing and financing non-cash transactions-
Conversion of debentures - - $ 49,207
The accompanying notes are an integral part of these consolidated statements.
1
AÇO MINAS GERAIS S.A. - AÇOMINAS AND SUBSIDIARIES
NOTES TO THE CONSOLIDATED FINANCIAL STATEMENTS
AS OF DECEMBER 31, 2001, 2000 AND 1999
(Amounts stated in thousands of U.S. dollars, unless otherwise indicated)
1. BUSINESS AND OWNERSHIP MATTERS (a) Ownership matters In December 2000, the major Açominas stockholders held 72.29% of the Company’s voting capital. The major stockholders were: Agropecuária Senhor do Bonfim Ltda., Clube de Participação Acionária dos Empregados da Açominas - C.E.A., C.E.A. Participações S.A., Fundação Açominas de Seguridade Social - Aços, Gerdau Participações Ltda. and NatSteel do Brasil Ltda.. On December 7, 2001, the Gerdau Group made an offer to acquire the shares held by Agropecuária Senhor do Bonfim Ltda., in a sale transaction coordinated by the Central Bank of Brazil. As a consequence, at the conclusion of such transaction, the Gerdau Group’s interest in the Company’s voting capital will exceed 50%. (b) Business Açominas is a sociedade anônima incorporated as a limited liability company under the laws of the Federative Repubic of Brazil. Its principal business comprises the production of steel billets, blooms and slabs. In 2001, the Company focused its efforts and invested in process and technological updating and productivity improvement. In addition, initiatives were implemented aimed at reducing production costs and improving quality of products. The objectives achieved during the year included the expansion of the product mix, offering to the market products with higher value-added, as well as investments in technological improvements and in productivity gains. The combination of such factors is part of the Company’s objective of increasing revenues and, as a consequence, placing the Company among the world’s largest steel producers. The revamping and modernization of the blast furnace lasted 38 days between June and July 2001. Such improvements increased the production level from 2.7 to 3.0 million tons of liquid steel per year. The work consisted basically of the implementation of a new internal cover for the blast furnace, known as “stave cooler”. Such system includes the implementation of refrigerated panels made of cast iron and copper, increasing the internal volume of the blast furnace by 15% and the useful life of the internal cover by at least 10 years, now expected to reach 20 years.
2
Also in 2001, taking advantage of the existing infrastructure, the Company made additional investments, and at the beginning of 2002 it will start the operation of the new rolling line for structural shape steel of the “I” and “H” types, with sizes ranging from 6 to 24 inches, manufactured according to the latest worldwide technical concepts and principally destined to the civil construction market. At the end of the first semester of 2002, the structural shape steel will be marketable, with sufficient inventory to meet the estimated demand. The new structural shape steel with parallel rim profiles, manufactured according to modern international specifications, will mark the entry of Açominas into a market segment featuring potential growth and will further expand the higher value-added mix of products offered by the Company. In 2001, additional investments were also approved and the construction of a rolling mill for concrete reinforcing bars in the Ouro Branco Plant was started. Such equipment, with a production capacity of up to 600 thousand tons/year, was budgeted at $55 million, with start-up in 2003. Management expects significant increase in revenue and operating cash generation as a consequence of such investments. 2. BASIS FOR PRESENTATION OF CONSOLIDATED FINANCIAL STATEMENTS
(a) Accounting records The Company’s accounting records are maintained in Brazilian Reais (R$), based on the criteria prescribed by the Brazilian Corporate Law. The financial statements prepared based on such accounting records and the corporate law criteria are the basis for determining income taxes and stockholders’ rights, such as the computation of dividends. The accompanying consolidated financial statements have been prepared in accordance with accounting principles generally accepted in the United States of America (“U.S. GAAP”), which differ in certain respects from the accounting principles applied by the Company in its financial statements prepared in accordance with accounting principles generally accepted in Brazil or for other statutory purposes in Brazil. Stockholders' equity and results of operations included in these financial statements differ from those included in the statutory accounting records as a result of (i) the effects of differences between the rate of devaluation of the Brazilian Real against the United States dollar and the indices mandated for indexation of statutory financial statements through December 1995, and (ii) adjustments made to reflect the requirements of generally accepted accounting principles in the United States of America.
(b) Currency translation The Company conducts the majority of its business in Brazilian Reais and has selected the United States dollar as its reporting currency for purposes of these financial statements.
3
Through December 31, 1997 The U.S. dollar amounts for the periods presented up to December 31, 1997 were remeasured from Brazilian real amounts in accordance with the requirements of Statement of Financial Accounting Standards (SFAS) No. 52, "Foreign Currency Translation", applicable to companies operating in highly-inflationary economies as follows:
1. Inventories, property, plant and equipment, accumulated depreciation and investments, accounted for at cost, and stockholders' equity were remeasured at historical rates of exchange.
2. The remaining assets and liabilities denominated in Brazilian Reais were remeasured at the year-end exchange rates reported by the Central Bank of Brazil (R$1.1164 at December 31, 1997).
3. Accounts in the statement of operations were translated at the average exchange rate for the month of the charge or credit to income, except for those accounts relating to assets remeasured at historical rates, which were calculated based on the historical U.S. dollar cost of those assets.
4. Gains and losses resulting from the remeasurement of the financial statements were included in the net income for the year.
5. Assets and liabilities denominated in foreign currencies other than U.S. dollars were translated to
U.S. dollars at the exchange rates prevailing at each balance sheet date, and resulting gains and losses were included in income for the year as foreign currency transaction gains or losses.
From January 1, 1998 As of January 1, 1998, the Brazilian economy ceased to be considered highly inflationary, and the Company changed its functional currency from the reporting currency (U.S. dollars) to the local currency (Brazilian Reais). Accordingly, at January 1, 1998 the Company translated the U.S. dollar amounts of nonmonetary assets and liabilities into Reais at the current exchange rate (R$1.1164 to $1.00), and those amounts became the new accounting basis for such assets and liabilities. Pursuant to SFAS No.109, “Accounting for Income Taxes", the deferred tax benefit associated with the differences
between the new functional currency bases and the indexed tax bases was reflected as a deferred tax asset recorded
by a credit to the cumulative translation adjustment component of "other comprehensive loss" in stockholders’
equity.
For all years commencing on January 1, 1998 and thereafter, the Company translates all assets and liabilities into
U.S. dollars at the current exchange rate at each balance sheet date, and all accounts in the statements of operations
and cash flows at the average monthly rates prevailing during the period. Transactions affecting stockholders’
equity accounts, excluding those in retained earnings, are translated at historical rates. The translation gain or loss
resulting from this new translation process is included in the cumulative translation adjustment component of the
caption "other comprehensive loss “ in stockholders’ equity. The effects of exchange rate changes on monetary
assets and liabilities denominated in currencies other than the Brazilian Reais are recorded in current operations.
3. SIGNIFICANT ACCOUNTING POLICIES

4
The following is a summary of the significant accounting policies followed by the Company in the preparation of the consolidated financial statements.
(a) Consolidation-- The consolidated financial statements include the accounts of Aço Minas Gerais
S.A. - Açominas and its subsidiaries Açominas Comércio Importação e Exportação S.A. - Açotrading S.A. and Açominas Overseas Ltd.. All significant intercompany balances and transactions have been eliminated in consolidation.
(b) Cash and cash equivalents-- Temporary cash investments are stated at cost plus income accrued to
the balance sheet date, based on rates agreed upon with the financial institutions. The Company considers as cash equivalents deposits that can be redeemed on demand and investments that have original maturities of less then three months when required.
(c) Accounts receivable-- Accounts receivable from foreign customers are restated based on the
exchange rates prevailing at the balance sheet date. An allowance for doubtful accounts was recorded in an amount considered sufficient to cover probable losses on accounts receivable. Domestic receivables amounting to approximately $3,444 are pledged as collateral for loans.
(d) Inventories-- Inventories are stated at the lower of market value and production cost or average
purchase price. (e) Property, plant and equipment-- Property, plant and equipment are recorded at cost, including
capitalized interest and other costs incurred during the construction phase of major new facilities. Interest on loans denominated in Reais includes the effect of indexation of principal required by certain of the loan agreements. Interest on foreign currency borrowings excludes the effects of foreign exchange gains and losses.
Depreciation is computed under the straight-line method at rates that take into consideration the
useful lives of the related assets (Note 7). Assets under construction are not depreciated until they are placed into service. Expenditures for maintenance and repairs are charged to expense as incurred. Any gain or loss on the disposal of property, plant and equipment is recognized in the year of disposal. Expenditures for modernization or increase in productivity of the property, plant and equipment are capitalized.
The Company periodically evaluates the carrying value of its long-lived assets for impairment.
The carrying value of a long-lived asset is considered impaired by the Company when the anticipated undiscounted cash flow from such asset is separately identifiable and less than its carrying value. In that event, a loss would be recognized based on the amount by which the carrying value exceeds the fair market value of the long-lived asset. Fair market value is determined primarily using discounted anticipated cash flows.
No impairment losses have been recorded for any of the periods presented. (f) Other current and long-term liabilities-- Stated at known or determinable amounts, including,
when applicable, accrued charges and monetary variations. (g) Income taxes-- The Company accounts for income taxes under the provisions of SFAS No.109,
“Accounting for Income Taxes”, which requires the application of the comprehensive liability method of accounting for income taxes. Under this method, a company is required to recognize a deferred tax asset or liability for all temporary differences except that, prior to January 1,1998 in accordance with paragraph 9 (f) of SFAS No.109, no deferred taxes were recorded for differences relating to certain assets and liabilities that were remeasured from reais to U.S. dollars at historical exchange rates and that resulted from changes in exchange rates or indexing to inflation in local currency for tax purposes. Deferred tax assets and liabilities are measured using enacted tax rates in effect for the year in which those temporary differences are expected to be recovered or settled. Under SFAS No.109, the effect on deferred tax assets and liabilities of changes in tax rates is recognized in income for the period that includes the enactment date.

5
Deferred tax assets are reduced through the recognition of a valuation allowance, as appropriate, if, based on the weight of available evidence, it is more likely than not that the deferred tax asset will not be realized.
(h) Use of estimates-- The preparation of financial statements in accordance with generally accepted
accounting principles requires that the Company make estimates and use assumptions, in its best judgment, that affect the reported amounts of assets, liabilities and disclosures of contingent assets and liabilities as of the dates of the financial statements and the reported amounts of revenues, costs and expenses during the reporting periods. Significant estimates are used when accounting for the allowance for doubtful accounts, depreciation, impairment of long-lived assets, income taxes, including recognition of valuation allowances, pension and other post-retirement benefits and contingencies, among others. Actual results could differ from those estimates.
(i) Revenues -- The Company recognizes revenues when title passes, the earnings process is
substantially complete, and the Company is reasonably assured of the collection of the proceeds from the exchange, all of which generally occur upon shipment of the Company's products.
(j) Pension Plans-- SFAS No. 87, “Employers’ Accounting for Pensions”, has been applied from the
beginning of the earliest year presented in these financial statements. Approximately 98% of the Company’s employees are covered by the pension plan to which the Company ma kes contributions based on actuarially determined amounts.
(k) Income allocation-- Annual dividends are calculated in accordance with the provisions of the
Brazilian Corporate Law. Approval of the payment of such dividend is received during the Company’s Annual General Meeting, which must be held on or before April 30 of each year. Dividends are payable in Brazilian Reais and reflected in these financial statements upon approval (declaration).
(l) Compensated absences-- Vacation expense is fully accrued in the period the employee renders
services to earn such vacation. (m) Environmental and remediation costs-- Expenditures relating to ongoing compliance with
environmental regulations, designed to minimize the environmental impact of the Company’s operations, are capitalized or charged against earnings, as appropriate. Capitalization is considered appropriate when the expenditures will continue to provide benefits to the Company. Provisions for non-capital expenditures are charged against earnings at the time they are considered to be probable and reasonably estimable. Management believes that, at present, its facilities are in substantial compliance with the applicable environmental regulations.
Future information and developments will require the Company to continually reassess the
expected impact of environmental matters. However, the Company has evaluated its total environmental exposure based on current available data and believes that compliance with all applicable laws and regulations will not have a material impact on the Company’s liquidity, consolidated financial position or results of operations.
(n) Advertising costs-- Advertising costs are expensed when incurred. Advertising costs included in
selling and marketing expenses were approximately $845, $329 and $273 for the years ended December 31, 2001, 2000 and 1999, respectively. No advertising costs have been deferred at the balance sheet dates herein.
(o) Reclassifications in 2000 and 1999-- Certain amounts have been reclassified to conform with the
2001 presentation. 4. CASH AND CASH EQUIVALENTS

6
2001 2000 Cash and banks $ 6,947 $ 4,382 Temporary cash investments-
Bank certificates of deposit 863 89,370 Fixed-income funds and other 93,223 54,775
----------- ----------- $ 101,033 $ 148,527 ====== ======
As of December 31, 2001 and 2000, temporary cash investments include short and medium-term transactions
negotiable and with high liquidity in the market, subject basically to interest that approximates the Interbank Deposit
Certificate - CDI rate.
Restricted cash refers to funds collected from the customers in the financing transactions secured by future export
sales, whose proceeds are used to pay the financing installments. It is subject to interest that approximates 5% per
year.
5. NOTES AND OTHER RECEIVABLES
2001 2000 Current Noncurrent Current Noncurrent
BMP - Belgo Mineira Participações Ind. e Com. Ltda.
$ -
$ -
$ 1,310
$ -
Cia. Auxiliar de Empresas Elétricas Brasileiras - CAEEB
-
533
-
595
Advances to employees 1,321 - 1,372 - ICMS (State VAT) recoverable, withheld income tax on
investments and other taxes
7,955
4,219
4,161
1,250 Present value adjustment on ICMS (State VAT) - (946) - - Eletrobrás compulsory loan - 5,773 - 6,708 Excel Tubos 1,636 - 529 - Other 5,246 189 6,449 94 --------- ----------- --------- ----------- 16,158 9,768 13,821 8,647 Allowance for losses (4,198) (4,619) (4,766) - --------- ----------- --------- ----------- $ 11,960 $ 5,149 $ 9,055 $ 8,647 ===== ====== ===== ====== The receivable from CAEEB (Cia. Auxiliar de Empresas Elétricas Brasileiras) was partially written off in 2000 based on experts’ valuation and based on the opinion of the Company’s legal department about the realization of these receivables. 6. INVENTORIES
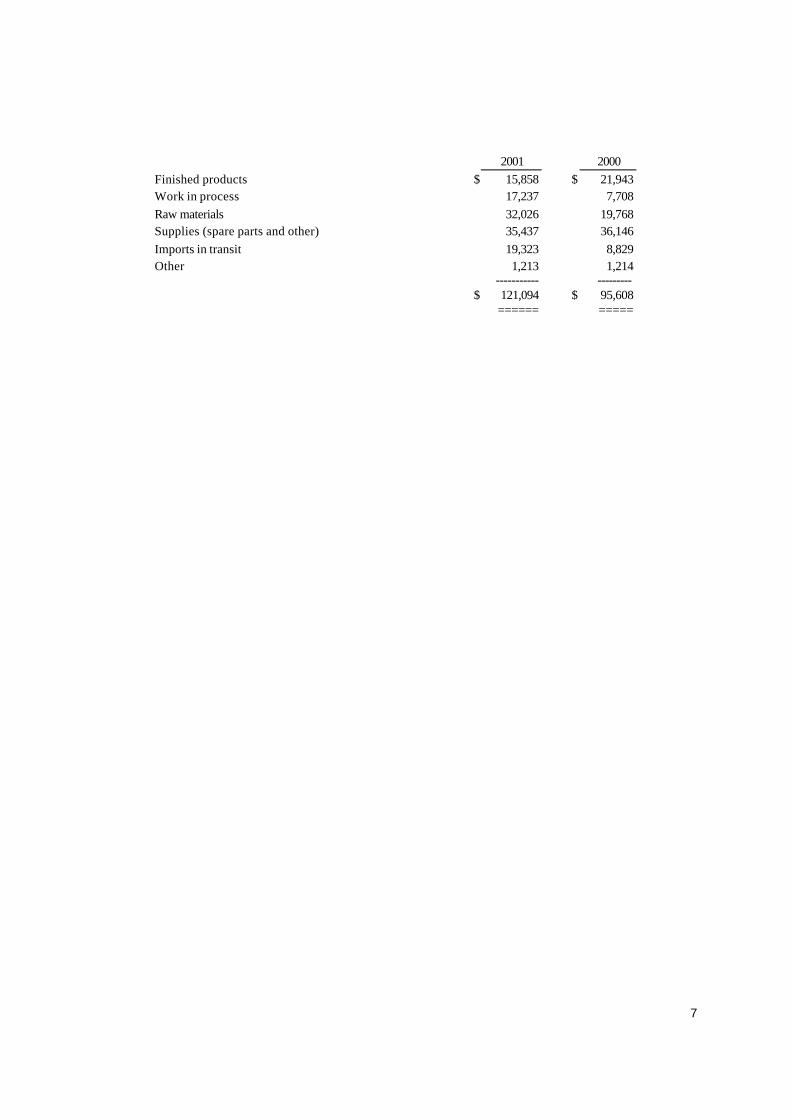
7
2001 2000
Finished products $ 15,858 $ 21,943 Work in process 17,237 7,708 Raw materials 32,026 19,768 Supplies (spare parts and other) 35,437 36,146 Imports in transit 19,323 8,829 Other 1,213 1,214
----------- --------- $ 121,094 $ 95,608
====== =====

8
7. PROPERTY, PLANT AND EQUIPMENT
Useful life - years
2001
2000
Steel mill 25 to 44 $ 1,505,350 $ 1,718,228 Leased plant 20 2,202 7,554 Administrative facilities 10 79,417 85,855 Marine terminal 11 to 39 30,267 35,543 Other 5 8,698 7,900 ------------- ------------- 1,625,934 1,855,080 Accumulated depreciation (642,950) (714,733) Land 59,688 70,906 Construction in progress 85,256 17,883 Discontinued plant - 68 ------------- ------------- $ 1,127,928 $ 1,229,204 ======= =======
The useful lives of the Company’s plant assets were determined by a technical study prepared by an independent
expert company.
Construction in progress as of December 31, 2001 and 2000 represents principally improvements in the
manufacturing facilities (Note 1 b).
The Company capitalized interest on construction in progress in the amount of $7,815, $790 and $4,448 in 2001,
2000 and 1999, respectively.

9
8. LOANS, FINANCING, ADVANCES ON EXCHANGE
AND EXPORT CONTRACTS AND EXPORT PREPAYMENT
2001 2000 Currency Current Noncurrent Current Noncurrent
Property, plant and equipment- Local currency- Caixa Econômica Federal R$ $ 4,828 $ 7,681 $ 4,859 $ 13,668 Cia. Vale do Rio Doce - C.V.R.D. R$ - - 415 -
Foreign currency- Banco do Brasil S.A. US$ 4,265 19,360 1,709 10,671 Banco Santander Brasil S.A. US$ 2,294 6,698 2,390 8,914 Marubeni Corporation US$ 3,017 9,757 2,801 10,410 Banco BNP Paribas US$ 2,485 6,779 - - Fortis Bank US$ 664 3,045 - - Siderúrgica J.L. Aliperti S.A. US$ 2,559 2,133 2,323 4,692 Other US$ 1,865 1,420 6 91
Working capital- local currency-
Banco Alfa R$ 1,475 17,459 2,879 1,025 BNDES R$ 30 10,740 - - Banco Itaú S.A R$ 1,852 3,686 - - Banco Pine R$ 2,954 1,145 1,499 791 Unibanco S.A. R$ 29 10,740 - - Other R$ 2,182 563 5,018 1,604
---------- ---------- ---------- ---------- $ 30,499 $ 101,206 $ 23,899 $ 51,866 ====== ====== ====== ======
Loans in local currency are subject to a weighted average interest rate of 13.40% p.a. (13.10% p.a. in 2000), including the TJLP, TR and IGPM indices. Loans in foreign currency are subject to exchange variation and a weighted average rate of 3.13% p.a. (6.64% in 2000). Loans are mostly guaranteed by chattel mortgage, promissory notes, pledge of equipment and assigned rights. The net book value of the property, plant and equipment items pledged amounts to $98,596 as of December 31, 2001 ($111,495 in 2000). Interest is paid on a monthly basis (loans for acquisition of property, plant and equipment in local currency and loans for working capital after their grace period) or on a semi-annual basis (loans in foreign currency and loans for working capital during the grace period). In July 2000, 850,987,275 debentures were redeemed by the Company at the buyers’ option, representing $117, out of a total amount of 797,872,340,430 debentures issued. There are no debentures outstanding as of December 31, 2001.

10
The long-term portion of loans matures as follows:
Year 2001
2002 $ - 2003 37,085 2004 20,293 2005 16,141 2006 14,517
2007 to 2009 13,170 ---------- $ 101,206 ======
Advances on exchange contracts are denominated in foreign currency and subject to exchange variation and an average interest rate of 4.69% per year. These advances mature in the short term. The export prepayment refers to a contract for advances on future exports and is subject to exchange variation and an interest rate of 2.4% above the semiannual LIBOR with the following maturity:
Year 2001
2003 $ 5,000 2004 20,000 2005 10,000
---------- $ 35,000 ======
9. FINANCING SECURED BY FUTURE EXPORT SALES As of December 31, 1998, the Company had financing transactions secured by future export sales made through its subsidiary, Açominas Overseas Ltd., by means of issuance of notes denominated in U.S. dollars, due quarterly until January 2002. In December 1999, the Company began a process of repaying all obligations to existing noteholders. To facilitate the program, the Company refinanced its Note obligations with a Loan advanced to Açominas Overseas Ltd. pursuant to an Advance Payment and Supply Agreement. The outstanding principal in December 31, 1999, in the amount of $59,197, was fully paid during 2000. The proceeds of the notes were used to purchase semi-finished products from the Company, under a Steel Sales Agreement whereby the Company sold 100% of the steel produced for export to countries outside of South America to Açominas Overseas Ltd., until all principal and interest on the notes had been paid in full. Following the repayment of the remaining note obligations, the Company will continue to sell 100% of the steel produced for export to countries outside of South America to Açominas Overseas Ltd. under a new agreement, which proceeds will be used to repay in full the principal and interest obligations on the Loan mentioned above. The price of the steel will be the prevailing price in the international market for semi-finished steel products. Effective December 1, 1999, Açominas Overseas Ltd. entered into an Advance Payment and Supply Agreement with Brazilian Steel International Trading Company (“BSIT”), a Cayman Islands special purpose company. Under the agreement, BSIT made an advance payment to Açominas Overseas Ltd. of $112,476, representing a gross loan of $150,000 made by a syndicate of commercial banks to BSIT less prepaid interest and related fees and other borrowing costs. As consideration for the advance payment, Açominas Overseas Ltd. is required to supply steel on behalf of BSIT to designated purchasers, over a specified period and of sufficient value (up to an aggregate amount of $150,000) such that the proceeds of sale flowing to BSIT enable it to meet its obligations to the lending banks. As BSIT does not have operations other than the financing secured by future export sales, all the assets, liabilities and results of operations of BSIT are included in Açominas’ financial statements.

11
The loan is repayable by BSIT in quarterly installments of $15,000 from March 1, 2001 until June 1, 2003. Prepayments are allowed, without penalty, subject to certain terms set out in the Loan agreement. The effective interest rate is 10.49% p.a.. The maturities are as follows:
Year 2001 2000 Current $ 51,951 $ 56,618
----------- ---------- Noncurrent 2002 - 33,743
2003 27,703 33,743 --------- ---------- 27,703 67,486 --------- ----------
$ 79,654 $ 124,104 ===== ======
10. SUPPLIERS AND CONTRACTORS
2001 2000 Suppliers and contractors - domestic $ 20,577 $ 23,154 Suppliers - foreign 94,183 70,268
----------- ----------- $ 114,760 $ 93,422
====== ====== The foreign supplier balance refers basically to acquisitions of coal, other raw materials and spare parts, substantially denominated in U.S. dollars. Coal acquisition transactions are subject to payment term of 360 days.
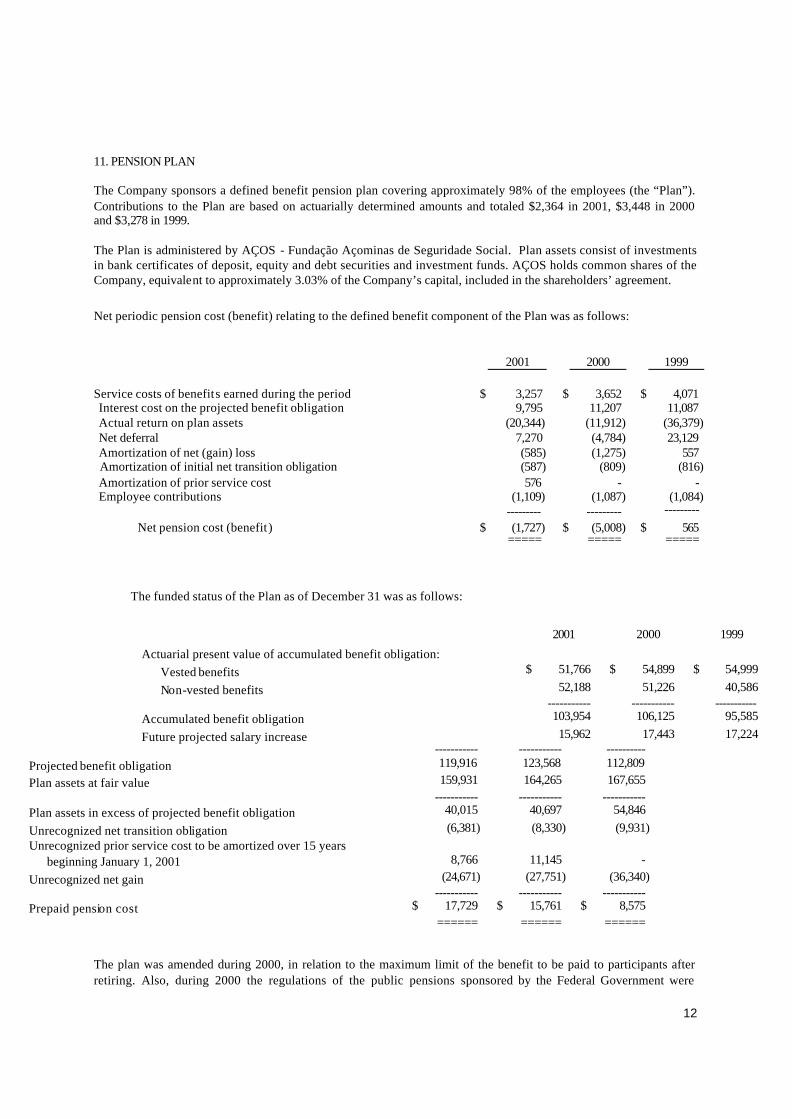
12
11. PENSION PLAN The Company sponsors a defined benefit pension plan covering approximately 98% of the employees (the “Plan”). Contributions to the Plan are based on actuarially determined amounts and totaled $2,364 in 2001, $3,448 in 2000 and $3,278 in 1999.
The Plan is administered by AÇOS - Fundação Açominas de Seguridade Social. Plan assets consist of investments in bank certificates of deposit, equity and debt securities and investment funds. AÇOS holds common shares of the Company, equivalent to approximately 3.03% of the Company’s capital, included in the shareholders’ agreement.
Net periodic pension cost (benefit) relating to the defined benefit component of the Plan was as follows:
2001 2000 1999
Service costs of benefits earned during the period $ 3,257 $ 3,652 $ 4,071 Interest cost on the projected benefit obligation 9,795 11,207 11,087 Actual return on plan assets (20,344) (11,912) (36,379) Net deferral 7,270 (4,784) 23,129 Amortization of net (gain) loss (585) (1,275) 557 Amortization of initial net transition obligation (587) (809) (816) Amortization of prior service cost 576 - - Employee contributions (1,109) (1,087) (1,084) --------- --------- ---------
Net pension cost (benefit ) $ (1,727) $ (5,008) $ 565 ===== ===== =====
The funded status of the Plan as of December 31 was as follows:
2001 2000 1999
Actuarial present value of accumulated benefit obligation:
Vested benefits $ 51,766 $ 54,899 $ 54,999
Non-vested benefits 52,188 51,226 40,586 ----------- ----------- ----------- Accumulated benefit obligation 103,954 106,125 95,585
Future projected salary increase 15,962 17,443 17,224 ----------- ----------- ---------- Projected benefit obligation 119,916 123,568 112,809
Plan assets at fair value 159,931 164,265 167,655 ----------- ----------- ----------- Plan assets in excess of projected benefit obligation 40,015 40,697 54,846
Unrecognized net transition obligation (6,381) (8,330) (9,931)Unrecognized prior service cost to be amortized over 15 years
beginning January 1, 2001
8,766
11,145
-
Unrecognized net gain (24,671) (27,751) (36,340) ----------- ----------- ----------- Prepaid pension cost $ 17,729 $ 15,761 $ 8,575 ====== ====== ======
The plan was amended during 2000, in relation to the maximum limit of the benefit to be paid to participants after retiring. Also, during 2000 the regulations of the public pensions sponsored by the Federal Government were

13
changed, impacting the actuarial evaluation of the Company’s pension plan. Such impacts are being reported as unrecognized prior service costs to be recognized during the next 15 years beginning January 1, 2001. Additional information required by SFAS No. 132 for the Plan is as follows:
2001 2000
Change in benefit obligation-
Benefit obligation at the beginning of the year $ 123,568 $ 112,809
Service cost 3,257 3,652
Interest cost 9,795 11,207
Actuarial gain 5,576 11,995
Benefit payments (4,108) (5,102)
Translation adjustments (18,172) (10,993) ----------- ----------- Benefit obligation at the end of the year $ 119,916 $ 123,568 ====== ====== Change in plan assets - Fair value of plan assets at the beginning of the year 164,265 167,655
Actual return on plan assets 20,344 11,912
Employer contributions 2,364 3,448
Participants contribution 1,184 1,361
Benefit payments (4,108) (5,102) Translation adjustments (24,118) (15,009) ----------- ----------- Fair value of plan assets at the end of the year $ 159,931 $ 164,265 ====== ======
2001 2000
Funded status- Funded status at the end of the year $ 40,015 $ 40,697
Unrecognized net transition obligation (6,381) (8,330)
Unrecognized prior service cost 8,766 11,145
Unrecognized gains (24,671) (27,751) ----------- ----------- Prepaid pension cost $ 17,729 $ 15,761 ====== ======
The unrecognized net transition obligation and net gains or losses are being amortized on a straight-line basis over
15 years.
Following is a summary of assumptions used in the accounting for the Plan:
2001 2000 1999 Weighted-average discount rate 10.24% 10.24% 10.24% Rate of increase in compensation 4.00% 4.00% 4.00% Long-term rate of return on plan assets 10.24% 10.24% 10.24%

14
12. DEFERRED INCOME AND SOCIAL CONTRIBUTION TAXES Temporary differences and carryforwards which give rise to deferred tax assets and liabilities are as follows:
2001 2000 Deferred tax assets:
Allowance for doubtful accounts- - accounts receivable $ 112 $ 537 - notes and other receivables 1,644 1,620
Reserve for contingent liabilities 3,308 6,326 Reserve for losses on fixed assets 94,847 139,949 Tax loss carryforwards 268,631 295,787 Difference of indices and depreciation of property,
plant and equipment
106,116
136,930 ----------- ----------- Gross deferred income tax assets 474,658 581,149 ----------- ----------- Deferred tax liabilities:
Prepaid pension cost 5,851 5,359 Capitalized interest on property, plant and equipment 81,916 130,210 Reserve for refurbishing and maintenance 6,147 7,733 Other 1,058 790
----------- ----------- Gross deferred income tax liabilities 94,972 144,092 ----------- ----------- Valuation allowance (346,124) (437,057) ----------- ----------- Net deferred income tax assets $ 33,562 $ - ====== ======
As a consequence of the capitalization process, the productivity increase, the cost reduction and the technological updating, management is expecting an increase in the Company's profitability. Based on this estimate, as well as the fact that the Company had profits in the last two years, the Company has reversed a portion of the valuation allowance during 2001 based upon management’s belief that it is more likely than not such deferred tax assets will be realized in the future upon the generation of taxable income. The tax loss carryforwards do not expire and may be carried forward for an indefinite period. Utilization of the tax carryforwards in any year, however, is limited to 30% of taxable income generated in such year. The amount of the deferred tax asset considered realizable, however, could be reduced if estimates of future taxable income are reduced.

15
The tax rates for the periods are:
Income tax 15% Additional income tax 10% Social contribution tax-
- from January 1 through April 30, 1999 8% - from May 1 through January 31, 2000 12% - from February 1 through December 31, 2002 9% - after January 1, 2003 8%
13. CONTINGENCIES
2001 2000 Tax litigation $ 3,441 $ 9,879 Civil litigation 2,685 3,629 Labor litigation 4,173 5,098 --------- --------- $ 10,299 $ 18,606 ===== =====
The Company is party to claims with respect to certain taxes, contributions and labor. Management believes, based on advice from legal counsel, that the reserve for contingencies is sufficient to meet probable and reasonably estimable losses in the event of unfavorable rulings, and that the ultimate resolution will not have a significant effect on the consolidated financial position as of December 31, 2001 or the results of future operations or cash flows. However, it is possible that these contingencies could have a material effect on quarterly or annual operating results, when resolved in future periods. The tax litigation reserve includes $2,787 ($2,916 in 2000) related to value-added tax (ICMS) charged by State of Santa Catarina on acquisition of coal in 1991. The Company has been challenged in the courts and prepared its defense, based on favorable reports of experts. Currently the Company is awaiting decision from the court. The remaining amount of $654 ($304 in 2000) in the tax litigation reserve relates to other tax claims and assessments that arose from the ordinary course of business. Approximately $3,893 of the tax litigation reserve recorded at December 31, 2000 related to federal social contribution tax on revenues (COFINS) being challenged by the Company due to the requirement for the inclusion of positive monetary variation in the calculation of such tax. Additionally, $2,766 related to a claim to recover the salary premium for education monthly paid by the Company, based on the argument of unconstitutionality of this premium. As part of the tax recovery program (Refis), the Company fully paid the amounts in 2000. The civil litigation reserve includes $2,276 ($2,351 in 2000) related to accidents and $409 ($585 in 2000) related to claims from contractors, which are being contested by the Company. The Company is also a party to a number of labor lawsuits. As of December 31, 2001, the Company has accrued $4,173 ($5,098 in 2000) relating to such lawsuits. Escrow deposits, which represent restricted assets of the Company, relate to amounts paid to the court and held in judicial escrow pending resolution of related legal matters. The balance as of December 31, 2001 is comprised principally of $786 ($652 in 2000) of labor claims and $553 ($604 in 2000) of payroll related charges. 14. STOCKHOLDERS' EQUITY
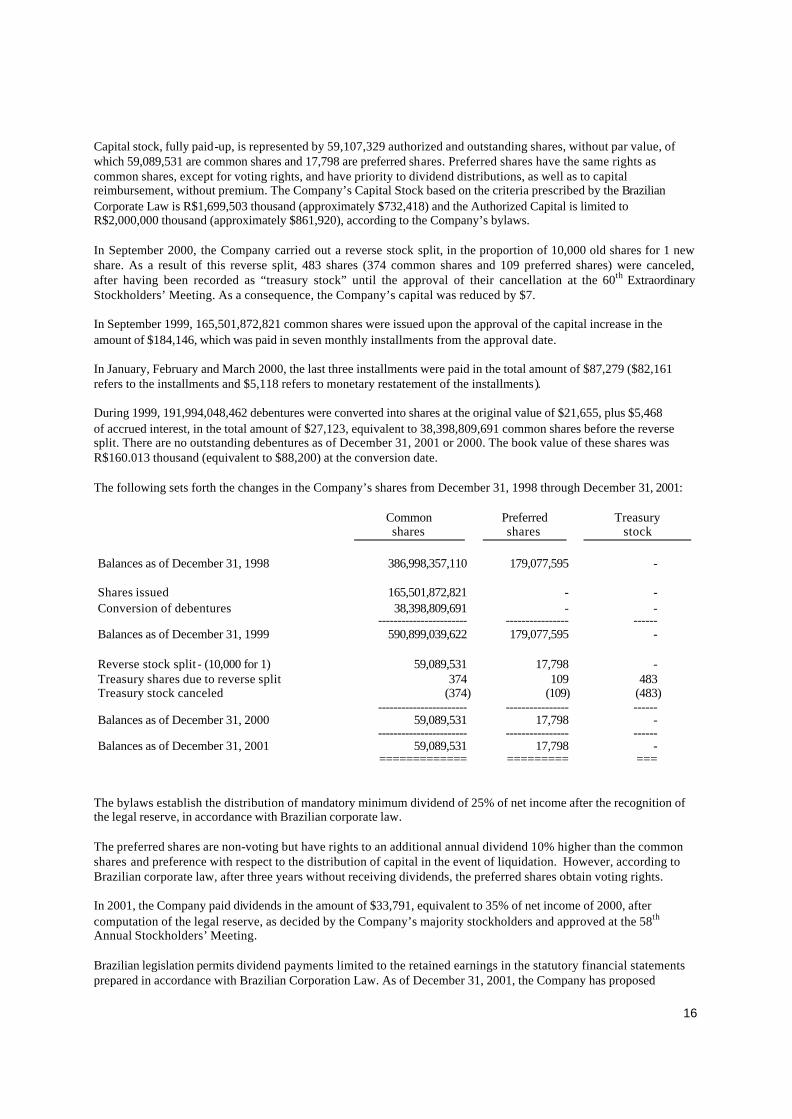
16
Capital stock, fully paid-up, is represented by 59,107,329 authorized and outstanding shares, without par value, of which 59,089,531 are common shares and 17,798 are preferred shares. Preferred shares have the same rights as common shares, except for voting rights, and have priority to dividend distributions, as well as to capital reimbursement, without premium. The Company’s Capital Stock based on the criteria prescribed by the Brazilian Corporate Law is R$1,699,503 thousand (approximately $732,418) and the Authorized Capital is limited to R$2,000,000 thousand (approximately $861,920), according to the Company’s bylaws. In September 2000, the Company carried out a reverse stock split, in the proportion of 10,000 old shares for 1 new share. As a result of this reverse split, 483 shares (374 common shares and 109 preferred shares) were canceled, after having been recorded as “treasury stock” until the approval of their cancellation at the 60th Extraordinary Stockholders’ Meeting. As a consequence, the Company’s capital was reduced by $7. In September 1999, 165,501,872,821 common shares were issued upon the approval of the capital increase in the amount of $184,146, which was paid in seven monthly installments from the approval date. In January, February and March 2000, the last three installments were paid in the total amount of $87,279 ($82,161 refers to the installments and $5,118 refers to monetary restatement of the installments). During 1999, 191,994,048,462 debentures were converted into shares at the original value of $21,655, plus $5,468 of accrued interest, in the total amount of $27,123, equivalent to 38,398,809,691 common shares before the reverse split. There are no outstanding debentures as of December 31, 2001 or 2000. The book value of these shares was R$160.013 thousand (equivalent to $88,200) at the conversion date. The following sets forth the changes in the Company’s shares from December 31, 1998 through December 31, 2001:
Common shares
Preferred shares
Treasury stock
Balances as of December 31, 1998 386,998,357,110 179,077,595 - Shares issued 165,501,872,821 - - Conversion of debentures 38,398,809,691 - - ----------------------- ---------------- ------ Balances as of December 31, 1999 590,899,039,622 179,077,595 - Reverse stock split - (10,000 for 1) 59,089,531 17,798 - Treasury shares due to reverse split 374 109 483 Treasury stock canceled (374) (109) (483) ----------------------- ---------------- ------ Balances as of December 31, 2000 59,089,531 17,798 - ----------------------- ---------------- ------ Balances as of December 31, 2001 59,089,531 17,798 - ============= ========= ===
The bylaws establish the distribution of mandatory minimum dividend of 25% of net income after the recognition of the legal reserve, in accordance with Brazilian corporate law. The preferred shares are non-voting but have rights to an additional annual dividend 10% higher than the common shares and preference with respect to the distribution of capital in the event of liquidation. However, according to Brazilian corporate law, after three years without receiving dividends, the preferred shares obtain voting rights. In 2001, the Company paid dividends in the amount of $33,791, equivalent to 35% of net income of 2000, after computation of the legal reserve, as decided by the Company’s majority stockholders and approved at the 58th Annual Stockholders’ Meeting. Brazilian legislation permits dividend payments limited to the retained earnings in the statutory financial statements prepared in accordance with Brazilian Corporation Law. As of December 31, 2001, the Company has proposed

17
dividends equivalent to $9,680, to be approved at the Annual Stockholders’ Meeting. The remaining accumulated profit included in the financial statements per Brazilian Corporate Law is R$205,796, equivalent to $88,690 at the exchange rate prevailing at that date. For US GAAP financial statement purposes, the absorption of accumulated deficits recorded in the financial statements per Brazilian Corporate Law was not considered. In accordance with SFAS No. 128, the following tables reconcile net income available to Common and Preferred shareholders and weighted average Common and Preferred shares outstanding to the amounts used to calculate basic and diluted EPS for the year ended December 31 1999, as well as to the amounts used to calculate basic EPS for the years ended December 31, 2001 and 2000. Due to the reverse stock split in 2000, the earnings per share computation for 1999 was retroactively adjusted to reflect such transaction.
2001 Common Preferred Total Basic numerator-
Actual dividends declared $ 33,781 $ 10 $ 33,791 Basic allocated undistributed earnings 10,122 3 10,125 ---------- ---- --------- Allocated net income available to Common and
Preferred shareholders
43,903
13
43,916 --------- --- ---------
Basic denominator- Weighted average shares 59,090 18
--------- ------ Basic earnings per share $ 0.74 $ 0.72
=== ===
2000 Common Preferred Total
Basic numerator- Actual dividends declared $ - $ - $ - Basic allocated undistributed earnings 86,074 26 86,100 ---------- --- ---------- Allocated net income available to Common and
Preferred shareholders
86,074
26
86,100 ---------- ------ ----------
Basic denominator- Weighted average shares 59,090 18
---------- ------ Basic earnings per share $ 1.46 $ 1.44
=== ===
1999 Common Preferred Total
Basic numerator- Actual dividends declared $ - $ - $ - Basic allocated undistributed earnings (103,256) (41) (103,297)
------------- ------ ------------ Allocated net loss available to Common and
Preferred shareholders
(103,256)
(41)
(103,297) ------------ ----- ------------
Basic denominator- Weighted average shares 45,404 18
---------- -------- Basic earnings per share $ (2.27) $ (2.28) ==== ====

18
1999 Common Preferred Total
Diluted numerator- Actual dividends declared $ - $ - $ - Basic allocated undistributed earnings (103,256) (41) (103,297) ------------ ----- ------------ Diluted allocated undistributed earnings (103,256) (41) (103,297) Interest expense on convertible debentures, net of tax 541 - 541
------------ ------ ------------ Allocated dilutive net loss available to Common and Preferred
shareholders
(102,715)
(41)
(102,756) ------------ ----- ------------
Diluted denominator- Basic weighted average shares 45,404 18 Convertible debentures 1,595 - ---------- ----- Diluted weighted average shares outstanding 46,999 18
---------- ------- Diluted earnin gs per share $ (2.19) $ (2.28) ===== ====

19
15. RELATED-PARTY TRANSACTIONS The principal balances and transactions with stockholders and other related companies are summarized as follows:
December 31, 2001
Gerdau S.A.
Holdercim
do Brasil S.A.
Fundação Açominas
de Seguridade
Social - AÇOS
Banco Real S.A.
ABN Amro
Sipar Aceros
Natsteel Trading
Total
BALANCES: Assets -
Current- Accounts receivable $ 3,168 $ 494 $ - $ - $ 1,894 $ 1,958 $ 7,514
Liabilities-
Current- Suppliers (112) (154) - - - - (266)Accounts payable (31) - (16) (28) - - (75)Advances on exchange
and export contracts
-
-
-
(1,204)
-
-
(1,204) TRANSACTIONS:
Sales 44,930 3,510 - - 12,133 42,997 103,570 Purchases $ (1,670) $ (1,803) $ - $ - $ - $ - $ (3,473)

20
December 31, 2000
Companhia
Vale do Rio Doce
CVRD
Companhia Siderúrgica de Tubarão
CST
Companh
ia Siderúrgi
ca Nacional
CSN
Gerdau S.A.
Holdercim
do Brasil S.A.
Fundação Açominas
de Seguridade
Social - AÇOS
Banco Real S.A.
ABN Amro
Natsteel Trading
Total
BALANCES: Assets-
Current- Accounts receivable $ - $ - $ 2,283 $ 488 $ 374 $ - $ - $ 13,863 $ 17,008
Liabilities-
Current- Loans and financing (415) - - - - - - - (415) Suppliers - (79) (820) (138) (253) - - - (1,290) Accounts payable - - - - - (442) (5,074) - (5,516) Freight payable (267) - - - - - - - (267)
TRANSACTIONS:
Sales - 275 42,234 59,722 4,225 - - 75,497 181,953 Purchases - (8,537) (9,365) (1,929) (3,193) - - - (23,024) Freight $ (39,590) $ - $ - $ - $ - $ - $ - $ - $ (39,590)
December 31, 1999
Companhia
Vale do Rio Doce
CVRD
Companh
ia Siderúrgi
ca de Tubarão
CST
Companhia Siderúrgica Nacional
CSN
Gerdau S.A.
Holdercim do Brasil S.A.
Natsteel Trading
Total
TRANSACTIONS:
Sales $$ - $$ 48 $$ 329 $$ 22,279 $$ 3,951 $$ 39,417 $$ 66,024 Purchases - (536) (5,679) (1,218) (498) - (7,931) Freight $$ (29,643) $$ - $$ - $$ - $$ - $$ - $$ (29,643)

21

GERDAU S.A. NOTES TO CONSOLIDATED FINANCIAL STATEMENTS
(In thousands of US Dollars, except per share amounts)
1
Cia. Vale do Rio Doce - CVRD was a shareholder of DOCEPAR S.A., which was part of the Company’s stockholders agreement at December 31, 2000. DOCEPAR S.A. also held equity interest in Cia. Siderúrgica de Tubarão - CST and Companhia Siderúrgica Nacional - CSN. As of December 31, 2001 these companies are not considered related parties. Banco Real S.A. ABN Amro is a stockholder of the Company. Transactions with related parties were made under conditions that include monetary restatement and interest when applicable and considered by management to be in line with market conditions. 16. TAX RECOVERY PROGRAM - REFIS The Brazilian Government authorized, under the so-called REFIS program (Tax Recovery Program), that Federal taxes then under dispute could be paid by taxpayers on deferred terms and that certain tax credits either originally belonging to the relevant taxpayer or acquired from third parties could be used as payment currency. The Company took part in the Tax Recovery Program (REFIS), according to the terms of Law Nos. 9,664 and 10,002 dated April 10 and September 14, 2000, respectively, and complementary legislation. The Company totally amortized the balance of INSS and salary premium for education installments making use of this recovery program. The option for REFIS occurred in December 12, 2000. In 2000, the Company used social contribution tax losses in the total amount of $136,988, generated in prior years, to amortize interest and fines owe d by the Company, limited to 8% of the Social Contribution Tax Losses, according to the REFIS legislation. The Company recorded the gain generated in the operation as a financial income in the amount of $10,959.The Company decided to fully pay the principal due in December 2000. 17. COMMITMENTS (a) In September 1998 the Company signed two agreements with Holdercim do Brasil S.A., one for an annual
supply of 560,040 tons of granulated slag and another for the purchase of an annual total of 300,000 tons of limestone, both for a period of 120 months beginning October 1, 1998, in the aggregate amount of $25,347 and $16,708, respectively, the prices of which are subject to annual review by the parties.
(b) For the purpose of maintaining and expanding its product line, in October 1998 the Company leased properties
and industrial assets from Siderúrgica J.L. Aliperti S.A. for periods of 60 and 240 months, respectively. For U.S. GAAP purposes, the lease of these properties and industrial assets was classified as a capital lease.
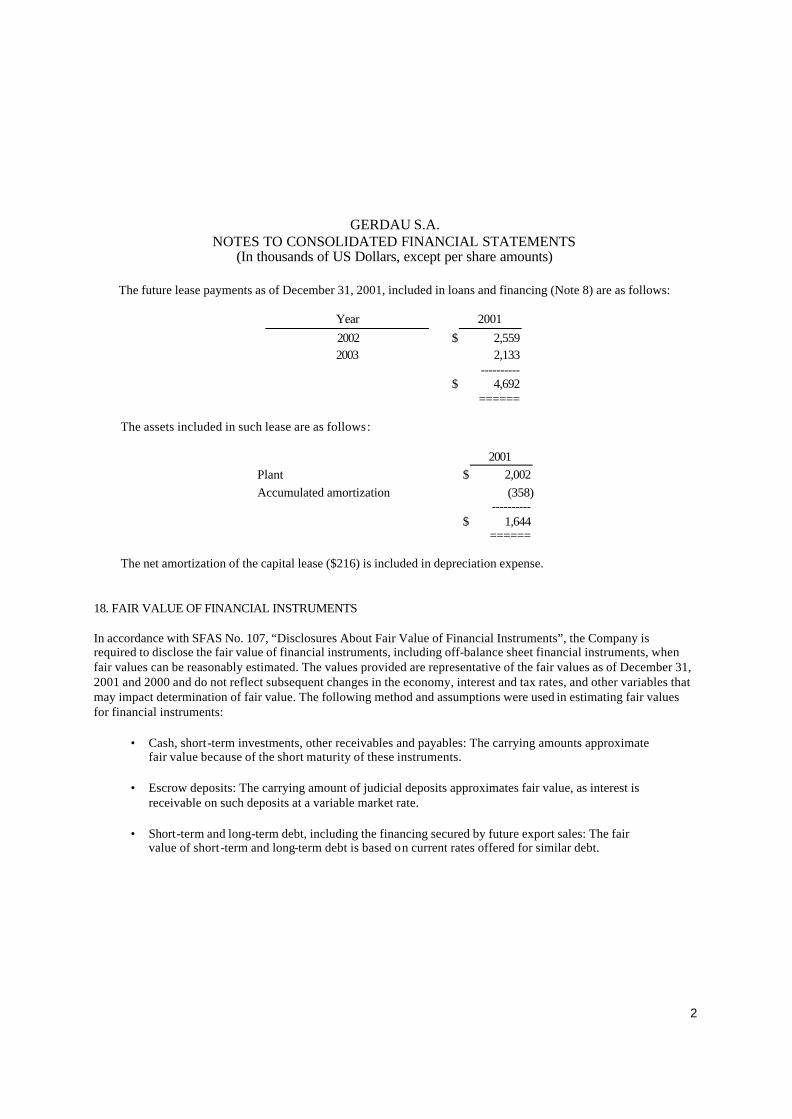
GERDAU S.A. NOTES TO CONSOLIDATED FINANCIAL STATEMENTS
(In thousands of US Dollars, except per share amounts)
2
The future lease payments as of December 31, 2001, included in loans and financing (Note 8) are as follows:
Year 2001 2002 $ 2,559 2003 2,133
---------- $ 4,692 ======
The assets included in such lease are as follows:
2001 Plant $ 2,002 Accumulated amortization (358) ---------- $ 1,644 ======
The net amortization of the capital lease ($216) is included in depreciation expense.
18. FAIR VALUE OF FINANCIAL INSTRUMENTS In accordance with SFAS No. 107, “Disclosures About Fair Value of Financial Instruments”, the Company is required to disclose the fair value of financial instruments, including off-balance sheet financial instruments, when fair values can be reasonably estimated. The values provided are representative of the fair values as of December 31, 2001 and 2000 and do not reflect subsequent changes in the economy, interest and tax rates, and other variables that may impact determination of fair value. The following method and assumptions were used in estimating fair values for financial instruments:
• Cash, short-term investments, other receivables and payables: The carrying amounts approximate fair value because of the short maturity of these instruments.
• Escrow deposits: The carrying amount of judicial deposits approximates fair value, as interest is
receivable on such deposits at a variable market rate. • Short-term and long-term debt, including the financing secured by future export sales: The fair
value of short-term and long-term debt is based on current rates offered for similar debt.

GERDAU S.A. NOTES TO CONSOLIDATED FINANCIAL STATEMENTS
(In thousands of US Dollars, except per share amounts)
3
The carrying amounts and fair values of the Company’s significant financial instruments as of December 31 are as follows:
2001 2000 Carrying
amount Fair value Carrying
amount Fair value
Cash and cash equivalent and restricted cash $ 116,033 $ 116,033 $ 159,947 $ 159,947 Escrow deposits 1,821 1,821 4,856 4,856 Loans and financing, advances on exchange and export
contracts, financing secured by future export sales and export prepayments $ 354,461 $
353,835 $ 279,450 $
278,523 19. CONCENTRATION OF CREDIT RISKS
No single customer of the Company, other than the related parties described in the note 15, accounted for more than
10% of net sales and no single supplier accounted for more than 10% of purchases. Historically, the Company has
not experienced significant losses on trade receivables.
20. SEGMENT INFORMATION
The Company’s operations are classified into two business segments: manufacturing and civil construction. The
manufacturing segment primarily consists of the production and sale of billets, slabs and blooms. The civil
construction segment principally involves the production and sale of concrete reinforcing bars and wire for
reinforced concrete.
Information about the Company’s segments is follows:
2001
Manufacturing Civil
Construction
Total Net sales $ 359,729 $ 77,743 $ 437,472 Income from operations 36,944 21,574 58,518 Identifiable assets 1,442,936 53,711 1,496,647 Capital expenditures 131,187 1,627 132,814
Depreciation $ 45,368 $ 361 $ 45,729

GERDAU S.A. NOTES TO CONSOLIDATED FINANCIAL STATEMENTS
(In thousands of US Dollars, except per share amounts)
4
2000
Manufacturing Civil
Construction
Total Net sales $ 473,459 $ 67,982 $ 541,441 Income from operations 107,940 24,840 132,780 Identifiable assets 1,509,360 66,660 1,576,020 Capital expenditures 57,156 3,984 61,140 Depreciation $ 57,451 $ 139 $ 57,590
1999
Manufacturing Civil
Construction
Total Net sales $ 358,621 $ 65,110 $ 423,731 Income from operations 56,414 12,687 69,101 Identifiable assets 1,592,763 33,670 1,626,433 Capital expenditures 89,317 4,872 94,189 Depreciation $ 52,619 $ 670 $ 53,289
Geographic information about net sales of the Company is as follows:
Region 2001 2000 1999 Domestic $ 181,376 $ 244,370 $ 191,205Asia 152,809 178,780 139,810North America 48,516 87,975 50,848Latin America (other than Brazil) 38,279 8,677 11,933Europe 8,706 19,579 29,935Other 7,786 2,060 - ------------ ------------ ------------ $ 437,472 $ 541,441 $ 423,731 ======= ======= =======
The operating assets are substantially located in Brazil.
21. NEW PRONOUNCEMENTS
In June 2001 the Financial Accounting Standards Board (FASB) issued Statement of Financial Accounting Standards (SFAS) No. 141, “Business Combinations”. SFAS No. 141 is effective for all business combinations initiated after June 30, 2001 and for all business combinations accounted for using the purchase method for which the date of acquisition is July 1, 2001, or later. SFAS No. 141 requires all business combinations initiated after June 30, 2001 to be accounted for using the purchase method. The Company does not anticipate that this new standard

GERDAU S.A. NOTES TO CONSOLIDATED FINANCIAL STATEMENTS
(In thousands of US Dollars, except per share amounts)
5
will have any impact on its financial position or results of operations. In June 2001 the FASB issued SFAS No. 142, “Goodwill and Other Intangible Assets”. SFAS No. 142 is effective for fiscal years beginning after December 15, 2001. Early application of SFAS No. 142 is permitted for entities with fiscal years beginning after March 15, 2001, provided that the first interim financial statements have not previously been issued. With the adoption of SFAS No. 142, goodwill is no longer subject to amortization over its estimated useful life, but rather it will be subject to at least an annual assessment for impairment by applying a fair-value-based test. Additionally, negative goodwill is recognized as an extraordinary gain at the time of the business combination. The Company does not anticipate that this new standard will have a significant impact on its financial position or results of operations. In June 2001 the FASB issued Statement of Financial Accounting Standards (SFAS) No. 143, “Accounting for Asset Retirement Obligations”. The new standard will be effective for financial statements issued for fiscal years beginning after June 15, 2002, with early application encouraged. The Company plans to adopt this new standard in January 1, 2003. SFAS No. 143 addresses financial accounting and reporting for obligations associated with the retirement of tangible long-lived assets and the associated asset retirement costs. It applies to legal obligations associated with the retirement of long-lived assets that result from the acquisition, construction, development and/or the normal operation of a long-lived asset, except for certain obligations of lessees. This Statement requires that the fair value of a liability for an asset retirement obligation be recognized in the period in which it is incurred if a reasonable estimate of fair value can be made. The associated asset retirement costs are capitalized as part of the carrying amount of the long-lived asset. The Company has not yet quantified all of the effects of adopting SFAS No. 143 on its financial statements. In August 2001 the FASB issued SFAS No. 144, “Accounting for the Impairment or Disposal of Long-Lived Assets”. The new standard will be effective for financial statements issued for fiscal years beginning after December 15, 2001, with early application encouraged. The Company plans to adopt this new standard in January 1, 2002. SFAS No. 144 supersedes SFAS No. 121, “ Accounting for the Impairment of Long-Lived Assets and for Long-Lived Assets to Be Disposed Of”, although it retains the fundamental provisions of SFAS No. 121. SFAS No. 144 also expands the scope of discontinued operations presentation to a component of an entity and eliminates the exception to consolidation for a temporarily controlled subsidiary. The Company has not yet quantified all of the effects of adopting SFAS No. 144 on its financial statements.
* * * * * * * * *