20 15 an nua l report - tennessee state government - … al institution l r s|41st annu ep al report...
TRANSCRIPT

20 Tennesse
015 Aee Departme
Annt of Financi
nuaal Institution
al Rns|41st Annu
Repual Report |
portt

Dear Governor Haslam and Citizens of the State of Tennessee:
I am pleased to present the 41st Annual Report of the Department of Financial Institutions.
The Department regulates banks, credit unions, trust companies, business and industrial development corporations, industrial loan and thrift companies, insurance premium finance companies, mortgage lenders, brokers, servicers and originators, title pledge lenders, check cashers, deferred presentment services companies, money transmitters and flexible credit act lenders.
We play a vital role in regulating and supporting the financial services industry and ensuring that Tennessee financial institutions remain fiscally strong and comply with governing authority.
The Department’s mission is to ensure a safe and sound system of state-chartered institutions for Tennessee citizens, while giving institutions the opportunity to contribute to economic progress. In short, we seek to find balanced regulation. The condition of the Tennessee banking system continues to improve from the economic downturn. Tennessee state-chartered depository institutions remain well positioned to continue serving their communities.
Although some consolidation within the banking industry is anticipated in 2016, total loans and assets continue to increase and the complexity and breadth of operations continue to grow. There have been no applications for a state bank charter filed since 2007, but there have been a significant number of conversions from a federal charter to a Tennessee state banking charter.
The Department recommends legislation in 2016. We recommend legislation that updates who may control and be served by a private family trust company. We also recommend legislation clarifying our authority to obtain FBI criminal background checks.
The Department continues to develop and implement its Regulatory Balance mission for depository institutions. Department examiners seek to right size regulation to the merits of each institution and avoid a one size fits all approach in order to support the Governor’s economic goals for Tennessee. The Tennessee banking system is critical to the state’s economic vitality and the Department’s balanced regulatory approach supports economic progress.
With respect to non-deposit companies, the Department has established a new risk focused examination program that establishes a risk profile on licensed locations so that we can focus more resources on companies that are high risk. The goal is to improve the operations of non-deposit companies by sharing risk assessment information.

In an effois implemavoiding worker oexperienc
Our expefacing us announceteachers Literacy CTennessefinanciallyinstitution
Throughoas the cothat Tennbehalf of
Sincerely,
ort to suppormenting AWS
over $450,00r working froce to further
erience indica today. The Dements, worand students
Commission. eans to makey literate pubns.
out this repondition of the
nessee remai the employe
,
rt the efficien to reduce th00 in annual om home. Th help us find
ates that finaDepartment kshops, conss were all a p The mission
e sound finanblic is a key fa
rt you will fine entities theins a premierees of the De
nt and effectivhe office spaccost. Nearly he expectatio regulatory b
ncial literacyhas initiated
sumer alerts,part of this efn of the Tennncial decisionactor in estab
nd additionale Departmenr state for ba
epartment, th
ve regulationce that the De 90% of Depa
on is to bettebalance.
y is one of the a number o, panel discusffort. I serve nessee Finanns when it coblishing a saf
informationnt regulates. anking, trust his report is r
n of financial epartment isartment staff
er retain emp
e keys to deaf activities inssions and a on the boarcial Literacy mes to plannfe and sound
n related to th As you read and financiarespectfully s
institutions,s assigned byf will be eithe
ployees and c
aling with then recent years
n effort to rerd of the TennCommissionning, saving ad system of f
he work of th this report, yl services com
submitted.
the Departmy nearly 75%,er a mobile create more
e economic iss. Public serveach Tennessnessee Finan is to equip and investingfinancial
his agency, asyou will noticmpanies. On
ment ,
ssues vice see ncial
g. A
s well ce n

TABLE OF CONTENTS
Department Overview Mission and Vision Statements 1-2 Department Overview 3 Fiscal Review 2015 Fiscal Numbers at a Glance 4 2015 Technological Advancements 5-6 Administrative Division Commissioner’s Office, Administrative Division Personnel and Narrative 7 Legal Section Narrative 8 2015 Legislation and Rules 9 Consumer Resources 10 Consumer Education 11 Complaints by Industry and Category 12 Complaints by County 13 Bank Division Bank Division Narrative and Personnel 14-15 Application Activities and Data at a Glance 16-17 Money Transmitter 18 BIDCO Data and Additional Financial Information for State-Chartered Banks 19-29 Additional Financial Information for State-Chartered Trust Companies 29-31 Compliance Division Compliance Division Narrative and Personnel 32 Regulatory Oversight 33 Fiscal Year Highlights 33-34 Industrial Loan and Thrift Companies (TILT) 34-36 Flexible Credit Lenders 36-38 Residential Mortgage Lenders, Brokers and Servicers 38-39 Title Pledge Lenders 39-40 Deferred Presentment Companies 41-42 Check Cashing Companies, Home Equity Conversion Mortgage Lenders 43 Insurance Premium Finance Companies 43-44 Credit Union Division Credit Union Narrative and Personnel 45-46 Corporate Reorganizations 47 Additional Financial Information for State-Chartered Credit Unions 48-54

1 | P a g
OUR
The primTennessesoundnescontribut
OUR
Our visioservices scommunto protec
Com
Greg Gonbegan sethe deparof all stathas serve GonzalesprofessioGonzalesTransmittfunds traCommissLiteracy Ctechnolog
e
MISSIOary statutory
ee with a safess and compte to the econ
R VISIOn is the estabsystem withinities by encot citizens.
mmissinzales is the 1rving in this rrtment sincete-chartered ed as assistan
is a past Chaonal organiza
, for a numbter Regulatornsfer compa
sioner GonzaCommission. gies are affec
ON: y mission of te and sound liance with gnomic progre
ON: blishment of n which instituraging com
ioner 18th commisrole in 2005, 1986. In thisdepository ant commissio
airman of thetion of state er of years, srs Associatio
anies. He servles currently Gonzales alcting the U.S.
the Departmsystem of ba
governing lawess of Tennes
a regulatorytutions have merce while
Greg Gssioner of the and was reas position, Gond licensed n
oner and gen
e Conference banking comserved as a mn (MTRA), anved on the U
y serves on thlso currently . payment sy
ent of Financanks and othw, while givingssee and the
y program tha the opportu there is stro
Gonzae Tennessee appointed by onzales servenon-deposito
neral counsel
e of State Bammissioners member of thn organization
.S. Treasury’she Board of D serves on a
ystems.
cial Institutioer institutiong institutions
e nation.
at provides funity to succeong enforcem
ales Department Governor Bies as Tennesory financial l for the depa
nk Superviso in the Unitedhe Board of Dn of a majoris Bank SecreDirectors of tnational task
ons is to provns by ensurins the opportu
for a sound seed and servement of laws
t of Financial ill Haslam. H
ssee’s chief re institutions. artment.
ors (CSBS), wd States. ComDirectors of tity of the stat
ecy Act Advisothe Tennessek force study
vide the peopng safety andunity to
state financiae their and regulatio
Institutions,e has servedegulatory off Additionally
hich is the mmissioner the Money tes that reguory Group. ee Financial ying how new
ple of d
al
ons
who d in ficer y, he
late
w

2 | P a g e
Commissioner Greg Gonzales- Continued Commissioner Gonzales was born in Cookeville, Tennessee and graduated Cum Laude in Cursu Honorum with a bachelor’s degree from Tennessee Technological University in 1980. Gonzales served as a research assistant in 1980 to Sir Patrick Cormack, a Conservative Party member of the British Parliament. He earned a law degree from the University of Tennessee in 1984. Commissioner Gonzales is an avid baseball fan and has rooted for the Chicago Cubs since the 1960’s, which has taught him great life lessons in perseverance.

3 | P a g e
DEPARTMENT OVERVIEW:
Total Number of State-Chartered Institutions Fiscal Year June 30, 2014 vs. Fiscal Year June 30, 2015
CHARTERS June 30, 2014 June 30, 2015 Commercial Banks/Savings Banks 154 151 Trust Companies 8 9 Credit Unions 94 90 TOTAL NUMBER OF CHARTERS 256 250
Total Number of Licensed or Registered Non-Depository Financial Institutions and Individuals
Fiscal Year June 30, 2014 vs. Fiscal Year June 30, 2015 LICENSEES/REGISTRANTS June 30, 2014 June 30,2015 Industrial Loan and Thrift Companies 1,379 1,521
Insurance Premium Finance Companies 49 41
Mortgage Companies 549 568
Mortgage Branches 1,186 1,392
Mortgage Loan Originators 7,278 8,164 Money Transmitters 78 88
BIDCOs 1 1
Deferred Presentment 1,288 1,286
Check Cashers 645 609
Title Pledge Lenders 1,044 1,087
Flex Credit Lenders N/A 345
TOTAL NUMBER OF LICENSEES/REGISTRANTS 13,497 15,102
Total Refunded to Consumers per Industry Fiscal Year ending June 30, 2015
LICENSEES / REGISTRANTS TOTAL Industrial Loan and Thrift Companies $213,235.94 Mortgage Companies $38,458.51 Deferred Presentment $98,278.79 Title Pledge Lenders $191,148.81 Check Cashers $107,064.31 TOTAL REFUNDED $648,186.36

4 | P a g
2015 FUN
The Dep
St St B
C T In C D
RAppropAssessmNon-DeCredit UOther
T
e
FISCADING
partment’s
tate-Charteretate-Chartereusiness and orporations rust Compan
ndustrial Loaheck Cashing
Deferred Pres
REVENUE SOriations-Bank
ment Fees epository FeeUnion Superv
TOTAL REVEN
AL REVSOURC
s regulator
ed Banks ed Credit UnIndustrial De(BIDCOS)
nies n and Thrift g Companiessentment Com
OURCE k
s vision Fees
NUES
VIEW CES:
ry oversigh
ions evelopment
Companies s mpanies
AMO(ROUNDED T
HUNDRED
$11,26$5,96$2,54$591
$20,36
ht includes
OUNT TO NEAREST DOLLARS)
68,700 1,900 2,300 ,600
64,500
FISCAL NUThe Departmreceives no funds and isassessed to regulated andepartment In late FY 20one time set$1,000,000 fAt June 30, 2of these funcarried forw
:
Money T Mortgage
Loan Ori Insuranc
Compan Title Pled Flexible C
January 1
UMBERS Ament of Finanfederal or st
s fully funded the financiand superviset.
012, the Depattlement fundfrom a nation2015, the remds totaled $8
ward to FY 201
Transmitters e Companiesginators
ce Premium Fies
dge Lenders Credit Lende1, 2015
AT A GLANncial Institutiate taxpayer
d by the fees l institutions d by the
artment receds totaling nwide settlem
maining balan821,700 and 15.
s and Mortga
Finance
rs Effective
NCE ions r
eived
ment. nce was
age
5 | P a g
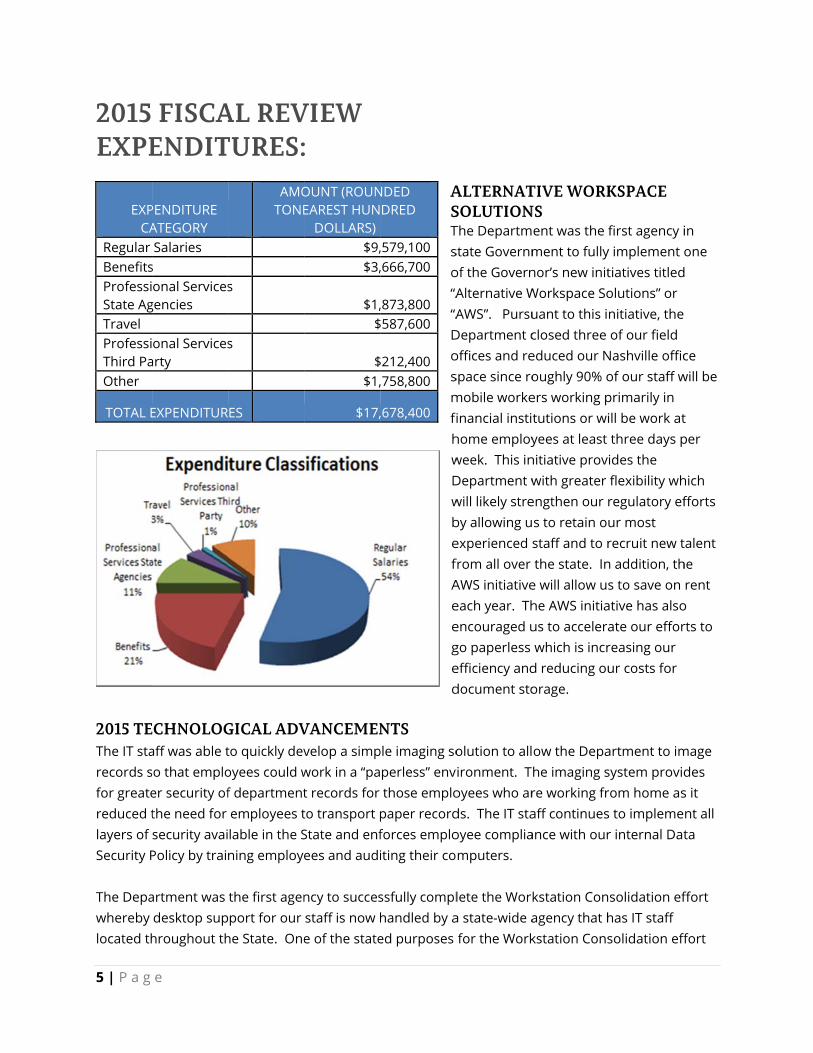
2015 EXPE
2015 TEThe IT starecords sfor greatereduced tlayers of Security P The Depawhereby located th
EXPCA
Regular BenefitsProfessiState AgTravel ProfessiThird PaOther
TOTAL E
e
FISCAENDIT
ECHNOLOGaff was able tso that emploer security ofthe need for security avaiPolicy by trai
artment was desktop sup
hroughout th
PENDITURE ATEGORY Salaries s onal Services
gencies
onal Servicesarty
EXPENDITUR
AL REVTURES:
GICAL ADVto quickly devoyees could wf department employees tlable in the Sning employe
the first agenport for our
he State. One
AMOTONE
s
s
ES
VIEW:
VANCEMENvelop a simpwork in a “pat records for to transport pState and enfees and audi
ncy to successtaff is now he of the state
OUNT (ROUNEAREST HUN
DOLLARS) $9,$3,
$1,$
$$1,
$17,
ASTso“A“ADosmfihwDwbefAeeged
NTS ple imaging so
perless” env those emplopaper recordforces emploiting their co
ssfully complhandled by aed purposes
NDED DRED
,579,100 ,666,700
,873,800 $587,600
$212,400 ,758,800
,678,400
ALTERNATSOLUTIONThe Departmstate Governmof the GovernAlternative WAWS”. Pursu
Department coffices and respace since romobile workeinancial insti
home employweek. This inDepartment wwill likely streby allowing uexperienced sfrom all over AWS initiativeeach year. Thencouraged ugo paperless efficiency anddocument sto
olution to allvironment. Toyees who ards. The IT staoyee compliamputers.
lete the Wora state-wide a for the Work
TIVE WORKNS
ent was the fment to fullynor’s new initWorkspace Souant to this iclosed three educed our Noughly 90% oers working ptutions or wiyees at least
nitiative provwith greater
engthen our rs to retain oustaff and to r the state. Ine will allow ushe AWS initiaus to accelera which is incrd reducing ouorage.
ow the Depahe imaging sre working fraff continuesance with our
kstation Conagency that hkstation Cons
KSPACE
first agency iy implement otiatives titledolutions” or nitiative, the of our field
Nashville officof our staff wprimarily in ill be work at three days pides the flexibility whregulatory efur most recruit new tn addition, ths to save on
ative has alsoate our efforreasing our ur costs for
artment to imsystem providrom home ass to implemer internal Dat
solidation efhas IT staff solidation eff
in one
ce will be
t per
hich fforts
talent he
rent o rts to
mage des s it nt all ta
ffort
fort

6 | P a g e
is to provide agency IT staff with more time to perform development work. Workstation Consolidation will also handle all inventory of computer equipment. TDFI completed development on the Flex Credit Renewal Application process.

7 | P a g
ADMThe Admservices, and cons TDFI contFinance a Training ithe DepastructureDeposit InFederal RNational ACouncil, NAssociatiodevelop f HEADQGreg Gon
ADMINTina G. MCounsel Michelle Leslie YanTeri CrowKelley CoCarmen MMary JaneBarbara JAssistant Christy AdSusan BlaFlora McCAssistant Tracy WhCharles InAdvanced
e
MINISTinistrative Dihuman resouumer resour
tinues to worand Administ
s another intrtment’s traid training cunsurance Co
Reserve SysteAssociation oNational Assoon and otherfuture leader
QUARTERS nzales, Comm
ISTRATIVEMiller, Deputy
Berry, Budgenez, Human R
w, HR Analystle, Administr
McCreedy, Exe Friedmannones, Admin dams, Cashieair, AdministrCarty, Execut ite, Executivengram, Busind
TRATIVvision managurces, traininrces.
rk with both ttration to dev
tegral part ofning needs a
urriculum is arporation, Na
em, Educationof State Credociation of Cors. The Depars in the Depa
missioner
E DIVISIONy Commission
et/Fiscal DirecResources D
rative Servicexecutive Secr, Accountant
nistrative Serv
ering Supervrative Servicetive Administ
e IT Director ness Technica
VE DIVges the Depa
ng and develo
the Departmvelop and im
f developing are annually aacquired throational Credinal Foundati
dit Union Suponsumer Creartment has aartment.
N ner/General
ctor irector
es Assistant retary t vices
isor es Assistant trative
al Support
VISIONartment’s budopment, lega
ment of Humaprove exami
and maintaiassessed and
ough externait Union Admon of the Co
pervisors, Fededit Administalso establish
COMTomInforHerbJoyce
JerreAdvaKennAdvaRamAdvaBonMarsEric MarDenBranPaulAssisAlanAliciaBettyAssis
N dget and oveal, informatio
an Resourcesiner career p
ning a qualifd budgeted.
al training souministration, B
nference of Sderal Financiatrators, Monehed an intern
MMISSIONm R. Hughes,
rmation Officb Kraycirik, Ce Simmons, C
emy Wilbergeanced neth Weemsanced
mesh Prajapatanced nie Heithcocsha AndersoRogers, Attok Kilpatrick, Aise Cole, Atto
ndi Snow, Attla Cagle, Execstant
n Smith, Consa Gay, Admin
tye Osborne, stant
ersees fiscal on systems,
s and the Depath with sala
fied staff. To The majorityurces such aBoard of GovState Bank Sal Institutioney Transmittnal leadershi
NER’S OFFILegislative Licer
CPA, CGFM, AChief Regula
er, Software
s, Software D
ti, Software D
ck, Project Maon, Legal Serv
rney Attorney orney torney cutive Admin
sumer Resounistrative Ser Administrat
partment of ary progressi
o ensure valuy of the s the Federavernors of thupervisors, s Examinatioer Regulatorip academy t
ICE iaison/Public
Audit Directortory Account
Developer
eveloper
Developer
anager Seniovices Directo
nistrative
urces Directorvices Assistaive Services
ion.
e,
l e
on s
to
c
r tant
or r
r ant

8 | P a g e
LEGAL SECTION The Legal Section provides legal advice and representation for the Department. It is comprised of a General Counsel, a Legal Services Director, six staff attorneys and one Legal Assistant. The Department’s Legal Section advises the Commissioner and departmental personnel in all legal matters affecting the Department. They work closely with regulated entities and the general public in addressing legal issues. They also work with the Governor’s Office and the Tennessee General Assembly on legislative issues affecting financial institutions. The Legal Section assists in the coordination of enforcement initiatives with other federal and state regulators as well as with various law enforcement agencies. The Legal Section represents the Department in all administrative enforcement actions initiated by the various divisions in the Department. The Legal Section was heavily involved in the 2015 Legislative session by tracking bills, working closely with the Governor’s Office, the General Assembly, and other groups sponsoring legislation which impacted the Department. It provided assistance to operating divisions on issues involving title pledge lenders, mortgage loan originator registration, predatory lending, bank and trust company operations including interstate transactions, bank and credit union applications, money transmission, Bank Secrecy Act compliance, check cashing, deferred presentment, mortgage companies, flexible credit lenders and credit union fields of membership, as well as other areas requiring legal expertise.

9 | P a g e
2015 LEGISLATION Public Chapter 241- Amends T.C.A. Title 45, Chapter 4 Effective Date: April 24, 2015
Public Chapter 241 amends Title 45, Chapter 4, more specifically at § 45-4-1002, by changing the manner in which the Commissioner assesses the annual supervision fee to state-chartered credit unions. This Act creates a more stable funding model for the Department’s Credit Union Division; it is based on actual budgetary needs; and, it addresses a concentration risk on revenue resources. This Act requires the Commissioner to determine the annual budget for the Credit Union Division, then divide the budget among the credit unions and assess each credit union a supervision fee in proportion to the credit union’s share of total assets in the system. This Act authorizes the Commissioner to establish minimum assessment tiers in lieu of any pro rata assessment and, for credit unions with assets greater than one billion dollars, a maximum assessment not exceeding 80% of the amount allocated. The minimum assessment tier shall not exceed five thousand dollars ($5,000.00). This Act requires that the Department shall send each state credit union or its successor a notice to pay the full supervision fee for the fiscal year and that the supervision fee shall not be prorated for any reason. Payment of the supervision fee shall be due within thirty (30) days of the notice.
Public Chapter 438- Amends T.C.A. Title 45, Chapter 12 Effective Date: May 18, 2015
Public Chapter 438 amends Title 45, Chapter 12, the Flexible Credit Act. This Act adds language to § 45-12-109 authorizing the Commissioner to conduct criminal history records checks at license renewal on an individual who is a director, officer, or ten (10%) or more shareholder of the licensee or, who owns or controls the licensee, as well as from any other individual associated with the licensee as is reasonably necessary to meet the purposes of the Flexible Credit Act. This Act provides that the criminal history records check shall be conducted by the Tennessee Bureau of Investigation and the Federal Bureau of Investigation and that the licensee must pay all costs associated with the criminal history records checks. Moreover, this Act adds language to Tenn. Code Ann. § 45-12-125 prohibiting the Commissioner from using a multi-state automated licensing system for sharing FBI criminal history record information unless authorized to do so by the federal Secure and Fair Enforcement for Mortgage Licensing Act or other federal law.
RULEMAKING No rules or amendments were filed in 2015.
10 | P a g e
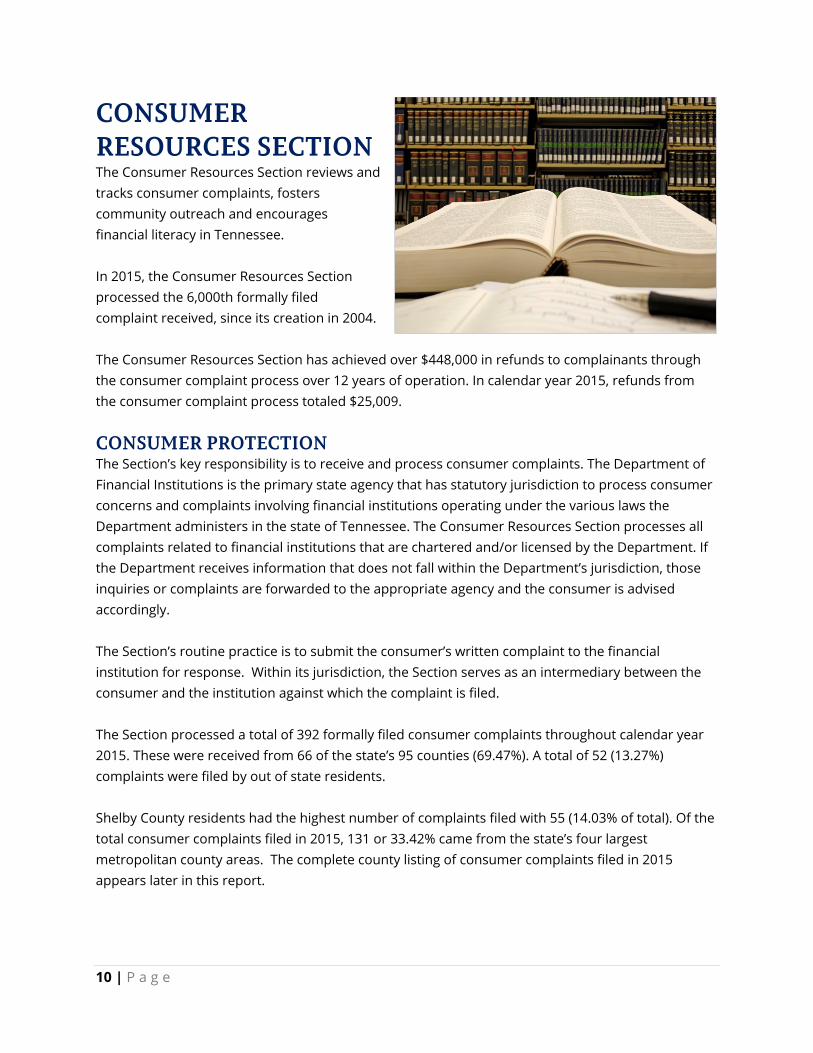
CONSUMER RESOURCES SECTION The Consumer Resources Section reviews and tracks consumer complaints, fosters community outreach and encourages financial literacy in Tennessee. In 2015, the Consumer Resources Section processed the 6,000th formally filed complaint received, since its creation in 2004. The Consumer Resources Section has achieved over $448,000 in refunds to complainants through the consumer complaint process over 12 years of operation. In calendar year 2015, refunds from the consumer complaint process totaled $25,009.
CONSUMER PROTECTION The Section’s key responsibility is to receive and process consumer complaints. The Department of Financial Institutions is the primary state agency that has statutory jurisdiction to process consumer concerns and complaints involving financial institutions operating under the various laws the Department administers in the state of Tennessee. The Consumer Resources Section processes all complaints related to financial institutions that are chartered and/or licensed by the Department. If the Department receives information that does not fall within the Department’s jurisdiction, those inquiries or complaints are forwarded to the appropriate agency and the consumer is advised accordingly. The Section’s routine practice is to submit the consumer’s written complaint to the financial institution for response. Within its jurisdiction, the Section serves as an intermediary between the consumer and the institution against which the complaint is filed. The Section processed a total of 392 formally filed consumer complaints throughout calendar year 2015. These were received from 66 of the state’s 95 counties (69.47%). A total of 52 (13.27%) complaints were filed by out of state residents. Shelby County residents had the highest number of complaints filed with 55 (14.03% of total). Of the total consumer complaints filed in 2015, 131 or 33.42% came from the state’s four largest metropolitan county areas. The complete county listing of consumer complaints filed in 2015 appears later in this report.

11 | P a g e
CONSUMER EDUCATION A key strategy in helping protect consumers is to develop and coordinate educational resources that can assist consumers in making informed financial decisions. Education is a powerful financial literacy tool. Consumers who understand their rights and responsibilities are better equipped to make sound financial decisions. The staff essentially provides one-on-one personal financial education on a daily basis through phone calls, letters and e-mail correspondence with consumers. One of the goals of the Section is to ensure that all Tennesseans have access to financial literacy programs that will help them make better money management decisions. The Commissioner is a board member of the Tennessee Financial Literacy Commission, which is to act as a clearing house for financial literacy activity in Tennessee and is to give input to the effort to increase financial literacy in elementary schools. We were privileged to partner with a number of agencies to promote savings in conjunction with America Saves Week. Throughout calendar year 2015, the section continued its partnership with Tennessee Jumpstart, A Coalition for Personal Financial Literacy. We also continued to serve on the Advisory Council for Bank on Music City, which is an initiative to reach the un-banked and under-banked in Nashville-Davidson County and the surrounding counties. This section continued issuing our quarterly newsletter titled “Spotlight on Finance” that is sent to more than 40,000 state employees. The newsletter is also posted on the Department’s website.
CONSUMER COMPLAINTS BY INDUSTRY INDUSTRY TOTAL
Bank* 96 Check Casher 3 Credit Union* 35
Default** 39 Deferred Presentment 33
Flexible Credit**** 17 Industrial Loan and Thrift (TILT)*** 43
Money Transmitter 17 Mortgage 87
Mortgage Loan Originator 6 Premium Finance 0
Title Pledge 16 TOTAL COMPLAINTS 392
*Calendar year ending December 31, 2015 *Bank and credit union data includes federally-chartered, other state-chartered and Tennessee state-chartered institutions. **DEFAULT category contains complaints against financial institutions and/or companies that were not subject to the Department’s regulation and the complaint was referred to the correct agency holding jurisdiction or regulatory authority. ***Tennessee Industrial Loan and Thrift Companies **** Flexible Credit Loans became effective January 1, 2015

12 | P a g
CON
FINANThe follow2015:
P Fr
g e
NSUMET
RANK
1
2
3
4
5
6
7
8
9
10
NCIAL EDwing is a listi
ellissippi Statriends for Lif
ER RESOOP TEN CO
Payme
Fa
U
Cr
UCATIONng of the pre
te Communife-Memphis
OURCEONSUMER
ALL
Custome
ent Processin
air Debt Coll
Forec
Modificatio
Misre
High
Unapproved
edit Bureau
N OUTREesentations m
ty College
ES SECCOMPLAI
LEGATION
er Service Iss
ng-Payment H
ections Act V
losure Issues
on or Deferra
epresentation
Interest Rate
Account Wit
Scams
Reporting Inf
EACH made or broc
CTIONINT ALLEG
sues
History Issue
Violations
s
al Fees
n
e
hdrawal
formation
chures provid
- ContGATIONS
es
ded to variou
tinued
#
50
38
21
18
17
17
16
16
14
12
us groups du
ring

13 | P a g e
CONSUMER RESOURCES SECTION- Continued
TOTAL COMPLAINTS BY COUNTY
County Total Complaints
Percent % County Total
Complaints Percent
% County Total Complaints
Percent %
Out of State 52 13.27% Hamblen 1 0.26% Moore 0 0.00%
Anderson 4 1.02% Hamilton 11 2.81% Morgan 1 0.26%
Bedford 2 0.51% Hancock 0 0.00% Obion 2 0.51%
Benton 2 0.51% Hardeman 1 0.26% Overton 0 0.00%
Bledsoe 0 0.00% Hardin 1 0.26% Perry 0 0.00%
Blount 7 0.00% Hawkins 2 0.51% Pickett 1 0.26%
Bradley 1 0.26% Haywood 1 0.26% Polk 0 0.00%
Campbell 1 0.26% Henderson 3 0.77% Putnam 1 0.26%
Cannon 0 0.00% Henry 0 0.00% Rhea 1 0.26%
Carroll 1 0.26% Hickman 0 0.00% Roane 2 0.51%
Carter 4 1.02% Houston 0 0.00% Robertson 3 0.77%
Cheatham 3 0.77% Humphreys 0 0.00% Rutherford 17 4.34%
Chester 1 0.26% Jackson 0 0.00% Scott 0 0.00%
Claiborne 1 0.26% Jefferson 1 0.26% Sequatchie 0 0.00%
Clay 0 0.00% Johnson 2 0.51% Sevier 8 2.04%
Cocke 1 0.26% Knox 20 5.01% Shelby 55 14.03%
Coffee 1 0.26% Lake 0 0.00% Smith 2 0.51%
Crockett 0 0.00% Lauderdale 2 0.51% Stewart 1 0.26%
Cumberland 2 0.51% Lawrence 2 0.51% Sullivan 8 2.04%
Davidson 45 11.45% Lewis 1 0.26% Sumner 11 2.81%
Decatur 2 0.51% Lincoln 1 0.26% Tipton 3 0.77%
Dekalb 2 0.51% Loudon 0 0.00% Trousdale 0 0.00%
Dickson 8 2.04% McMinn 2 0.51% Unicoi 2 0.51%
Dyer 1 0.26% McNairy 1 0.26% Union 0 0.00%
Fayette 0 0.00% Macon 1 0.26% Van Buren 0 0.00%
Fentress 0 0.00% Madison 5 1.28% Warren 3 0.77%
Franklin 1 0.26% Marion 6 1.53% Washington 7 1.79%
Gibson 0 0.00% Marshall 2 0.51% Wayne 0 0.00%
Giles 0 0.00% Maury 5 1.28% Weakley 1 0.26%
Grainger 0 0.00% Meigs 0 0.00% White 1 0.26%
Greene 1 0.00% Monroe 1 0.26% Williamson 14 3.57%
Grundy 0 0.00% Montgomery 9 2.30% Wilson 7 1.79%
Total 392 100.0%
14 | P a g
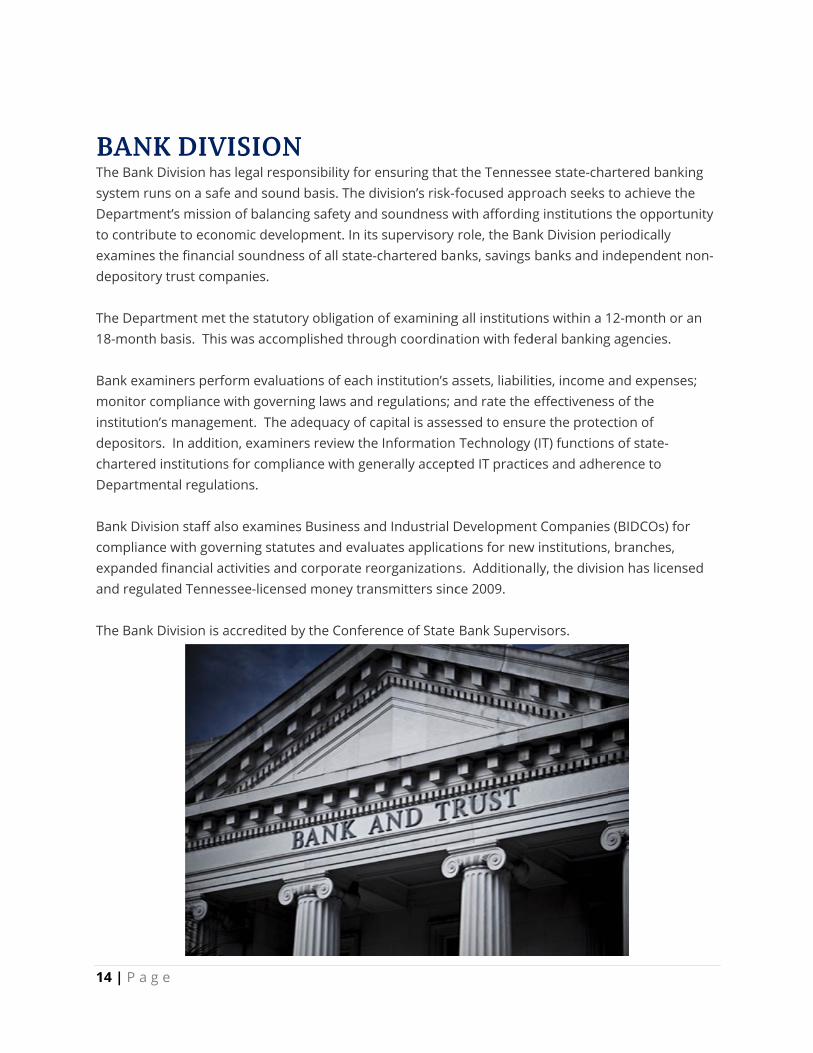
BANThe Banksystem ruDepartmeto contribexaminesdepositor The Depa18-month Bank examonitor cinstitutiondepositorcharteredDepartme Bank Divicomplianexpandedand regu The Bank
g e
K DIVIk Division hasuns on a safeent’s missionbute to econos the financiary trust comp
artment met h basis. This
miners perfocompliance wn’s managemrs. In additiod institutionsental regulat
ision staff alsce with goved financial aclated Tennes
k Division is a
ISION s legal respone and sound n of balancingomic developal soundnesspanies.
the statutory was accomp
orm evaluatiowith governinment. The adon, examiners for compliantions.
so examines erning statutectivities and cssee-licensed
accredited by
nsibility for ebasis. The divg safety and pment. In its s of all state-c
y obligation oplished throu
ons of each ing laws and rdequacy of cas review the nce with gen
Business andes and evaluacorporate reod money tran
y the Confere
ensuring thatvision’s risk-f soundness w supervisory chartered ba
of examininggh coordinat
nstitution’s aregulations; aapital is asses Information erally accept
d Industrial Dates applicatorganizations
nsmitters sinc
ence of State
t the Tennessfocused apprwith affording role, the Bannks, savings
g all institutiotion with fed
assets, liabilitand rate the ssed to ensu Technology ted IT practic
Developmenttions for news. Additionace 2009.
Bank Superv
see state-charoach seeks g institutions
nk Division p banks and in
ons within a 1deral banking
ties, income effectivenesre the protec (IT) functionces and adhe
t Companiesw institutions,
lly, the divisi
visors.
artered bankto achieve ths the opportueriodically ndependent
12-month or g agencies.
and expenses of the ction of s of state-
erence to
s (BIDCOs) fo, branches, on has licens
ing he unity
non-
an
es;
r
sed

15 | P a g
BAN ADMINTod TrulovTony MattDebra GrisWade McCJustin McCTransmitteClyde McC EXAMINWEST TENDanny NoPhillip StafTimothy RRoxanne TVicki Ivey, CoordinatRobert PraToniece JoGrant Cass
MIDDLE TTodd Rice,Mike Sisk, Storm MillSherri CasCoordinatEdward BlGerald ProKimberly MAlan KirkwMark Herr EAST TENNLouella McJessica HuJames MatJonathan PCoordinatChad HolbJosh RobeKenneth KAnthony VJamice Lan *ExaminationCEM, CertifiedCertified Ope
g e
K DIVIISTRATIO
ve, CEM, Assisthews, Chief Adssom, Chief AdCullough, ProgClinton, Prograers
Claran, Division
NATION PENNESSEE DIVIS
len, Bank Divisfford, Bank Reunions, Bank
Taylor, CEIC, FICEIC, Bank Offor ather, Bank Exhnson, COE, Bselberry, IT Ba
ENNESSEE DIV, Bank Division Bank Regionaer, CEM, Banksetty, CEIC, CFor ack, FI Special
oby, CFE, IT BaMorrow, Bank
wood, Bank Exaren, Bank Exam
NESSEE DIVIScElroy, Bank Dff, Bank Regiott Curtis, Bank Piper, Bank Ofor
bert, FI Special rtson, IT Bank
Kelley, Bank ExValentino, Bankne-Washburn,
n Personnel Desigd Examinations M
erations Examiner
ISION-N tant Commissdministrator– dministrator - ram Administ
am Administra
n Training Dire
ERSONNELSION sion Manager
egional SupervRegional Supe Special Exam
ff-Site Monitor
xaminer Bank Examinerank Examiner
VISION n Manager al Supervisor k Regional SupFE, Off-Site Mo
Examiner Trunk Examiner Examiner aminer miner
ION Division Manag
nal Supervisor Regional Supe
ff-Site Monitor
Examiner Tru Examiner
xaminer k Examiner Bank Examine
nation: anager; CEIC, Cert
- Cont
ioner ExaminationsApplications rator - Trust tor - Money
ector
L
visor ervisor iner Trust ing
r
ervisor onitoring
ust
ger r ervisor
ring
ust
er
tified Examiner-in-
inued
JamePhilipEkaeAdmWilliaMemGina
KennStepJeffreTeresHollyBrittaCheeCourBlake
ChryDarnJohn DilloJordaMattCodyWilliaJameZach
Joy SJamePennAshleCoreMichMadiSamuTimo
-Charge; CFE, Cert
es Dewhirst, Cop Ruffin, Safet
ette Udoumanainistrator am Cook, Safe
mory Barber, M Tarolli, Admin
neth Oliver, Bahen Barry Kofey Rial, Bank Esa Curtis, Bany Ragan, Bank any Williams, Bena Keltner, Bartney Hopper, e Mascolo, Ba
ystine Dobbs, Bnell Tate, Bank Tubb, Bank Exn Scott, Bank an Brown, Bant Hogan, Bank y Durham, Banam Borre, Banes Alley, Bank Eh Tarwater, Ban
Seaver, Bank Exes Cody Jordanny Peterson, Bey Carter, Ban
ey Wright, Banhael Blair, Bankison McMahanuel England, B
othy Whitley, B
tified Fraud Exami
onsumer Comty and Soundna, Safety and S
ety and SoundMT Applicationnistrative Serv
ank Examiner ffman, Bank ExExaminer k Examiner Examiner Bank Examineank Examiner Bank Examinenk Examiner
Bank Examinek Examiner xaminer Examiner
nk Examiner Examiner nk Examiner nk Examiner Examiner nk Examiner
xaminer n, Bank Examinank Examiner
nk Examiner k Examiner k Examiner n, Bank Exami
Bank ExaminerBank Examiner
ner; COE,
mpliance Liaisoness AdministrSoundness
ness Administs Specialist
vices Assistant
xaminer
er er
r
ner r
ner r r
on rator
trator

16 | P a g e
BANK DIVISION- Continued APPLICATION ACTIVITIES FY 14-15 NEW BANKS OPEN
There were no new bank openings in fiscal year 2014-15
BANK MERGERS MidSouth Bank, Murfreesboro, TN, merged with and into Franklin Synergy Bank, Franklin,
TN (July 2014) Community National Bank of the Lakeway Area, Morristown, TN, merged with and into
TriSummit Bank, Kingsport, TN (July 2014) Reliant Bank, Brentwood, TN, merged with and into Commerce Union Bank, Springfield, TN
(April 2015) Traders Bank, Tullahoma, TN ,merged with and into Citizens Bank of Lafayette, Lafayette, TN
(April 2015)
BANK CONVERSIONS There were no bank conversions in fiscal year 2014-15
BANK CLOSURES There were no bank closures in fiscal year 2014-15
BIDCO TRANSACTIONS There were no BIDCO application transactions in fiscal year 2014-15
NEW TRUST COMPANIES OPEN Advocacy Trust of Tennessee, LLC, Chattanooga, TN (February 2015)
MONEY TRANSMITTER TRANSACTIONS NEW LICENSE ISSUED
o Intuit Payments, Inc., Mountain View, CA (July 2014) o Remitly, Inc., Seattle, WA (July 2014) o Shaka Express Corp, Jersey City, NJ (September 2014) o TouchPay Holdings, LLC, Irving, TX (September 2014) o World First USA, Inc., Arlington, VA (November 2014) o U.S. Payments, LLC, Tulsa, OK (December 2014) o GAMDIRECT, LLC, Lynnwood, WA (January 2015) o Swanson Services Corporation, Denver, CO (January 2015) o Chime, Inc., New York, NY (April 2015) o PLACID NK CORPORATION, Westbury, NY (May 2015) o WorldRemit Corp., Denver, CO (June 2015) o Finxera, Inc., San Mateo, CA (June 2015)

17 | P a g e
BANK DIVISION- Continued
VOLUNTARY CORPORATE TRANSACTIONS o Petro Express Properties, LLC, Nashville, TN (January 2015) o nFinanSe Payments, Inc., Tampa, FL (April 2015)
INFORMATION AT A GLANCE (AS OF JUNE 30, 2015) BANK REGULATED INSTITUTIONS: 151 Banks 1 BIDCO 9 Independent non-depository trust companies 88 Money Transmitters BANK DATA CONSOLIDATED TOTAL ASSETS: $56.4 billion, representing a $3.9 billion or 7.55 percent change since June 30, 2014 CONSOLIDATED CAPITAL: $6.3 billion, representing 11.19 percent of total assets RETURN ON AVERAGE ASSETS (ROAA): Median ROAA of 0.83 percent with a median Net Interest Margin of 4.00 percent (includes all banks) ALLOWANCE FOR LOAN AND LEASE LOSSES (ALLL): Median ALLL to total loans and leases ratio of 1.39 PAST DUE RATIO: Median past due ratio of 1.10 percent TRUST COMPANY DATA TOTAL CONSOLIDATED CORPORATE ASSETS: $99.2 million, representing a less than 1 percent change compared to the same period in 2014 AGGREGATED NET INCOME FOR TRUST COMPANIES: $4.2 million, representing a 14 percent decline compared to the same period in 2014 TRUST ASSETS UNDER MANAGEMENT AND/OR CUSTODY: Reflects an increase of 10 percent from $18.5 billion to $20.3 billion, inclusive of assets invested in common/collective trust funds.

18 | P a g e
BANK DIVISION- Continued MONEY TRANSMITTERS The activities of Money Transmitter companies are governed by the “Tennessee Money Transmitter Act of 1994", codified at Tennessee Code Annotated Title 45, Chapter 7. There are exemptions that apply to certain government agencies, as well as business organizations. See Tennessee Code Annotated Section 45-7-204. The Department continues to enhance its policies and procedures to ensure that they efficiently and effectively facilitate its statutory responsibility to ensure certain consumer protections as well as to help provide a good business environment for legitimate industry. The Department also continues to be an active participant in the Money Transmitter Regulatory Association and Conference of State Bank Supervisors to facilitate fulfillment of its responsibilities with respect to money transmission licensing and regulation. Effective October 1, 2013 the Tennessee Department of Financial Institutions (TDFI) began using the National Mortgage Licensing System (NMLS) to manage money transmitter licenses. Through NMLS, entities are now able to apply for, amend, and renew their Tennessee money transmitter license authority conveniently and safely online. NMLS is a secure, web-based system created by state regulators to provide efficiencies in the processing of state licenses and to improve supervision of state regulated industries. Through NMLS, companies maintain a single record which they use to apply for, maintain, renew, and surrender licenses in one or more states. More information about NMLS can be found at: http://mortgage.nationwidelicensingsystem.org/Pages/default.aspx
Licensing- Each applicant for a money transmitter license must demonstrate, and each licensee must maintain, a net worth of not less than $100,000 computed according to generally accepted accounting principles. Persons transmitting, or proposing to transmit, money shall have an additional net worth of $25,000 per additional location or agent located in Tennessee, as applicable, to a maximum of $500,000. The applicant must demonstrate such experience, character, and general fitness as to command the confidence of the public and warrant the belief that the business will be operated lawfully and fairly. As of June 30, 2015, the division licensed 88 money transmitters.
19 | P a g e
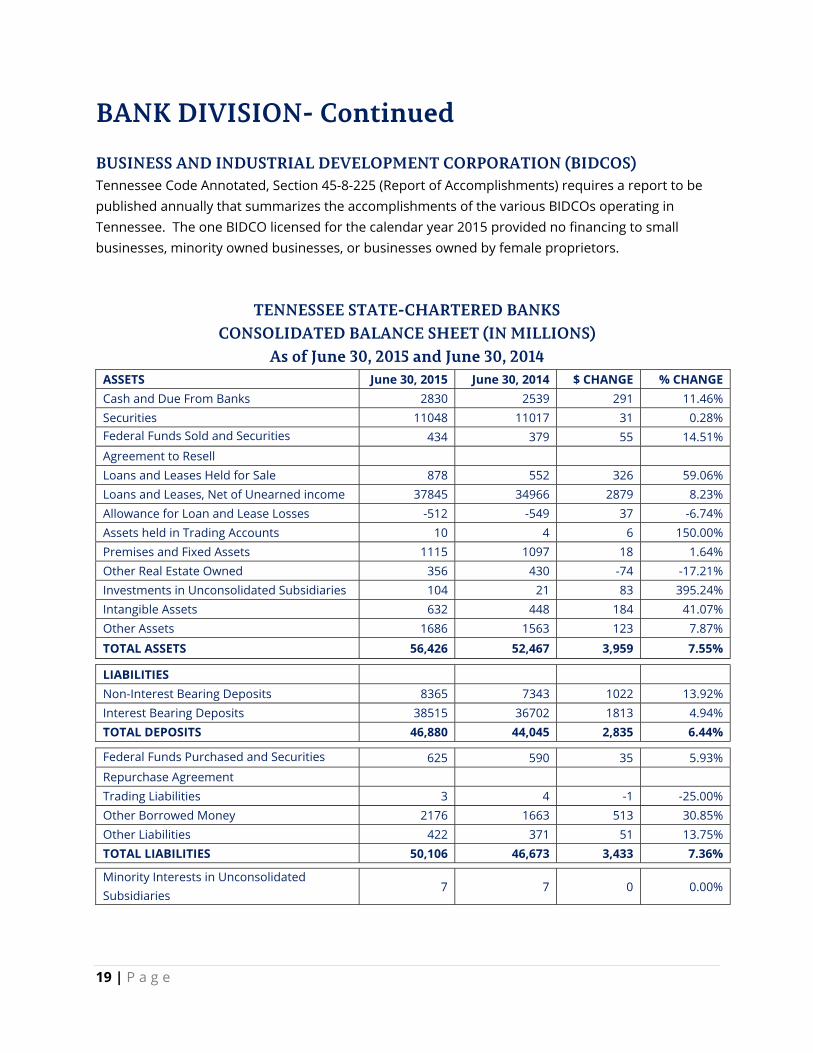
BANK DIVISION- Continued BUSINESS AND INDUSTRIAL DEVELOPMENT CORPORATION (BIDCOS) Tennessee Code Annotated, Section 45-8-225 (Report of Accomplishments) requires a report to be published annually that summarizes the accomplishments of the various BIDCOs operating in Tennessee. The one BIDCO licensed for the calendar year 2015 provided no financing to small businesses, minority owned businesses, or businesses owned by female proprietors.
TENNESSEE STATE-CHARTERED BANKS CONSOLIDATED BALANCE SHEET (IN MILLIONS)
As of June 30, 2015 and June 30, 2014 ASSETS June 30, 2015 June 30, 2014 $ CHANGE % CHANGE Cash and Due From Banks 2830 2539 291 11.46% Securities 11048 11017 31 0.28% Federal Funds Sold and Securities 434 379 55 14.51% Agreement to Resell Loans and Leases Held for Sale 878 552 326 59.06% Loans and Leases, Net of Unearned income 37845 34966 2879 8.23% Allowance for Loan and Lease Losses -512 -549 37 -6.74% Assets held in Trading Accounts 10 4 6 150.00% Premises and Fixed Assets 1115 1097 18 1.64% Other Real Estate Owned 356 430 -74 -17.21% Investments in Unconsolidated Subsidiaries 104 21 83 395.24% Intangible Assets 632 448 184 41.07% Other Assets 1686 1563 123 7.87%
TOTAL ASSETS 56,426 52,467 3,959 7.55% LIABILITIES Non-Interest Bearing Deposits 8365 7343 1022 13.92% Interest Bearing Deposits 38515 36702 1813 4.94% TOTAL DEPOSITS 46,880 44,045 2,835 6.44% Federal Funds Purchased and Securities 625 590 35 5.93% Repurchase Agreement Trading Liabilities 3 4 -1 -25.00% Other Borrowed Money 2176 1663 513 30.85% Other Liabilities 422 371 51 13.75% TOTAL LIABILITIES 50,106 46,673 3,433 7.36% Minority Interests in Unconsolidated Subsidiaries
7 7 0 0.00%

20 | P a g e
BANK DIVISION- Continued
TENNESSEE STATE-CHARTERED BANKS CONSOLIDATED BALANCE SHEET (IN MILLIONS)
As of June 30, 2015 and June 30, 2014EQUITY CAPITAL Preferred Stock 68 98 -30 -30.61% Common Stock 367 332 35 10.54% Surplus 3172 2873 299 10.41% Undivided Profits 2708 2488 220 8.84% Accumulated other Comprehensive Income 3 1 2 200.00% Other Equity Capital Components -5 -5 0 0.00%
TOTAL EQUITY CAPITAL 6313 5787 526 9.09% TOTAL LIABILITIES AND EQUITY CAPITAL 56,426 52,467 3,959 7.55%
TENNESSEE STATE CHARTERED BANKS CONSOLIDATED INCOME STATEMENT (IN MILLIONS)
Six months ending June 30, 2015 and June 30, 2014 JUNE 30, 2015 JUNE 30, 2014
Interest Income 1083 1043 Interest Expenses 113 118 NET INTEREST INCOME 970 925 Non-Interest Income 292 219 Non-Interest Expense 830 780 Provision for Loan and Lease Losses 26 31 Securities Gains/Losses 8 8 Pre-Tax Net Income 414 341 Applicable Income Taxes 108 89 NET OPERATING INCOME 306 252 Extraordinary Gains/Losses 0 0 NET INCOME 306 252 TOTAL CASH DIVIDENDS 132 108

21 | P a g e
TENNESSEE STATE CHARTERED BANKS SUMMARY OF INDIVIDUAL BANKS (IN THOUSANDS)
(A) (B) (C ) (D) (E) (F) (G) (H) (I) (J)
City Institution Cash Invest Total Loans
Loan Loss
Reserve
Other Assets
Total Assets
Deposits Other Liabilities
MIUS Capital Net Income
ADAMSVILLE Farmers & Merchants Bank
8825 8176 15951 434 1338 33856 28918 897 0 4041 49
ASHLAND CITY Community Bank & Trust 3817 102707 84546 3084 13785 201771 173018 8863 0 19890 -164
ATWOOD Citizens Bank & Trust Company
1828 14294 9522 46 543 26141 23778 89 0 2274 65
BARTLETT Bank of Bartlett 11183 92782 182097 2577 51122 334607 302597 7256 0 24754 75
BELLS Bank of Crockett 5271 83111 42075 584 10074 139947 120734 2443 0 16770 799
BOLIVAR Merchants & Planters Bank
4623 25173 46929 677 7667 83715 70511 2123 0 11081 285
BRENTWOOD Reliant Bank 23890 110116 615761 7425 58395 800737 602157 106790 0 91790 2606
BRIGHTON Brighton Bank 2169 7329 39559 462 2979 51574 48578 210 0 2786 -81
BROWNSVILLE INSOUTH Bank 14455 63580 189676 2459 22187 287439 256756 1551 0 29132 807
BYRDSTOWN People's Bank and Trust Company of Pickett
5714 16988 85912 2099 6728 113243 100091 607 0 12545 474
CAMDEN Apex Bank 19614 31021 295973 5503 37974 379079 295022 21880 0 62177 7850
CHATTANOOGA First Volunteer Bank 115851 76650 656342 8617 62912 903138 802834 9779 0 90525 5240
CHATTANOOGA Cornerstone Community Bank
33341 74504 309850 3579 20739 434855 331873 63193 0 39789 1244
CHATTANOOGA CapitalMark Bank & Trust 19644 141680 855201 7601 39986 1048910 910127 38490 0 100293 5005
CLARKSVILLE F&M Bank 23096 67218 713428 4975 62139 860906 693368 87054 7391 73093 2931
CLARKSVILLE First Advantage Bank 8647 49673 387842 5387 29295 470070 346266 62653 0 61151 1310
CLARKSVILLE Legends Bank 16338 93358 264617 3061 25268 396520 336208 23206 0 37106 1500
CLARKSVILLE Cumberland Bank and Trust
11646 16974 131122 1887 9180 167035 143604 5388 0 18043 803
CLEVELAND Bank of Cleveland 34952 0 177465 2915 14760 224262 186494 1119 0 36649 1599
CLEVELAND Southern Heritage Bank 25407 93830 128793 216 21690 269504 231458 803 0 37243 1188
CLIFTON Peoples Bank 4587 20347 110257 1594 15295 148892 128772 6878 0 13242 593
COLLIERVILLE BankTennessee 11003 17259 214735 3816 29097 268278 233018 7388 0 27872 1223
COLLIERVILLE Landmark Community Bank
14972 112840 601210 6415 30354 752961 607773 78286 0 66902 3260
COLUMBIA First Farmers and Merchants Bank
26363 432874 685965 8593 72152 1208761 1056888 39495 95 112283 5449
COLUMBIA Community First Bank & Trust
53095 101717 266347 4540 37061 453680 408200 2572 88 42820 2815
COLUMBIA Heritage Bank & Trust 15789 13035 69868 1738 6317 103271 90810 3913 0 8548 494
COOKEVILLE Bank of Putnam County 61732 142180 194429 1181 15538 412698 375300 4849 0 32549 1664
COOKEVILLE Putnam 1st Mercantile Bank
3904 24737 84455 1330 4856 116622 103056 417 0 13149 357
CORDOVA First Alliance Bank 7724 7998 96022 1620 10002 120126 103643 3604 0 12879 191
CROSSVILLE Cumberland County Bank 58897 93334 121514 1424 12792 285113 257885 5257 0 21971 990
DECATURVILLE Decatur County Bank 3689 27354 50865 780 7316 88444 74866 7070 0 6508 489
DECHERD Franklin County United Bank
8532 11894 58373 1665 6396 83530 73436 240 0 9854 -79
DICKSON Bank of Dickson 7888 77609 133077 1370 5945 223149 188154 6661 0 28334 792
DICKSON TriStar Bank 6211 65497 144055 1309 18862 233316 202644 10236 0 20436 714

22 | P a g e
TENNESSEE STATE CHARTERED BANKS SUMMARY OF INDIVIDUAL BANKS (IN THOUSANDS)
(A) (B) (C ) (D) (E) (F) (G) (H) (I) (J)
City Institution Cash Invest Total Loans
Loan Loss
Reserve
Other Assets
Total Assets
Deposits Other Liabilities
MIUS Capital Net Income
DUNLAP Citizens Tri-County Bank 60475 239247 316785 4784 40927 652650 579926 5142 0 67582 5137
DYER The Farmers & Merchants Bank
3522 50580 33123 252 9769 96742 80666 6626 0 9450 73
ELIZABETHTON Citizens Bank 25976 203954 442287 3149 27319 696387 525168 78890 0 92329 5233
ELIZABETHTON Security Federal Bank 2985 13827 37358 392 4288 58066 43296 1438 0 13332 339
ERIN Traditions First Bank 2906 33639 74604 741 6111 116519 101801 1999 0 12719 468
FARRAGUT SouthEast Bank 60817 9354 677054 3908 37207 780524 699093 10372 0 71059 5213
FAYETTEVILLE Bank of Lincoln County 14507 14749 90881 1304 11282 130115 112046 506 0 17563 650
FRANKEWING Bank of Frankewing 26420 32066 144195 3489 14661 213853 185519 4657 0 23677 910
FRANKLIN Franklin Synergy Bank 43414 681999 979032 8016 70187 1766616 1504574 97391 0 164651 6692
GALLATIN Sumner Bank & Trust 12439 48483 90531 1298 9676 159831 138346 7447 0 14038 709
GATES Gates Banking and Trust Company
599 28704 13234 308 2292 44521 38913 491 0 5117 274
GERMANTOWN First Capital Bank 11315 30778 198582 1231 9523 248967 202054 23667 0 23246 864
GLEASON Bank of Gleason 6856 73775 35762 1049 3059 118403 93940 842 0 23621 764
GREENEVILLE Andrew Johnson Bank 25119 27255 267713 4946 14682 329823 297629 1131 0 31063 1474
GREENEVILLE American Patriot Bank 7124 3395 41530 942 15358 66465 64600 458 0 1407 -164
GREENEVILLE Heritage Community Bank 5299 11762 67857 1438 9494 92974 86242 420 0 6312 97
GREENFIELD Greenfield Banking Company
4197 5286 40863 444 1681 51583 42691 2636 0 6256 152
HALLS Bank of Halls 1701 32893 30408 497 5677 70182 61483 710 0 7989 425
HALLS The Lauderdale County Bank
5868 19696 23852 314 2285 51387 45794 740 0 4853 158
HARROGATE Commercial Bank 42977 105896 596917 7704 72919 811005 668143 56981 0 85881 4148
HARTSVILLE Citizens Bank 3938 30262 140129 2128 7875 180076 156607 6153 0 17316 1068
HENDERSON Chester County Bank 15831 25756 26923 273 1463 69700 62639 247 0 6814 236
HUNTINGDON Carroll Bank and Trust 12169 40560 192556 1148 26782 270919 231800 11121 0 27998 602
JACKSON First South Bank 7393 150149 257019 2630 34977 446908 360296 31422 0 55190 3331
JACKSON The Bank of Jackson 3365 89156 53581 1062 8310 153350 132657 4637 0 16056 502
JAMESTOWN Union Bank 5627 68702 121372 2138 19926 213489 190049 1443 0 21997 533
JAMESTOWN Progressive Savings Bank 22625 28299 170933 1412 35947 256392 230434 1896 0 24062 606
JASPER Citizens State Bank 21254 22719 81012 588 14350 138747 127432 460 0 10855 313
JEFFERSON CITY First Peoples Bank of Tennessee
7510 28049 90440 704 11660 136955 120200 4761 0 11994 44
JELLICO UBank 5744 21746 34660 495 4589 66244 56825 742 0 8677 343
KINGSPORT Bank of Tennessee 16120 212887 645873 7359 65231 932752 781229 65777 0 85746 5262
KINGSPORT TriSummit Bank 13456 68297 217233 2027 24122 321081 260405 28377 0 32299 774
KNOXVILLE Mountain Commerce Bank 12557 39006 361356 5102 34649 442466 390208 11394 0 40864 1605
KNOXVILLE Clayton Bank and Trust 41596 64154 594118 20024 32575 712419 539633 41703 0 131083 11771

23 | P a g e
TENNESSEE STATE CHARTERED BANKSSUMMARY OF INDIVIDUAL BANKS (IN THOUSANDS)
(A) (B) (C ) (D) (E) (F) (G) (H) (I) (J)
City Institution Cash Invest Total Loans
Loan Loss
Reserve
Other Assets
Total Assets
Deposits Other Liabilities
MIUS Capital Net Income
KNOXVILLE American Trust Bank of East Tennessee
3307 23560 103640 1178 4805 134134 113546 4015 0 16573 548
LA FOLLETTE Peoples Bank of the South 10812 2509 120731 1673 7979 140358 118450 2130 0 19778 1029
LAFAYETTE Citizens Bank of Lafayette 34941 329584 424936 6658 44397 827200 679978 64283 0 82939 3907
LAFAYETTE Macon Bank and Trust Company
14898 192896 136803 2531 17306 359372 304951 9525 0 44896 1691
LAWRENCEBURG Lawrenceburg Federal Bank
4526 0 48443 235 3308 56042 41712 1147 0 13183 208
LEBANON Wilson Bank and Trust 40389 368492 1443537 22412 100399 1930405 1708850 12086 0 209469 11953
LEBANON CedarStone Bank 4113 43382 110690 1322 13423 170286 136174 18013 0 16099 482
LEBANON First Freedom Bank 45437 1963 252479 3504 22433 318808 266672 18617 0 33519 1925
LEWISBURG First Commerce Bank 15311 57104 205019 3187 16064 290311 258101 2993 0 29217 1774
LEXINGTON Community Bank 2077 19888 95078 1094 7527 123476 104335 7574 0 11567 842
LIVINGSTON Union Bank & Trust Company
4558 18335 58219 1103 2910 82919 72546 320 0 10053 1042
LIVINGSTON American Bank & Trust of the Cumberlands
13909 11154 161856 1948 11953 196924 174817 6519 0 15588 1256
LOBELVILLE Bank of Perry County 4459 13192 125595 1780 7984 149450 124465 10145 0 14840 1375
MADISONVILLE Volunteer Federal Savings Bank
30656 3437 125372 598 13561 172428 134615 13364 0 24449 444
MADISONVILLE Peoples Bank of East Tennessee
16966 35406 137186 1312 24986 213232 190530 1484 0 21218 220
MANCHESTER Peoples Bank & Trust Company
7153 21097 50116 789 6749 84326 73374 1477 0 9475 334
MANCHESTER Coffee County Bank 14143 13722 106988 2266 4946 137533 118540 1641 0 17352 1651
MARYVILLE Citizens Bank of Blount County
38535 110420 165526 2489 10809 322801 265990 3715 0 53096 1220
MARYVILLE Foothills Bank & Trust 13925 47150 136893 2618 6184 201534 172247 9626 0 19661 683
MC KENZIE McKenzie Banking Company
43653 22738 52617 1262 7442 125188 106177 798 0 18213 1235
MC MINNVILLE Security Federal Savings Bank of McMinnville
12001 39126 122284 1190 7859 180080 156985 5349 0 17746 535
MC MINNVILLE Homeland Community Bank
11611 42883 74617 1957 13489 140643 125926 1279 0 13438 312
MEDINA Medina Banking Co. 3572 24140 13785 219 3665 44943 37883 88 0 6972 55
MEMPHIS Trust Company Bank 5889 514 14611 342 4299 24971 22321 2505 0 145 -937
MEMPHIS Tri-State Bank of Memphis 23031 22284 76365 1778 5582 125484 112102 966 0 12416 81
MEMPHIS Financial Federal Bank 19207 0 410872 7161 8966 431884 280566 89476 0 61842 4227
MEMPHIS Independent Bank 29093 10862 786506 8815 116396 934042 767240 50646 0 116156 4707
MEMPHIS Paragon Bank 7369 47883 232113 2783 12063 296645 238583 25503 0 32559 -241
MEMPHIS Triumph Bank 8498 74024 401465 5261 13093 491819 425953 17415 0 48451 2403
MEMPHIS Magna Bank 14050 63390 480383 4716 34777 587884 447654 69746 0 70484 2571
MILAN The Bank of Milan 1944 24345 31340 304 3517 60842 54231 706 0 5905 560
MILLINGTON Patriot Bank 3931 128277 125561 2796 19650 274623 235503 12859 0 26261 1391
MOUNT JULIET SOUTHERN BANK OF TENNESSEE
21843 33085 140652 1133 8996 203443 176146 4124 0 23173 489
MOUNTAIN CITY Farmers State Bank 8878 35230 79224 1198 11684 133818 111695 1405 0 20718 486

24 | P a g e
TENNESSEE STATE CHARTERED BANKSSUMMARY OF INDIVIDUAL BANKS (IN THOUSANDS)
(A) (B) (C ) (D) (E) (F) (G) (H) (I) (J)
City Institution Cash Invest Total Loans
Loan Loss
Reserve
Other Assets
Total Assets
Deposits Other Liabilities
MIUS Capital Net Income
MOUNTAIN CITY Johnson County Bank 14621 37206 61820 808 7448 120287 99539 4120 0 16628 423
NASHVILLE Avenue Bank 18576 216898 799804 9312 49984 1075950 852018 114746 0 109186 3584
NASHVILLE FirstBank 75275 578599 1742584 29030 163504 2530932 2040551 234636 0 255745 23319
NASHVILLE Citizens Savings Bank and Trust Company
4571 12067 84335 1186 4308 104095 92799 3294 0 8002 155
NASHVILLE InsBank 15489 16222 251482 3052 16905 297046 230953 38045 0 28048 1111
NASHVILLE Pinnacle Bank 263917 840458 4861897 65572 596124 6496824 5031509 588164 100 877051 46697
NASHVILLE CapStar Bank 40722 284580 776260 8939 56288 1148911 967735 75029 0 106147 3430
NASHVILLE Truxton Trust Company 18762 83153 241116 2733 15221 355519 285157 33291 0 37071 2279
NASHVILLE Civic Bank & Trust 7026 57761 71323 1328 8180 142962 111002 11235 0 20725 -44
NEW TAZEWELL Citizens Bank 3760 15421 130519 1522 7552 155730 138763 3989 0 12978 343
NEWBERN Security Bank 5402 98817 56527 1176 14968 174538 140045 14344 0 20149 818
NOLENSVILLE Peoples State Bank of Commerce
23287 28790 90942 1728 8639 149930 141012 321 0 8597 743
OAK RIDGE TNBANK 4502 41017 131076 1385 12142 187352 149423 20004 0 17925 224
OOLTEWAH Community Trust & Banking Company
17207 23289 89646 2055 6908 134995 119664 505 0 14826 582
PARIS Commercial Bank & Trust Co.
14038 185327 434531 7738 38333 664491 584528 5037 0 74926 5012
PARIS Security Bank and Trust Company
3820 29900 129437 612 11385 173930 154210 1896 0 17824 1923
PARSONS Farmers Bank 14916 2789 16252 267 1305 34995 30251 132 0 4612 87
PIGEON FORGE Tennessee State Bank 51007 115536 392833 8821 62041 612596 519680 31669 0 61247 404
PIGEON FORGE SmartBank 37006 90682 390774 3833 28915 543544 483200 4240 0 56104 807
PIKEVILLE First Farmers & Commercial Bank
11402 37230 57183 838 5658 110635 98276 148 0 12211 457
PIPERTON The Bank of Fayette County
8535 55016 288371 3973 21967 369916 306722 29874 0 33320 1720
PORTLAND The Farmers Bank 28379 162300 341276 5499 30468 556924 475171 21928 0 59825 2959
PORTLAND Volunteer State Bank 13224 25916 428163 3677 57272 520898 386052 85274 0 49572 6382
RIPLEY Bank of Ripley 6029 103848 80458 2007 12883 201211 168806 2181 0 30224 445
ROGERSVILLE Civis Bank 11351 8670 77894 1034 13970 110851 103023 2301 0 5527 63
ROGERSVILLE First Community Bank of East Tennessee
13828 39539 112666 2143 20496 184386 148070 15931 0 20385 634
RUTLEDGE Citizens Bank and Trust Company of Grainger
7488 115751 65392 1025 10326 197932 164449 636 0 32847 761
SARDIS The Peoples Bank 1631 21649 43796 505 4508 71079 63749 705 0 6625 224
SAVANNAH The Hardin County Bank 7750 41684 355326 3404 32678 434034 373475 22572 0 37987 2205
SAVANNAH Central Bank 12756 20810 64817 2055 7759 104087 95312 1333 0 7442 305
SELMER Home Banking Company 5354 41255 35733 371 6458 88429 78786 1057 0 8586 257
SEVIERVILLE Sevier County Bank 49990 35672 182558 2495 49812 315537 294677 1773 0 19087 1541
SHELBYVILLE First Community Bank of Bedford County
31798 62806 265740 2177 51400 409567 256399 102574 0 50594 4057
SHELBYVILLE PEOPLES BANK OF MIDDLE TENNESSEE
3163 19130 75866 1126 7460 104493 90175 1185 0 13133 487

25 | P a g e
TENNESSEE STATE CHARTERED BANKSSUMMARY OF INDIVIDUAL BANKS (IN THOUSANDS)
(A) (B) (C ) (D) (E) (F) (G) (H) (I) (J)
City Institution Cash Invest Total Loans
Loan Loss
Reserve
Other Assets
Total Assets Deposits
Other Liabilities MIUS Capital Net Income
SPRING CITY First Bank of Tennessee 22016 19257 221340 2981 11919 271551 220841 21551 0 29159 2354
TAZEWELL First Century Bank 19254 44216 180817 3607 21901 262581 230511 2603 0 29467 245
TULLAHOMA American City Bank of Tullahoma
5148 23721 219633 2213 17678 263967 206586 8307 0 49074 3163
TULLAHOMA Southern Community Bank 5802 25150 126701 1260 13668 170061 145666 6727 0 17668 466
TULLAHOMA First Vision Bank of Tennessee
7751 30147 131527 1787 9650 177288 153883 2765 0 20640 883
UNION CITY Reelfoot Bank 8467 49612 81321 2113 9938 147225 130203 1695 0 15327 412
UNION CITY First State Bank 40909 505281 1145600 1912 210205 1900083 1544858 58815 0 296410 8351
WARTBURG Citizens First Bank 6506 20686 113659 1371 12702 152182 133598 5007 0 13577 554
WAYNESBORO The Bank of Waynesboro 18547 21564 102925 2020 10089 151105 130540 801 0 19764 808
WAYNESBORO Wayne County Bank 22634 30765 224721 5301 31520 304339 251166 15652 0 37521 1439
WINCHESTER Citizens Community Bank 17439 39237 124983 3229 14679 193109 168184 2271 0 22654 1483
WOODLAND MILLS
The Farmers Bank, Woodland Mills,
4100 5199 2714 52 115 12076 10196 9 0 1871 -48
Total 2,830,038 11,481,744 38,723,588 512,111 3,903,156 56,426,415 46,880,173 3,225,774 7,674 6,312,794 306,428
1 ;
(A) Cash - Includes currency/coin, both interest-bearing and non-interest bearing balances due from depository institutions (B) Investments – Investments owned: Includes securities, federal funds sold, and securities purchased under agreements to resell (C) Total Loans – Includes all loans and lease financing receivables, net of unearned income (D) Loan Loss Reserve – Allowance for Loan and Lease Losses (E) Other Assets – Includes premises and fixed assets, trading assets, other real estate owned, investments in unconsolidated subsidiaries and associated companies, customer’s liability to bank on acceptances outstanding, intangible assets, and assets not reportable elsewhere. (F) Deposits – Includes all interest bearing and non-interest bearing customer deposits held. (G) Other Liabilities – Includes federal funds purchased, securities sold under agreements to repurchase, demand notes issued to U.S. Treasury, mortgage indebtedness, obligations under capital leases, bank’s liability on acceptances outstanding, and all other liabilities (H) Minority Interest in Unconsolidated Subsidiaries (I) Equity Capital – Includes preferred stock, common stock, surplus, undivided profits, and accumulated other comprehensive income (J) Net Income – Income earned after all expenses, taxes, and extraordinary items
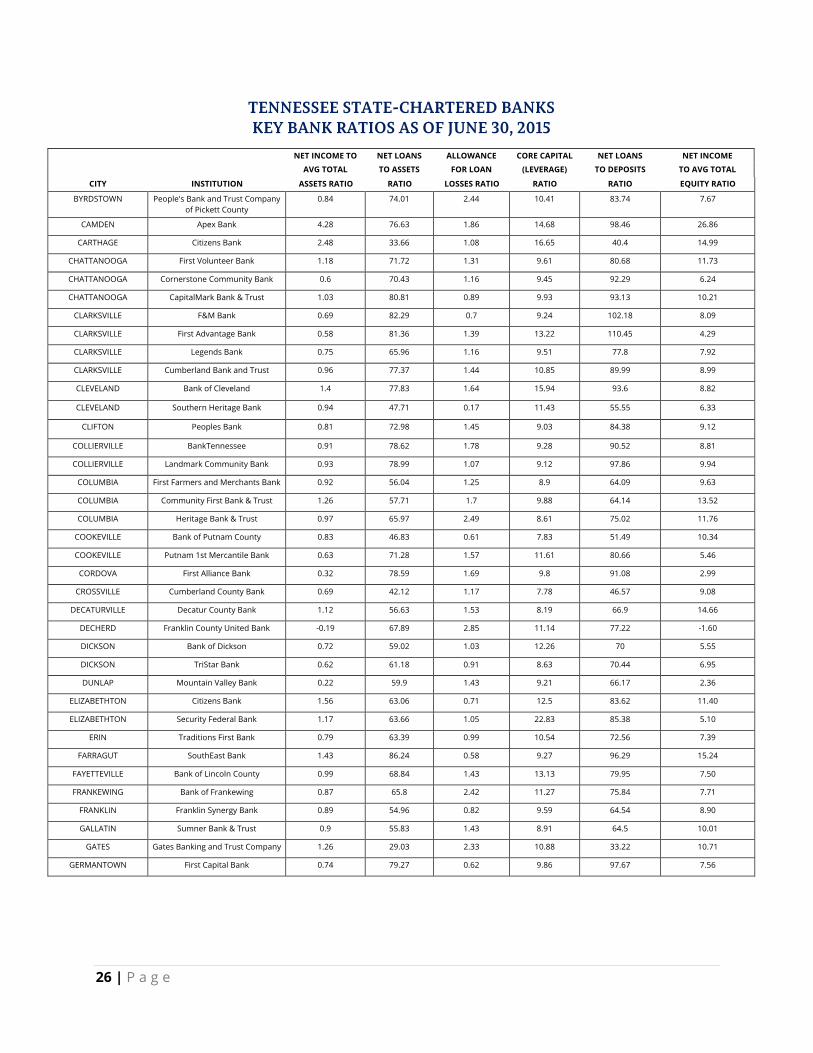
TENNESSEE STATE-CHARTERED BANKS KEY BANK RATIOS AS OF JUNE 30, 2015
NET INCOME TO NET LOANS ALLOWANCE CORE CAPITAL NET LOANS NET INCOME
AVG TOTAL TO ASSETS FOR LOAN (LEVERAGE) TO DEPOSITS TO AVG TOTAL
CITY INSTITUTION ASSETS RATIO RATIO LOSSES RATIO RATIO RATIO EQUITY RATIO
ADAMSVILLE Farmers & Merchants Bank 0.28 45.83 2.72 11.53 53.66 2.41
ASHLAND CITY Community Bank & Trust -0.16 40.37 3.65 10.37 47.08 -1.60
ATWOOD Citizens Bank & Trust Company 0.49 36.25 0.48 8.91 39.85 5.76
BARTLETT Bank of Bartlett 0.04 53.65 1.42 6.07 59.33 0.60
BELLS Bank of Crockett 1.17 29.65 1.39 11.38 34.37 9.59
BOLIVAR Merchants & Planters Bank 0.66 55.25 1.44 12.35 65.6 5.13
BRENTWOOD Reliant Bank 0.66 75.97 1.21 10.4 101.03 5.68
BRIGHTON Brighton Bank -0.3 75.81 1.17 5.18 80.48 -5.71
BROWNSVILLE INSOUTH Bank 0.55 65.13 1.3 8.91 72.92 5.49
26 | P a g e
TENNESSEE STATE-CHARTERED BANKSKEY BANK RATIOS AS OF JUNE 30, 2015
NET INCOME TO NET LOANS ALLOWANCE CORE CAPITAL NET LOANS NET INCOME
AVG TOTAL TO ASSETS FOR LOAN (LEVERAGE) TO DEPOSITS TO AVG TOTAL
CITY INSTITUTION ASSETS RATIO RATIO LOSSES RATIO RATIO RATIO EQUITY RATIO
BYRDSTOWN People's Bank and Trust Company of Pickett County
0.84 74.01 2.44 10.41 83.74 7.67
CAMDEN Apex Bank 4.28 76.63 1.86 14.68 98.46 26.86
CARTHAGE Citizens Bank 2.48 33.66 1.08 16.65 40.4 14.99
CHATTANOOGA First Volunteer Bank 1.18 71.72 1.31 9.61 80.68 11.73
CHATTANOOGA Cornerstone Community Bank 0.6 70.43 1.16 9.45 92.29 6.24
CHATTANOOGA CapitalMark Bank & Trust 1.03 80.81 0.89 9.93 93.13 10.21
CLARKSVILLE F&M Bank 0.69 82.29 0.7 9.24 102.18 8.09
CLARKSVILLE First Advantage Bank 0.58 81.36 1.39 13.22 110.45 4.29
CLARKSVILLE Legends Bank 0.75 65.96 1.16 9.51 77.8 7.92
CLARKSVILLE Cumberland Bank and Trust 0.96 77.37 1.44 10.85 89.99 8.99
CLEVELAND Bank of Cleveland 1.4 77.83 1.64 15.94 93.6 8.82
CLEVELAND Southern Heritage Bank 0.94 47.71 0.17 11.43 55.55 6.33
CLIFTON Peoples Bank 0.81 72.98 1.45 9.03 84.38 9.12
COLLIERVILLE BankTennessee 0.91 78.62 1.78 9.28 90.52 8.81
COLLIERVILLE Landmark Community Bank 0.93 78.99 1.07 9.12 97.86 9.94
COLUMBIA First Farmers and Merchants Bank 0.92 56.04 1.25 8.9 64.09 9.63
COLUMBIA Community First Bank & Trust 1.26 57.71 1.7 9.88 64.14 13.52
COLUMBIA Heritage Bank & Trust 0.97 65.97 2.49 8.61 75.02 11.76
COOKEVILLE Bank of Putnam County 0.83 46.83 0.61 7.83 51.49 10.34
COOKEVILLE Putnam 1st Mercantile Bank 0.63 71.28 1.57 11.61 80.66 5.46
CORDOVA First Alliance Bank 0.32 78.59 1.69 9.8 91.08 2.99
CROSSVILLE Cumberland County Bank 0.69 42.12 1.17 7.78 46.57 9.08
DECATURVILLE Decatur County Bank 1.12 56.63 1.53 8.19 66.9 14.66
DECHERD Franklin County United Bank -0.19 67.89 2.85 11.14 77.22 -1.60
DICKSON Bank of Dickson 0.72 59.02 1.03 12.26 70 5.55
DICKSON TriStar Bank 0.62 61.18 0.91 8.63 70.44 6.95
DUNLAP Mountain Valley Bank 0.22 59.9 1.43 9.21 66.17 2.36
ELIZABETHTON Citizens Bank 1.56 63.06 0.71 12.5 83.62 11.40
ELIZABETHTON Security Federal Bank 1.17 63.66 1.05 22.83 85.38 5.10
ERIN Traditions First Bank 0.79 63.39 0.99 10.54 72.56 7.39
FARRAGUT SouthEast Bank 1.43 86.24 0.58 9.27 96.29 15.24
FAYETTEVILLE Bank of Lincoln County 0.99 68.84 1.43 13.13 79.95 7.50
FRANKEWING Bank of Frankewing 0.87 65.8 2.42 11.27 75.84 7.71
FRANKLIN Franklin Synergy Bank 0.89 54.96 0.82 9.59 64.54 8.90
GALLATIN Sumner Bank & Trust 0.9 55.83 1.43 8.91 64.5 10.01
GATES Gates Banking and Trust Company 1.26 29.03 2.33 10.88 33.22 10.71
GERMANTOWN First Capital Bank 0.74 79.27 0.62 9.86 97.67 7.56
27 | P a g e
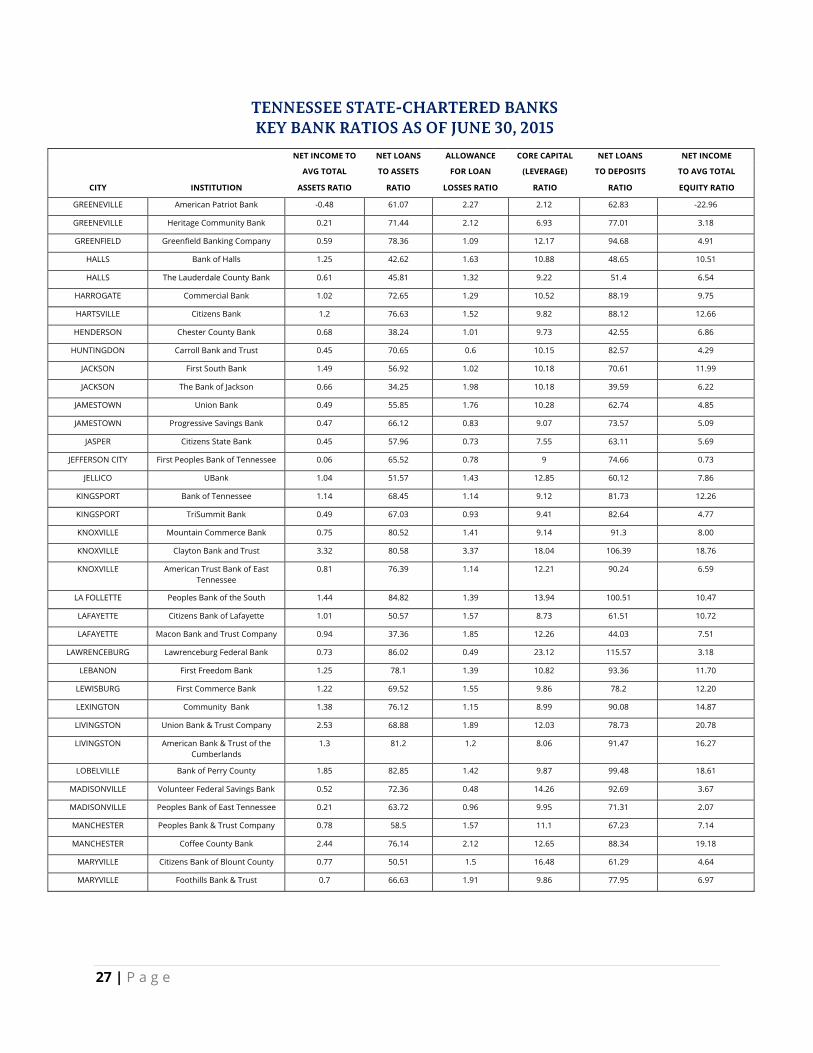
TENNESSEE STATE-CHARTERED BANKSKEY BANK RATIOS AS OF JUNE 30, 2015
NET INCOME TO NET LOANS ALLOWANCE CORE CAPITAL NET LOANS NET INCOME
AVG TOTAL TO ASSETS FOR LOAN (LEVERAGE) TO DEPOSITS TO AVG TOTAL
CITY INSTITUTION ASSETS RATIO RATIO LOSSES RATIO RATIO RATIO EQUITY RATIO
GREENEVILLE American Patriot Bank -0.48 61.07 2.27 2.12 62.83 -22.96
GREENEVILLE Heritage Community Bank 0.21 71.44 2.12 6.93 77.01 3.18
GREENFIELD Greenfield Banking Company 0.59 78.36 1.09 12.17 94.68 4.91
HALLS Bank of Halls 1.25 42.62 1.63 10.88 48.65 10.51
HALLS The Lauderdale County Bank 0.61 45.81 1.32 9.22 51.4 6.54
HARROGATE Commercial Bank 1.02 72.65 1.29 10.52 88.19 9.75
HARTSVILLE Citizens Bank 1.2 76.63 1.52 9.82 88.12 12.66
HENDERSON Chester County Bank 0.68 38.24 1.01 9.73 42.55 6.86
HUNTINGDON Carroll Bank and Trust 0.45 70.65 0.6 10.15 82.57 4.29
JACKSON First South Bank 1.49 56.92 1.02 10.18 70.61 11.99
JACKSON The Bank of Jackson 0.66 34.25 1.98 10.18 39.59 6.22
JAMESTOWN Union Bank 0.49 55.85 1.76 10.28 62.74 4.85
JAMESTOWN Progressive Savings Bank 0.47 66.12 0.83 9.07 73.57 5.09
JASPER Citizens State Bank 0.45 57.96 0.73 7.55 63.11 5.69
JEFFERSON CITY First Peoples Bank of Tennessee 0.06 65.52 0.78 9 74.66 0.73
JELLICO UBank 1.04 51.57 1.43 12.85 60.12 7.86
KINGSPORT Bank of Tennessee 1.14 68.45 1.14 9.12 81.73 12.26
KINGSPORT TriSummit Bank 0.49 67.03 0.93 9.41 82.64 4.77
KNOXVILLE Mountain Commerce Bank 0.75 80.52 1.41 9.14 91.3 8.00
KNOXVILLE Clayton Bank and Trust 3.32 80.58 3.37 18.04 106.39 18.76
KNOXVILLE American Trust Bank of East Tennessee
0.81 76.39 1.14 12.21 90.24 6.59
LA FOLLETTE Peoples Bank of the South 1.44 84.82 1.39 13.94 100.51 10.47
LAFAYETTE Citizens Bank of Lafayette 1.01 50.57 1.57 8.73 61.51 10.72
LAFAYETTE Macon Bank and Trust Company 0.94 37.36 1.85 12.26 44.03 7.51
LAWRENCEBURG Lawrenceburg Federal Bank 0.73 86.02 0.49 23.12 115.57 3.18
LEBANON First Freedom Bank 1.25 78.1 1.39 10.82 93.36 11.70
LEWISBURG First Commerce Bank 1.22 69.52 1.55 9.86 78.2 12.20
LEXINGTON Community Bank 1.38 76.12 1.15 8.99 90.08 14.87
LIVINGSTON Union Bank & Trust Company 2.53 68.88 1.89 12.03 78.73 20.78
LIVINGSTON American Bank & Trust of the Cumberlands
1.3 81.2 1.2 8.06 91.47 16.27
LOBELVILLE Bank of Perry County 1.85 82.85 1.42 9.87 99.48 18.61
MADISONVILLE Volunteer Federal Savings Bank 0.52 72.36 0.48 14.26 92.69 3.67
MADISONVILLE Peoples Bank of East Tennessee 0.21 63.72 0.96 9.95 71.31 2.07
MANCHESTER Peoples Bank & Trust Company 0.78 58.5 1.57 11.1 67.23 7.14
MANCHESTER Coffee County Bank 2.44 76.14 2.12 12.65 88.34 19.18
MARYVILLE Citizens Bank of Blount County 0.77 50.51 1.5 16.48 61.29 4.64
MARYVILLE Foothills Bank & Trust 0.7 66.63 1.91 9.86 77.95 6.97

28 | P a g e
TENNESSEE STATE-CHARTERED BANKSKEY BANK RATIOS AS OF JUNE 30, 2015
NET INCOME TO NET LOANS ALLOWANCE CORE CAPITAL NET LOANS NET INCOME
AVG TOTAL TO ASSETS FOR LOAN (LEVERAGE) TO DEPOSITS TO AVG TOTAL
CITY INSTITUTION ASSETS RATIO RATIO LOSSES RATIO RATIO RATIO EQUITY RATIO
MC KENZIE McKenzie Banking Company 1.98 41.02 2.4 14.43 48.37 13.96
MC MINNVILLE Security Federal Savings Bank of McMinnville
0.59 67.24 0.97 9.7 77.14 6.02
MC MINNVILLE Homeland Community Bank 0.45 51.66 2.62 9.72 57.7 4.64
MEMPHIS Tri-State Bank of Memphis -0.33 58.87 2.14 8.46 66 -3.26
MEMPHIS Financial Federal Bank 2.18 93.48 1.74 15.62 143.89 13.95
MEMPHIS Independent Bank 1.05 83.26 1.12 11.35 101.36 8.22
MEMPHIS Paragon Bank -0.17 77.31 1.2 10.78 96.12 -1.47
MEMPHIS Triumph Bank 0.96 80.56 1.31 9.4 93.02 10.12
MEMPHIS Magna Bank 0.89 80.91 0.98 12.03 106.26 7.37
MILAN The Bank of Milan 1.78 51.01 0.97 9.7 57.23 18.37
MILLINGTON Patriot Bank 1 44.7 2.23 8.9 52.13 10.57
MOUNT JULIET SOUTHERN BANK OF TENNESSEE 0.49 68.58 0.81 10.66 79.21 4.24
MOUNTAIN CITY Farmers State Bank 0.72 58.31 1.51 14.98 69.86 4.69
MOUNTAIN CITY Johnson County Bank 0.69 50.72 1.31 13.66 61.29 5.13
NASHVILLE Avenue Bank 0.69 73.47 1.16 10.41 92.78 6.94
NASHVILLE FirstBank 1.9 67.7 1.67 8.31 83.98 18.58
NASHVILLE Citizens Savings Bank and Trust Company
0.3 79.88 1.41 8.17 89.6 3.84
NASHVILLE InsBank 0.82 83.63 1.21 9.9 107.57 8.34
NASHVILLE Pinnacle Bank 1.51 73.83 1.35 9.77 95.33 10.87
NASHVILLE Truxton Trust Company 1.3 67.05 1.13 10.47 83.6 12.49
NASHVILLE Civic Bank & Trust -0.06 48.96 1.86 13.86 63.06 -0.42
NEWBERN Security Bank 0.96 31.71 2.08 11.12 39.52 7.99
NOLENSVILLE Peoples State Bank of Commerce 0.98 59.5 1.9 5.91 63.27 18.03
OAK RIDGE TNBANK 0.24 69.22 1.06 8.66 86.79 2.46
OOLTEWAH Community Trust & Banking Company
0.92 64.88 2.29 11.61 73.2 7.78
PARIS Commercial Bank & Trust Co. 1.51 64.23 1.78 10.67 73.02 13.43
PARIS Security Bank and Trust Company 2.19 74.07 0.47 10.09 83.54 21.46
PIGEON FORGE SmartBank 0.31 71.19 0.98 10.92 80.08 2.88
PIKEVILLE First Farmers & Commercial Bank 0.83 50.93 1.47 11.01 57.33 7.59
PIPERTON The Bank of Fayette County 1 76.88 1.38 9.61 92.72 10.47
PORTLAND The Farmers Bank 1.06 60.29 1.61 10.43 70.66 9.97
PORTLAND Volunteer State Bank 2.63 81.49 0.86 8.79 109.96 26.43
RIPLEY Bank of Ripley 0.43 38.99 2.49 14.18 46.47 2.89
ROGERSVILLE Civis Bank 0.11 69.34 1.33 4.93 74.6 2.30
ROGERSVILLE First Community Bank of East Tennessee
0.68 59.94 1.9 11.12 74.64 6.29
RUTLEDGE Citizens Bank and Trust Company of Grainger County
0.77 32.52 1.57 16.38 39.14 4.56
SARDIS The Peoples Bank 0.62 60.91 1.15 8.58 67.91 6.67
SAVANNAH The Hardin County Bank 1.02 81.08 0.96 8.94 94.23 11.83
SAVANNAH Central Bank 0.57 60.3 3.17 6.9 65.85 8.43

29 | P a g e
TENNESSEE STATE-CHARTERED BANKSKEY BANK RATIOS AS OF JUNE 30, 2015
NET INCOME TO NET LOANS ALLOWANCE CORE CAPITAL NET LOANS NET INCOME
AVG TOTAL TO ASSETS FOR LOAN (LEVERAGE) TO DEPOSITS TO AVG TOTAL
CITY INSTITUTION ASSETS RATIO RATIO LOSSES RATIO RATIO RATIO EQUITY RATIO
SELMER Home Banking Company 0.56 39.99 1.04 9.3 44.88 5.92
SEVIERVILLE Sevier County Bank 1.03 57.07 1.37 6.31 61.11 22.74
SHELBYVILLE First Community Bank of Bedford County
2.18 64.35 0.82 11.81 102.79 16.64
SHELBYVILLE PEOPLES BANK OF MIDDLE TENNESSEE
0.95 71.53 1.48 12.52 82.88 7.45
SPRING CITY First Bank of Tennessee 1.79 80.41 1.35 10.87 98.88 16.29
TREZEVANT Farmer's & Merchants Bank 1.03 87.18 1.53 8.92 102.45 11.38
TULLAHOMA American City Bank of Tullahoma 2.44 82.37 1.01 15.9 105.24 13.30
TULLAHOMA Southern Community Bank 0.57 73.76 0.99 9.62 86.12 5.33
TULLAHOMA First Vision Bank of Tennessee 1.02 73.18 1.36 11.62 84.31 8.60
UNION CITY Reelfoot Bank 0.55 53.8 2.6 10.61 60.83 5.31
UNION CITY First State Bank 0.87 60.19 0.17 10.1 74.03 6.30
WARTBURG Citizens First Bank 0.74 73.79 1.21 8.49 84.05 7.88
WAYNESBORO The Bank of Waynesboro 1.09 66.78 1.96 13.17 77.3 8.18
WAYNESBORO Wayne County Bank 0.94 72.1 2.36 12.24 87.36 7.78
WINCHESTER Citizens Community Bank 1.54 63.05 2.58 11.72 72.39 13.16
WOODLAND MILLS The Farmers Bank, Woodland Mills, Tennessee
-0.77 22.04 1.92 14.98 26.11 -5.06
Median including All Institutions 0.83 66.12 1.39 10.15 77.22 7.59
1
TENNESSEE STATE-CHARTERED TRUST COMPANIES CONSOLIDATED BALANCE SHEET (IN THOUSANDS)
June 30, 2015 June 30, 2014 $ Change % Change ASSETS Cash and Due from Banks 43,478 42,558 920 2.16%
Securities and Investments 1,325 1,825 -500 -27.40%
Premises and Fixed Assets 1,785 1,720 65 3.78%
Intangible Assets 37,416 39,442 -2,026 -5.13%
Other Assets 15,206 14,116 1,090 7.72%
TOTAL ASSETS 99,210 99,661 -451 -0.45% LIABILITIES Other Liabilities 20,628 19,202 1,426 7.43%
TOTAL LIABILITIES 20,628 19,202 1,426 7.43% NET ASSETS Unrestricted Assets 0 0 0 0.00%
Temporarily Restricted Assets 0 0 0 0.00%
Permanently Restricted Assets 0 0 0 0.00%

30 | P a g e
Note: Guardianship and Trust Company is not included in the figures above.
TENNESSEE STATE-CHARTERED TRUST COMPANIES
CONSOLIDATED INCOME STATEMENT (IN THOUSANDS) June 30, 2015 June 30, 2014 $ Change % Change Fee Income 62,988 60,547 2,441 4.03% NET FEE INCOME 62,988 60,547 2,441 4.03% Other Income 33 58 -25 -43.10% TOTAL INCOME 63,021 60,605 2,416 3.98% Operating Expenses 40,846 35,673 5,173 14.50% Advisor/Consulting Fees 11,265 13,206 -1,941 -14.70% Inter-Company Expense (Credit)
998 1,051 -53
-5.04%
Securities (Gains) and Losses 13 0 13 0.00% TOTAL OPERATING EXPENSES
53,122 49,930 3,192 6.39%
Pre-Tax Net Operating 9,899 10,675 -776 -7.27% Less: Applicable Income Taxes 1,213 1,581 -368 -23.28% Non-Operating Expenses 4,413 4,110 303 7.37% NET OPERATING INCOME 4,273 4,984 -711 -14.27% Extraordinary Gains/Losses 0 0 0 0.00% NET INCOME 4,273 4,984 -711 -14.27%
Note: Guardianship and Trust Company is not included in the figures above.
TENNESSEE STATE-CHARTERED TRUST COMPANIES CONSOLIDATED BALANCE SHEET (IN THOUSANDS)
EQUITY CAPITAL Common Stock 6,052 4,865 1,187 24.40%
Less: Treasury Stock 1,301 1,326 25 -1.88%
Surplus 4,318 5,326 -1,008 -18.93%
Additional Paid-in Capital 63,262 63,237 25 0.04%
Undivided Profits 6,251 8,360 -2,109 -27.91%
Unrealized Gains and (Losses) 0 -3 3 100.00%
TOTAL EQUITY CAPITAL 78,582 80,459 -1,877 -4.40% TOTAL LIABILITIES AND EQUITY CAPITAL
99,210 99,661 -451 -0.32%

31 | P a g e
TENNESSEE STATE-CHARTERED TRUST COMPANIES STATEMENT OF CONDITION (IN THOUSANDS)
(A) (B) (C) (D) (E) (F) (G) (H) (I) (J)
Institution City Cash Invest Other Assets
Total Assets
Other Liabilities
Equity Capital
Net Income TAUM
Common/Collective
Funds
No. of Funds
Advocacy Trust of Tennessee, LLC
Chattanooga 974 0 133 1,107 44 1,063 -87 44,272 0 0
First Mercantile Trust Company
Cordova 33,428 0 35,782 69,210 7,736 61,474 1,672 4,292,414 3,495,549 156
Meridian Trust and Investment Company
Knoxville 268 300 1,071 1,639 144 1,495 807 618,537 0 0
The Trust Company of Knoxville
Knoxville 2,701 0 926 3,627 719 2,908 758 2,626,423 43,952 1
Argent Trust and Investment Company
Memphis 132 0 7,336 7,468 3,976 3,492 245 2,623,879 0 0
Diversified Trust Company Memphis 3,159 0 5,728 8,887 5,907 2,980 -269 5,795,213 1,724,372 13
Cumberland Trust and Investment Company
Nashville 146 0 3,333 3,479 344 3,135 535 2,204,748 0 0
Equitable Trust Company Nashville 2,670 1,025 98 3,793 1,758 2,035 612 2,156,788 0 0
Totals 43,478 1,325 54,407 99,210 20,628 78,582 4,273 20,362,274 5,263,873 170
Cash - Includes currency and coin, and both interest bearing and non-interest bearing balances due from depository institutions Investments - Investments Owned Other Assets -Includes premises and fixed assets, investments in unconsolidated subsidiaries, intangible assets, and all other assets Total Assets - The sum of (A) through (C) Other Liabilities - Includes all liabilities Equity Capital - Includes preferred stock, common stock, treasury stock, debt capital, surplus, undivided profits, and all other capital reserves net of any unrealized holding gains (losses) on available for sale securities Net Income - Income earned after all expenses, taxes, and extraordinary items Total Assets Under Management - Total Discretionary and Non-Discretionary Assets Under Management and/or Custody inclusive of funds held in Common/Collective Funds Common/Collective Funds - Assets held in Common and/or Collective Investment Funds trusteed by company at market value Number of Funds - Number of Common/Collective Funds Note: Guardianship and Trust Company is not included.

32 | P a g
COMThe Deparesponsibcertain noindividuasubject bDepartme
C D F H
M In In R R T
ADMINMike IgneyMelody Joh
LICENSDavid AxfoCarl Scott, Stephen H
EXAMINNicole ChaJack Lay, RElizabeth HDavid Kelly EXAMINRobert CamSteve CranRobert DoStephanie Grant GouChad HaneKevin HickRobert Ho
g e
MPLIANartment’s Comble for the licon-depositorls doing busiy law to reguent:
Check CasherDeferred PresFlexible CrediHome Equity Mortgage Lenndustrial Loansurance Pre
Residential MResidential MTitle Pledge L
ISTRATIOy, Assistant Cohnson, Financ
ING ord, JD, Chief A CFSA, Directo
Henley, CPA, Di
NATION amblee, CFE, CRegulatory ComHarrell, Regulay, Compliance
NERS mpbell, Loan Enor, Loan Examyle, Loan Exam Dunn, Loan E
uveia, CFE, Loaey, Loan Exam
ks, Loan Examiornbeak, Loan
NCE DImpliance Divcensing and ery financial ininess in Tenn
ulatory overs
rs sentment Seit Lenders Conversion (nders an and Thrift emium Finan
Mortgage LenMortgage LoaLenders
N ommissioner ial Analyst
Administrator or of Licensing irector of Licen
Chief Administmpliance Direcatory Complian Examination
Examiner miner miner xaminer n Examiner
miner ner Examiner
IVISIOvision is examination nstitutions annessee that aight by the
rvice Provide
(Reverse)
Companies nce Companieders, Brokern Originators
nsing
rator ctor nce Manager Supervisor
ON of nd are
ers
es s and Services
MelaSteff
DavidHarvMand
PatriSupeCathSupe
KerryLukeKeithJameCalviRobeMikeJim W
ers
anie Harper, Adfany Daniel, Ad
d Gaines, Finavie Franklin, III,dy Heady, Fina
ck Somers, Coervisor y Wilkerson, C
ervisor
y Rial, Loan Exe Schroer, Loanh Sharp, Loan es Simmons, Lin Stout, Loan ert Walker, Loae Wiggins, LoanWorley, Loan E
dministrative dministrative S
ancial Analyst , Financial Anaancial Analyst
ompliance Exa
Compliance Ex
xaminer n Examiner Examiner oan Examiner Examiner an Examiner n Examiner
Examiner
Services AssisServices Assist
alyst
mination
xamination
r
tant tant

33 | P a g e
COMPLIANCE DIVISION- Continued
REGULATORY OVERSIGHT In order to lawfully engage in business in Tennessee, each institution or individual must first obtain a license, certificate of registration or authorization from the Department. All such applications are processed by the Compliance Division, which ensures that each applicant meets the minimum qualifications required by law in order to engage in such business. Through a comprehensive examination program, licensed and registered entities are subject to periodic examination by the Compliance Division’s examiners. Examinations are designed to test and enforce compliance with Tennessee laws, as well as certain Federal laws and regulations such as the Real Estate Settlement Procedures Act and the Truth in Lending Act. These laws and regulations were promulgated in order to protect consumers by, among other things, limiting the amount of interest, loan charges and insurance charges that may be imposed, as well as providing for specific disclosures to the consumer regarding loan provisions. The Compliance Division’s examiners also investigate consumer complaints and allegations of consumer fraud and usury. Through 3,256 examinations and other methods of regulatory oversight of non-depository institutions, the Department returned refunds in the amount of $673,313.78 to consumers for the calendar year ending December 31, 2015. In addition, administrative enforcement actions initiated by the Department resulted in civil monetary penalties of $201,902.19.
FISCAL YEAR HIGHLIGHTS
RISK-FOCUSED EXAMINATION PROGRAM The Compliance Division has established a risk focused regulatory program for non-depository financial institutions that bases regulatory scrutiny on compliance benchmarks. The primary focus was to develop a method of identifying characteristics within a licensed entity that would allow for an allocation of exam resources based on the potential risk of harm to the consumer. Companies showing a need for greater regulatory scrutiny would be identified and examined with a greater frequency. Likewise, companies showing a low risk to consumers would need less regulatory scrutiny. The risk program ensures compliance with governing law, but also considers various risk factors that have been determined are most relative to the potential for consumer harm such as prior exam results, repeat violations leading to refunds, management experience, employee training, and whether appropriate risk management systems are in place.
34 | P a g e
COMPLIANCE DIVISION- Continued
This rating system will allow the Department to focus on licensees that appear to have the greatest risk. The goal of the Compliance Division is to assist management in reducing risk to consumers and helping licensees to be more successful.
SUPERVISION FEE Public Chapter 736 of the Tennessee Public Acts of 2014 amended parts of Title 45 of the Tennessee Code relative to non-depository financial institutions regulated by the Compliance Division. Public Chapter 736 changed the way that licensees and registrants regulated by the Compliance Division are assessed licensing, registration and examination fees, combining those fees into an annual supervision fee. The licensing year for some institutions was also changed. Each person regulated by the Compliance Division, except mortgage loan originators, is assessed an annual supervision fee, which is determined by the Commissioner on an annual basis based on the Department’s budget as approved by the Administration and the General Assembly. The supervision fee includes the annual licensing or registration fee and the costs for a routine examination or investigation. Licensees and registrants continue to pay the actual expenses for out-of-state examinations and inspections. The supervision fee is paid with the filing of an application, whether a new or renewal application, and payment of the fee is a condition of obtaining the issuance or renewal of the license or registration. Mortgage loan originators are not assessed a supervision fee, but continue to pay the same licensing and renewal fees as previously required. The supervision fee was phased in at different times during 2015 and has now been fully implemented. The new fee structure will assist the Department in implementing its risk-focused examination program for non-depository institutions, furthering the Department’s overarching goal of establishing an appropriate level of regulatory oversight to fulfill the Department’s obligations to consumers, but doing so in a manner so as to permit financial institutions to contribute to economic progress and to serve the needs of consumers.
INDUSTRIAL LOAN AND THRIFT COMPANIES (TILT) The Tennessee Industrial Loan and Thrift (“TILT”) Companies Act, Tenn. Code Ann. §§ 45-5-101, et seq., was adopted for the stated purpose of allowing the citizens of Tennessee to have available the facilities and resources of regulated lending institutions to meet their needs for loans at rates and charges reasonably commensurate with economic realities. TILT companies are authorized to charge rates of interest higher than the rates currently authorized under Tennessee’s general usury statutes. The requirements for registration under the TILT Act include having a minimum net worth of $25,000 for each location from which business is conducted, and filing with the Department a surety bond in the amount of $200,000 if the business proposes to make residential mortgage loans, or $50,000 otherwise. Registrations under the TILT Act expire on March 31 of each year and may be renewed by filing a renewal application on or before March 1. As of December 31, 2015 there were 1,548 TILT locations registered with the Department. For the calendar year 2015, the Department conducted 860 examinations of TILT companies resulting in refunds totaling $195,303.56.

35 | P a g e
Industrial Loan and Thrift Companies Composite Annual Report
(Year Ending December 31, 2014)
Number of Companies Included in this Report 200 Number of Offices included in this report 1,491 Number of Employees included in this report 6,151
RATE OF RETURN Average Monthly Gross Receivable (Industry) $2,158,422,703.00 Average Monthly Gross Receivable (Location) $1,447,634.00 Net Income (Industry) $103,203,382.00 Net Income (Location) $69,217.56 Rate of Return on Outstanding Receivables (Location) 5.00%
ANALYSIS OF ACCOUNTS OUTSTANDING (MONTHLY AVERAGE)
Average Number of Accounts Outstanding (Industry) 750,787
Average Number of Accounts Outstanding (Company) 3,754
Average Number of Accounts Outstanding (Location) 504 OTHER INFORMATION
Number of Loans Outstanding at Beginning of Year 773,219
Dollar Amount of Loans Outstanding at Beginning of Year $2,047,412,799
Average Amount per Loan Outstanding at Beginning of Year $2,648
Number of Loans Made During the Year 2,523,461
Dollar Amount of Loans Made During the Year $3,643,796,432
Average Amount per Loan Made $1,444
Number of Loans Charged Off During the Year 188,561
Dollar Amount of Loans Charged Off During the Year $154,894,809
Average Account Balance Charged Off $821
Number of Loans Outstanding at Year End 819,857
Dollar Amount of Loans Outstanding at Year End $2,154,698,497
Average Account Balance per Loan Outstanding at Year End $2,628

36 | P a g e
Compliance Division Industrial Loan and Thrift Companies
Composite Annual Report (Year Ending December 31, 2014) ANALYSIS OF LOANS RECEIVABLE
Gross Loan Receivables Outstanding – January $2,064,694,652 Gross Loan Receivables Outstanding – February $2,190,798,618 Gross Loan Receivables Outstanding – March $2,171,510,235 Gross Loan Receivables Outstanding – April $2,137,384,032 Gross Loan Receivables Outstanding – May $2,150,439,741 Gross Loan Receivables Outstanding – June $2,165,515,863 Gross Loan Receivables Outstanding – July $2,123,990,757 Gross Loan Receivables Outstanding – August $2,144,859,546 Gross Loan Receivables Outstanding – September $2,163,883,479 Gross Loan Receivables Outstanding – October $2,163,940,222 Gross Loan Receivables Outstanding – November $2,181,231,395 Gross Loan Receivables Outstanding – December $2,242,823,895
FLEXIBLE CREDIT LENDERS Businesses licensed under the Flexible Credit Act, Tenn. Code Ann. §§ 45-12-101, et seq., may offer flex loans, which are open-end credit plans contemplating repeated noncommercial consumer loans that may be unsecured or secured by personal property, and may be without fixed maturities or limitations as to the length of term. Flexible credit lenders may charge a periodic interest rate not to exceed 24% per annum, and a customary fee not to exceed a daily rate of .7% of the average daily principal balance in any billing cycle. No flex loan plan may have an outstanding principal balance in excess of $4,000 at any time. The requirements for licensure under the Flexible Credit Act include having a minimum net worth of $50,000 for each location, and filing with the Department a surety bond in the amount of $25,000 for each location up to a maximum of $200,000 for any one licensee. Licenses under the Flexible Credit Act expire on December 31 of each year and may be renewed by filing a renewal application, through the Nationwide Multistate Licensing System (“NMLS”), between November 1 and December 31. As of December 31, 2015, there were 401 flexible credit locations licensed with the Department. The Flexible Credit Act first became effective January 1, 2015. The first loans were made in the spring of 2015. Exams are scheduled to begin in early 2016.
ANNUAL REPORT INFORMATION FOR CALENDAR YEAR ENDING DECEMBER 31, 2015 Under T.C.A. § 45-12-122, the Commissioner shall prepare and submit to the governor and general assembly, annually, an analysis and recapitulation of the reports for the preceding calendar year for the purpose of reflecting the general results of operations under this chapter.
37 | P a g e
COMPLIANCE DIVISION- Continued
STATEMENT OF ASSETS, LIABILITIES, AND EQUITY
The following tabulation represents aggregate information from the audited financial statements of 11 reporting entities.
As of December 31, 2015, five (5) companies owned 89% of the industry’s assets. This accounts for $180,402,242 of the total reported assets of $202,960,494. Nine (9) companies reported assets greater than $500,000; whereas 2 companies had less than $500,000 in assets.
STATEMENT OF INCOME AND EXPENSES
Since the Flexible Credit Act did not become effective until January 2015, licensees did not have information to report for the preceding calendar year 2014. Therefore, the following tabulation represents aggregate information for the period ending September 30, 2015:
(*Excluding Owner’s Compensation) Of the 11 reporting companies, 4 reported operating losses. The average company made a profit of $124,134. Salaries are a major company expense, amounting to about 24% of total operating income. The average salary expense for a reporting company was $733,937. Losses on receivables constitute another major industry expense. Bad debt expense represented approximately 31% of total operating income.
Total Assets $202,960,494
Total Liabilities $45,424,837
Net Worth $157,535,657
Total Operating Income $33,245,148
Salary Expense $8,073,310
Bad Debt Expense $10,254,805
Owners’ Compensation $547,708
Net Income* $1,365,479

38 | P a g e
COMPLIANCE DIVISION- Continued
TRANSACTIONAL DATA
Distribution of 2015 New Agreements by Dollar Amount: (Maximum agreement amount= $4,000)
RESIDENTIAL MORTGAGE LENDERS, BROKERS AND SERVICERS Residential mortgage lenders, brokers and servicers doing business in Tennessee must be licensed under the Tennessee Residential Lending, Brokerage and Servicing Act, Tenn. Code Ann. §§ 45-13-101, et seq. The requirements for licensure include having a minimum net worth of $25,000, and filing with the Department a surety bond in an initial amount of between $90,000 and $200,000 depending on the nature of the business to be conducted, and the bond is adjustable annually based on the dollar amount of Tennessee residential mortgage loans originated in the preceding calendar year. Licenses expire on December 31 of each year and may be renewed by the filing of a renewal application, through the Nationwide Multistate Licensing System (“NMLS”), between November 1 and December 31. As of December 31, 2015, there were 585 mortgage businesses licensed with the Department. For the calendar year 2015, the Department conducted 120 examinations of mortgage companies, resulting in refunds totaling $144,211.17. RESIDENTIAL MORTGAGE LOAN ORIGINATORS Residential mortgage loan originators must also be licensed under the Tennessee Residential Lending, Brokerage and Servicing Act, Tenn. Code Ann. §§ 45-13-101, et seq. The requirements for licensure include the following: 20 hours of pre-licensure education, 2 hours of which must be in Tennessee law; passing score on a national test with uniform state content; authorization for a fingerprint based criminal background check through the FBI; authorization for a credit report from a national credit reporting agency. A mortgage loan originator license is not active unless the individual is also sponsored by a licensed mortgage lender or mortgage loan broker, and a mortgage loan originator is prohibited by law from providing origination services with an inactive license. Licenses expire on December 31 of each year and may be renewed by the filing of a renewal application, through the Nationwide Multistate Licensing System (“NMLS”), between November 1 and December 31. As of December 31, 2015, there were 9,263 mortgage loan originators licensed
Number of New Agreements Entered Into for 2015 139,842
Dollar Amount of New Agreements During 2015 $94,302,163
$1000 or less 117,777
$1001-$3000 18,621
$3001-$4000 3,444

39 | P a g e
COMPLIANCE DIVISION- Continued with the Department. The Department examines the work product of individual mortgage loan originators when it examines the sponsoring broker or lender.
TITLE PLEDGE LENDERS The Tennessee Title Pledge Act, Tenn. Code Ann. §§ 45-15-101, et seq., governs the activities of title pledge lenders in Tennessee. A title pledge loan is a 30 day loan, which may be renewed, secured by the borrower’s motor vehicle. Title pledge lenders may charge interest at a rate not to exceed 2% per month, and a customary fee of no more than 1/5 of the original principal amount of the loan or the unpaid balance due at the inception of any renewal. If a borrower fails to repay a loan, the lender may repossess and sell the vehicle, but the borrower is not personally liable for any deficiency balance. The requirements for licensure under the Tennessee Title Pledge Act include having a minimum net worth of $75,000 for each location, and filing with the Department a surety bond in the amount of $25,000 for each location up to a maximum of $200,000 for any one licensee. Licenses under the Tennessee Title Pledge Act expire on December 31 of each year and may be renewed by filing a renewal application on or before December 1. As of December 31, 2015, there were 965 title pledge locations licensed with the Department. For the calendar year 2015, the Department conducted 830 examinations of title pledge businesses resulting in refunds totaling $123,525.12.
ANNUAL REPORT INFORMATION FOR CALENDAR YEAR ENDING DECEMBER 31, 2014 The following tabulation represents aggregate information from reports filed by 148 licensed companies with 951 locations. The Department did not require an annual report from companies that opened after December, 2014.
As of December 31, 2014, five (5) companies owned 65% of the industry’s assets. This accounts for $332,404,837 of the total reported assets of $507,869,721. 63 companies reported assets greater than $500,000; 81 companies had assets of between $100,000 and $500,000; and the remaining 4 reflected total assets of less than $100,000.
STATEMENT OF INCOME AND EXPENSES
The following information was compiled from the statements of income and expenses for the period of January 1, 2014 to December 31, 2014.
Total Assets $507,869,721
Total Liabilities $80,238,909
Net Worth $427,630,812

40 | P a g e
COMPLIANCE DIVISION- Continued
(*Excluding Owner’s Compensation)
Of the 148 reporting companies, 44 reported operating losses and 14 reported net income of over $100,000 for the period ending December 31, 2014. The average company made a profit of $297,290. Salaries are a major company expense, amounting to about 20% of total operating income. The average salary expense for a reporting company was $252,594. Losses on receivables constitute another major industry expense. Bad debt expense represented approximately 23% of total operating income.
TRANSACTIONAL DATA
The following transactional data were reported for the reporting period ending December 31, 2014:
Distribution of 2014 New Agreements by Dollar Amount: (Maximum agreement amt. = $2,500)
$1000 or less 184,255 $1001 - $2,000 49,005 $2001 - $2,500 16,997
Total Operating Income $188,561,806
Salary Expense $37,383,922
Bad Debt Expense $43,099,679
Owners’ Compensation $5,617,403
Net Income* $43,998,957
Number of New Agreements Entered Into for 2014 250,257
Dollar Amount of New Agreements During 2014 $230,651,534
Number of Defaults 49,941
Number of Repossessions 24,408
Total Surplus Amount Returned to Customers after Sale of Repossessed Vehicles
$710,595
Number of Customers Holding Agreements Outstanding as of December 31, 2014 179,088
Number of Customers who Deferred a Principal Payment Reduction in 2014 21,218

41 | P a g e
COMPLIANCE DIVISION- Continued
DEFERRED PRESENTMENT SERVICE PROVIDERS Licensees under the Deferred Presentment Services Act, Tenn. Code Ann. §§ 45-17-101, et seq., may engage in the business of deferred presentment services. A deferred presentment service is a transaction involving, in exchange for a fee, the acceptance and payment by the licensee of a check and the holding of the check for a period of time prior to presentment for payment. Licensees may charge a fee of not more than 15% of the face amount of the check, and may not have outstanding more than 2 checks from any 1 customer at the same time, with the aggregate face value of all outstanding checks from any one customer not to exceed $500. The requirements for licensure include having a minimum net worth of $25,000 for each location. Licenses under the Deferred Presentment Services Act expire on December 31 of each year and may be renewed by the filing of a renewal application, through the Nationwide Multistate Licensing System (“NMLS”), between November 1 and December 31. As of December 31, 2015, there were 1,211 deferred presentment service locations licensed with the Department. For calendar year 2015, the Department conducted 986 examinations of deferred presentment service businesses, resulting in refunds totaling $107,139.76.
ANNUAL REPORT INFORMATION By December 31st of each year, licensees are required by T.C.A. § 45-17-119 to file with the Commissioner of Financial Institutions an Annual Report covering the licensee’s business activities as of the close of business on December 31st of the prior year. These reports include a balance sheet, statement of income and expense, as well as other statistical data. Following is a recapitulation of the 2014 annual reports, submitted by licensees with renewal applications, for the purpose of reflecting the general results of operations for the calendar year ending December 31, 2014. Note: In accordance with the requirements set forth in Public Chapter 679, effective April 12, 2012, the licensing year was changed to January 1st through December 31st of each year.
ANNUAL REPORT INFORMATION FOR CALENDAR YEAR ENDING DECEMBER 31, 2014 The following tabulation represents aggregate information from reports filed by 250 licensed companies. The Department did not require an annual report from companies that opened after December, 2014.
STATEMENT OF ASSETS, LIABILITIES, AND EQUITY
Total Assets $1,123,008,494
Total Liabilities $591,956,284
Net Worth $531,052,210

42 | P a g e
COMPLIANCE DIVISION- Continued As of December 31, 2014, five (5) companies owned 82% of the industry’s assets. This accounts for $916,553,793 of the total reported assets of $1,123,008,494. 68 companies reported assets greater than $500,000; 133 companies had assets of between $100,000 and $500,000; and the remaining 49 showed total assets of less than $100,000.
STATEMENT OF INCOME AND EXPENSES
The following information was compiled from the statements of income and expenses for the period of January 1, 2014 to December 31, 2014.
*Excluding Owner’s Compensation
Of the 250 reporting companies, 62 reported operating losses and 36 reported net income of over $100,000 for the period ending December 31, 2014. The average company made a profit of $138,251. Salaries are a major company expense, amounting to about 23% of total operating income. The average salary expense for a reporting company was $216,483. Losses on receivables constitute another major industry expense. Bad debt expense represented approximately 21% of total operating income.
TRANSACTIONAL DATA The following transactional data were reported for the reporting period ending December 31, 2014:
Number of Transactions 4,067,979
Dollar Amount of Transactions During the Year $1,174,995,820
Average Size of Receivable Transactions $289
Number of transactions by size of check:
Total Operating Income $233,347,429
Salary Expense $54,120,661
Bad Debt Expense $49,674,921
Owners’ Compensation $15,615,251
Net Income* $34,562,744
$1 - $150 627,201
$151 - $250 1,494,212
$251 - $500 1,946,566

43 | P a g e
COMPLIANCE DIVISION- Continued
CHECK CASHERS Check cashers, for a fee, provide currency in exchange for a payment instrument, such as a check. They are licensed under the Check Cashing Act of 1997, Tenn. Code Ann. §§ 45-18-101, et seq. Licensed check cashers may charge fees as follows: in general, no more than 5% of the face amount of the payment instrument or $5, whichever is greater; for payment instruments for state public assistance or federal social security benefits, no more than 3% of the face amount or $2, whichever is greater; and for personal checks or money orders, no more than 10% of the face amount or $5, whichever is greater. The requirements for licensure include a minimum net worth of $25,000 for each location. Licenses under the Check Cashing Act expire on March 31 of each year and may be renewed by the filing of a renewal application on or before March 1. As of December 31, 2015, there were 584 check cashing locations licensed with the Department. For calendar year 2015, the Department conducted 453 examinations of check cashing businesses, resulting in refunds totaling $103,134.17.
HOME EQUITY CONVERSION MORTGAGE LENDERS Home equity conversion mortgages, also known as reverse mortgages, are governed in Tennessee by the Home Equity Conversion Mortgage Act, Tenn. Code Ann. §§ 47-30-101, et seq. A business that makes home equity conversion mortgages must be licensed under the Tennessee Residential Lending, Brokerage and Servicing Act, Tenn. Code Ann. §§ 45-13-101, et seq. and must also be an authorized lender under the Home Equity Conversion Mortgage Act. All reverse mortgages issued in Tennessee must comply with all requirements for participation in the federal Department of Housing and Urban Development’s (“HUD”) Home Equity Conversion Mortgage Program (or other similar federal reverse mortgage loan program) and must be insured by the Federal Housing Agency or other similar federal agency. The requirements for authorization include licensure under the Tennessee Residential Lending, Brokerage and Servicing Act, and proof of approval as a lender by the Department of Housing and Urban Development. Authorized lenders are examined for compliance with Home Equity Conversion Mortgage Act at the same time that they are examined for compliance under the Tennessee Residential Lending, Brokerage and Servicing Act.
INSURANCE PREMIUM FINANCE COMPANIES Persons engaged in the business of premium finance companies in Tennessee must be licensed under the Premium Finance Company Act of 1980, Tenn. Code Ann. §§ 56-37-101, et seq. Premium finance companies enter into agreements by which an insured or prospective insured promises to pay to the premium finance company the amount advanced or to be advanced under the agreement to an insurer or insurance agent or producing agent in payment of premiums of an insurance contract, together with interest and a service charge. A premium finance company may

44 | P a g e
COMPLIANCE DIVISION- Continued charge interest not to exceed a maximum effective rate of 24% per annum, and may charge on pre-computed loans a service charge in an amount equal to 4% of the total amount of the loan. The requirements for licensure under the Premium Finance Company Act include the experience, training or education so as to be qualified in the business for which the license is required. As of December 31, 2015, there were 52 insurance premium finance companies licensed with the Department. For calendar year 2015, the Department conducted 7 examinations of insurance premium finance companies.
45 | P a g
CREDThe Credsupervisionatural-punion exaexaminatand Voluncomplianregulatioliabilities,assess thperform iwith the D Collective1 corporaUnion Divbillion. T0.90%. Inarray of a Volunteeneeds of corporatestates. Pprocessin The CredSupervisoperiod. Afor NASCstate credcertificati The primsafe and institution
g e
DIT UNit Union Divison and examerson and coaminers perftions for eachnteer Corporce with govens. Evaluatio, income ande solvency ofinvestigationDepartment’s
ely, the 89 naate credit univision have ahe return on
ndividually, thasset sizes, fi
r Corporate Cnatural-pers
e credit unionrimary offeri
ng, security s
it Union Divisors (NASCUS)Additionally, eUS examinatdit union exaon’s required
ary responsisound systemns the oppor
NION Dsion is respo
mination of storporate credform safety ah state-chartrate Credit Uerning laws aons of each cd expenses arf the instituti
ns as a result s Consumer
atural-personion regulated
assets of appn average asshe institutionelds of mem
Credit Unionson credit unn that servesngs include tafekeeping, c
sion remains). The NASCUeligible divisition certificataminers and d continuing
bility of the Cm of credit urtunity to con
DIVISInsible for the
tate-charteredit unions. C
and soundneered credit union to detend
credit union’sre performedion. They als of complaintResources Se
n credit uniond by the Credroximately $
sets was ns present a vbership and
, located in Nions, whethe
s more than 3traditional coconsulting se
s accredited bUS accreditaton examiner
tions. This ceencourages c education h
Credit Union nions by ens
ntribute to th
ION e
ed Credit ss
union rmine
s assets, d to so ts filed ection.
ns and dit 10.9
vast services.
Nashville, TN,er state or fed361 memberorrespondenervices and W
by the Nationtion was re-crs and supervertification pcontinued prours.
Division is tosuring complhe economic
, continues toderally-chartr credit uniont services su
Web design.
nal Associatiocertified in Juvisors have mrogram provrofessional d
o provide theiance with goprogress of T
o meet the fitered. VolCons in Tennessch as investm
on of State Cne 2015 for amet comprehvides recognidevelopment
e people of Toverning lawTennessee.
inancial servrp is a $1.3 bsee and othements, item
Credit Union another five-hensive critetion to super through the
Tennessee wiw, while giving
ice billion er
-year ria rior
th a g
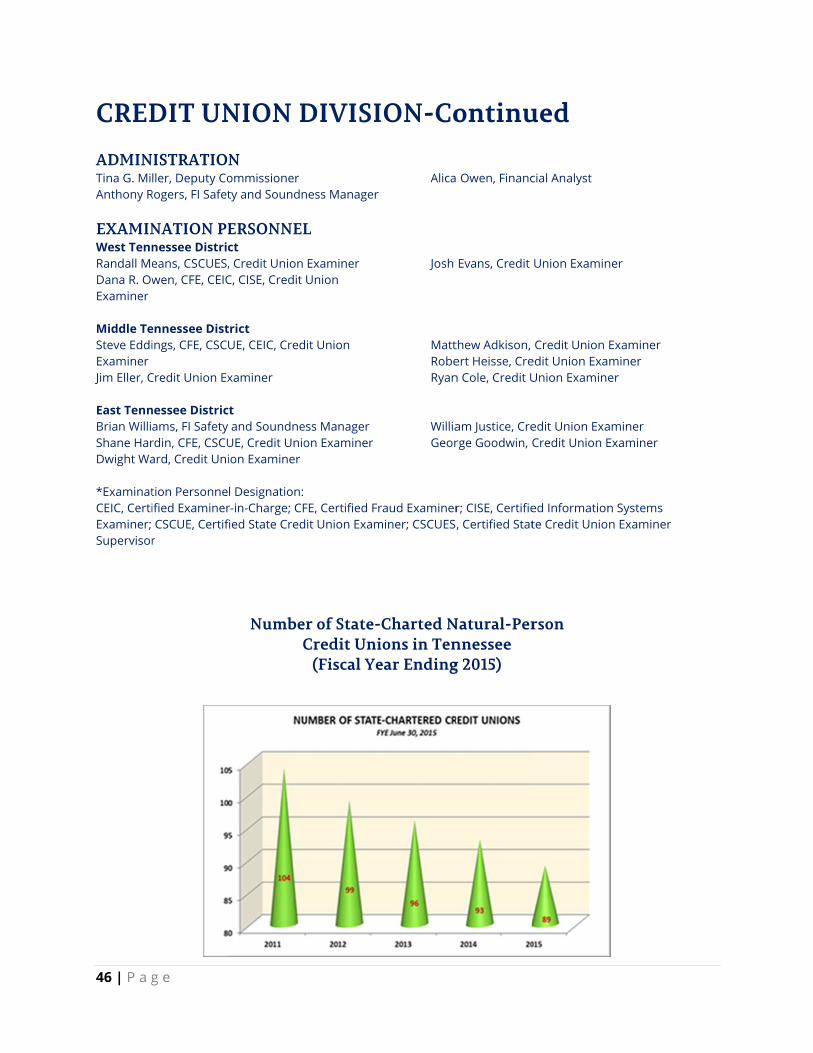
46 | P a g
CRED ADMINTina G. MiAnthony R EXAMINWest TennRandall MeDana R. OwExaminer
Middle TeSteve EddiExaminer Jim Eller, C East TennBrian WilliShane HarDwight Wa *ExaminatCEIC, CertiExaminer; Supervisor
g e
DIT UNISTRATIOller, Deputy Co
Rogers, FI Safet
NATION PEnessee Districeans, CSCUES,wen, CFE, CEIC
ennessee Distings, CFE, CSC
Credit Union Ex
nessee Districams, FI Safety rdin, CFE, CSCUard, Credit Uni
tion Personneified Examiner CSCUE, Certifr
NION DN ommissioner ty and Soundn
ERSONNELct, Credit Union C, CISE, Credit
trict UE, CEIC, Cred
xaminer
ct and SoundneUE, Credit Unioion Examiner
l Designation: r-in-Charge; CFfied State Cred
NumbeC
DIVISI
ness Manager
L
Examiner Union
dit Union
ess Manager on Examiner
FE, Certified Frdit Union Exam
er of State-Credit Uni
(Fiscal Ye
ION-Co
Alica
Josh
MattRobeRyan
WilliaGeor
raud Examinerminer; CSCUES,
Charted Nions in Tenear Ending
ontinu
Owen, Financ
Evans, Credit
thew Adkison, ert Heisse, Cren Cole, Credit U
am Justice, Crerge Goodwin, C
r; CISE, Certifie, Certified Stat
Natural-Pernnessee g 2015)
ued
cial Analyst
Union Examin
Credit Union edit Union ExaUnion Examine
edit Union ExaCredit Union E
ed Informationte Credit Unio
rson
ner
Examiner miner er
aminer Examiner
n Systems n Examiner

47 | P a g e
CREDIT UNION DIVISION-Continued CREDIT UNION CHANGES AND REORGANIZATIONS July 01, 2014 – June 30, 2015 Mergers/Liquidations
08/09/2014 Rohm and Haas Employees Credit Union (Knoxville) completed a voluntary liquidation.
10/10/2014 Members First Credit Union (Cleveland) merged into Bowater Employees
Credit Union (Calhoun)
10/30/2014 AGC Credit Union (Kingsport) merged into First Kingsport Credit Union (Kingsport)
Charter Changes/Conversions/Field of Membership Additions
08/05/2014 DuPont Memphis Plant Employees Credit Union (Memphis) converted from a multi-occupational/associational field of membership to a community-based field of membership to serve Shelby County, TN.
10/10/2014 The West Tennessee Credit Union (Memphis) added Tipton County, TN to its
field of membership. Name Changes
08/14/2014 DuPont Memphis Plant Employees Credit Union (Memphis) changed its name to The West Tennessee Credit Union.
04/01/2015 DuPont Community Credit Union (Hixson) changed its name to Scenic
Community Credit Union. Branches The following credit unions have opened, plan to open or relocated a branch office to the location listed:
CREDIT UNION LOCATION Employee Resources
(Lawrenceburg) New Corporate Office: 2135 N. Locust Avenue,
Lawrenceburg, TN

48 | P a g e
CREDIT UNION KEY RATIOS CAPITAL ADEQUACY FYE 6/30/2015 FYE 6/30/2014
Net Worth/Total Assets 12.83% 12.70%
Net Worth/Total Assets--Including Optional Total Assets Election (if used) 12.84% 12.70%
Total Delinquent Loans / Net Worth 2.32% 2.32%
Solvency Evaluation (Estimated) 114.81% 114.70%
Classified Assets (Estimated) / Net Worth 4.76% 5.13%
ASSET QUALITY
Delinquent Loans / Total Loans 0.43% 0.44%
*Net Charge-Offs / Average Loans 0.39% 0.37%
Fair (Market) HTM Invest Value/Book Value HTM Invest. 98.63% 99.57%
Accum Unreal G/L On AFS/Cost Of AFS -0.45% -0.70%
Delinquent Loans / Assets 0.30% 0.29%
EARNINGS
*Return On Average Assets 0.90% 0.89%
*Gross Income/Average Assets 4.67% 4.72%
*Yield on Average Loans 4.57% 4.78%
*Yield on Average Investments 0.79% 0.73%
* Fee & Other Op.Income / Avg. Assets 1.30% 1.30%
*Cost of Funds / Avg. Assets 0.45% 0.48%
*Net Margin / Avg. Assets 4.22% 4.24%
*Operating Exp./ Avg. Assets 3.12% 3.17%
*Provision For Loan & Lease Losses / Average Assets 0.21% 0.20%
*Net Interest Margin/Avg. Assets 2.92% 2.94%
Operating Exp./Gross Income 66.81% 67.08%
Fixed Assets & Foreclosed & Repossessed Assets / Total Assets \1 2.67% 2.88%
*Net Operating Exp. /Avg. Assets 2.40% 2.40%
ASSET / LIABILITY MANAGEMENT
Net Long-Term Assets / Total Assets 33.99% 36.11%
Reg. Shares / Total Shares. & Borrowings 31.99% 30.53%
Total Loans / Total Shares 81.72% 79.07%
Total Loans / Total Assets 69.56% 67.28%
Cash + Short-Term Investments / Assets 15.96% 17.05%
Total Shares, Dep. & Borrs / Earning Assets 91.05% 91.25%
Reg Shares + Share Drafts / Total Shares & Borrs 46.79% 44.29%
Borrowings / Total Shares & Net Worth 1.44% 1.62%
Supervisory Interest Rate Risk Threshold/Net Worth 252.78% 257.65%
PRODUCTIVITY
Members / Potential Members 7.10% 7.08%
Borrowers / Members 54.27% 53.22%
Members / Full-Time Employees 355.90% 356.66%
Avg. Shares Per Member $8,872 $8,689
Avg. Loan Balance $13,359 $12,908
* Salary And Benefits / Full-Time Empl. $60,932 $60,813
OTHER RATIOS

49 | P a g e
CREDIT UNION KEY RATIOS * Net Worth Growth 7.15% 6.78% * Market (Share) Growth 6.26% 6.66% * Loan Growth 7.52% 6.67%
* Asset Growth 5.80% 6.41% * Investment Growth 2.32% 6.35% * Membership Growth 3.76% 1.09%
* Annualized ratios
CREDIT UNION DIVISION CONSOLIDATED BALANCE SHEET
ASSETS As of 6/30/2015 As of 6/30/2014 % Change CASH:
Cash on Hand 96,640,853 90,829,973 6.40% Cash on Deposit 852,458,960 872,318,532 -2.28% Cash Equivalents 43,817,030 53,214,168 -17.66% Total Cash $992,916,843 $1,016,362,673 -2.31%
INVESTMENTS: Trading Securities 0 0 Available for Sale Securities 386,719,706 399,679,089 -3.24% Held-to-Maturity Securities 346,799,688 403,630,529 -14.08% Deposits in Commercial Banks, S & Ls, Savings Banks 658,642,922 629,401,986 4.65% Loans to, Deposits in, & Investments in Natural Person CUs 57,486,268 40,208,030 42.97% Total MCSD and PIC in Corporate 27,860,396 28,280,177 -1.48% All Other Investments in Corporate Credit Unions 25,045,475 38,083,687 -34.24% All Other Investments 60,393,019 80,323,228 -24.81% Total Investments $1,562,947,474 $1,619,606,726 -3.50%
LOANS HELD FOR SALE $1,730,338 $1,930,638 -10.37% Loans and Leases:
Unsecured Credit Card Loans 228,313,772 220,653,482 3.47% All Other Unsecured loans 268,055,256 256,945,532 4.32% Non-Federally Guaranteed Student Loans 61,771,230 61,876,055 -0.17% New Auto Loans 1,003,233,908 819,117,463 22.48% Used Auto Loans 1,354,006,478 1,235,873,678 9.56% First Mortgage Real Estate Loans 3,035,877,129 2,842,899,039 6.79% Other Real Estate Loans 318,843,440 328,138,654 -2.83% Leases Receivable 0 0 All Other Loans/Lines of Credit 443,625,276 413,831,897 7.20% Total Loans $6,713,726,489 $6,179,335,800 8.65% ALLOWANCE FOR LOAN & LEASE LOSSES (58,995,660) (59,881,593) -1.48%
Total Foreclosed and Repossessed Assets 13,768,494 17,214,991 -20.02% Land and Building (Net of Depreciation) 208,051,301 210,135,350 -0.99% Other Fixed Assets 31,846,760 32,542,657 -2.14% NCUA Share Insurance Capitalization Deposit 75,791,530 71,854,924 5.48% Total Intangible Assets 683,752 474,411 44.13% Total Other Assets 109,458,424 95,527,106 14.58%
Total Assets $9,651,925,745 $9,185,103,683 5.08%
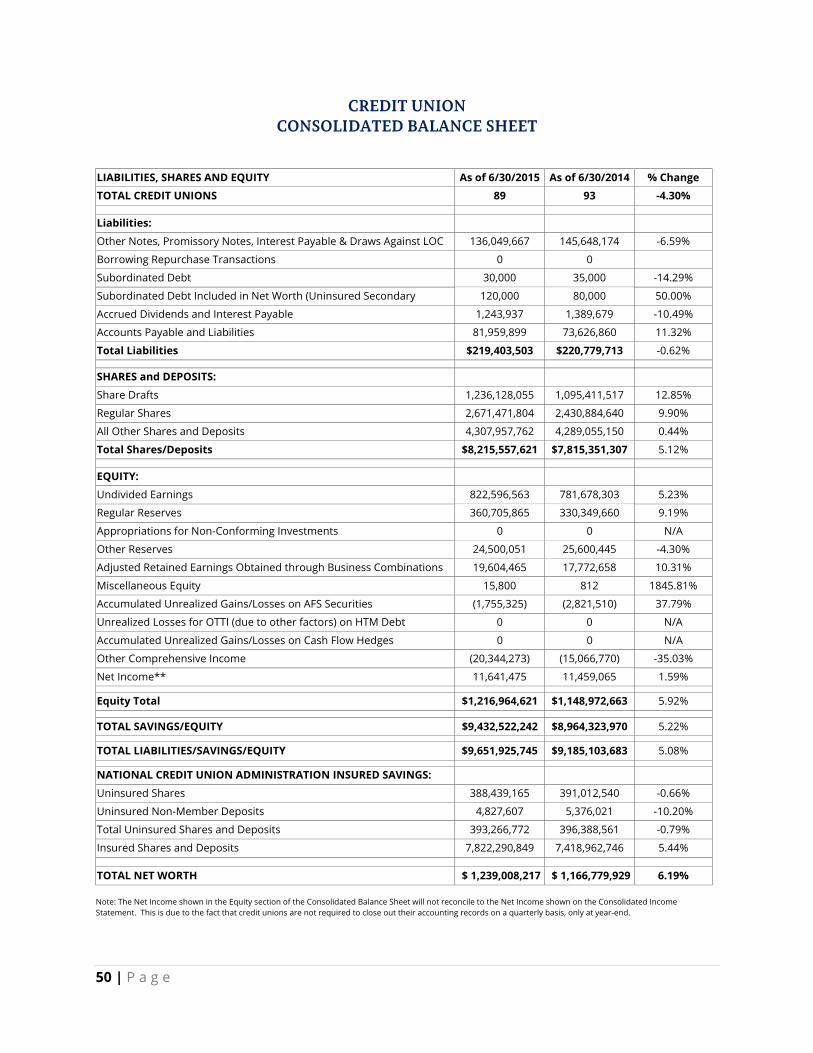
50 | P a g e
CREDIT UNION CONSOLIDATED BALANCE SHEET
LIABILITIES, SHARES AND EQUITY As of 6/30/2015 As of 6/30/2014 % Change
TOTAL CREDIT UNIONS 89 93 -4.30%
Liabilities:
Other Notes, Promissory Notes, Interest Payable & Draws Against LOC 136,049,667 145,648,174 -6.59%
Borrowing Repurchase Transactions 0 0
Subordinated Debt 30,000 35,000 -14.29%
Subordinated Debt Included in Net Worth (Uninsured Secondary 120,000 80,000 50.00%
Accrued Dividends and Interest Payable 1,243,937 1,389,679 -10.49%
Accounts Payable and Liabilities 81,959,899 73,626,860 11.32%
Total Liabilities $219,403,503 $220,779,713 -0.62%
SHARES and DEPOSITS:
Share Drafts 1,236,128,055 1,095,411,517 12.85%
Regular Shares 2,671,471,804 2,430,884,640 9.90%
All Other Shares and Deposits 4,307,957,762 4,289,055,150 0.44%
Total Shares/Deposits $8,215,557,621 $7,815,351,307 5.12%
EQUITY:
Undivided Earnings 822,596,563 781,678,303 5.23%
Regular Reserves 360,705,865 330,349,660 9.19%
Appropriations for Non-Conforming Investments 0 0 N/A
Other Reserves 24,500,051 25,600,445 -4.30%
Adjusted Retained Earnings Obtained through Business Combinations 19,604,465 17,772,658 10.31%
Miscellaneous Equity 15,800 812 1845.81%
Accumulated Unrealized Gains/Losses on AFS Securities (1,755,325) (2,821,510) 37.79%
Unrealized Losses for OTTI (due to other factors) on HTM Debt 0 0 N/A
Accumulated Unrealized Gains/Losses on Cash Flow Hedges 0 0 N/A
Other Comprehensive Income (20,344,273) (15,066,770) -35.03%
Net Income** 11,641,475 11,459,065 1.59%
Equity Total $1,216,964,621 $1,148,972,663 5.92%
TOTAL SAVINGS/EQUITY $9,432,522,242 $8,964,323,970 5.22%
TOTAL LIABILITIES/SAVINGS/EQUITY $9,651,925,745 $9,185,103,683 5.08%
NATIONAL CREDIT UNION ADMINISTRATION INSURED SAVINGS:
Uninsured Shares 388,439,165 391,012,540 -0.66%
Uninsured Non-Member Deposits 4,827,607 5,376,021 -10.20%
Total Uninsured Shares and Deposits 393,266,772 396,388,561 -0.79%
Insured Shares and Deposits 7,822,290,849 7,418,962,746 5.44%
TOTAL NET WORTH $ 1,239,008,217 $ 1,166,779,929 6.19% Note: The Net Income shown in the Equity section of the Consolidated Balance Sheet will not reconcile to the Net Income shown on the Consolidated Income Statement. This is due to the fact that credit unions are not required to close out their accounting records on a quarterly basis, only at year-end.

51 | P a g e
CREDIT UNION DIVISION CONSOLIDATED INCOME STATEMENT
FYE 6/30/2015 FYE 6/30/2014 % Change
Interest Income
Interest on Loans 150,483,677 145,249,324 3.60%
Less Interest Refund (7) (0)
Income from Investments 9,620,099 9,190,096 4.68%
Income from Trading 0 0 N/A
Total Interest Income $160,103,769 $154,439,420 3.67%
Interest Expense
Dividends 8,203,933 8,362,360 -1.89%
Interest on Deposits 11,958,597 12,066,356 -0.89%
Interest on Borrowed Money 1,134,223 1,237,619 -8.35%
Total Interest Expense $21,296,753 $21,666,335 -1.71%
Provision for Loan and Lease Losses (PLLL) 9,769,536 8,939,618 9.28%
Net Interest Income after PLLL $129,037,480 $123,833,467 4.20%
Non-Interest Income
Fee Income 33,913,527 34,411,889 -1.45%
Other Operating Income 27,976,393 24,491,080 14.23%
Gain(Loss) on Investments 79,070 177,063 -55.34%
Gain(Loss) on Non-Trading Derivatives 0 0
Gain(Loss) on Disposition of Assets (140,740) 14,873 1046.28%
Gain from Bargain Purchase (Merger) 0 0 N/A
Other Non-Operating Income/(Expense) 206,763 180,103 14.80%
NCUSIF Stabilization Income 0 0
Total Non-Interest Income $62,035,013 $59,275,008 4.66%
Non-Interest Expense
Employee Compensation and Benefits 79,271,976 76,685,343 3.37%
Travel/Conference Expense 1,379,022 1,434,503 -3.87%
Office Occupancy 9,504,836 9,458,168 0.49%
Office Operation Expense 31,575,596 30,230,876 4.45%
Education and Promotion 4,596,257 4,639,716 -0.94%
Loan Servicing Expense 6,820,789 6,437,173 5.96%
Professional/Outside Service 11,041,787 10,257,456 7.65%
Member Insurance N/A N/A
Member Insurance - NCUSIF Premium 0 14,441 -100.00%
Member Insurance - Temporary Corporate CU 182,479 193,718 -5.80%
Member Insurance - Other 56,360 125,812 -55.20%
Operating Fees 1,427,761 1,299,583 9.86%
Miscellaneous Operating Expense 2,460,633 2,326,313 5.77%
Total Non-Interest Expense $148,317,496 $143,103,102 3.64%

52 | P a g e
CREDIT UNION DIVISIONCONSOLIDATED INCOME STATEMENT- Continued
Net Income Excluding Stabilization Expense & $42,937,476 $40,213,532 6.77%
Net Income (Loss) $42,754,997 $40,005,373 6.87%
Transfer to Regular Reserve $9,754,570 $7,216,745 35.17%
TENNESSEE STATE-CHARTERED CREDIT UNION ASSETS (As of June 30, 2015)
Credit Union Year Est.
Address City County Zip Assets
1 A.U.B. EMPLOYEES' 1965 100 NEW ENGLEWOOD ROAD ATHENS McMINN 37303 $1.6M
2 AGILITY FINANCIAL 1964 495 UNION AVENUE MEMPHIS SHELBY 38103 $9.5M
3 APPLIANCE 1972 640 KING EDWARD AVENUE SE CLEVELAND BRADLEY 37311 $10.7M
4 BCBST EMPLOYEES 1971 1 CAMERON HILL CIRCLE CHATTANOOGA HAMILTON 37402 $10.4M
5 BOWATER EMPLOYEES 1954 454 HIGHWAY 163 CALHOUN McMINN 37309 $146.0M
6 BRADLEY INITIATIVE 2003 1075 BLYTHE AVENUE SE CLEVELAND BRADLEY 37311 $2.4M
7 CEMC EMPLOYEES 1959 1940 MADISON STREET CLARKSVILLE MONTGOMERY 37043 $2.6M
8 CHATTANOOGA FEDERAL EMPLOYEES 1925 2011 STEIN DRIVE CHATTANOOGA HAMILTON 37421 $47.3M
9 CITY EMPLOYEES 1932 1720 WESTERN AVENUE KNOXVILLE KNOX 37921 $70.7M
10 CN/IC EMPLOYEES 1928 2005 NONCONNAH BLVD. SUITE 7 MEMPHIS SHELBY 38132 $8.0M
11 COLLEGEDALE 1952 5046 UNIVERSITY DRIVE COLLEGEDALE HAMILTON 37315 $38.7M
12 CONSUMER 1953 3634 E ANDREW JOHNSON HIGHWAY GREENEVILLE GREENE 37745 $363.0M
13 CORNERSTONE FINANCIAL 1962 1701 21st AVENUE S NASHVILLE DAVIDSON 37212 $284.6M
14 CREDIT UNION FOR ROBERTSON COUNTY 1968 2416 MEMORIAL BLVD SPRINGFIELD ROBERTSON 37172 $43.4M
15 DIXIE LINE 1932 567 VERITAS STREET NASHVILLE DAVIDSON 37211 $8.1M
16 EASTMAN 1934 2021 MEADOWVIEW LANE KINGSPORT SULLIVAN 37662 $3.16B
17 ELECTRIC SERVICE 1951 2340 JACKSON DOWNS BOULEVARD NASHVILLE DAVIDSON 37214 $60.5M
18 EMPLOYEE RESOURCES 1964 1604 REMKE AVENUE LAWRENCEBURG LAWRENCE 38464 $74.8M
19 EMPLOYEES CREDIT UNION 1934 1415 MURFREESBORO PIKE SUITE 148 NASHVILLE DAVIDSON 37217 $31.1M
20 EMPLOYMENT SECURITY 1955 220 FRENCH LANDING DR NASHVILLE DAVIDSON 37243 $13.0M
21 EPB EMPLOYEES 1954 1500 McCALLIE AVE CHATTANOOGA HAMILTON 37404 $28.7M
22 FIRST CHOICE COMMUNITY 1934 100 N. 17TH STREET KNOXVILLE KNOX 37921 $36.6M
23 FIRST KINGSPORT 1932 408 CLAY STREET KINGSPORT SULLIVAN 37660 $45.6M
24 FIRST SOUTH FINANCIAL 1957 6471 STAGE ROAD, SUITE 200 BARTLETT SHELBY 38134 $494.7M
25 GALLATIN STEAM PLANT 1956 1499 STEAM PLANT ROAD GALLATIN SUMNER 37066 $5.3M
26 GATEWAY 1959 100 OTIS SMITH DRIVE CLARKSVILLE MONTGOMERY 37043 $11.4M
27 GREATER EASTERN 1952 2110 MOUNTCASTLE DRIVE JOHNSON CITY WASHINGTON 37604 $51.0M
28 GREENEVILLE CITY EMPLOYEES' 1965 310 SOUTH MAIN STREET, SUITE 3 GREENEVILLE GREENE 37743 $9.4M
29 GREENEVILLE WORKS EMPLS. SAVINGS ASSOCIATION
1976 2745 SNAPPS FERRY ROAD GREENEVILLE GREENE 37745 $2.1M
30 HAPPY VALLEY 1933 210 EAST C STREET ELIZABETHTON CARTER 37643 $30.8M
31 HARDIN COUNTY HOSPITAL EMPLOYEES 1964 935 WAYNE ROAD SAVANNAH HARDIN 38372 $1.3M

53 | P a g e
TENNESSEE STATE-CHARTERED CREDIT UNION ASSETS (As of June 30, 2015)
Credit Union Year Est.
Address City County Zip Assets
32 HEALTH SYSTEMS 1953 4005 N. BROADWAY STREET KNOXVILLE KNOX 37917 $6.3M
33 HEALTHCARE SERVICES 1952 946 EAST THIRD STREET CHATTANOOGA HAMILTON 37403 $17.6M
34 HERITAGE SOUTH COMMUNITY 1957 763 NORTH MAIN STREET SHELBYVILLE BEDFORD 37160 $165.8M
35 HOLLEY 1952 1107 MINERAL WELLS AVENUE PARIS HENRY 38242 $47.3M
36 HURD EMPLOYEES 1968 200 W CHURCH STREET GREENEVILLE GREENE 37745 $2.9M
37 JACK DANIEL EMPLOYEES 1987 488 MAJORS BOULEVARD LYNCHBURG MOORE 37352 $26.8M
38 JOHNSONVILLE TVA EMPLOYEES 1952 209 HIGHWAY 641 NORTH CAMDEN BENTON 38320 $87.8M
39 KIMBERLY CLARK 1971 1520 N SECOND ST MEMPHIS SHELBY 38107 $107.2M
40 KINGSPORT PRESS CU 1930 528 W. CENTER STREET KINGSPORT SULLIVAN 37660 $65.7M
41 KINGSTON TVA EMPLOYEES 1954 714 SWAN POND RD HARRIMAN ROANE 37748 $2.1M
42 KNOX CO. EMPLOYEES 1974 400 MAIN STREET, ROOM 355 KNOXVILLE KNOX 37902 $9.0M
43 KNOXVILLE NEWS-SENTINEL EMPLOYEES 1935 2332 NEWS SENTINEL DRIVE KNOXVILLE KNOX 37912 $7.7M
44 KNOXVILLE TVA EMPLOYEES 1934 301 WALL AVENUE KNOXVILLE KNOX 37902 $1.44B
45 LAKESIDE EMPLS. 1965 1008 BROADWAY AVENUE NEW JOHNSONVILLE
HUMPHREYS 37134 $36.2M
46 LANGSTON BAG CO. EMPLS. SAV. ASSN. 1964 1760 SOUTH 3RD STREET MEMPHIS SHELBY 38109 $48.3K
47 LEADERS CREDIT UNION 1957 87 MURRAY GUARD DR JACKSON MADISON 38305 $255.4M
48 LIFE 1958 2010 CHURCH STREET, SUITE 204 NASHVILLE DAVIDSON 37203 $30.7M
49 LIFEWAY 1954 ONE LIFEWAY PLAZA NASHVILLE DAVIDSON 37234 $49.0M
50 LOWLAND 1953 622 WEST 1ST NORTH STREET MORRISTOWN HAMBLEN 37814 $86.5M
51 M.P.D. COMMUNITY 1966 2711 OLD LEBANON ROAD NASHVILLE DAVIDSON 37214 $25.4M
52 MARYVILLE MUNICIPAL 1971 321 W BROADWAY AVENUE MARYVILLE BLOUNT 37801 $15.2M
53 MCNAIRY COUNTY EMPLOYEES 1980 105 N OAK STREET ADAMSVILLE McNAIRY 38310 $1.3M
54 MEMORIAL 1959 6800 LONGVIEW ROAD CHATTANOOGA HAMILTON 37421 $7.7M
55 MEMPHIS CITY EMPLOYEES 1959 2678 MT MORIAH TERRACE MEMPHIS SHELBY 38115 $246.6M
56 METROPOLITAN TEACHERS 1957 1605 JEFFERSON STREET NASHVILLE DAVIDSON 37208 $3.2M
57 MID-EAST TENNESSEE COMMUNITY 2009 17640 STATE HIGHWAY 58N DECATUR MEIGS 37322 $7.5M
58 MOUNTAIN STATES 1953 408 N. STATE OF FRANKLIN ROAD JOHNSON CITY WASHINGTON 37604 $15.9M
59 N M H CREDIT UNION 1966 3443 DICKERSON PK # G-10 NASHVILLE DAVIDSON 37207 $15.8M
60 N.G.H. 1959 1818 ALBION STREET NASHVILLE DAVIDSON 37208 $7.2M
61 NASHVILLE FIREMEN'S 1932 908 WOODLAND STREET NASHVILLE DAVIDSON 37206 $21.7M
62 NASHVILLE POST OFFICE 1925 10 RACHEL DRIVE NASHVILLE DAVIDSON 37214 $72.0M
64 NEWSPAPER AND PRINTERS 1932 1100 BROADWAY NASHVILLE DAVIDSON 37203 $1.6M
65 NORTHEAST COMMUNITY 1952 980 JASON WITTEN WAY ELIZABETHTON CARTER 37643 $105.4M
66 O.M.C. EMPLOYEES' 1969 1186 LOWER RIVER ROAD NW CHARLESTON BRADLEY 37310 $27.8M
67 OLD HICKORY 1934 1000 INDUSTRIAL DRIVE OLD HICKORY DAVIDSON 37138 $224.6M
68 OLIVET BAPTIST 1978 3084 SOUTHERN AVENUE MEMPHIS SHELBY 38111 $416K
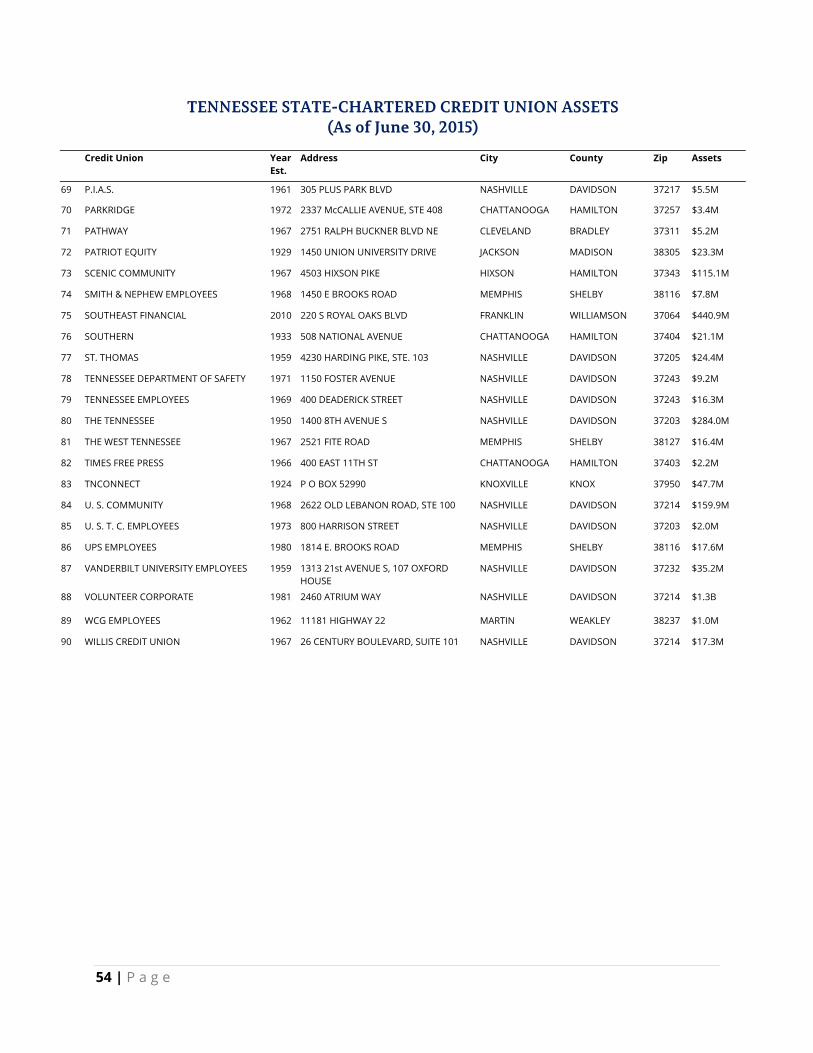
54 | P a g e
TENNESSEE STATE-CHARTERED CREDIT UNION ASSETS (As of June 30, 2015)
Credit Union Year Est.
Address City County Zip Assets
69 P.I.A.S. 1961 305 PLUS PARK BLVD NASHVILLE DAVIDSON 37217 $5.5M
70 PARKRIDGE 1972 2337 McCALLIE AVENUE, STE 408 CHATTANOOGA HAMILTON 37257 $3.4M
71 PATHWAY 1967 2751 RALPH BUCKNER BLVD NE CLEVELAND BRADLEY 37311 $5.2M
72 PATRIOT EQUITY 1929 1450 UNION UNIVERSITY DRIVE JACKSON MADISON 38305 $23.3M
73 SCENIC COMMUNITY 1967 4503 HIXSON PIKE HIXSON HAMILTON 37343 $115.1M
74 SMITH & NEPHEW EMPLOYEES 1968 1450 E BROOKS ROAD MEMPHIS SHELBY 38116 $7.8M
75 SOUTHEAST FINANCIAL 2010 220 S ROYAL OAKS BLVD FRANKLIN WILLIAMSON 37064 $440.9M
76 SOUTHERN 1933 508 NATIONAL AVENUE CHATTANOOGA HAMILTON 37404 $21.1M
77 ST. THOMAS 1959 4230 HARDING PIKE, STE. 103 NASHVILLE DAVIDSON 37205 $24.4M
78 TENNESSEE DEPARTMENT OF SAFETY 1971 1150 FOSTER AVENUE NASHVILLE DAVIDSON 37243 $9.2M
79 TENNESSEE EMPLOYEES 1969 400 DEADERICK STREET NASHVILLE DAVIDSON 37243 $16.3M
80 THE TENNESSEE 1950 1400 8TH AVENUE S NASHVILLE DAVIDSON 37203 $284.0M
81 THE WEST TENNESSEE 1967 2521 FITE ROAD MEMPHIS SHELBY 38127 $16.4M
82 TIMES FREE PRESS 1966 400 EAST 11TH ST CHATTANOOGA HAMILTON 37403 $2.2M
83 TNCONNECT 1924 P O BOX 52990 KNOXVILLE KNOX 37950 $47.7M
84 U. S. COMMUNITY 1968 2622 OLD LEBANON ROAD, STE 100 NASHVILLE DAVIDSON 37214 $159.9M
85 U. S. T. C. EMPLOYEES 1973 800 HARRISON STREET NASHVILLE DAVIDSON 37203 $2.0M
86 UPS EMPLOYEES 1980 1814 E. BROOKS ROAD MEMPHIS SHELBY 38116 $17.6M
87 VANDERBILT UNIVERSITY EMPLOYEES 1959 1313 21st AVENUE S, 107 OXFORD HOUSE
NASHVILLE DAVIDSON 37232 $35.2M
88 VOLUNTEER CORPORATE 1981 2460 ATRIUM WAY NASHVILLE DAVIDSON 37214 $1.3B
89 WCG EMPLOYEES 1962 11181 HIGHWAY 22 MARTIN WEAKLEY 38237 $1.0M
90 WILLIS CREDIT UNION 1967 26 CENTURY BOULEVARD, SUITE 101 NASHVILLE DAVIDSON 37214 $17.3M